Converting Strategy To Value
23
Converting strategy to value •Strategy •Action •Value •Value ©2010 W. Scott Keenen
Transcript of Converting Strategy To Value
Converting strategy to valueg gy
•Strategy
•Action
•Value•Value©2010 W. Scott Keenen

A Seat at the Table?A Seat at the Table?
CEO’s are looking forCEO s are looking for HR to bring solutions to business challengesto business challenges which add value
©2010 W. Scott Keenen

Leadership StrategicLeadership Strategic
Strategic thinking by itself is academic and irrelevant.
V l i t d th th f l i l t ti fValue is created thru the successful implementation of strategy
Metrics provide means to quantify value added or provided to the business
The Leadership competency that is required is the bilit t t t t t ti t lcapability to convert strategy to action to value.
©2010 W. Scott Keenen
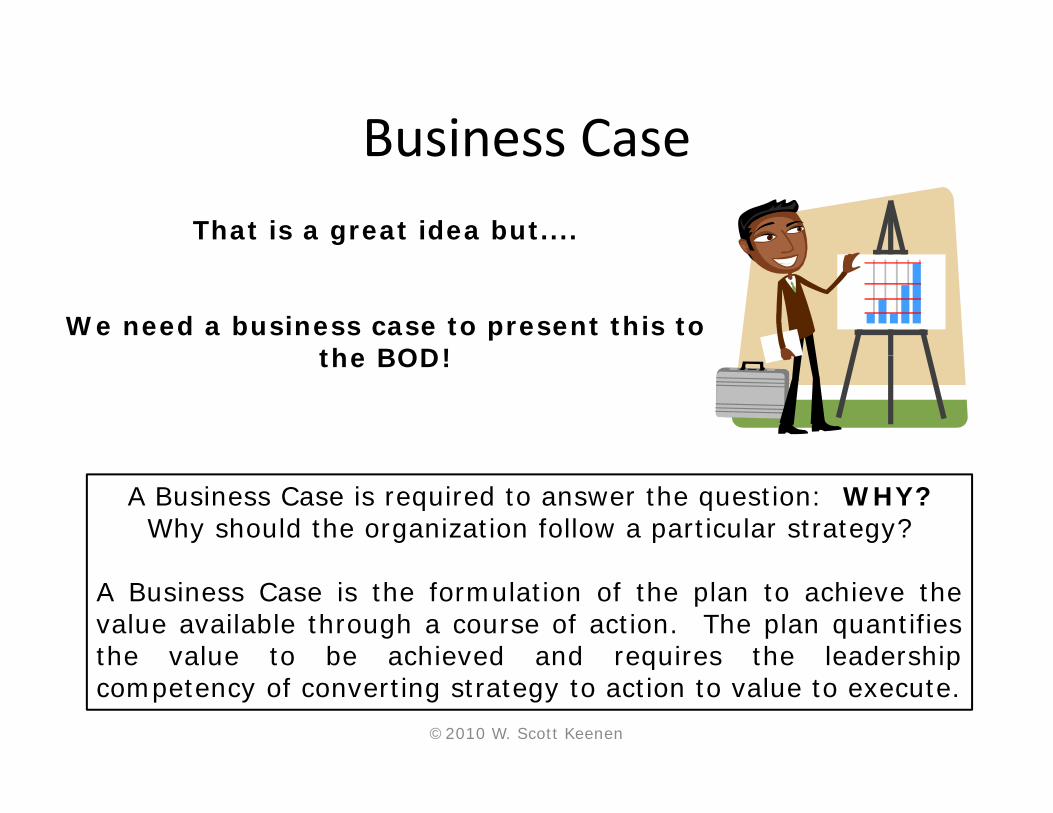
Business CaseBusiness CaseThat is a great idea but....
We need a business case to present this to the BOD!the BOD!
A Business Case is required to answer the question: WHY?Why should the organization follow a particular strategy?
A Business Case is the formulation of the plan to achieve thevalue available through a course of action. The plan quantifiesthe value to be achieved and requires the leadershipthe value to be achieved and requires the leadershipcompetency of converting strategy to action to value to execute.
©2010 W. Scott Keenen

Real Life ‐ HR LeadershipReal Life HR Leadership
• RetentionRetention
• RecruitingC t hi– Cost per hire
– Time to hire
– Staffing Solutions Contractor Loading
• Compensation
• Outsourcing
©2010 W. Scott Keenen
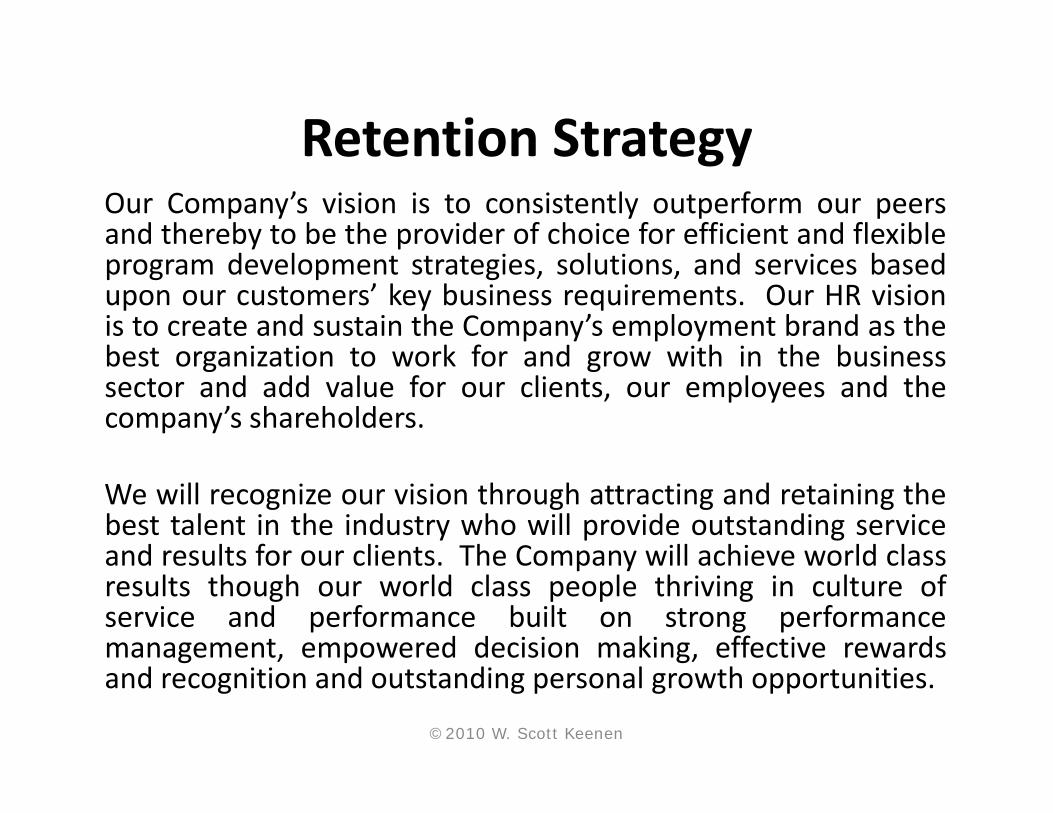
Retention StrategyRetention StrategyOur Company’s vision is to consistently outperform our peersand thereby to be the provider of choice for efficient and flexible
d l l d b dprogram development strategies, solutions, and services basedupon our customers’ key business requirements. Our HR visionis to create and sustain the Company’s employment brand as thebest organization to work for and grow with in the businessbest organization to work for and grow with in the businesssector and add value for our clients, our employees and thecompany’s shareholders.
We will recognize our vision through attracting and retaining thebest talent in the industry who will provide outstanding serviceand results for our clients The Company will achieve world classand results for our clients. The Company will achieve world classresults though our world class people thriving in culture ofservice and performance built on strong performancemanagement, empowered decision making, effective rewardsg p gand recognition and outstanding personal growth opportunities.
©2010 W. Scott Keenen

Retention PlanRetention Plan• Harmonize (global position levels, job titles and job descriptions)
• Identify core career development paths and requirements
M t kill t i i f i P l M t d L d hi• Management skills training focusing on People Management and Leadership
• Hire right! Conduct interview and recruiting workshops
• Collect feedback from Management and Employees on the Performance Management process implement action plan for continuous improvement
• Global on‐boarding/induction process
• Create and implement organization wide program for variable compensation (including loyalty program evaluation).
• Twice annual promotion review with organi ation wide announcement• Twice annual promotion review, with organization wide announcement
• Competitive equity based compensation strategy
• Conduct employee focus groups or survey on “What do you like best about the company”
• Implement employee engagement survey and indexp p y g g y
• Develop programs and management training to address remote working
• Conduct Management focus groups on Retention
• Extend HR support through incremental resources in HRBP roles with operations
• Increase HR visibility and accessibility to global employee population
©2010 W. Scott Keenen
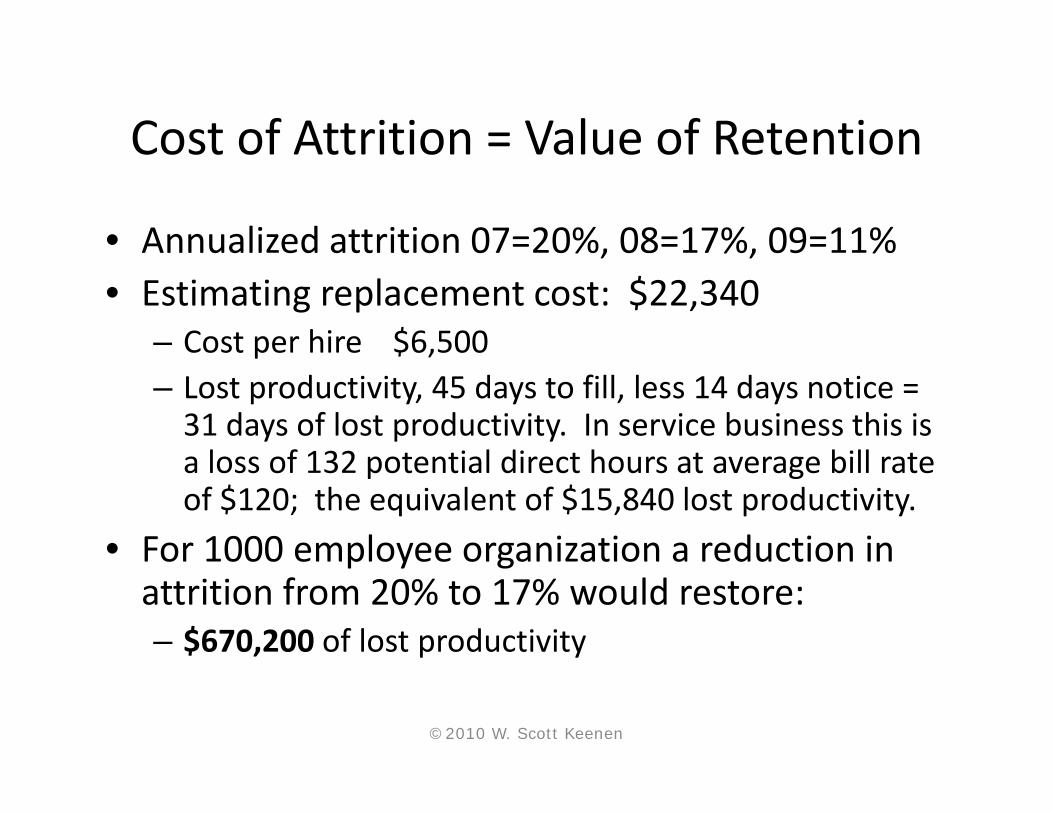
Cost of Attrition = Value of RetentionCost of Attrition Value of Retention
• Annualized attrition 07=20%, 08=17%, 09=11%ua ed att t o 0 0%, 08 %, 09 %• Estimating replacement cost: $22,340
– Cost per hire $6,500p $ ,– Lost productivity, 45 days to fill, less 14 days notice = 31 days of lost productivity. In service business this is a loss of 132 potential direct hours at average bill ratea loss of 132 potential direct hours at average bill rate of $120; the equivalent of $15,840 lost productivity.
• For 1000 employee organization a reduction inFor 1000 employee organization a reduction in attrition from 20% to 17% would restore: – $670,200 of lost productivity
©2010 W. Scott Keenen

RecruitingRecruiting
Provide the best candidate through an efficient gprocess resulting in a optimal time to hire at a competitive market based salary.• Review and revise process• Review and revise process• Align staffing resources with business• Communicate and Train managers in process• Communicate and Train managers in process• Implement ATS• Establish metrics for evaluating resultsEstablish metrics for evaluating results• Implement incentive plan to drive performance against metrics
©2010 W. Scott Keenen
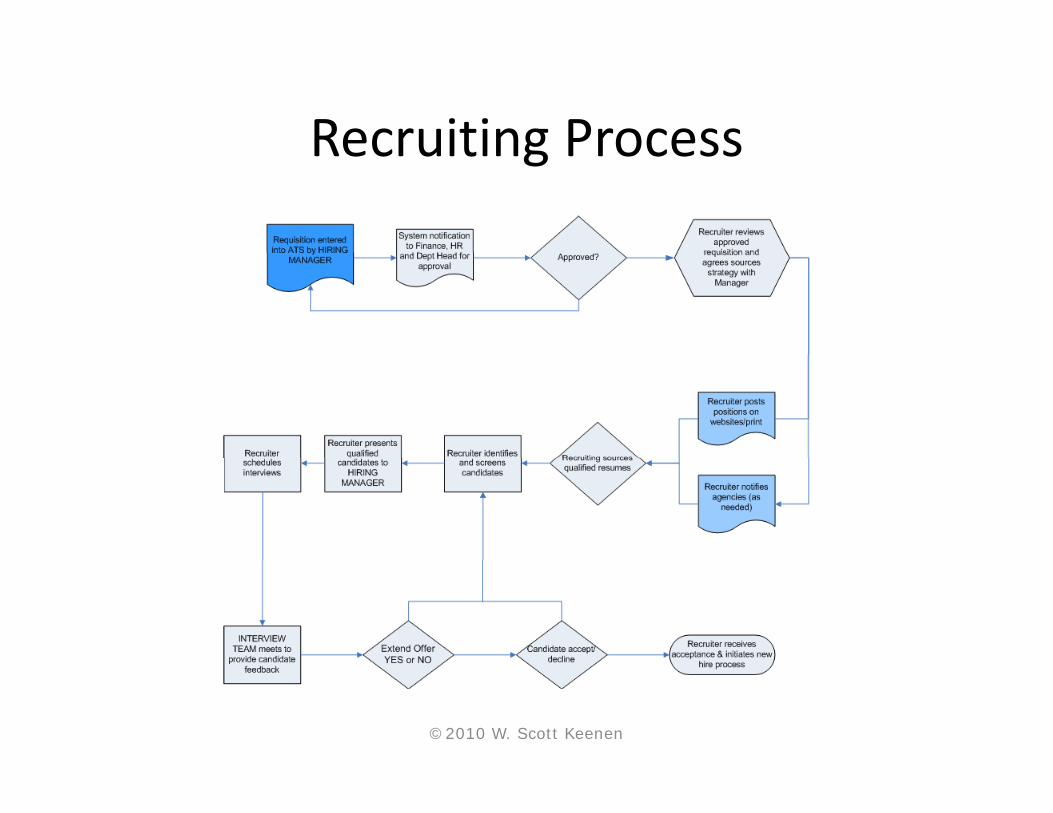
Recruiting ProcessRecruiting Process
©2010 W. Scott Keenen

Managing Metrics Drives ValueManaging Metrics Drives Value
• 2008 US Recruiting filled 250 requisitions at an2008 US Recruiting filled 250 requisitions at an average cph of $6,500, average time to fill 41 days
• 2009 Recruiting filled 250 requisitions at an average g q gcph of $5,000, average time to fill 30 days– $1,500 reduction in cost per hire yields annualized savings of $375,000
– Reduction in time to fill of 11 days provides productivity of:• 47 hours of incremental billable hours per hire $5 657 of incremental• 47 hours of incremental billable hours per hire, $5,657 of incremental revenue per hire resulting in annualized potential revenue increase of
$1,400,000$ , ,
©2010 W. Scott Keenen

Staffing SolutionsStaffing Solutions2007 shortage of “plug and play” ready Consultants, +60 days time to hire resulted in a significant ramp in independent contractors used in
f f loperations. At one point in excess of 32% of Consultants were independent contractors. Increase in employment related risk (failure to with‐hold and co‐employment) as well as a $45,000 greater annual average cost of IC versus EE resulting in gross margin contribution 50%average cost of IC versus EE, resulting in gross margin contribution 50% of that of a employee.• Assigned dedicated recruiter for Consultants and co‐located with
OperationsOperations• Set targets for contractor conversion by quarter• Implemented metric, “contractor loading”, to track results of
iactions
©2010 W. Scott Keenen
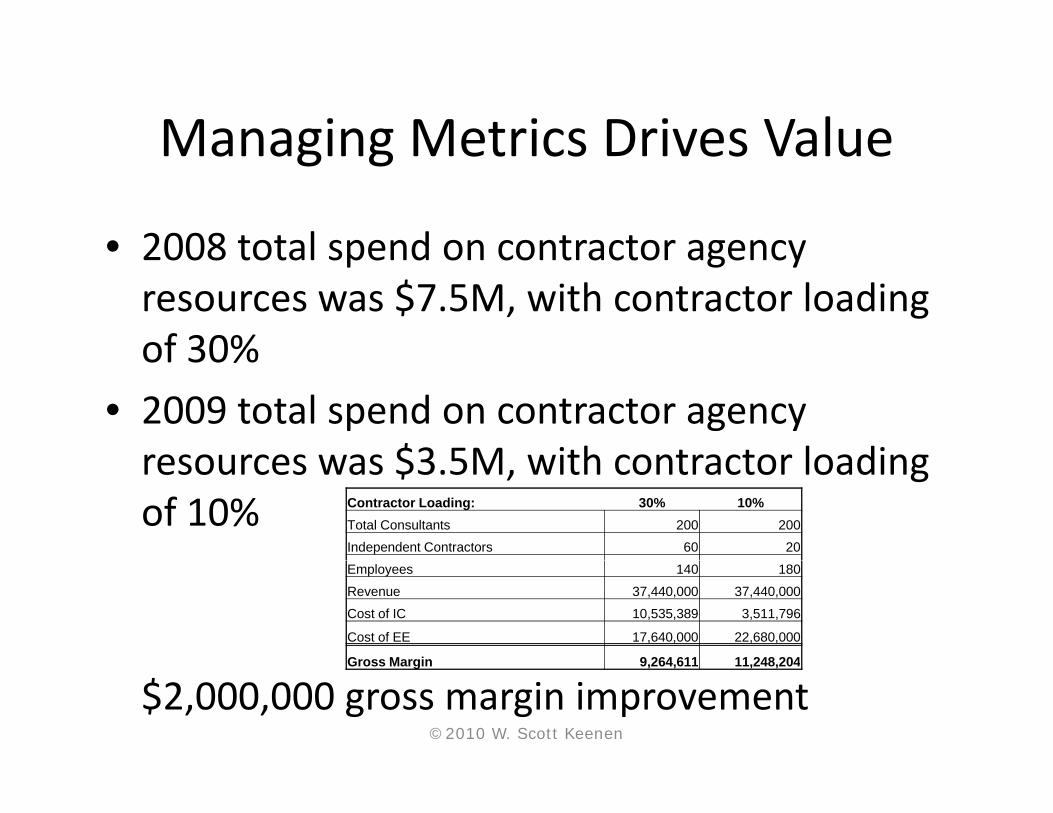
Managing Metrics Drives ValueManaging Metrics Drives Value
• 2008 total spend on contractor agency2008 total spend on contractor agency resources was $7.5M, with contractor loading of 30%of 30%
• 2009 total spend on contractor agency resources was $3 5M with contractor loadingresources was $3.5M, with contractor loading of 10% Contractor Loading: 30% 10%
Total Consultants 200 200Independent Contractors 60 20
Employees 140 180
Revenue 37,440,000 37,440,000
Cost of IC 10,535,389 3,511,796
Cost of EE 17,640,000 22,680,000
Gross Margin 9 264 611 11 248 204
$2,000,000 gross margin improvementGross Margin 9,264,611 11,248,204
©2010 W. Scott Keenen
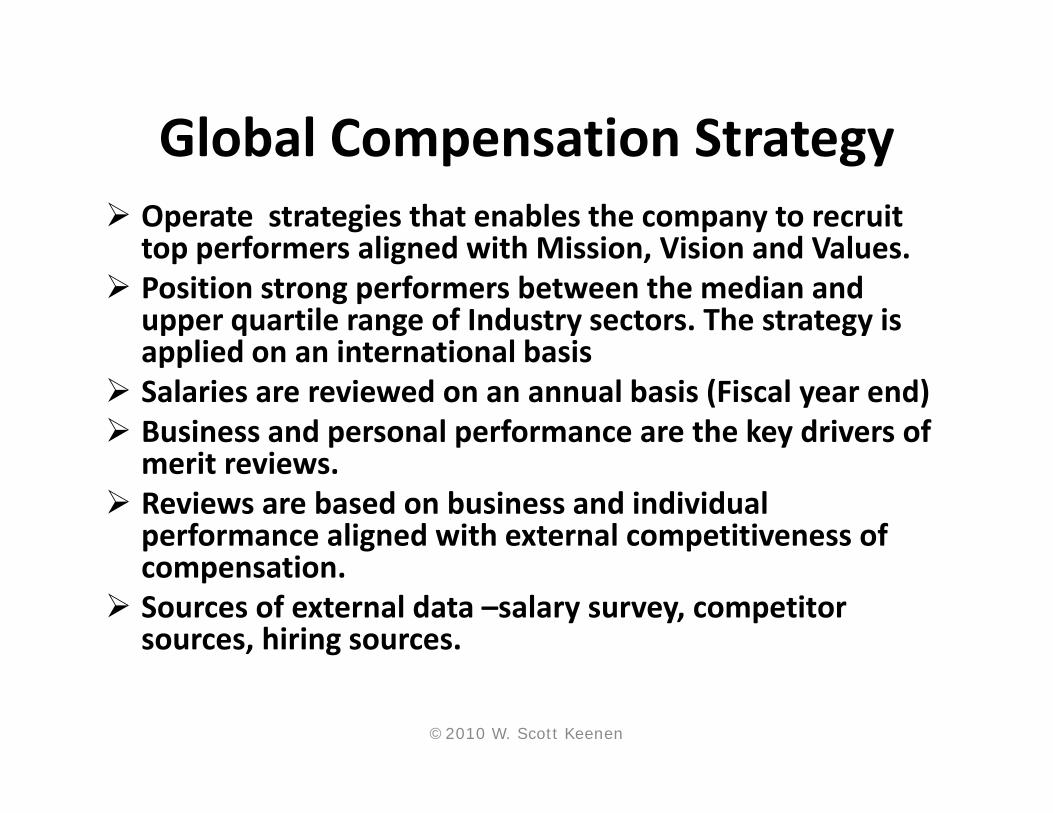
Global Compensation StrategyGlobal Compensation Strategy Operate strategies that enables the company to recruit
top performers aligned with Mission Vision and Valuestop performers aligned with Mission, Vision and Values. Position strong performers between the median and
upper quartile range of Industry sectors. The strategy is applied on an international basisapplied on an international basis
Salaries are reviewed on an annual basis (Fiscal year end) Business and personal performance are the key drivers of
merit re ie smerit reviews. Reviews are based on business and individual
performance aligned with external competitiveness of ticompensation.
Sources of external data –salary survey, competitor sources, hiring sources.
©2010 W. Scott Keenen
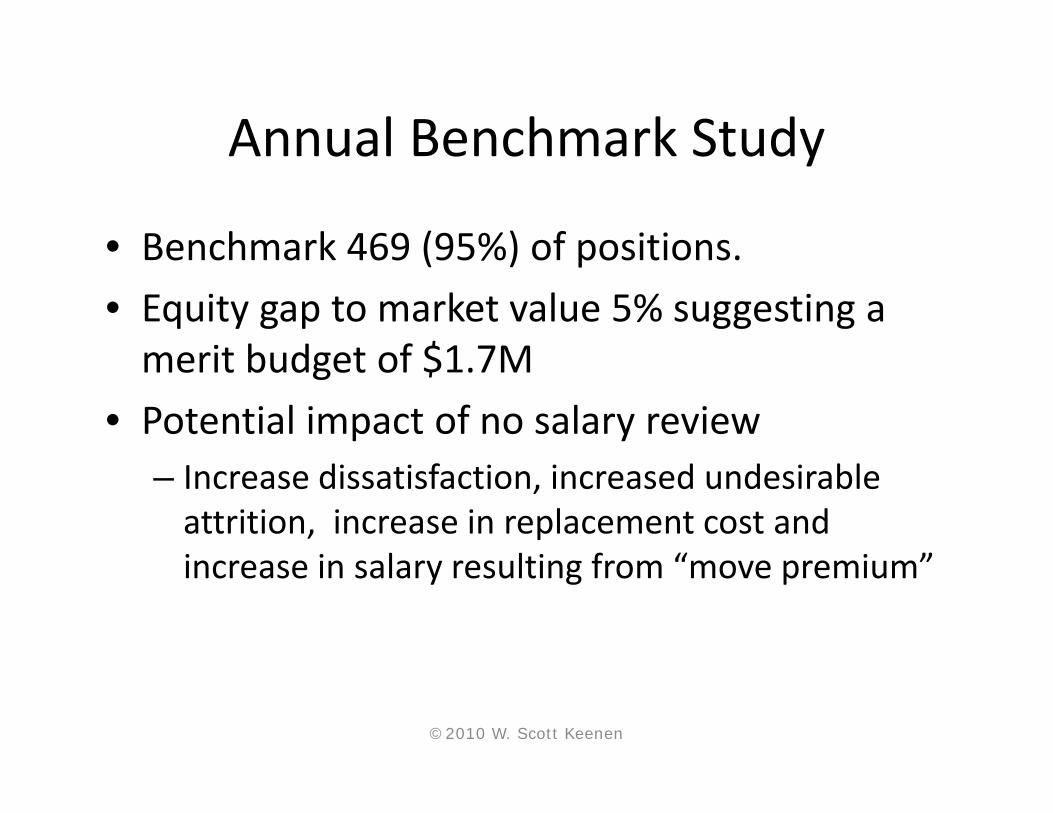
Annual Benchmark StudyAnnual Benchmark Study
• Benchmark 469 (95%) of positionsBenchmark 469 (95%) of positions.
• Equity gap to market value 5% suggesting a merit budget of $1 7Mmerit budget of $1.7M
• Potential impact of no salary review– Increase dissatisfaction, increased undesirable attrition, increase in replacement cost and increase in salar res lting from “mo e premi m”increase in salary resulting from “move premium”
©2010 W. Scott Keenen
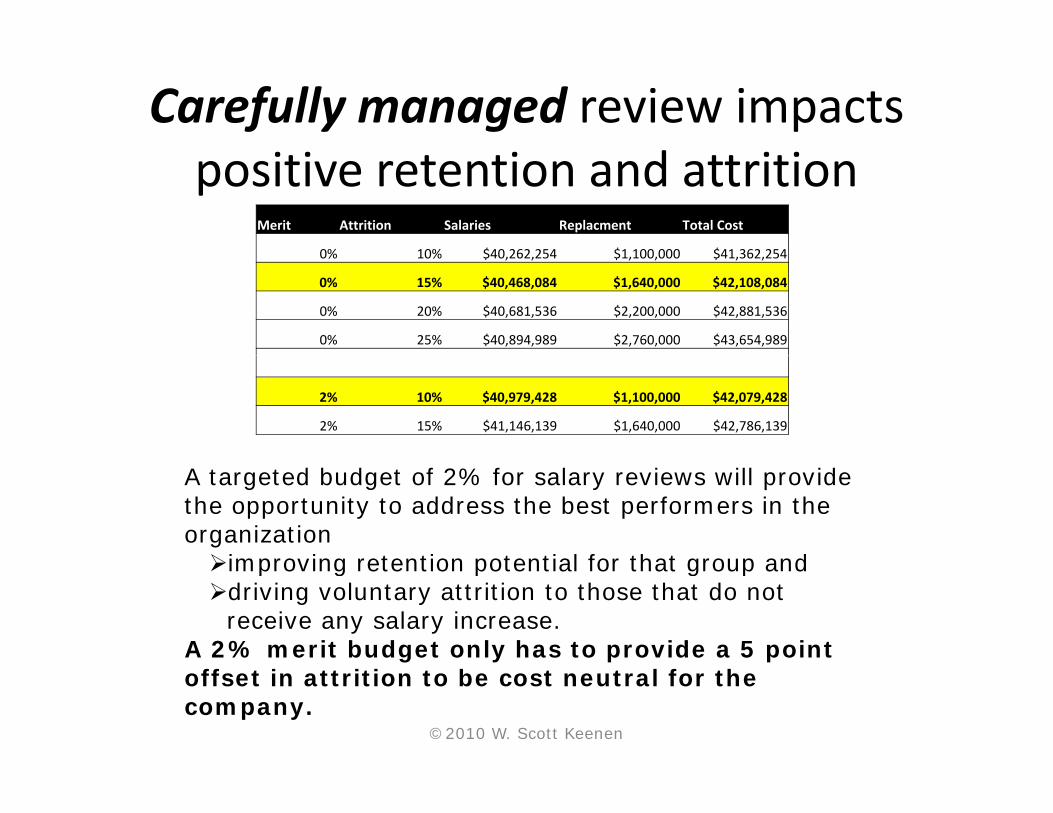
Carefully managed review impacts dpositive retention and attrition
Merit Attrition Salaries Replacment Total Cost
0% 10% $40 262 254 $1 100 000 $41 362 2540% 10% $40,262,254 $1,100,000 $41,362,254
0% 15% $40,468,084 $1,640,000 $42,108,084
0% 20% $40,681,536 $2,200,000 $42,881,536
0% 25% $40,894,989 $2,760,000 $43,654,989
2% 10% $40,979,428 $1,100,000 $42,079,428
2% 15% $41,146,139 $1,640,000 $42,786,139
A targeted budget of 2% for salary reviews will provide the opportunity to address the best performers in the organization improving retention potential for that group and improving retention potential for that group and driving voluntary attrition to those that do not
receive any salary increase. A 2% merit budget only has to provide a 5 point offset in attrition to be cost neutral for the company.
©2010 W. Scott Keenen
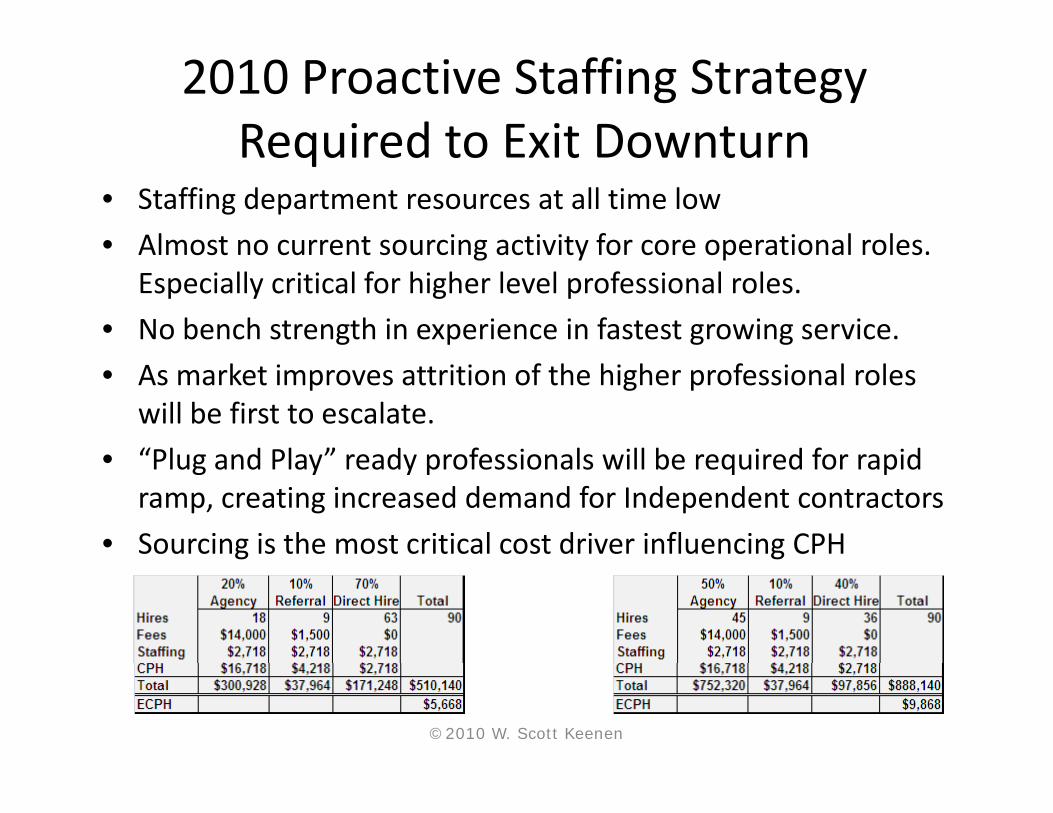
2010 Proactive Staffing Strategy Required to Exit DownturnRequired to Exit Downturn
• Staffing department resources at all time low
• Almost no current sourcing activity for core operational roles.Almost no current sourcing activity for core operational roles. Especially critical for higher level professional roles.
• No bench strength in experience in fastest growing service.
• As market improves attrition of the higher professional roles will be first to escalate.
• “Plug and Play” ready professionals will be required for rapid• Plug and Play ready professionals will be required for rapid ramp, creating increased demand for Independent contractors
• Sourcing is the most critical cost driver influencing CPH
©2010 W. Scott Keenen

2010 Staffing Risk2010 Staffing Risk
Service quality failures due to lack of resources, Service quality failures due to lack of resources, resources not prepared, resources stretched too thin
Higher distraction of Operations Management to focus on staffing
Increase in ECPH Ti t fill i d did t lit d Time to fill increases and candidate quality decreases Increased demand and resulting increase in hourly rates for independent contractorsrates for independent contractors
©2010 W. Scott Keenen
2010 Strategy2010 Strategy
Organization requires a recruiting strategy which will provideg q g gy pimmediate access to sourcing highly qualified candidates,candidate assessment, efficient on‐boarding, and competitivecompensation irrespective of employment statuscompensation irrespective of employment status.
The components of this strategy will be based on:
RPO with industry specific experience for sourcing qualified y p p g qcandidates and providing applicant tracking and candidate assessment tools.
C i kf i ldi Contingent workforce management system yielding a competitive market place for contingent resources, providing centralized administration, and legal compliance.
©2010 W. Scott Keenen

RPO BenefitsRPO Benefits• Access to industry specific sourcing experience.
• Web‐based requisition and applicant tracking.
• On line candidate screening with option of candidate assessment.
• Scalable solution with monthly base line cost equivalent to 2009 sourcing investment plus cost of 1 recruiter. ($8,250 vs $8,750)
• Improved candidate quality, more effective use of hiring managers time, sustained or reduced time to hire
• Efficient on‐boarding (reference checks, FDA debarment check, background check, prepare and extend job offers, electronic notification for new hire)
W/O RPO W/O RPO RPOForecast requisition activity 90 90 90Sourcing and internal recruiter 118,350 118,350Agency and referral fees 391,800 769,800RPO Program Fee 99,000*RPO TA&A Fee 409,500Total estimated recruiting costs 510,150 888,150 508,500Effective Cost Per Hire 5,668 9,868 5,650*estimated based on 90 hires ave salary $62,000
©2010 W. Scott Keenen
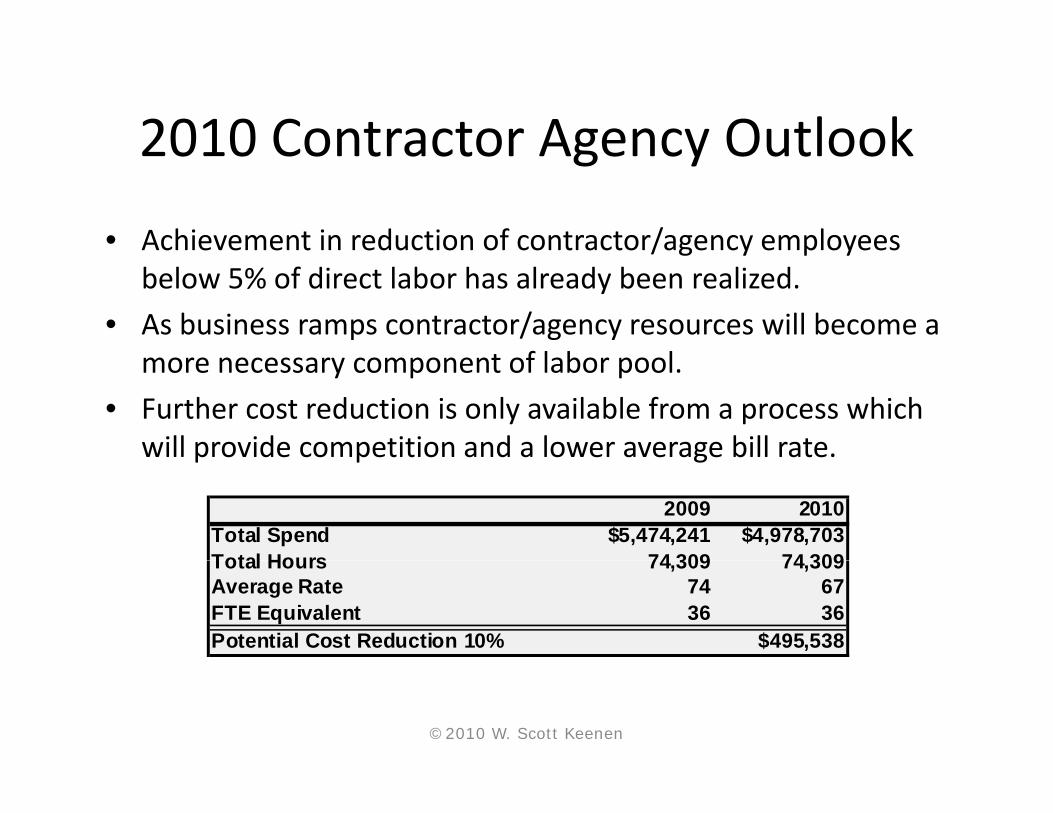
2010 Contractor Agency Outlook2010 Contractor Agency Outlook
• Achievement in reduction of contractor/agency employees / g y p ybelow 5% of direct labor has already been realized.
• As business ramps contractor/agency resources will become a t f l b lmore necessary component of labor pool.
• Further cost reduction is only available from a process which will provide competition and a lower average bill rate.p p g
2009 2010Total Spend $5,474,241 $4,978,703Total Hours 74 309 74 309Total Hours 74,309 74,309Average Rate 74 67FTE Equivalent 36 36Potential Cost Reduction 10% $495,538
©2010 W. Scott Keenen
Contingent Staff Management BenefitsContingent Staff Management Benefits
• Access to industry specific sourcing experience.y p g p
• Web‐based requisitioning and competitive marketplace.
• Web‐based time and expense entry.
• Consolidated bill/pay.
• Rate negotiation savings, best people at the best rates.
• Risk mitigation and legal compliance.
• On line candidate screening with option of candidate assessmentassessment.
• Streamline procurement cycle through vendor qualification.
• 5% savings on bill rate would provide $250,000 cost reduction.
©2010 W. Scott Keenen

©2010 W. Scott Keenen