CONVERSION MODE PHOTON ANALYSIS USING THE …etd.lib.metu.edu.tr/upload/12617510/index.pdf ·...
72
CONVERSION MODE PHOTON ANALYSIS USING THE ALPHA MAGNETIC SPECTROMETER (AMS-02) A THESIS SUBMITTED TO THE GRADUATE SCHOOL OF NATURAL AND APPLIED SCIENCES OF MIDDLE EAST TECHNICAL UNIVERSITY BY EM ˙ IRHAN POSTACI IN PARTIAL FULFILLMENT OF THE REQUIREMENTS FOR THE DEGREE OF MASTER OF SCIENCE IN PHYSICS JULY 2014
-
Upload
nguyencong -
Category
Documents
-
view
223 -
download
1
Transcript of CONVERSION MODE PHOTON ANALYSIS USING THE …etd.lib.metu.edu.tr/upload/12617510/index.pdf ·...

CONVERSION MODE PHOTON ANALYSIS USING THE ALPHA MAGNETICSPECTROMETER (AMS-02)
A THESIS SUBMITTED TOTHE GRADUATE SCHOOL OF NATURAL AND APPLIED SCIENCES
OFMIDDLE EAST TECHNICAL UNIVERSITY
BY
EMIRHAN POSTACI
IN PARTIAL FULFILLMENT OF THE REQUIREMENTSFOR
THE DEGREE OF MASTER OF SCIENCEIN
PHYSICS
JULY 2014


Approval of the thesis:
CONVERSION MODE PHOTON ANALYSIS USING THE ALPHA MAGNETICSPECTROMETER (AMS-02)
submitted by EMIRHAN POSTACI in partial fulfillment of the requirements for thedegree of Master of Science in Physics Department, Middle East Technical Uni-versity by,
Prof. Dr. Canan ÖzgenDean, Graduate School of Natural and Applied Sciences
Prof. Dr. Mehmet T. ZeyrekHead of Department, Physics
Assoc. Prof. Dr. M. Bilge DemirközSupervisor, Physics Department, METU
Examining Committee Members:
Prof. Dr. Mehmet T. ZeyrekPhysics Department, METU
Assoc. Prof. Dr. M. Bilge DemirközPhysics Department, METU
Prof. Dr. Osman YılmazPhysics Department, METU
Prof. Dr. Gürsevil TuranPhysics Department, METU
Prof. Dr. Sakir AyıkPhysics Department, Tennessee Technological University
Date:

I hereby declare that all information in this document has been obtained andpresented in accordance with academic rules and ethical conduct. I also declarethat, as required by these rules and conduct, I have fully cited and referenced allmaterial and results that are not original to this work.
Name, Last Name: EMIRHAN POSTACI
Signature :
iv

ABSTRACT
CONVERSION MODE PHOTON ANALYSIS USING THE ALPHA MAGNETICSPECTROMETER (AMS-02)
Postacı, EmirhanM.S., Department of Physics
Supervisor : Assoc. Prof. Dr. M. Bilge Demirköz
July 2014, 54 pages
The Alpha Magnetic Spectrometer (AMS-02) is a particle physics detector operat-ing as an external module on the International Space Station (ISS). It is designed tosearch for antimatter and dark matter by measuring cosmic ray composition and flux.Dark matter does not interact electromagnetically, so cannot be detected directly withoptical instruments. A strong candidate of dark matter is the lightest supersymmetricparticle which can annihilate into the Standard Model particles, called the neutralino.If neutralinos annihilate in the galactic halo, they could result in an excess of particlesthat can be detected by the AMS-02. Any peaks in the positron, antiproton, or photonspectrum could signal the presence of neutralinos, but would need to be distinguishedfrom other complex astrophysical signals. Photon analysis can be done in two ways:calorimetric mode and conversion mode. In the calorimetric mode of photon anal-ysis, photons leave no trace in subdetectors down to the ECAL. In the conversionmode, photons which are converted to electron-positron pairs in the upper parts ofthe AMS-02 are studied. This thesis outlines the study of conversion mode photonanalysis above 100 GeV energy.
Keywords: Alpha Magnetic Spectrometer, AMS-02, Dark Matter, Weakly InteractingMassive Particles, WIMP, Conversion Mode, Photon
v

ÖZ
ALFA MANYETIK SPEKTROMETRESI (AMS-02) ILE DÖNÜSÜMMODUNDA FOTON ANALIZI
Postacı, EmirhanYüksek Lisans, Fizik Bölümü
Tez Yöneticisi : Doç. Dr. M. Bilge Demirköz
Temmuz 2014 , 54 sayfa
Alfa Manyetik Spektrometresi (AMS-02), Uluslararası Uzay Istasyonu üzerinde ha-rici bir modül olarak faaliyet gösteren bir parçacık fizigi dedektörüdür. Kozmik ısınla-rın içerigini ve akısını ölçerek karanlık madde ve anti madde aramak için tasarlanmıs-tır. Karanlık madde elektromanyetik etkilesme yapmadıgı için optik enstrümanlar iletespit edilemez. Karanlık madde olmaya güçlü bir aday, nötralino denilen, StandartModel parçacıklarına bozusma olasılıgı olan bir en hafif süpersimetrik parçacıktır.Eger nötralinolar galaktik halede bozunursa AMS-02 tarafından gözlemlenebilen par-çacıklarda bir fazlalık meydana getirebilir. Pozitron, anti proton veya foton tayfındakiherhangi bir fazlalık, nötralinonun varlıgına bir isaret olabilir ama alacagımız sinya-lin diger karmasık astrofiziksel sinyallerden ayırt edilmesi gerekir. Foton analizi ikisekilde yapılabilir: kalorimetrik mod ve dönüsüm modu. Kalorimetrik modda dedek-törün en altında yer alan elektromanyetik kalorimetreye gelene kadar iz bırakmayanfotonlar incelenir. Dönüsüm modunda ise dedektörün üst kısımlarında elektron po-zitron çiftine dönüsen fotonlar incelenir. Bu tez 100 GeV üzeri enerjilerde dönüsümmodunda foton analizi çalısmasını özetler.
Anahtar Kelimeler: Alfa Manyetik Spektrometresi, AMS-02, Karanlık Madde, ZayıfEtkilesen Devasa Parçacık, WIMP, Dönüsüm Modu, Foton
vi

To my family
vii

ACKNOWLEDGMENTS
I would like to express my special appreciation and thanks to my supervisor Prof.Bilge Demirköz for her guidance and patience starting from my undergraduate years.I have greatly benefited from her knowledge and experience. Her encouragementhelped me very much while writing this thesis.
I would like to thank Prof. Ting who made AMS possible for me. I would also like tothank all the AMS Collaboration members I know, who helped me during the periodthat I stayed at CERN.
I would also like thank my colleagues Tansu Daylan, Cenk Türkoglu, and EmreErgeçen both for their help for improving my analysis, and their friendship. I willnot forget the times we had both at METU and at CERN. I would also like to thankDilek Kızılören, Aysenur Gencer, and Ramazan Uzel for their contribution in thegroup meetings.
I would like to thank my friends Murat Öztürk and Elif Sarıgül who were with methroughout the Master’s. We had much fun even in the stressful course taking period.
My special thanks go to my parents Reside and Veysel, and my sisters Sebnem andUmut. They all believed and supported me. None of this would be possible withoutthem.
Last but not least, I wish to thank Selen Saatci who gives me the power to go on indifficult times. Life would be so meaningless without her love. I also appreciate herhelp in the writing process of this thesis.
This work is partially supported by Turkish Atomic Energy Agency (TAEK) under thegrant agreement 2012TAEKCERN-A5.H2.P1.01-20, and by the Marie Curie CareerIntegration Grants (CIG) under the grant agreement PCIG10-GA-2011-304264.
viii

TABLE OF CONTENTS
ABSTRACT . . . . . . . . . . . . . . . . . . . . . . . . . . . . . . . . . . . . v
ÖZ . . . . . . . . . . . . . . . . . . . . . . . . . . . . . . . . . . . . . . . . . vi
ACKNOWLEDGMENTS . . . . . . . . . . . . . . . . . . . . . . . . . . . . . viii
TABLE OF CONTENTS . . . . . . . . . . . . . . . . . . . . . . . . . . . . . ix
LIST OF TABLES . . . . . . . . . . . . . . . . . . . . . . . . . . . . . . . . xi
LIST OF FIGURES . . . . . . . . . . . . . . . . . . . . . . . . . . . . . . . . xii
LIST OF ABBREVIATIONS . . . . . . . . . . . . . . . . . . . . . . . . . . . xvi
CHAPTERS
1 INTRODUCTION . . . . . . . . . . . . . . . . . . . . . . . . . . . 1
2 SEARCH FOR DARK MATTER . . . . . . . . . . . . . . . . . . . . 3
2.1 Observational Evidence . . . . . . . . . . . . . . . . . . . . 3
2.2 Particle Nature of Dark Matter . . . . . . . . . . . . . . . . 6
2.3 Detecting Dark Matter . . . . . . . . . . . . . . . . . . . . . 7
2.3.1 Direct Detection . . . . . . . . . . . . . . . . . . 7
2.3.2 Accelerator Searches . . . . . . . . . . . . . . . . 8
2.3.3 Indirect Detection . . . . . . . . . . . . . . . . . . 10
ix

2.4 Electron-Positron Pair Production . . . . . . . . . . . . . . . 12
3 AMS-02 DETECTOR . . . . . . . . . . . . . . . . . . . . . . . . . 17
3.1 Overview . . . . . . . . . . . . . . . . . . . . . . . . . . . . 17
3.2 Subdetectors . . . . . . . . . . . . . . . . . . . . . . . . . . 18
3.2.1 Magnet . . . . . . . . . . . . . . . . . . . . . . . 18
3.2.2 Transition Radiation Detector (TRD) . . . . . . . . 19
3.2.3 Silicon Tracker . . . . . . . . . . . . . . . . . . . 21
3.2.4 Anticoincidence Counters (ACC) . . . . . . . . . . 22
3.2.5 Time of Flight (TOF) . . . . . . . . . . . . . . . . 23
3.2.6 Ring Imaging Cerenkov Detector (RICH) . . . . . 24
3.2.7 Electromagnetic Calorimeter (ECAL) . . . . . . . 25
3.3 AMS-02 as a Photon Detector . . . . . . . . . . . . . . . . . 26
3.3.1 Calorimetric Mode . . . . . . . . . . . . . . . . . 26
3.3.2 Conversion Mode . . . . . . . . . . . . . . . . . . 26
3.4 AMS-02 Results . . . . . . . . . . . . . . . . . . . . . . . . 27
4 ANALYSIS . . . . . . . . . . . . . . . . . . . . . . . . . . . . . . . 35
4.1 Event Selection . . . . . . . . . . . . . . . . . . . . . . . . 35
4.2 Results and Discussion . . . . . . . . . . . . . . . . . . . . 46
5 CONCLUSION . . . . . . . . . . . . . . . . . . . . . . . . . . . . . 49
REFERENCES . . . . . . . . . . . . . . . . . . . . . . . . . . . . . . . . . . 51
x

LIST OF TABLES
TABLES
Table 2.1 The cross section values for two nucleus, Z = 6 Carbon and Z = 13Aluminum. . . . . . . . . . . . . . . . . . . . . . . . . . . . . . . . . . . 15
Table 2.2 The angle between the incident photon and emerging electron (orpositron). . . . . . . . . . . . . . . . . . . . . . . . . . . . . . . . . . . . 15
xi

LIST OF FIGURES
FIGURES
Figure 1.1 An overview of each of the AMS-02 subsystems and support struc-tures [48]. . . . . . . . . . . . . . . . . . . . . . . . . . . . . . . . . . . 2
Figure 2.1 Rotation curve versus radius of NGC 6503 and contribution fromvarious components of the galaxy. The dashed, dotted, and dash-dottedlines are the visible components, the gas, and the dark matter halo, re-spectively. Adding the dark halo contribution to Keplerian decrease, themeasured flat rotation curve can be deduced [15]. . . . . . . . . . . . . . 4
Figure 2.2 X-ray image of the Bullet Cluster by Chandra X-ray Observatoryis in blue, red, and yellow. Superimposed mass density contours derivedfrom the gravitational lensing effect are shown in green. Right ascension(x-axis) units are hours, minutes, and seconds, and declination (y-axis)units are degrees, and arcminutes [28]. . . . . . . . . . . . . . . . . . . . 5
Figure 2.3 The power spectrum of the CMB radiation temperature anisotropyin angular scale, covering multipole moments l between 2 and 2500. Thefirst, the second, and the third acoustic peaks give physical informationabout curvature of the Universe, reduced baryon density, and dark matterdensity, respectively [7]. . . . . . . . . . . . . . . . . . . . . . . . . . . . 6
Figure 2.4 WIMP-nucleon spin-independent cross section limits from differ-ent direct detection experiments (color), and some theoretical predictions(grey) [11]. . . . . . . . . . . . . . . . . . . . . . . . . . . . . . . . . . . 9
Figure 2.5 Exluded mass regions at 95% CL for chargino-neutralino produc-tion measured by CMS [35]. . . . . . . . . . . . . . . . . . . . . . . . . . 9
Figure 2.6 Positron fraction measured by PAMELA (red) compared with pre-vious experiments (black) [8]. . . . . . . . . . . . . . . . . . . . . . . . . 10
Figure 2.7 Fermi LAT positron fraction measurement (red) compared withother experiments [5]. . . . . . . . . . . . . . . . . . . . . . . . . . . . . 11
xii

Figure 2.8 E2×Φ versus energy, and a power law fit (red) by Fermi LAT. Thegrey band stands for systematic uncertainty [4]. . . . . . . . . . . . . . . 11
Figure 2.9 Photon cross section for Cu in the energy range between 10 keV
and 100 GeV [33]. . . . . . . . . . . . . . . . . . . . . . . . . . . . . . . 13
Figure 3.1 An exploded view of AMS-02 [31]. . . . . . . . . . . . . . . . . . 18
Figure 3.2 The Transition Radiation Detector (TRD) seen from the side, read-out elements, and support structure [49]. . . . . . . . . . . . . . . . . . . 19
Figure 3.3 The working principle of AMS-02 TRD. Incoming particle is inblue, the TR photon is in red, and the straw tubes which are filled withXe-CO2 gas mixture are in green [49]. . . . . . . . . . . . . . . . . . . . 20
Figure 3.4 TRD-LLe distribution for electrons with energies between 15 and35 GeV , and 50 and 100 GeV (left), and for protons with energies be-tween 20 and 22 GeV , and 330 GeV (right) [46]. . . . . . . . . . . . . . . 20
Figure 3.5 One of the nine tracker planes which consists ladders that are madeof double sided silicon microstrip sensors [49]. . . . . . . . . . . . . . . . 21
Figure 3.6 Working principle of the ACC. Incident particles which hit themagnet are rejected [48]. . . . . . . . . . . . . . . . . . . . . . . . . . . . 22
Figure 3.7 The upper (left) and the lower (right) ToF planes during assembly[49]. . . . . . . . . . . . . . . . . . . . . . . . . . . . . . . . . . . . . . 23
Figure 3.8 Particle charge magnitude evaluated by the upper ToF. Lower ToFis also gives similar results with upper ToF [41]. . . . . . . . . . . . . . . 23
Figure 3.9 Exploded view of the RICH. The radiators plane (top), the conicalreflecting mirror (middle), and the detection plane (bottom) [40]. . . . . . 24
Figure 3.10 The Electromagnetic Calorimeter (ECAL). The fibers and the sup-port structure can be seen [49]. . . . . . . . . . . . . . . . . . . . . . . . 25
Figure 3.11 An AMS-02 event display shows a downward going MC photonshowering in the ECAL. Few hits in the RICH and the Tracker are dueto the backscattered particles. Red dashed line indicates the reconstructedphoton direction, i.e., there is no track [30]. . . . . . . . . . . . . . . . . . 27
Figure 3.12 An AMS-02 event display shows an MC photon convert in the up-per ToF, and the e+e− pair bend in opposite directions in the inner Trackerdue to magnetic field. While the e+ escapes the AMS-02 volume, the e−
gives a shower in the ECAL [30]. . . . . . . . . . . . . . . . . . . . . . . 28
xiii

Figure 3.13 The AMS-02 positron fraction compared with PAMELA and Fermi-LAT [10]. . . . . . . . . . . . . . . . . . . . . . . . . . . . . . . . . . . . 29
Figure 3.14 The positron fraction measured by AMS-02 and fit with the mini-mal model [36]. . . . . . . . . . . . . . . . . . . . . . . . . . . . . . . . 30
Figure 3.15 Galactic maps of the electron (left) and positron (right) events inthe energy range of 16 − 350 GeV . The colors represent the number ofevents per bin [25]. . . . . . . . . . . . . . . . . . . . . . . . . . . . . . . 30
Figure 3.16 Measured electron (left) and positron (right) fluxes by AMS-02compared with HEAT and PAMELA [47]. . . . . . . . . . . . . . . . . . 31
Figure 3.17 Combined electron – positron spectrum compared with previousexperiments [18]. . . . . . . . . . . . . . . . . . . . . . . . . . . . . . . 32
Figure 3.18 The average proton flux of AMS-02 compared with previous ex-periments [32]. . . . . . . . . . . . . . . . . . . . . . . . . . . . . . . . . 32
Figure 3.19 The measured helium spectrum multiplied by the rigidity value inthe 2.7 power by AMS-02 compared with the previous experiments [26]. . 33
Figure 3.20 Boron to carbon ratio measured by AMS-02 compared with previ-ous experiments [41]. . . . . . . . . . . . . . . . . . . . . . . . . . . . . 33
Figure 4.1 Energy resolution of the ECAL with respect to energy. It is derivedusing photon MC. . . . . . . . . . . . . . . . . . . . . . . . . . . . . . . 36
Figure 4.2 Angular resolution of the ECAL with respect to energy. It is de-rived using photon MC. . . . . . . . . . . . . . . . . . . . . . . . . . . . 36
Figure 4.3 Efficiency versus reconstructed energy for single track cut. . . . . . 37
Figure 4.4 Chi-square distribution of photon MC. A loose cut is applied, trackswhich have a chi-square value less than 10 are selected. . . . . . . . . . . 38
Figure 4.5 MC tracker charge values for photon, electron, proton, and helium;in red, blue, green, and purple, respectively. Electron and proton sampleshave a peak around 1, while converted photons have a peak around 1.4.Helium has a peak at 2 which is not the main background. A selection isapplied between 1.2 and 1.8. . . . . . . . . . . . . . . . . . . . . . . . . 39
Figure 4.6 Photon MC charge information in different Tracker layers. Whilethe layer number is increasing, the charge information becomes more elec-tron like. In layer 9, most of the events have charge value of 1 which isincompatible with converted photons. For this reason, Layer 9 is excludedwhen calculating the charge value. . . . . . . . . . . . . . . . . . . . . . 40
xiv

Figure 4.7 Efficiency versus reconstructed energy for charge larger than 1.2 cut. 40
Figure 4.8 Efficiency versus reconstructed energy for charge below 1.8 cut. . . 41
Figure 4.9 Tracker charge value of ISS data. Proton domination in cosmicrays can be seen in the peak around 1. Between 1.2 and 1.8 is selected forconverted photon signal. . . . . . . . . . . . . . . . . . . . . . . . . . . . 41
Figure 4.10 Efficiency versus reconstructed energy for TRD geometrical ac-ceptance cut. . . . . . . . . . . . . . . . . . . . . . . . . . . . . . . . . . 42
Figure 4.11 Efficiency versus reconstructed energy for no hits in TRD first 5
layers cut. . . . . . . . . . . . . . . . . . . . . . . . . . . . . . . . . . . 42
Figure 4.12 cos(z) of ECAL shower value derived by using photon MC. Down-ward going events have cos(z) value of −1. . . . . . . . . . . . . . . . . . 43
Figure 4.13 cos(z) of ECAL shower for ISS data. Events at 1 are undesiredupward going particles. Then, events at −1 are selected. . . . . . . . . . . 43
Figure 4.14 Efficiency versus reconstructed energy for (ECAL Shower - TrackerTrack) < 5 cm cut. . . . . . . . . . . . . . . . . . . . . . . . . . . . . . . 44
Figure 4.15 E/p value for photon MC. Events which haveE/p < 30 are selected. 44
Figure 4.16 Efficiency versus reconstructed energy for E/p < 30 cut. . . . . . 45
Figure 4.17 MC ECAL BDT values for photon, electron, and proton; in red,blue, and green, respectively. Protons has a peak at −1 while convertedphotons and electron have peaks at 1. A selection is applied for eventslarger than 0.5. This is the most powerful cut to eliminate proton back-ground. . . . . . . . . . . . . . . . . . . . . . . . . . . . . . . . . . . . . 46
Figure 4.18 Efficiency versus reconstructed energy for the ECAL BDT > 0.5 cut. 46
Figure 4.19 The ECAL BDT value of ISS data. Events at −1 are protons.Events which have a BDT value below 0.5 are rejected. . . . . . . . . . . 47
Figure 4.20 A front and side view of AMS-02 event display which shows ahigh energy conversion mode MC photon event which passes all the cutsin the event selection. . . . . . . . . . . . . . . . . . . . . . . . . . . . . 47
Figure 4.21 Expected number of events derived using Fermi power law fit inFigure 2.8. . . . . . . . . . . . . . . . . . . . . . . . . . . . . . . . . . . 48
xv

LIST OF ABBREVIATIONS
ACC Anticoincidence Counters
AMS Alpha Magnetic Spectrometer
ATLAS A Toroidal LHC Apparatus
BDT Boosted Decision Tree
CAST CERN Axion Solar Telescope
CERN The European Organization for Nuclear Research
CMB Cosmic microwave background
CMS Compact Muon Solenoid
COBE Cosmic Background Explorer
ECAL Electromagnetic Calorimeter
ESA European Space Agency
ISS International Space Station
LHC Large Hadron Collider
LNGS Gran Sasso National Laboratory
LSP Lightest supersymmetric particle
MC Monte Carlo
MET Missing transverse energy
MIP Minimum ionizing particle
NASA National Aeronautics and Space Administration
NGC New General Catalogue of Nebulae and Clusters of Stars
PAMELA a Payload for Antimatter Matter Exploration and Light-nucleiAstrophysics
PMT Photomultiplier
QCD Quantum Chromodynamics
RICH Ring Imaging Cerenkov Detector
SAA South Atlantic Anomaly
SM Standard Model
SUSY Supersymmetry
TOF Time of Flight System
xvi

TR Transition radiation
TRD Transition Radiation Detector
WIMP Weakly interacting massive particle
WMAP Wilkinson Microwave Anisotropy Probe
xvii

xviii

CHAPTER 1
INTRODUCTION
The Alpha Magnetic Spectrometer (AMS-02) is a general purpose astroparticle physics
experiment that was installed on the International Space Station (ISS) on the 19th of
May, 2011, and has been taking cosmic-ray data since. Orbiting the Earth on the ISS
at an altitude of about 300 km, AMS-02 is studying the composition of primary cos-
mic rays with an unprecedented accuracy of one part in 10 billion particles, exploring
a new frontier in the field of particle physics. AMS-02 searches for primordial anti-
matter and a dark matter signature. AMS-02 measures the cosmic-ray spectrum for
charged particles and photons, as well as for primary elements up to Fe. AMS-02
determines the momentum, the charge, the velocity and the energy of a particle using
a permanent magnet and several subdetectors. AMS-02 allows for the measurement
of momentum up to 3 TeV/nucleon and charge of the particle by reconstructing the
particle’s curvature in the magnetic field. High energy photons which convert to e+e−
pairs in the AMS-02 volume can also be identified and their energy, determined. The
energy spectra of cosmic particles such as positrons, antiprotons, and photons can
contain dark matter annihilation signatures in the galactic halo. AMS-02 measured
over 50 billion particles for 1125 days as of the 18th of June, 2014, and it is going to
operate until the end of the ISS mission which has been approved until 2024. AMS-
02 published the first results about positron fraction in the Physical Review Letters
using 8% of the total expected data [10]. Figure 1.1 shows AMS-02 subsystems and
support structures.
In the AMS-02 collaboration, the analysis effort has been organized into two groups
named Group Alpha and Group A, which independently work on each analysis topic
1

Figure 1.1: An overview of each of the AMS-02 subsystems and support structures
[48].
before revealing their results at a designated collaboration meeting. Before publish-
ing an analysis paper, the work and the results are cross-checked, sometimes based
on different analysis techniques. Only when a consensus is reached, the analysis is
concluded and the progress reported in physics journal. The METU-AMS team is
part of the Alpha analysis effort along with MIT, Hawaii, LAPP-Annecy, Grenoble,
Academia Sinica, IHEP-Beijing, Geneva and CIEMAT-Madrid groups.
This thesis outlines a conversion mode analysis for photon data collected by AMS-
02. A sharp feature in the photon spectrum could be a strong signal of dark matter
annihilation in the galactic halo. Therefore, this thesis first focuses on the theoreti-
cal predictions and the experimental search for dark matter in Chapter 2. Then, an
overview of AMS-02 detector and current published results will be presented in Chap-
ter 3. In Chapter 4, the analysis procedure will be explained in detail. Finally a brief
conclusion will be given in Chapter 5.
2

CHAPTER 2
SEARCH FOR DARK MATTER
In this chapter, first, observational evidences for dark matter will be reviewed. Then,
particle nature of dark matter, and the detection mechanism will be presented. Finally,
electron-positron pair production mechanism will be discussed which is crucial for
the author’s analysis that will be explained later.
2.1 Observational Evidence
In 1933, Swiss astrophysicist Fritz Zwicky investigated the dispersion speed of a
small group of seven galaxies in the Coma Cluster. Zwicky’s goal was to calculate
the total mass of the cluster, and he observed a discrepancy between the luminous
mass and the dynamical mass measured by using the virial theorem. The dispersion
speed of these galaxies was surprisingly lower than expected [51]. The conclusion
Zwicky made pointed to the existence of extra mass. Since this extra mass must have
been non-luminous, he named it dark matter.
After Zwicky’s pioneering work, the next evidence for dark matter was presented by
Vera Rubin in 1970. Rubin measured the velocity curve of spiral galaxies with a high
precision spectrograph [45]. Rubin found out that most stars have approximately
same orbital speeds in spiral galaxies, i.e., rotational curves of the galaxies are flat
[44]. It was unexpected that galaxies do not have a Keplerian velocity decrease at
large radius. Rubin concluded that non-luminous matter must exist beyond the visible
galaxy. This work also suggests that dark matter must have a halo structure. A halo
contribution must be added to obtain the observed flat rotation curve which can be
3

seen in Figure 2.1. In other words, if there was no dark matter, not only would the
average rotational velocity be lower on average, the profile would also be different.
Figure 2.1: Rotation curve versus radius of NGC 6503 and contribution from various
components of the galaxy. The dashed, dotted, and dash-dotted lines are the visible
components, the gas, and the dark matter halo, respectively. Adding the dark halo
contribution to Keplerian decrease, the measured flat rotation curve can be deduced
[15].
1E 0657-558 (z = 0.296) cluster which is also known as the Bullet Cluster is con-
sidered as the strongest observational evidence for the existence of dark matter. The
Bullet Cluster consists of two colliding clusters of galaxies which is shown in Figure
2.2. A weak lensing study shows that the gravitational potential traces the distribu-
tion of mass in the galaxy. Superimposed mass density contours which can be seen
in Figure 2.2 in green shows the gravitational centers of the galaxy which is not in
the same region as baryonic component of the galaxy. As two clusters collide, since
the baryonic mass component has friction, it emits X-rays and slows down, while
dark matter which is frictionless continues on its path with nearly constant velocity.
At a statistical significance of 8σ, the spatial difference between the center of the to-
tal mass and the center of the baryonic mass peaks cannot be explained by modified
gravitation theories. Hence, this study strongly indicates that the most of the matter
in the system is unseen [28].
4
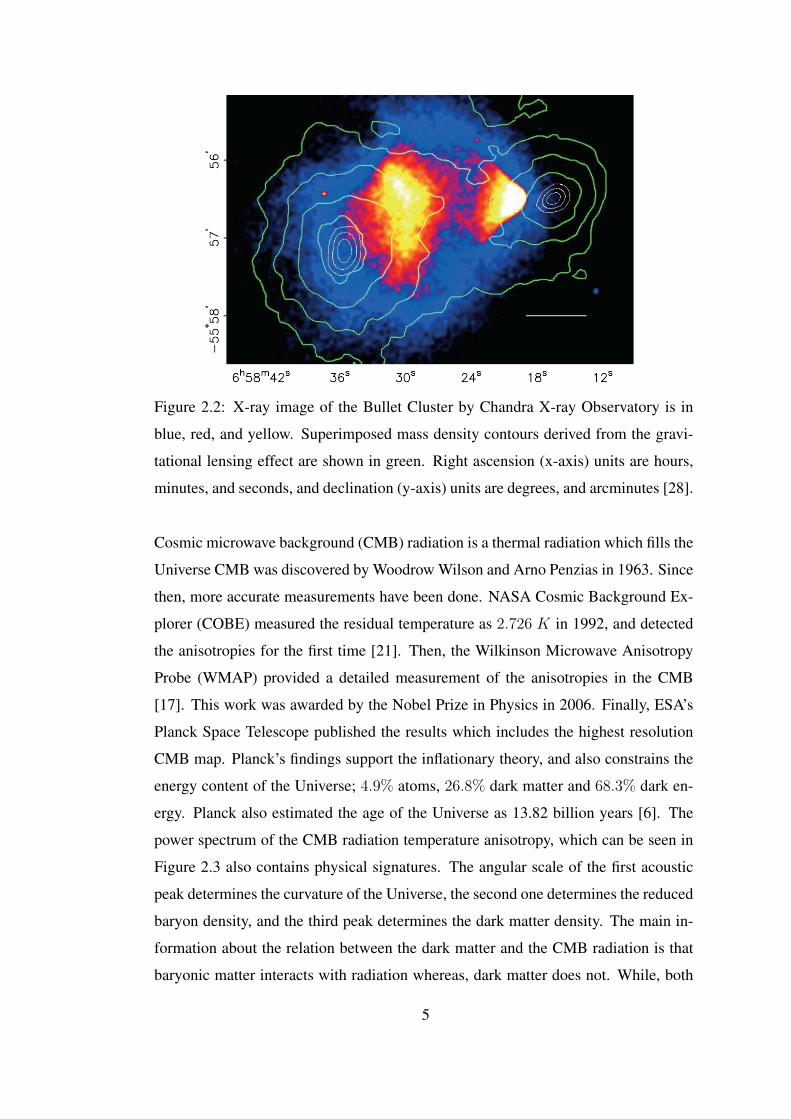
Figure 2.2: X-ray image of the Bullet Cluster by Chandra X-ray Observatory is in
blue, red, and yellow. Superimposed mass density contours derived from the gravi-
tational lensing effect are shown in green. Right ascension (x-axis) units are hours,
minutes, and seconds, and declination (y-axis) units are degrees, and arcminutes [28].
Cosmic microwave background (CMB) radiation is a thermal radiation which fills the
Universe CMB was discovered by Woodrow Wilson and Arno Penzias in 1963. Since
then, more accurate measurements have been done. NASA Cosmic Background Ex-
plorer (COBE) measured the residual temperature as 2.726 K in 1992, and detected
the anisotropies for the first time [21]. Then, the Wilkinson Microwave Anisotropy
Probe (WMAP) provided a detailed measurement of the anisotropies in the CMB
[17]. This work was awarded by the Nobel Prize in Physics in 2006. Finally, ESA’s
Planck Space Telescope published the results which includes the highest resolution
CMB map. Planck’s findings support the inflationary theory, and also constrains the
energy content of the Universe; 4.9% atoms, 26.8% dark matter and 68.3% dark en-
ergy. Planck also estimated the age of the Universe as 13.82 billion years [6]. The
power spectrum of the CMB radiation temperature anisotropy, which can be seen in
Figure 2.3 also contains physical signatures. The angular scale of the first acoustic
peak determines the curvature of the Universe, the second one determines the reduced
baryon density, and the third peak determines the dark matter density. The main in-
formation about the relation between the dark matter and the CMB radiation is that
baryonic matter interacts with radiation whereas, dark matter does not. While, both
5

affect the oscillations by their gravity, thus two forms of matter will have different
effects. Therefore, measurements of the CMB radiation in the Universe provide per-
haps the most compelling evidences that the dark matter is non-baryonic and the most
precise measurements of its abundance.
Figure 2.3: The power spectrum of the CMB radiation temperature anisotropy in an-
gular scale, covering multipole moments l between 2 and 2500. The first, the second,
and the third acoustic peaks give physical information about curvature of the Uni-
verse, reduced baryon density, and dark matter density, respectively [7].
After 2006, cold dark matter theory is favored by most cosmologists as a description
of how the Universe went from small structures at early times (as shown by the CMB)
to the bigger structures like galaxy clusters [13].
2.2 Particle Nature of Dark Matter
The leading dark matter particle candidates are assumed to be non-baryonic and cold,
i.e., nonrelativistic. The strongest candidates are axions and weakly interacting mas-
sive particles (WIMPs). The axion is postulated as a possible solution to strong CP
problem in QCD [42]. The axion mass is constrained to be near 10−5 eV [34]. WIMPs
are stable particles which can arise in several extensions of the Standard Model such
as supersymmetry and hidden valley theories, and are the main concern of this sec-
tion.
6

Supersymmetry (SUSY) is a beyond SM theory which relates bosons and fermions.
In SUSY, each SM fermion have a boson superpartner, and vice versa. The most
discussed and theoretically developed WIMP candidate is the neutralino, the lighest
supersymmetric particle (LSP) in many SUSY theories. R-parity, which is an exact
discrete symmetry, predicts that the LSP is stable. Neutralino is a linear combination
of the supersymmetric particles photino, higssino, and Z-ino which are the superpart-
ners of photon, Higgs, and Z, respectively. It is predicted by SUSY that the neutralino
has a mass less than a few TeV and interacts weakly with ordinary matter. If a WIMP
like neutralino exists, it should have a cosmological abundance Ω ∼ 1, and can ac-
count for dark matter in the Universe today [34].
If WIMPs are responsible for the flatness of galactic rotation curves, then the lo-
cal halo density should be around 0.3 GeV cm−3, and they should have a Maxwell-
Boltzmann distribution with a velocity dispersion of about 220 km s−1 [34]. WIMPs
should have a non-zero coupling to ordinary matter, as they must annihilate in the
early Universe.
2.3 Detecting Dark Matter
If dark matter has a particle nature, and if it interacts with matter, it must do so through
three mechanisms. These are the annihilation, the production, and the scattering.
Each mechanism requires different experiments for detection, and a combination of
these are required for discovery. The indirect detection experiments search for the
resultant particles from annihilation. The production of dark matter particles can
only be tested in an accelerator such as at the LHC. Direct detection experiments are
sensitive to the scattering channel. The direct detection and the indirect detection
experiments, and the accelerator searches will be mentioned in this section.
2.3.1 Direct Detection
The dominant interaction mechanism is elastic scattering because of the low velocity
of the WIMPs. These interactions are spin-independent. The differential recoil energy
7

spectrum of this type of interaction is given by the formula [46]:
dR
dQ=
σ0ρ0√πv0mχmr
2F 2(Q)T (Q) (2.1)
where mχ is the WIMP mass, ρ0 is the WIMP density in the galactic halo, σ0 is the
scattering cross section between the WIMP and the nucleus, mr is the WIMP-nucleus
reduced mass which is mr = mχmNmχ+mN
, mN is the mass of the nucleus, F 2(Q) is the
nuclear form factor, and finally T (Q) is a dimensionless integral over the local WIMP
velocity distribution.
In order to reduce the cosmic ray background, direct detection experiments mostly
operate in deep underground laboratories. Two types of detector technologies are
commonly used by direct detection experiments: cryogenic detectors and noble liquid
detectors. Cryogenic detectors operate at temperatures below ~100 mK to detect the
heat produced when a particle hits an atom in a crystal absorber, e.g., germanium.
The work principle of noble liquid detectors depends on detecting the flash of the
scintillation light produced by a particle collision in the noble liquid, e.g., xenon,
argon.
XENON100 is a direct detection experiment operated at the Gran Sasso National
Laboratory (LNGS) for 13 months. It uses liquid xenon for both target (ionization)
and detection (scintillation signals). XENON100 set the best limit on WIMP-nucleon
scattering cross section for WIMP masses above 8 GeV/c2, with a minimum of 2 ×10−45cm2 at 55 GeV/c2 which can be seen in Figure 2.4 [11].
The CAST experiment searches for axions. If axions exist, they can be detected by the
conversion to photons in a strong magnetic field. The CAST uses an LHC magnet for
that purpose. CAST analysis up to 2003 implied an upper limit to the axion-photon
coupling of gaγ < 1.16× 10⁻¹⁰ GeV −1 at 95% CL for ma < 0.02 eV [16].
2.3.2 Accelerator Searches
The main signature of dark matter particle produced at accelerator searches such as
the LHC is missing transverse energy (MET) in the detector along with the other SM
particles. Searches generally rule out certain parameters of phase space dependent on
the model and free variables used. The latest results from ATLAS [2] and CMS [35]
8

Figure 2.4: WIMP-nucleon spin-independent cross section limits from different direct
detection experiments (color), and some theoretical predictions (grey) [11].
on dark matter searches mainly concentrate on different SUSY models while there
are also searches for extra dimensions [37] and hidden valley [50] models.
Current searches are sensitive up to neutralino masses of about 1 TeV , and some
SUSY models predicting masses up to 700 GeV have been ruled out [1].
Figure 2.5: Exluded mass regions at 95% CL for chargino-neutralino production mea-
sured by CMS [35].
9

2.3.3 Indirect Detection
Particles are produced by the interaction of cosmic rays and interstellar medium, and
it is called secondary production. Apart from secondary production, particles can
also be created by dark matter particle annihilations. Collisions of dark matter in the
galactic halo can annihilate into particle-antiparticle pairs such as ZZ, W−W+, HH ,
τ−τ+, tt etc. with kinematic constraints. However, these particles eventually decay
into the handful stable particles of the SM, which are: e−e+, pp, γ, and νs.
χ+ χ→ p+ ...
→ e+ + ...
→ γ + ...
While e− and p are abundant in cosmic rays, a deviation from the expected smooth
power law spectrum (due to Fermi acceleration and collision of particles) for p, e+,
γ can indicate a dark matter signal. νs are notoriously hard to detect. ICECUBE
experiment has an upper limit on the cross section as a function of WIMP mass from
300 GeV to 100 TeV for the annihilation into νν [3].
Figure 2.6: Positron fraction measured by PAMELA (red) compared with previous
experiments (black) [8].
Figure 2.6 shows the positron fraction measured by PAMELA up to 100 GeV com-
pared with previous balloon experiments: Muller & Tang 1987 [39], Clem & Even-
10

Figure 2.7: Fermi LAT positron fraction measurement (red) compared with other
experiments [5].
son [27], HEAT94+95 [12], CAPRICE94 [20], HEAT00 [14], and a space experiment
AMS-01 [9]. PAMELA had a total acquisition time of 500 days, and 151,672 elec-
trons and 9,430 positrons were identified [8].
Figure 2.8: E2 × Φ versus energy, and a power law fit (red) by Fermi LAT. The grey
band stands for systematic uncertainty [4].
Figure 2.7 shows the positron fraction measurement by Fermi LAT between 20 GeV
and 200 GeV compared with previous results. While both PAMELA and Fermi data
indicate a rise in the positron fraction above 30 GeV , the measurements are low in
11

statistics and not in agreement with each other. More statistics and better energy
resolution are required for a dark matter signature. Moreover, such an observation
can point to possible production of positrons from nearby astrophysical sources, such
as pulsars [23]. For a conclusive dark matter signature, the point where the spectrum
falls must be observed, which requires higher energy measurement. AMS-02 which
has a magnet, larger acceptance, and more acquisition time, measured the positron
fraction with unprecedented accuracy, and it will be discussed in Chapter 3 in detail.
Figure 2.8 shows photon flux measured by Fermi LAT up to 263.7 GeV and a power
law fit [4]. There is also a suggestion that there might be a dark matter annihilation
into two photons would give a sharp feature at the χ0 mass [30].
2.4 Electron-Positron Pair Production
Since this analysis is based on converted photons, i.e. photons which make electron-
positron pair production, it is necessary to briefly discuss pair production in this sec-
tion.
The photon interaction with matter can be categorized according to: the type of target,
e.g., electrons, nuclei, etc., and the type of event, e.g., absorption, scattering, electron-
positron pair production, etc. The cross sections of a photon with Cu is shown in
Figure 2.9 as an example. It can be seen in this figure that the dominant interaction
after 10 MeV is pair production.
Electron-positron pair production is one of the main processes that take place when
the high energy photons interact with a nucleus. It occurs especially when there
is an intensive flux of high energy γ rays [38]. If the photon energy hω is greater
than 2mec2 near a nuclear Coulomb field, the photon can transform into an electron-
positron pair.
The reaction for pair production is denoted by γ + M → M + me + me + Q, and
the threshold condition for the process is given as
Tth = 2mec2 = 1.022 MeV (2.2)
If we consider the positron as a hole in the sea of negative electrons, its energy and
12

Figure 2.9: Photon cross section for Cu in the energy range between 10 keV and
100 GeV [33].
momentum can be given as E+ = −E and ~p+ = −~p. The energy of the electron is
denoted by E0 = E, hence the energy of the positron is E+ = |E|. At the end of
the process, it can be observed that the photon is absorbed and an electron-positron
pair occur with energies E0 and E+, respectively. Also, θ+ is the angle between the
direction of motion of positron and the direction of incident photon, and φ+ is the
azimuthal angle between them.
The differential cross section for the process [19] is given as
dφ = − Z2
137
e4
2π
p0p+k3
dE0sinθ0dθ0sinθ+dθ+dφ+
q4
p2+sin2θ+(4E20 − q2)
(E+ − p+cosθ+)2
+p20sin
2θ0(4E2+ − q2)
(E0 − p0cosθ0)2+
2p02p+sinθ0sinθ+cosφ+(4E0E+ + q2)
(E0 − p0cosθ0)(E+ − p+cosθ+)
−2k2(p2+sin
2θ+ + p20sin2θ0 + 2p0p+ + sinθ0sinθ+cosφ+)
(E0 − p0cosθ0)(E+ − p+cosθ+)
(2.3)
Thus, the integration over the angles yields to the cross section for the electron-
13

positron pair production with energies E0 and E+ as follows,
φ(E0)dE0 =Z2
137
(e2
mec2
)2p0p+k3
dE0
− 4
3− 2E0E+
p20 + p2+p20p
2+
+ µ2
(ε0E+
p30+ε+E0
p3+− ε+ε0p0p+
)+
[k2
p30p3+
(E20E
2+ + p20p
2+)− 8
3
E0E+
p0p+
]log
+µ2k
2p0p+
[E0E+ − p20
p30ε0 +
E0E+ − p2+p3+
ε+ +2kE0E+
p20p2+
]log
(2.4)
where
ε+ = 2logE+ + p+
µ
log = logE0k − p20 + p0p+E0k − p20 − p0p+
= 2logE0E+ + p0p+ + µ2
µk
(2.5)
It can be observed that this cross section formula is symmetrical in E0 and E+ [19].
The energy conservation results in hω = E0 + E+.
The total cross section can be obtained by integrating over all possible values of
electron energy E0. The integration offers analytical solutions for two cases; the
intermediate photon energy limit and the ultrarelativistic limit [38].
If there is no screening and the photon energy is in the intermediate range, 1 hω/mec
2 1/αZ1/3, the cross section for photons can be written as
σpair = αr2eZ2
[28
9ln
(2hω
mec2
)− 218
27
]m2atom−1 (2.6)
where re is the classical electron radius and α = 1/137 is the fine structure constant.
The probability of pair production increases with increasing photon energy. Born
approximation is used to approximate the cross section without the screening effect.
In the case of complete screening and in the ultra relativistic limit of the photon
energies hω/mec2 1/αZ1/3, the cross section becomes
σpair = αr2eZ2
[28
9ln
(183
Z1/3
)− 2
27
]m2atom−1 (2.7)
For the purpose of this thesis, it must be noted that the cross section is nearly constant
with increasing energy in this region.
Table 2.1 shows the cross section values for C and Al from 10 MeV to 100 GeV .
It can be seen from both Figure 2.9 and Table 2.1 that cross section values become
almost constant after 10 GeV .
14

Table 2.1: The cross section values for two nucleus, Z = 6 Carbon and Z = 13 Alu-minum.
Photon Energyhν
σpair
[barn2atom−1]CarbonZ = 6
AluminumZ = 13
10 MeV 0.07686 0.3584100 MeV 0.2079 0.95031 GeV 0.2805 1.23710 GeV 0.2975 1.300100 GeV 0.3002 1.309
Table 2.2: The angle between the incident photon and emerging electron (or positron).
Photon Energy (hν) θ [degrees]
10 MeV 2.9278100 MeV 0.29271 GeV 0.029210 GeV 0.0029100 GeV 0.0002
The average angle between the incident photon and the emitted electron (or positron)
can be given as
θ =mec
2
hν[rad] (2.8)
Table 2.2 shows the angle between the incident γ and produced electron (or positron)
between energies of 10 MeV and 100 GeV . It should be noted that θ is so small after
10 GeV that the resultant e+e− pair continues their path together which is important
for this thesis.
The mean free path for a gamma ray to travel in a material before the pair produc-
tion occurs is defined as λpair and related with the total cross section by the relation1
λpair= Nσpair, where N denotes the atom density in the material. In the case of total
screening, the pair production can occur in the field of an atomic electron and the total
cross section can simply be evaluated by substituting Z(Z+1) instead of the Z2 term
in Equation 2.7. Hence, the mean free path for a gamma ray in the ultrarelativistic
15

limit can be written as follows,
1
λpair= Nσpair =
7
94Z(Z + 1)Nr2eαln
(183
Z1/3
)(2.9)
where the small constant term in Equation 2.7 can be ignored. The mean free path
can also be related with the target radiation length, χ0, as
λpair =9
7χ0 (2.10)
where χ0 is the radiation length of the material, usually measured in g cm−2. χ0 is
the mean distance for an electron loses all but 1/e of its energy, and 7/9 of the mean
free path for pair production by a photon. The ECAL in the AMS-02 has 17 χ0 in
total.
16
CHAPTER 3
AMS-02 DETECTOR
First, the AMS-02 subdetectors will be outlined in this chapter. Photon analyses can
be done in two ways with the AMS-02. These methods will be explained. Finally, the
latest AMS-02 results will be briefly discussed.
3.1 Overview
The AMS-02 is the first large magnetic spectrometer in the space. To measure the
cosmic particles with an unprecedented accuracy, it has seven subsystems which is
shown in Figure 3.1:
• Magnet bends particles and antiparticles in opposite directions.
• Transition Radiation Detector (TRD) identifies electrons and positrons among
other particles.
• Time of Flight System (ToF) provides fast trigger and measures particle veloc-
ity.
• Silicon Tracker determines charge sign of the particles.
• Ring Imaging Cerenkov Detector (RICH) measures the velocity of the particle.
• Anticoincidence Counters (ACC) veto particles passing through the magnet.
• Electromagnetic Calorimeter (ECAL) measures the energy of electrons, positrons,
and photons, i.e., electromagnetically interacting particles.
17

Figure 3.1: An exploded view of AMS-02 [31].
In AMS-02 z = −1 defines a downward going particle. The magnetic field points
along the x-direction in the AMS coordinate system. Therefore, yz plane is the bend-
ing plane.
3.2 Subdetectors
3.2.1 Magnet
Particles and their antiparticle counterparts have almost the same properties; for in-
stance, they have the mass, but they have opposite charges. Particles and antiparticles
can be separated simply by using a magnetic field. In a uniform magnetic field, parti-
cles and antiparticles are bent in opposite directions.
The AMS-02 magnet consists of Neodymium-Iron-Boron sectors. The magnet has a
18

peak magnetic flux of 0.15 Tm2, and an acceptance of 0.82 m2sr. The configuration
has a negligible dipole moment outside the magnet. It is required not to have an
undesirable force on the ISS [49].
3.2.2 Transition Radiation Detector (TRD)
When charged particles cross the boundary between two media which have differ-
ent dielectric constants, they emit transition radiation. Although the probability of
a particle to emit transition radiation at a single interface is about 10−2, this can be
increased by adding several layers. The TRD of AMS-02 is formed of 20 layers, the
edges of which can be seen in Figure 3.2. Each layer consists of 20 mm of thick
fleece used as radiator and straw tubes which have 6 mm diameter and filled with
Xe-CO2 gas mixture used as detector [31].
Figure 3.2: The Transition Radiation Detector (TRD) seen from the side, readout
elements, and support structure [49].
Both the primary particle and the emitted X-ray photon ionize the gas mixture in the
straw tubes. The ionized gas starts an ionization avalanche in the vicinity of a thin
wire at high voltage. This abrupt current change induces a fast electric signal. The X-
ray contribution to the ionization signal adds up with the ionization signal of a charged
particle traversing the gas. The intensity of the transition radiation is proportional to
the Lorentz factor
γ =E
m0c2(3.1)
19

Figure 3.3: The working principle of AMS-02 TRD. Incoming particle is in blue, the
TR photon is in red, and the straw tubes which are filled with Xe-CO2 gas mixture
are in green [49].
where E is the energy, m0 is the rest mass of the particle, and c is the speed of
light. Hence, electrons are more likely to have this transition radiation contribution to
ionization than more massive particles like protons at the same energy.
Figure 3.3 shows the working principle of the TRD. Incoming particle (blue) emits
TR (red), and both the particle and the TR ionizes the gas mixture in the straw tube
(green).
Figure 3.4: TRD-LLe distribution for electrons with energies between 15 and
35 GeV , and 50 and 100 GeV (left), and for protons with energies between 20 and
22 GeV , and 330 GeV (right) [46].
20

In order to separate electrons and protons, a log-likelihood method is developed using
signals from all the TRD layers. Figure 3.4 shows the difference of log-likelihood
probability of the electron hypothesis (TRD-LLe) between an electron and proton
sample [46]. It can be seen in the figure that electrons have almost no shift with
different energies. However, protons have a shift towards electron like values with
increasing energy because the Lorentz factor γ becomes appreciable.
3.2.3 Silicon Tracker
The silicon tracker is composed of double-sided silicon microstrip sensors, each has
an active volume of 41.360 × 72.045 × 0.300 mm3 [24]. The silicon sensors are
grouped together for readout and biasing in ladders. Nine planes are then formed by
these ladders. One of the nine planes is shown in Figure 3.5. The spatial resolution is
10 µm in the bending plane (yz), and 30 µm in the non-bending plane (xz).
Figure 3.5: One of the nine tracker planes which consists ladders that are made of
double sided silicon microstrip sensors [49].
When a charged particle passes through a ladder, the electron-hole pairs are produced.
The analogue signal is generated by the acceleration of electrons under a bias voltage.
The signal is then integrated and digitized. The exact position of the hit is determined
by fitting the signal cluster. The tracker hits are combined to reconstruct the track
21

of the particle. The best-fit curve and the rigidity of the particle are determined by
minimizing the residuals δx and δy.
AMS-02 as a space instrument have to deal with two main problems: the vibrations
during the transport before deployment and periodic temperature fluctuations due to
solar radiation and cooling because of the shadow of the Earth. In order to have
reliable data from the Tracker under these effects, AMS-02 has a laser alignment
system. This system generates optical signals which imitate straight particle tracks,
and traces the movement in the tracker geometry with an accuracy of 5µm [49].
3.2.4 Anticoincidence Counters (ACC)
The Anticoincidence Counters are a layer of scintillators which surround the Silicon
Tracker. The ACC is formed by 16 scintillation panels of 8 mm thickness. The
particles entering the tracker laterally, i.e., outside of the main acceptance, can be
detected by the ACC, then undesired particles can be vetoed in the trigger system
[49].
Figure 3.6 shows how the ACC works. Events which pass through the magnet are
rejected. Secondary particles coming from the interaction of the incident particle in
the AMS-02 can be identified, and are not rejected by the ACC.
Figure 3.6: Working principle of the ACC. Incident particles which hit the magnet
are rejected [48].
22

3.2.5 Time of Flight (TOF)
The Time of Flight is a scintillator system which has four planes grouped as two pairs
shown in Figure 3.7, positioned below and above the magnet. The active area of each
plane is 1.2m2 [49]. The paddles are overlapped by 0.5 cm in each plane to avoid
geometrical inefficiencies. The paddles in a pair of planes are perpendicular to each
other for efficient background rejection. The ToF provides fast trigger for charged
particles and converted photons, measures particle velocity, and discriminates upward
and downward going particles. The time resolution of the ToF system is 120 ps. The
ToF can also measure the absolute charge of the particle. The geometrical acceptance
of the system is 0.4 m2sr [49].
Figure 3.7: The upper (left) and the lower (right) ToF planes during assembly [49].
Figure 3.8 shows the absolute charge measurement in the upper ToF by the combina-
tion of measurements from two layers of scintillating counters [41].
Figure 3.8: Particle charge magnitude evaluated by the upper ToF. Lower ToF is also
gives similar results with upper ToF [41].
23

3.2.6 Ring Imaging Cerenkov Detector (RICH)
For an analysis such as the search of antimatter or relative abundances of isotopes, the
mass measurement is essential. The mass is related to the momentum and the velocity
of the particle by the formula
m =p
βc
√1− β2 (3.2)
where m is the mass, p is the momentum of the particle, c is the speed of light in
a vacuum, and β is the ratio of the velocity of the particle to the speed of light.
Thus, these two quantities (p and β) must be measured. The momentum information
is obtained from the Silicon Tracker with a relative accuracy of 1% over a wide
range of energies. This error appears also on the mass of the particle, so the velocity
has to be measured with a relative accuracy of about 1 per mil [49]. Ring Imaging
Cerenkov Detector serves this purpose. Figure 3.9 shows the parts of the RICH: the
silica aerogel radiator, the mirror, and the photomultipliers.
Figure 3.9: Exploded view of the RICH. The radiators plane (top), the conical reflect-
ing mirror (middle), and the detection plane (bottom) [40].
The velocity can be measured using the Cerenkov effect. The Cerenkov radiation
consists of photons emitted along a characteristic cone whose angular aperture is
24

directly related to the particle velocity and with the index of refraction of the material.
The Cerenkov angle is related with β given by the formula
θC =1
nβ(3.3)
where θC is the Cerenkov angle, n is the index of refraction of the material, and β is
v/c. Then β measurement is directly related with the reconstruction of θC [22].
3.2.7 Electromagnetic Calorimeter (ECAL)
The Electromagnetic Calorimeter is a sampling calorimeter made of lead-scintillating
fibers which can be seen in Figure 3.10. The active volume of the ECAL is 638 kg
and 68.5 × 68.5 × 16.7 cm3. When a particle traverses the active volume, produced
light is collected by 324 photomultipliers (PMTs). The ECAL measures the energy
deposition, and attains 3-dimensional image of the longitudinal and lateral shower de-
velopment. The ECAL has 18 superlayers, each of which has an 18.5 mm thickness.
Each layer is composed of 11 grooved, 1 mm thick lead foils, and 1 mm diameter
scintillating fibers glued together. The ECAL has 17 χ0 in total [43].
Figure 3.10: The Electromagnetic Calorimeter (ECAL). The fibers and the support
structure can be seen [49].
An efficient way of separating positrons from protons is needed for both lepton and
conversion mode photon analysis. The ECAL is a specialized detector which is able
to distinguish positrons from protons and electrons from antiprotons with an identifi-
cation power of one positron over 105 protons. When a high-energy electron, positron
25

or photon passes through a material with a high Z, many other electrons, positrons and
photons of lower energy are produced, i.e., electromagnetic shower. When a high en-
ergy proton passes through the material, it mostly behaves as a minimum ionizing
particle (MIP). However, it produces several pions, kaons etc. if it interacts with the
material, i.e., hadronic shower. Protons and positrons can be identified by investi-
gating the ECAL shower profiles. The direction of the incident particle can also be
determined from the shower shape.
3.3 AMS-02 as a Photon Detector
Depending on the interaction point of the photon in the detector, the photon analysis
can be done in two ways: Calorimetric mode, and conversion mode, which will be
discussed here.
3.3.1 Calorimetric Mode
The material density in the subdetectors of AMS-02 above the ECAL was designed
to be at a minimum. This is required to minimize the effects of multiple scattering,
and to ensure the confidence of the measured variables such as rigidity. This fact
allows a photon to pass through the detector without interacting the material down to
the ECAL. Such a photon is called a calorimetric photon. In Figure 3.11 a typical
calorimetric Monte Carlo (MC) event is shown.
While more energetic events can be analyzed with this mode compared with the con-
version mode, angular resolution of the events are limited by the angular resolution
of the ECAL.
3.3.2 Conversion Mode
Although the material density of the subdetectors is low except the ECAL, there is
still a probability for a photon to make an e+e− pair production. If the primary photon
converts at or above the upper ToF plane, a pair of tracks can be found and a vertex
26

Figure 3.11: An AMS-02 event display shows a downward going MC photon show-
ering in the ECAL. Few hits in the RICH and the Tracker are due to the backscattered
particles. Red dashed line indicates the reconstructed photon direction, i.e., there is
no track [30].
can be reconstructed. However, when photons above 50 GeV convert, the Silicon
Tracker cannot spatially resolve two tracks of e+ and e−. The two tracks seem as
one particle track; therefore, a vertex cannot be found. However, up to 50 GeV the
angular resolution of the Tracker can be used which is far better than the angular
resolution of the ECAL.
3.4 AMS-02 Results
The first AMS-02 paper, ‘First Result from the Alpha Magnetic Spectrometer on
the International Space Station: Precision Measurement of the Positron Fraction in
Primary Cosmic Rays of 0.5−350GeV ’ was published on Physical Review Letters on
27

Figure 3.12: An AMS-02 event display shows an MC photon convert in the upper ToF,
and the e+e− pair bend in opposite directions in the inner Tracker due to magnetic
field. While the e+ escapes the AMS-02 volume, the e− gives a shower in the ECAL
[30].
the 5th of April, 2013. The paper includes 18 months of collected data from 19 May
2011 to 10 December 2012, which is only approximately 8% of the expected AMS-
02 data. The paper presents the ratio of the positron flux to the combined electron-
positron flux between 0.5 to 350 GeV energy range. Approximately 25 billion events
are analyzed.
The measured positron fraction as a function of reconstructed energy is shown in
Figure 3.13. In the figure, up to 10 GeV , there is a decline with increasing energy
because of the secondary production of particles. After 10GeV , the steady increment
points that there is another mechanism besides the secondary production of positrons.
The behavior after 250 GeV can be understood with more statistics. There is no ob-
served fine structure in the energy spectrum. An anisotropy study is conducted using
28

Figure 3.13: The AMS-02 positron fraction compared with PAMELA and Fermi-LAT
[10].
the sample from 16 to 350 GeV , and the positron to electron ratio shows consistency
with isotropy. These results points to a new physical phenomena which can have a
particle physics or an astrophysical physics origin [10].
There are seven proceedings which were presented at 33rd International Cosmic Ray
Conference, Rio De Janeiro 2013, The Astro-particle Physics Conference (ICRC
2013) which was held between 2 and 9 July 2013.
Precision measurement of the positron fraction in primary cosmic rays of 0.5-350
GeV
There is no fine structure in the positron fraction shown in Figure 3.14. From 20 to
250 GeV the slope decreases by an order of magnitude [36].
Determination of the positron anisotropy with AMS
The anisotropy study is conducted with 35, 000 positron events in the energy range
of 16 − 250 GeV . The positron to electron ratio at any angular scale seems to be
isotropic. The upper limit on the dipole anisotropy parameter is set to 0.030 with a
95% confidence level [25].
29

Figure 3.14: The positron fraction measured by AMS-02 and fit with the minimal
model [36].
Figure 3.15: Galactic maps of the electron (left) and positron (right) events in the
energy range of 16 − 350 GeV . The colors represent the number of events per bin
[25].
Precision measurements of the electron spectrum and the positron spectrum with
AMS
Measured fluxes multiplied by the third power of the energy are shown in Figure 3.16.
This analysis consists of 10% of the total expected data. The largest energy bin of the
electron flux measurement is 500 GeV . The multiplied electron flux is increasing up
to 10 GeV , and it starts to decrease after 10 GeV . While, the result is in agreement
with the previous experiments such as HEAT and PAMELA in their mid-range, the
effect of solar modulation is significant at low energies. The AMS-02 measurement
30

extends up to 350 GeV with the positron flux is increasing up to 10 GeV , going flat
between 10 − 30 GeV , and then increasing again. It is noteworthy that the spectral
index and its energy dependence is different between the electron and the positron
spectrum [47].
Figure 3.16: Measured electron (left) and positron (right) fluxes by AMS-02 com-
pared with HEAT and PAMELA [47].
Precision measurement of the e+ + e− spectrum with AMS
Measured events are in the energy range between 0.5 and 700GeV , which is shown in
Figure 3.17. 10% of the total expected data are used. There is no fine structure in the
spectrum unlike ATIC and PPB-BETS results. Nevertheless, there is a change in the
spectral distribution which can be better observed in separate electron and positron
flux measurements. This change can be compatible with the AMS-02 positron frac-
tion result. Systematical error studies still continue [18].
Precision measurement of the proton flux with AMS
The measured proton flux multiplied by E2.7 is shown in Figure 3.18. There is no fine
structure in the spectrum. The high energy region is consistent with the single power
law spectra. The flux below 30 GV is affected by the solar modulation [32].
Precision Measurement of the Cosmic Ray Helium Flux with AMS Experiment
The measured helium spectrum in the rigidity range from 2 GV to 3 TV is shown in
31

Figure 3.17: Combined electron – positron spectrum compared with previous experi-
ments [18].
Figure 3.18: The average proton flux of AMS-02 compared with previous experi-
ments [32].
Figure 3.19. The spectrum is modulated by the time dependent solar activity below
10 GV . The spectrum can be parametrized by a single power law spectrum. There is
no fine structure [26].
Precision Measurement of the Cosmic Ray Boron-to-Carbon Ratio with AMS
AMS-02 can distinguish nuclei from Z = 1 to Z = 26 up to TeV/n. Boron to
32

Figure 3.19: The measured helium spectrum multiplied by the rigidity value in the
2.7 power by AMS-02 compared with the previous experiments [26].
carbon ratio measurement is important because it is sensitive to propagation modeling
of cosmic rays. The derived boron to carbon ratio in the energy range from 0.5 to
700 GeV/n is shown in Figure 3.20. Statistics is the main limitation at high energies
for the ratio measurement and the statistical error calculation [41].
Figure 3.20: Boron to carbon ratio measured by AMS-02 compared with previous
experiments [41].
33

34

CHAPTER 4
ANALYSIS
In this chapter high energy conversion mode photon analysis will be presented. High
energy conversion mode photon events have one reconstructed Tracker track be-
cause the Silicon Tracker cannot spatially resolve two tracks of the resulting electron-
positron pair. Motivation of this analysis is to use the ECAL for energy information,
and the Tracker for angle information which is far better than that of the ECAL. A set
of cuts to eliminate background events will be explained in detail. Then, the physics
results will be discussed.
4.1 Event Selection
In order to determine the cuts which will be used in data, Monte Carlo (MC) samples
are used. Energy range of the MC samples are: from 100 GeV to 2000 GeV for
photons and electrons; and from 200 GeV to 4000 GeV for protons. ISS data used
in this analysis covers the AMS-02 data from 19th of May, 2011 to 28th of February,
2014.
Resolution
For the energy bins in all plots, energy resolution of the ECAL is used which can be
seen in Figure 4.1. Figure 4.2 shows the angular resolution of the ECAL. Resolution
plots are obtained using photon MC sample between 5GeV and 100GeV . The angu-
lar resolution is plotted by comparing the direction of the reconstructed ECAL shower
with the truth value. The distribution of the difference between the reconstructed and
35

truth angle value is fitted with a Gaussian. Energy resolution is obtained similarly by
fitting the distribution of (Erec − Egen)/Egen.
Figure 4.1: Energy resolution of the ECAL with respect to energy. It is derived using
photon MC.
Figure 4.2: Angular resolution of the ECAL with respect to energy. It is derived using
photon MC.
However the motivation of this analysis is to use angular resolution from the Tracker
36

which is better than that of the ECAL. Angular resolution of the Tracker is only
limited by the opening angle of e+e− pair and the multiple scattering.
Preselection
There are some data quality cuts which are necessary for the detector to work under
optimum conditions. Two cuts are used to satisfy this. One of them is science run tag,
and the other is live time. With the science run tag cut, events which are in the bad
run list are not included in the selection. In South Atlantic Anomaly (SAA) region
there is very high rate of particles because trapped low energy particles are closer to
the surface of the Earth due to the shift of the axis of the magnetic dipole field from
the center of the Earth [29]. To exclude data taken from SAA region, live time is
required to be greater than 0.65.
Events which have single particle showers in the ECAL are required. The ECAL
shower is required to start and exit (if the event is energetic enough to exit from the
ECAL) in the ECAL fiducial volume. Fiducial volume cut rejects the events which
have the particle shower within 2 cm of the edge of the ECAL planes.
Tracker Track
Since converted photon events which have energies larger than 50GeV seems to have
one Tracker track, a single track cut is applied. As seen in Figure 4.3, 10% of the
MC photon events have single track. Most of the photon events in the sample do not
have a Tracker track.
Figure 4.3: Efficiency versus reconstructed energy for single track cut.
37

It should be noted here that all the following efficiency plots are obtained after the cuts
presented until here which are science run tag, live time, single shower, the ECAL
fiducial volume, and the single track.
This single track is also required to have a chi-square value less than 10. Figure 4.4
shows the distribution of chi-square which is obtained using photon MC.
Figure 4.4: Chi-square distribution of photon MC. A loose cut is applied, tracks which
have a chi-square value less than 10 are selected.
Tracker Charge
Protons have a dominant abundance in cosmic rays; therefore, they are the main back-
ground for several analyses. Moreover, for the high energy conversion mode analysis,
electrons are also background events because many features of electrons and con-
verted photons are similar, such as their Tracker tracks and ECAL shower shapes.
Therefore, an efficient cut is required to reject also background electron events.
Although electron-positron pair seems to have one Tracker track in high energies, they
give double contribution of charge deposition to the Silicon Tracker planes. There-
fore, this variable can be used to select converted photons as they give a larger value
of charge than 1. Figure 4.5 shows the charge values for photon, electron, proton, and
helium MC samples. It can be seen that converted photons have a peak at 1.4 while
electrons and protons have peaks at 1. Since energy deposition is proportional to the
38

square root of Z, contributions from e− and e+ add up to give a peak at 1.4 instead of
2.
Figure 4.5: MC tracker charge values for photon, electron, proton, and helium; in
red, blue, green, and purple, respectively. Electron and proton samples have a peak
around 1, while converted photons have a peak around 1.4. Helium has a peak at 2
which is not the main background. A selection is applied between 1.2 and 1.8.
Figure 4.6 shows the charge value determined from all individual Tracker layers.
Layer 9 gives more electron like charge value, hence it is excluded for the charge
calculation.
The efficiency plots for charge larger than 1.2 and charge below 1.8 are shown in
Figure 4.7 and Figure 4.8, respectively. As it can be seen in these plots, these cuts are
two of the most effective cuts in the analysis.
Figure 4.9 shows the charge value for ISS data. The proton domination in cosmic
rays can be seen in this figure.
TRD Geometrical Acceptance
To use a TRD hits cut which is important for this analysis, and will be explained next,
events are required to be in the TRD geometrical acceptance. Figure 4.10 shows the
efficiency of the cut using photon MC samples. The cut has almost 100% in all the
energy range for MC events.
39

Figure 4.6: Photon MC charge information in different Tracker layers. While the
layer number is increasing, the charge information becomes more electron like. In
layer 9, most of the events have charge value of 1 which is incompatible with con-
verted photons. For this reason, Layer 9 is excluded when calculating the charge
value.
Figure 4.7: Efficiency versus reconstructed energy for charge larger than 1.2 cut.
TRD Hits
In the TRD, an electron have both energy deposition and TR contribution. Since
converted photons consist of electron-positron pairs, in these type of events, both the
energy deposition and TR contribution are doubled. However, one must be sure that
these two particles come from an initial photon. To do this, events which have no TRD
40

Figure 4.8: Efficiency versus reconstructed energy for charge below 1.8 cut.
Figure 4.9: Tracker charge value of ISS data. Proton domination in cosmic rays can
be seen in the peak around 1. Between 1.2 and 1.8 is selected for converted photon
signal.
hits in first 5 layers are selected. Determining the number 5 depends on two things.
First, the number of layers which must have no hits should be minimized, because
as the number increases, the number of layers from which the energy deposition and
the TR contribution can be measured decreases accordingly. Second one comes from
the structure of the TRD. In the TRD, first 4 layers are orthogonal to next 12 layers.
Then, adding an orthogonal layer increases the probability of a photon not to miss the
straw tubes. Figure 4.11 shows the efficiency of this cut which is around 60% up to
2 TeV .
41

Figure 4.10: Efficiency versus reconstructed energy for TRD geometrical acceptance
cut.
Figure 4.11: Efficiency versus reconstructed energy for no hits in TRD first 5 layers
cut.
Cos(z) of the ECAL Shower
By the ECAL shower shape, it can be determined whether an event is downward or
upward going. Figure 4.12 shows the cos(z) of the ECAL shower from photon MC.
Almost all events are around −1 which are the selected downward going particles.
Events which have cos(z) > 0 of the ECAL shower which can be seen in Figure 4.13
are the upward going particles, and are rejected.
ECAL Shower - Tracker Track Spatial Matching
Although there is a cut such as cos(z) of ECAL shower, there are still misrecon-
structed upward going particles. These type of events characteristically do not have
spatially matched Tracker track and the ECAL shower. In order to reject these type
42

Figure 4.12: cos(z) of ECAL shower value derived by using photon MC. Downward
going events have cos(z) value of −1.
Figure 4.13: cos(z) of ECAL shower for ISS data. Events at 1 are undesired upward
going particles. Then, events at −1 are selected.
of events, a 5 cm spatial matching condition is applied. Efficiency of this cut changes
between 50% and 70% with energy as shown in Figure 4.14.
Energy over Momentum
This cut serves similar purpose with the matching cut. In some cases upward going
particles are reconstructed as downward going, and after shower, which is started at
43

Figure 4.14: Efficiency versus reconstructed energy for (ECAL Shower - Tracker
Track) < 5 cm cut.
the bottom of the ECAL, secondary particles which have low momentum give tracks
in the Tracker. Therefore, the rigidity value measured by the Tracker and the energy
value measured by the ECAL do not match. To reject this kind of events, a cut to E/p
is required. Energy is obtained from the ECAL, and it is divided by the momentum
which is obtained from the Tracker. Events which have energy over momentum value
larger than 30 are rejected which can be seen in Figure 4.15.
Figure 4.15: E/p value for photon MC. Events which have E/p < 30 are selected.
Figure 4.16 shows the efficiency for E/p < 30 cut with respect to energy. Efficiency
of this cut is nearly flat around 85%.
44

Figure 4.16: Efficiency versus reconstructed energy for E/p < 30 cut.
ECAL BDT
The ECAL Boosted Decision Tree (BDT) is a variable uses shower features of events
to eliminate the most abundant cosmic ray components, protons. Most of the protons
behave as MIPs, and do not produce a shower in the ECAL. Then, the fraction of
energy deposition in each layer allows for an effective separation between protons and
electrons. Thus, if protons interact with the ECAL, they give hadronic showers which
are different than electromagnetic showers. Then, with the help of these different
shower profiles, the BDT is trained. With the match between energy and momentum,
the rejection power of the BDT rises to about 104.
Figure 4.17 shows the BDT variable for photon, electron, and proton MC samples.
Protons have a peak at −1, while electrons and converted photons have peaks at 1.
Events which have the BDT value larger than 0.5 are selected which is the same as
lepton analyses.
It can be seen in Figure 4.18 that the BDT cut has an efficiency between 60% and
90% up to 2 TeV .
Figure 4.19 shows the BDT value for ISS data. Most of the events are at −1 value
which is because of the proton abundance in cosmic rays.
Figure 4.20 shows an MC photon event which passes all the cuts in the event selection.
There are no hits in the first layers of the TRD, but there are TRD clusters in the
following layers, i.e., the photon converts in the TRD. The resultant e+ and e− are so
45

Figure 4.17: MC ECAL BDT values for photon, electron, and proton; in red, blue, and
green, respectively. Protons has a peak at −1 while converted photons and electron
have peaks at 1. A selection is applied for events larger than 0.5. This is the most
powerful cut to eliminate proton background.
Figure 4.18: Efficiency versus reconstructed energy for the ECAL BDT > 0.5 cut.
close to each other that the Tracker reconstructs only one track. Then the event gives
an ECAL shower.
4.2 Results and Discussion
MC study shows that all the cuts except the single track cut have at least 50% ef-
ficiencies. Thus, efficiencies does not vary much with increasing energy. And the
46

Figure 4.19: The ECAL BDT value of ISS data. Events at −1 are protons. Events
which have a BDT value below 0.5 are rejected.
Figure 4.20: A front and side view of AMS-02 event display which shows a high
energy conversion mode MC photon event which passes all the cuts in the event se-
lection.
small variations in efficiencies have increasing trend which is favorable because the
analysis is optimized for high energies. Three most important cuts are the TRD hits
for e rejection, the Tracker charge for e and p rejection, and the ECAL BDT for p
rejection.
47

After all the cuts have been applied there are no events left in AMS-02 data, with
the energy larger than 100 GeV which is the main energy regime for the analysis.
Although the low statistics is expected, the objective was to measure few clean con-
verted photon events which have energies larger than 100 GeV . Figure 4.21 shows
the expected spectrum derived from Fermi power law fit which can be seen in Figure
2.8 multiplied by AMS-02 exposure (9.5 × 10⁷ s), AMS-02 acceptance (0.4 m2sr),
and analysis efficiencies.
Figure 4.21: Expected number of events derived using Fermi power law fit in Figure
2.8.
48

CHAPTER 5
CONCLUSION
In this thesis historical development and observational evidences of dark matter were
reviewed. Theoretical predictions for the particle nature of dark matter, and the most
favored models were introduced. Direct detection, accelerator searches, and indi-
rect detection efforts to obtain a dark matter particle signature were explained. The
most sophisticated astroparticle physics detector in space up to now, AMS-02, which
collected more than 50 billion events was explained.
Motivation of the analysis was to select high energy photons without the limitation
of the angular resolution of the ECAL which is inevitable in the calorimetric mode
analysis. This analysis aimed to select high energy conversion mode photons where
the angle information is obtained from the Silicon Tracker and the energy informa-
tion, from the ECAL. In order to determine the cuts which were applied later to the
ISS data, high energy MC samples for photons, electrons, and protons were used.
Although the expected number of events were low, the goal was to measure a few
converted photon events larger than 100 GeV . None were observed.
While this investigation yielded no candidates with current statistics, this analysis can
be developed further by successor group members, and with increasing statistics, it
can produce candidate events in the future.
49

50

REFERENCES
[1] G. Aad et al. Search for supersymmetry using final states with one lepton, jets,and missing transverse momentum with the ATLAS detector in
√s = 7 TeV pp.
Phys.Rev.Lett., 106:131802, 2011, arXiv:hep-ex/1102.2357.
[2] G. Aad et al. Search for direct production of charginos, neutralinos and slep-tons in final states with two leptons and missing transverse momentum in ppcollisions at
√s = 8 TeV with the ATLAS detector. JHEP, 1405:071, 2014,
arXiv:hep-ex/1403.5294.
[3] M. Aartsen et al. IceCube Search for Dark Matter Annihilation in nearbyGalaxies and Galaxy Clusters. Phys.Rev., D88(12):122001, 2013, arXiv:astro-ph.HE/1307.3473.
[4] Ackermann et al. Fermi LAT search for dark matter in gamma-ray lines and theinclusive photon spectrum. Phys.Rev.D, 86(2):022002, July 2012, arXiv:astro-ph.HE/1205.2739.
[5] M. Ackermann et al. Measurement of separate cosmic-ray electron and positronspectra with the Fermi Large Area Telescope. Phys.Rev.Lett., 108:011103,2012, arXiv:astro-ph.HE/1109.0521.
[6] P. Ade et al. Planck 2013 results. I. Overview of products and scientific results.2013, arXiv:astro-ph.CO/1303.5062.
[7] P. Ade et al. Planck 2013 results. XV. CMB power spectra and likelihood. 2013,arXiv:astro-ph.CO/1303.5075.
[8] O. Adriani et al. An anomalous positron abundance in cosmic rays with energies1.5-100 GeV. Nature, 458:607–609, 2009, arXiv:astro-ph/0810.4995.
[9] M. Aguilar et al. Cosmic-ray positron fraction measurement from 1 to 30 GeVwith AMS-01. Physics Letters B, 646(4):145 – 154, 2007.
[10] M. Aguilar et al. First Result from the Alpha Magnetic Spectrometer on theInternational Space Station: Precision Measurement of the Positron Fraction inPrimary Cosmic Rays of 0.5–350 GeV. Phys.Rev.Lett., 110:141102, 2013.
[11] E. Aprile et al. Dark Matter Results from 225 Live Days of XENON100 Data.Phys.Rev.Lett., 109:181301, 2012, arXiv:astro-ph.CO/1207.5988.
51

[12] S. Barwick et al. Measurements of the cosmic ray positron fraction from 1-GeVto 50-GeV. Astrophys.J., 482:L191–L194, 1997, arXiv:astro-ph/9703192.
[13] P. Battinelli and S. Demers. The C star population of DDO 190. A&A, 447:473–480, Feb. 2006.
[14] J. Beatty, A. Bhattacharyya, C. Bower, S. Coutu, M. DuVernois, et al. New mea-surement of the cosmic-ray positron fraction from 5 to 15-GeV. Phys.Rev.Lett.,93:241102, 2004, arXiv:astro-ph/0412230.
[15] K. Begeman, A. Broeils, and R. Sanders. Extended rotation curves of spi-ral galaxies: Dark haloes and modified dynamics. Mon.Not.Roy.Astron.Soc.,249:523, 1991.
[16] B. Beltran et al. Search for solar axions: The CAST experiment at CERN. PoS,HEP2005:022, 2006, arXiv:hep-ex/0507007.
[17] C. L. Bennett et al. Nine-year Wilkinson Microwave Anisotropy Probe(WMAP) Observations: Final Maps and Results. Astrophys.J.Suppl.S., 208:20,Oct. 2013, arXiv:astro-ph.CO/1212.5225.
[18] B. Bertucci on behalf of the AMS Collaboration. Precision measurement of thee+ + e− spectrum with AMS. 33rd International Cosmic Ray Conference, TheAstroparticle Physics Conference, 2013.
[19] H. Bethe and W. Heitler. On the Stopping of fast particles and on the creationof positive electrons. Proc.Roy.Soc.Lond., A146:83–112, 1934.
[20] M. Boezio, P. Carlson, T. Francke, N. Weber, M. Suffert, et al. The Cosmic-Ray Electron and Positron Spectra Measured at 1 AU during Solar MinimumActivity. Astrophys.J., 532:653–669, 2000.
[21] N. W. Boggess et al. The COBE mission - Its design and performance two yearsafter launch. Astrophys.J., 397:420–429, Oct. 1992.
[22] M. Buénerd. The RICH counter of the AMS experiment. Nucl. Instrum. Meth.,A502:158–162, 2003.
[23] I. Buesching, O. de Jager, M. Potgieter, and C. Venter. A Cosmic Ray PositronAnisotropy due to Two Middle-Aged, Nearby Pulsars. 2008, arXiv:astro-ph/0804.0220.
[24] W. J. Burger. The AMS silicon tracker. Nucl.Phys.Proc.Suppl., 113:139–146,2002.
[25] J. Casaus on behalf of the AMS Collaboration. Determination of the positronanisotropy with AMS. 33rd International Cosmic Ray Conference, The As-troparticle Physics Conference, 2013.
52

[26] V. Choutko on behalf of the AMS Collaboration. Precision measurement of thecosmic ray helium flux with AMS experiment. 33rd International Cosmic RayConference, The Astroparticle Physics Conference, 2013.
[27] J. Clem and P. Evenson. Cosmic ray positron fraction observations during theA-magnetic solar minimum. Proc. 30th ICRC Merida, 2007.
[28] D. Clowe, M. Bradac, A. H. Gonzalez, M. Markevitch, S. W. Randall, et al. Adirect empirical proof of the existence of dark matter. Astrophys.J., 648:L109–L113, 2006, arXiv:astro-ph/0608407.
[29] A. Contin and D. Grandi. South atlantic anomaly definition, June 2012.
[30] T. Daylan. Photon proton separation using Alpha Magnetic Spectrometer 02,July 2013.
[31] B. Demirköz. A transition radiation detector and gas supply system for AMS.Master’s thesis, Massachusetts Institute of Technology, 2004.
[32] S. Haino on behalf of the AMS Collaboration. Precision measurement of theproton flux with AMS. 33rd International Cosmic Ray Conference, The As-troparticle Physics Conference, 2013.
[33] H. Hirayama. Lecture note on photon interactions and cross sections. Internal2000-10, KEK, November 2000.
[34] G. Jungman, M. Kamionkowski, and K. Griest. Supersymmetric dark matter.Physics Reports, 267(5–6):195 – 373, 1996.
[35] V. Khachatryan et al. Searches for electroweak production of charginos, neu-tralinos, and sleptons decaying to leptons and W, Z, and Higgs bosons in ppcollisions at 8 TeV. 2014, arXiv:hep-ex/1405.7570.
[36] A. Kounine on behalf of the AMS Collaboration. Precision measurement of thepositron fraction in primary cosmic rays of 0.5-350 GeV. 33rd InternationalCosmic Ray Conference, The Astroparticle Physics Conference, 2013.
[37] B. T. Le. Search for extra dimensions in the diphoton channel with ATLASexperiment at LHC. PhD thesis, Université De Grenoble, 2013.
[38] M. S. Longair. High Energy Astrophysics. Cambridge University Press, 2011.
[39] D. Mueller and K.-K. Tang. Cosmic-ray positrons from 10 to 20 GeV - Aballoon-borne measurement using the geomagnetic east-west asymmetry. As-trophys.J., 312:183–194, Jan. 1987.
[40] A. Oliva. High Charge Cosmic Rays Measurement with the AMS-02 SiliconTracker. PhD thesis, Universita degli studi di Perugia, 2006.
53

[41] A. Oliva on behalf of the AMS Collaboration. Precision measurement of thecosmic ray boron-to-carbon ratio with AMS. 33rd International Cosmic RayConference, The Astroparticle Physics Conference, 2013.
[42] R. Peccei and H. R. Quinn. CP Conservation in the Presence of Instantons.Phys.Rev.Lett., 38:1440–1443, 1977.
[43] F. Pilo. Diffuse Gamma Ray emission detection with the AMS-02 electromag-netic calorimeter. PhD thesis, Universita degli studi di Siena, 2005.
[44] V. Rubin, N. Thonnard, and J. Ford, W.K. Rotational properties of 21 SC galax-ies with a large range of luminosities and radii, from NGC 4605 /R = 4kpc/ toUGC 2885 /R = 122 kpc/. Astrophys.J., 238:471, 1980.
[45] V. C. Rubin and W. K. Ford, Jr. Rotation of the Andromeda Nebula from aSpectroscopic Survey of Emission Regions. Astrophys.J., 159:379–403, 1970.
[46] T. Saab. An Introduction to Dark Matter Direct Detection Searches & Tech-niques. 2012, arXiv:physics.ins-det/1203.2566.
[47] S. Schael on behalf of the AMS Collaboration. Precision measurements of theelectron spectrum and the positron spectrum with ams. 33rd International Cos-mic Ray Conference, The Astroparticle Physics Conference, 2013.
[48] The AMS Collaboration. http://ams.cern.ch.
[49] The AMS Collaboration. AMS on ISS Construction of a particle physics detec-tor on the International Space Station. AMS Note, 2004.
[50] M. Verducci. Hidden Valley search at ATLAS. J.Phys.Conf.Ser., 335:012068,2011.
[51] F. Zwicky. On the Masses of Nebulae and of Clusters of Nebulae. Astrophys.J.,86:217–246, 1937.
54