
Conversion Conference Berlin
118
@THCapper YOUR RESULTS ARE INVALID STATISTICS FOR CRO
-
Upload
tom-capper -
Category
Marketing
-
view
725 -
download
0
Transcript of Conversion Conference Berlin
@THCapper
YOUR RESULTSARE INVALID
STATISTICS FOR CRO
A Good A/B Test Result:“10% Uplift, With 95% Significance”
● What does this mean?● Is this correct?
“10% Uplift, With 95% Significance”

Easy Questions?

Most Tools Encourage Mistakes


Risk

Marketer: “Roll it out!”
Statistician (me): *sobs*

“That’s Risky”


“Advanced”
You will learn today:
● The most common serious errors in A/B testing
● How to avoid them● How to interpret your result● Whether to roll it out

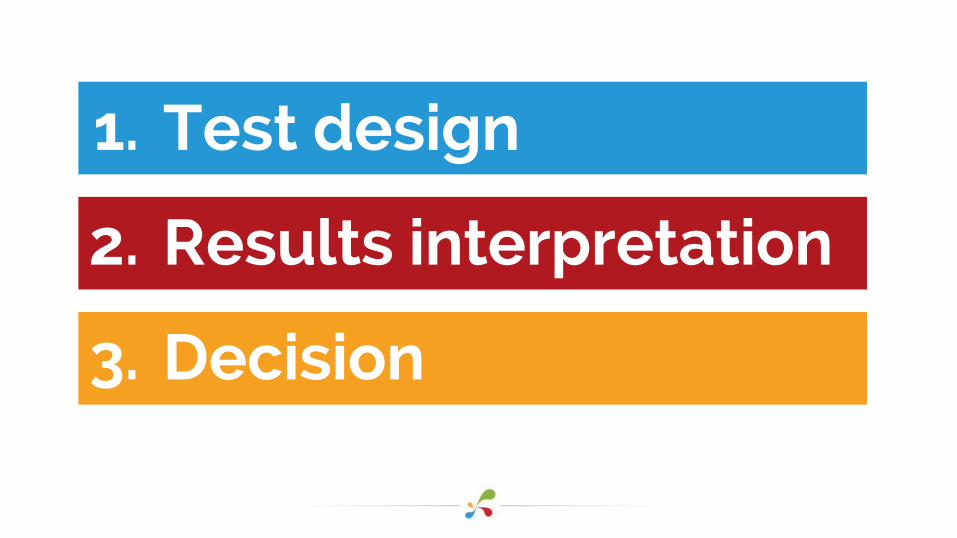
How to Run an A/B Test

1. Test design
2. Results interpretation
3. Decision

Jargon: Null Hypothesis
Jargon: Null Hypothesis
● The hypothesis that your variant and original are functionally equivalent
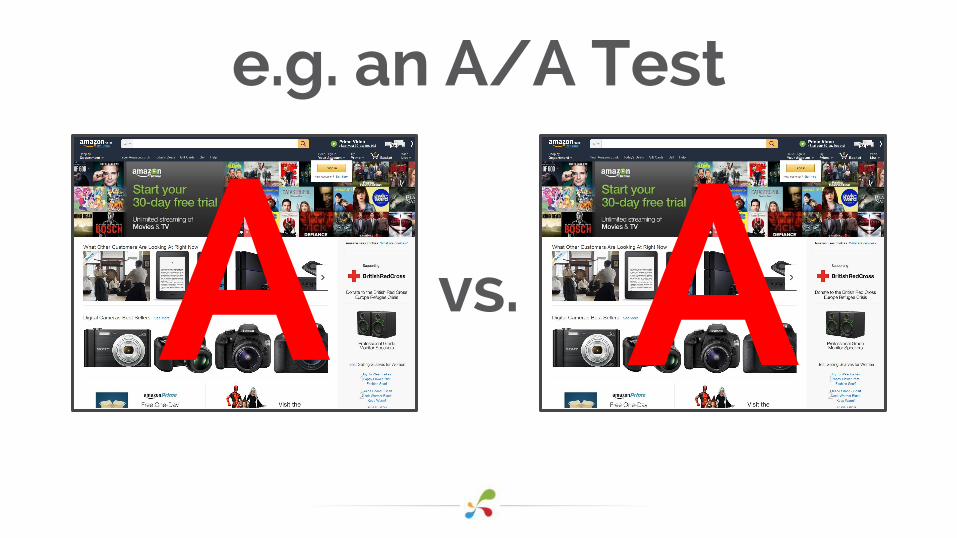
e.g. an A/A Test
vs.A A

Jargon: P-Value
Jargon: P-Value
● The chance of a result this extreme if the null hypothesis is true
● E.g. 0.05 for 95% significance

Jargon: Critical Value
Jargon: Critical Value
● What you compare your p-value with when deciding whether to reject the null hypothesis

1. Test Design

How Many Tests?
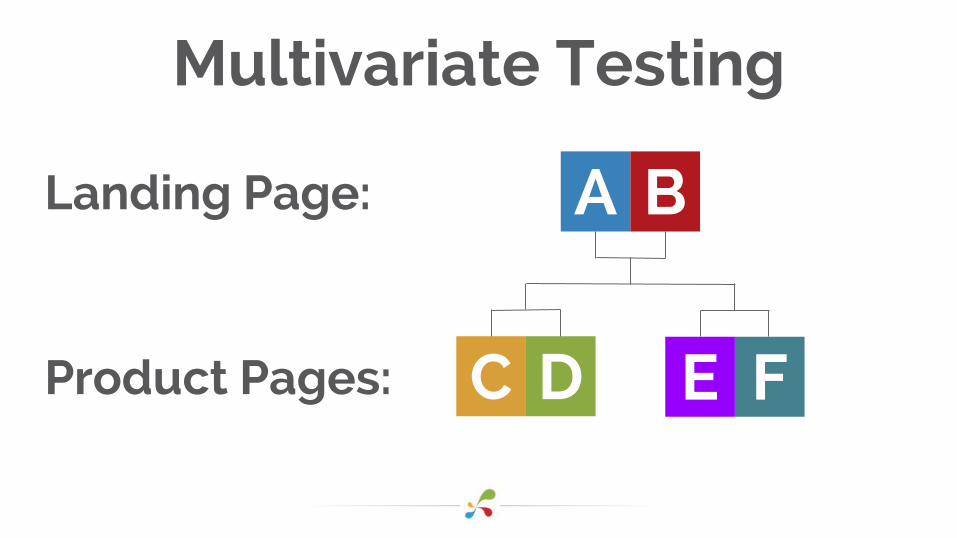
A B
C D E F
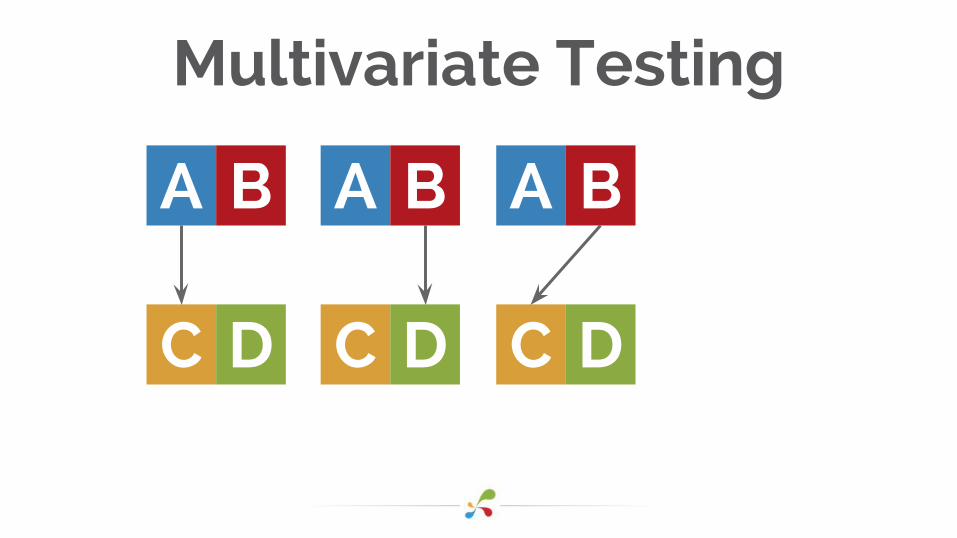
Multivariate Testing
Landing Page:
Product Pages:
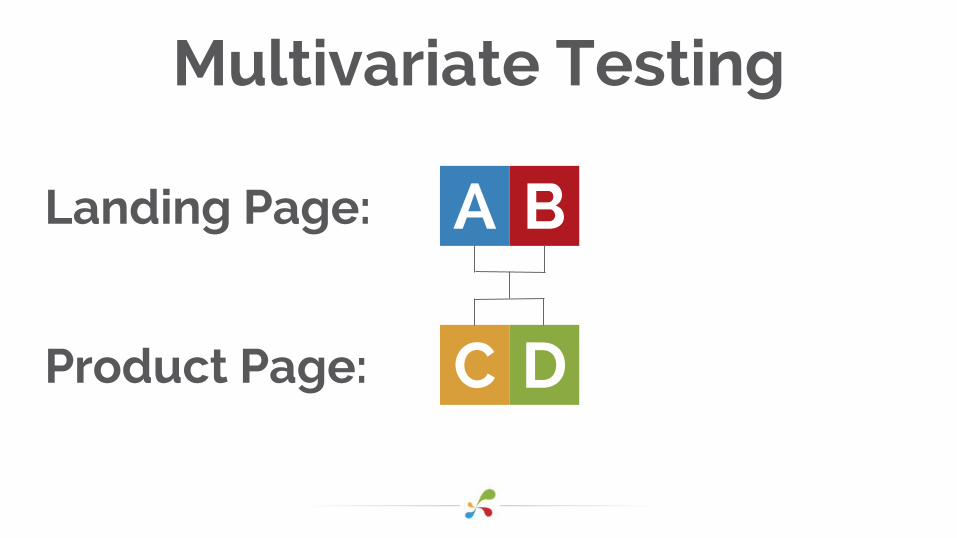
Multivariate Testing
A B
C D
Landing Page:
Product Page:
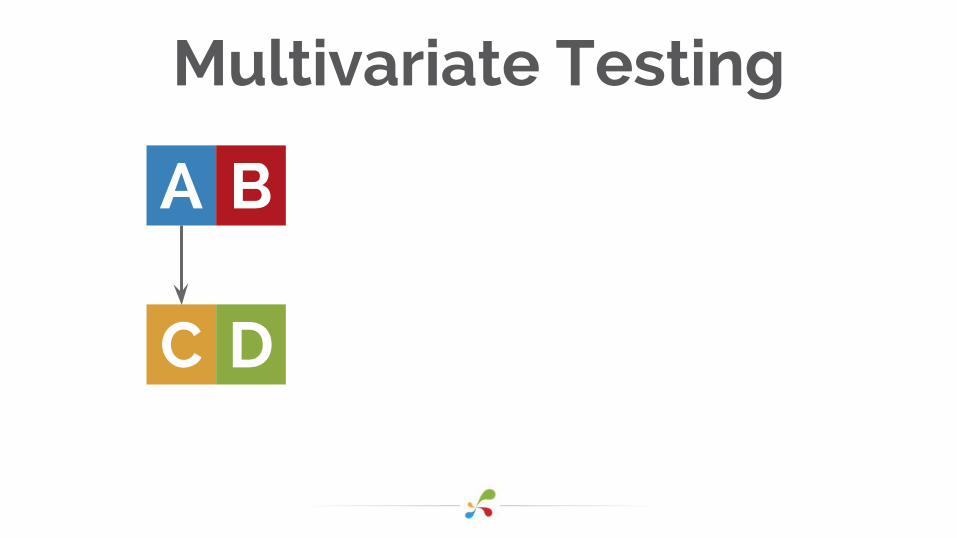
Multivariate Testing
A
C D
B
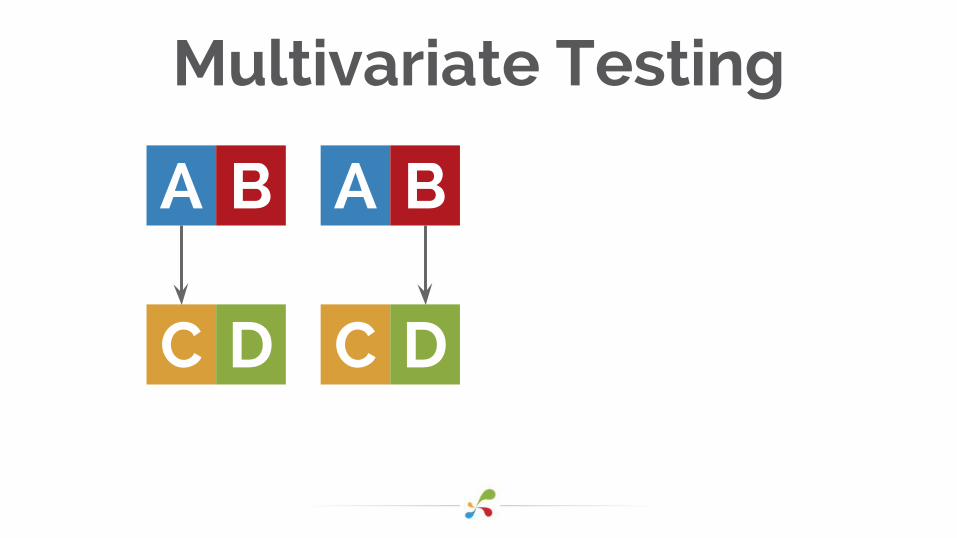
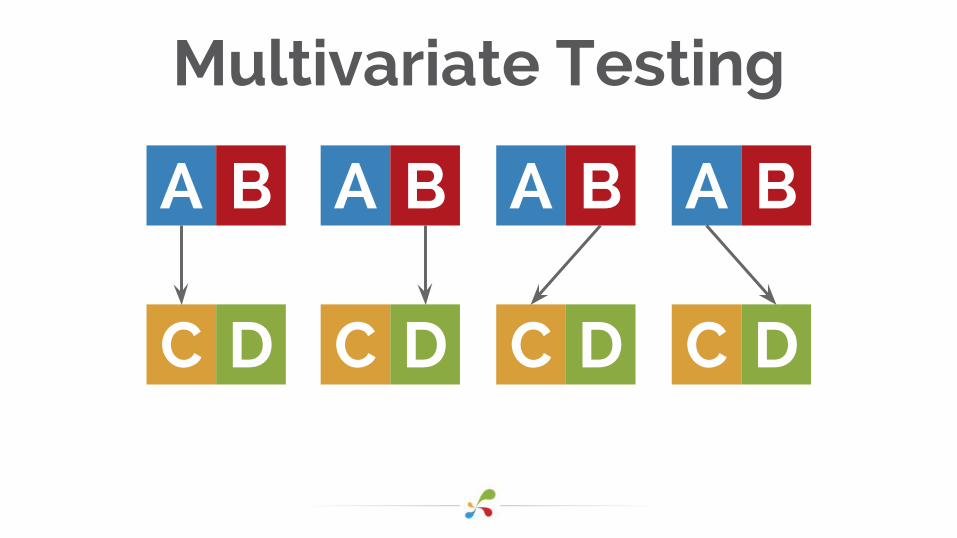
Multivariate Testing
A
C D
BA
C D
B
Multivariate Testing
A
C D
BA
C D
BA
C D
B
Multivariate Testing
A
C D
B A
C D
BA
C D
BA
C D
B
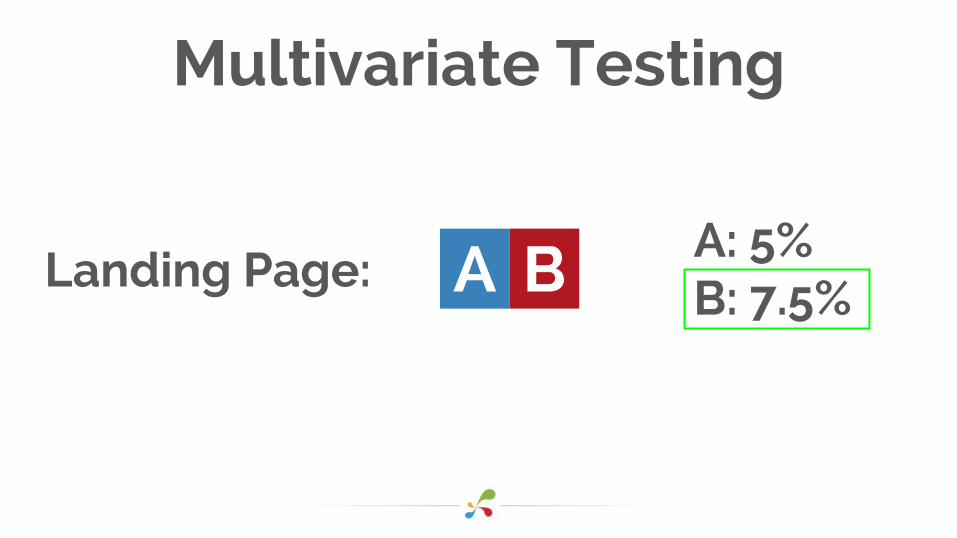
Multivariate Testing
A BLanding Page:A: 5%B: 7.5%

Multivariate Testing
C D C: 5%D: 7.5%
Product Page:

Multivariate Testing
A
C D
B A
C D
BA
C D
BA
C D
B

A
C
Multivariate Testing
D
B A
C D
BA
C D
BA
C D
B
AC: 0%
BD: 5%
BC: 10%
AD: 10%
A B


“Constantly Iterate”
Multiple Testing
A B C D E F
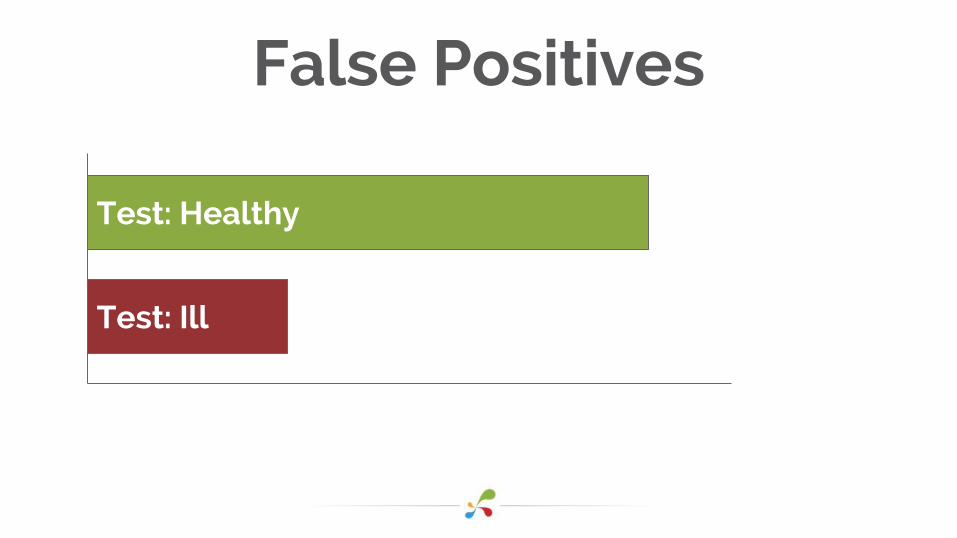
False Positives
Test: Healthy
Test: Ill
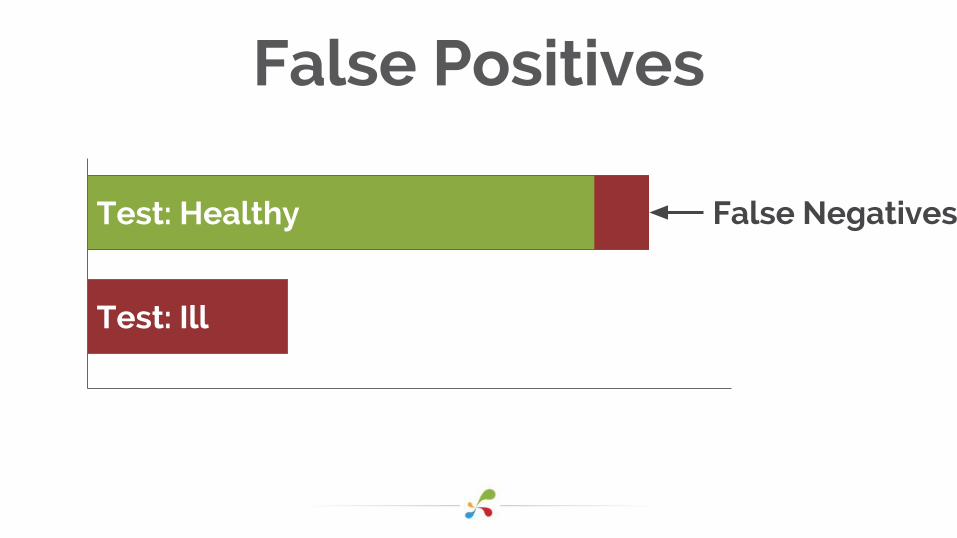
False Positives
Test: Healthy
Test: Ill
False Negatives
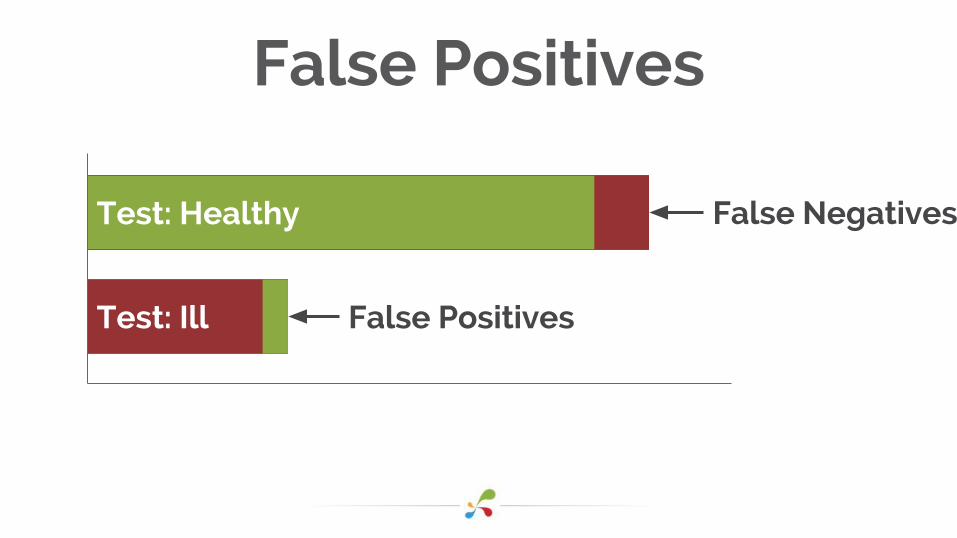
False Positives
Test: Healthy
Test: Ill False Positives
False Negatives
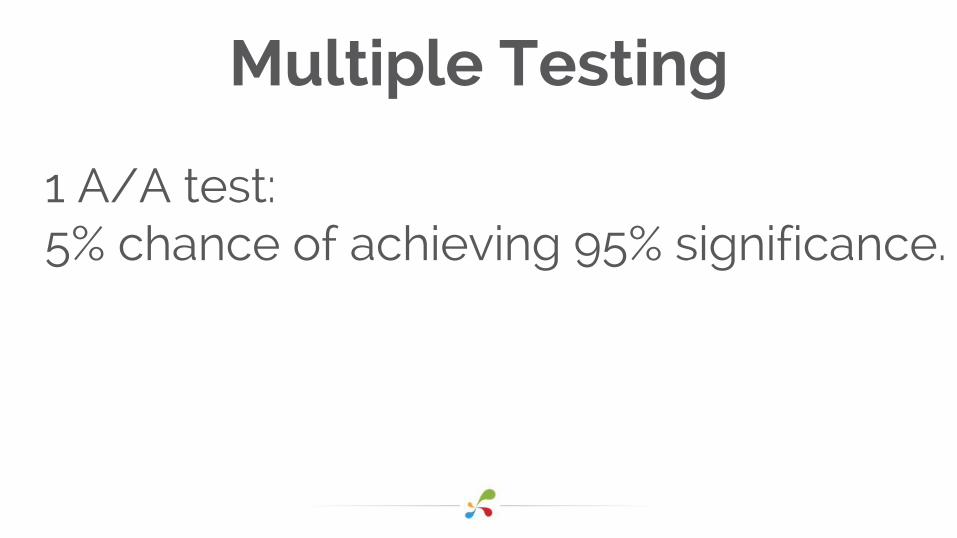
Multiple Testing
1 A/A test:5% chance of achieving 95% significance.
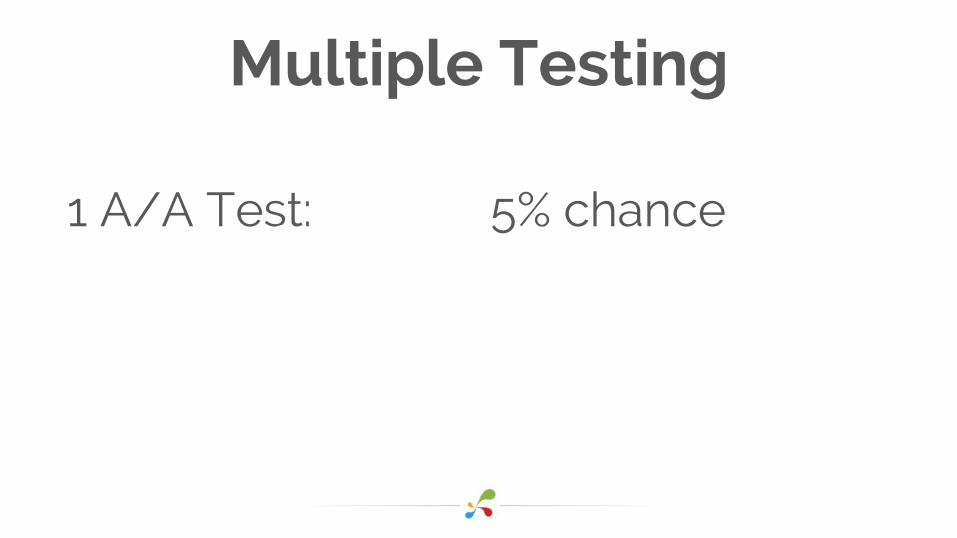
Multiple Testing
1 A/A Test: 5% chance
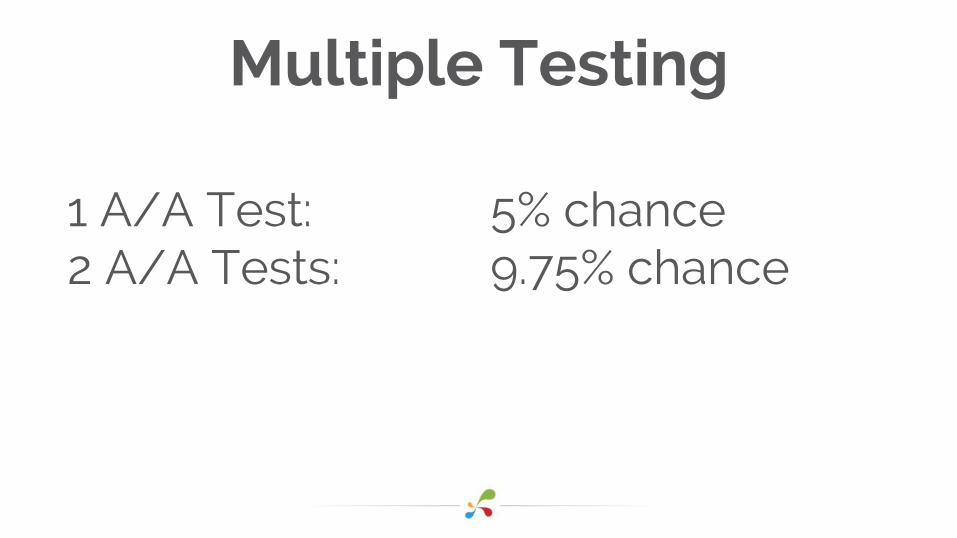
Multiple Testing
1 A/A Test:2 A/A Tests:
5% chance9.75% chance
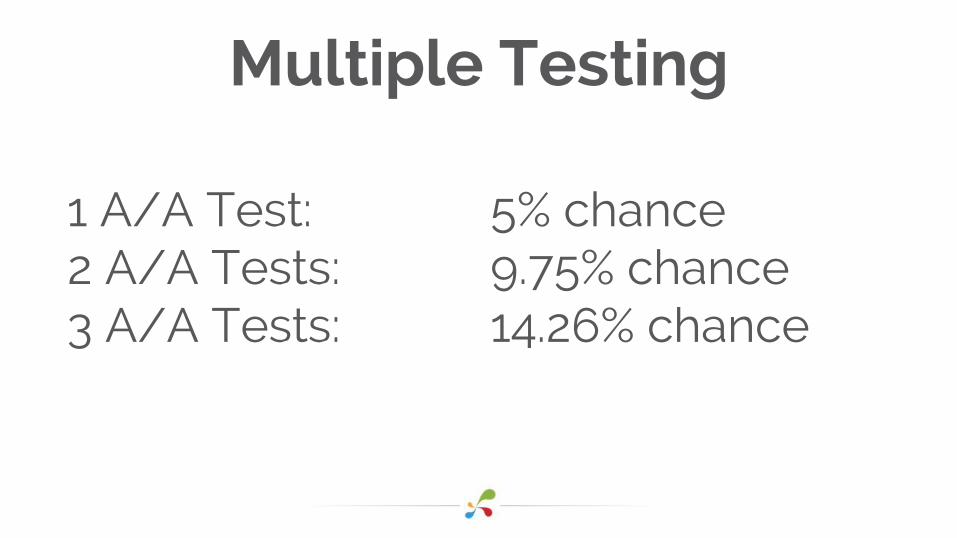
Multiple Testing
1 A/A Test:2 A/A Tests:3 A/A Tests:
5% chance9.75% chance14.26% chance
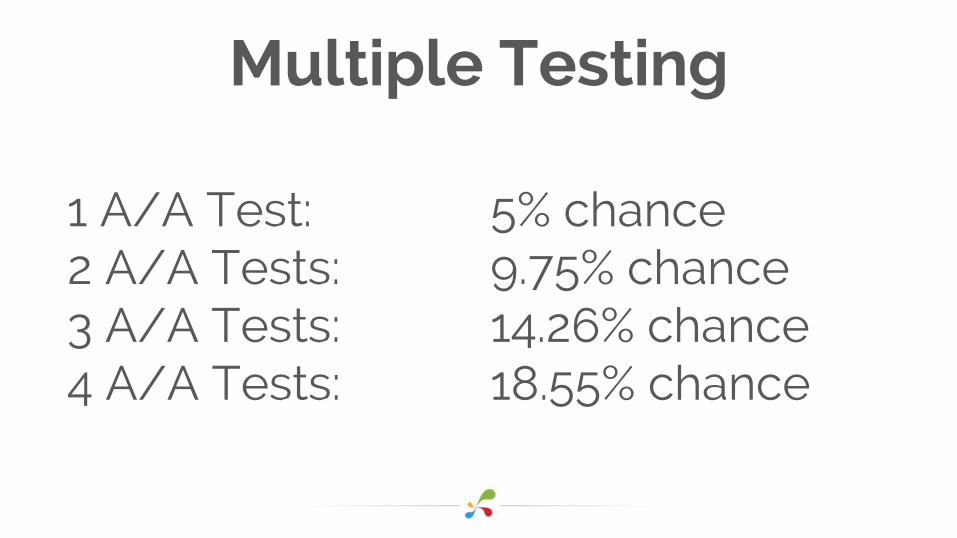
Multiple Testing
1 A/A Test:2 A/A Tests:3 A/A Tests:4 A/A Tests:
5% chance9.75% chance14.26% chance18.55% chance
Multiple Testing
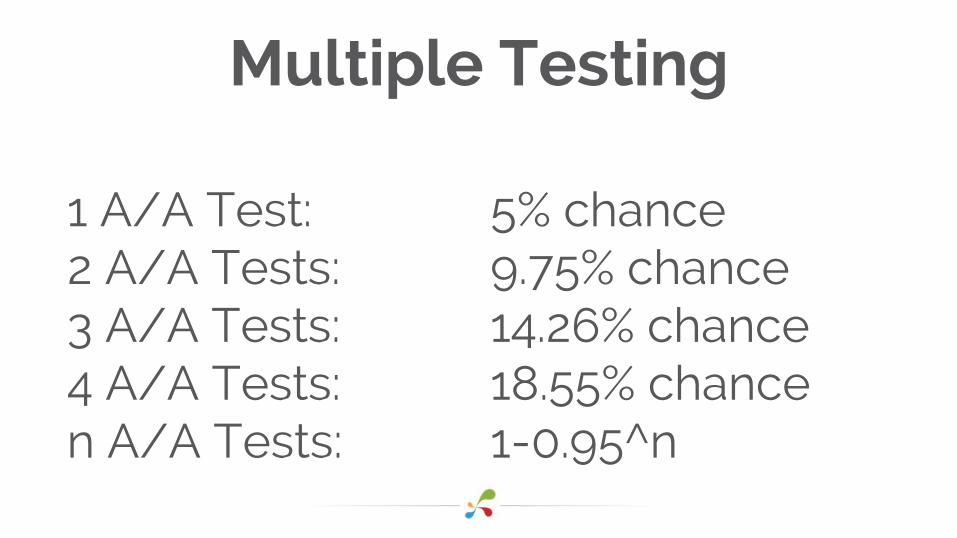
1 A/A Test:2 A/A Tests:3 A/A Tests:4 A/A Tests:n A/A Tests:
5% chance9.75% chance14.26% chance18.55% chance1-0.95^n
Multiple Testing
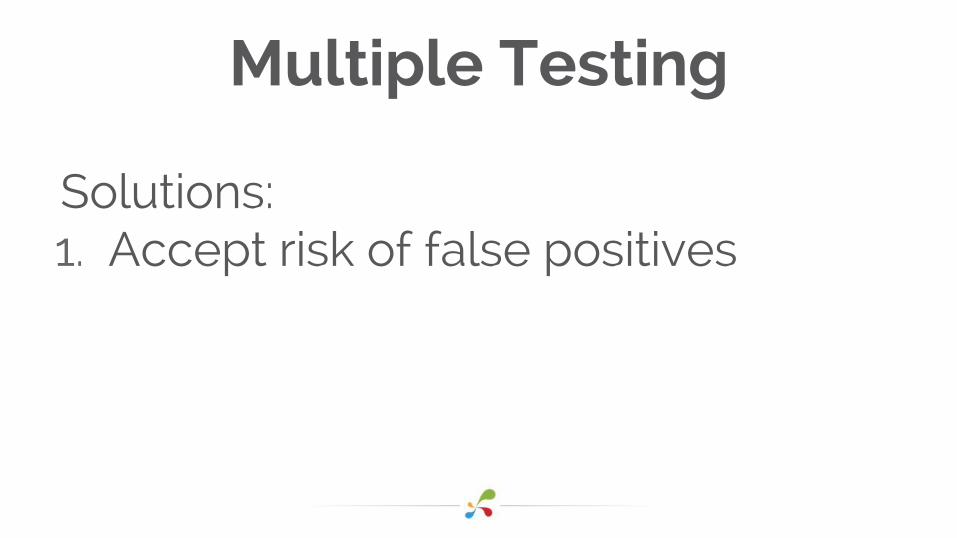
Solutions:1. Accept risk of false positives
Multiple Testing
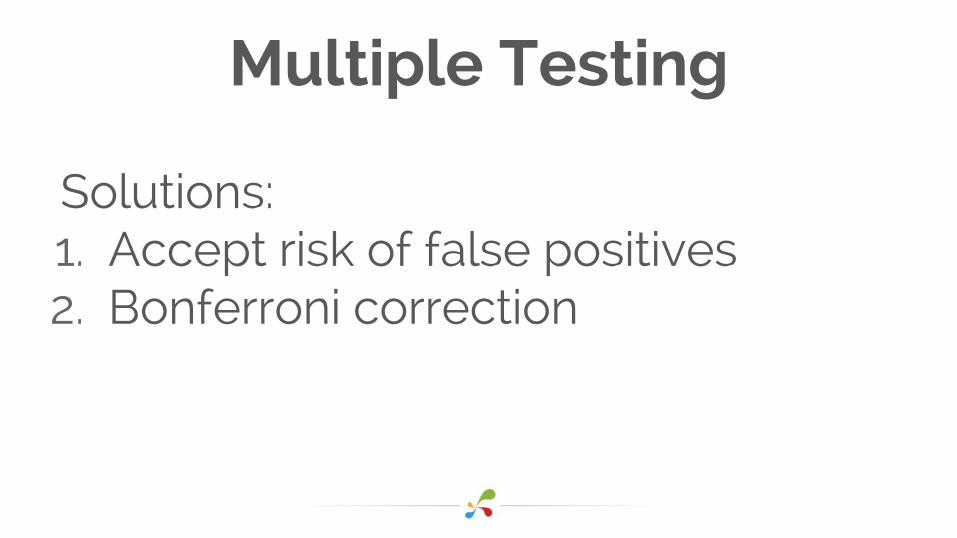
Solutions:1. Accept risk of false positives2. Bonferroni correction
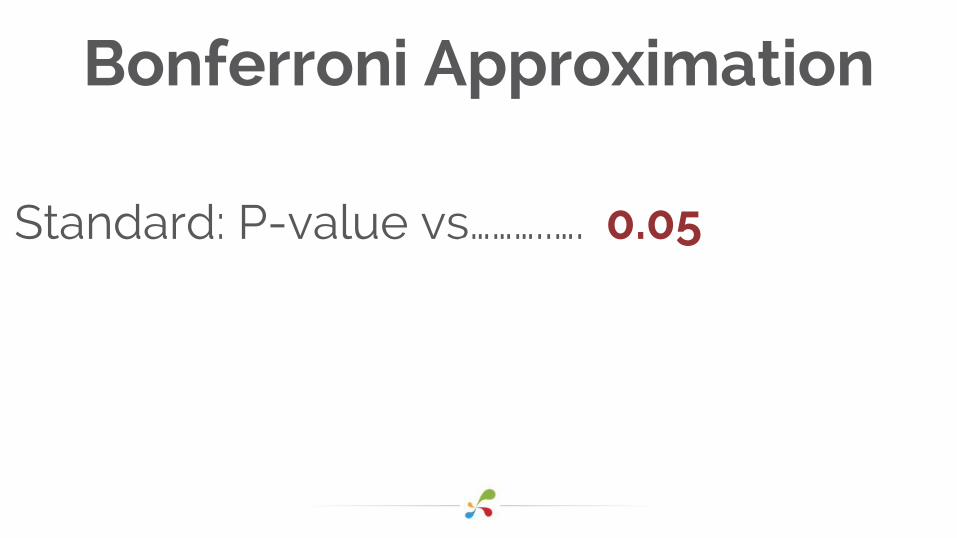
Bonferroni Approximation
Standard: P-value vs………..…. 0.05
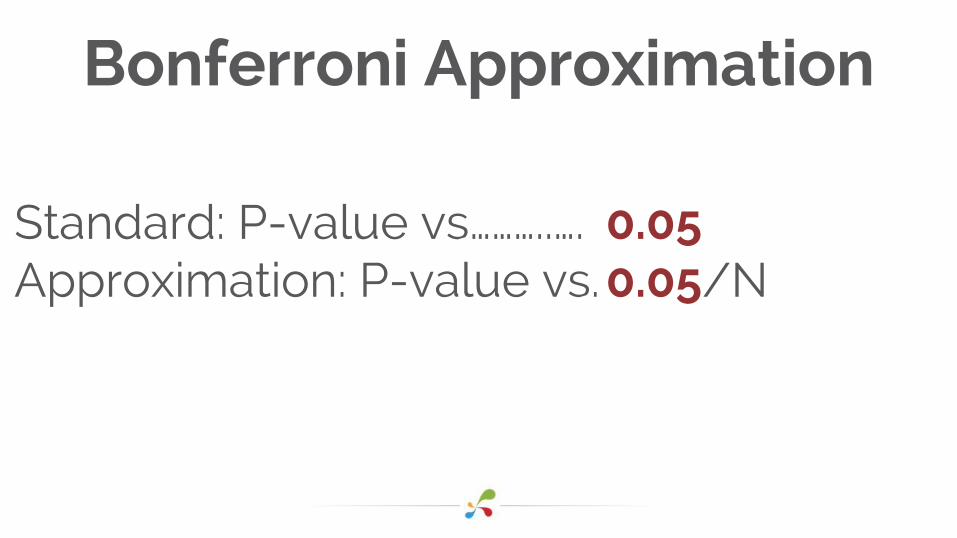
Bonferroni Approximation
Standard: P-value vs………..….Approximation: P-value vs…...
0.050.05/N
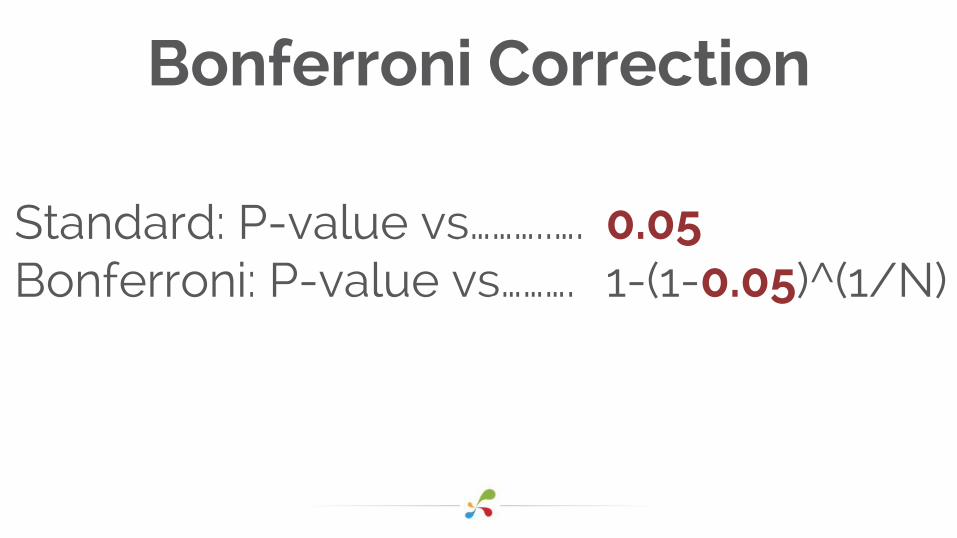
Bonferroni Correction
Standard: P-value vs………..….Bonferroni: P-value vs……….
0.051-(1-0.05)^(1/N)
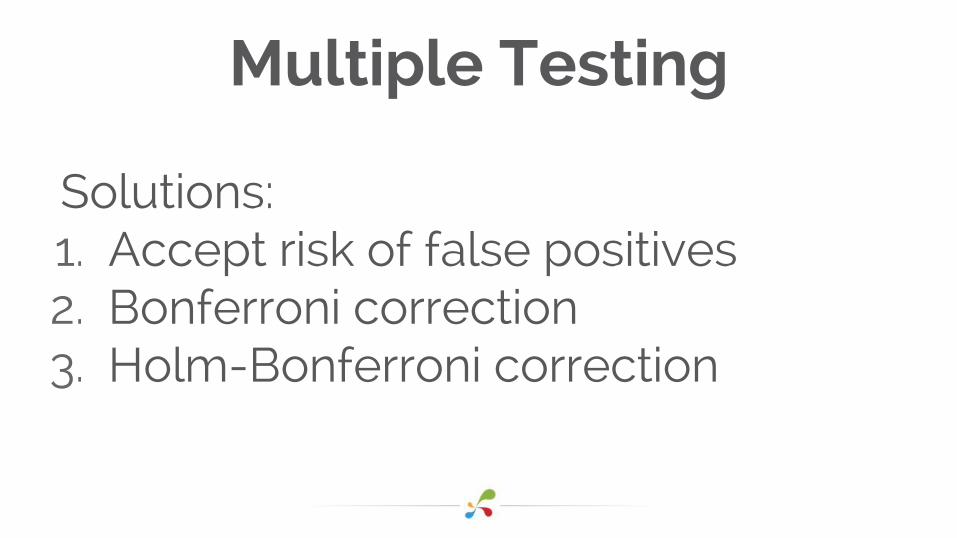
Multiple Testing
Solutions:1. Accept risk of false positives2. Bonferroni correction3. Holm-Bonferroni correction

Choosing the Right Metric
Choosing the Right Metric
Conversion Ratevs.
Average Session Value
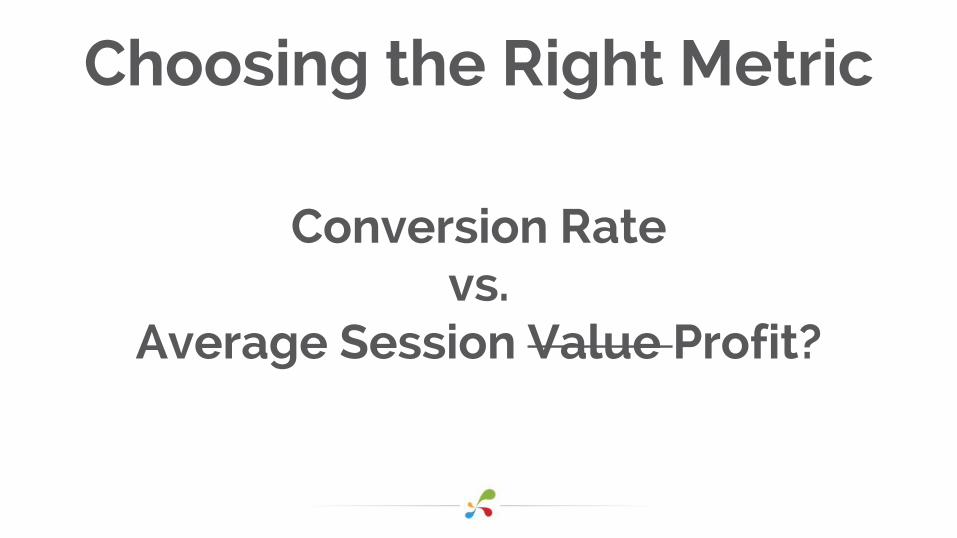
Choosing the Right Metric
Conversion Ratevs.
Average Session Value Profit?

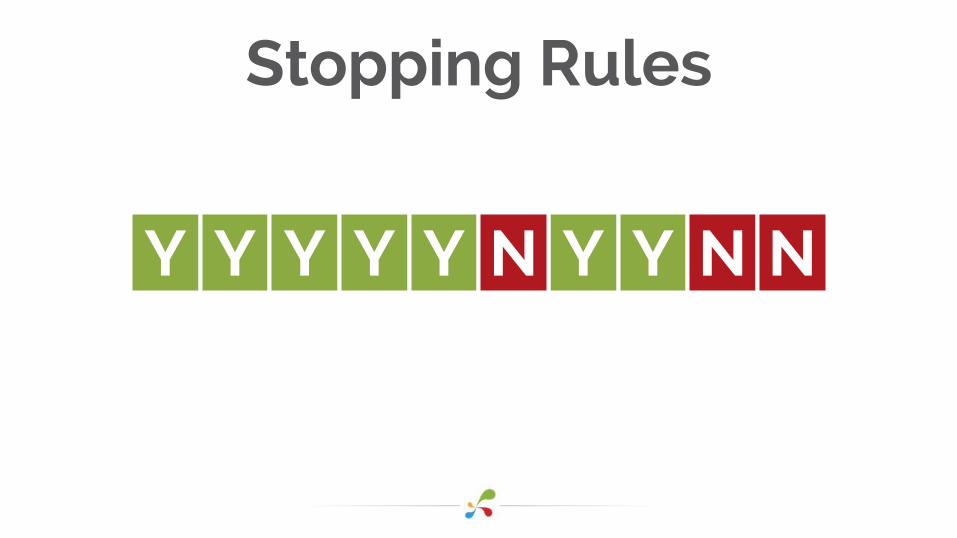
Stopping Rules
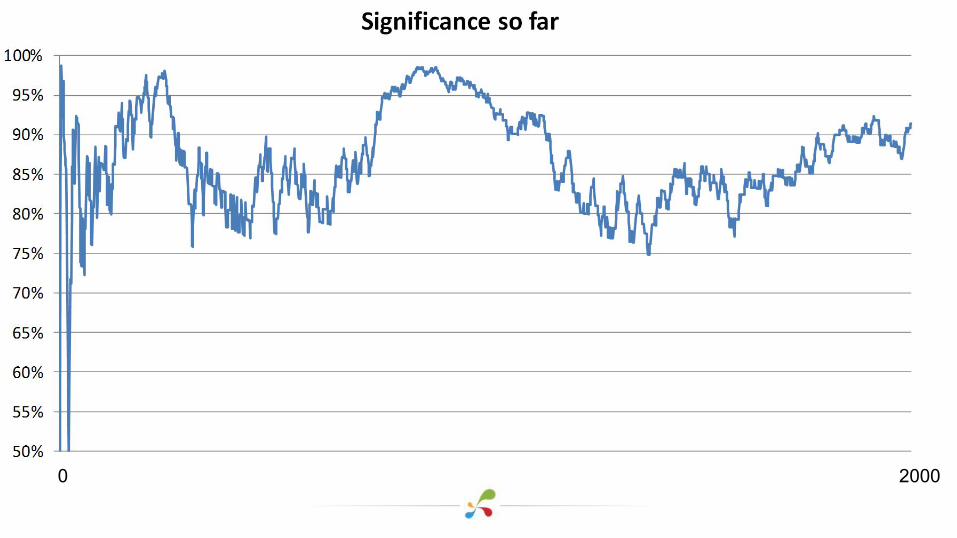
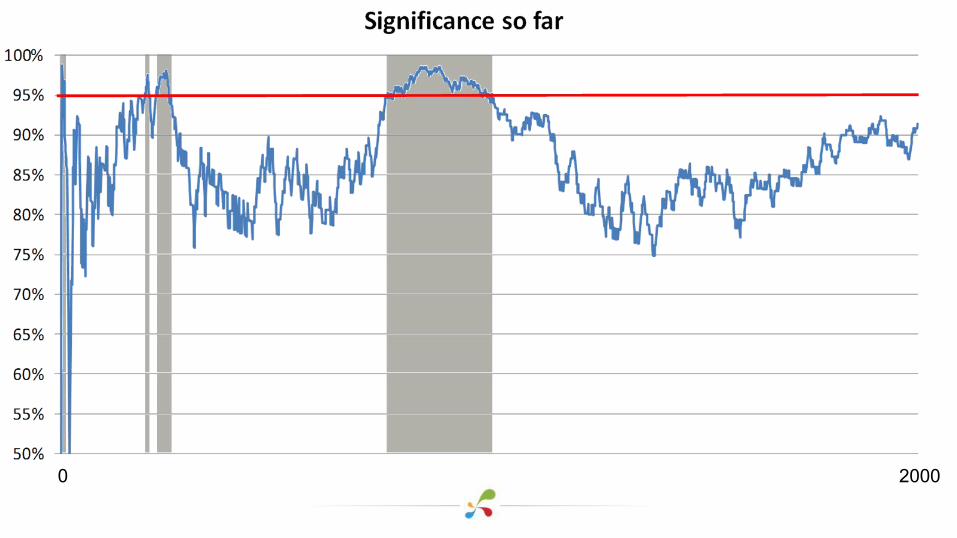
Stopping Rules
Common: When my test reaches significance.

“Significance so far” varies over time.
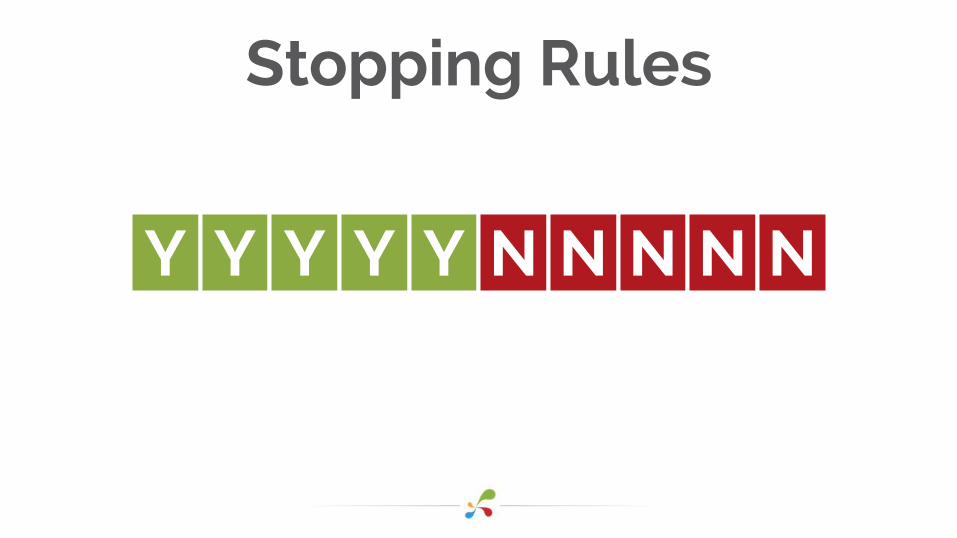
Stopping Rules
Y Y Y Y Y N N N N N
Stopping Rules
Y Y Y Y Y Y YN N N
Stopping Rules
20000
20000
Exceptions
https://en.wikipedia.org/wiki/Sequential_probability_ratio_test
Stopping Rules
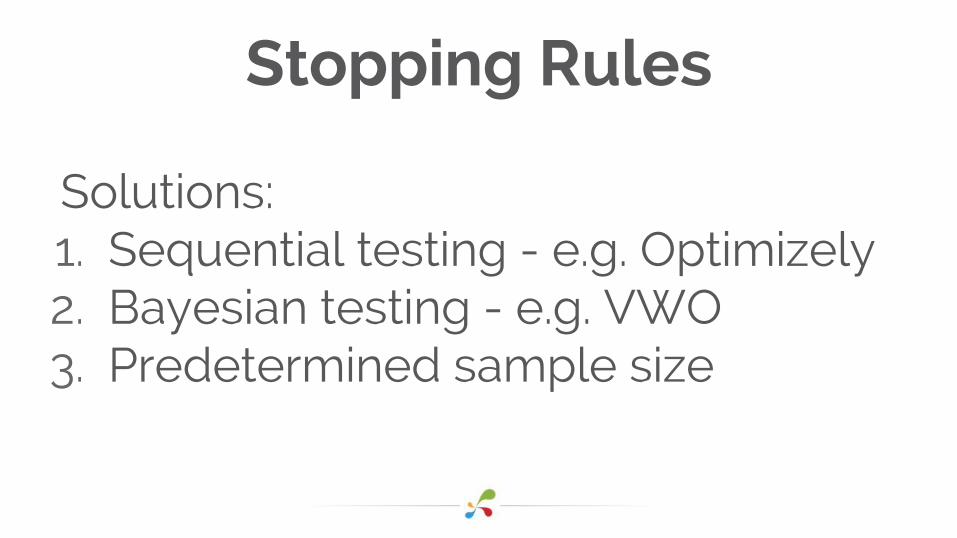
Solutions:1. Sequential testing - e.g. Optimizely2. Bayesian testing - e.g. VWO3. Predetermined sample size
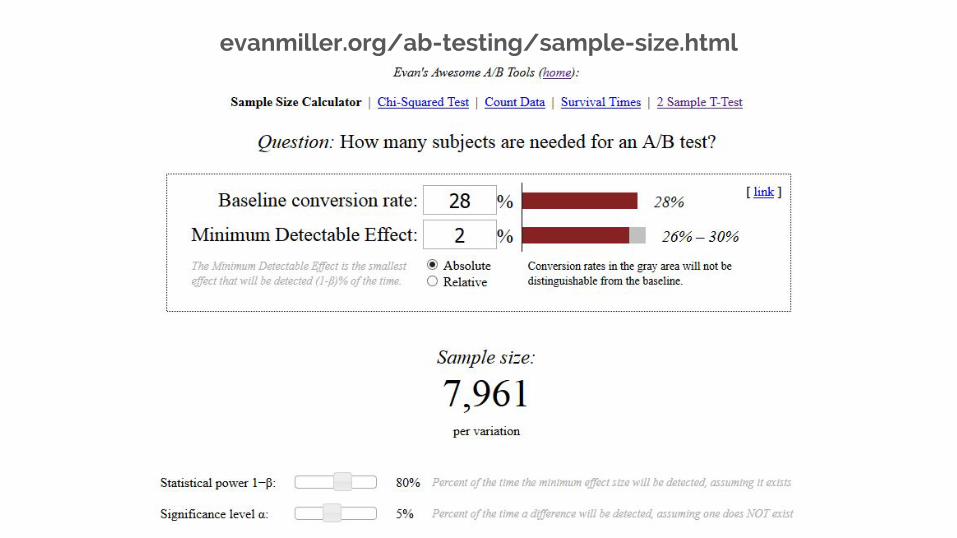
evanmiller.org/ab-testing/sample-size.html

Sample Size for Average Session Value Testing
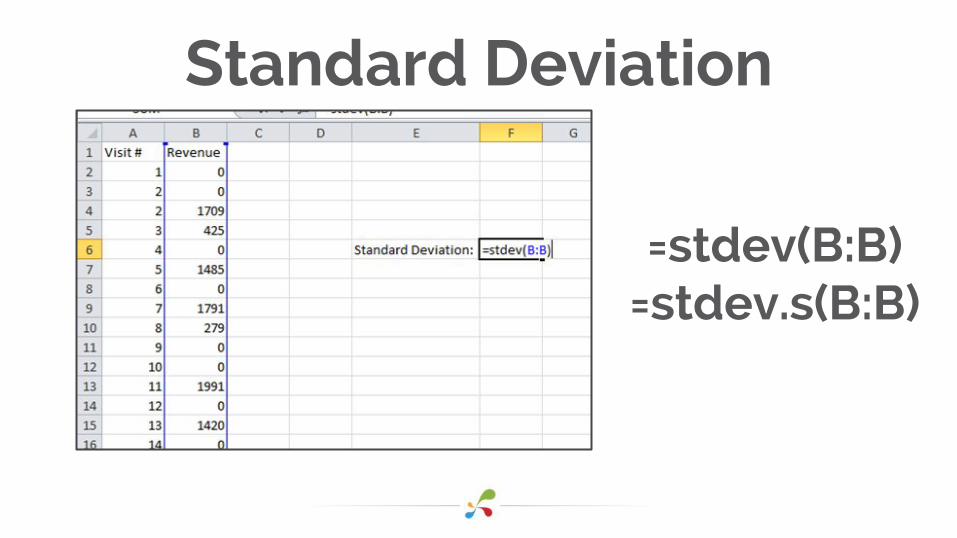
=stdev(B:B)=stdev.s(B:B)
Standard Deviation
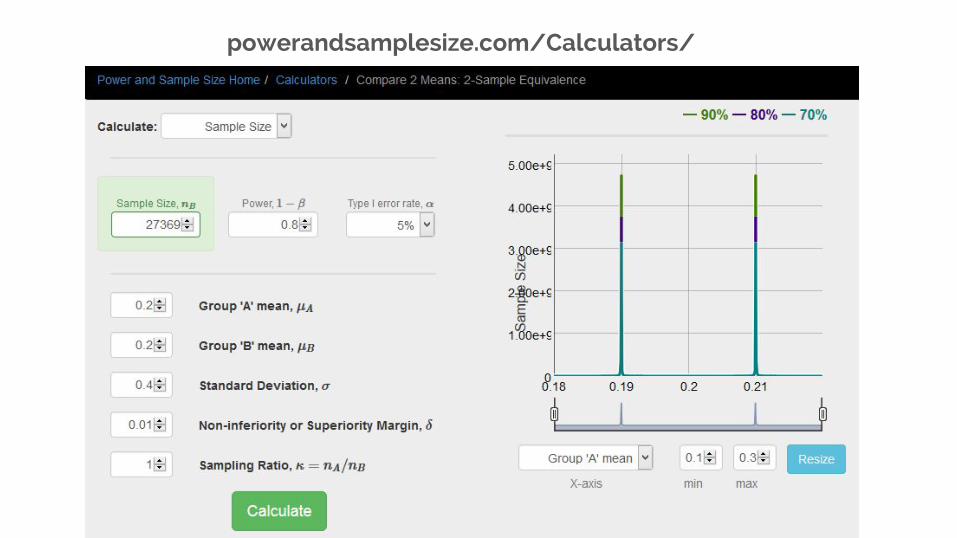
powerandsamplesize.com/Calculators/

Cutting Your Losses
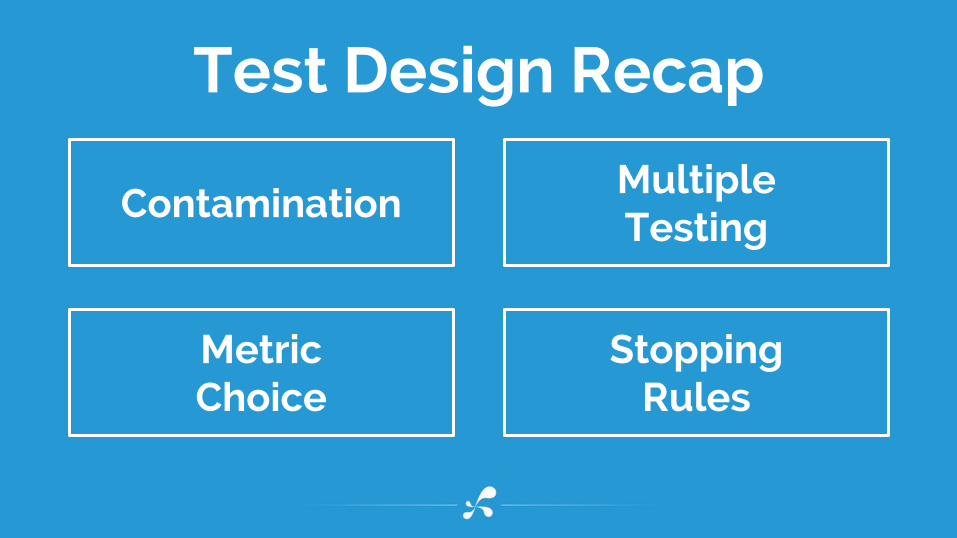
Test Design Recap
ContaminationMultipleTesting
MetricChoice
StoppingRules

1. Test design
2. Results interpretation
3. Decision

2. Results Interpretation
Interpreting the P-Value
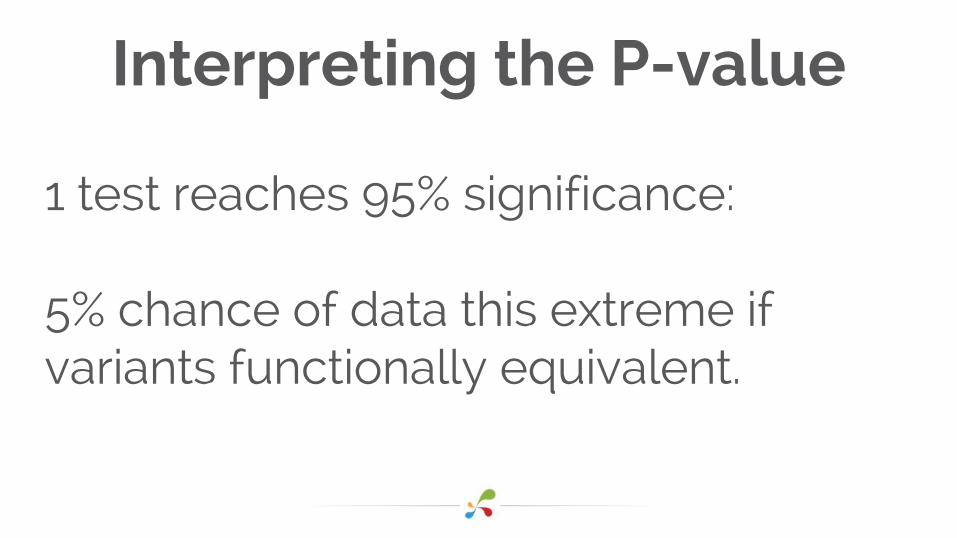
Interpreting the P-value
1 test reaches 95% significance:
5% chance of data this extreme if variants functionally equivalent.
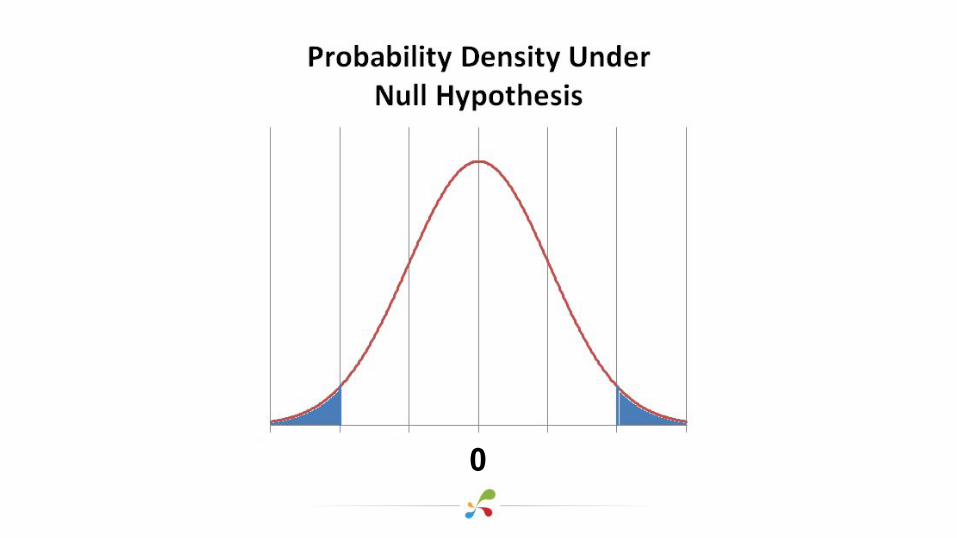
0
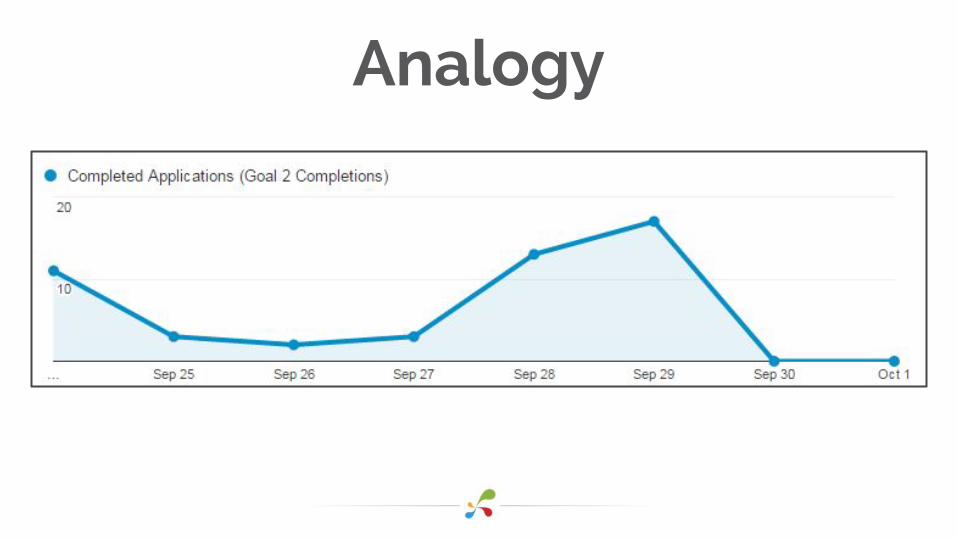
Analogy
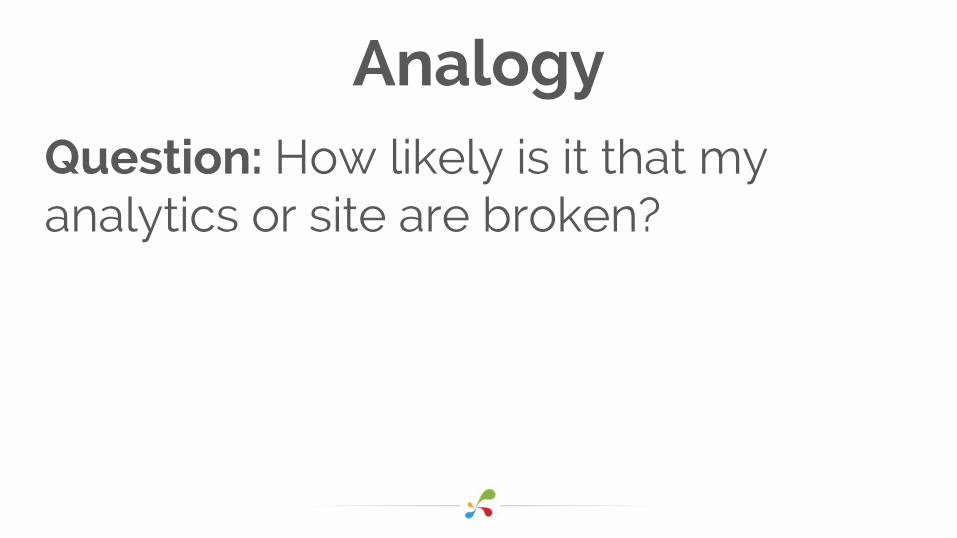
AnalogyQuestion: How likely is it that my analytics or site are broken?
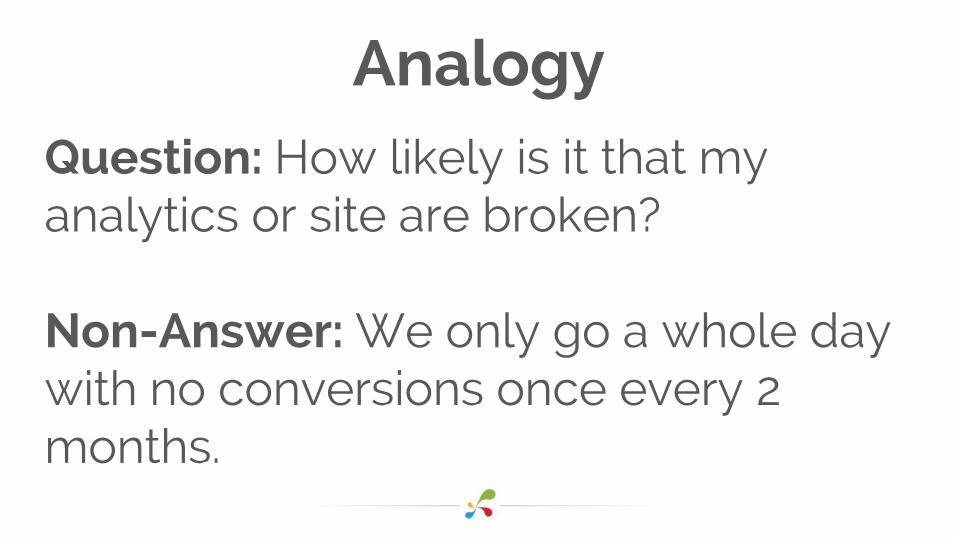
AnalogyQuestion: How likely is it that my analytics or site are broken?
Non-Answer: We only go a whole day with no conversions once every 2 months.
Analytics is broken with probability 1 or 0.
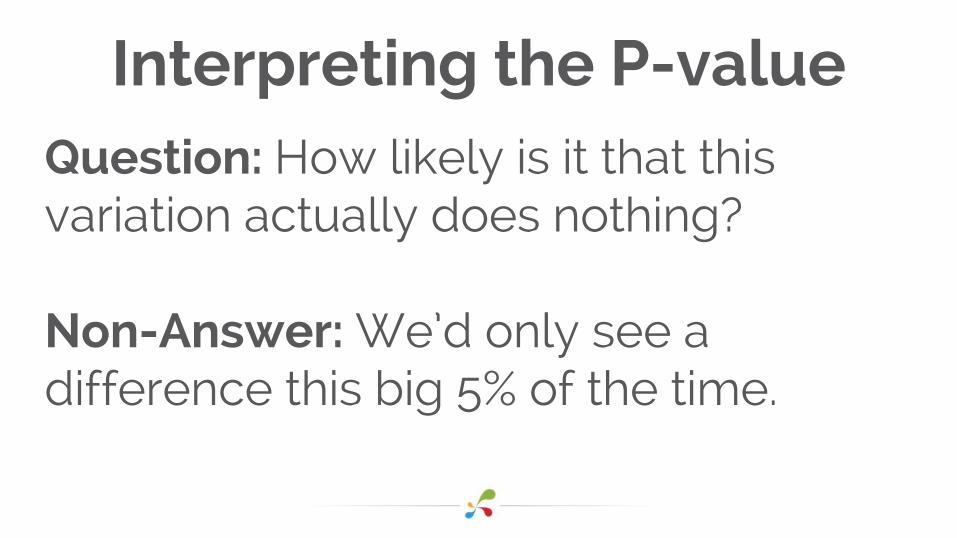
Interpreting the P-valueQuestion: How likely is it that this variation actually does nothing?
Non-Answer: We’d only see a difference this big 5% of the time.
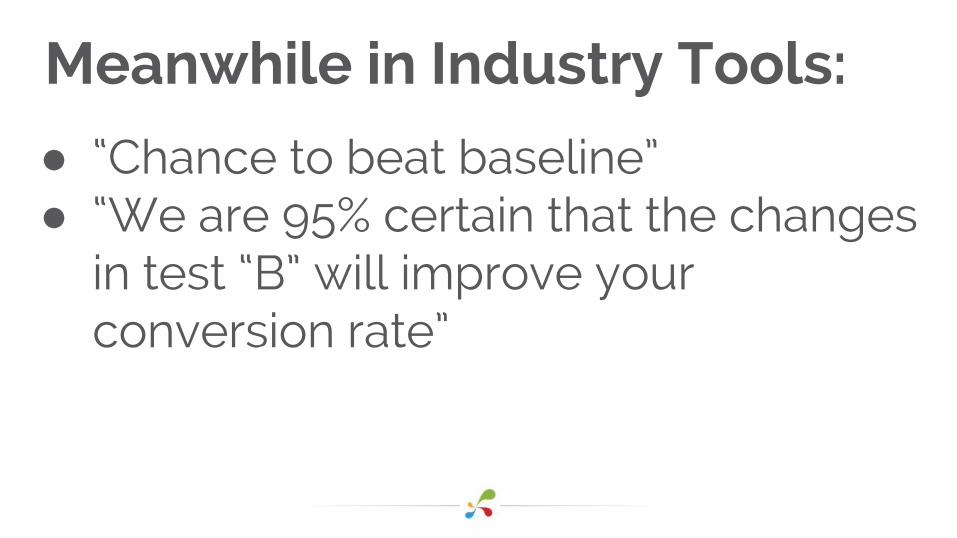
Meanwhile in Industry Tools:
● “Chance to beat baseline”● “We are 95% certain that the changes
in test “B” will improve your conversion rate”

Unanswered Questions
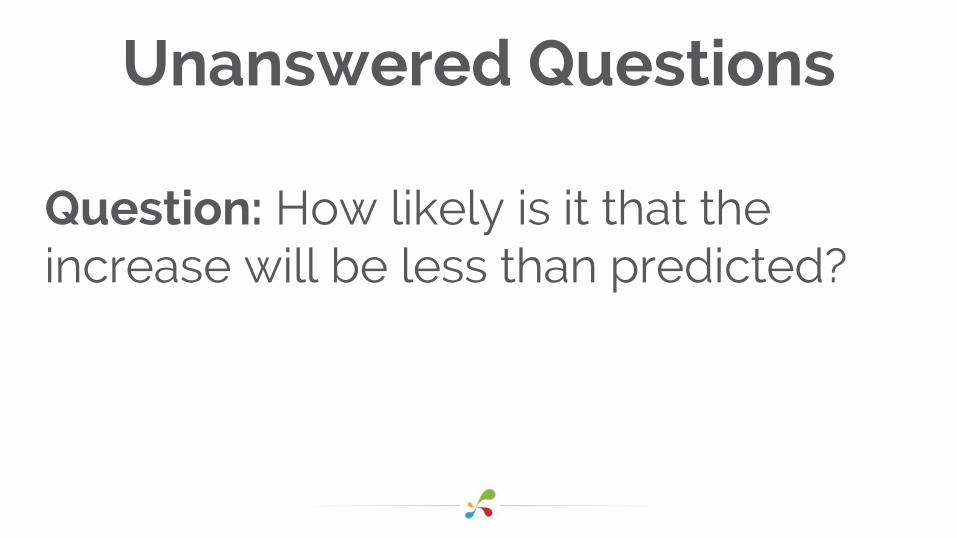
Unanswered Questions
Question: How likely is it that the increase will be less than predicted?
Unanswered Questions
Question: How likely is it that the increase will be negative?
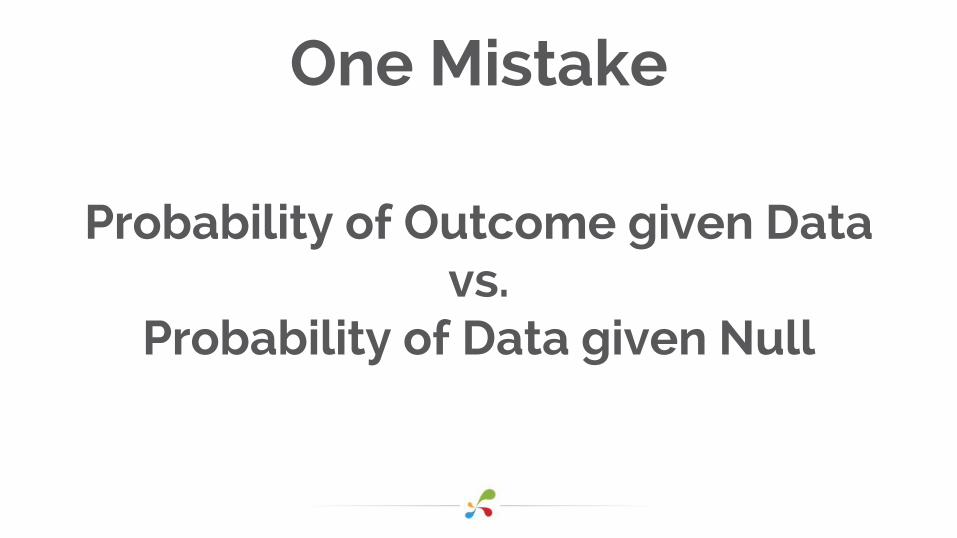
One Mistake
Probability of Outcome given Datavs.
Probability of Data given Null
Unanswered Questions
Question: How likely is it that these results are a fluke?

Confidence Intervals
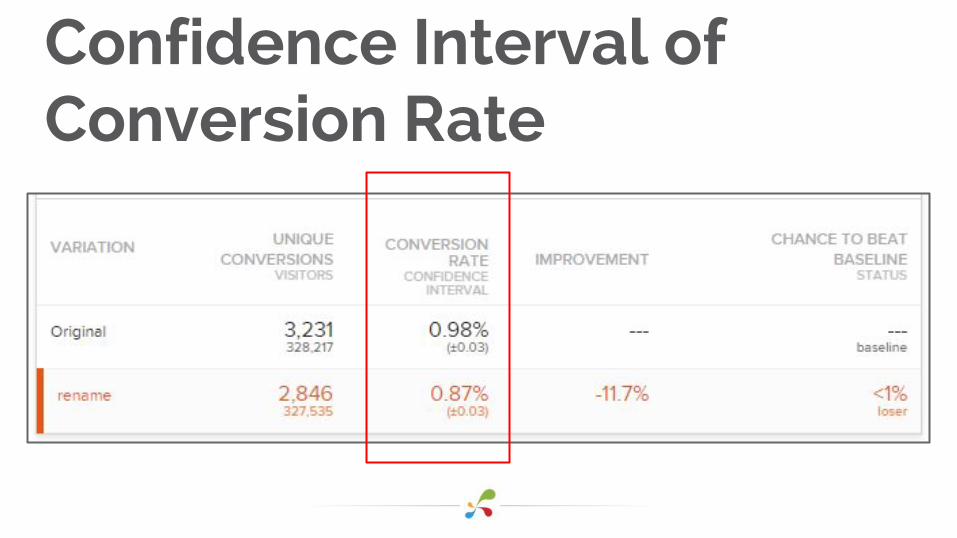
Confidence Interval of Conversion Rate
Overlapping Confidence Intervals

Everything Else Still Applies

Choosing the Right Metric
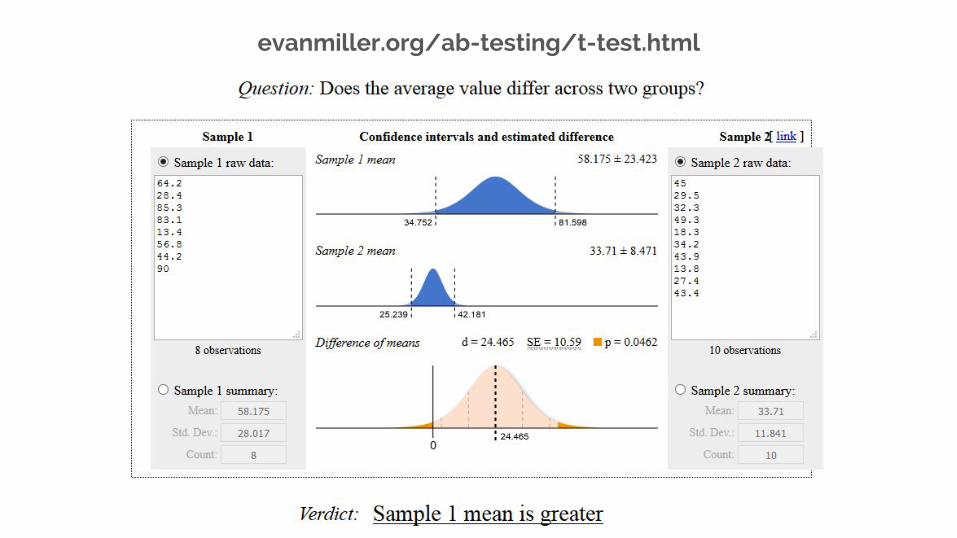
evanmiller.org/ab-testing/t-test.html
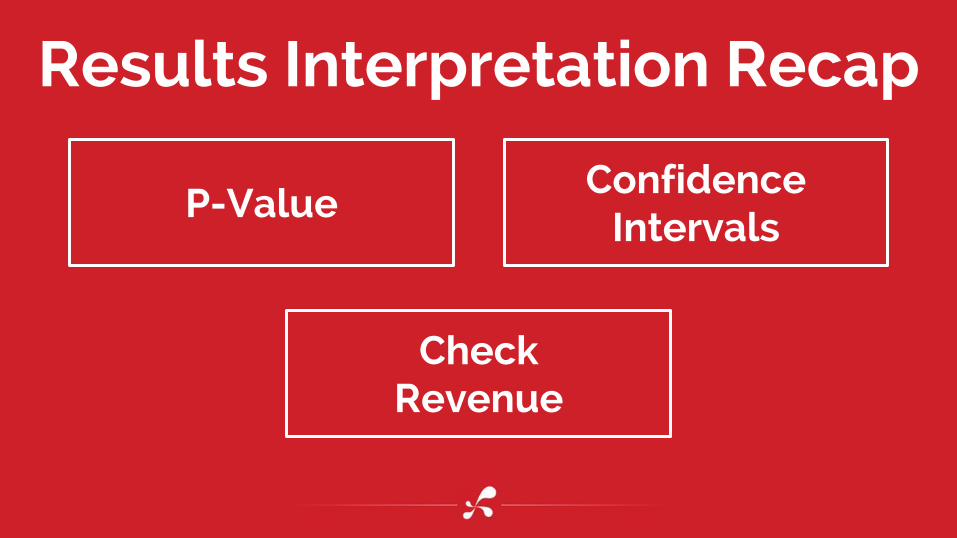
Results Interpretation Recap
CheckRevenue
P-ValueConfidence
Intervals

1. Test design
2. Results interpretation
3. Decision

3. Decision

A Good A/B Test Result:“10% Uplift, With 95% Significance”

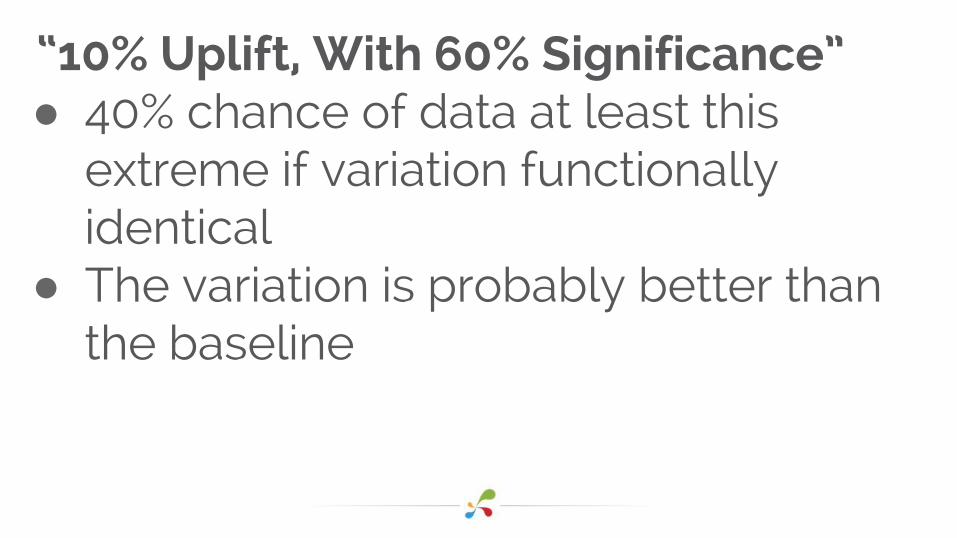
But what about this?“10% Uplift, With 60% Significance”

Jargon: P-Value
● The chance of a result this extreme if the null hypothesis is true
● E.g. 0.05 for 95% significance
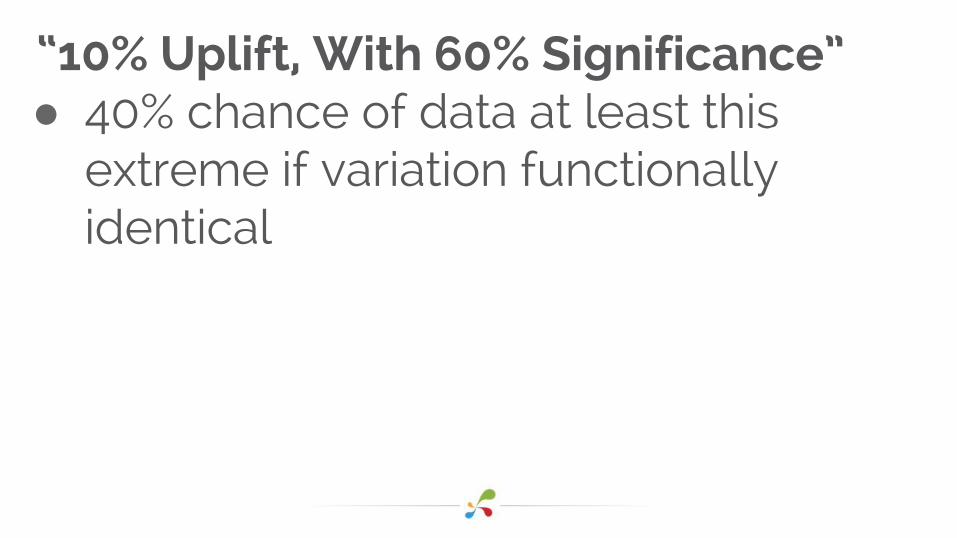
“10% Uplift, With 60% Significance”● 40% chance of data at least this
extreme if variation functionally identical
“10% Uplift, With 60% Significance”● 40% chance of data at least this
extreme if variation functionally identical
● The variation is probably better than the baseline
Drug Trialsvs.
Investment Banking
Are You OK With False Positives?


Data is Expensive
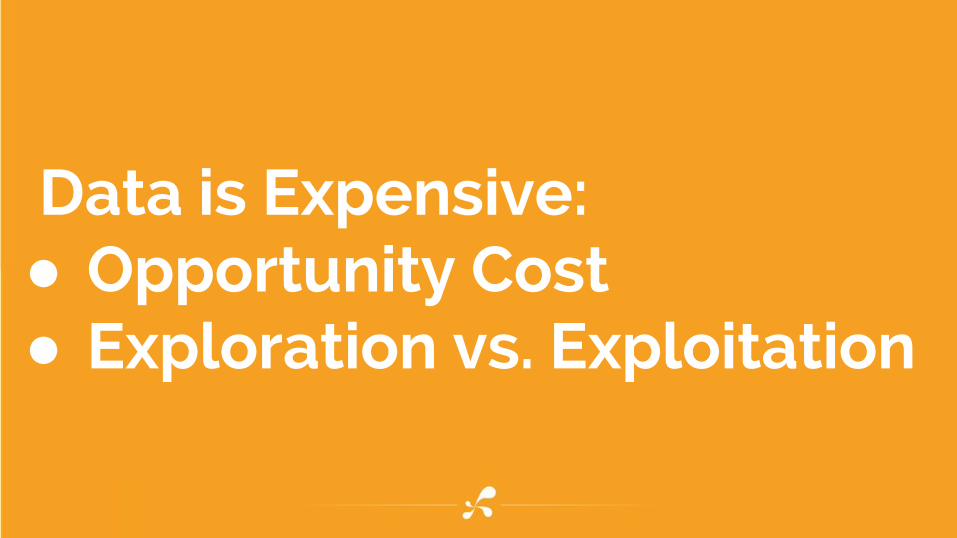
Data is Expensive:● Opportunity Cost● Exploration vs. Exploitation

Historical Comparisons are Invalid

Hang on…Why Should I Care About
Significance?

1. Ignoring Significance Doesn’t Allow You to Ignore Statistics

2. Risk Aversion

Risk Factors:● Agility● Business attitudes● What’s the worst that
could happen?
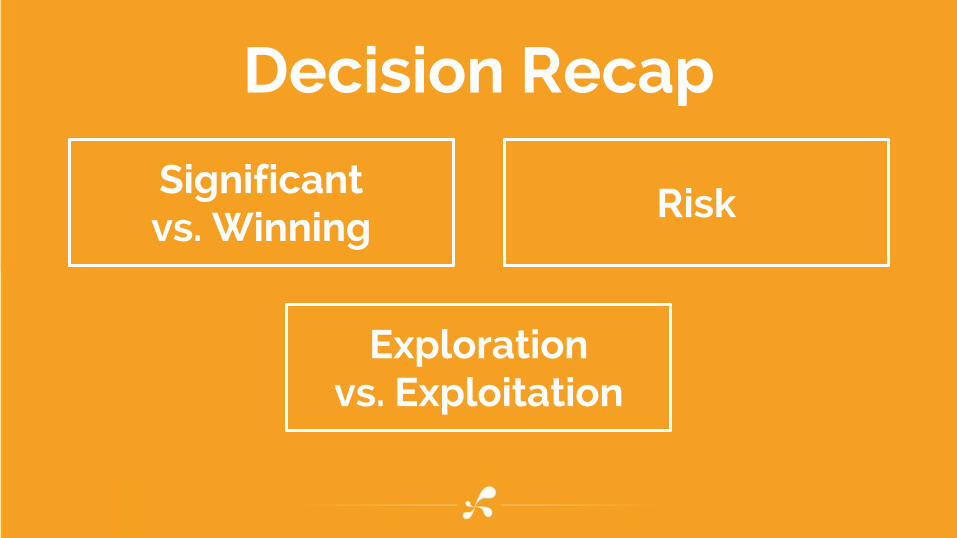
Decision Recap
Significantvs. Winning
Risk
Explorationvs. Exploitation
Conclusion:3 Takeaways
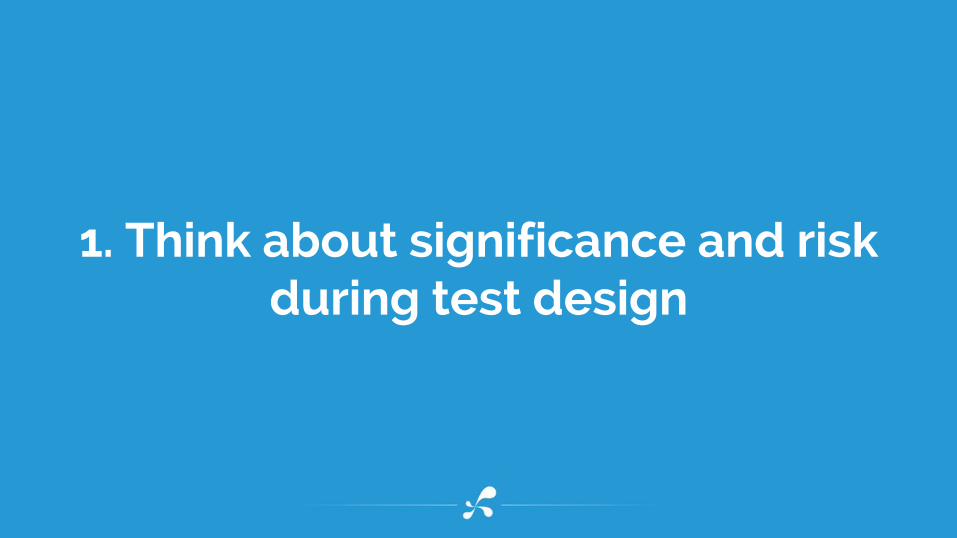
1. Think about significance and risk during test design

2. Remember your real KPI: Profit

3. You’re not testing medicines
@THCapper
Takeaways:1. Think about significance and risk
during test design2. Remember your real KPI: Profit3. You’re not testing medicines