
Conversational Peers and Idea Generation: Evidence...
50
Conversational Peers and Idea Generation: Evidence from a Field Experiment * Sharique Hasan Stanford University Rembrand Koning Stanford University May 12, 2017 Abstract High quality ideas and the individuals who generate them are critical to the success of organizations. In this article, we take a micro-network perspective on idea generation and incorporate personality theory into a multi-level model of information acquisition and idea generation. We posit that innovator and peer personality are critical factors conditioning who will generate high-quality ideas, and that our proposed mechanisms have implications at both individual and team levels. Using data from a randomized field experiment embedded in a startup bootcamp for early-stage entrepreneurs, our findings show that innovators who are more open to experience do generate better ideas, but only when they converse with extroverted peers. Further, we find that teams populated with such openness-extroversion dyads perform substantially better—having both a higher pool of novel information and better recombinative capability with the team. We discuss implications for future research on the individual and social determinants of innovation. * Author ordering is alphabetical. Please direct correspondence to either [email protected] or [email protected]. This research has received funding and support from The Indian Software Product Industry Roundtable (iSPIRT), Stanford’s SEED Center Stanford GSB, and the Kauffman Foundation. 1
Transcript of Conversational Peers and Idea Generation: Evidence...

Conversational Peers and Idea Generation:Evidence from a Field Experiment ∗
Sharique HasanStanford University
Rembrand KoningStanford University
May 12, 2017
Abstract
High quality ideas and the individuals who generate them are critical to the success of organizations.In this article, we take a micro-network perspective on idea generation and incorporate personality theoryinto a multi-level model of information acquisition and idea generation. We posit that innovator and peerpersonality are critical factors conditioning who will generate high-quality ideas, and that our proposedmechanisms have implications at both individual and team levels. Using data from a randomized fieldexperiment embedded in a startup bootcamp for early-stage entrepreneurs, our findings show that innovatorswho are more open to experience do generate better ideas, but only when they converse with extrovertedpeers. Further, we find that teams populated with such openness-extroversion dyads perform substantiallybetter—having both a higher pool of novel information and better recombinative capability with the team.We discuss implications for future research on the individual and social determinants of innovation.
∗Author ordering is alphabetical. Please direct correspondence to either [email protected] or [email protected]. This researchhas received funding and support from The Indian Software Product Industry Roundtable (iSPIRT), Stanford’s SEED CenterStanford GSB, and the Kauffman Foundation.
1

Introduction
The eventual success or failure of an entrepreneur can be the difference between having a good idea and an
average one. Scholars posit that the capability for developing creative and high-quality ideas depends on
the ability to effectively recombine diverse pieces of knowledge (e.g., Fleming, 2001). One important stream
of research on creativity has highlighted the role that psychological factors—such as personality—play in
setting the micro-foundations for this capability (e.g., Feist, 1998; McCrae, 1987; Barron and Harrington,
1981). Organization theorists, on the other hand, have emphasized structural sources of advantage in
creativity over individual ones, namely differential access to external knowledge through patterns of social
relationships (Perry-Smith and Mannucci, 2015; Burt, 2004). In the latter models, individual differences in
the personalities or cognitive processes of both innovators and their sources of information have been largely
abstracted away to focus attention on broader social patterns. This article extends existing research by
taking a micro-network perspective on idea generation and incorporates personality theory into a multi-level
model of information acquisition and idea generation.
In recent years, scholarship in the micro-network tradition has challenged the predominantly structural
theory of social networks—as pipes that primarily channel information—by enriching it with psychological
foundations (Kilduff and Krackhardt, 2008, 1994). Scholars have argued that individual differences shape
how structural patterns emerge and affect behavior (Fang et al., 2015). Much of this work has focused on
how human psychology shapes the formation and activation of networks. Work by Mehra, Kilduff and Brass
(2001) and Sasovova et al. (2010), for example, highlight the importance of self-monitoring personality on the
ability to bridge structural holes. Casciaro and Lobo (2008) similarly argue that positive and negative affect
fundamentally shapes who is sought out for advice in organizations. Smith, Menon and Thompson (2012)
show that cognition affects what parts of individuals’ networks are activated during times of uncertainty.
While the psychological foundations of network emergence have been studied extensively, the causal chain
linking the psychological traits of interacting parities to performance outcomes remains limited (for a recent
exception, see Burt, 2012). In this article, we extend existing models to examine the interactive effect of ego
and alter personalities on the ability to generate high-quality ideas, a crucial organizational outcome.
Our arguments focus on the basic building-blocks of a micro-network theory of innovation: the interac-
tions between an innovator and the sources of her information (who we call conversational peers, or peers).
To develop our theory of innovator capability we extend existing research linking personality differences to
creativity. Prior work has highlighted the role of openness to experience (hereon, openness) in determining
creative skill (Feist, 1998; McCrae, 1987). Individuals with higher openness are more creative because they
2

seek out diverse information and experiences, but also recombine these more effectively into novel ideas.
Those closed to experience are more conservative in their consumption of new information, and are unlikely
to have the ability or desire to develop new combinations of knowledge. However, recent scholarship has be-
gun to show that social and organizational factors substantially condition whether even those with inherent
creative skill are able to develop high-quality ideas or merely average ones (e.g., Baer and Oldham, 2006;
Burke and Witt, 2002).
A micro-network perspective on creativity enhancing social interactions suggests that who one gets exter-
nal information from should shape creative outcomes (Perry-Smith and Mannucci, 2015). We bring to bear
research on personality and social behavior to argue that conversations with peers higher in extraversion
(rather than those more introverted) provide innovators with an increased volume of idiosyncratic informa-
tion relevant at the ideation stage (De Vries, Van den Hooff and de Ridder, 2006; Forret and Dougherty,
2001; McCrae and John, 1992). Such information provides greater grist for new ideas, than its converse.
Moreover, we theorize a complementarity between innovator openness and peer extraversion. Greater re-
combinative capability and a higher volume of diverse information—leads to further enhanced idea quality.
Finally, a multi-level implication of our theory is that teams populated with high openness members who
have conversed with more extroverted peers, will develop better ideas as a team. This is because such teams
will have more creative skill, but also a higher-quality distribution ideas from which to recombine and choose
(Girotra, Terwiesch and Ulrich, 2010).
To test our predictions, we embedded a field experiment in an academy for over 100 aspiring entrepreneurs
held in June 2014. Prior to entering the academy, participants completed demographic and personality sur-
veys, which provided us with detailed pre-experiment personality data. The experiment that constitutes this
study lasted five days. Our key treatment consists of randomly assigning individuals to three conversations,
with each conversation lasting 14 minutes. This randomization created exogenous variation in the pairing of
different personality traits of both the idea generators and their conversational peers. We captured the ideas
generated individually by participants before and after the randomized conversations, and their subsequent
double-blinded evaluation. To test our multi-level hypotheses, we randomly assigned participants to teams to
develop a single software prototype after their individual-level ideas were generated over a three-day period.
These final team-generated prototypes were double-blind evaluated along a range of dimensions.
Contrary to established theory and consistent with recent work on the context dependence of creative
ability (e.g., Baer and Oldham, 2006), we find that openness to experience alone does not appear to relate to
idea quality. We do, however, find evidence of our micro-network mechanisms: talking to more extroverted
peers enhances idea quality, but also that more open individuals are indeed better equipped to use this novel
3

information to generate higher-quality ideas. We also find evidence that the higher-quality ideas generated
as a consequence of the experimentally induced conversations continue to impact team outcomes, with the
individual-level results replicating at the team-level.
Theory and Hypotheses
Idea Generation and Openness to Experience
Idea generation is the first step in the “idea journey” and is a central function in any entrepreneurial
organization (Perry-Smith and Mannucci, 2015). During this stage, an innovator is tasked with generating
many ideas, from among which one or a few are chosen for implementation. A growing body of literature
suggests that two mechanisms play a critical role at this stage. Perry-Smith and Mannucci (2015) summarized
these as “access to non-redundant knowledge” and the “cognitive flexibility to recombine disparate knowledge
into new associations.”
Over the past few decades, scholars have worked to understand what specific characteristics of individu-
als, social contexts, and processes are most likely to trigger these creativity-enhancing mechanisms. One of
the most thorough investigations has focused on the stable personality traits of individuals that correlate to
creativity. A rich panoply of research suggest that openness to experience a factor in the five factor model of
personality (with the other four factors being Extraversion, Agreeableness, Neuroticism, and Conscientious-
ness) is the trait most strongly related to creativity in both the arts and sciences (Feist, 1999). Openness,
according to McCrae (1996) has both an intrapsychic component—indicating skills and dispositions that
allow a person to effectively generate ideas—as well as an interpersonal component—which allow individuals
to acquire novel information useful for ideation.
Intrapsychic Mechanisms: A vast literature exists on openness to experience and its correlates, especially
its relationship to creativity (Feist, 1999). McCrae (1987) in a classic study on openness and creativity argues
that these constructs are linked through two broad types of mechanisms—abilities and the dispositions to
use them in creative endeavors. One stream of research on the openness-creativity link has highlighted the
skill that more open people have in completing unstructured creative tasks (Williams, 2004). Openness
causes people to tolerate complexity, rather than shy away from it (e.g., LePine, Colquitt and Erez, 2000);
deploy more representational resources and attention to their tasks and environments; explore a wider range
of perspectives when considering ideas or interpreting information; and engage more effectively in divergent
4

thinking (e.g., Hammond et al., 2011; Oldham and Cummings, 1996; McCrae and Costa, 1980). This suite
of abilities gives more open individuals facility in developing a wide range of ideas that are more likely to be
novel or unconventional (George and Zhou, 2001).
In addition, more open people prefer tasks that let them use these abilities or prefer activities that are
complex or incorporate diverse perspectives. Their dispositions include greater curiosity, as well as a desire
and willingness to ask questions and seek novel information (McCrae, 1996). Further, more open individuals
have a stronger belief in their own creative self-efficacy (e.g., Karwowski et al., 2013). Finally, a key char-
acteristic of those who are more open to experience is a willingness to question convention, leading them to
veer from traditional approaches.
Interpersonal Mechanisms: The intrapsychic mechanisms provide insight into the capabilities that open
individuals can deploy when tasked with taking available information and recombining it to produce a new
idea. Yet, further research by McCrae (1996) suggests that open individuals possess abilities and dispositions
that allow them to extract diverse information from their social environments, and are able to adapt to
other people’s perspectives. Further, the open individual’s tolerance for uncertainty allows them to recall
information incongruent with their own experiences–thus increasing information diversity (McCrae, 1996).
Finally, in conversations, those more open to experience delve into abstract topics (e.g., Funder and Sneed,
1993) and are interested in talking to new people and initiating new conversation threads when old ones
have died out (Cuperman and Ickes, 2009).
In contrast, those exhibiting closedness prefer more routine ideas and situations. They are most com-
fortable when the information is familiar, certain, and does not differ much from their own expectations.
Thus, in both the intrapsychic and interpersonal realms more closed individuals will tend to produce ideas
that are familiar and less likely to contain unconventional elements or combinations. Thus, we hypothesize:
Hypothesis 1 Innovators with higher (lower) openness to experience will develop higher quality (lower
quality) ideas.
Social Interactions as Inputs to Ideation: The Value of Extroverts
Yet, Hypothesis 1, is countered by a strong null. The ability of open individuals to acquire diverse knowledge
and recombine it into new ideas depends on the requisite informational variety and volume. Therefore,
without modeling the informational determinants of creativity jointly with the personality differences of
innovators, we may make incorrect inferences about who will generate the best ideas. Good ideas are rarely
5

developed in vacuums (Singh and Fleming, 2010). Innovators often engage in conversations with peers—
co-workers, friends, acquaintances or customers—that provide them with the raw material for innovation
(Perry-Smith and Mannucci, 2015). Indeed, the modern practice of innovation depends fundamentally
on sourcing the opinions, experiences, and knowledge of others (Blank, 2013; Brown et al., 2008). The
weight of this external information in idea generation is no different for open individuals. While their
abilities and dispositions may give them an edge in idea generation, they are nevertheless constrained by the
raw information they possess. As a consequence, an open innovator who lacks a sufficient pool of diverse
information may generate only average or perhaps weaker ideas.
Overcoming this limitation requires that open innovators should ideally talk to peers who are willing
to provide them with a substantial pool of new and diverse information. That is, the two mechanisms of
information sharing and information variety determine whether the innovator will receive from her peers
the raw information useful for generating novel ideas.
Willingness to Share Information: Not all conversations are created equal. In particular, conversational
dynamics depend on the personalities of the parties who are interacting (e.g., Cuperman and Ickes, 2009).
One personality trait in particular, extraversion, is related to greater sharing behaviors (Matzler et al., 2008).
The literature defines extroversion as a stable trait within the five factor model of personality that leads
individuals to enjoy interacting with others, talking, and sharing information (Furnham and Bachtiar, 2008;
John and Srivastava, 1999) In conversations, extroverts tend to express themselves. Their descriptions of
events and experiences are elaborate and interpretive (Beukeboom, Tanis and Vermeulen, 2013). Finally,
extroverts are eager and willing to share their knowledge with others (Matzler et al., 2008). These charac-
teristics should provide an innovator who talks to an extrovert with information with three qualities: higher
volume, richness of detail and elaboration.
Large Networks and Information Variety: However, a greater willingness to share information should
only increase informational volume, but not variety. Another stream of research on extraversion suggests
that extroverts have larger and more diverse networks compared with introverts (e.g., Landis, 2016; Watson
and Clark, 1997). Totterdell, Holman and Hukin (2008) found that extroverts had a greater behavioral
tendency to connect with others, and thus a larger network size. The link between greater extraversion and
network size has been found in a wide array of studies. Asendorpf and Wilpers (1998), for example, find
that extraversion predicted the size of an individual’s network, and Casciaro (1998) and Neubert and Taggar
(2004) find further evidence that extraversion is related to centrality in social networks. In recent work, Feiler
6
and Kleinbaum (2015) find that extroverts do indeed have larger networks than do introverts. This ability
to build larger networks also comes at the cost of tie strength and relational closeness. Research finds that
extroverts, while having larger networks, appear to have weaker network connections (Pollet, Roberts and
Dunbar, 2011). The structural consequences of these tendencies—large networks with weak ties—suggests
that those more extroverted should have networks that expose them more heterogeneous information from
their many weaker contacts (Granovetter, 1973).
However, the theorizing that more extroverted peers will lead to a higher volume of idiosyncratic infor-
mation, useful for ideation, rests upon a set of assumptions regarding the behavior of extroverts and the
information they possess. First, it assumes that extroverts are not purely engaging in “small talk” or “idle
chatter” which lacks informational content. Second, it may be that more introverted peers are more reflec-
tive and as a result may produce greater insight than more extroverted peers, despite the short duration
of a conversation (e.g., Cain, 2013; Grant, Gino and Hofmann, 2011). Third, more introverted individual’s
analytical nature may help them better shape and dissect the idea’s of their peers, thus improving them.
On balance, however, the strengths of extroverts—being more talkative, warm, more connected, and
willing to share knowledge—should privilege them as sources of information over introverts in the medium of
a short conversation, especially with new people. The conversations with extroverts, particularly at the very
early stages idea generation, should result in a high volume of diverse information. Thus, we hypothesize
the following:
Hypothesis 2 Individuals who converse with more extroverted peers will develop higher-quality ideas.
An Openness–Extroversion Complementarity in Ideation: While the mechanisms described above
should increase idea quality for the average innovator, more open innovators should capitalize on conver-
sations with extroverted peers more than others. Open individuals are likely to engage better with their
extroverted conversational peers who provide a high baseline flow of information (McCrae and Sutin, 2009).
Open innovators, compared with closed ones, will ask more probing questions, guide the conversation in more
useful directions, and listen more intently (McCrae, 1987). These behaviors should amplify the amount of
information that can be received from the extroverted peer. Moreover, in developing their ideas, open in-
novators will possess more of the abilities and dispositions that would help them develop higher-quality
ideas with more fluency and novelty (Karwowski et al., 2013). A higher base of external information from
the conversation will give them a richer pool of facts, emotions, ideas, opinions, and perspectives that they
can recombine into novel associations. That is, they should have more detailed ideas as well as more novel
combinations of ideas than innovators who are less open. Therefore, this complementarity between peer
7

and focal innovator personality—extroverted peers and open innovators—should lead to higher-quality ideas
than the baseline effect of just talking to more extroverted peers. Thus, we hypothesize the following:
Hypothesis 3 More open innovators (versus those more closed to experience) will generate better ideas
after talking ton more extroverted peers.
Openness-Extraversion and Team Performance
The three key predictions from the individual-level theorizing are that: (1) more open individuals will gen-
erate higher quality ideas; (2) conversing with individuals who are more extroverted (than less) will lead
to better ideas; (3) the open innovator/extroverted peer pairing will further enhance idea quality. What
do these individual level predictions mean for the ideal composition of teams tasked to build upon the in-
dividually generated ideas and develop them into a singular prototype? At the team level, we argue these
predictions replicate through two intervening processes—(a) more team-level skill in recombination and (b)
better pool of previously generated ideas and novel information.
Openness within teams: While a vast literature exists on team demography and process and its relation-
ship to team creative outcomes (e.g., Paulus, 2000; Ancona and Caldwell, 1992), the literature on how a
team’s personality composition affects outcomes is still limited (see Schilpzand, Herold and Shalley (2011) for
an exception) . However, several mechanisms lead us to reason that teams with more open members should
develop higher quality ideas. First, after generating ideas at the individual level, more open individuals
individually, and thus collectively will have a higher-quality pool of ideas from which to select. Thus a shift
in the the quality of the idea distribution to the right will increase the average quality of the idea generated.
Second, even assuming that the pool of ideas does not improve in quality, more open team members will
better recombine the extant ideas into more novel combinations, leading to more creative outcomes. Third,
the combination of an improved pool with better team-level recombinative capability should substantially
increase the resulting team-level creative product. Thus, we hypothesize:
Hypothesis 4 Teams whose members are more open to experience on average will develop higher-quality
ideas.
Prior conversations with more extroverts: In addition to the skills and ideas brought to the team by
members through their own abilities, team members also bring with them information and ideas sourced
through external conversations. Team members who have previously conversed with more extroverted peers
8

will have higher-quality previously generated ideas as well as a store of experiences, insights, and anecdotes
(H2). Relative to teams who have not spoken to more extroverted peers, those that have will begin their
idea generation process with better raw material for idea generation. A growing body of research suggests
that the distribution of ideas within a team affects its ability to innovate (Girotra, Terwiesch and Ulrich,
2010; Kavadias and Sommer, 2009; Taylor and Greve, 2006). First, teams with a higher-quality distribution
of ideas should more readily choose better ideas than teams with lower-quality ideas (Terwiesch and Loch,
2004; Dahan and Mendelson, 2001). This is especially true if they are choosing the best idea among the
ones they have access to, but it should also hold more generally. Second, teams with raw ideas that are of
high quality should also recombine them better into new ideas (Taylor and Greve, 2006). For instance, if
individual A brings back novel information from a peer conversation to the team, then another team member
B now has access to this information and can use it to generate an idea (Girotra, Terwiesch and Ulrich,
2010). Jointly, the team can engage in an innovation process where the externally accumulated information,
or the individual ideas generated from it, are team-level goods.
Hypothesis 5 Teams whose members have previously conversed with more extroverted peers will generate
higher-quality ideas.
The openness-extraversion complementarity in teams: Finally, the enhanced pool of previously
generated ideas, a larger amount of raw information from talking to those more extroverted, as well as a
team with more “creative” personality types (e.g., with more members higher in openness to experience)
point towards a better team-level idea. Nevertheless, a purely naıve assumption that groups with a higher-
quality distribution of pre-existing ideas will also develop better ideas as a group may not hold because
of group dynamics. Previous work suggests that group members may discuss redundant ideas, engage in
free riding, or be led by the common effect to discuss ideas that are shared, not different (Paulus, 2000;
Gigone and Hastie, 1993). Thus, an initial pool of high-quality information may fizzle into mediocre results.
Teams with more open members might be shielded from this fate because of their collective inquisitiveness,
openness to divergent opinions, and cognitive flexibility; thus, they can more effectively recombine the ideas
brought in by other team members (Schilpzand, Herold and Shalley, 2011). Thus, we hypothesize:
Hypothesis 6 Teams with more open members (versus more closed members) will generate better ideas if
these members have previously talked to more extroverted peers.
9

Empirical Setting and Methods
Our basic argument is that open innovators who converse with extroverted peers will generate higher-quality
ideas individually. Teams with more such individuals will also develop better ideas. Testing these predictions,
however, is difficult for four important reasons. First, unlike formal collaborations, conversations, especially
with external peers, are difficult for researchers to observe. They are rarely recorded by people participating
in them. Moreover, conversations vary dramatically in their structure, purpose, and length, and comparison
across conversations to test the impact of peer characteristics is often confounded by these variations. Second,
researchers rarely observe the dynamics of the innovation process. What is most often observed is the final
product developed by a team and rarely the ideas generated by both individuals and their team. Third, while
researchers often have data about peers’ level of education, publication records, or patents, more nuanced
measures of peer characteristics such as personality are generally difficult to gather, especially for peers with
whom an individual only has a conversation. Finally, and perhaps just as importantly, the choice of both
team and external conversational partners is endogenous and often self-selected based on peer and individual
characteristics that are unobservable to the researcher (Manski, 1993).
Experimental Design: An Innovation Competition
To overcome these empirical challenges we embedded a field experiment in the first week of an entrepreneur-
ship academy held in New Delhi, India, in July 20141. During the boot camp, 112 aspiring entrepreneurs
from across India participated in a three-week program that help them develop skills in idea generation,
design thinking, prototype design, and business model development. The ages of the 112 graduates ranged
from 18 to 36, with a mean age of just over 22. Our program had 25 women. Everyone had at least a college
degree or was enrolled in college, with 60 of the participants enrolled in a college, master’s, or PhD program.
Our program was regionally diverse, with 62 of the participants from the state of Delhi and the rest from
across India. The class was composed primarily of engineering and computer science degree holders (78),
followed by 18 business degree holders; the rest were from the arts and sciences. Eight people were enrolled
in or had graduated from advanced degree programs.
The boot camp provided instruction from leading members of India’s startup ecosystem, including suc-
cessful entrepreneurs, designers, and venture capitalists. The program was structured into three week-long
modules. The first week, which was the most structured (and on which we base this study), focused on the
1The experimental nature of the boot camp was reviewed by our university’s Institutional Review Board. All participantssigned two consent forms: an online form at the time of application and a paper-based form on the first day of the boot camp.
10

idea-generation process. To incentivize participation and effort, the three most highly rated proposals and
prototypes from this week won prizes totaling 45,000 Indian rupees (INR; 789.47 USD). The major prizes
were team based. The first prize was 20,000 INR, the second was 10,000 INR, and the third was 7,500 INR.
The prize allocation was based on the average rating received by a team’s proposal during the peer review
process, with the three highest teams winning the top three prizes. The second week focused on business
models. The final week was the least structured; participants could select their own teams of three people
from the boot camp to develop a business concept and prototype to receive up to 8,000 USD in funding and
support to implement their idea.
We used the activities from the first week and data collected before the boot camp to test our six hypothe-
ses. Before the boot camp began, we asked all participants to complete surveys, chief among which was the
44-item Big Five Inventory (John and Srivastava, 1999). All participants allowed us to collect pre-bootcamp
(thus, pre-treatment) measures of extraversion, openness to experience, neuroticism, agreeableness, and con-
scientiousness. We discuss the construction of our key variables using this inventory in the variables section
below.
The first day (Monday) was dedicated to logistics, an introduction to the program, and a short icebreaker
in a randomized group at the end of the day. We did not collect any data during this day, as it was not part
of the experimental setup for the week. The second day (Tuesday) began with individuals reporting to one
of 40 tables, where they sat with their icebreaker group and were asked to individually generate as many or
as few ideas as they wished for innovative software products for the Indian wedding industry. The text of
the prompt read as follows:
On November 27, 2011, over 60,000 weddings took place on this single day in New Delhi just
because the day was auspicious. Every wedding hall in Delhi was booked for every shift, and
families paid large premiums of at least one to two lakhs to book even the smallest halls. Even
on less auspicious days, Indian weddings are big, fun, complex, loud, colorful, and most of all,
expensive. Today, the size of the Indian wedding industry is estimated to be around 2.25 trillion
Indian rupees or 38 billion US dollars. The industry is also diverse—it includes products and ser-
vices such as marriage gardens, matchmaking, clothing, decorations, makeup, gifts, and jewelry.
Startups in India have only scratched the surface of this industry. The most prominent example is
Shaadi.com, which has revolutionized matchmaking and made many aunties across India obsolete.
Your task for this week is to develop a product concept for a mobile and web application that will
reinvent part of the wedding experience—either before, during, or after the wedding—in India.
11

On to reinventing!
We chose the Indian wedding industry as our prompt for three reasons. First, based on conversations
with Indian entrepreneurs and venture capitalists, the Indian wedding industry is large and has significant
market potential. Several venture capital firms are actively investing in software products for this large
market. The choice of the wedding industry was therefore based in part on concerns of external validity.
Second, unlike finance or biotechnology, the “Indian wedding” was something that the vast majority of
boot camp participants had experienced, but it was an industry where a subset of individuals would not
have a systematic skill or knowledge advantage. Third, we chose this industry because it was a relatively
diverse domain, composed of problems ranging from finding mates to buying wedding dresses to honeymoon
selection and even post-marital counseling. Thus, the Indian wedding context had the potential to produce
differentiation in the types and quality of ideas generated by the participants. For one hour, the participants
entered each discrete idea into a software application as short texts. Individuals generated 6.6 ideas, with
each idea having a length of approximately 505 characters. We call these ideas “pre-treatment” ideas.
Conversational peer randomization. To test our hypotheses, we randomized a set of three empathy
interviews that participants had with other members of the boot camp. These interviews are a staple of
the design-thinking approach (Kelley and Kelley, 2013). Each empathy interview lasted 14 minutes and
consisted of a random pairing between two individuals at the boot camp. We put each pair in random
and pre-assigned seats across from each other, with participants assigned (randomly) to an “A” and a “B”
position. The protocol of the interview was semi-structured, and participants were asked to learn about their
conversational peers’ experience with an Indian wedding. We began with person A interviewing and listening
to person B’s perspective for four minutes, followed by person B interviewing and listening to person A’s
perspective for the same amount of time. Next, person A was asked to “dig deeper” by asking person B more
questions for three more minutes. Person B then repeated this process with person A. During and after the
conversation, the participants could take notes about their conversation and record it in the sheet depicted
in Figure 1. After the first pairwise peer interaction, individuals were re-randomized to two more pairwise
interactions following the same structure. After all three randomizations, individuals were instructed to
return to their original assigned table and generate new ideas for one hour. Participants generated an
average of 4.5 ideas, with the average idea having 476 characters. We call these “post-treatment” ideas.
[Figure 1 about here.]
Anonymous Peer Evaluations of Individual Ideas. The next morning, from 9:30 am to 11:00 am (Wednes-
day, day 3), all participants anonymously evaluated a random subset of both the pre- and post-treatment
12

ideas of other boot camp participants. Our choice of double-blind anonymous peer evaluations arises from
three considerations. First, peer evaluation is perhaps the most common evaluation in many contexts. In
academia, research articles are evaluated by anonymous peers, as are grants (Marsh, Jayasinghe and Bond,
2008). In organizations, many decisions about products and design choices are evaluated by peers. In edu-
cation, peer evaluations are becoming increasingly common for evaluating classroom projects (Cooper and
Sahami, 2013; Reily, Finnerty and Terveen, 2009). Second, many prior studies of creativity have used peer
ratings as measures of the creative output of teams and individuals (Amabile et al., 2005, 2004). Third,
peer evaluation, particularly in this context, is superior to evaluations by external or online parties who
may not have either the incentive or the ability to effectively assess an idea’s worth. Finally, research has
indicated that peer evaluations are more accurate when evaluators are blinded to the identity of the subject.
They are also harsher and more accurate when evaluating more than three items (Marsh, Jayasinghe and
Bond, 2008; Boudreau et al., 2016). Thus, we asked individuals to rate approximately 50 ideas in three
dimensions on a 5-point Likert scale from strongly disagree to strongly agree: whether the idea was novel,
whether the product was something that the rater would buy, and whether the idea had business potential.
Each idea received approximately 6.24 ratings. The average ratings were 2.45 for business value, 2.59 for
buy likelihood, and 2.43 for novelty.
Idea development in teams. At the end of the evaluation session on day 3, individuals were randomly
assigned to teams of approximately three individuals. Within these teams, individuals worked on days 3, 4,
and 5 to develop a mock-up prototype and business plan. The teams were given the freedom to work on
any idea that they jointly chose. The idea could be one from the pre-treatment ideation session, the post-
treatment session, a combination of both, or neither. By midnight of day 5 (Friday), participants submitted
a complete project of the prototype, which included a “splash page” consisting of a graphic describing their
product, a presentation walk through of their software prototype, a text description of their product and
the problem it was intended to solve, a one-sentence description of their product, and a product name.
Final project submission evaluations On day 6 (Saturday), we assigned the 112 participants five random
and anonymous project submissions to evaluate (excluding their own). Participants evaluated their assigned
submissions using an online system where students both rated (on a 5-point Likert scale, equivalent to
the individual ideas) and ranked five randomly assigned submissions. Each team’s project therefore received
approximately 14 evaluations on 12 dimensions, including product novelty, unique insight, display of empathy
for customer needs, feasibility, business potential, as well as the quality of the prototype walk through and
splash page (Girotra, Terwiesch and Ulrich, 2010). Our results are strongly consistent across both the ratings
13

and rankings.2
Figure 2 summarizes the process of the experiment, the randomizations, and the data collection.
[Figure 2 about here.]
Testing the Individual-Level Hypotheses
Dependent variables. Our first set of hypotheses concerns the relationship between conversational peer
extraversion and the quality of post-treatment ideas generated by more open individual innovators. The key
dependent variables for this analysis derive from the anonymous peer evaluations (day 3) of the raw ideas
generated by individuals on day 2. The first of these dependent variables is Idea Quality ; it is the sum
of the evaluations an idea receives from an anonymous evaluator on the dimensions of business value, buy
likelihood, and novelty.3 To understand how our treatment changes the content of the ideas generated, we
also construct two dependent variables using the raw text of the ideas themselves. The first variable, idea
development, counts the number of unique words used by an innovator in describing their idea. Development,
as measured by unique terms, has been used in a wide variety of prior studies and has been shown to correlate
with success in a fields ranging from poetry to the hard sciences (Simonton, 1990; Feist, 1997). Our second
content-based variable, recombination, measures the extent to which the words used by an innovator in the
write-up of an idea connect disparate semantic domains. To generate our measure of recombination, we
construct a semantic similarity network between the ideas generated using the word overlaps as a measure
of connectedness. Using this semantic network, we then calculate the betweenness centrality for each idea
to measure how recombinative each idea likely is. Research on what makes products, articles and patents
successful finds that ideas that sit between different and distinct idea “domains” often represent novel
recombinations with greater potential (Hargadon and Sutton, 1997; Uzzi et al., 2013). Full details on how
we construct these text-based measures can be found in the Appendix.
Independent variables. To examine the relationship between an innovator’s openness and peer extraver-
sion on quality of the idea generated, we create three variables. First, we create a variable Openness (self)
which measures the average of an individual’s responses to the 10-item openness scale deployed before the
bootcamp. This variable is normalized to have mean 0 and standard deviation 1. Second, we create a vari-
able extraversion (Peer) which measures the average extraversion score of an individual’s three randomly
2The ranking analysis is available upon request.3While most ideas received evaluations on all dimensions, some received evaluations on only one. For the construction of Idea
Quality, we coded the score as missing if it did not receive evaluations on all three dimensions. We find no systematic relationshipbetween the variable of interest and the likelihood that a project evaluation was missing.
14

assigned conversational peers. Extraversion is calculated using the average of the the 8-item extraversion
scale, and is standardized at the individual level before being aggregated into our average peer measure.
Third, we create an interaction variable Extraversion (Peer) × Openness (Self) to test Hypothesis 3, that
open individuals especially benefit from talking with extraverted partners.
Control Variables To further assess the robustness of our results, we also control for a number of ad-
ditional variables in our models. To test that open innovators benefit from talking with extraverts, and
that it is not the case that extraverts benefit from talking with open innovators, we parallel the operations
described above and construct extraversion (Self), Openness (Peer), and Extraversion (Self) × Openness
(Peer) variables. For completeness, we also generate Openness (Self) × Openness (Peer) and Extraversion
(Self) × Extraversion (Peer) variables.
We also include three non-personality controls in our primary models that capture the ability and talent
of the participants. The first of these control is a person’s pre-treatment idea quality, the average of the
evaluations of each person’s pre-conversation ideas. This allows us to test if what matters is not openness or
extraversion, but being paired with some one who simply generates higher quality ideas. The second control
is a measure of each person’s general ability and talent as measured by their bootcamp independently
evaluated admission score.4 The admission score allows us to rule out the possibility that extraversion
is simply capturing differences in human capital and talent. The third control is each person’s educational
background; we construct a binary measure that indicates if the participant has an engineering degree. Given
the technological focus of the bootcamp, this allows us to control for familiarity and experience developing
web applications.
[Table 1 about here.]
Table 1 presents summary statistics for our dependent, independent and control variables at the individual
level. We also include the other three personality measures for completeness. As expected, the standard
deviations are smaller for the averaged personality scores of each participant’s three randomly assigned
peers. Table 6 in the Appendix provides a table of bivariate correlations. We find little evidence that a
person’s personality traits are correlated with those of their randomized peers, providing evidence that our
randomization was successful. Table 7 in the Appendix tests for balance more formally by regressing an
individual’s personality measures on the Extraversion (Peer) variable. We find no evidence for imbalance.
Modeling strategy To test our three individual-level hypotheses, we used ordered logistic regression models
4Each participants bootcamp application was rated by four independent admissions evaluators. The evaluations were on a 1 to5 scale and based on grades in college; the prestige of their college; the quality of their application essay; their skills in businesstopics such as finance, marketing, and sales; and their technical skills such as interaction design and programming.
15
to regress all evaluations e of idea d by individual i on the openness of the innovator, the randomized
conversational peers’ average level of extraversion, and the interaction. Since peers were randomly assigned
and assignment does not appear imbalanced, our estimate of Extraversion (Peer) can be interpreted as a
causal peer effect. We use ordered logistic regression since our dependent variable takes on integer values
between 3 and 15. Since we have multiple evaluations and multiple ideas for individuals i, we included fixed
effects at the evaluator level and corrected our standard errors by clustering them at the individual level.
The evaluator fixed effects increases our power by removing idiosyncratic between-evaluator differences. The
clustering reduces our power by accounting for the fact that the ideas generated by the 108 brainstorming
participants are not independent.5 We next turn to our team-level measures before discussing our results.
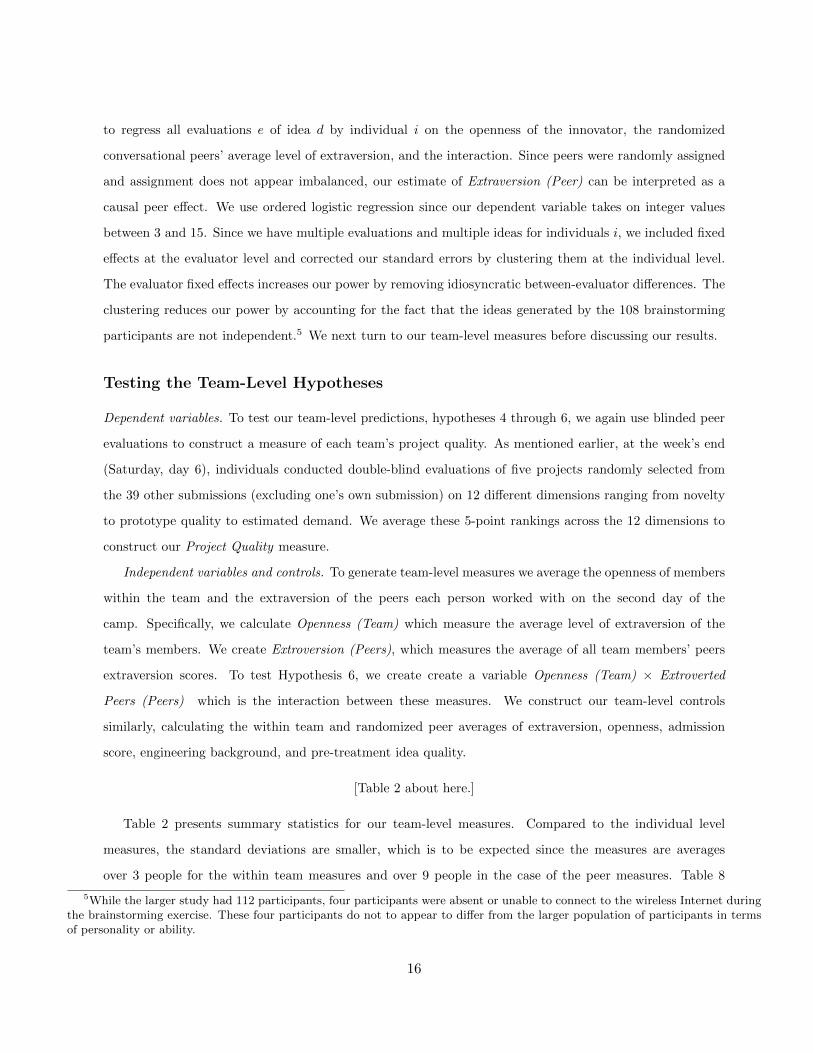
Testing the Team-Level Hypotheses
Dependent variables. To test our team-level predictions, hypotheses 4 through 6, we again use blinded peer
evaluations to construct a measure of each team’s project quality. As mentioned earlier, at the week’s end
(Saturday, day 6), individuals conducted double-blind evaluations of five projects randomly selected from
the 39 other submissions (excluding one’s own submission) on 12 different dimensions ranging from novelty
to prototype quality to estimated demand. We average these 5-point rankings across the 12 dimensions to
construct our Project Quality measure.
Independent variables and controls. To generate team-level measures we average the openness of members
within the team and the extraversion of the peers each person worked with on the second day of the
camp. Specifically, we calculate Openness (Team) which measure the average level of extraversion of the
team’s members. We create Extroversion (Peers), which measures the average of all team members’ peers
extraversion scores. To test Hypothesis 6, we create create a variable Openness (Team) × Extroverted
Peers (Peers) which is the interaction between these measures. We construct our team-level controls
similarly, calculating the within team and randomized peer averages of extraversion, openness, admission
score, engineering background, and pre-treatment idea quality.
[Table 2 about here.]
Table 2 presents summary statistics for our team-level measures. Compared to the individual level
measures, the standard deviations are smaller, which is to be expected since the measures are averages
over 3 people for the within team measures and over 9 people in the case of the peer measures. Table 8
5While the larger study had 112 participants, four participants were absent or unable to connect to the wireless Internet duringthe brainstorming exercise. These four participants do not to appear to differ from the larger population of participants in termsof personality or ability.
16
in the Appendix presents a table of correlations between these measures. Again, we find little evidence
that a team’s average personality scores are correlated with the average of the team’s randomized peers.
Table 9 in the Appendix explicitly tests for balance by regressing a team’s average personality scores on the
Extraversion (Peer) variable for the team. We find no evidence for imbalance.
Modeling strategy To test theses hypotheses, we use linear regression models to regress all evaluations e of
project p by team i on the team’s average openness, the average level of extraversion of the team member’s
randomized peers, and the interaction. As our team project quality measure is quite continuous, unlike the
evaluations at the individual level, we use standard linear regression instead of ordered logistic models. Since
we have multiple evaluations and multiple ideas for individuals i, we included fixed effects at the evaluator
level and corrected our standard errors by clustering them at the team-level.
Results
Individual-level results
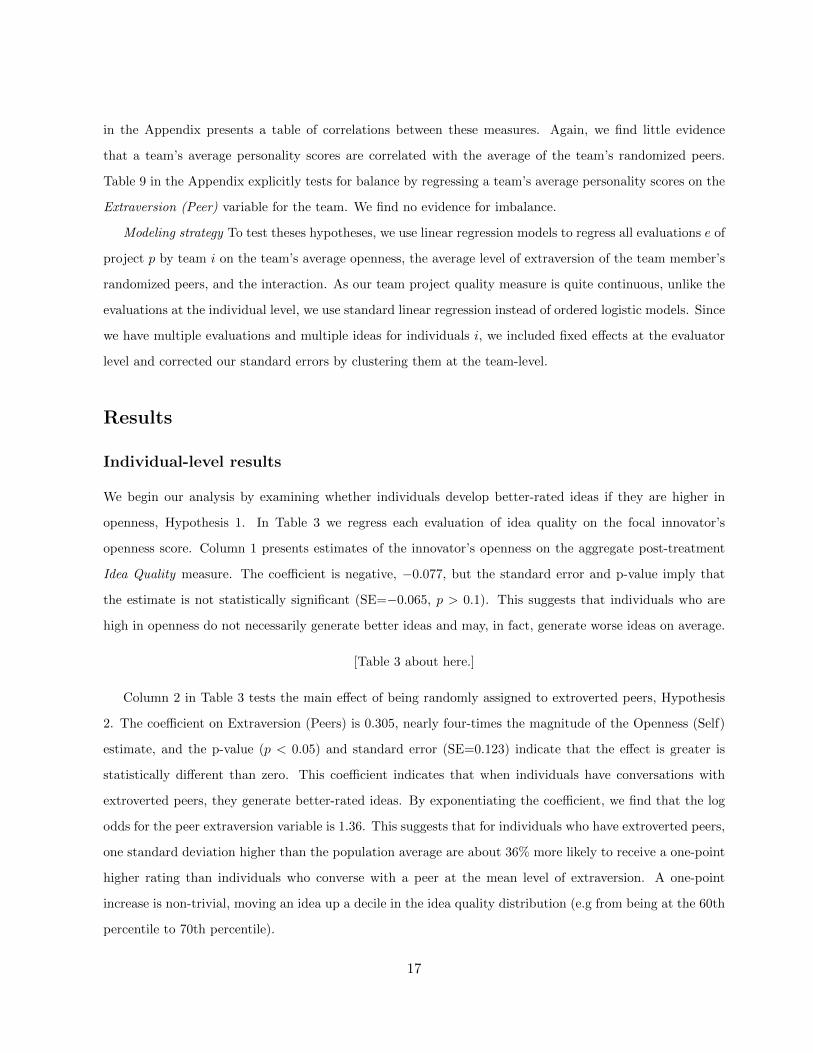
We begin our analysis by examining whether individuals develop better-rated ideas if they are higher in
openness, Hypothesis 1. In Table 3 we regress each evaluation of idea quality on the focal innovator’s
openness score. Column 1 presents estimates of the innovator’s openness on the aggregate post-treatment
Idea Quality measure. The coefficient is negative, −0.077, but the standard error and p-value imply that
the estimate is not statistically significant (SE=−0.065, p > 0.1). This suggests that individuals who are
high in openness do not necessarily generate better ideas and may, in fact, generate worse ideas on average.
[Table 3 about here.]
Column 2 in Table 3 tests the main effect of being randomly assigned to extroverted peers, Hypothesis
2. The coefficient on Extraversion (Peers) is 0.305, nearly four-times the magnitude of the Openness (Self)
estimate, and the p-value (p < 0.05) and standard error (SE=0.123) indicate that the effect is greater is
statistically different than zero. This coefficient indicates that when individuals have conversations with
extroverted peers, they generate better-rated ideas. By exponentiating the coefficient, we find that the log
odds for the peer extraversion variable is 1.36. This suggests that for individuals who have extroverted peers,
one standard deviation higher than the population average are about 36% more likely to receive a one-point
higher rating than individuals who converse with a peer at the mean level of extraversion. A one-point
increase is non-trivial, moving an idea up a decile in the idea quality distribution (e.g from being at the 60th
percentile to 70th percentile).
17

Column 3 tests our third hypothesis, that open innovators who converse with extroverts will produce
higher quality ideas. Specifically, in Column 3 we include a variable for individuals’ level of openness, the
average peer extraversion and an interaction of this variable with their peers’ average extraversion. The
coefficients on the main effects of Openness (Self) and Extraversion (Peers) remain relatively unchanged.
The coefficient on the interaction term is similar in size and significance to the Extraversion (Peers) variable.
The estimate is 0.300 and the standard error of (0.142) and p-value (p < 0.05) indicate the effect can be
distinguished from zero. The coefficient indicates that individuals who are one-standard deviation higher
in openness get twice the benefit when they talk with extroverts. Furthermore, since the main effect of
Openness (Self) is a fourth the size of the interaction effect, we find that open individuals do generate better
ideas but only after they have had conversations with extroverts.
Column 4 builds on the model in Column 3 by including the full set of self-peer interactions between
extraversion and openness. This model allows us to check the robustness of our results in the face of
alternative self-peer personality interactions. Including the additional interactions increases the magnitude
of the coefficients on Extraversion (Peers) and its interaction with Openness (Self) and does not meaningfully
change the width of the estimated standard errors. Consistent with our expectations that those who share
large volumes of information may not be listening, the estimate on Extraversion (Self) is negative at −.103
(SE = .066, p > 0.1) though not significant at conventional levels. Furthermore, having peers high in
openness does not appear to help an innovator generate better ideas. The estimate on the Openness (self)
measure is −.219 (SE = 0.106, p < 0.05). Thus the matching appears to be asymmetric, open innovators
matching with extraverts perform better while their extraverted partners perform worse, especially when
matched with a peer who is open.
Column 5 includes our three non-personality ability measures to further assess robustness. The first
control is pre-treatment idea quality, the average of the evaluations of each person’s pre-conversation ideas.6
The second control is our measure of each person’s estimated generalized ability as measured by their
admission score. The third control is our dummy for if the individual has or is pursuing an engineering
degree. Including these controls at the self and peer level does not substantively change our primary results.
Thus it does not appear that our results are driven by the peer’s pre-treatment idea quality, their talent or
educational backgrounds. It is not necessarily the quality of the peer, but it appears to be the fact that the
peer is sharing a large volume of varied information.
To further test our argument that talking with extroverts, especially for innovators high in openness,
6We have complete observations for all 108 brainstorming participants, except for one individual who only participated in thepost-treatment brainstorming session. In Column 9 we drop this person’s 9 idea evaluation from the analysis.
18

results in the transfer of larger amounts of varied information and so the generation of more developed
and recombinative ideas we next turn to analyzing the text of the idea itself. Specifically, we test if our
treatment effects shape how how developed and recombinative an idea is and if these changes mediate the
effects on idea quality. Tables 4 presents results from this analysis, allowing us to see if our hypothesized
causal pathway is present.
[Table 4 about here.]
In Column 1 of Table 4 we test if our treatment affected an idea’s development. We regress an idea’s
development score (the log of the number of unique terms) on Openness (Self), Extraversion (Peers), the
interaction, and the average development score of the innovator’s pre-treatment ideas.7 Similar to the models
in Table 3, we find that the coefficients on Extraversion (Peers) and its interaction with Openness (Self)
are positive and similar in magnitude. A one-standard deviation increase in Extraversion (Peers) increases
the number of unique terms in the idea by 0.38 standard deviations (SE = 0.160, p < 0.05) and the effect
appears larger for those higher in Openness, increasing the number of unique terms used by an additional
0.34 standard deviations (SE = 0.205, p < 0.1). Column 2 tests the effects on recombination and finds
similar results with an one-standard deviation increase in Extraversion (Peers) leading to an increase in an
idea’s recombination score of 0.245 standard deviations (SE = 0.118, p < 0.05) and with the effect increasing
by another 0.24 for innovators high in openness (SE = 0.138, p < 0.1). We find evidence that talking with
extroverts, especially for those high in openness, results in more developed and more recombinative ideas.
In Column 3 we examine if higher recombination and development scores are associated with better
evaluations. Indeed, we find that idea’s with higher development scores are better ideas. A one standard-
deviation increase in an idea’s development score leads to an increase in idea quality of 0.314 points (SE =
0.076, p < 0.01). We find a somewhat weaker but significant effect for recombination, with a one-standard
deviation increase improving idea quality by 0.195 points (SE = 0.096, p < 0.05).
At the bottom of Column 3 we report the results of our formal mediation analysis (Baron and Kenny,
1986). Specifically, our mediation analysis tests if the effect of Extraversion (Peers) and Openness (Self)
X Extraversion (Peers) is mediated by recombination and development. Using a multiple-mediation model
we show that it is, though primarily through our measure of development. The total effect of Extraversion
(Peers) and Openness (Self) X Extraversion (Peers) on Idea Quality is 0.806 (SE = 0.243, p < 0.01). Of this
effect, we estimate that 0.31 (about 38%) is mediated by development and recombination (SE = 0.112, p <
7Three ideas, which each received 5 evaluations, used only very common words and so after parsing the text ended up havingzero terms. For these terms, the recombination score could not be calculated since betweenness cannot be calculated for isolatesin the semantic network. We drop these 15 observations from our analysis.
19

0.05). Examining each measure separately, we find that roughly 85% of the mediated effect appears to
flow through development and about 15% of the quality effect may come from recombination, though the
indirect effect through recombination is not statistically significant. However, our measures of development
and recombination are quite correlated. This correlation makes simultaneously identifying the two effects
empirically challenging. That said, the models in Table 4 provide evidence for our causal pathway: talking
with extroverts, especially for innovator’s high in openness, leads to developed and recombinative ideas which
in turns leads to higher quality ideas.
We report a number of additional robustness tests in the Appendix. Appendix Table 10 replicates
Table 3 using Ordinary Least Squares instead of ordered logistic regression to check that the interaction
effect between Openness (Self) and Extraversion (Peers) is not an artifact of the non-linear specification
(e.g., Ai and Norton, 2003). We find evidence for the interaction effect in the linear specification, and in
further robustness checks we find that plots of our interaction terms are consistent over the range of the
data. In Appendix Table 11 we test if what matters is not the extraversion of an innovator’s peers, but the
neuroticism, conscientiousness, agreeableness, or self-monitoring of the peers. These measures are largely
insignificant, even when interacted with the innovator’s openness. Furthermore, they do not meaningfully
change the coefficients on our openness and extraversion measures. Appendix Table 12 tests if idea generation
is improved not by talking with extroverts only, but by talking with a mix of extroverts and introverts or
by talking first to extraverts and then to intraverts. We test for the value of talking to a mix of peers by
including the standard deviation of extraversion; we test for potential order or sequence effects by separately
including in our regression model the peer extraversion of an innovator’s first, second and third conversation
partner. We find little evidence for either. Appendix Table 13 tests if the effects on idea quality impact each
of the underlying dimensions of novelty, business, and buy ratings. We find our effects hold across these
dimensions. Finally, Appendix Table 9 includes controls for if the idea evaluator knows, is friends with, or
provides advice with the participant who generated the idea. While the evaluations did not include any
information about who generated the idea, perhaps people were able to determine who generated the idea
and favored their friends. Controlling for the evaluator-innovator relationship status does not impact our
findings. We find little evidence that evaluators provided their friends with better scores.
Team-level results
Our second set of hypotheses concerns the relationships between team openness, inter-team peer extraversion,
and if their is a complementarity between these two measures. Similar to our individual level analysis, we
20

regress measures of each team’s final project quality on the team-level measures of peer extraversion, team
member openness, and their interaction. Table 5 presents our results. All models include evaluator fixed
effects and cluster standard errors at the team level.
[Table 5 about here.]
Column 1 in Table 5 regresses the project quality score on team-level measures of our key independent
variables. Our results provide modest support for Hypothesis 4 that team’s with members higher in Openness
generate higher quality projects, with a point estimate of 0.124 (SE = 0.063, p < 0.10). It appears a team
with a one-standard deviation higher openness average will generate projects that are about 0.58 standard
deviations higher in project quality. Column 2 in Table 5 regresses project quality on the average extraversion
of the 9 people each team member talked to during the second day brainstorming exercise. We find little
evidence for any effect, though the coefficient is positive. Column 3 includes the Openness (Team) ×
Extraversion (Peers) term. We find strong evidence for Hypothesis 6.= The coefficient is 0.311 (SE =
0.162, p < 0.05) positive, significant, and meaningful in magnitude; about 2.5 times larger in magnitude
than the Openness (Team) measure.
Columns 4 and 5 in Table 5 test if these results are robust to the inclusion of additional personality
measures and ability measures. In Column 4, which includes the full set of extraversion and openness
interactions, we find that the results remain relatively unchanged, though the magnitude of the interaction
term increases in size. The model reported in Column 5 includes the team’s and peers’ average admission
score, pre-treatment idea quality, and if they have an engineering degree. While none of the ability measures
are significant, inclusion appears to increase our power: the coefficient on Extraversion (Peers) increases in
magnitude to 0.183 and becomes statistically significant (SE = 0.083, p < 0.05). In this final model, we find
evidence for all our team-level hypotheses.
We report further robustness tests in the Appendix. Specifically, in Appendix Table 15 we test if what
matters for project quality is having a mix of open and closed members in a team or talking to a mix
of extraverts and intraverts. Our effects remain largely unchanged when including the standard deviation
of team openness or the standard deviation of peer extraversion. It does not appear that extraversion or
openness diversity drives differences in a team’s project quality.
21

Discussion
In this article, we propose and empirically test a micro-network theory of information acquisition and idea
generation by enriching the fundamental building-block of a network theory of creativity–dyadic conversa-
tions. Our model incorporates personality theory to specify both the personality of the innovator—openness
to experience—as well as the personality of her conversational peer—extraversion—most conducive to gen-
erating high-quality ideas. Further, we theorize how these individual-level mechanisms aggregate to the level
of teams.
Contrary to prior research, we find that being open to experience alone does not lead individuals to
generate better ideas (e.g. McCrae, 1987; Feist, 1998). Our findings suggest that this individual capability
depends on the types of peers with whom a focal innovator converses. When open innovators are exposed
to extroverted peers, they are more likely to develop higher quality ideas–ones that are evaluated higher, are
more detailed, and have more distinct word usage compared to other ideas. Conversely, more open innovators
whose peers are not extroverted appear to produce mostly average ideas. In terms of magnitude, while this
effect alone will not make the lowest-quality ideas the best ones, it can shift ideas at the margins of “good”
to “very good” or “very good” to “great.” This is equivalent of moving an idea from being at the 80th
percentile of quality to being in the top decile. Overall, our findings highlight the importance for considering
the specific nature of social inputs in to the production of good ideas. Moreover, this insight—about the
value of a dyadic interaction for information acquisition and ideation—can fruitfully be used to design teams
that have a preponderance of those individuals who can help develop high-quality ideas within teams.
This study holds several implications for organizational research, particularly the role that social inter-
action plays in the generation of novel ideas at the level of both the team and the individual. The primary
contribution of this article is the embedding of social-psychological processes in a structural model of inno-
vation. First, we build on the work of micro-network scholars (e.g., Kilduff and Krackhardt, 2008, 1994) who
have highlighted the importance of incorporating individual differences into structural theories of action (e.g.,
Fleming, Mingo and Chen, 2007; Burt, 2004). Our model pushes the micro-network approach forward along
two directions—(a) by extending micro-network mechanisms beyond network formation to their effects on
performance and (b) by showing the the personality of alters—in addition to the focal actor or ego—shapes
network processes. Second, our work provides a multi-level perspective on team performance—(a) by eluci-
dating how individual and network level processes of idea generation can be used to shape the demography
of teams and (b) further highlighting the critical role of personality in team performance, both within the
team and of external ties (Schilpzand, Herold and Shalley, 2011).
22

In terms of managerial implications, there are at least three. First, managers should seek out team
members who are more open. Our findings and the findings of other scholars suggest that more open
team members help the team develop better ideas (Schilpzand, Herold and Shalley, 2011; Neuman, Wagner
and Christiansen, 1999). Second, innovators who are interested in developing new ideas should seek out
conversational partners who have traits that are correlated with extroversion: large networks, higher verbal
fluency, and a willingness to share. Finally, if potential alters possess valuable insight and knowledge but are
not extroverted, then innovators should devise other strategies for communication besides short interactions.
Such alternative approaches to interaction—longer conversations, perhaps over multiple occasions—may
yield high value (Cain, 2013; Grant, Gino and Hofmann, 2011).
Our study also contributes to the literature from a methodological perspective. In this article, we
used data from a field setting (an entrepreneurship boot camp) in which we embedded a randomized field
experiment. By randomizing social interaction, namely external peer conversations and team assignments, as
well as measuring detailed data ideation and individual characteristics, we could trace a nuanced and dynamic
process from its earliest inception (a conversation with an external peer) to the performance of teams several
days after. While the specific context of our study is not generalizable to all contexts, longer field experiments
with a subset of the methodological innovations introduced in our study could be used to study, for instance,
how external peer conversation affects the success of startups in more naturalistic contexts. This can be
accomplished, for example, by working with incubators to facilitate external conversations between startups
or an external pool of entrepreneurs, venture capitalists, and customers.
In conclusion, we note several limitations, both theoretical and empirical, of the present study. First,
we have narrowed in on a concrete social interaction and specific personality traits (Perry-Smith and Man-
nucci, 2015). However, it is likely that a more general theoretical account would require us to think more
about how our proposed mechanisms should or should not vary depending on task content, incentives, and
organizational cultures (Sauermann and Cohen, 2010; Sørensen, 2002). Second, we have also constrained
conversations to those that are one-off and short; such a constraint may play to the strengths of extroverts
(Cain, 2013). Introverts may be as valuable, or perhaps more valuable, if the interaction is ongoing or longer
(Grant, Gino and Hofmann, 2011). Thus, future theory must extend the types of social interactions studied.
Third, our theory and empirics are limited in examining only singular facets of both peer and focal innovator
personalities—e.g., extraversion and openness. However, different facets of a individuals personality may
jointly shape how they behave in certain situations or when different incentives are at play. Extroverts who
are neurotic may behave differently in highly competitive situations, as compared to extroverts that are not.
In terms of empirical limitations, our findings, though benefiting from randomized peer interaction and de-
23
tailed measurement, rely on a very specific context: an entrepreneurship boot camp held in New Delhi, India.
Thus, our findings may not have broad generalizability outside of the entrepreneurial context. Although our
findings are internally consistent and we have ruled out many possible mechanisms and confounders through
our research design and measurement, more research needs to be conducted to pinpoint the set of actual
mechanisms at play. Finally, we think that future theory and empirical analysis should account for the types
of personalities present a person’s networks in more naturalistic settings (Feiler and Kleinbaum, 2015). For
instance, it would be interesting to understand whether some individuals’ networks have more of the types
of personalities that would give them access to useful information for ideation than others.
Several opportunities exist for extending our results and adding even further nuance. One key limi-
tation of this study is that the conversations between the focal individual and the peer are not captured
(McFarland, Jurafsky and Rawlings, 2013). Thus, we are limited to inferring the nature and volume of the
information transmitted based on our understanding of the structure of the interaction and psychological
theory. Similarly, other types of measurement of interpersonal interaction are likely to give greater depth to
our theories. Another possibility for extending the work in this paper is to take the idea of matching and
formally incorporate it into our empirical tests. In this article, we used randomization to create variation in
peer and focal individual characteristics within a set of pairings. Matches are therefore a by-product of the
randomization process and not explicitly designed. Future studies, particularly for match effects estimated
in purely randomized contexts, should be designed to see whether these effects hold with experiments de-
signed to specifically test them against a stronger null. Recent work by Carrell, Sacerdote and West (2013)
suggested that implementing policy based on findings from randomized studies may not necessarily yield
expected results due to interpersonal dynamics. Further, we have have modeled the impact of our constructs
on the mean of the evaluations received by an individual’s or team’s ideas. However, social interaction may
also shift the distribution of the types of ideas generated, perhaps reducing or increasing variance in quality,
reactions or content. An exciting direction for future research would be to model higher order moments of
the idea distribution. Finally, an important future direction for this research is studying the implications of
our findings on a macro scale: more connections between individuals and organizations increase the over-
all innovative capabilities of ecosystems and regions (Saxenian, 1996). The ideal situation would be that
network ties such as the ones created here increase performance for all members and not just reshuffle the
outcome distribution.
24

References
Ai, Chunrong and Edward C Norton. 2003. “Interaction terms in logit and probit models.” Economics letters80(1):123–129.
Amabile, Teresa M, Elizabeth A Schatzel, Giovanni B Moneta and Steven J Kramer. 2004. “Leader behaviors andthe work environment for creativity: Perceived leader support.” The Leadership Quarterly 15(1):5–32.
Amabile, Teresa M, Sigal G Barsade, Jennifer S Mueller and Barry M Staw. 2005. “Affect and creativity at work.”Administrative Science Quarterly 50(3):367–403.
Ancona, Deborah Gladstein and David F Caldwell. 1992. “Demography and design: Predictors of new product teamperformance.” Organization Science 3(3):321–341.
Asendorpf, Jens B and Susanne Wilpers. 1998. “Personality effects on social relationships.” Journal of Personalityand Social Psychology 74(6):1531–1544.
Baer, Markus and Greg R Oldham. 2006. “The curvilinear relation between experienced creative time pressure andcreativity: moderating effects of openness to experience and support for creativity.” Journal of Applied Psychology91(4):963–970.
Baron, Reuben M and David A Kenny. 1986. “The moderator–mediator variable distinction in social psychologicalresearch: Conceptual, strategic, and statistical considerations.” Journal of Personality and Social Psychology51(6):1173–1182.
Barron, Frank and David M Harrington. 1981. “Creativity, intelligence, and personality.” Annual Review of Psychol-ogy 32(1):439–476.
Beukeboom, Camiel J, Martin Tanis and Ivar E Vermeulen. 2013. “The Language of Extraversion Extraverted PeopleTalk More Abstractly, Introverts Are More Concrete.” Journal of Language and Social Psychology 32(2):191–201.
Blank, Steve. 2013. “Why the lean start-up changes everything.” Harvard Business Review 91(5):63–72.
Boudreau, Kevin J, Eva C Guinan, Karim R Lakhani and Christoph Riedl. 2016. “Looking Across and LookingBeyond the Knowledge Frontier: Intellectual Distance, Novelty, and Resource Allocation in Science.” ManagementScience 62(10):2765–2783.
Brown, Tim et al. 2008. “Design thinking.” Harvard Business Review 86(6):84.
Burke, LA and LA Witt. 2002. “Moderators of the openness to experience-performance relationship.” Journal ofManagerial Psychology 17(8):712–721.
Burt, R. S. 2004. “Structural holes and good ideas.” American Journal of Sociology 110(2):349–399.
Burt, Ronald S. 2012. “Network-related personality and the agency question: Multirole evidence from a virtualworld1.” American Journal of Sociology 118(3):543–591.
Cain, Susan. 2013. Quiet: The power of introverts in a world that can’t stop talking. Broadway Books.
Carrell, Scott E, Bruce I Sacerdote and James E West. 2013. “From natural variation to optimal policy? Theimportance of endogenous peer group formation.” Econometrica 81(3):855–882.
Casciaro, Tiziana. 1998. “Seeing things clearly: Social structure, personality, and accuracy in social network percep-tion.” Social Networks 20(4):331–351.
Casciaro, Tiziana and Miguel Sousa Lobo. 2008. “When competence is irrelevant: The role of interpersonal affect intask-related ties.” Administrative Science Quarterly 53(4):655–684.
Cooper, Steve and Mehran Sahami. 2013. “Reflections on Stanford’s MOOCs.” Communications of the ACM 56(2):28–30.
25

Cuperman, Ronen and William Ickes. 2009. “Big Five predictors of behavior and perceptions in initial dyadic inter-actions: Personality similarity helps extraverts and introverts, but hurts ?disagreeables?.” Journal of Personalityand Social Psychology 97(4):667–684.
Dahan, Ely and Haim Mendelson. 2001. “An extreme-value model of concept testing.” Management Science47(1):102–116.
de Vaan, Mathijs, Balazs Vedres and David Stark. 2015. “Game Changer: The Topology of Creativity.” AmericanJounral of Sociology 120(4):1144–1194.
De Vries, Reinout E, Bart Van den Hooff and Jan A de Ridder. 2006. “Explaining knowledge sharing the role ofteam communication styles, job satisfaction, and performance beliefs.” Communication Research 33(2):115–135.
Fang, Ruolian, Blaine Landis, Zhen Zhang, Marc H Anderson, Jason D Shaw and Martin Kilduff. 2015. “Inte-grating personality and social networks: A meta-analysis of personality, network position, and work outcomes inorganizations.” Organization Science 26(4):1243–1260.
Feiler, Daniel C and Adam M Kleinbaum. 2015. “Popularity, similarity, and the network extraversion bias.” Psycho-logical Science 26(5):593–603.
Feist, G J. 1997. “Quantity, quality, and depth of research as influences on scientific eminence: Is quantity mostimportant?” Creativity Research Journal 10(4):325–335.
Feist, Gregory J. 1998. “A meta-analysis of personality in scientific and artistic creativity.” Personality and SocialPsychology Review 2(4):290–309.
Feist, Gregory J. 1999. “14 The Influence of Personality on Artistic and Scientific Creativity.” Handbook of creativityp. 273.
Fleming, Lee. 2001. “Recombinant uncertainty in technological search.” Management Science 47(1):117–132.
Fleming, Lee, Santiago Mingo and David Chen. 2007. “Collaborative brokerage, generative creativity, and creativesuccess.” Administrative Science Quarterly 52(3):443–475.
Forret, Monica L and Thomas W Dougherty. 2001. “Correlates of networking behavior for managerial and professionalemployees.” Group & Organization Management 26(3):283–311.
Funder, David C and Carl D Sneed. 1993. “Behavioral manifestations of personality: an ecological approach tojudgmental accuracy.” Journal of Personality and Social Psychology 64(3):479–490.
Furnham, Adrian and Velicia Bachtiar. 2008. “Personality and intelligence as predictors of creativity.” Personalityand Individual Differences 45(7):613–617.
George, Jennifer M and Jing Zhou. 2001. “When openness to experience and conscientiousness are related to creativebehavior: an interactional approach.” Journal of Applied Psychology 86(3):513–524.
Gigone, Daniel and Reid Hastie. 1993. “The common knowledge effect: Information sharing and group judgment.”Journal of Personality and Social Psychology 65(5):959–974.
Girotra, Karan, Christian Terwiesch and Karl T Ulrich. 2010. “Idea generation and the quality of the best idea.”Management Science 56(4):591–605.
Granovetter, M. S. 1973. “The Strength of Weak Ties.” American Journal of Sociology 78(6):1360–1380.
Grant, Adam M, Francesca Gino and David A Hofmann. 2011. “Reversing the extraverted leadership advantage:The role of employee proactivity.” Academy of Management Journal 54(3):528–550.
Hammond, Michelle M, Nicole L Neff, James L Farr, Alexander R Schwall and Xinyuan Zhao. 2011. “Predictors ofindividual-level innovation at work: A meta-analysis.” Psychology of Aesthetics, Creativity, and the Arts 5(1):90–105.
26

Hargadon, A and R I Sutton. 1997. “Technology brokering and innovation in a product development firm.” Admin-istrative Science Quarterly 42(4):716–749.
John, Oliver P and Sanjay Srivastava. 1999. “The Big Five trait taxonomy: History, measurement, and theoreticalperspectives.” Handbook of personality: Theory and research 2(1999):102–138.
Karwowski, Maciej, Izabela Lebuda, Ewa Wisniewska and Jacek Gralewski. 2013. “Big Five Personality Traits asthe Predictors of Creative Self-Efficacy and Creative Personal Identity: Does Gender Matter?” The Journal ofCreative Behavior 47(3):215–232.
Kavadias, Stylianos and Svenja C Sommer. 2009. “The effects of problem structure and team diversity on brain-storming effectiveness.” Management Science 55(12):1899–1913.
Kelley, Tom and David Kelley. 2013. Creative confidence: Unleashing the creative potential within us all. CrownBusiness.
Kilduff, M. and D. Krackhardt. 1994. “Bringing the Individual Back in - a Structural-Analysis of the Internal Marketfor Reputation in Organizations.” Academy of Management Journal 37(1):87–108.
Kilduff, Martin and David Krackhardt. 2008. Interpersonal networks in organizations: Cognition, personality, dy-namics, and culture. Vol. 30 Cambridge University Press.
Kim, Kyung Hee. 2006. “Can we trust creativity tests? A review of the Torrance Tests of Creative Thinking (TTCT).”Creativity Research Journal 18(1):3–14.
Landis, Blaine. 2016. “Personality and social networks in organizations: A review and future directions.” Journal ofOrganizational Behavior 37(1):107–121.
LePine, Jeffrey A, Jason A Colquitt and Amir Erez. 2000. “Adaptability to changing task contexts: Effects of generalcognitive ability, conscientiousness, and openness to experience.” Personnel Psychology 53(3):563–593.
Manning, Christopher D and Hinrich Schutze. 1999. Foundations of statistical natural language processing. Vol. 999MIT Press.
Manski, C.F. 1993. “Identification of endogenous social effects: The reflection problem.” The Review of EconomicStudies 60(3):531–542.
Marsh, Herbert W, Upali W Jayasinghe and Nigel W Bond. 2008. “Improving the peer-review process for grantapplications: reliability, validity, bias, and generalizability.” American Psychologist 63(3):160–168.
Matzler, Kurt, Birgit Renzl, Julia Muller, Stephan Herting and Todd A Mooradian. 2008. “Personality traits andknowledge sharing.” Journal of Economic Psychology 29(3):301–313.
McCrae, Robert R. 1987. “Creativity, divergent thinking, and openness to experience.” Journal of Personality andSocial Psychology 52(6):1258–1265.
McCrae, Robert R. 1996. “Social consequences of experiential openness.” Psychological Bulletin 120(3):323–337.
McCrae, Robert R and Angelina R Sutin. 2009. “Openness to experience.” Handbook of Individual Differences inSocial Behavior pp. 257–273.
McCrae, Robert R and Oliver P John. 1992. “An introduction to the five-factor model and its applications.” Journalof Personality 60(2):175–215.
McCrae, Robert R and Paul T Costa. 1980. “Openness to experience and ego level in Loevinger’s Sentence CompletionTest: Dispositional contributions to developmental models of personality.” Journal of Personality and SocialPsychology 39(6):1179–1190.
McFarland, Daniel A, Dan Jurafsky and Craig Rawlings. 2013. “Making the Connection: Social Bonding in CourtshipSituations.” American Journal of Sociology 118(6):1596–1649.
27

Mehra, A., M. Kilduff and D. J. Brass. 2001. “The social networks of high and low self-monitors: Implications forworkplace performance.” Administrative Science Quarterly 46(1):121–146.
Neubert, Mitchell J and Simon Taggar. 2004. “Pathways to informal leadership: The moderating role of gender onthe relationship of individual differences and team member network centrality to informal leadership emergence.”The Leadership Quarterly 15(2):175–194.
Neuman, George A, Stephen H Wagner and Neil D Christiansen. 1999. “The relationship between work-team per-sonality composition and the job performance of teams.” Group & Organization Management 24(1):28–45.
Oldham, Greg R and Anne Cummings. 1996. “Employee creativity: Personal and contextual factors at work.”Academy of Management Journal 39(3):607–634.
Paulus, Paul. 2000. “Groups, teams, and creativity: The creative potential of idea-generating groups.” AppliedPsychology 49(2):237–262.
Perry-Smith, Jill and Pier Vittorio Mannucci. 2015. “From creativity to innovation: The social network drivers ofthe four phases of the idea journey.” Academy of Management Review 42(1):59–79.
Pollet, Thomas, Sam Roberts and Robin Dunbar. 2011. “Extraverts have larger social network layers.” Journal ofIndividual Differences 32(3):161–169.
Reily, Ken, Pam Ludford Finnerty and Loren Terveen. 2009. Two peers are better than one: aggregating peer reviewsfor computing assignments is surprisingly accurate. In Proceedings of the ACM 2009 international conference onSupporting group work. ACM pp. 115–124.
Sasovova, Zuzana, Ajay Mehra, Stephen P Borgatti and Michaela C Schippers. 2010. “Network churn: The effectsof self-monitoring personality on brokerage dynamics.” Administrative Science Quarterly 55(4):639–670.
Sauermann, Henry and Wesley M Cohen. 2010. “What makes them tick? Employee motives and firm innovation.”Management Science 56(12):2134–2153.
Saxenian, AnnaLee. 1996. Regional advantage. Harvard University Press.
Schilpzand, Marieke Catharine, David M Herold and Christina E Shalley. 2011. “Members’ openness to experienceand teams’ creative performance.” Small Group Research 42(1):55–76.
Simonton, Dean Keith. 1990. “Lexical choices and aesthetic success: A computer content analysis of 154 Shakespearesonnets.” Computers and the Humanities 24(4):251–264.
Simonton, Dean Keith. 1999. Origins of genius: Darwinian perspectives on creativity. Oxford University Press.
Singh, Jasjit and Lee Fleming. 2010. “Lone inventors as sources of breakthroughs: Myth or reality?” ManagementScience 56(1):41–56.
Smith, Edward Bishop, Tanya Menon and Leigh Thompson. 2012. “Status differences in the cognitive activation ofsocial networks.” Organization Science 23(1):67–82.
Sørensen, Jesper B. 2002. “The strength of corporate culture and the reliability of firm performance.” AdministrativeScience Quarterly 47(1):70–91.
Taylor, Alva and Henrich R Greve. 2006. “Superman or the fantastic four? Knowledge combination and experiencein innovative teams.” Academy of Management Journal 49(4):723–740.
Terwiesch, Christian and Christoph H Loch. 2004. “Collaborative prototyping and the pricing of custom-designedproducts.” Management Science 50(2):145–158.
Torrance, E Paul. 1972. “Predictive validity of the Torrance Tests of Creative Thinking.” The Journal of CreativeBehavior 6(4):236–252.
28

Totterdell, Peter, David Holman and Amy Hukin. 2008. “Social networkers: Measuring and examining individualdifferences in propensity to connect with others.” Social Networks 30(4):283–296.
Uzzi, Brian, Satyam Mukherjee, Michael Stringer and Ben Jones. 2013. “Atypical combinations and scientific impact.”Science 342(6157):468–472.
Watson, David and Lee Anna Clark. 1997. “Extraversion and its positive emotional core.” Handbook of PersonalityPsychology pp. 767–793.
Williams, Scott David. 2004. “Personality, attitude, and leader influences on divergent thinking and creativity inorganizations.” European Journal of Innovation Management 7(3):187–204.
29

Figure 1: Note-taking sheet for each empathy interview.
30

Figure 2: Visual summary of experimental procedure and data collection.
31

Table 1: Summary statistics at the individual participant level
count mean sd min max
Average Idea Quality (Self) 108 7.696 1.245 5.000 12.000
Extraversion (Self) 108 -0.025 1.005 -2.988 2.291Openness (Self) 108 0.018 1.010 -2.953 1.986Conscientious (Self) 108 0.011 0.988 -2.211 2.359Agreeableness (Self) 108 -0.008 0.998 -2.646 2.066Neuroticism (Self) 108 0.018 1.005 -2.212 2.237Admission Score (Self) 108 -0.009 1.016 -2.284 1.777Engineer (Self) 108 0.713 0.454 0.000 1.000Pre-treatment Idea Quality (Self) 107 2.544 0.327 1.759 4.022
Extraversion (Peers) 108 0.002 0.569 -1.841 1.603Openness(Peers) 108 0.031 0.596 -1.142 1.492Conscientious (Peers) 108 0.004 0.613 -1.380 1.866Agreeableness (Peers) 108 0.020 0.603 -1.524 1.589Neuroticism (Peers) 108 -0.037 0.574 -1.808 1.159Admission Score (Peers) 108 0.005 0.574 -1.269 1.342Engineer (Peers) 108 0.686 0.270 0.000 1.000Pre-treatment Idea Quality (Peers) 108 2.539 0.180 2.114 3.096
Observations 108
Table 2: Summary statistics at the team level.
count mean sd min max
Average Project Quality (Team) 40 2.791 0.205 2.439 3.294
Extraversion (Team) 40 0.008 0.624 -1.267 1.144Openness (Team) 40 0.015 0.567 -1.142 1.368Conscientious (Team) 40 0.004 0.550 -1.103 1.321Agreeableness (Team) 40 -0.004 0.626 -1.300 1.168Neuroticism (Team) 40 0.005 0.631 -1.201 1.361Admission Score (Team) 40 -0.009 0.534 -1.124 1.051Engineer (Team) 40 0.702 0.275 0.000 1.000Pre-treatment idea quality (Team) 40 2.544 0.156 2.191 2.919
Extraversion (Peers) 40 -0.002 0.355 -0.846 0.838Openness (Peers) 40 0.021 0.361 -0.731 0.806Conscientious (Peers) 40 -0.009 0.399 -1.048 0.717Agreeableness (Peers) 40 -0.002 0.389 -0.839 0.894Neuroticism (Peers) 40 -0.046 0.328 -1.178 0.507Admission Score (Peers) 40 0.005 0.413 -0.931 0.939Engineer (Peers) 40 0.700 0.158 0.389 1.000Pre-treatment idea quality (Peers) 40 2.532 0.099 2.282 2.766
Observations 40
32

Table 3: Do conversations with extroverted peers increase an open individual’s idea quality?
Dependent variable:Idea Quality
(1) (2) (3) (4) (5)
Openness (Self) -0.077 -0.092 -0.074 -0.111∗∗
(0.065) (0.060) (0.060) (0.056)
Extraversion (Peers) 0.305∗∗ 0.323∗∗∗ 0.428∗∗∗ 0.371∗∗∗
(0.123) (0.109) (0.117) (0.104)
Openness (Self) × Extraversion (Peers) 0.300∗∗ 0.342∗∗ 0.328∗∗
(0.142) (0.153) (0.141)
Extraversion (Self) -0.103(0.066)
Openness(Peers) -0.220∗∗
(0.106)
Openness (Self) × Openness (Peers) 0.023(0.137)
Extraversion (Self) × Openness (Peers) -0.138(0.149)
Extraversion (Self) × Extraversion (Peers) -0.177(0.158)
Pre-Treatment Idea Quality (Self) 0.456∗
(0.247)
Pre-treatment Idea Quality (Peers) 0.314(0.378)
Admission Score (Self) 0.013(0.059)
Admission Score (Peers) 0.199∗
(0.107)
Engineer (Self) -0.158(0.152)
Engineer (Peers) -0.045(0.283)
Observations 1150 1150 1150 1150 1141
Standard errors in parenthesesOrdered Logistic Regression with evaluator fixed effects.All tests are two tailed. Standard errors clustered at the individual innovator level.∗ p < 0.10, ∗∗ p < 0.05, ∗∗∗ p < 0.01
33

Table 4: Do conversations with extroverted peers change the content of an individual’s ideas?
Dependent variable:
Idea Idea StandardizedDevelopment Recombination Idea Quality
(1) (2) (3)
Openness (Self) −0.114 −0.104∗ −0.050(0.084) (0.059) (0.069)
Extraversion (Peers) 0.379∗∗ 0.245∗∗ 0.271∗∗
(0.160) (0.118) (0.114)
Openness (Self) X Extraversion (Peers) 0.340∗ 0.240∗ 0.230(0.205) (0.138) (0.148)
Pre-Treatment Development (Self) 0.304∗∗
(0.129)
Pre-Treatment Recombination (Self) 0.066(0.087)
Idea Development 0.360∗∗∗
(0.072)
Idea Recombination 0.098(0.073)
Constant −0.231∗∗ −0.00001 0.083(0.108) (0.072) (0.072)
Indirect Treatment Effect (Development) 0.259∗∗
(0.103)Indirect Treatment Effect (Recombination) 0.047
(0.037)Indirect Treatment Effect (Dev. and Rec.) 0.306∗∗
(0.112)Total Effect 0.806∗∗∗
(0.217)
Observations 1,135 1,135 1,135
Note: ∗p<0.1; ∗∗p<0.05; ∗∗∗p<0.01Ordinary Least Squares with evalutor fixed effects.
Standard errors clustered at the individual innovator level.
34

Table 5: Do teams with open members that conversed with extroverted peers generate higher quality projects?
Dependent variable:Project Quality
(1) (2) (3) (4) (5)
Openness (Team) 0.124∗ 0.133∗ 0.130∗∗ 0.138∗∗
(0.063) (0.067) (0.064) (0.062)
Extraversion (Peers) 0.107 0.124 0.095 0.183∗∗
(0.093) (0.085) (0.087) (0.083)
Openness (Team) × Extraversion (Peers) 0.331∗∗ 0.825∗∗∗ 0.335∗∗
(0.162) (0.197) (0.149)
Extraversion (Team) -0.120∗∗
(0.052)
Openness (Peers) -0.022(0.095)
Openness (Team) × Openness (Peers) -0.463∗∗∗
(0.170)
Extraversion (Team) × Openness (Peers) 0.043(0.123)
Extraversion (Team) × Extraversion (Peers) 0.113(0.140)
Pre-treatment idea quality (Team) 0.325(0.254)
Pre-treatment idea quality (Peers) 0.146(0.326)
Admission Score (Team) 0.103(0.074)
Admission Score (Peers) 0.024(0.095)
Engineer (Team) -0.111(0.099)
Engineer (Peers) -0.188(0.221)
Constant 2.803∗∗∗ 2.806∗∗∗ 2.797∗∗∗ 2.771∗∗∗ 1.810∗
(0.031) (0.033) (0.030) (0.027) (1.057)
Observations 556 556 556 556 556
Standard errors in parenthesesLinear Regression with evaluator fixed effects.All tests are two tailed. Standard errors clustered at theteam level.∗ p < 0.10, ∗∗ p < 0.05, ∗∗∗ p < 0.01
35

1 Overview of the Appendix
In this appendix, we provide a series of additional summary statistics, details on how we constructed our text-basedmeasures, a variety robustness checks, a detailed description of the bootcamp, and further information about theideas and projects generated.
Sections 2 and 3 report summary statistics. In Section 2 we report individual level bivariate correlations alongwith balance tests. In Section 3 we report a the team level bivariate correlations along with balance tests.
Section 4 details how we construct our idea development and recombination measures.In Sections 5 through 9 we report robustness checks at the individual level. In Table 5 we replicate the results in
Table 3 but using linear regression to ensure that our estimated interaction effect is not an artifact of the non-linearmodel we use. In Section 6 we test if alternative peer-personality interactions explain our findings, but we find littleevidence for these alternatives. In Section 7 we test if what matters is not talking to extroverts, but talking to a mixof extroverts and introverts, perhaps in a particular order. We find little evidence for this alternative. In Section 8we test if our effects hold across the three different dimensions (purchase intention, novelty, and business potential)each idea was evaluated on. We find our effects holds relatively evenly on each dimension. In section 9 we show thatthe participants are no more or less likely to give positive evaluations to the ideas generated by their friends andadvice partners, confirming that our quality measure is not biased by the relationships between participants.
In Section 10 we report robustness checks at the team level. Specifically, we show that personality diversity, in theform of teams with a mix of open and closed individuals or talking to peers who are a mix of extraverts or intraverts,does not appear to increase, nor decrease, team performance. Similar to the individual level results, what matters isthe level of openness and extraversion and not personality diversity.
In the final three sections we provide more details about the bootcamp and ideas generated. In Section 11 wedescribe the recruitment process and bootcamp in more detail. Section 12 provides further details on the ideasgenerated and Section 13 provides examples of the projects generated at the end of the first week.
2 Individual level correlations and balance tests
Table 6 presents the correlations between the variables used in our primary analysis. Table 7 regresses our measureof peer extraversion on an individual’s personality measures. We find not significant relationship, indicating that arerandomization was successful at the individual level.
[Table 6 about here.]
[Table 7 about here.]
3 Team level correlations and balance tests
Table 8 presents the correlations between the variables used in our primary analysis. Table 9 regresses our measureof peer extraversion on a teams’s average personality score. We find not significant relationship, indicating that arerandomization was successful at the team level.
[Table 8 about here.]
[Table 9 about here.]
4 Idea Development and recombination variable construction
As briefly discussed in the main body of the paper, we calculated two content-based measures of the ideas generated.The first measure, commonly used in the creativity literature, captures how “developed” an idea is by counting thenumber of unique words used to describe the idea. Idea development has been shown to correlate with poetic successand scientific success (Simonton, 1990; Feist, 1997). To generate a content-based measure of idea development, wetook all the ideas generated during the brainstorming sessions and first cleaned the raw text. To do so, we took thetext from each idea, stripped out all the punctuation, removed common English “stop words” (of, the, a), and thenstemmed the remaining words so that words capturing the same concept (e.g., “run” and “running”) mapped to thesame underlying meaning (“run”). Using this cleaned corpus, we counted the number of unique terms to generate a
36

measure of development. Since the distribution of term counts is fat-tailed, we generated a final “development score”measure by taking the log of the count of distinct terms in each idea and then standardize the variable to have mean0 and standard deviation 1.
While the number of unique terms reflects how developed the idea is, it is only one of many dimensions thatexplain why an idea is more creative and innovative. While the traditional Torrance model (Torrance, 1972; Kim,2006) treats creativity as a composite of four dimensions (elaboration and development, fluency, flexibility, andoriginality and novelty), more recent work has argued that creativity encapsulates a larger set of concepts, includingthe evolutionary fitness of an idea, its surprisingness in a Bayesian sense, and how recombinative it is (Simonton,1999; de Vaan, Vedres and Stark, 2015). The idea of recombination is especially rooted in the sociology of knowledgeand innovation. Within this research stream, scholars treat ideas, new products, or patents as embedded withina larger semantic network. Some ideas are central in this network, others are peripheral, and some sit on theboundaries between different “communities” of ideas. It is this last position of spanning boundaries that has receivedthe most attention, with research finding that ideas sitting at the interaction of many other ideas represent novelrecombinations with greater potential (Hargadon and Sutton, 1997; Uzzi et al., 2013; de Vaan, Vedres and Stark,2015).
To measure how recombinative the idea is, we drew on the literature that treats ideas as embedded in a largersemantic network. We began by building a network between all the ideas generated during the brainstorming session.In this network, ideas are connected if they are similar, and they remain unconnected if they are distant. Wegenerated a measure of distance by first calculating a term-frequency-inverse-document-frequency weighted idea-by-term matrix Manning and Schutze (1999). As with the idea development score discussed above, terms representcleaned and stemmed words. Using this idea-by-term matrix, we then calculated the cosine distance between eachidea within this matrix. Conceptually, ideas that are farther apart in terms of cosine distance share few terms,whereas ideas that are closer together share many overlapping terms. We treated two ideas as connected in the finalsemantic network if they had a cosine distance in the top decile of similarity (less than 0.92).8 We then calculatedeach idea’s betweenness centrality in this network of ideas. Ideas high in betweenness centrality are those that siton the shortest paths between all the other ideas generated and are thus ideas that are most central in connectingdisparate idea domains. As with many measures of centrality, betweenness centrality is fat-tailed. Therefore, togenerate a final “recombination score,” we took the log of each idea’s betweenness centrality in the semantic networkand then standardize the variable to have mean 0 and standard deviation 1.
5 Individual-level results hold when using OLS
We replicate Table 3 using standard linear regression instead of ordered logistic regression. This model returns themarginal effects at the group means and so helps us test if our results, and especially our interaction term, are robustto model specification. Indeed, the interaction terms remains positive and significant. For example, in Column 3 thecoefficient is 0.418 with a standard error of 0.193.
[Table 10 about here.]
6 Alternative personality matches do not explain our results
Table 11 tests is other personality interactions are driving our results. We find little evidence that our findings arebeing driven by other personality constructs.
[Table 11 about here.]
7 Testing for variance and order effects
One possible alternative is that idea generation is improved not by talking with extroverts only, but by talkingwith a mix of extroverts and introverts. Building on this idea that it is the variance that matters, perhaps whatreally matters is the sequence of conversations. Perhaps introverts improve idea quality when encountered after
8Results are similar at other percentile cutoffs, although the results weaken as the networks become more connected and asvariation in measures of centrality decline.
37

talking with extroverts? Table 12 tests these alternative models. Model 1 shows that the standard deviation of peerextraversion does not appear to improve idea quality nor does its interaction with the focal innovator’s openness.Model 2 disaggregates the effects, including separate extraversion measures for the first, second, and third peer withwhich the focal actor conversed. For both the interactions and the main effects, we find little evidence that the orderof who an innovator talks to matters. None of the estimates are substantially different from one another, though theestimates have wider standard errors since we lose power by estimating the extraversion of each conversation partnerseparately.
[Table 12 about here.]
8 Do our results hold on dissaggregated quality measures?
In Table 13, we examine whether our results hold in the more disaggregated versions of the post-treatment idearatings. We find that peer Extraversion (Peers) and the interaction with the Openness of the innovator increases thequality of ideas in the dimensions of business value, buy likelihood, and novelty. Consistent with our theorizing, wefind that our effects increase idea quality across the board and not simply in terms of one idiosyncratic dimension.
[Table 13 about here.]
9 Does bias in the evaluation process lead to bias in the peereffects estimation?
Though the evaluations of ideas was double-blinded, we still wanted to ensure that our estimates were not biased bywhether evaluators had knowledge of or interacted with the individual generating the idea that they were evaluating.To do this, we conducted an analysis where we controlled for the presence of a relationship prior to the treatmentbetween an evaluator and the focal innovator. Our results, presented in Table 14, indicate that such a bias does notappear to exist or does not affect our key results. Knowing, being friends with, or going to another participant foradvice does not appear to change the rating of the idea in any appreciable way. In Column 4 we drop all evaluationsconducted by evaluators who knew the individual whose blinded idea they were evaluating. Again, our results remainrobust.
[Table 14 about here.]
10 Testing for variance effects at the team level
To test if teams benefit from having a mixture of open and closed individuals, or from talking to a mix of intravertsand extraverts, we include the standard deviation of these two measures in Table 15. Consistent with the individual-level results, we find little evidence that talking to a mix of intraverts and extraverts improves a team’s performance.Furthermore, we find no evidence that teams with a mix of open and closed individuals perform better. If anything,such teams appear to generate lower quality projects.
[Table 15 about here.]
11 Setting Description, Participant Recruitment and ParticipantCharacteristics
The organization, Innovate Delhi, was a 3-week intensive startup boot camp and pre-accelerator that ran from June2 (Day 1) to June 22 (Day 21), 2014 on the campus of IIIT-Delhi. The program consisted of three modules spreadover three weeks. The bootcamp was held six days a week, Monday through Saturday, from 9am until 5pm. The firstweek (on which this experiment is based) focused on design thinking, feedback, and prototyping. Individuals workedin randomly assigned teams of three to develop a software product concept for the Indian wedding industry. Duringthis week, teams and individuals were required to converse with three other participants about their experience withweddings. At the end of the week, individuals submitted their final prototype for peer evaluation.
38

Admission into the Innovate Delhi program required the completion of an extensive online application, madepublic September 10, 2013 and with a completion deadline of February 1st, 2014. Applicants had to provide adetailed overview of their work history, education, and business skills. Furthermore they were strongly encouragedto write an essay explaining why they wanted to enter the program and, as part of the application, we asked themto email people they thought may also be interested. We recruited applicants through a number of different meansincluding facebook ads, social media posts, entrepreneurship organizations and word-of-moth referrals. Over 1,247people started the full application, 58 started a short version of the standard application we launched after theFebruary 1st deadline, and 71 people completed a wait-list Google Form application that was designed to attractlast-minute applicants; a total of 1,376 applications were started. We received 508 fully completed applications ofwhich 437 were standard applications and 71 were from the last-minute Google Form applications (these applicationsdid not allow the user to save their work and submit at a later date hence the perfect pass through rate).
From these applications we accepted 358 standard applicants and 18 last-minute applicants. From this poolof accepted students 178 enrolled by May 1st and signed our initial online IRB consent form. This form clearlystated that the program was being conducted for research purposes and that digital, video, and audio data would becollected. From this group we still had a sizable attrition rate: 135 formally paid the registration fee, signed up fora Google Apps @innovatedelhi.com account, and completed a battery of pre-program surveys. Of these 135 studentswho formally enrolled 118 attended the first day of the program and signed our second physical consent form. Ofthose who attended on the first day 95 percent (112) of these students continued on to the second day and completedthe three-week program. Of the 112 program graduates 104 people completed the full standard application, 5 thethe shorter standard application, and 3 the last-minute application. From these 112 graduates of the program 38found out about Innovate Delhi through a friend, 24 heard about it from a Facebook ad campaign, 13 through theuniversity where we ran the program, 8 through Internet searches for entrepreneurship boot-camps and accelerators,and the remainder through an assortment of social media and word-of-mouth means.
The age range of the 112 graduates ran from 18 to 36, with a mean age of just over 22. Our program had 25women and everyone had, or was enrolled in, college with 60 of the participants enrolled in a college, masters, orphd program. Our program was regionally diverse with 62 of the participants from the state of Delhi and the restfrom across India. The class was primarily engineering and computer science degree holders (78), followed by 18business degrees, and the rest from the arts and sciences. A total of 8 people were enrolled in, or, had graduated fromadvanced degree programs. The participants came from a broad spectrum of universities including Delhi University,IIIT-Delhi, Jaypee University, Delhi Technological University, and the IITs. It is important to note that universitiesin India are composed of relatively independent colleges, thus most of the participants in our program did not knowone another even if they came from the same university. For example, of the 26 participants from Delhi Universityhalf are the only representative from their college and the most popular college from Delhi University supplied only3 participants. Everyone in the program spoke English since proficiency in English was an application requirementand nearly all the participants were multi-lingual with Hindi, Urdu, Bengali, Punjabi, and Tamil being the mostcommon.
The participants professional experience and business skills were quite varied. Of the Innovate Delhi graduates, 77had formal work experience at companies ranging form multi-nationals to large Indian businesses to new startups fromacross India. As expected, the group was quite entrepreneurial with 37 of the participants having started a company,the majority of which were suspended or had folded before the start of the program. In terms of having a priorconnection to the Indian startup ecosystem, 36 had worked for a StartUp that was not their own and 28 could namea mentor they had in the Indian StartUp ecosystem. Just over half, 65, have a very rough idea for a startup cominginto the program. In terms of skills 63 had a background in web programming, 50 experience in marketing, 38 in dataanalysis, 30 in sales, and many in accounting, PR, operations, and market analysis. Unsurprisingly for a programfocused on software startups, the most common industry the participants were interested in entering (58 people)was Internet and Technology. Beyond this core interests were diverse with 39 people interested in education, 35 infinancial services, 27 in advertising, 17 in media, 13 in health care, 12 in food and beverage, and others interestedin everything from manufacturing to agriculture to corporate social responsibility. The incoming within-programnetworks of the participants are very sparse, with the average participant not knowing 98% of the other participantsand were not friends with 99.5% of the other participants.
12 Individual Ideas and evaluation
To provide context for the nature of the ideas generated during the individual idea generation process, we, presentexamples of raw ideas generated immediately after the three randomized interviews that were rated highly as well as
39

poorly on the three dimensions of business potential, buy likelihood and novelty.Examples of highly rated ideas include:
Feast on demand lets the wedding planners minimise food wastage during the feasts in the events. Throughthis app, the wedding planners can generate a link and forward it to all the guests. On opening that link,the guests are confronted with a set of choices of food items/dishes they wish to consume during theevent. After the guests give their preferences, the wedding planner gets the data and can arrange the foodaccording to these estimates. Also, the dishes with low preference can be eliminated to the reduce wastage.
Behavioral analysis of bride and grooms online profiles on key social networks. This could be done exclu-sively by a company which would give a detailed analysis by psychologists. This would definitely aid thematch-making process, making it more thorough.
Renting of Wedding Dresses. Most women don’t sell off jewelry bought, but dresses cannot be re-worn.Since branding is all that matters when it comes to second hand, the dresses could be dry washed andrepacked in bags and delivered.
Examples of ideas that received low ratings include:
PERSONALISED CARDS. [my interviewee] said that it gets to be highly painful to write names on cardsand thus I propose that an agency that sends personalised cards and tracks whether they have reached.
connectivity of app event and fb event is a nice way to spread info easily
Build an app that would give users a complete guide on personal grooming tips for weddings (from decidingon what to wear to how to wear the make-up to how to carry yourself,etc) customized according to theuser’s built, complexion, and personality.
13 Project examples and evaluation
To provide reference points for how evaluators rated the final team submissions, we provide examples of submissionsin the top, middle, and bottom quartiles of submissions in terms of total score.
An example of a submission in the top quartile was a prototype for mobile app called “Snappily Wed.” Theteam’s description of the product is:
Your guests use smart phones to take photos at the wedding but don’t share them with you. For you it’sa loss of precious memories. Our App solves the problem by allowing your Guests to take pictures anddirectly saving them on the cloud. Don’t miss out on your wedding. Capture and retain every photo takenby Everybody at your wedding (be it your uncle playing with your nieces or your brother taking photos ofthe food served).The marrying couple (you or the person maintaining your account) will have access tothese pictures and will retain and share the ones which are great, while discarding the rest, for your lovedones to view.
Their splash page depicted in figure 3, is clear and visually appealing:
[Figure 3 about here.]
An example of a submission in near the 50th percentile is “Tender my Wedding.” The team describes their ideaas:
TenderMyWedding is a platform which turns the process of finding vendors for a wedding upside down.Rather than the customer looking for vendors for their wedding needs, we let Vendors look for them.All they do is simply post their requirements with budget and within no time, top service providers fromeverywhere would be competing to get them as their customer. It’s a win-win as you get multiple cost-effective quotes for the requirements without stepping out of your home and Vendors get new business.
Their splash page submission, depicted in figure 4:
[Figure 4 about here.]
40

An example of a submission in the bottom quartile of the ratings is “Invite My Pals” which is described as:
Invite My Pals makes inviting people a much easier task with superb efficiency! Be it wedding or anyother occasion, using this app you can send invitations to people that will not just directly reach thembut also would let you keep track of how many people are going to join you on your day. With the videoinvites and e-cards best suiting to your taste you send invitations in more personalised way than everbefore!!
Their splash page submission, depicted in figure 5:
[Figure 5 about here.]
41

Figure 3: Splash page for submission in the top quartile—Snappily Wed.
Figure 4: Splash page for submission in the middle quartile—Tender my Wedding.
42

Figure 5: Splash page for submission in the bottom quartile—Invite My Pals.
43

Table 6: Correlations at the individual participant level.
1 2 3 4 5 6 7 8 9 10 11 12 13 14 15 16 17
1 Average Idea 1.00Quality (Self)
2 Extraversion (Self) 0.01 1.00
3 Openness (Self) 0.04 0.30 1.00
4 Conscientious (Self) -0.09 0.24 0.19 1.00
5 Agreeableness (Self) 0.05 0.03 0.03 0.27 1.00
6 Neuroticism (Self) 0.05 -0.21 -0.34 -0.32 -0.21 1.00
7 Admission Score (Self) -0.02 0.02 0.16 0.16 -0.13 0.03 1.00
8 Engineer (Self) -0.13 0.01 -0.06 -0.03 -0.01 -0.10 -0.01 1.00
9 Pre-treatment 0.17 -0.00 -0.03 -0.30 0.00 -0.01 0.05 0.03 1.00Idea Quality (Self)
10 Extraversion (Peers) 0.12 0.05 0.01 0.00 0.04 -0.00 -0.05 0.16 -0.05 1.00
11 Openness(Peers) -0.18 0.01 -0.19 -0.02 0.02 0.05 0.13 0.12 -0.08 0.40 1.00
12 Conscientious (Peers) -0.06 -0.04 -0.04 0.05 0.07 0.14 0.10 -0.01 -0.05 0.09 0.17 1.00
13 Agreeableness (Peers) -0.12 -0.03 -0.00 0.08 -0.08 0.06 0.02 -0.06 -0.05 0.05 0.04 0.20 1.00
14 Neuroticism (Peers) 0.16 0.01 0.06 0.13 0.07 -0.22 0.03 -0.27 -0.05 -0.31 -0.36 -0.31 -0.23 1.00
15 Admission Score (Peers) 0.14 -0.02 0.13 0.07 0.04 -0.01 -0.04 -0.08 -0.10 0.01 0.21 0.26 -0.19 0.08 1.00
16 Engineer (Peers) 0.09 0.12 0.13 0.04 -0.03 -0.23 -0.04 0.14 0.08 0.16 -0.04 0.01 -0.04 -0.07 -0.03 1.00
17 Pre-treatment 0.06 -0.01 -0.05 -0.10 -0.05 -0.07 -0.09 0.08 0.04 0.04 0.03 -0.36 0.00 0.09 -0.09 0.02 1.00Idea Quality (Peers)
Table 7: Peer assignments appears balanced at the individual level.
(1) (2) (3) (4) (5)Openness Extraversion Conscientious Agreeableness Neuroticism
(Self) (Self) (Self) (Self) (Self)
Extraversion (Peers) 0.015 0.087 0.006 0.066 -0.002(0.141) (0.150) (0.173) (0.203) (0.162)
Constant 0.018 -0.026 0.011 -0.008 0.018(0.098) (0.097) (0.095) (0.096) (0.097)
Observations 108 108 108 108 108
Standard errors in parenthesesLinear Regression.All tests are two tailed. Standard errors clustered at the individual innovator level.
44

Table 8: Correlations at the team level.
(1)
1 2 3 4 5 6 7 8 9 10 11 12 13 14 15 16 171 Average Project Quality (Team) 1.00
2 Extraversion (Team) -0.01 1.00
3 Openness (Team) 0.22 0.07 1.00
4 Conscientious (Team) 0.09 0.11 0.02 1.00
5 Agreeableness (Team) -0.15 -0.08 -0.00 0.24 1.00
6 Neuroticism (Team) 0.12 -0.09 -0.29 -0.31 -0.23 1.00
7 Admission Score (Team) 0.17 -0.01 0.21 0.10 -0.25 0.10 1.00
8 Engineer (Team) -0.02 -0.05 -0.06 0.15 -0.07 -0.10 -0.08 1.00
9 Pre-treatment idea quality (Team) -0.02 0.01 -0.19 -0.07 0.13 -0.05 -0.14 -0.02 1.00
10 Extraversion (Peers) 0.13 0.02 0.08 0.10 -0.05 -0.06 -0.25 0.26 0.14 1.00
11 Openness (Peers) -0.14 -0.07 -0.22 -0.18 -0.02 -0.09 -0.02 0.16 0.02 0.35 1.00
12 Conscientious (Peers) -0.20 -0.20 -0.18 -0.01 0.04 0.33 0.04 0.01 0.08 0.04 0.12 1.00
13 Agreeableness (Peers) -0.18 -0.29 -0.31 0.05 -0.13 0.08 -0.20 -0.05 0.19 -0.02 -0.13 0.25 1.00
14 Neuroticism (Peers) -0.16 0.27 0.17 0.19 0.16 -0.13 0.28 -0.32 -0.32 -0.53 -0.37 -0.29 -0.29 1.00
15 Admission Score (Peers) 0.04 -0.05 0.25 0.12 0.21 -0.01 0.04 0.16 -0.35 -0.08 0.04 0.37 -0.19 0.14 1.00
16 Engineer (Peers) -0.15 0.06 0.29 -0.03 -0.04 -0.17 -0.16 -0.06 0.15 0.18 -0.12 -0.12 0.03 -0.01 0.17 1.00
17 Pre-treatment idea quality (Peers) 0.12 -0.02 -0.01 0.14 -0.08 0.12 0.19 0.20 -0.08 -0.01 0.29 -0.28 0.07 -0.07 -0.17 -0.01 1.00
Table 9: Peer assignments appears balanced at the team level.
(1) (2) (3) (4) (5)Openness Extraversion Conscientious Agreeableness Neuroticism(Team) (Team) (Team) (Team) (Team)
Extraversion (Peers) 0.118 0.027 0.162 -0.076 -0.095(0.228) (0.316) (0.228) (0.260) (0.299)
Constant 0.016 0.008 0.004 -0.004 0.005(0.091) (0.100) (0.088) (0.100) (0.101)
Observations 40 40 40 40 40
Standard errors in parentheses.Linear Regression.All tests are two tailed. Standard errors clustered at the individual innovator level.∗ p < 0.10, ∗∗ p < 0.05, ∗∗∗ p < 0.01
45
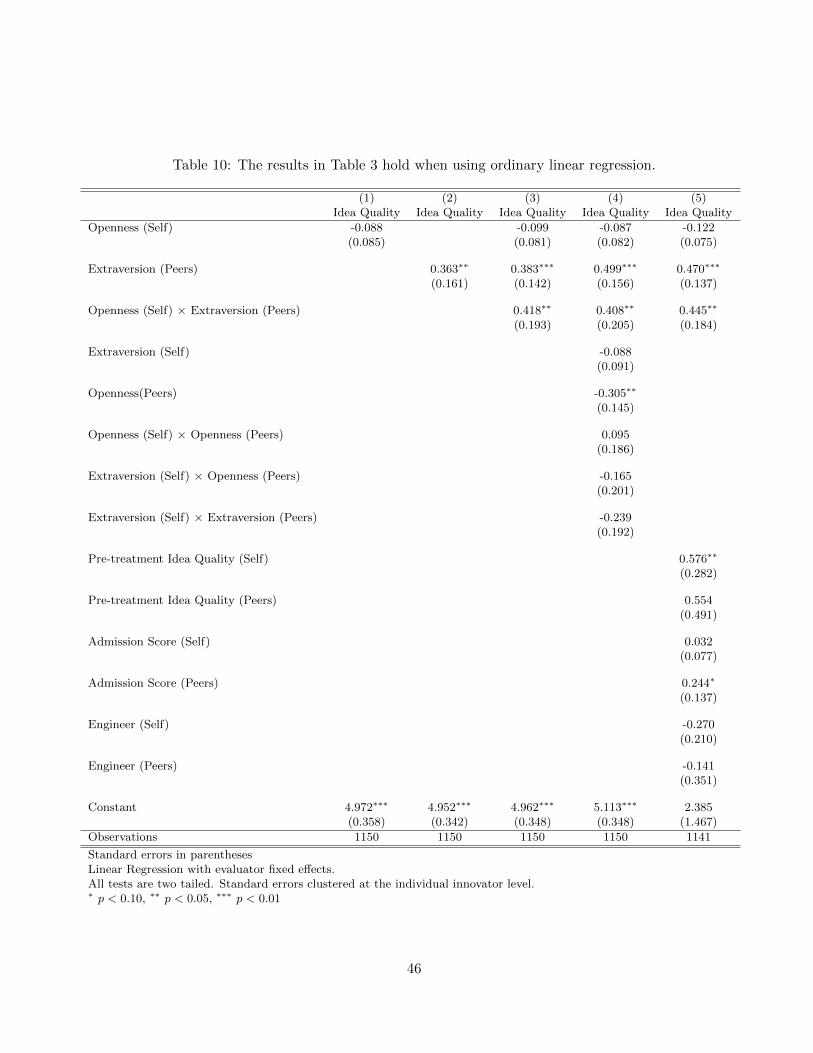
Table 10: The results in Table 3 hold when using ordinary linear regression.
(1) (2) (3) (4) (5)Idea Quality Idea Quality Idea Quality Idea Quality Idea Quality
Openness (Self) -0.088 -0.099 -0.087 -0.122(0.085) (0.081) (0.082) (0.075)
Extraversion (Peers) 0.363∗∗ 0.383∗∗∗ 0.499∗∗∗ 0.470∗∗∗
(0.161) (0.142) (0.156) (0.137)
Openness (Self) × Extraversion (Peers) 0.418∗∗ 0.408∗∗ 0.445∗∗
(0.193) (0.205) (0.184)
Extraversion (Self) -0.088(0.091)
Openness(Peers) -0.305∗∗
(0.145)
Openness (Self) × Openness (Peers) 0.095(0.186)
Extraversion (Self) × Openness (Peers) -0.165(0.201)
Extraversion (Self) × Extraversion (Peers) -0.239(0.192)
Pre-treatment Idea Quality (Self) 0.576∗∗
(0.282)
Pre-treatment Idea Quality (Peers) 0.554(0.491)
Admission Score (Self) 0.032(0.077)
Admission Score (Peers) 0.244∗
(0.137)
Engineer (Self) -0.270(0.210)
Engineer (Peers) -0.141(0.351)
Constant 4.972∗∗∗ 4.952∗∗∗ 4.962∗∗∗ 5.113∗∗∗ 2.385(0.358) (0.342) (0.348) (0.348) (1.467)
Observations 1150 1150 1150 1150 1141
Standard errors in parenthesesLinear Regression with evaluator fixed effects.All tests are two tailed. Standard errors clustered at the individual innovator level.∗ p < 0.10, ∗∗ p < 0.05, ∗∗∗ p < 0.01
46
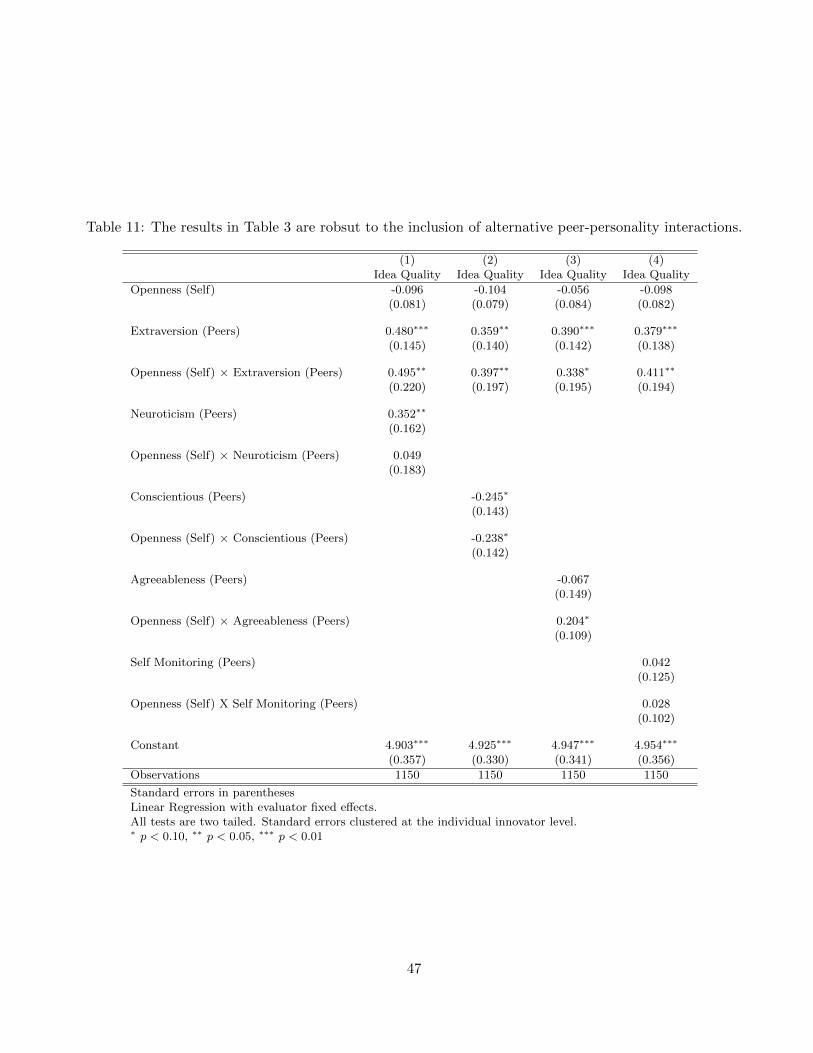
Table 11: The results in Table 3 are robsut to the inclusion of alternative peer-personality interactions.
(1) (2) (3) (4)Idea Quality Idea Quality Idea Quality Idea Quality
Openness (Self) -0.096 -0.104 -0.056 -0.098(0.081) (0.079) (0.084) (0.082)
Extraversion (Peers) 0.480∗∗∗ 0.359∗∗ 0.390∗∗∗ 0.379∗∗∗
(0.145) (0.140) (0.142) (0.138)
Openness (Self) × Extraversion (Peers) 0.495∗∗ 0.397∗∗ 0.338∗ 0.411∗∗
(0.220) (0.197) (0.195) (0.194)
Neuroticism (Peers) 0.352∗∗
(0.162)
Openness (Self) × Neuroticism (Peers) 0.049(0.183)
Conscientious (Peers) -0.245∗
(0.143)
Openness (Self) × Conscientious (Peers) -0.238∗
(0.142)
Agreeableness (Peers) -0.067(0.149)
Openness (Self) × Agreeableness (Peers) 0.204∗
(0.109)
Self Monitoring (Peers) 0.042(0.125)
Openness (Self) X Self Monitoring (Peers) 0.028(0.102)
Constant 4.903∗∗∗ 4.925∗∗∗ 4.947∗∗∗ 4.954∗∗∗
(0.357) (0.330) (0.341) (0.356)
Observations 1150 1150 1150 1150
Standard errors in parenthesesLinear Regression with evaluator fixed effects.All tests are two tailed. Standard errors clustered at the individual innovator level.∗ p < 0.10, ∗∗ p < 0.05, ∗∗∗ p < 0.01
47

Table 12: Individuals who talk with a mix of extraverts and intraverts do not appear to generate higher qualityideas. Furthermore, the order of who an individual converses with does not appear to have a significant impacton idea quality.
(1) (2)Idea Quality Idea Quality
Openness (Self) -0.133 -0.067(0.197) (0.084)
Extraversion (Peers) 0.477∗∗∗
(0.132)
Openness (Self) × Extraversion (Peers) 0.351∗
(0.185)
Extraversion S.D. (Peers) 0.227(0.172)
Openness (Self) × Extraversion S.D. (Peers) 0.021(0.190)
Extraversion (First Peer) 0.135∗
(0.071)
Extraversion (Second Peer) 0.299∗∗∗
(0.074)
Extraversion (Third Peer) 0.096(0.067)
Extraversion (First Peer) × Openness (Self) 0.014(0.070)
Extraversion (Second Peer) × Openness (Self) 0.336∗∗∗
(0.097)
Extraversion (Third Peer) × Openness (Self) 0.157∗
(0.083)
Constant 4.800∗∗∗ 4.957∗∗∗
(0.359) (0.325)
Observations 1144 1150
Standard errors in parenthesesLinear Regression with evaluator fixed effects.All tests are two tailed. Standard errors clustered at the individual innovator level.∗ p < 0.10, ∗∗ p < 0.05, ∗∗∗ p < 0.01
48

Table 13: The randomized conversations appear to impact the business, buy, and novelty dimensions of anindividual’s idea quality equally.
(1) (2) (3)Business Rating Buy Rating Novelty Rating
Openness (Self) -0.047 -0.059 -0.105∗
(0.058) (0.058) (0.055)
Extraversion (Peers) 0.234∗∗ 0.272∗∗∗ 0.264∗∗
(0.109) (0.093) (0.122)
Openness (Self) × Extraversion (Peers) 0.320∗∗ 0.334∗∗∗ 0.336∗∗∗
(0.154) (0.115) (0.130)
Observations 1203 1352 1765
Standard errors in parenthesesOrdered Logistic Regression with evaluator fixed effects.All tests are two tailed. Standard errors clustered at the individual innovator level.∗ p < 0.10, ∗∗ p < 0.05, ∗∗∗ p < 0.01
Table 14: Our results are robust when controlling for the presence of a innovator-evaluator relationship.
(1) (2) (3)Idea Quality Idea Quality Idea Quality
Openness (Self) -0.104 -0.105∗ -0.105∗
(0.063) (0.063) (0.063)
Extraversion (Peers) 0.333∗∗∗ 0.334∗∗∗ 0.334∗∗∗
(0.115) (0.115) (0.114)
Openness (Self) × Extraversion (Peers) 0.296∗∗ 0.296∗∗ 0.296∗∗
(0.143) (0.143) (0.143)
Evaluator knows innovator 0.062(0.319)
Evaluator is friends with innovator -0.000(0.504)
Innovator sought advice from evaluator 0.021(0.412)
Observations 1132 1132 1132
Standard errors in parenthesesOrdered Logistic Regression with evaluator fixed effects.All tests are two tailed. Standard errors clustered at the individual innovator level.∗ p < 0.10, ∗∗ p < 0.05, ∗∗∗ p < 0.01
49

Table 15: Teams with a mix of open and closed individuals or who talk with a mix of intraverts and extravertsdo not outperform teams that are simply more open and talk to more extraverts.
(1) (2) (3)Project Quality Project Quality Project Quality
Openness (Team) 0.115∗ -0.105 -0.086(0.067) (0.208) (0.212)
Extraversion (Peers) 0.317∗∗ 0.125 0.319∗∗
(0.129) (0.094) (0.153)
Openness (Team) × Extraversion (Peers) 0.302∗ 0.555∗ 0.479∗
(0.166) (0.277) (0.276)
Std. Dev. Openness (Team) -0.041 -0.035(0.052) (0.050)
Std. Dev. Openness (Team) × Extraversion (Peers) -0.223∗∗ -0.215∗∗
(0.098) (0.106)
Std. Dev. Extraversion (Team) 0.151 0.166(0.143) (0.144)
Openness (Team) × Std. Dev. Extraversion (Peers) 0.439 0.375(0.350) (0.353)
Constant 2.840∗∗∗ 2.729∗∗∗ 2.759∗∗∗
(0.064) (0.075) (0.090)
Observations 556 556 556
Standard errors in parenthesesLinear Regression with evaluator fixed effects.All tests are two tailed. Standard errors clustered at the team level.∗ p < 0.10, ∗∗ p < 0.05, ∗∗∗ p < 0.01
50