Convergence of detrital stoichiometry predicts thresholds...
13
1745 INTRODUCTION Nutrient pollution from nonpoint sources affects aquatic ecosystems worldwide (Carpenter et al. 1998). Among these systems, streams are particularly vulnerable to the effects of nonpoint nutrient pollution due to their connection to the surrounding landscape via ground- water and/or surface water runoff (Mulholland 1992, Sudduth et al. 2013). Human activities, such as urbani- zation and agriculture, have dramatically increased nutrient concentrations (i.e., nitrogen [N] and phos- phorus [P]) in streams in recent decades (Alexander and Smith 2006), contributing to degradation of water quality (Brown and Froemke 2012). Increased availability of nutrients can have fundamental effects on ecosystem- level processes, such as macroinvertebrate production (Cross et al. 2006) and particulate organic matter breakdown (Ferreira et al. 2015). However, nutrient effects on particulate organic matter pathways are typi- cally outside of the scope of nutrient pollution Convergence of detrital stoichiometry predicts thresholds of nutrient-stimulated breakdown in streams DAVID W. P. MANNING, 1,5 AMY D. ROSEMOND, 1 VLADISLAV GULIS, 2 JONATHAN P. BENSTEAD, 3 JOHN S. KOMINOSKI, 1,6 AND JOHN C. MAERZ 4 1 Odum School of Ecology, University of Georgia, Athens, Georgia 30602 USA 2 Department of Biology, Coastal Carolina University, Conway, South Carolina 29528 USA 3 Department of Biological Sciences, University of Alabama, Tuscaloosa, Alabama 35487 USA 4 Warnell School of Forest Resources, University of Georgia, Athens, Georgia 30602 USA Abstract. Nutrient enrichment of detritus-based streams increases detrital resource quality for consumers and stimulates breakdown rates of particulate organic carbon (C). The relative importance of dissolved inorganic nitrogen (N) vs. phosphorus (P) for detrital quality and their effects on microbial- vs. detritivore-mediated detrital breakdown are poorly understood. We tested effects of experimental N and P additions on detrital stoichiometry (C:N, C:P) and total and microbial breakdown (i.e., with and without detritivorous shredders, respec- tively) of five detritus types (four leaf litter species and wood) with different initial C:nutrient content. We enriched five headwater streams continuously for two years at different relative availabilities of N and P and compared breakdown rates and detrital stoichiometry to pre- treatment conditions. Total breakdown rates increased with nutrient enrichment and were predicted by altered detrital stoichiometry. Streamwater N and P, fungal biomass, and their interactions affected stoichiometry of detritus. Streamwater N and P decreased detrital C:N, whereas streamwater P had stronger negative effects on detrital C:P. Nutrient addition and fungal biomass reduced C:N by 70% and C:P by 83% on average after conditioning, com- pared to only 26% for C:N and 10% for C:P under pretreatment conditions. Detritus with lowest initial nutrient content changed the most and had greatest increases in total breakdown rates. Detrital stoichiometry was reduced and differences among detritus types were homog- enized by nutrient enrichment. With enrichment, detrital nutrient content approached detri- tivore nutritional requirements and stimulated greater detritivore vs. microbial litter breakdown. We used breakpoint regression to estimate values of detrital stoichiometry that can potentially be used to indicate elevated breakdown rates. Breakpoint ratios for total breakdown were 41 (C:N) and 1518 (C:P), coinciding with total breakdown rates that were ~1.9 times higher when C:N or C:P fell below these breakpoints. Microbial and shredder-mediated breakdown rates both increased when C:N and C:P were reduced, suggesting that detrital stoichiometry is useful for predicting litter breakdown dominated by either microbial or shredder activity. Our results show strong effects of nutrient enrichment on detrital stoichiometry and offer a robust link between a potential holistic nutrient loading metric (decreased and homogenized detrital stoichiometry) and increased C loss from stream ecosystems. Key words: breakpoint regression; carbon; detritus; ecological stoichiometry; fungi; nitrogen; phosphorus; shredders; threshold elemental ratios; Coweeta Hydrologic Laboratory; Long Term Ecological Research (LTER); Appalachian Mountains; Macon County; North Carolina; USA. Ecological Applications, 26(6), 2016, pp. 1745–1757 © 2016 by the Ecological Society of America Manuscript received 1 July 2015; revised 4 January 2016; accepted 28 January 2016. Corresponding Editor: C. Nilsson. 5 Present address: School of Environment and Natural Resources, The Ohio State University, 210 Kottman Hall 2021 Coffey Road Columbus, Ohio 43210, USA. E-mail: [email protected] 6 Present address: Department of Biological Sciences, Florida International University, 11200 SW 8th Street Miami, Florida 33199, USA.
Transcript of Convergence of detrital stoichiometry predicts thresholds...

1745
IntroductIon
Nutrient pollution from nonpoint sources affects aquatic ecosystems worldwide (Carpenter et al. 1998). Among these systems, streams are particularly vulnerable to the effects of nonpoint nutrient pollution due to their
connection to the surrounding landscape via ground-water and/or surface water runoff (Mulholland 1992, Sudduth et al. 2013). Human activities, such as urbani-zation and agriculture, have dramatically increased nutrient concentrations (i.e., nitrogen [N] and phos-phorus [P]) in streams in recent decades (Alexander and Smith 2006), contributing to degradation of water quality (Brown and Froemke 2012). Increased availability of nutrients can have fundamental effects on ecosystem- level processes, such as macroinvertebrate production (Cross et al. 2006) and particulate organic matter breakdown (Ferreira et al. 2015). However, nutrient effects on particulate organic matter pathways are typi-cally outside of the scope of nutrient pollution
Convergence of detrital stoichiometry predicts thresholds of nutrient- stimulated breakdown in streams
davId W. P. MannIng,1,5 aMy d. roseMond,1 vladIslav gulIs,2 Jonathan P. Benstead,3 John s. KoMInosKI,1,6 and John c. Maerz4
1Odum School of Ecology, University of Georgia, Athens, Georgia 30602 USA2Department of Biology, Coastal Carolina University, Conway, South Carolina 29528 USA
3Department of Biological Sciences, University of Alabama, Tuscaloosa, Alabama 35487 USA4Warnell School of Forest Resources, University of Georgia, Athens, Georgia 30602 USA
Abstract. Nutrient enrichment of detritus- based streams increases detrital resource quality for consumers and stimulates breakdown rates of particulate organic carbon (C). The relative importance of dissolved inorganic nitrogen (N) vs. phosphorus (P) for detrital quality and their effects on microbial- vs. detritivore- mediated detrital breakdown are poorly understood. We tested effects of experimental N and P additions on detrital stoichiometry (C:N, C:P) and total and microbial breakdown (i.e., with and without detritivorous shredders, respec-tively) of five detritus types (four leaf litter species and wood) with different initial C : nutrient content. We enriched five headwater streams continuously for two years at different relative availabilities of N and P and compared breakdown rates and detrital stoichiometry to pre-treatment conditions. Total breakdown rates increased with nutrient enrichment and were predicted by altered detrital stoichiometry. Streamwater N and P, fungal biomass, and their interactions affected stoichiometry of detritus. Streamwater N and P decreased detrital C:N, whereas streamwater P had stronger negative effects on detrital C:P. Nutrient addition and fungal biomass reduced C:N by 70% and C:P by 83% on average after conditioning, com-pared to only 26% for C:N and 10% for C:P under pretreatment conditions. Detritus with lowest initial nutrient content changed the most and had greatest increases in total breakdown rates. Detrital stoichiometry was reduced and differences among detritus types were homog-enized by nutrient enrichment. With enrichment, detrital nutrient content approached detri-tivore nutritional requirements and stimulated greater detritivore vs. microbial litter breakdown. We used breakpoint regression to estimate values of detrital stoichiometry that can potentially be used to indicate elevated breakdown rates. Breakpoint ratios for total breakdown were 41 (C:N) and 1518 (C:P), coinciding with total breakdown rates that were ~1.9 times higher when C:N or C:P fell below these breakpoints. Microbial and shredder- mediated breakdown rates both increased when C:N and C:P were reduced, suggesting that detrital stoichiometry is useful for predicting litter breakdown dominated by either microbial or shredder activity. Our results show strong effects of nutrient enrichment on detrital stoichiometry and offer a robust link between a potential holistic nutrient loading metric (decreased and homogenized detrital stoichiometry) and increased C loss from stream ecosystems.
Key words: breakpoint regression; carbon; detritus; ecological stoichiometry; fungi; nitrogen; phosphorus; shredders; threshold elemental ratios; Coweeta Hydrologic Laboratory; Long Term Ecological Research (LTER); Appalachian Mountains; Macon County; North Carolina; USA.
Ecological Applications, 26(6), 2016, pp. 1745–1757 © 2016 by the Ecological Society of America
Manuscript received 1 July 2015; revised 4 January 2016; accepted 28 January 2016. Corresponding Editor: C. Nilsson.
5Present address: School of Environment and Natural Resources, The Ohio State University, 210 Kottman Hall 2021 Coffey Road Columbus, Ohio 43210, USA. E-mail: [email protected]
6Present address: Department of Biological Sciences, Florida International University, 11200 SW 8th Street Miami, Florida 33199, USA.

DAVID W. P. MANNING ET AL. Ecological Applications Vol. 26, No. 6
1746
management practices, which tend to rely on metrics related to primary production (e.g., Evans- White et al. 2013).
Particulate organic matter (hereafter detritus) is a crucial resource for stream ecosystems (Wallace et al. 1997, Hall et al. 2000), and nutrient loading from watershed sources can alter its availability (Kominoski and Rosemond 2012). Recent evidence suggests that increased nutrients can rapidly deplete detritus (Rosemond et al. 2015), but development of robust relationships between added nutrients and the mecha-nisms driving detrital breakdown is lacking. In contrast, relationships between nutrients and production of algal carbon (C) or stream periphyton community structure are more established (e.g., Elser et al. 2007, Taylor et al. 2014). A potential indicator of nutrient pollution effects in stream ecosystems is the rate of detrital breakdown (Gessner and Chauvet 2002). However, stressors that occur in parallel with excessive nutrient loading (e.g., toxic pollutants) may reduce a key trophic guild, detri-tivores (e.g., shredding macroinvertebrates, hereafter shredders), causing inconsistent effects of nutrient con-centrations on detrital breakdown and impeding its use as an indicator of ecosystem health in streams affected by multiple stressors (Woodward et al. 2012). Stronger mechanistic links between consistent nutrient- mediated changes to ecosystem structure and function are needed to adequately assess integrity of detritus- based streams (Palmer and Febria 2012).
Detrital breakdown in streams is driven by interacting abiotic and biotic factors, including abrasion, microbial conditioning, and consumption by shredders (Tank et al. 2010). In terrestrial and aquatic systems, detrital breakdown rates can be partially explained by initial detrital quality (i.e., C:N, or C:P), with slower rates of decomposition for detritus that are nutrient- poor (i.e., high C:N, C:P; Cornwell et al. 2008, Hladyz et al. 2009). Nutrient enrichment can increase the nutrient content of detritus (Rosemond et al. 2010, Scott et al. 2013, Prater et al. 2015), potentially homogenizing formerly diverse detrital resources in terms of elemental stoichiometry (i.e., C:N or C:P). These effects occur through microbial colonization and biomass accrual on detritus and asso-ciated immobilization of dissolved inorganic nutrients (Suberkropp 1995, Cheever et al. 2012, Tant et al. 2013, Mehring et al. 2015), such that wide- ranging detrital C : nutrient content becomes increasingly homogenous via microbial conditioning (e.g., Rosemond et al. 2010, Frainer et al. 2015; Fig. 1).
Reduction and homogenization of detrital C : nutrient content driven by microbial decomposers in streams (especially aquatic hyphomycetes; Findlay et al. 2002) can affect the activity of shredders. Specifically, microbial enhancement of detrital nutrient content can cause detrital C:N or C:P to more closely match the shredder threshold elemental ratio (TER), or the point at which the consumer switches from nutrient limitation to C limitation (Sterner and Elser 2002). The implication
FIg. 1. A conceptual representation of how nutrients could affect microbially mediated conditioning and detrital stoichiometry, and the quality of the resource for shredders, inspired by and modified from Wickings et al. (2012). We show reference and nutrient- enriched conditions, where the leaf litter species used in this study (poplar, maple, oak, and rhododendron) converge to a similar C : nutrient stoichiometry and approach shredder threshold elemental ratios (TERs) under nutrient enrichment. We expected that detrital breakdown rates would be increased under nutrient enrichment and could be predicted based on litter C:N and C:P approaching optimal C : nutrient content after nutrient- enhanced microbial conditioning.

NUTRIENT THRESHOLDS OF LITTER BREAKDOWNSeptember 2016 1747
of such reduced imbalances between detritus and detritivore TERs is increased consumption (Frainer et al. 2015), and/or growth by individuals (Frainer et al. 2015, Fuller et al. 2015, Halvorson et al. 2015), and potentially increased reproduction and survival at the population level (e.g., Danger et al. 2013). Combined, these effects of increased nutrient content on shredder growth, consumption, and survival could affect the rate at which detritus is processed in streams. However, the association between nutrient- stimulated changes to detrital C:N and C:P and breakdown rates remains poorly characterized, particularly with respect to differential effects of streamwater N vs. P on detrital C : nutrient content and subsequent microbial vs. shredder- mediated effects on breakdown rates.
Our objective was to assess if detrital C : nutrient stoichiometry affected by nutrient pollution could be linked to increased microbial and shredder- mediated detrital breakdown rates. We explored these relation-ships using multiyear, whole- ecosystem enrichments of five headwater streams with a crossed gradient of N and P concentrations. We used a set of five substrates (four leaf litter species and wood veneers) that spanned a wide range of initial C:N and C:P ratios. We pre-dicted that nutrient enrichment would enhance microbial conditioning and stoichiometric homogeni-zation of diverse detritus types (Fig. 1) and that litter nutrient content would depend on streamwater nutrient concentrations (i.e., that P would have stronger negative effects on C:P and that N would have stronger negative effects on C:N; Kominoski et al. 2015). We also predicted that microbial effects on litter nutrient concentrations would produce C : nutrient content that approached estimated shredder TERs and thereby facilitate shredder- mediated breakdown (Frost et al. 2006, Tant et al. 2013). If shredder activity is stimulated by such convergence of detrital stoichi-ometry toward shredder TERs, we would also expect breakdown rates to exhibit threshold responses at or around detrital C:N and/or C:P ratios that matched detritivore TERs.
Methods
Site description and experimental design
Our study took place at Coweeta Hydrologic Laboratory (CWT), a USDA Forest Service research station and Long Term Ecological Research (LTER) site located in the southern Appalachian Mountains in Macon County, North Carolina, USA (see Swank and Crossley 1988). We selected five 70- m reaches in first- order streams within the Dryman Fork catchment to receive continuous dosing of N and P for two years. The streams were similar physically and chemically and contained similar abundance and biomass of shredders prior to nutrient additions based on analysis of simi-larity (ANOSIM) of shredder community data from
litterbags (see Methods: Detrital breakdown rates; ANOSIM R = −0.005 and 0.004, for shredder abun-dance and biomass, respectively; P > 0.05 in both cases). Following a year of pretreatment data col-lection, we began dosing the entire length of each 70- m reach on 11 July 2011 with solutions of ammonium nitrate (NH4NO3) and phosphoric acid (H3PO4) using solar- powered metering pumps (LMI Milton Roy, Ivyland, Pennsylvania, USA) connected to gravity- fed irrigation lines supplied with streamwater. The dosing system in each stream was programed to be propor-tional to discharge measured continuously using pressure transducers (Keller America, Newport News, Virginia, USA) and CR800 dataloggers (Campbell Scientific, Logan, Utah, USA). Dripper spouts were placed ~5 m apart along the irrigation line to ensure adequate mixing along each 70- m reach.
Each stream reach received a unique concentrated solution of N and P to target five increasing concentrations of N (added + background = 81, 244, 365, 488, 650 μg/L as dissolved inorganic nitrogen [DIN]) and corresponding decreasing concentrations of P (added + background = 90, 68, 51, 33, and 11 μg/L as soluble reactive phosphorus [SRP]), resulting in a unique target N:P ratio for each stream (2, 8, 16, 32, and 128, respectively). Multiple streamwater samples (n = 4) were taken every ~15 m along each of the 70- m reaches on days 1, 4, 7, 14, 23, 29, and 34 of enrichment to confirm adequate mixing of added nutrients. After day 34 of enrichment, streamwater was collected above (n = 1) and below (n = 3, at 10, 17, and 70 m) the nutrient dosing system biweekly, filtered in the field (0.45- μm nitrocellulose membrane filters; Millipore Billerica, Massachusetts, USA), frozen within 24 h after retrieval, and analyzed for DIN (NH4–N + NO3–N) and SRP concentrations within 28 d (Alpkem Rapid Flow Analyzer 300 for DIN, spectrophotometric method with UV- 1700 spectrophotometer, Shimadzu, Kyoto, Japan, for SRP). Two- year average measured DIN concentrations during enrichment (83, 198, 330, 363, and 309 μg/L; all values respective to treatment targets previously discussed) were close to but lower than target concentrations. Two- year average measured SRP concentrations (49, 55, 36, 22, and 7 μg/L) were also close to but lower than target concentrations. Measured concentrations reflected the effects of uptake, so we also calculated the actual amounts of DIN and SRP that were added to the streams; the latter values were used for the analyses presented here. These enriched concentrations were determined using the quantity of nutrients added to each stream based on detailed nutrient solution refill records, total daily dis-charge, and measured background concentrations from samples collected above the nutrient dosing system. Further details about the experimental design, infra-structure, and stream physicochemical characteristics can be found in Manning et al. (2015) and Rosemond et al. (2015).
DAVID W. P. MANNING ET AL. Ecological Applications Vol. 26, No. 6
1748
Detrital breakdown rates
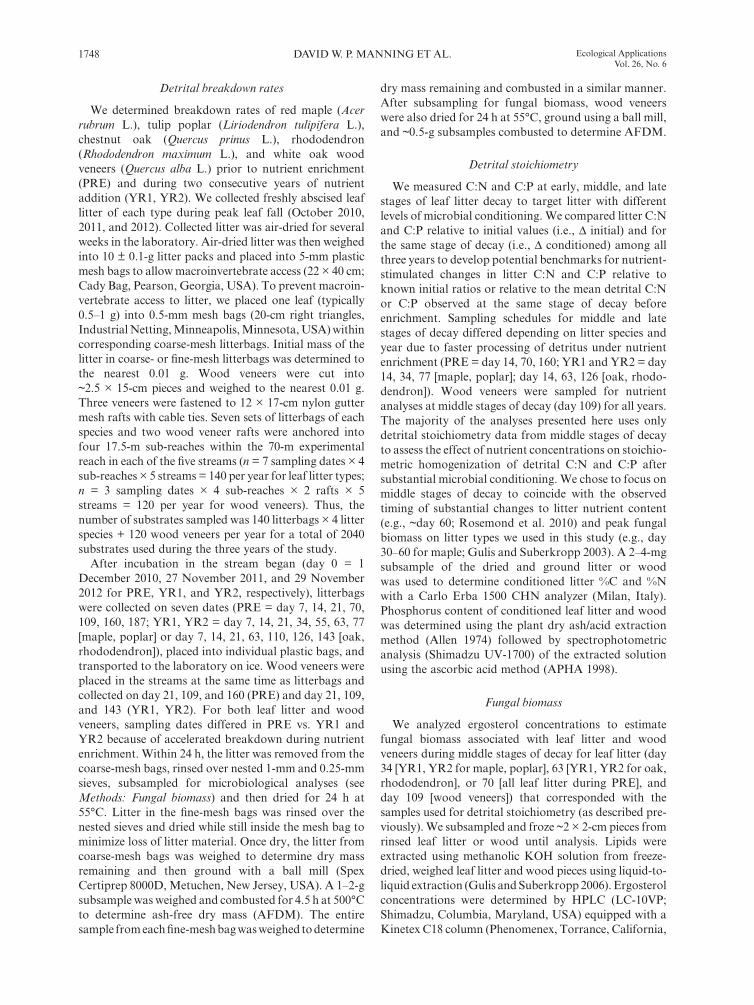
We determined breakdown rates of red maple (Acer rubrum L.), tulip poplar (Liriodendron tulipifera L.), chestnut oak (Quercus prinus L.), rhododendron (Rhododendron maximum L.), and white oak wood veneers (Quercus alba L.) prior to nutrient enrichment (PRE) and during two consecutive years of nutrient addition (YR1, YR2). We collected freshly abscised leaf litter of each type during peak leaf fall (October 2010, 2011, and 2012). Collected litter was air- dried for several weeks in the laboratory. Air- dried litter was then weighed into 10 ± 0.1-g litter packs and placed into 5- mm plastic mesh bags to allow macroinvertebrate access (22 × 40 cm; Cady Bag, Pearson, Georgia, USA). To prevent macroin-vertebrate access to litter, we placed one leaf (typically 0.5–1 g) into 0.5- mm mesh bags (20- cm right triangles, Industrial Netting, Minneapolis, Minnesota, USA) within corresponding coarse- mesh litterbags. Initial mass of the litter in coarse- or fine- mesh litterbags was determined to the nearest 0.01 g. Wood veneers were cut into ~2.5 × 15- cm pieces and weighed to the nearest 0.01 g. Three veneers were fastened to 12 × 17- cm nylon gutter mesh rafts with cable ties. Seven sets of litterbags of each species and two wood veneer rafts were anchored into four 17.5- m sub- reaches within the 70- m experimental reach in each of the five streams (n = 7 sampling dates × 4 sub- reaches × 5 streams = 140 per year for leaf litter types; n = 3 sampling dates × 4 sub- reaches × 2 rafts × 5 streams = 120 per year for wood veneers). Thus, the number of substrates sampled was 140 litterbags × 4 litter species + 120 wood veneers per year for a total of 2040 substrates used during the three years of the study.
After incubation in the stream began (day 0 = 1 December 2010, 27 November 2011, and 29 November 2012 for PRE, YR1, and YR2, respectively), litterbags were collected on seven dates (PRE = day 7, 14, 21, 70, 109, 160, 187; YR1, YR2 = day 7, 14, 21, 34, 55, 63, 77 [maple, poplar] or day 7, 14, 21, 63, 110, 126, 143 [oak, rhododendron]), placed into individual plastic bags, and transported to the laboratory on ice. Wood veneers were placed in the streams at the same time as litterbags and collected on day 21, 109, and 160 (PRE) and day 21, 109, and 143 (YR1, YR2). For both leaf litter and wood veneers, sampling dates differed in PRE vs. YR1 and YR2 because of accelerated breakdown during nutrient enrichment. Within 24 h, the litter was removed from the coarse- mesh bags, rinsed over nested 1- mm and 0.25- mm sieves, subsampled for microbiological analyses (see Methods: Fungal biomass) and then dried for 24 h at 55°C. Litter in the fine- mesh bags was rinsed over the nested sieves and dried while still inside the mesh bag to minimize loss of litter material. Once dry, the litter from coarse- mesh bags was weighed to determine dry mass remaining and then ground with a ball mill (Spex Certiprep 8000D, Metuchen, New Jersey, USA). A 1–2- g subsample was weighed and combusted for 4.5 h at 500°C to determine ash- free dry mass (AFDM). The entire sample from each fine- mesh bag was weighed to determine
dry mass remaining and combusted in a similar manner. After subsampling for fungal biomass, wood veneers were also dried for 24 h at 55°C, ground using a ball mill, and ~0.5-g subsamples combusted to determine AFDM.
Detrital stoichiometry
We measured C:N and C:P at early, middle, and late stages of leaf litter decay to target litter with different levels of microbial conditioning. We compared litter C:N and C:P relative to initial values (i.e., Δ initial) and for the same stage of decay (i.e., Δ conditioned) among all three years to develop potential benchmarks for nutrient- stimulated changes in litter C:N and C:P relative to known initial ratios or relative to the mean detrital C:N or C:P observed at the same stage of decay before enrichment. Sampling schedules for middle and late stages of decay differed depending on litter species and year due to faster processing of detritus under nutrient enrichment (PRE = day 14, 70, 160; YR1 and YR2 = day 14, 34, 77 [maple, poplar]; day 14, 63, 126 [oak, rhodo-dendron]). Wood veneers were sampled for nutrient analyses at middle stages of decay (day 109) for all years. The majority of the analyses presented here uses only detrital stoichiometry data from middle stages of decay to assess the effect of nutrient concentrations on stoichio-metric homogenization of detrital C:N and C:P after substantial microbial conditioning. We chose to focus on middle stages of decay to coincide with the observed timing of substantial changes to litter nutrient content (e.g., ~day 60; Rosemond et al. 2010) and peak fungal biomass on litter types we used in this study (e.g., day 30–60 for maple; Gulis and Suberkropp 2003). A 2–4- mg subsample of the dried and ground litter or wood was used to determine conditioned litter %C and %N with a Carlo Erba 1500 CHN analyzer (Milan, Italy). Phosphorus content of conditioned leaf litter and wood was determined using the plant dry ash/acid extraction method (Allen 1974) followed by spectrophotometric analysis (Shimadzu UV- 1700) of the extracted solution using the ascorbic acid method (APHA 1998).
Fungal biomass
We analyzed ergosterol concentrations to estimate fungal biomass associated with leaf litter and wood veneers during middle stages of decay for leaf litter (day 34 [YR1, YR2 for maple, poplar], 63 [YR1, YR2 for oak, rhododendron], or 70 [all leaf litter during PRE], and day 109 [wood veneers]) that corresponded with the samples used for detrital stoichiometry (as described pre-viously). We subsampled and froze ~2 × 2-cm pieces from rinsed leaf litter or wood until analysis. Lipids were extracted using methanolic KOH solution from freeze- dried, weighed leaf litter and wood pieces using liquid- to- liquid extraction (Gulis and Suberkropp 2006). Ergosterol concentrations were determined by HPLC (LC- 10VP; Shimadzu, Columbia, Maryland, USA) equipped with a Kinetex C18 column (Phenomenex, Torrance, California,

NUTRIENT THRESHOLDS OF LITTER BREAKDOWNSeptember 2016 1749
USA) and a UV detector set at 282 nm (Gulis and Suberkropp 2006). We used external ergosterol standards (Acros Organics, Geel, Belgium), and ergosterol concen-trations were converted to fungal biomass using a standard conversion factor of 5.5 μg of ergosterol/mg of fungal dry mass (Gessner and Chauvet 1993).
Data analysis
Total leaf litter and wood breakdown rates (i.e., microbial + shredder = ktotal) were estimated based on the percent litter or wood mass remaining over time according to the negative- exponential model (Petersen and Cummins 1974)
where mt is the detrital mass remaining at time t, m0 is the initial litter or wood mass, and k is the breakdown rate. We determined a unique decay rate k for each leaf litter type and wood veneers from each sub- reach within the 70- m experimental reach (n = 4 sub- reaches × 5 streams × 5 detritus types × 3 yr = 300). Breakdown rates of litter in fine- mesh bags were determined in the same way, and we considered these estimates to reflect microbial breakdown rates (kmicrobe). We determined shredder contributions to breakdown rates by sub-tracting kmicrobe from total breakdown rates (i.e., ktotal − kmicrobe = kshredder; Woodward et al. 2012).
All analyses were conducted using the statistical software R v. 3.0.1 (R Core Team 2013). Response vari-ables were ln- transformed when appropriate to meet assumptions of normality or linearity. We used an ANOVA model to test for overall nutrient enrichment effects on detrital C:N and C:P across years and detritus types. We then applied a linear model to assess the effects of N and P concentrations (as continuous variables) on detrital C:N and C:P, respectively. We expected that N and P effects would be additive, but fungal biomass effects would interact with nutrient concentrations (e.g., Kominoski et al. 2015, Manning et al. 2015). This model also included a categorical predictor for detritus type, such that we tested for differences in mean C:N or C:P among the five detritus types (i.e., differences in the intercept for the detritus). Therefore, our model predicting detrital C:N and C:P included N and P concentrations, their interaction with fungal biomass, and detritus type. We standardized predictor variables using z scores to compare predictor variables measured at different scales and to aid the inter-pretation of interactions between continuous predictors (i.e., N and P concentrations and fungal biomass; Gelman and Hill 2007). Slope coefficients for this model can be interpreted as the expected change in detrital C:N or C:P for an increase in N, P, or fungal biomass concentration by one standard deviation. Because we centered our data, main effects in the models can be interpreted as the pre-dicted effect of a given parameter on detrital C:N or C:P for detritus with mean fungal biomass or in streamwater with mean N or P concentration.
We analyzed the contributions of microbial and shredder- mediated breakdown rates (i.e., kmicrobe vs. ktotal − kmicrobe = kshredder; wood k was excluded for this analysis) with respect to nutrient enrichment (i.e., by year) and detritus type. The relative contribution of microor-ganisms vs. shredders can be determined based on the ratio of kshredder/kmicrobe, where a ratio < 1 indicates greater microbial contributions (Hladyz et al. 2010). We tested for differences in contributions of microbial vs. shredder- mediated breakdown using ANOVA, with year as the main predictor of ln- transformed kshredder/kmicrobe. Finally, we used breakpoint regression to pinpoint possible thresholds in the relationship between leaf litter breakdown and detrital C:N or C:P (Dodds et al. 2010). Breakpoint regression allows for the estimation of piece- wise linear relationships and can be used to pinpoint the value where the linear relationship between two variables changes (Muggeo 2003). We specifically used these break-point models to identify the point at which the relationship between C:N or C:P and leaf litter breakdown changed significantly. We then compared the breakpoint C:N and C:P values identified by the models to previously reported shredder TERs (e.g., Tant et al. 2013). Specifically, we compared breakpoints ad hoc to the values reported in Tant et al. (2013), which was specific to a dominant shredder in our system (larvae of a caddisfly in the genus Pycnopsyche, TER C:N = 27, C:P = 1992) and is also comparable to detritivore TER C:P values from Frost et al. (2006; mean ± SD TER C:P = 1,495 ± 1,154) and Halvorson et al. (2015; Pycnopsyche lepida TER C:P = 1620). We used the R package segmented (Muggeo 2003) to analyze our data for possible breakpoints that could correspond to shredder TERs.
results
Nutrient enrichment effects on detrital stoichiometry
Decreases in detrital C:N and C:P relative to initial C:N and C:P (i.e., Δ initial) were enhanced by nutrient enrichment (Appendix S1: Table S1; Fig. 2). In the pre-treatment year, there were relatively small changes from initial stoichiometry through time. Specifically, in the pre-treatment year, leaf litter C:N and C:P were reduced 30% and 24% compared to initial, respectively, and wood C:N and C:P were reduced 11% and increased 47%, respec-tively (Appendix S1: Table S1). Under nutrient- enrichment (YR1 and YR2), leaf litter C:N was reduced by ~50% and leaf litter C:P was reduced by ~60% compared to initial C:N and C:P. Wood exhibited the sharpest reductions in C:N and C:P compared to initial ratios under nutrient- enriched conditions and was reduced by >70% for both C:N and C:P in YR1 and YR2 (Appendix S1: Table S1).
Nutrient- stimulated reductions in C:N and C:P also resulted in pronounced differences in detrital nutrient content between the pretreatment and nutrient- enriched years for the same stage of decay (i.e., Δ conditioned; Appendix S1: Table S1). Nutrient enrichment led to
mt=m
0e−kt
,

DAVID W. P. MANNING ET AL. Ecological Applications Vol. 26, No. 6
1750
27% and 29% reductions in mean detrital C:N for YR1 and YR2 compared to pretreatment values at middle stages of decay across leaf litter species (Appendix S1: Table S1). For wood, nutrient enrichment led to 66% and 73% reductions in mean detrital C:N for YR1 and YR2 at middle stages of decay compared to pre-treatment. Significantly greater reductions in mean detrital C:N at middle stages of decay were observed for poplar, rhododendron, and wood veneers compared to red maple leaf litter in YR1 and YR2 (Appendix S1: Table S1).
Detrital C:P was reduced to a greater degree than C:N during YR1 and YR2 (Appendix S1: Table S1; Fig. 2). Conditioning under nutrient enrichment led to 52% and 48% reductions in mean C:P for YR1 and YR2 com-pared to pretreatment values across leaf litter species (Appendix S1: Table S1). Nutrient enrichment led to 80% and 93% reductions in wood C:P compared to pre-treatment. Significantly greater reductions in mean detrital C:P were observed for wood veneers and rhodo-dendron leaf litter compared to red maple leaf litter, but not other leaf litter species in YR1 and YR2 (Appendix S1: Table S1).
Microbial and streamwater nutrient effects on stoichiometric homogenization of detritus
The effects of N and P concentrations, fungal biomass, their interactions, and detritus type explained 54% and 58% of the variation in conditioned detrital C:N and C:P, respectively, based on adjusted R2 values from each model. The effects of fungal biomass on detrital C:N and C:P were dependent on N and P availability (Table 1); specifically, there was a positive association between added N and P concentrations, fungal biomass, and detrital stoichiometry corresponding to stronger negative effects of fungal biomass on detrital C:N and C:P with increased N and P concentrations. The combined effects of N and P on detrital C:N and C:P ratios were compa-rable to the effects of fungal biomass alone based on the scaled coefficients in the models. That is, the N and P effects on detritus with mean fungal biomass were com-parable to fungal biomass effects given mean N and P concentrations (Table 1).
The C:N ratio of leaf litter and wood was driven by fungal biomass, streamwater N, streamwater P, and the interaction between fungal biomass and streamwater N.
FIg. 2. Mean C:N (top row) and C:P (bottom row) for leaf litter collected during pretreatment (PRE) (open circles) or nutrient-enriched conditions (YR1 and YR2; filled gray and black circles, respectively). Early (d 14), middle (d 70 [PRE], 34, or 62) and late (d 160 [PRE], 77, or 143) C:N and C:P are shown depending on the given leaf litter type and year. Asterisks indicate mean initial C:N or C:P across all three years (n = 15). All error bars indicate ± 1 standard error. Lines connect points from the same year (dashed = PRE; solid gray = YR1; solid black = YR2). Conditioned C:N or C:P were only measured on wood veneers on d 109 in all years, and are compared among years using boxplots (rightmost graph on top and bottom rows of the figure; note different y-axis scales). Solid horizontal lines, open boxes, and whiskers in the boxplots indicate median, interquartile range, and 1.5 times the 1st and 3rd quartile, respectively. Outliers > 1.5 times the 3rd quartile are shown with open circles outside the whiskers. Dotted lines denote mean (n = 5) initial C:N or C:P ratios for wood veneers. All ratios are molar. Note: Increased C:N or C:P on day 14 compared to initial for most litter types occurred PRE but not during enrichment years, likely reflecting initial leaching of N and P relative to C under those conditions. .

NUTRIENT THRESHOLDS OF LITTER BREAKDOWNSeptember 2016 1751
Based on comparisons among the scaled coefficients, the strength of the effect of streamwater N on detrital C:N was weaker than the effect of streamwater P on detrital C:N for detritus with mean fungal biomass (Table 1). In general, the most N- poor substrates (i.e., rhododendron, wood) tended to gain the most N and showed significant decreases in C:N compared to relatively nutrient- rich detritus (e.g., red maple; Appendix S1: Table S2), although poplar also showed decreased C:N compared to maple. As a result, differences between rhododendron and wood C:N vs. maple, poplar, and oak C:N were reduced under nutrient- enriched conditions (Appendix S1: Table S3). For example, mean wood C:N was ~2.9 times greater than maple C:N under pretreatment conditions, whereas mean wood C:N was essentially equivalent to maple C:N (~1.0 times) under nutrient- enriched conditions (Appendix S1: Table S3). Likewise, the range of C:N values was reduced by 65% under nutrient- enriched conditions; C:N values of all five detritus types spanned a range between 27 and 133 compared to 37 and 337 under pretreatment conditions. Across our N:P treatments, we found that the greatest reductions in detrital C:N occurred when dis-solved N:P ≥ 32, but the differences between reduced C:N values among streams were small (mean C:N = 48 vs. C:N = 43 for treatment N:P = 2 and 128, respectively).
The C:P ratio of leaf litter and wood was also driven by fungal biomass, streamwater P, and the interaction between fungal biomass and streamwater N and P (Table 1). The strongest driver of conditioned detrital C:P ratios was fungal biomass, followed by nearly equal control by streamwater P (Table 1). The most P- poor sub-strates (i.e., rhododendron, wood) gained the most P, leading to sharp decreases in C:P compared to more nutrient- rich substrates (e.g., maple; Appendix S1: Table S2). As a result, differences between rhododendron and
wood C:P vs. maple, poplar, and oak C:P were reduced under nutrient- enriched conditions. For instance, mean wood C:P was ~6.5 times greater than mean maple C:P under pretreatment conditions, whereas wood C:P was only ~1.5 times higher than maple C:P under nutrient- enriched conditions (Appendix S1: Table S3). Likewise, the range of C:P values was reduced by 60% under nutrient- enriched conditions; C:P values of all five detritus types spanned a range between 669 and 19, 956 compared to 1042 and 49, 496 under pretreatment conditions. Across our N:P treatments, we found that the differences in litter stoichiometry values among streams were larger for C:P compared to C:N (mean C:P = 1,205 vs. C:P = 2,705 for treatment N:P = 2 and 128, respectively).
Effects of nutrient enrichment and initial stoichiometry on detrital breakdown rates
Reduced and homogenized detrital stoichiometry cor-responded to increased detrital breakdown rates, espe-cially for ktotal. Across litter types and years, total breakdown rates were ~2.5 times pretreatment rates, whereas microbial breakdown rates in YR1 and YR2 were only ~1.4 times pretreatment rates (Appendix S1: Table S4). Similar to reductions in detrital C : nutrient ratios, increases in total breakdown rates were more pronounced for recalcitrant leaf litter species: average ktotal for oak and rhododendron was 2.4 times and 3.9 times higher during nutrient enrichment, compared to 1.8 times and 2.3 times higher breakdown rates for maple and poplar, respectively (Appendix S1: Table S4). We found a positive, linear rela-tionship between the magnitude of the increase in breakdown rate under nutrient enrichment (mean YR1 and YR2 ktotal / PRE ktotal; Fig. 3A, B; Appendix S1: Table S4) and the initial C:N or C:P of the detritus, such
taBle 1. Parameter estimates based on linear models for drivers of leaf litter and wood stoichiometry. Intercepts correspond to mean ln- transformed maple (M), poplar (P), oak (O), rhododendron (R), and wood (W) C:N or C:P, and standardized slopes correspond to effects of added N (N conc.) or P (P conc.) concentrations on detrital stoichiometry, and their interactions with fungal biomass (i.e., N × fungi and P × fungi).
C:N model Estimate SE C:P model Estimate SE
InterceptsM 3.789 0.040 M 7.276 0.068P −0.202 0.054 P −0.199 0.091O 0.071 0.056 O 0.147 0.094R 0.408 0.057 R 0.400 0.098W 0.243 0.054 W 0.385 0.092
SlopesFungi −0.123 0.021 Fungi −0.263 0.035N conc. −0.049 0.020 N conc. −0.043 0.034P conc. −0.081 0.020 P conc. −0.238 0.034N × fungi 0.078 0.021 N × fungi 0.159 0.035P × fungi 0.070 0.021 P × fungi 0.166 0.036
Notes: These predictors explained 54% and 58% of the variation in detrital C:N and C:P, respectively.All slopes are based on relationships between scaled predictors (using z scores) and ln- transformed response variables (i.e., middle- stage C:N, C:P). Standardized slopes are useful for direct comparisons of parameters measured at different scales and for interpreting interactions between continuous variables (Gelman and Hill 2007). Bold text corresponds to significant differences (P < 0.05) between intercepts for different detritus types in comparison to maple or significant slope estimates (i.e., slope estimates are for fungi, N conc., P conc., and their interactions).

DAVID W. P. MANNING ET AL. Ecological Applications Vol. 26, No. 6
1752
that the most pronounced increases in breakdown rates relative to PRE were for the most nutrient- poor substrates (i.e., highest initial C:N, C:P; Fig. 3A, B).
Effects of shredders on detrital breakdown rates
We found that shredder contributions increased more than microbial contributions to breakdown in YR1 and YR2 based on the ln- transformed ratio, kshredder / kmicrobe (Fig. 4A–D). We tested for differences in shredder con-tributions between years for each detritus type because we found no evidence for interactions between year and detritus type, or differences among streams in terms of the contribution of shredders vs. microorganisms to breakdown rates. We found significantly increased shredder contributions to breakdown for all leaf litter types in all years, with the exception of rhododendron in YR2 (Tukey’s HSD, all P < 0.05; Fig. 4A–D). Maple, poplar, and oak switched from greater relative microbial vs. shredder contribution to breakdown under pre-treatment conditions to greater relative shredder contri-bution in YR1 and YR2 (i.e., ln kshredder / kmicrobe > 0; Fig. 4A–C). For rhododendron, shredder contributions were greater than for other litter types under pretreatment conditions; shredder contributions increased in YR1, but not in YR2, compared to pretreatment conditions (Fig. 4D).
Identifying stoichiometrically explicit breakpoints for detrital breakdown rates
Breakpoints were found in the relationship between total breakdown rates and C:N ratios (Fig. 5A; P < 0.05, adjusted R2 = 0.25) of decaying leaf litter. The identified breakpoint for litter C:N and total litter breakdown was 41 (± 2), which represents a 56% decrease from initial C:N averaged across leaf litter species. Total breakdown
rates differed above and below breakpoints for C:N. Total breakdown rates were 1.8 times higher when C:N was below the breakpoint (Fig. 5A). There were also sig-nificant breakpoints in the relationship between total litter breakdown rates and litter C:P ratios (Fig. 5B; P < 0.05, adjusted R2 = 0.31). The breakpoint for C:P and total litter breakdown was 1,518 (± 167), which rep-resents a 65% decrease from initial C:P averaged across leaf litter types. As with C:N, total breakdown rates dif-fered above and below breakpoints for C:P. Total breakdown rates were 1.9 times higher when C:P was below the breakpoint (Fig. 5B). These breakpoint C:N and C:P ratios for total breakdown rates differed con-siderably from mean leaf litter C:N (63) and C:P (3,167) values for pretreatment conditions, while mean C:N (46) and C:P (1,453) during enriched conditions were more similar to breakpoint C:N and C:P for total breakdown rates. Mean C:N and C:P of leaf litter as well as the breakpoint ratios were comparable to TERs for C:N (27) and C:P (1,992) of an important shredder taxon in our study system (caddisfly larvae in the genus Pycnopsyche; Tant et al. 2013) and to the mean TER C:P reported for detritivores (mean ± SD TER C:P = 1,495 ± 1,154; Frost et al. 2006).
dIscussIon
Linking resource structure and ecosystem function is a crucial step toward developing robust metrics of eco-system integrity (Gessner and Chauvet 2002, Palmer and Febria 2012), particularly with regard to detecting and predicting responses to widespread ecosystem stressors, such as nutrient pollution. Increases in streamwater nutrient concentrations are known to increase litter and wood nutrient content (Stelzer et al. 2003, Gulis et al. 2004); here, we explicitly linked these stoichiometric changes to causative experimental gradients of N and P
FIg. 3. Breakdown rates of leaf litter and wood increased as a function of initial (A) C:N and (B) C:P; solid lines indicate linear relationships between breakdown rate response ratios and intial C:N or C:P (P < 0.05 in both cases, R2 = 0.86, 0.90, respectively). The magnitude of the increase in breakdown rates was calculated as the ratio of the average YR1 and YR2 (ENR) ktotal / PRE ktotal (i.e., the response ratio). Letters correspond to each detritus type: maple (M), poplar (P), oak (O), rhododendron (R), and wood (W).
M
P O
R
W
60 100 140 180
23
45
6
Initial C:N
(ktotal(
EN
R)k total
(PR
E))
A
Bre
akdo
wn
rate
resp
onse
ratio
M
P O
R
W
2000 6000 10000
23
45
6
Initial C:P
B

NUTRIENT THRESHOLDS OF LITTER BREAKDOWNSeptember 2016 1753
and resulting ecosystem function (i.e., increased rates of detrital breakdown).
Our study targeted low- to- moderate nutrient enrichment common in human- modified landscapes
(Scott et al. 2002, Alexander and Smith 2006), but these concentrations were sufficient to induce decreased detrital stoichiometry and increased breakdown rates. Thus, we suggest standardized, nutrient- poor detrital
FIg. 4. The contribution of shredder- mediated breakdown increased with nutrient enrichment for all leaf litter types, with the exception of rhododendron in YR2. We tested for differences in shredder contributions between years for each detritus type because the interaction between year and detritus type was not significant. Shown are mean (error bars indicate (± SE) ln- transformed kshredder / kmicrobe for each leaf litter type: (A) maple, (B) poplar, (C) oak, and (D) rhododendron, and year. The dashed horizontal line at kshredder / kmicrobe = 0 corresponds to the point at which contributions of shredders and microorganisms are equivalent (i.e., ln (1) = 0). Differing letters between years denote significant differences in ln(kshredder/kmicrobe) between years based on ANOVA and Tukey’s HSD post hoc tests at P < 0.05.
–0.5
0.5
1.0
1.5
2.0
Maple
Year
(lnk shredderk m
icrobe)
PRE YR1 YR2
Shr
edde
r vs.
mic
robi
al c
ontri
butio
n
a b bc
A
–0.5
0.5
1.0
1.5
2.0
Poplar
Year
(lnk shredderk m
icrobe)
PRE YR1 YR2
Shr
edde
r vs.
mic
robi
al c
ontri
butio
n
a b bc
B
–0.5
0.5
1.0
1.5
2.0
Oak
Year
(lnk shredderk m
icrobe)
PRE YR1 YR2
Shr
edde
r vs.
mic
robi
al c
ontri
butio
n
a b bc
C
–0.5
0.5
1.0
1.5
2.0
Rhododendron
Year
(lnk shredderk m
icrobe)
PRE YR1 YR2
Shr
edde
r vs.
mic
robi
al c
ontri
butio
n a bc acD
FIg. 5. Total breakdown rates as a function of middle- stage (A) C:N or (B) C:P ratios of all leaf litter species used in this study (wood veneers not included). Vertical dashed lines depict breakpoints for these relationships. Identified breakpoints were 41 and 1518 for C:N and C:P, respectively. Open, filled gray, and filled black circles represent PRE, YR1, and YR2, respectively.
40 60 80 100
0.00
0.02
0.04
0.06
Litter C:N
Leaf
litte
rbre
akdo
wn
rate
(ktotal/d
)
A
2000 4000 6000 8000
0.00
0.02
0.04
0.06
Litter C:P
B

DAVID W. P. MANNING ET AL. Ecological Applications Vol. 26, No. 6
1754
substrates (e.g., wood veneers) could be used to indicate nutrient pollution and its effects on an ecosystem function. For instance, we found that after ~100 d of conditioning, wood veneers had C:N and C:P that was 73% and 80% lower than initial under nutrient- enriched conditions, compared to only 10% lower than initial for C:N and no difference for C:P under pretreatment condi-tions. Thus our data suggest that increased rates of ecosystem- scale C loss may be expected if detrital C:N and C:P are found to be substantially reduced (e.g., >70%) compared to corresponding initial C:N and C:P. These findings offer a potentially significant and useful metric of nutrient- mediated changes to a critical basal resource that can be used to predict where and when accelerated C loss might occur in stream ecosystems in response to nutrient pollution. More studies at the level of stream mesocosms and/or whole streams are needed to further develop the predicted linkage we make here between changes in nutrient content of detritus and detrital loss rates.
Streamwater nutrient and microbial effects on detrital stoichiometry
Nutrient loading from distinct land use can result in skewed N and P availability in streams, thus, the con-centrations and ratios we used mimicked such patterns of N and P loading (e.g., high N:P from N- rich fertilizers vs. low N:P from sewage effluent; Arbuckle and Downing 2001, Peñuelas et al. 2012). Detrital C:N and C:P were reduced across our N:P treatments, but there were dif-ferences in this response when comparing detrital C:N and C:P. For example, our findings suggest that C:N can be affected by increases in either N or P concentrations, as evidenced by similar C:N values across our treatment N:P ratios. In contrast, P effects were stronger than N effects on C:P, indicating that changes in detrital C:P are more dependent on the availability of P when N is also available. These different responses of C:N and C:P to streamwater N compared to P could be important in the context of detritivore nutrient limitation when N and P loading are skewed. Several studies have observed both N- and P- limitation of decomposers (Rosemond et al. 2002, Ferreira et al. 2006) and detritivores (Danger et al. 2013, Frainer et al. 2015). Thus, our findings suggest that N- limitation via detrital resources could be alleviated across elevated N or P concentrations, while P- limitation could be alleviated more when N:P loading is skewed toward lower N:P ratios.
Increased microbial biomass has been implicated as a driver of increased detrital nutrient content (Gulis and Suberkropp 2003, Tant et al. 2013). Our study found that streamwater nutrient availability and fungal biomass together control detrital C : nutrient stoichiometry. Specifically, the effects of streamwater N and P on detrital C:N and C:P were dependent on fungal biomass, but streamwater P concentration effects were stronger than the interaction of streamwater P with fungal biomass.
These results suggest that while DIN effects on detrital C:N are particularly dependent on fungal biomass accrual, streamwater P appears to independently control detrital C:P to a greater degree, as fungi can likely store P without considerable increases in biomass when stream-water P availability is elevated (V. Gulis, unpublished data). Aquatic fungi typically contribute >95% of microbial biomass on coarse detritus, such as leaf litter and wood (Gessner et al. 2007), and thus were likely the major drivers of stoichiometric changes of detritus in this study. Detrital stoichiometry could be affected in a similar way in other systems where fungal decomposers are predominant (e.g., soils/terrestrial detritus; Barantal et al. 2014). However, we cannot rule out the potential effects of bacteria (but see Tant et al. 2013), abiotic sorption (e.g., Mehring et al. 2015), or differential allo-cation of resources to fungal sporulation in response to N vs. P availability in affecting detrital stoichiometry.
Shredder- driven effects on leaf litter breakdown rates
We found that relatively recalcitrant detritus showed greater responses to streamwater nutrients in terms of reduced C : nutrient content and that shredders con-tributed more to the breakdown of all four leaf litter species under nutrient enrichment. These findings com-bined with our breakpoint ratios for increased total breakdown rates suggest that reduced C:N and C:P of detritus is an important driver of increased breakdown rates, particularly when nutrient- poor resources approach shredder nutrient requirements. Thus, the effects of nutrient enrichment on detrital breakdown could be amplified in systems characterized by intact shredder communities and nutrient- poor detritus. Although the presence of shredders may increase nutrient- enrichment effects on detrital breakdown, our analysis demonstrated that microbial breakdown rates also increased. These findings imply that, across diverse systems with and without detritivores, nutrient enrichment will predictably increase detrital C loss rates.
Breakpoints for detrital breakdown
Shredder growth, reproduction, and survival are related to the nutrient content of basal resources con-sumed, particularly if the food resource meets shredder nutrient demands (i.e., approaches the TER; Danger et al. 2013, Halvorson et al. 2015). Our findings support the existence of a causative link between (1) nutrient- mediated microbial processing that drives detrital C:N or C:P toward shredder TERs and (2) subsequent stimu-lation of shredder activity leading to increased litter breakdown rates. As a result of effects of streamwater N and P and fungal biomass, greater than 78% of con-ditioned detrital C:P was found to be below the estimated C:P TER for a dominant shredder in our study system (larvae of the caddisfly Pycnopsyche; C:P TER = 1992; Tant et al. 2013) under enriched conditions compared to

NUTRIENT THRESHOLDS OF LITTER BREAKDOWNSeptember 2016 1755
17% falling below this threshold during pretreatment. Other detritivores can exhibit a range of C:P TERs depending on diet or taxon- specific physiology (e.g., larvae of the cranefly Tipula C:P TER = 1,000–2,500; Fuller et al. 2015) and other reported values of shredder TERs tend to fall in the range of reduced detrital stoi-chiometry found in this study (Frost et al. 2006). However, it is known that some shredders selectively consume and assimilate patches of detritus that contain greater amounts of fungal biomass and nutrients (Arsuffi and Suberkropp 1985, Dodds et al. 2014), complicating the inferences made here based on bulk detrital resources. Nevertheless, we show that nutrient enrichment did increase the prevalence of low C : nutrient detritus that could be consumed by shredders and that these patterns likely correspond to the breakpoints we have identified in the relationship between total litter breakdown rates and detrital C:N and C:P ratios.
Breakpoints in litter breakdown rates were also observed when detritivores were excluded from litter using fine- mesh litterbags (data not shown). In this case, large changes in detrital stoichiometry indicate increased colonization of detritus by microorganisms. Consequently, changes in detrital stoichiometry may indicate increased detrital loss from either decomposers and/or detritivores and thus be applicable to a range of stream types and conditions. Thus, we expect that in areas where shredder abundance is low due to bio-geographic factors (Boyero et al. 2011) or stressors (Griffiths et al. 2009, Woodward et al. 2012), micro-bially driven breakdown will be more important and detrital loss rates would be increased with nutrient enrichment unless decomposers are suppressed by asso-ciated contaminants.
Comparing nutrient- induced changes to detrital vs. biofilm stoichiometry
We found that changes in detrital stoichiometry were induced at low to moderate nutrient concentrations. The changes in detrital stoichiometry we observed were similar to changes in biofilm stoichiometry across gra-dients of N and P concentrations (Taylor et al. 2014). Specifically, Taylor et al. (2014) found that biofilm C:N decreased by 26% and biofilm C:P decreased by 38% when total P increased from 10 to 20 μg/L. When com-paring our data across this range in P concentrations, we found similar responses; detrital C:N decreased by 10% and detrital C:P decreased by 38%. These findings indicate that changes in basal resource stoichiometry can occur due to effects on either autotrophic (e.g., biofilm) or heterotrophic microbial communities and that they may respond to nutrient gradients similarly. Further, as a result of our experimental nutrient additions, detrital stoichiometry that formerly spanned large ranges also became more similar and approached TERs for certain detritivores. A similar pattern occurred in the Taylor et al. (2014) study, where biofilms were more variable in
terms of nutrient content at low nutrient concentrations and more homogeneous at high nutrient concentrations. This similar pattern suggests that the diversity in nutrient content of detritus or biofilms can be reduced by nutrient enrichment, which may affect detritivore and biofilm consumer communities (LeRoy and Marks 2006, Taylor et al. 2014). Given that diverse detritus or biofilm nutrient content typically supports diverse consumer assemblages, nutrient- induced reduction and homogenization of basal resource stoichiometry could potentially lead to low diversity of food quality and associated reduced diversity of consumers (e.g., Evans- White et al. 2009). Thus, nutrient enrichment may diminish stream consumer bio-diversity related to either heterotrophic or autotrophic food web pathways in some cases.
We identified relevant breakpoints for a key ecosystem function in response to microbial homogenization of a key detrital resource trait under nutrient enrichment, a pattern similar to observations made for stream biofilms. Thus, the response of detrital or autotrophic stoichi-ometry could be an important tool for predicting ecosystem- scale consequences of nutrient enrichment. Such assessments of changes in basal resource structure (i.e., reduced and homogenized detrital stoichiometry associated with stream carbon loss) could be useful if incorporated into management strategies for mitigating the effects of nutrient pollution on the functioning of stream ecosystems.
acKnoWledgMents
We are grateful for the maintenance and sampling of the five study streams by Jason Coombs and Katie Norris. Phillip Bumpers, Jason Coombs, Katie Norris, Kait Farrell, James Wood, Tom Maddox, and Emmy Deng helped in the laboratory or in the field. This study received support from the NSF (DEB- 0918894 to A. D. Rosemond and J. C. Maerz, DEB- 0918904 to J. P.Benstead, and DEB- 0919054 to V. Gulis). This study also leveraged logistical support from the CWT LTER Program at the University of Georgia, which is supported by NSF award DEB- 0823293 from the Long Term Ecological Research Program (J. C. Maerz co- PI). Rob Case, Daniel Hutcheson, and Kevin Simpson of YSI Integrated Systems and Services constructed the infrastructure for the nutrient- dosing system. Aqueous ammonium nitrate was provided by The Andersons, Inc., through David Plank. We thank Phillip Bumpers, Alan Covich, Chao Song, Nina Wurzburger, and two reviewers for helpful comments that improved this manuscript.
lIterature cIted
Alexander, R. B., and R. A. Smith. 2006. Trends in the nutrient enrichment of U.S. rivers during the late 20th century and their relation to changes in probable stream trophic conditions. Limnology and Oceanography 51:639–654.
Allen, S. E., editor. 1974. Chemical analysis of ecological materials. Wiley, New York, New York, USA.
American Public Health Association (APHA). 1998. Standard methods for the examination of water and wastewater, Twentieth edition. American Public Health Association, Washington, D.C., USA.

DAVID W. P. MANNING ET AL. Ecological Applications Vol. 26, No. 6
1756
Arbuckle, K. E., and J. A. Downing. 2001. The influence of watershed land use on lake N:P in a predominantly agricultural landscape. Limnology and Oceanography 46:970–975.
Arsuffi, T. L., and K. Suberkropp. 1985. Selective feeding by stream caddisfly (Trichoptera) detritivores on leaves with fungal- colonized patches. Oikos 45:50–58.
Barantal, S., H. Schimann, N. Fromin, and S. Hattenschwiler. 2014. C, N and P fertilization in an Amazonian rainforest supports stoichiometric dissimilarity as a driver of litter diversity effects on decomposition. Proceedings of the Royal Society B 281:20141682.
Boyero, L., et al. 2011. Global distribution of a key trophic guild contrasts with common latitudinal diversity patterns. Ecology 92:1839–1848.
Brown, T. C., and P. Froemke. 2012. Nationwide assessment of nonpoint source threats to water quality. BioScience 62:136–146.
Carpenter, S. R., N. F. Caraco, D. L. Correll, R. W. Howarth, A. N. Sharpley, and V. H. Smith. 1998. Nonpoint pollution of surface waters with phosphorus and nitrogen. Ecological Applications 8:559–568.
Cheever, B. M., E. B. Kratzer, and J. R. Webster. 2012. Immobilization and mineralization of N and P by heterotrophic microbes during leaf decomposition. Freshwater Science 31:133–147.
Cornwell, W. K., et al. 2008. Plant species traits are the predominant control on litter decomposition rates within biomes worldwide. Ecology Letters 11:1065–1071.
Cross, W. F., J. B. Wallace, A. D. Rosemond, and S. L. Eggert. 2006. Whole- system nutrient enrichment increases secondary production in a detritus- based ecosystem. Ecology 87:1556–1565.
Danger, M., J. Arce Funck, S. Devin, J. Heberle, and V. Felten. 2013. Phosphorus content in detritus controls life- history traits of a detritivore. Functional Ecology 27:807–815.
Dodds, W. K., W. H. Clements, K. Gido, R. H. Hilderbrand, and R. S. King. 2010. Thresholds, breakpoints, and nonlinearity in freshwaters as related to management. Journal of the North American Benthological Society 29:988–997.
Dodds, W. K., et al. 2014. You are not always what we think you eat: selective assimilation across multiple whole- stream isotopic tracer studies. Ecology 95:2757–2767.
Elser, J. J., M. E. S. Bracken, E. E. Cleland, D. S. Gruner, W. S. Harpole, H. Hillebrand, J. T. Ngai, E. W. Seabloom, J. B. Shurin, and J. E. Smith. 2007. Global analysis of nitrogen and phosphorus limitation of primary producers in freshwater marine and terrestrial ecosystems. Ecology Letters 10:1135–1142.
Evans-White, M. A., W. K. Dodds, D. G. Huggins, and D. S. Baker. 2009. Thresholds in macroinvertebrate biodiversity and stoichiometry across water- quality gradients in Central Plains (USA) streams. Journal of the North American Benthological Society 28:855–868.
Evans-White, M. A., B. E. Haggard, and J. T. Scott. 2013. A review of nutrient criteria development in the United States. Journal of Environmental Quality 42:1002–1014.
Ferreira, V., V. Gulis, and M. A. S. Graça. 2006. Whole stream nitrate addition affects litter decomposition and associated fungi but not invertebrates. Oecologia 149:718–729.
Ferreira, V., B. Castagneyrol, J. Koricheva, V. Gulis, E. Chauvet, and M. A. S. Graça. 2015. A meta- analysis of the effects of nutrient enrichment on litter decomposition in streams. Biological Reviews 90:669–688.
Findlay, S., et al. 2002. A cross- system comparison of bacterial and fungal biomass in detritus pools of headwater streams. Microbial Ecology 43:55–66.
Frainer, A., J. Jabiol, M. O. Gessner, A. Bruder, E. Chauvet, and B. G. McKie. 2015. Stoichiometric imbalances between detritus and detritivores are related to shifts in ecosystem functioning. Oikos :001–011. http://dx.doi.org/10.1111/oik. 02687
Frost, P. C., J. P. Benstead, W. F. Cross, H. Hillebrand, J. H. Larson, M. A. Xenopoulos, and T. Yoshida. 2006. Threshold elemental ratios of carbon and phosphorus in aquatic consumers. Ecology Letters 9:774–779.
Fuller, C. L., M. A. Evans-White, and S. A. Entrekin. 2015. Growth and stoichiometry of a common aquatic detritivore respond to changes in resource stoichiometry. Oecologia 177:837–848.
Gelman, A., and J. Hill. 2007. Data analysis using regression and multilevel/hierarchical models. Cambridge University Press, Cambridge, UK.
Gessner, M. O., and E. Chauvet. 1993. Ergosterol- to- biomass conversion factors for aquatic hyphomycetes. Applied and Environmental Microbiology 59:502–507.
Gessner, M. O., and E. Chauvet. 2002. A case for using litter breakdown to assess functional stream integrity. Ecological Applications 12:498–510.
Gessner, M. O., V. Gulis, K. A. Kuehn, E. Chauvet, and K. Suberkropp. 2007. Fungal decomposers of plant litter in aquatic ecosystems. Pages 301–324 in C. P. Kubicek and I. S. Druzhinina, editors. The mycota. Springer. Berlin, Germany.
Griffiths, N. A., J. L. Tank, T. V. Royer, E. J. Rosi-Marshall, M. R. Whiles, C. P. Chambers, T. C. Frauendorf, and M. A. Evans-White. 2009. Rapid decomposition of maize detritus in agricultural headwater streams. Ecological Applications 19:133–142.
Gulis, V., and K. Suberkropp. 2003. Leaf litter decomposition and microbial activity in nutrient- enriched and unaltered reaches of a headwater stream. Freshwater Biology 48:123–134.
Gulis, V., and K. Suberkropp. 2006. Fungi: biomass, production, and sporulation of aquatic hyphomycetes. Pages 311–326 in F.R. Hauer and G.A. Lamberti, editors. Methods in stream ecology. Second edition. Academic Press, San Diego, California, USA.
Gulis, V., A. D. Rosemond, K. Suberkropp, H. S. Weyers, and J. P. Benstead. 2004. Effects of nutrient enrichment on the decomposition of wood and associated microbial activity in streams. Freshwater Biology 49:1437–1447.
Hall, R. O., J. B. Wallace, and S. L. Eggert. 2000. Organic matter flow in stream food webs with reduced detrital resource base. Ecology 81:3445–3463.
Halvorson, H. M., J. T. Scott, A. J. Sanders, and M. A. Evans-White. 2015. A stream insect detritivore violates common assumptions of threshold elemental ratio bioenergetics models. Freshwater Science 34:508–515.
Hladyz, S., M. O. Gessner, P. S. Giller, J. Pozo, and G. Woodward. 2009. Resource quality and stoichiometric constraints on stream ecosystem functioning. Freshwater Biology 54:957–970.
Hladyz, S., S. D. Tiegs, M. O. Gessner, P. S. Giller, G. Rîsnoveanu, E. Preda, M. Nistorescu, M. Schindler, and G. Woodward. 2010. Leaf- litter breakdown in pasture and deciduous woodland streams: a comparison among three European regions. Freshwater Biology 55:1916–1929.
Kominoski, J. S., and A. D. Rosemond. 2012. Conservation from the bottom up: forecasting effects of global change on dynamics of organic matter and management needs for river networks. Freshwater Science 31:51–68.

NUTRIENT THRESHOLDS OF LITTER BREAKDOWNSeptember 2016 1757
Kominoski, J. S., A. D. Rosemond, J. P. Benstead, V. Gulis, J. C. Maerz, and D. W. P. Manning. 2015. Low- to- moderate nitrogen and phosphorus concentrations accelerate microbially driven litter breakdown rates. Ecological Applications 25:856–865.
LeRoy, C. J., and J. C. Marks. 2006. Litter quality, stream characteristics and litter diversity influence decomposition rates and macroinvertebrates. Freshwater Biology 51:605–617.
Manning, D. W. P., A. D. Rosemond, J. S. Kominoski, V. Gulis, J. P. Benstead, and J. C. Maerz. 2015. Detrital stoichiometry as a critical nexus for the effects of streamwater nutrients on leaf litter breakdown rates. Ecology 96:2214–2224.
Mehring, A. S., K. A. Kuehn, A. Thompson, C. M. Pringle, A. D. Rosemond, M. R. First, R. R. Lowrance, and G. Vellidis. 2015. Leaf litter nutrient uptake in an intermittent blackwater river: influence of tree species and associated biotic and abiotic drivers. Functional Ecology 29:849–860 http://dx.doi.org/10.1111/1365- 2435.12399
Muggeo, V. M. 2003. Estimating regression models with unknown break- points. Statistics in Medicine 22:3055–3071.
Mulholland, P. J. 1992. Regulation of nutrient concentrations in a temperate forest stream: roles of upland, riparian, and instream processes. Limnology and Oceanography 37:1512–1526.
Palmer, M. A., and C. M. Febria. 2012. The heartbeat of ecosystems. Science 336:1393–1394.
Peñuelas, J., J. Sardans, A. Rivas-Ubach, and I. A. Janssens. 2012. The human- induced imbalance between C, N and P in Earth’s life system. Global Change Biology 18:3–6.
Petersen, R. C., and K. W. Cummins. 1974. Leaf processing in a woodland stream. Freshwater Biology 4:343–368.
Prater, C., E. J. Norman, and M. A. Evans-White. 2015. Relationships among nutrient enrichment, detritus quality and quantity, and large- bodied shredding insect community structure. Hydrobiologia 753:219–232.
R Core Team. 2013. R: a language and environment for statistical computing. R Foundation for Statistical Computing, Vienna, Austria. www.r-project.org
Rosemond, A. D., C. M. Pringle, A. Ramírez, M. J. Paul, and J. L. Meyer. 2002. Landscape variation in phosphorus concentration and effects on detritus- based tropical streams. Limnology and Oceanography 47:278–289.
Rosemond, A. D., C. M. Swan, J. S. Kominoski, and S. E. Dye. 2010. Non- additive effects of litter mixing are sup-pressed in a nutrient- enriched stream. Oikos 119:326–336.
Rosemond, A. D., J. P. Benstead, P. M. Bumpers, V. Gulis, J. S. Kominoski, D. W. P. Manning, K. Suberkropp, and J. B. Wallace. 2015. Experimental nutrient additions
accelerate terrestrial carbon loss from stream ecosystems. Science 347:1142–1145.
Scott, M. C., G. S. Helfman, M. E. McTammany, E. F. Benfield, and P. V. Bolstad. 2002. Multiscale influences on physical and chemical stream conditions across Blue Ridge landscapes. Journal of the American Water Resources Association 38:1379–1392.
Scott, E. E., C. Prater, E. Norman, B. C. Baker, M. Evans-White, and J. T. Scott. 2013. Leaf- litter stoichiometry is affected by streamwater phosphorus concentrations and litter type. Freshwater Science 32:753–761.
Stelzer, R. S., J. Heffernan, and G. E. Likens. 2003. The influence of dissolved nutrients and particulate organic matter quality on microbial respiration and biomass in a forest stream. Freshwater Biology 48:1925–1937.
Sterner, R. W., and J. J. Elser. 2002. Ecological stoichiometry. Princeton University Press, Princeton, New Jersey, USA.
Suberkropp, K. 1995. The influence of nutrients on fungal growth, productivity, and sporulation during leaf break-down in streams. Canadian Journal of Botany 73: S1361–S1369.
Sudduth, E. B., S. S. Perakis, and E. S. Bernhardt. 2013. Nitrate in watersheds: straight from soils to streams? Journal of Geophysical Research: Biogeosciences 118:291–302.
Swank, W. T., and D. A. Crossley. 1988. Forest hydrology and ecology at Coweeta. Springer-Verlag, New York, New York, USA.
Tank, J. L., E. J. Rosi-Marshall, N. A. Griffiths, S. A. Entrekin, and M. L. Stephen. 2010. A review of allochthonous organic matter dynamics and metabolism in streams. Journal of the North American Benthological Society 29:118–146.
Tant, C. J., A. D. Rosemond, and M. R. First. 2013. Stream nutrient enrichment has a greater effect on coarse than on fine benthic organic matter. Freshwater Science 32:1111–1121.
Taylor, J. M., R. S. King, A. A. Pease, and K. O. Winemiller. 2014. Nonlinear response of stream ecosystem structure to low- level phosphorus enrichment. Freshwater Biology 59:969–984.
Wallace, J. B., S. L. Eggert, J. L. Meyer, and J. R. Webster. 1997. Multiple trophic levels of a forest stream linked to terrestrial litter inputs. Science 277:102–104.
Wickings, K., A. S. Grandy, S. C. Reed, and C. C. Cleveland. 2012. The origin of litter chemical complexity during decom-position. Ecology Letters 15:1180–1188.
Woodward, G., et al. 2012. Continental- scale effects of nutri-ent pollution on stream ecosystem functioning. Science 336:1438–1440.
suPPortIng InForMatIon
Additional supporting information may be found in the online version of this article at http://onlinelibrary.wiley.com/doi/10.1890/15-1217.1/suppinfo