Conventional Arms Transfers to Developing Nations, 2008-2015 · Conventional Arms Transfers to...
72
Conventional Arms Transfers to Developing Nations, 2008-2015 Catherine A. Theohary Specialist in National Security Policy and Information Operations December 19, 2016 Congressional Research Service 7-5700 www.crs.gov R44716
Transcript of Conventional Arms Transfers to Developing Nations, 2008-2015 · Conventional Arms Transfers to...
Conventional Arms Transfers to Developing
Nations, 2008-2015
Catherine A. Theohary
Specialist in National Security Policy and Information Operations
December 19, 2016
Congressional Research Service
7-5700
www.crs.gov
R44716

Conventional Arms Transfers to Developing Nations, 2008-2015
Congressional Research Service
Summary This report provides Congress with official, unclassified, quantitative data on conventional arms
transfers to developing nations by the United States and foreign countries for the preceding eight
calendar years for use in its policy oversight functions. All agreement and delivery data in this
report for the United States are government-to-government Foreign Military Sales (FMS)
transactions. Similar data are provided on worldwide conventional arms transfers by all
government suppliers, but the principal focus is the level of arms transfers by major weapons
supplying governments to nations in the developing world.
Developing nations continue to be the primary focus of foreign arms sales activity by weapons
suppliers. During the years 2008-2011, the value of arms transfer agreements with developing
nations comprised 80.39% of all such agreements worldwide. More recently, arms transfer
agreements with developing nations constituted 80.92% of all such agreements globally from
2012-2015, and 81.70% of these agreements in 2015.
The value of all arms transfer agreements with developing nations in 2015 was $65.2 billion. In
2015, the value of all arms deliveries to developing nations was $33.6 billion.
Recently, from 2012 to 2015, the United States and Russia were predominant the arms market in
the developing world, with both nations either ranking first or second in all but the most recent in
these four years in the value of arms transfer agreements. From 2012 to 2015, the United States
made nearly $86 billion in such agreements, 33.38%of all these agreements (expressed in current
dollars). Russia made $48.6 billion, 18.94% of these agreements. During this same period,
collectively, the United States and Russia made 52% of all arms transfer agreements with
developing nations, ($134 billion in current dollars).
In 2015, the United States ranked first in arms transfer agreements with developing nations with
$26.7 billion or 41% of these agreements. In second place was France with $15.2 billion or
23.30% of such agreements.
In 2015, the United States ranked first in the value of arms deliveries to developing nations at
$11.9 billion, or 35.42% of all such deliveries. Russia and France tied for second in these
deliveries at $6.2 billion each and each representing 18.45%.
In worldwide arms transfer agreements in 2015—to both developed and developing nations—the
United States was predominant, ranking first with $40.2 billion in such agreements or 50.29% of
all such agreements. France ranked second in worldwide arms transfer agreements in 2015 with
$15.3 billion in such global agreements or 19.16%. The value of all arms transfer agreements
worldwide in 2015 was $79.9 billion.
In 2015, Qatar ranked first among all developing nations weapons purchasers concluding $17.5
billion in the value of arms transfer agreements. Egypt ranked second, concluding $11.9 billion in
such agreements. Saudi Arabia ranked third with $8.6 billion in such agreements.

Conventional Arms Transfers to Developing Nations, 2008-2015
Congressional Research Service
Contents
Conventional Arms Transfers to Developing Nations, 2008-2015 .................................................. 1
Introduction and Overview ....................................................................................................... 1
Major Findings ................................................................................................................................ 3
General Trends in Arms Transfers Worldwide .......................................................................... 3 General Trends in Arms Transfers to Developing Nations ........................................................ 5
United States ....................................................................................................................... 7 Russia .................................................................................................................................. 8 China ................................................................................................................................... 9 Major West European Suppliers......................................................................................... 11
Regional Arms Transfer Agreements ...................................................................................... 13 Near East ........................................................................................................................... 13
Asia ......................................................................................................................................... 14 Leading Developing Nations Arms Purchasers ....................................................................... 15 Weapons Types Recently Delivered to Near East Nations ...................................................... 15
Arms Values Data Tables and Charts for 2008-2015 ..................................................................... 17
Selected Weapons Deliveries to Developing Nations, 2008-2015 ................................................ 49
Worldwide Arms Transfer Agreements and Deliveries Values, 2008-2015 .................................. 55
Description of Items Counted in Weapons Categories, 2008-2015 .............................................. 65
Regions Identified in Arms Transfer Tables and Charts ................................................................ 66
Figures
Figure 1. Arms Transfer Agreements Worldwide, 2008-2015 Developed and Developing
Worlds Compared ....................................................................................................................... 20
Figure 2. Arms Transfer Agreements Worldwide .......................................................................... 21
Figure 3. Arms Transfer Agreements With Developing Nations ................................................... 21
Figure 4. Arms Transfer Agreements With Developing Nations by Major Supplier, 2008-
2015 ............................................................................................................................................ 22
Figure 5. Arms Transfer Agreements with Developing Nations in the Near East ......................... 24
Figure 6. Arms Transfer Agreements With Developing Nations in Asia ....................................... 24
Figure 7. Arms Deliveries Worldwide 2008-2015 Developed and
Developing Worlds Compared ................................................................................................... 25
Figure 8. Arms Deliveries to Developing Countries by Major Supplier, 2008-2015 .................... 26
Tables
Table 1. Worldwide Arms Transfer Agreements, 2008-2015 and Suppliers’ Share with
Developing World ...................................................................................................................... 23
Table 2. Worldwide Arms Deliveries, 2008-2015 and Suppliers’ Share with Developing
World .......................................................................................................................................... 27
Table 3. Arms Transfer Agreements with Developing Nations, by Supplier, 2008-2015 .............. 28
Table 4. Arms Transfer Agreements with Developing Nations, by Supplier, 2008-2015 .............. 29

Conventional Arms Transfers to Developing Nations, 2008-2015
Congressional Research Service
Table 5. Arms Transfer Agreements with Developing Nations, by Supplier, 2008-2015 .............. 30
Table 6. Regional Arms Transfer Agreements, by Supplier, 2008-2015 ....................................... 31
Table 7. Percentage of Each Supplier’s Agreements Value by Region, 2008-2015 ...................... 32
Table 8. Percentage of Total Agreements Value by Supplier to Regions, 2008-2015 ................... 33
Table 9. Arms Transfer Agreements with Developing Nations, 2008-2015:
Leading Suppliers Compared ..................................................................................................... 34
Table 10. Arms Transfer Agreements with Developing Nations in 2015: Leading
Suppliers Compared ................................................................................................................... 35
Table 11. Arms Transfer Agreements with Near East, by Supplier ............................................... 36
Table 12. Arms Transfer Agreements with Developing Nations, 2008-2015: Agreements
by the Leading Recipients .......................................................................................................... 37
Table 13. Arms Transfer Agreements with Developing Nations in 2015: Agreements by
Leading Recipients ..................................................................................................................... 38
Table 14. Arms Deliveries to Developing Nations, by Supplier, 2008-2015 ................................ 39
Table 15. Arms Deliveries to Developing Nations, by Supplier, 2008-2015 ................................ 40
Table 16. Arms Deliveries to Developing Nations, by Supplier, 2008-2015 ................................ 41
Table 17. Regional Arms Deliveries by Supplier, 2008-2015 ....................................................... 42
Table 18. Percentage of Supplier Deliveries Value by Region, 2008-2015 ................................... 43
Table 19. Percentage of Total Deliveries Value by Supplier to Regions, 2008-2015 .................... 44
Table 20. Arms Deliveries to Developing Nations, 2008-2015 Leading Suppliers
Compared ................................................................................................................................... 45
Table 21. Arms Deliveries to Developing Nations in 2015: Leading Suppliers Compared .......... 46
Table 22. Arms Deliveries to Near East, by Supplier .................................................................... 47
Table 23. Arms Deliveries to Developing Nations, 2008-2015: The Leading Recipients ............. 48
Table 24. Arms Deliveries to Developing Nations in 2015: The Leading Recipients ................... 49
Table 25. Numbers of Weapons Delivered by Suppliers to Developing Nations .......................... 50
Table 26. Number of Weapons Delivered by Suppliers to Asia and the Pacific ............................ 51
Table 27. Numbers of Weapons Delivered by Suppliers to Near East .......................................... 52
Table 28. Numbers of Weapons Delivered by Suppliers to Latin America ................................... 53
Table 29. Number of Weapons Delivered by Suppliers to Africa .................................................. 54
Table 30. Arms Transfer Agreements with the World, by Supplier, 2008-2015 ............................ 56
Table 31. Arms Transfer Agreements with the World, by Supplier, 2008-2015 ............................ 57
Table 32. Arms Transfer Agreements with the World, by Supplier, 2008-2015 ............................ 58
Table 33. Arms Transfer Agreements with the World, 2008-2015: Leading Suppliers
Compared ................................................................................................................................... 59
Table 34. Arms Transfer Agreements with the World in 2015: Leading Suppliers
Compared ................................................................................................................................... 60
Table 35. Arms Deliveries to the World, by Supplier, 2008-2015 ................................................. 61
Table 36. Arms Deliveries to the World, by Supplier, 2008-2015 ................................................. 62
Table 37. Arms Deliveries to the World, by Supplier 2008-2015 .................................................. 63
Table 38. Arms Deliveries to the World, 2008-2015: Leading Suppliers Compared .................... 64
Table 39. Arms Deliveries to the World In 2015: Leading Suppliers Compared .......................... 65

Conventional Arms Transfers to Developing Nations, 2008-2015
Congressional Research Service
Contacts
Author Contact Information .......................................................................................................... 67

Conventional Arms Transfers to Developing Nations, 2008-2015
Congressional Research Service 1
Conventional Arms Transfers to Developing
Nations, 2008-2015
Introduction and Overview
This report provides Congress with official, unclassified data from U.S. government sources on
transfers of conventional arms to developing nations by major suppliers for the period 2008
through 2015. It also includes some data on worldwide supplier transactions. It updates and
revises CRS Report R42017, Conventional Arms Transfers to Developing Nations, 2007-2014, by
Catherine A. Theohary.
Data in this report provide a means for Congress to identify existing supplier-purchaser
relationships in conventional weapons acquisitions. Use of these data can assist Congress in its
oversight role of assessing how the current nature of the international weapons trade might affect
U.S. national interests. For most of recent American history, maintaining regional stability and
ensuring the security of U.S. allies and friendly nations throughout the world have been important
elements of U.S. foreign and national security policy. Knowing the extent to which foreign
government arms suppliers are transferring arms to individual nations or regions provides
Congress with a context for evaluating policy questions it may confront. Such policy questions
may include, for example, whether to support specific U.S. arms sales to given countries or
regions or to support or offset arms transfers by other nations. The data in this report may also
assist Congress in evaluating whether multilateral arms control arrangements or other U.S.
foreign policy initiatives are being supported or undermined by the actions of arms suppliers.
This report focuses principally on the level of arms transfers by major weapons suppliers to
nations in the developing world—where most analysts agree that the potential for the outbreak of
regional military conflicts currently is greatest, and where the greatest proportion of the
conventional arms trade is conducted. For decades, during the height of the Cold War, providing
conventional weapons to friendly states was an instrument of foreign policy utilized by the United
States and its allies. This was equally true for the Soviet Union and its allies. The underlying
rationale given for U.S. arms transfer policy then was to help ensure that friendly states were not
placed at risk through a military disadvantage created by arms transfers by the Soviet Union or its
allies. Following the Cold War’s end, U.S. arms transfer policy has been based on maintaining or
augmenting friendly and allied nations’ ability to deal with regional security threats and concerns.
Data in this report illustrate global patterns of conventional arms transfers that have changed in
the post-Cold War and post-Persian Gulf War years. Relationships between arms suppliers and
recipients continue to evolve in response to changing political, military, and economic
circumstances. Whereas the principal motivation for arms sales by key foreign suppliers in earlier
years might have been to support a foreign policy objective, today that motivation may be based
as much, if not more, on economic considerations as those of foreign or national security policy.
Nations in the developing world continue to be the primary focus of foreign arms sales activity by
conventional weapons suppliers. During the period of this report, 2008-2015, conventional arms
transfer agreements (which represent orders for future delivery) to developing nations comprised
80.24% of the value of all international arms transfer agreements. The portion of agreements with
developing countries constituted 80.92% of all agreements globally from 2012-2015. In 2015,
arms transfer agreements with developing countries accounted for 81.7% of the value of all such
agreements globally. Deliveries of conventional arms to developing nations, from 2012 to 2015

Conventional Arms Transfers to Developing Nations, 2008-2015
Congressional Research Service 2
constituted 67.89% of all international arms deliveries. In 2015, arms deliveries to developing
nations constituted 72.69% of the value of all such arms deliveries worldwide.
The data in this new report supersede all data published in previous editions. Because these new
data for 2008-2015 reflect potentially significant updates to and revisions of the underlying U.S.
government databases used for this report, only the data in this most recent edition should be used
for comparison of data found in previous reports. The data are expressed in U.S. dollars for the
calendar years indicated, and adjusted for inflation (see box note below). U.S. commercially
licensed arms export deliveries values are excluded (see box note on page 16). Also excluded are
arms transfers by any supplier to subnational groups. The definition of developing nations, as
used in this report, and the specific classes of items included in its values totals are found in box
notes below. The report’s table of contents provides a detailed listing and description of the
various data tables to guide the reader to specific items of interest.
Calendar Year Data Used
All arms transfer and arms delivery data in this report are for the calendar year or calendar year period given. This
applies to U.S. and foreign data alike. United States government departments and agencies publish data on U.S. arms
transfers and deliveries but generally use the United States fiscal year as the computational time period for these data.
As a consequence, there are likely to be distinct differences noted in those published totals using a fiscal year basis
and those provided in this report which use a calendar year basis. Details on data used are outlined in notes at the
bottom of Tables 3, 14, 30 and 35.
Arms Transfer Values
The values of arms transfer agreements (or deliveries) in this report refer to the total values of conventional arms orders (or deliveries as the case may be), which include all categories of weapons and ammunition, military spare
parts, military construction, military assistance and training programs, and all associated services.
Definition of Developing Nations and Regions
As used in this report, the developing nations category includes all countries except the United States, Russia,
European nations, Canada, Japan, Australia, and New Zealand. A listing of countries located in the regions defined for
the purpose of this analysis—Asia, Near East, Latin America, and Africa—is provided at the end of the report.

Conventional Arms Transfers to Developing Nations, 2008-2015
Congressional Research Service 3
Constant 2015 Dollars
Throughout this report values of arms transfer agreements and values of arms deliveries for all suppliers are
expressed in U.S. dollars. Values for any given year generally reflect the exchange rates that prevailed during that
specific calendar year. This report, in places, converts these dollar amounts (current dollars) into constant 2015 U.S. dollars. Although this helps to eliminate the distorting effects of inflation to permit a more accurate comparison of
various dollar levels over time, the effects of fluctuating exchange rates are not neutralized. The deflators used for the
constant dollar calculations in this report are those provided by the U.S. Department of Defense and are set out at
the bottom of Tables 4, 15, 31, and 36, where all data are expressed in constant 2015 U.S. dollars. In places in the
text and in figures where constant dollars are not used they are so labeled. For example, all regional data tables that
are composed of four-year aggregate dollar totals (2008-2011 and 2012-2015) or when single years are used they are
expressed in current dollar terms. Where tables rank leading arms suppliers to developing nations or leading
developing nation recipients using four-year aggregate dollar totals, these values are expressed in current dollars.
When percentage comparisons are used, they are calculated using current dollars.
Major Findings
General Trends in Arms Transfers Worldwide
The value of all arms transfer agreements worldwide (to both developed and developing nations)
in 2015 was $79.9 billion. This was a decrease in arms agreements values over the 2014 total of
$89 billion. (Figure 1) (Table 1) (Table 30) (Table 31).
In 2015, the United States led in arms transfer agreements worldwide, making agreements valued
at $40.2 billion (50.29% of all such agreements), up from $36.1 billion in 2014. France ranked
second in 2015 with $15.3 billion in agreements (19.16% of these agreements globally), up
considerably from $5.7 billion in 2014. The United States and France collectively made
agreements in 2015 valued at over $55.4 billion, 69.4% of all international arms transfer
agreements made by all suppliers (Figure 1) (Table 30) (Table 31, Table 32, and Table 34).
For the period 2012-2015, the total value of all international arms transfer agreements ($317
billion in current dollars) was higher than the worldwide value during 2008-2011 ($266.6 billion
in current dollars). During the period 2008-2011, developing world nations accounted for 80.39%
of the value of all arms transfer agreements made worldwide. During 2012-2015, developing
world nations accounted for 80.92% of all arms transfer agreements made globally. In 2015,
developing nations accounted for 81.7% of all arms transfer agreements made worldwide (Figure
1) (Table 30) (Table 31).
In 2015, the United States ranked first in the value of all arms deliveries worldwide, making
nearly $16.9 billion in such deliveries or 36.62%. This is the eighth year in a row that the United
States has led in global arms deliveries. Russia ranked second in worldwide arms deliveries in
2015, making $7.2 billion in such deliveries, and ranked second for all of those eight years.
France ranked third in 2015, making $7.0 billion in such deliveries. These three suppliers of arms
in 2015 collectively delivered approximately $31.3 billion, or 67.77% of all arms delivered
worldwide by all suppliers in that year (Table 2) (Table 36, Table 37, and Table 39).
The value of all international arms deliveries in 2015 was nearly $46.2 billion. This is a decrease
in the total value of arms deliveries from the previous year from $54.1 billion. The total value of
such arms deliveries worldwide in 2012-2015 (about $199 billion) was higher than the deliveries
worldwide from 2008 to 2011 (about $187 billion (Table 2) (Table 36 and Table 37) (Figure 7
and Figure 8).

Conventional Arms Transfers to Developing Nations, 2008-2015
Congressional Research Service 4
Developing nations from 2012 to 2015 received 67.9% of the value of all international arms
deliveries. In the earlier period, 2008-2011, developing nations accounted for 57.7% of the value
of all arms deliveries worldwide. In 2015, developing nations collectively accounted for 72.7% of
the value of all international arms deliveries (Table 2) (Table 15, Table 36, and Table 37).
Worldwide weapons orders decreased in 2015. The total of $79.8 billion was a decrease from $89
billion in 2014. The United States’ worldwide weapons agreements values increased in value
from $36.1 billion in 2014 to $40.2 billion in 2015. The U.S. market share increased greatly as
well, from roughly 40.5% in 2014 to 50.3% in 2015. Although the United States retained its
position as the leading arms supplying nation in the world, nearly all other major suppliers saw
increases too. The principal example was France, whose worldwide agreements increased from
$5.7 billion in 2014 to $15.3 billion in 2015. Meanwhile, Russia posted a marginal decline in its
global arms agreements values, from $11.2 billion in 2014 to $11.1 billion in 2015. The collective
market share of worldwide arms agreements for the four major West European suppliers—France,
the United Kingdom, Germany, and Italy—was approximately 22% in 2015.
Although the global total in weapons sales in 2015 represents an increase, the international arms
market is not likely growing overall. The U.S. global total for arms agreements in 2011 appears as
an outlier figure, representing large sales with Saudi Arabia worth approximately $33.4 billion.
Moreover, there continue to be significant constraints on its growth, due, in particular, to the
weakened state of the global economy. The Eurozone financial crisis and the slow international
recovery from the recession of 2008 have generally limited defense purchases of prospective
customers. Concerns over their domestic budget problems have led many purchasing nations to
defer or limit the purchase of new major weapon systems. Some nations have chosen to limit their
purchasing to upgrades of existing systems and to training and support services. Others have
decided to emphasize the integration into their force structures of the major weapon systems they
had previously purchased. Orders for weapons upgrades and support services can still be rather
lucrative, and such sales can provide weapons suppliers with continued revenue, despite the
reduction in demand for major weapon systems.
As new arms sales have become more difficult to conclude in the face of economic factors,
competition among sellers has increased. A number of weapons-exporting nations are focusing
not only on the clients with which they have held historic competitive advantages due to well-
established military-support relationships, but also on potential new clients in countries and
regions where they have not been traditional arms suppliers. As the overall market for weapons
has stagnated, arms suppliers have faced the challenge of providing weapons in type and price
that can create a competitive edge. To overcome the key obstacle of limited defense budgets in
several developing nations, arms suppliers have increasingly utilized flexible financing options,
and guarantees of counter-trade, co-production, licensed production, and co-assembly elements in
their contracts to secure new orders.
Given important limitations on significant growth of arms sales to developing nations—especially
those that are less affluent—competition between European nations or consortia on the one hand
and the United States on the other is likely to be especially intense where all these suppliers have
previously concluded arms agreements with the more affluent states. Recent examples of this
competition have been the contests for combat aircraft sales to the oil-rich Persian Gulf states,
and a major competition for the sale of a substantial number of combat aircraft to India. The more
affluent developing nations have been leveraging their attractiveness as clients by demanding
greater cost offsets in their arms contracts, as well as transfer of more advanced technology and
provisions for domestic production options. Weapons contracts with more wealthy developing
nations in the Near East and Asia appear to be especially significant to European weapons
suppliers that have used foreign arms sales contracts as a means to support their own domestic

Conventional Arms Transfers to Developing Nations, 2008-2015
Congressional Research Service 5
weapons development programs and need them to compensate, wherever possible, for declining
arms orders from the rest of the developing world.
At the same time, nations in the developed world continue to pursue measures aimed at protecting
important elements of their national military industrial bases by limiting arms purchases from
other developed nations. This has resulted in several major arms suppliers emphasizing joint
production of various weapon systems with other developed nations as an effective way to share
the costs of developing new weapons, while preserving productive capacity. Some supplier
nations have decided to manufacture items for niche weapons categories where their specialized
production capabilities give them important advantages in the international arms marketplace.
The strong competition for weapons contracts has also led to consolidation of certain sectors of
the domestic defense industries of key weapons-producing nations to enhance their
competiveness further.
Although less-affluent nations in the developing world may be compelled by financial
considerations to limit their weapons purchases, others in the developing world with significant
financial assets continue to launch new and costly weapons-procurement programs. Having
notable income from oil sales has provided a major advantage for major oil-producing states in
funding their arms purchases. At the same time dependency on oil imports has caused difficulties
for many oil consuming states, and contributed to their decision to curtail or defer new weapons
acquisitions. It’s important to note that any possible effects of significant oil declines since the
end of 2014 on global arms purchases would not be seen in the period covered by this report.
Despite the volatility of the international economy in recent years, some nations in the Near East
and Asia regions have resumed or continued large weapons purchases. These purchases have been
made by a limited number of developing nations in these two regions. Most recently they have
been made by Saudi Arabia and the United Arab Emirates in the Near East—both pivotal partners
in the U.S. effort to contain Iran. India in Asia is another large arms purchaser. For certain
developing nations in these regions, the strength of their individual economies appears to be a key
factor in their decisions to proceed with major arms purchases.
A few developing nations in Latin America, and, to a much lesser extent, in Africa, have sought to
modernize key sectors of their military forces. In recent years, some nations in these regions have
placed large arms orders, by regional standards, to advance that goal. Many countries within these
regions are significantly constrained by their financial resources and thus limited in the weapons
they can purchase. Given the limited availability of seller-supplied credit and financing for
weapons purchases, and their smaller national budgets, most of these countries are forced to be
especially selective in their military purchases. As a consequence, few major weapon systems
purchases are likely to be made in either region.
General Trends in Arms Transfers to Developing Nations
The value of all arms transfer agreements with developing nations in 2015 was $65.2 billion, a
substantial decrease from the $79.3 billion total in 2014 (Figure 1) (Table 1) (Table 3) (Table 4).
In 2015, the value of all arms deliveries to developing nations ($33.6 billion) decreased slightly
from the value of 2014 deliveries ($36.2 billion). Deliveries since 2008 peaked in 2014 (Figure 7
and Figure 8) (Table 2) (Table 15).
Until France ranked second in 2015, the United States and Russia had dominated the arms market
in the developing world since 2012. Both nations either ranked first or second among countries
for three out of the four years in terms of the value of arms transfer agreements. From 2012 to
2015, the United States made approximately $85.6 billion of these agreements, or 33.38%.
During this same period, Russia made $48.6 billion, 18.9% of all such agreements, expressed in

Conventional Arms Transfers to Developing Nations, 2008-2015
Congressional Research Service 6
current dollars. Collectively, the United States and Russia made 52.33%, just over half of all arms
transfer agreements with developing nations during this four-year period. France from 2012 to
2015 made nearly $27.7 billion or 10.8% of all such agreements with developing nations during
these years. In the earlier period (2008-2011) Russia ranked second with $32.8 billion in arms
transfer agreements with developing nations or 15.3%; the United States made $111.1 billion in
arms transfer agreements during this period or 51.8%. France made $21.5 billion in agreements or
10% (Table 3).
In any given year for the period 2008-2015, most arms transfers to developing nations were made
by two or three major suppliers. The United States ranked first among these suppliers for all but
one year during this period. Russia has been a competitor for the lead in arms transfer agreements
with developing nations, ranking first in 2009, and second every year since except 2015.
Although Russia has lacked the larger traditional client base for armaments held by the United
States and the major West European suppliers, it has been a major source of weaponry for a few
key purchasers in the developing world. Russia’s most significant high-value arms transfer
agreements continue to be with India. Russia has also had some success in concluding arms
agreements with clients in the Near East and Southeast Asia.
Russia has increased its sales efforts in Latin America with a principal focus on Venezuela. Russia
has adopted more flexible payment arrangements, including loans, for its prospective customers
in the developing world generally, including a willingness in specific cases to forgive outstanding
debts owed to it by a prospective client in order to secure new arms purchases. At the same time
Russia continues efforts to enhance the quality of its follow-on support services to make Russian
weaponry more attractive and competitive, attempting to assure potential clients that it will
provide timely and effective service and spare parts for the weapon systems it sells.
Among the four major West European arms suppliers, France and the United Kingdom have been
the most successful in concluding significant orders with developing countries from 2008 to
2015, based on either long-term supply relationships or their having specialized weapon systems
available for sale. Germany, however, has shown particular success in selling naval systems
customized for developing nations. The United Kingdom has had comparable successes with
aircraft sales.
Despite the competition the United States faces from other major arms suppliers, it appears likely
it will hold its position as the principal supplier to key developing world nations, especially with
those able to afford major new weapons. From the onset of the Cold War period, the United States
developed an especially large and diverse base of arms equipment clients globally with whom it
is able to conclude a continuing series of arms agreements annually. For decades it has also
provided upgrades, spare parts, ordnance and support services for the wide variety of weapon
systems it has previously sold to this large list of clients. This provides a steady stream of orders
from year to year, even when the United States does not conclude major new arms agreements for
major weapon systems. It also makes the United States a logical supplier for newer- generation
military equipment to these traditional purchasers.
Major arms-supplying nations continue to center their sales efforts on the wealthier developing
countries, as arms transfers to the less-affluent developing nations remain constrained by the
scarcity of funds in their defense budgets and the unsettled state of the international economy.
From 2008 to 2011, the values of all arms transfer agreements with developing nations increased
from year to year, but declined in 2010. These agreements reached a peak in 2011 at about $78
billion. The increase in agreements with developing nations from 2008 to 2012, and particularly
in 2011, was driven to an important degree by sales to the more affluent developing nations,
especially key oil-producing states in the Persian Gulf, which actively sought new advanced

Conventional Arms Transfers to Developing Nations, 2008-2015
Congressional Research Service 7
weaponry during these years, as part of a U.S. effort to enhance the militaries of its key partners
there.
More recently, the less-traditional European and non-European suppliers, including China, have
been successful in securing some agreements with developing nations, although at lower levels
and with uneven results, compared to the major weapons suppliers. Yet, these non-major arms
suppliers have occasionally made arms deals of significance, such as missile sales and light
combat systems. In 2014, Canada won a contract with Saudi Arabia to sell 108 armored vehicles,
for a total of approximately $14 billion. After ending a decades-long arms agreement with Saudi
Arabia, in 2015, Sweden found a buyer in the U.A.E. for two new Erieye airborne Swing Role
Surveillance Systems and the upgrade of two others for a total of $1.27 billion. Although their
agreement values appear larger when they are aggregated as a group, most of their annual arms
transfer agreement values during 2008-2015 have been comparatively low when they are listed as
individual suppliers. In various cases, these suppliers have been successful in selling older
generation or less-advanced equipment. This group of arms suppliers is more likely to be the
source of small arms and light weapons and associated ordnance rather than routine sellers of
major weapon systems. Most of these arms suppliers do not rank very high in the value of their
arms agreements and deliveries, although some will rank among the top 10 suppliers from year to
year (Table 43, Table 9, Table 10, Table 15, Table 20 , and Table 21).
United States
The total value of United States arms transfer agreements with developing nations registered a
decrease from $29.7 billion in 2014 to $26.7 billion in 2015. Even so, the U.S. market share of
the value of all such agreements was 40.99% in 2015, an increase from a 37.48% share in 2014
(Figure 1, Figure 7, and Figure 8) (Table 1, Table 3, Table 4, and Table 5).
In 2015, the total value of U.S. arms transfer agreements with developing nations was comprised
primarily of major new orders in the Near East and Asia. The U.S. reached key agreements with
Saudi Arabia and Iraq in the Near East and South Korea in Asia. The United States also continued
to secure orders for significant equipment and support services contracts with a broad number of
U.S. clients globally. The approximately $40 billion arms agreement total for the United States in
2015 also reflects the continuing U.S. advantage of having well-established defense support
arrangements with many weapons purchasers worldwide, based upon the existing U.S. weapon
systems that the militaries of these clients utilize. U.S. agreements with all of its customers in
2015 include not only sales of very costly major weapon systems, but also the upgrading and the
support of systems previously provided. It is important to emphasize that U.S. arms agreements
involving a wide variety of items such as spare parts, ammunition, ordnance, training, and support
services can have significant costs associated with them.
The larger valued arms transfer agreements with the United States in 2015 with developing
nations included multiple agreements with Saudi Arabia to provide, among other things,
munitions and associated accessories and Patriot PAC-3 missiles for over $7 billion. Purchases
from Qatar reached $9.9 billion for calendar year 2015. In the fourth quarter of fiscal year 2014,
Qatar accepted the cases that make up the majority of this value, with contracts for Patriot
missiles, Javelin missiles, and Apache helicopters worth $9.56 billion, although it was reported in
the press that Secretary of Defense Hagel signed an agreement with Qatar in July of 2014 worth
$11 billion. South Korea’s orders totaled nearly $5 billion, including, among other things,
contracts for a RF-16 aircraft upgrade program and Aegis Shipboard Combat System.

Conventional Arms Transfers to Developing Nations, 2008-2015
Congressional Research Service 8
Russia
The total value of Russia’s arms transfer agreements with developing nations in 2015 was $11
billion, an increase from $10.2 billion in 2014. Russia’s share of all developing world arms
transfer agreements also increased from 12.9% in 2014 to 16.9% in 2015 (Figure 1, Figure 7,
and Figure 8) (Table 1, Table 3, Table 4, Table 5, and Table 10).
Russia’s arms transfer agreement totals with developing nations have been notable during the
eight years covered in this report, reaching a peak in 2012 of $16.7 billion (in current dollars).
During the 2012-2015 period, Russia ranked second among all suppliers to developing countries,
making nearly $49 billion in agreements (in current dollars) (Table 9). Russia’s status as a
leading supplier of arms to developing nations reflects a successful effort to overcome the
significant industrial production problems associated with the dissolution of the former Soviet
Union. The major arms clients of the former Soviet Union were generally less wealthy
developing countries. In the Soviet era, several client states received substantial military aid
grants and significant discounts on their arms purchases. Confronted with a limited arms client
base in the post-Cold War era and stiff competition from Western arms suppliers for new markets,
Russia adapted its selling practices in the developing world in an effort to regain and sustain an
important share among previous and prospective clients in that segment of the international arms
market.
In recent years, Russia has made significant efforts to provide more creative financing and
payment options for prospective arms purchasers. Russia has agreed to engage in counter-trade,
offsets, debt-swapping, and, in key cases, to make significant licensed production agreements in
order to sell its weapons. Russia’s willingness to agree to licensed production has been a critical
element in several cases involving important arms clients, particularly India and China. Russia’s
efforts to expand its arms customer base elsewhere have met with mixed results. Some successful
Russian arms sales efforts have occurred in Southeast Asia. Here Russia has signed arms
agreements with Malaysia, Vietnam, Burma, and Indonesia. Russia has also concluded major
arms deals with Venezuela and Algeria. Elsewhere in the developing world, Russian military
equipment continues to be competitive because it ranges from the most basic to the highly
advanced. Russia’s less expensive armaments have proven attractive to less affluent developing
nations.
Missiles and aircraft continue to provide a significant portion of Russia’s arms exports, less so
naval systems. Nevertheless, the absence of substantial funding for new research and
development efforts in these and other military equipment areas has hampered Russia’s longer-
term foreign arms sales prospects. Weapons research and development (R&D) programs exist in
Russia, yet other major arms suppliers have advanced much more rapidly in developing and
producing weaponry than have existing Russian military R&D programs, a factor that may deter
expansion of the Russian arms client base. This was illustrated by Russia’s decision to acquire
French technology through purchase of the Mistral amphibious assault ship, rather than relying on
Russian shipbuilding specialists to create a comparable ship for the Russian Navy. However in
August 2015, France canceled the Mistral agreement.
Nonetheless, Russia has had important arms development and sales programs, particularly
involving India and, to a lesser extent, China, which should provide it with sustained business for
a decade. During the mid-1990s, Russia sold major combat fighter aircraft and main battle tanks
to India, and has provided other major weapon systems through lease or licensed production. It
continues to provide support services and items for these various weapon systems. More recently,
however, Russia has lost major contracts to other key weapons suppliers, threatening its long-
standing supplier relationship with India. Russian sales of advanced weaponry in South Asia have
Conventional Arms Transfers to Developing Nations, 2008-2015
Congressional Research Service 9
been a matter of ongoing concern to the United States because of long-standing tensions between
Pakistan and India. The United States sought to expand its military cooperation with and arms
sales to India as part of the U.S. strategic shift to the Asia-Pacific region.1
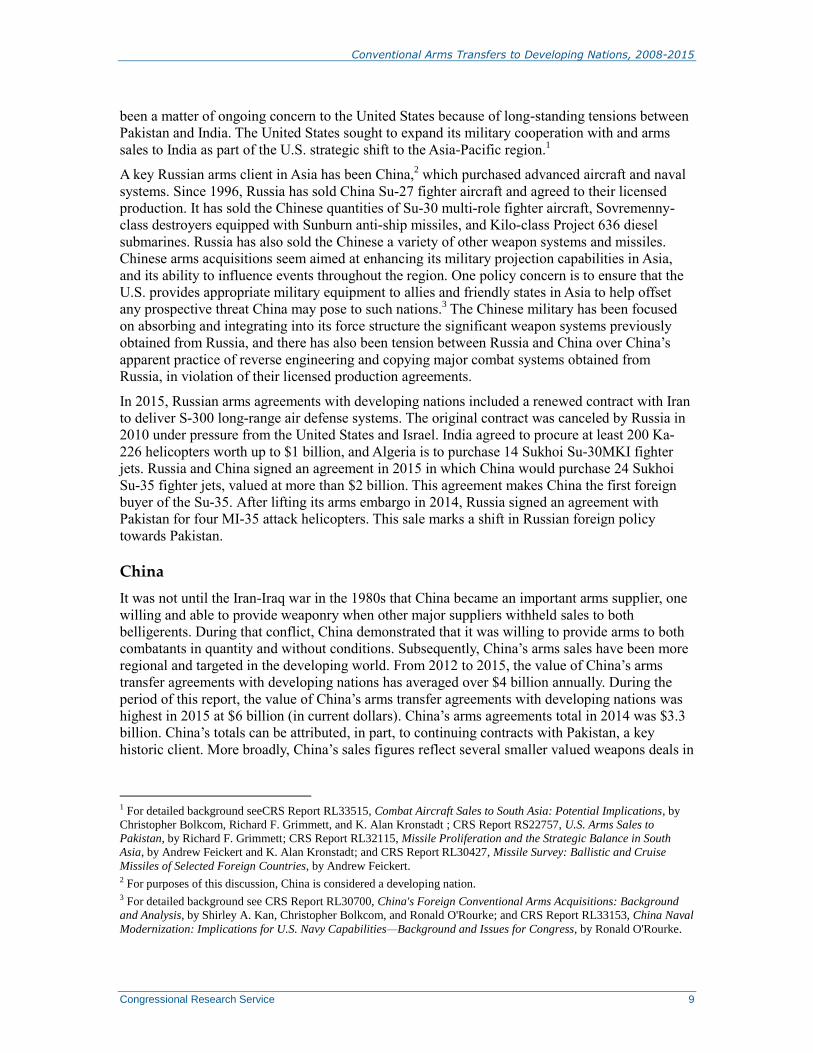
A key Russian arms client in Asia has been China,2 which purchased advanced aircraft and naval
systems. Since 1996, Russia has sold China Su-27 fighter aircraft and agreed to their licensed
production. It has sold the Chinese quantities of Su-30 multi-role fighter aircraft, Sovremenny-
class destroyers equipped with Sunburn anti-ship missiles, and Kilo-class Project 636 diesel
submarines. Russia has also sold the Chinese a variety of other weapon systems and missiles.
Chinese arms acquisitions seem aimed at enhancing its military projection capabilities in Asia,
and its ability to influence events throughout the region. One policy concern is to ensure that the
U.S. provides appropriate military equipment to allies and friendly states in Asia to help offset
any prospective threat China may pose to such nations.3 The Chinese military has been focused
on absorbing and integrating into its force structure the significant weapon systems previously
obtained from Russia, and there has also been tension between Russia and China over China’s
apparent practice of reverse engineering and copying major combat systems obtained from
Russia, in violation of their licensed production agreements.
In 2015, Russian arms agreements with developing nations included a renewed contract with Iran
to deliver S-300 long-range air defense systems. The original contract was canceled by Russia in
2010 under pressure from the United States and Israel. India agreed to procure at least 200 Ka-
226 helicopters worth up to $1 billion, and Algeria is to purchase 14 Sukhoi Su-30MKI fighter
jets. Russia and China signed an agreement in 2015 in which China would purchase 24 Sukhoi
Su-35 fighter jets, valued at more than $2 billion. This agreement makes China the first foreign
buyer of the Su-35. After lifting its arms embargo in 2014, Russia signed an agreement with
Pakistan for four MI-35 attack helicopters. This sale marks a shift in Russian foreign policy
towards Pakistan.
China
It was not until the Iran-Iraq war in the 1980s that China became an important arms supplier, one
willing and able to provide weaponry when other major suppliers withheld sales to both
belligerents. During that conflict, China demonstrated that it was willing to provide arms to both
combatants in quantity and without conditions. Subsequently, China’s arms sales have been more
regional and targeted in the developing world. From 2012 to 2015, the value of China’s arms
transfer agreements with developing nations has averaged over $4 billion annually. During the
period of this report, the value of China’s arms transfer agreements with developing nations was
highest in 2015 at $6 billion (in current dollars). China’s arms agreements total in 2014 was $3.3
billion. China’s totals can be attributed, in part, to continuing contracts with Pakistan, a key
historic client. More broadly, China’s sales figures reflect several smaller valued weapons deals in
1 For detailed background seeCRS Report RL33515, Combat Aircraft Sales to South Asia: Potential Implications, by
Christopher Bolkcom, Richard F. Grimmett, and K. Alan Kronstadt ; CRS Report RS22757, U.S. Arms Sales to
Pakistan, by Richard F. Grimmett; CRS Report RL32115, Missile Proliferation and the Strategic Balance in South
Asia, by Andrew Feickert and K. Alan Kronstadt; and CRS Report RL30427, Missile Survey: Ballistic and Cruise
Missiles of Selected Foreign Countries, by Andrew Feickert. 2 For purposes of this discussion, China is considered a developing nation. 3 For detailed background see CRS Report RL30700, China's Foreign Conventional Arms Acquisitions: Background
and Analysis, by Shirley A. Kan, Christopher Bolkcom, and Ronald O'Rourke; and CRS Report RL33153, China Naval
Modernization: Implications for U.S. Navy Capabilities—Background and Issues for Congress, by Ronald O'Rourke.

Conventional Arms Transfers to Developing Nations, 2008-2015
Congressional Research Service 10
Asia, Africa, and the Near East, rather than especially large agreements for major weapon systems
(Table 43, Table 10, and Table 11) (Figure 7).
Comparatively, few developing nations with significant financial resources have purchased
Chinese military equipment during the eight-year period of this report. Most Chinese weapons for
export are less advanced and sophisticated than weaponry available from Western suppliers or
Russia. China, consequently, does not appear likely to be a key supplier of major conventional
weapons in the developing world arms market in the immediate future. That said, China has
indicated that increasingly it views foreign arms sales as an important market in which it wishes
to compete, and has increased the promotion of its more advanced aircraft in an effort to secure
contracts from developing countries. China’s weapon systems for export seem based upon
designs obtained from Russia through previous licensed production programs. Nonetheless,
China’s likely client base will be states in Asia and Africa seeking quantities of small arms and
light weapons, rather than major combat systems.
China has also been an important source of missiles to some developing countries. For example,
China has supplied battlefield and cruise missiles to Iran and surface-to-surface missiles to
Pakistan. According to U.S. officials, the Chinese government no longer supplies other countries
with complete missile systems. However, Chinese entities are suppliers of missile-related
technology. Such activity raises questions about China’s willingness to fulfill the government’s
stated commitment to act in accordance with the restrictions on missile transfers set out in the
Missile Technology Control Regime (MTCR) and how its interpretation of MTCR guidelines
differs from other member states. Because China has military products—particularly its
missiles—that some developing countries would like to acquire, it can present an obstacle to
efforts to stem proliferation of advanced missile systems to some areas of the developing world.4
China continues to be the source of a variety of small arms and light weapons transferred to
African states. The prospects for significant revenue earnings from these arms sales are limited.
China likely views such sales as one means of enhancing its status as an international political
power, and increasing its ability to obtain access to significant natural resources, especially oil.
The control of sales of small arms and light weapons to regions of conflict, especially to some
African nations, has been a matter of concern to the United States and others. The United Nations
also has undertaken an examination of this issue in an effort to achieve consensus on a path to
curtail this weapons trade comprehensively. During July 2012, the United Nations attempted to
reach agreement on the text of an Arms Trade Treaty (ATT), aimed at setting agreed standards for
member states regarding what types of conventional arms sales should be made internationally,
and what criteria should be applied in making arms transfer decisions. At the end of the month-
long period, set aside for negotiations, this effort failed to achieve the necessary consensus on a
treaty draft. China, while not a member of the group of U.N. states negotiating the final draft,
made it publicly clear that it did not support any treaty that would prevent any state from making
its own, independent, national decision to make an arms sale.5 The U.N. adopted the treaty as a
resolution following a vote on April 2, 2013; China and Russia abstained. The treaty entered into
4 For detailed background on the MTCR and proliferation control regimes and related policy issues see CRS Report
RL31559, Proliferation Control Regimes: Background and Status, coordinated by Mary Beth Nikitin; and CRS Report
RL31848, Missile Technology Control Regime (MTCR) and International Code of Conduct Against Ballistic Missile
Proliferation (ICOC): Background and Issues for Congress, by Andrew Feickert. 5 For background on China’s actions and motivations for increased activities in Africa see CRS Report RL33055,
China and Sub-Saharan Africa, by Raymond W. Copson, Kerry Dumbaugh, and Michelle Weijing Lau. For
background on U.S. Policy concerns regarding small arms and light weapons transfers see CRS Report RS20958,
International Small Arms and Light Weapons Transfers: U.S. Policy, by Richard F. Grimmett. China’s position on an
Arms Trade Treaty is here: http://www.un.org/disarmament/ATT/statements/docs/20120709/20120706_China_E.pdf

Conventional Arms Transfers to Developing Nations, 2008-2015
Congressional Research Service 11
force on December 24, 2014. To date, 78 states have ratified the treaty, with the United States as a
signatory. President Obama transmitted the treaty to the Senate for its advice and consent on
December 9, 2016.
Major West European Suppliers
France, the United Kingdom, Germany, and Italy—the four major West European arms
suppliers—have supplied a wide variety of sophisticated weapons to a number of purchasers.
They are potential sources of armaments for nations that the United States chooses not to supply
for policy reasons. The United Kingdom, for example, sold major combat fighter aircraft to Saudi
Arabia in the mid-1980s, when the United States chose not to sell a comparable aircraft. More
recently, India made European aircraft suppliers finalists in its competition for a major sale of
combat aircraft--a competition ultimately won by France. The contending U.S. and Russian
aircraft were rejected. France also contracted with the Egyptian navy for frigates valued at
approximately $1.4 billion. Moreover, Saudi Arabia recently purchased 72 Eurofighter Typhoon
fighter aircraft from the United Kingdom, an aircraft built by four European nations—the U.K,
Germany, Italy and Spain. During the Cold War, NATO allies of the United States generally
supported the U.S. position in restricting arms sales to certain nations. In the post-Cold War
period, however, their national defense export policies have not been fully coordinated with the
United States.
Key European arms supplying states, especially France, view arms sales foremost as a matter for
national decision. Economic considerations appear to be a greater driver in French arms sales
decision-making than foreign policy priorities. France has also frequently used foreign military
sales as an important means for underwriting development and procurement of new weapon
systems for its own military forces. The potential for policy differences between the United States
and major West European supplying states over conventional weapons transfers to specific
countries has increased in recent years because of a divergence of views over what is an
appropriate arms sale. Such a conflict resulted from an effort led by France and Germany in
2004-2005 to lift the arms embargo on arms sales to China adhered to by members of the
European Union. The United States viewed this as a misguided effort, and vigorously opposed it.
Ultimately, the proposal to lift the embargo was not adopted. However, this episode proved to be
a source of significant tension between the United States and some members of the European
Union. The arms sales activities of major European suppliers, consequently, will continue to be of
interest to U.S. policymakers, given their capability to make sales of advanced military equipment
to countries of concern in U.S. national security policy.6
The four major West European suppliers (France, the United Kingdom, Germany, and Italy), as a
group, registered a significant increase in in their collective share of all arms transfer agreements
with developing nations between 2014 and 2015, with France representing the majority. This
group’s share rose from 9.5% in 2014 to 27% in 2015. The collective value of this group’s arms
transfer agreements with developing nations in 2015 was $17.6 billion compared to a total of
nearly $7.5 billion in 2014 (in current dollars). Of these four nations, France was the leading
6For detailed background see CRS Report RL32870, European Union's Arms Embargo on China: Implications and
Options for U.S. Policy, by Kristin Archick, Richard F. Grimmett, and Shirley A. Kan. It should be noted that members
of the European Union, and others, have agreed to a common effort to attempt some degree of control on the transfer of
certain weapon systems, but the principal vehicle for this cooperation—the Wassenaar Arrangement—lacks a
mechanism to enforce its rules. For detailed background see CRS Report RS20517, Military Technology and
Conventional Weapons Export Controls: The Wassenaar Arrangement, by Richard F. Grimmett.

Conventional Arms Transfers to Developing Nations, 2008-2015
Congressional Research Service 12
supplier with a record $15.2 billion in agreements in 2015. Italy, meanwhile registered $1 billion
in arms agreements in 2015. (Figure 7 and Figure 8) (Table 3 and Table 5).
In the period from 2008 to 2015, the four major West European suppliers were important
participants in the developing world arms market. Individual suppliers within the major West
European group have had notable years for arms agreements during this period: France in 2015
($15.2 billion) and in 2009 ($9.3 billion); the United Kingdom in 2012 ($5.7 billion); Germany
($7 billion) in 2013, and in 2012 ($4.9 billion); and Italy in 2012 ($1.5 billion). In the case of all
of these West European nations, large agreement totals in one year have usually resulted from the
conclusion of large arms contracts with one or a small number of major purchasers in that
particular year (Table 3 and Table 5).
The major West European suppliers, individually, have enhanced their competitive position in
weapons exports through strong government marketing support for their foreign arms sales. All of
them can produce both advanced and basic air, ground, and naval weapon systems. The four
major West European suppliers have sometimes competed successfully for arms sales contracts
with developing nations against the United States, which has tended to sell to several of the same
major clients, especially to the Persian Gulf states that see the United States as the ultimate
guarantor of Gulf security. The continuing demand for U.S. weapons in the global arms
marketplace, from a large established client base, has created a more difficult environment for
individual West European suppliers to secure large new contracts with developing nations on a
sustained basis. Yet, as the data indicate, the major West European suppliers continue to make
significant arms transfer contracts each year. In 2015, a contract with Qatar for the Rafale fighter
jet and missiles for a value of $7.1 billion contributed to France’s record-setting export total,
along with a contract with Egypt for two dozen Rafale fighter jets and a naval frigate worth
nearly $6 billion.
An effort to enhance their market share of the arms trade in the face of the strong demand for U.S.
defense equipment, among other considerations, was a key factor in inducing European Union
(EU) member states to adopt a new code of conduct for defense procurement practices. This code
was agreed on November 21, 2005, at the European Defense Agency’s (EDA) steering board
meeting. Currently voluntary, the EU hopes it will become mandatory, and through its
mechanisms foster greater cooperation within the European defense equipment sector in the
awarding of contracts for defense items. By successfully securing greater intra-European
cooperation in defense program planning and collaboration in defense contracting, the EU hopes
that the defense industrial bases of individual EU states will be preserved, thereby enhancing the
capability of European defense firms to compete for arms sales throughout the world. Some
European arms companies have begun, and others completed the phasing out of production of
certain types of weapon systems. These suppliers have increasingly sought to engage in joint
production ventures with other key European weapons suppliers or even client countries in an
effort to sustain major sectors of their individual defense industrial bases—even if a substantial
portion of the weapons produced are for their own armed forces. Examples are the Eurofighter
and Eurocopter projects. A few European suppliers have also adopted the strategy of cooperating
in defense production ventures with the United States such as the Joint Strike Fighter (JSF), rather
than attempting to compete directly, thus meeting their own requirements for advanced combat
aircraft while positioning themselves to share in profits resulting from future sales of this new
fighter aircraft.7
7 For detailed background on issues relating to the Joint Strike Fighter program see CRS Report RL30563, F-35 Joint
Strike Fighter (JSF) Program: Background and Issues for Congress, by Jeremiah Gertler.

Conventional Arms Transfers to Developing Nations, 2008-2015
Congressional Research Service 13
Regional Arms Transfer Agreements
The leading markets for arms in regions of the developing world have been predominately in the
Near East and Asia. Latin American and African nations, by contrast, have not been major
purchasers of weapons, with rare exceptions. The regional arms agreement data tables in this
report demonstrate this. U.S. policymakers have placed emphasis on helping to maintain stability
throughout the regions of the developing world. Consequently, the United States has made and
supported arms sales and transfers it has argued would advance that goal, while discouraging
significant sales by other suppliers to states and regions where military threats to nations in the
area are minimal. Other arms suppliers do not necessarily share the U.S. perspective on what
constitutes an appropriate arms sale, and in some instances the financial benefit of the sale to the
supplier overrides other considerations. The regional and country specific arms-transfer data in
this report provide an indication of where various arms suppliers are focusing their attention and
who their principal clients are. By reviewing these data, policymakers can identify potential
developments that may be of concern, and use this information to assist a review of options they
may choose to consider, given the circumstances. What follows below is a review of data on
arms-transfer agreement activities in the two regions that lead in arms acquisitions, the Near East
and Asia. This is followed, in turn, by a review of data regarding the leading arms purchasers in
the developing world more broadly.
Near East8
The Persian Gulf crisis of August 1990-February 1991 was a principal catalyst for major new
weapons purchases in the Near East made during the last twenty-five years. This crisis,
culminating in a U.S.-led war to expel Iraq from Kuwait, firmly established the United States as a
guarantor of Gulf security and created new demands by key purchasers such as Saudi Arabia,
Kuwait, the United Arab Emirates, and other members of the Gulf Cooperation Council (GCC)
for a variety of advanced weapon systems. Subsequently, concerns over the growing strategic
threat from Iran, which have continued into the 21st century, have become the principal basis of
GCC states’ advanced arms purchases. Because GCC states do not share a land border with Iran,
their weapons purchases have focused primarily on air, naval, and missile defense systems. Egypt
and Israel have also continued their military modernization programs by increasing their
purchases of advanced weaponry, primarily from the United States.
From 2008-2011, Saudi Arabia was the largest purchaser with an agreements value of $52.5
billion. In 2012-2015 Saudi Arabia again held the largest number of agreements with a total value
of $41 billion (in current dollars). India was again second with $23.9 billion (Table 11 and Table
12).
The Near East has generally been the largest arms market in the developing world. In the earlier
period (2008-2011), it ranked first with 54.47% of the total value of all developing nations arms
transfer agreements ($115 billion in current dollars). The Asia region ranked second in 2008-2011
with 28.85% of these agreements ($61 billion in current dollars). During 2012-2015, the Near
East region again placed first with 61.11% of all developing nations agreements ($156.2 billion in
current dollars). The Asia region ranked second in 2012-2015 with $72.2 billion of these
agreements or 31.33% (Table 6 and Table 7).
8 In this report the Near East region includes the following nations: Algeria, Bahrain, Egypt, Iran, Iraq, Israel, Jordan,
Kuwait, Lebanon, Libya, Morocco, Oman, Qatar, Saudi Arabia, Syria, Tunisia, United Arab Emirates, and Yemen. The
countries included in the other geographic regions are listed at the end of the report.

Conventional Arms Transfers to Developing Nations, 2008-2015
Congressional Research Service 14
The United States was predominant in arms transfer agreements with the Near East during the
2008-2011 period with 75.08% of their total value ($86.4 billion in current dollars). Russia was
distant second during these years with 5.47% ($6.3 billion in current dollars). Recently, from
2012 to 2015, the United States ranked first in arms agreements with this region with $54.6
billion (in current dollars), a 35% share. Russia accounted for 17.87% of the region’s agreements
in the most recent period ($27.9 billion in current dollars) (Figure 5) (Table 6 and Table 8).
Asia
The data on regional arms-transfer agreements from 2008 to 2015 indicate that Asia, after the
Near East, is the second largest region of the developing world for orders of conventional
weaponry. Throughout Asia, several developing nations have been upgrading and modernizing
their defense forces, and this has led to new conventional weapons sales in that region. Beginning
in the mid-1990s, Russia became the principal supplier of advanced conventional weaponry to
China for about a decade—selling it fighters, submarines, destroyers, and missiles—while
establishing itself as the principal arms supplier to India. Russian arms sales to these two
countries have been primarily responsible for much of the increase in Asia’s overall share of the
arms market in the developing world during much of the period of this report. Russia has also
expanded its client base in Asia, securing aircraft orders from Malaysia, Vietnam, Burma, and
Indonesia. It is notable that India, while the principal Russian arms customer, during recent years
has sought to diversify its weapons supplier base, purchasing the Phalcon early warning defense
system aircraft in 2004 from Israel and numerous items from France in 2005, in particular six
Scorpene diesel attack submarines. In 2008 India purchased six C130J cargo aircraft from the
United States. In 2010, the United Kingdom sold India 57 Hawk jet trainers for $1 billion. In
2010 Italy also sold India 12 AW101 helicopters. In 2011, France secured a $2.4 billion contract
with India to upgrade 51 of its Mirage-2000 combat fighters, and the United States agreed to sell
India 10 C-17 Globemaster III aircraft for $4.1 billion. This pattern of Indian arms purchases
indicates that Russia will likely face strong new competition from other major weapons suppliers
for the India arms market, and it can no longer be assured that India will consistently purchase its
major combat systems. Indeed, India in 2011 had eliminated Russia from the international
competition to supply a new-generation combat fighter aircraft, a competition won by France. In
2015 Russia and India agreed to a contract in which India would procure at least 200 Ka-226T
helicopters.
Asia has over time been the second-largest developing-world arms market. In 2012-2015, Asia
ranked second, accounting for 31.3% of the total value of all arms transfer agreements with
developing nations ($72.2 billion in current dollars). In the earlier period, 2008-2011, the Asia
region ranked second, accounting for 28.8% of all such agreements ($61 billion in current dollars)
(Table 6 and Table 7).
In the earlier period (2008-2011), the United States ranked first in the value of arms transfer
agreements with Asia with 27.53% ($16.8 billion in current dollars).Russia made 26.23% of this
region’s agreements in 2008-2011. The major Western European suppliers, as a group, made 17%
of this region’s agreements. In the later period (2012-2015), the United States ranked first in
Asian agreements with 36.53% ($26.4 billion in current dollars); Russia ranked second with
24.53% ($17.7 billion in current dollars). The major West European suppliers, as a group, made
16.9% of this region’s agreements in 2012-2015. (Figure 6) (Table 8).

Conventional Arms Transfers to Developing Nations, 2008-2015
Congressional Research Service 15
Leading Developing Nations Arms Purchasers
Saudi Arabia was the leading developing world arms purchaser from 2008-2015, with agreements
totaling $93.5 billion. India was the second largest developing world arms purchaser from 2008 to
2015, making arms transfer agreements totaling $34 billion during these years (in current dollars).
These increases reflect the military modernization efforts by India, underway since the 1990s. In
the 2008-2011 period, Saudi Arabia ranked first in arms transfer agreements at $52.5 billion (in
current dollars). In 2012-2015 Saudi Arabia ranked first in arms transfer agreements, with $41 (in
current dollars). The total value of all arms transfer agreements with developing nations from
2008 to 2015 was $468.4 billion (in current dollars). (Table 3, Table 6, Table 12, and Table 13).
Weapons Types Recently Delivered to Near East Nations
Regional weapons delivery data reflect the diverse sources of supply and type of conventional
weaponry actually transferred to developing nations. Even though the United States, Russia, and
the four major West European suppliers dominate in the delivery of the 14 classes of weapons
examined, it is also evident that the other European suppliers and some non-European suppliers,
including China, can be leading suppliers of selected types of conventional armaments to
developing nations (Tables 25-29).
Weapons deliveries to the Near East, historically the largest purchasing region in the developing
world, reflect the quantities and types delivered by both major and lesser suppliers. The following
is a summary of weapons deliveries to this region for the period 2012-2015 from Table 27:
United States
52 tanks and self-propelled guns
1APC and armored car
45 supersonic combat aircraft
136 artillery
236 surface-to-air missiles
20 anti-ship missiles
Russia
210 tanks and self-propelled guns
10 APCs and armored cars
40 artillery
10 supersonic combat aircraft
50 helicopters
3,880 surface-to-air missiles
60 surface-to-surface missiles
China
60 artillery
10 APCs and armored cars
390 surface-to-air missiles
1 major surface combatant

Conventional Arms Transfers to Developing Nations, 2008-2015
Congressional Research Service 16
Major West European Suppliers
250 APCs and armored cars
10 tanks and self-propelled guns
7 major surface combatants
18 minor surface combatants
1 submarine
20 supersonic combat aircraft
40 helicopters
920 surface-to-air missiles
170 anti-ship missiles
All Other European Suppliers
80 tanks and self-propelled guns
170 artillery
560 APCs and armored cars
2 major surface combatants
32 minor surface combatants
20 surface-to-air missiles
All Other Suppliers
10 tanks and self-propelled guns
280 artillery
180 APCs and armored cars
2 major surface combatants
20 helicopters
270 surface-to-air missiles
These data indicate that substantial quantities of major combat systems were delivered to the Near
East region from 2012-2015, in particular, tanks and self-propelled guns, armored vehicles,
supersonic combat aircraft, helicopters, air defense and anti-ship missiles. Although the United
States, Russia, and the European suppliers were the ones who delivered the greater number of
these significant combat systems, other suppliers provided important naval systems and ground
equipment as well. Both aircraft platforms and naval craft are particularly expensive, and
constitute a large portion of the dollar values of arms deliveries of all suppliers to this region
during the 2012-2015 period. Although not necessarily as expensive as aircraft or naval vessels,
other weapon systems possess significant capabilities and create important security threats in the
Near East region. Such systems include anti-ship and surface-to-surface missiles. In these
categories Russia delivered 60 surface-to-surface missiles to the Near East from 2012-2015. The
four major West European suppliers collectively delivered 170 anti-ship missiles.

Conventional Arms Transfers to Developing Nations, 2008-2015
Congressional Research Service 17
U.S. Commercial Arms Exports
United States commercially licensed arms export deliveries data are not included in this report. The United States is
the only major arms supplier that has two distinct systems for the export of weapons: the government-to-
government Foreign Military Sales (FMS) system, and the licensed commercial export system. It should be noted that
data maintained on U.S. commercial sales agreements and deliveries are incomplete, and are not collected or revised
on an ongoing basis, making them significantly less precise than those for the U.S. FMS program—which accounts for
the overwhelming portion of U.S. conventional arms transfer agreements and deliveries involving weapon systems.
There are no official compilations of commercial agreement data comparable to that for the FMS program maintained
on an annual basis. Once an exporter receives from the State Department a commercial license authorization to
sell—valid for four years—there is no current requirement that the exporter provide to the State Department, on a
systematic and ongoing basis, comprehensive details regarding any sales contract that results from the license
authorization, including if any such contract is reduced in scope or cancelled. Nor is the exporter required to report
that no contract with the prospective buyer resulted.
Annual commercially licensed arms deliveries data are obtained from shipper’s export documents and completed
licenses from ports of exit by the U.S. Customs and Border Protection Agency which are then provided to the U.S.
Census Bureau. The Census Bureau takes these arms export data, and, following a minimal review of them, submits
them to the Directorate of Defense Trade Controls in the Political-Military Bureau (PM/DDTC) of the State
Department, which makes the final compilation of such data—details of which are not publicly available. Once
compiled by the Directorate of Defense Trade Controls at the State Department, these commercially licensed arms
deliveries data are not revised. By contrast, the U.S. Foreign Military Sales (FMS) program data, for both agreements
and deliveries, maintained by the Defense Department, are systematically collected, reviewed for accuracy on an on-
going basis, and are revised from year-to-year as needed to reflect any changes or to correct any errors in the
information. This report includes all FMS deliveries data. By excluding U.S. commercial licensed arms deliveries data,
the U.S. arms delivery totals will be understated.
Some have suggested that a systematic data collection and reporting system for commercial licensed exports,
comparable to the one that exists now in the Department of Defense, should be established by the Department of
State. Having current and comprehensive agreement and delivery data on commercially licensed exports would
provide a more complete picture of the U.S. arms export trade, in this view, and thus facilitate Congressional
oversight of this sector of U.S. exports.
Arms Values Data Tables and Charts for 2008-2015 Tables 3 through 13 present current official data on arms transfer agreements with developing
nations by major suppliers from 2008 to 2015. These data show the most recent trends in arms
contract activity by major suppliers. Delivery data, which reflect implementation of sales
previously concluded, are provided in Tables 14 through 24. Table 30, Table 31, Table 32, Table
33, and Table 34 provide data on worldwide arms transfer agreements from 2008-2015, while
Table 35, Table 36, Table 37, Table 38, and Table 39 provide data on worldwide arms deliveries
during this period. To use these data regarding agreements for purposes other than assessing
general trends in seller/buyer activity is to risk drawing conclusions that can be readily
invalidated by future events—precise values and comparisons, for example, may change due to
cancellations or modifications of major arms transfer agreements previously concluded.
These data sets reflect the comparative magnitude of arms transactions by arms suppliers with
recipient nations expressed in constant dollar terms, unless otherwise noted. Illustrative pie and
bar charts are provided in this section to give the relative market share of individual arms
suppliers globally, to the developing world and to specific regions. Table 1 provides the value of
worldwide arms transfer agreements for 2008-2011. 2012-2015 and 2015, and the suppliers’ share
of such agreements with the developing world. Table 2 provides the value of worldwide arms
deliveries for 2008-2011, 2012-2015 and 2015, and the suppliers’ share of such deliveries with
the developing world. Specific content of other individual data tables is described below.
Conventional Arms Transfers to Developing Nations, 2008-2015
Congressional Research Service 18
Table 3 shows the annual current dollar values of arms transfer agreements to developing nations
by major suppliers from 2008-2015. This table provides the data from which Table 4 (constant
dollars) and Table 5 (supplier percentages) are derived.
Regional Arms Transfer Agreements, 2008-2015
Table 6 gives the values of arms transfer agreements between suppliers and individual regions of
the developing world for the periods 2008-2011 and 2012-2015. These values are expressed in
current U.S. dollars. Table 7, derived from Table 6, gives the percentage distribution of each
supplier’s agreement values within the regions for the two time periods. Table 8, also derived
from Table 6, illustrates what percentage share of each developing world region’s total arms
transfer agreements was held by specific suppliers during the years 2008-2011 and 2012-2015.
Arms Transfer Agreements With Developing Nations, 2008-2015: Leading
Suppliers Compared
Table 9 gives the values of arms transfer agreements with the developing nations from 2008 to
2015 by the top 11 suppliers. The table ranks these suppliers on the basis of the total current
dollar values of their respective agreements with the developing world for each of three periods—
2008-2011, 2012-2015, and 2008-2015.
Arms Transfer Agreements With Developing Nations In 2015: Leading
Suppliers Compared
Table 10 ranks and gives for 2015 the values of arms transfer agreements with developing nations
of the top 11 suppliers in current U.S. dollars.
Arms Transfer Agreements With Near East 2008-2015: Suppliers and
Recipients
Table 11 gives the values of arms transfer agreements with the Near East nations by suppliers or
categories of suppliers for the periods 2008-2011 and 2012-2015. These values are expressed in
current U.S. dollars. They are a subset of the data contained in Table 3 and Table 6.
Arms Transfers to Developing Nations, 2008-2015: Agreements With
Leading Recipients
Table 12 gives the values of arms transfer agreements made by the top 10 recipients of arms in
the developing world from 2008 to 2015 with all suppliers collectively. The table ranks recipients
on the basis of the total current dollar values of their respective agreements with all suppliers for
each of three periods—2008-2011, 2012-2015 and 2008-2015.
Arms Transfers to Developing Nations In 2015: Agreements With Leading
Recipients
Table 13 names the top 10 developing world recipients of arms transfer agreements in 2015. The
table ranks these recipients on the basis of the total current dollar values of their respective
agreements with all suppliers in 2015.
Developing Nations Arms Delivery Values
Table 14 shows the annual current dollar values of arms deliveries (items actually transferred) to
developing nations by major suppliers from 2008-2015. The utility of these particular data is that
they reflect transfers that have occurred. They provide the data from which Table 15 (constant
dollars) and Table 16 (supplier percentages) are derived.

Conventional Arms Transfers to Developing Nations, 2008-2015
Congressional Research Service 19
Regional Arms Delivery Values, 2008-2015
Table 17 gives the values of arms deliveries by suppliers to individual regions of the developing
world for the periods 2008-2011 and 2012-2015. These values are expressed in current U.S.
dollars. Table 18, derived from Table 17, gives the percentage distribution of each supplier’s
deliveries values within the regions for the two time periods. Table 19, also derived from Table
17, illustrates what percentage share of each developing world region’s total arms delivery values
was held by specific suppliers during the years 2008-2011 and 2012-2015.
Arms Deliveries to Developing Nations, 2008-2015: Leading Suppliers
Compared
Table 20 gives the values of arms deliveries to developing nations from 2008-2015 by the top 11
suppliers. The table ranks these suppliers on the basis of the total current dollar values of their
respective deliveries to the developing world for each of three periods—2008-2011, 2012-2015,
and 2008-2015.
Arms Deliveries to Developing Nations In 2015: Leading Suppliers
Compared
Table 21 ranks and gives for 2015 the values of arms deliveries to developing nations of the top
11 suppliers in current U.S. dollars.
Arms Deliveries to Near East, 2008-2015: Suppliers and Recipients
Table 22 gives the values of arms delivered to Near East nations by suppliers or categories of
suppliers for the periods 2008-2011 and 2012-2015. These values are expressed in current U.S.
dollars. They are a subset of the data contained in Table 14 and Table 17.
Arms Deliveries to Developing Nations, 2008-2015: The Leading Recipients
Table 23 gives the values of arms deliveries made to the top 10 recipients of arms in the
developing world from 2008 to 2015 by all suppliers collectively. The table ranks recipients on
the basis of the total current dollar values of their respective deliveries from all suppliers for each
of three periods—2008-2011, 2012-2015 and 2008-2015.
Arms Transfers to Developing Nations In 2015: Agreements With Leading
Recipients
Table 24 names the top 10 developing world recipients of arms transfer agreements in 2015. The
table ranks these recipients on the basis of the total current dollar values of their respective
agreements with all suppliers in 2015.
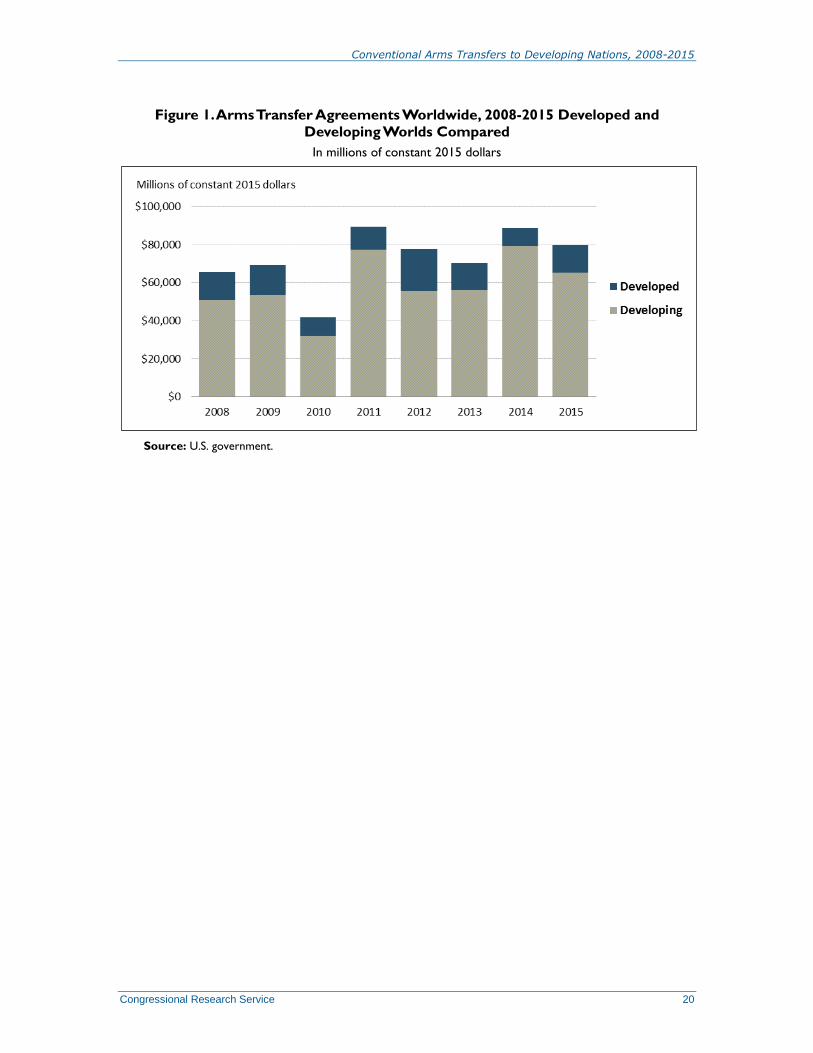
Conventional Arms Transfers to Developing Nations, 2008-2015
Congressional Research Service 20
Figure 1. Arms Transfer Agreements Worldwide, 2008-2015 Developed and
Developing Worlds Compared
In millions of constant 2015 dollars
Source: U.S. government.

Conventional Arms Transfers to Developing Nations, 2007-2014
CRS-21
Figure 2. Arms Transfer Agreements Worldwide
(supplier percentage of value)
Source: U.S. government.
Figure 3. Arms Transfer Agreements With Developing Nations
(supplier percentage of value)
Source: U.S. government.

Conventional Arms Transfers to Developing Nations, 2007-2014
CRS-22
Figure 4. Arms Transfer Agreements With Developing Nations by Major Supplier, 2008-2015
(millions of constant 2015 dollars)
Source: U.S. government.

Conventional Arms Transfers to Developing Nations, 2008-2015
Congressional Research Service 23
Table 1. Worldwide Arms Transfer Agreements, 2008-2015 and Suppliers’ Share with
Developing World
(in millions of current 2015 U.S. dollars)
Supplier
Worldwide Agreements
Value 2008-2011
Percentage of Total with
Developing World
United States 139,437 79.71%
Russia 36,000 91.11%
France 23,200 92.67%
United Kingdom 4,000 70.00%
China 10,500 99.05%
Germany 9,600 56.25%
Italy 8,900 56.18%
All Other European 20,400 70.59%
All Others 14,600 74.66%
TOTAL 266,637 80.39%
Supplier
Worldwide Agreements Value 2012-2015
Percentage of Total with Developing World
United States 126,034 67.95%
Russia 52,500 92.57%
France 29,200 94.86%
United Kingdom 10,800 96.30%
China 17,100 100.00%
Germany 15,900 81.76%
Italy 5,500 81.82%
All Other European 42,200 86.97%
All Others 17,800 72.47%
TOTAL 317,034 80.92%
Supplier
Worldwide Agreements
Value 2015
Percentage of Total with
Developing World
United States 40,157 66.60%
Russia 11,100 99.10%
France 15,300 99.35%
United Kingdom 700 100.00%
China 6,000 100.00%
Germany 9,00 77.78%
Italy 1,000 100.00%
All Other European 3,100 93.55%
All Others 1,600 62.50%
TOTAL 79,857 81.70%
Source: U.S. government.

Conventional Arms Transfers to Developing Nations, 2007-2014
CRS-24
Figure 5. Arms Transfer Agreements with Developing Nations in the Near East
(supplier percentage of value)
Source: U.S. government.
Figure 6. Arms Transfer Agreements With Developing Nations in Asia
(supplier percentage of value)
(excludes Japan, Australia, and New Zealand)
Source: U.S. government.
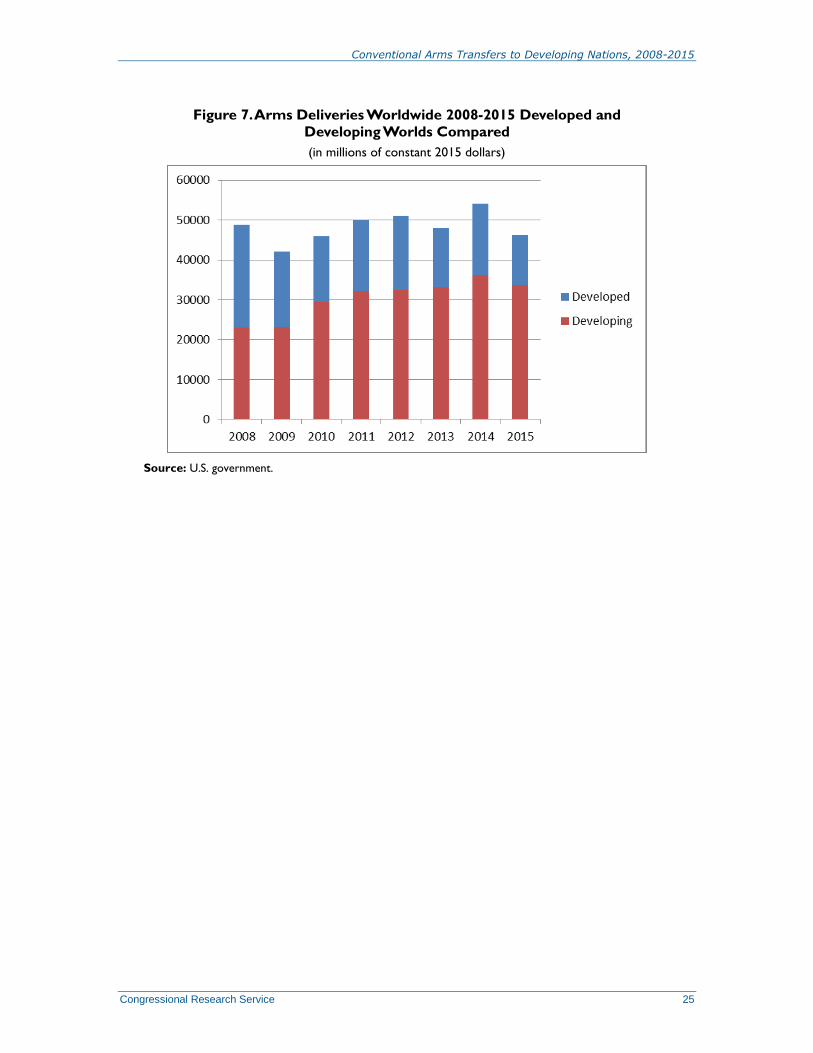
Conventional Arms Transfers to Developing Nations, 2008-2015
Congressional Research Service 25
Figure 7. Arms Deliveries Worldwide 2008-2015 Developed and
Developing Worlds Compared
(in millions of constant 2015 dollars)
Source: U.S. government.

Conventional Arms Transfers to Developing Nations, 2007-2014
CRS-26
Figure 8. Arms Deliveries to Developing Countries by Major Supplier, 2008-2015 (in millions of constant 2015 dollars)
Source: U.S. government.

Conventional Arms Transfers to Developing Nations, 2008-2015
Congressional Research Service 27
Table 2. Worldwide Arms Deliveries, 2008-2015 and Suppliers’ Share with
Developing World
(in millions of current 2015 U.S. dollars)
Supplier
Worldwide Deliveries
Value 2008-2011 Percentage of Total to Developing World
United States 52,635 62.73%
Russia 28,400 94.72%
France 8,900 49.44%
United Kingdom 11,300 49.56%
China 8,900 100.00%
Germany 15,200 38.82%
Italy 6,400 20.25%
All Other European 25,700 49.42%
All Others 19,500 35.90%
TOTAL 186,835 57.66%
Supplier
Worldwide Deliveries Value 2012-2015 Percentage of Total to Developing World
United States 64,640 69.63%
Russia 38,100 91.60%
France 20,400 68.14%
United Kingdom 10,900 50.46%
China 9,600 98.96%
Germany 6,800 57.35%
Italy 6,800 63.24%
All Other European 25,500 46.27%
All Others 16,700 39.52%
TOTAL 199,440 67.89%
Supplier
Worldwide Deliveries
Value 2015 Percentage of Total to Developing World
United States 16,931 70.31%
Russia 7,200 86.11%
France 7,000 88.57%
United Kingdom 1,300 15.38%
China 2,900 100.00%
Germany 1,600 68.75%
Italy 1,800 83.33%
All Other European 4,400 54.55%
All Others 3,100 38.71%
TOTAL 46,231 72.69%
Source: U.S. government.

Conventional Arms Transfers to Developing Nations, 2007-2014
CRS -28
Table 3. Arms Transfer Agreements with Developing Nations, by Supplier, 2008-2015
(in millions of current U.S. dollars)
2008 2009 2010 2011 2012 2013 2014 2015 2008-2015
United States 27,200 13,119 14,695 56,131 11,331 17,835 29,735 26,743 194,264
Russia 5,400 14,900 6,800 5,700 16,700 10,700 10,200 11,000 81,400
France 5,600 9,300 1,900 4,700 3,100 3,800 5,600 15,200 49,200
United Kingdom 0 1,100 1,200 500 5,700 3,600 400 700 13,200
China 2,200 3,000 2,000 3,200 3,500 4,300 3,300 6,000 27,500
Germany 3,000 2,200 100 100 4,900 7,000 400 700 18,400
Italy 1,400 1,300 1,200 1,100 1,500 900 1,100 1,000 9,500
All Other European 4,100 4,600 2,800 2,900 5,800 3,600 24,400 2,900 51,100
All Others 2,000 4,200 1,500 3,200 3,000 4,700 4,200 1,000 23,800
TOTAL 50,900 53,719 32,195 77,531 55,531 56,435 79,335 65,243 468,364
Source: U.S. government.
Notes: Developing nations category excludes the United States, Europe, Canada, Japan, Australia, and New Zealand. All data are for the calendar year given except for U.S.
MAP (Military Assistance Program), IMET (International Military Education, and Training), and Excess Defense Article data, which are included for the particular fiscal year.
All amounts given include the values of all categories of weapons, spare parts, construction, all associated services, military assistance, excess defense articles, and training
programs. Statistics for foreign countries are based upon estimated selling prices. All foreign data are rounded to the nearest $100 million.
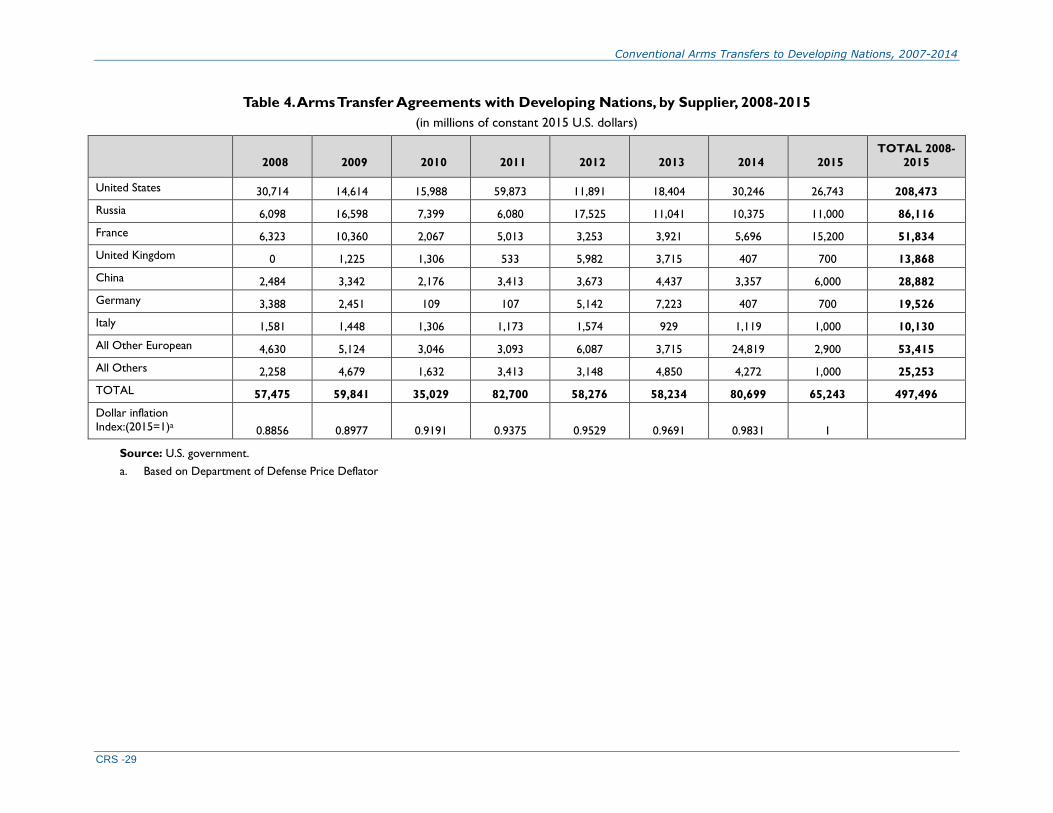
Conventional Arms Transfers to Developing Nations, 2007-2014
CRS -29
Table 4. Arms Transfer Agreements with Developing Nations, by Supplier, 2008-2015
(in millions of constant 2015 U.S. dollars)
2008 2009 2010 2011 2012 2013 2014 2015
TOTAL 2008-
2015
United States 30,714 14,614 15,988 59,873 11,891 18,404 30,246 26,743 208,473
Russia 6,098 16,598 7,399 6,080 17,525 11,041 10,375 11,000 86,116
France 6,323 10,360 2,067 5,013 3,253 3,921 5,696 15,200 51,834
United Kingdom 0 1,225 1,306 533 5,982 3,715 407 700 13,868
China 2,484 3,342 2,176 3,413 3,673 4,437 3,357 6,000 28,882
Germany 3,388 2,451 109 107 5,142 7,223 407 700 19,526
Italy 1,581 1,448 1,306 1,173 1,574 929 1,119 1,000 10,130
All Other European 4,630 5,124 3,046 3,093 6,087 3,715 24,819 2,900 53,415
All Others 2,258 4,679 1,632 3,413 3,148 4,850 4,272 1,000 25,253
TOTAL 57,475 59,841 35,029 82,700 58,276 58,234 80,699 65,243 497,496
Dollar inflation
Index:(2015=1)a 0.8856 0.8977 0.9191 0.9375 0.9529 0.9691 0.9831 1
Source: U.S. government.
a. Based on Department of Defense Price Deflator
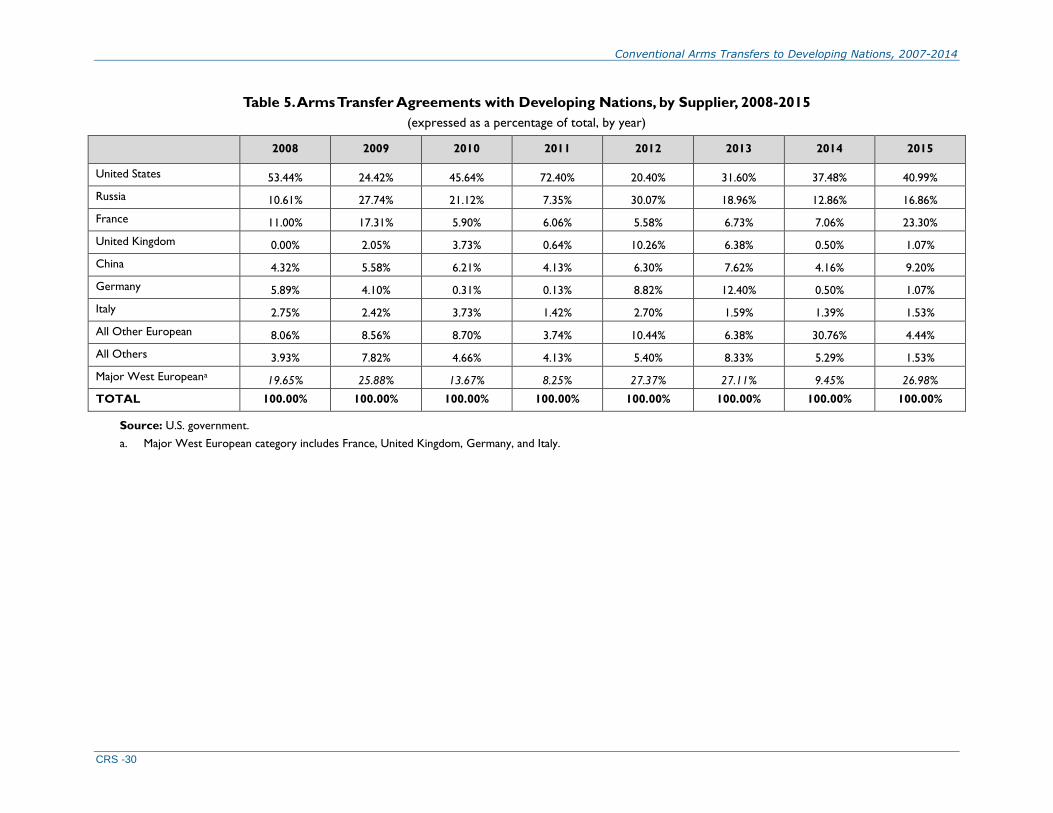
Conventional Arms Transfers to Developing Nations, 2007-2014
CRS -30
Table 5. Arms Transfer Agreements with Developing Nations, by Supplier, 2008-2015
(expressed as a percentage of total, by year)
2008 2009 2010 2011 2012 2013 2014 2015
United States 53.44% 24.42% 45.64% 72.40% 20.40% 31.60% 37.48% 40.99%
Russia 10.61% 27.74% 21.12% 7.35% 30.07% 18.96% 12.86% 16.86%
France 11.00% 17.31% 5.90% 6.06% 5.58% 6.73% 7.06% 23.30%
United Kingdom 0.00% 2.05% 3.73% 0.64% 10.26% 6.38% 0.50% 1.07%
China 4.32% 5.58% 6.21% 4.13% 6.30% 7.62% 4.16% 9.20%
Germany 5.89% 4.10% 0.31% 0.13% 8.82% 12.40% 0.50% 1.07%
Italy 2.75% 2.42% 3.73% 1.42% 2.70% 1.59% 1.39% 1.53%
All Other European 8.06% 8.56% 8.70% 3.74% 10.44% 6.38% 30.76% 4.44%
All Others 3.93% 7.82% 4.66% 4.13% 5.40% 8.33% 5.29% 1.53%
Major West Europeana 19.65% 25.88% 13.67% 8.25% 27.37% 27.11% 9.45% 26.98%
TOTAL 100.00% 100.00% 100.00% 100.00% 100.00% 100.00% 100.00% 100.00%
Source: U.S. government.
a. Major West European category includes France, United Kingdom, Germany, and Italy.
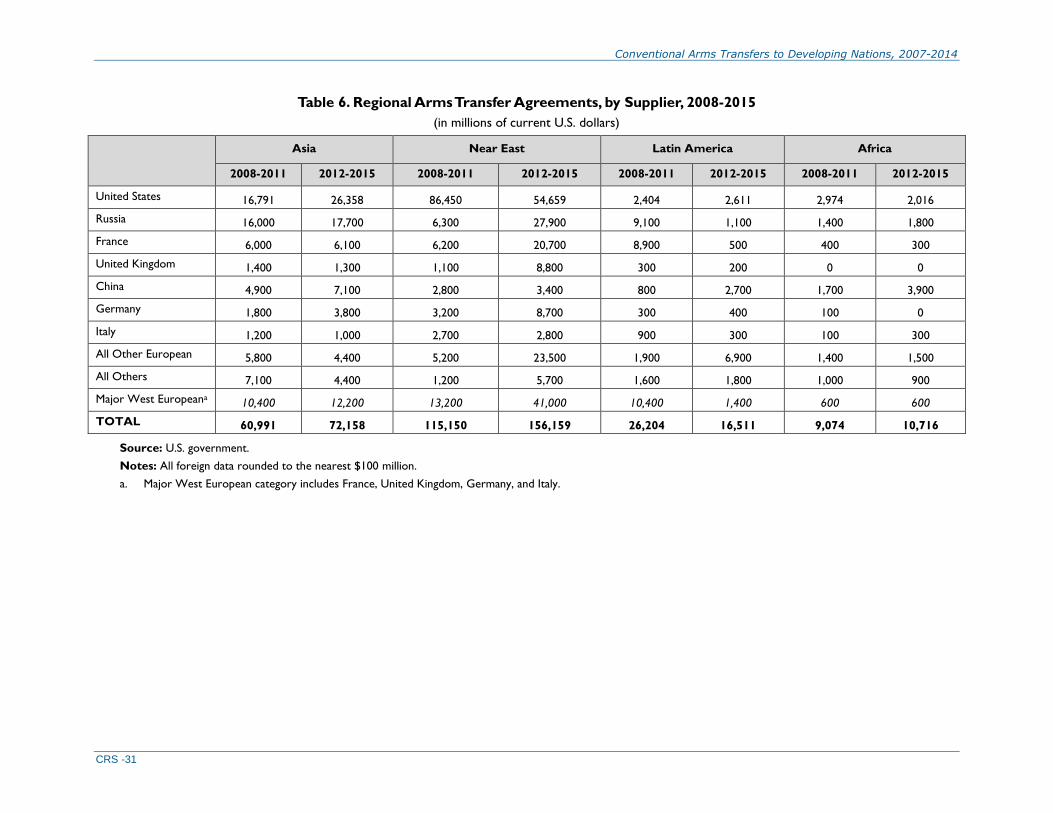
Conventional Arms Transfers to Developing Nations, 2007-2014
CRS -31
Table 6. Regional Arms Transfer Agreements, by Supplier, 2008-2015
(in millions of current U.S. dollars)
Asia Near East Latin America Africa
2008-2011 2012-2015 2008-2011 2012-2015 2008-2011 2012-2015 2008-2011 2012-2015
United States 16,791 26,358 86,450 54,659 2,404 2,611 2,974 2,016
Russia 16,000 17,700 6,300 27,900 9,100 1,100 1,400 1,800
France 6,000 6,100 6,200 20,700 8,900 500 400 300
United Kingdom 1,400 1,300 1,100 8,800 300 200 0 0
China 4,900 7,100 2,800 3,400 800 2,700 1,700 3,900
Germany 1,800 3,800 3,200 8,700 300 400 100 0
Italy 1,200 1,000 2,700 2,800 900 300 100 300
All Other European 5,800 4,400 5,200 23,500 1,900 6,900 1,400 1,500
All Others 7,100 4,400 1,200 5,700 1,600 1,800 1,000 900
Major West Europeana 10,400 12,200 13,200 41,000 10,400 1,400 600 600
TOTAL 60,991 72,158 115,150 156,159 26,204 16,511 9,074 10,716
Source: U.S. government.
Notes: All foreign data rounded to the nearest $100 million.
a. Major West European category includes France, United Kingdom, Germany, and Italy.

Conventional Arms Transfers to Developing Nations, 2007-2014
CRS -32
Table 7. Percentage of Each Supplier’s Agreements Value by Region, 2008-2015
Asia Near East Latin America Africa TOTAL
2008-2011 2012-2015 2008-2011 2012-2015 2008-2011 2012-2015 2008-2011 2012-2015 2008-2011 2012-2015
United States 15.46% 30.78% 79.59% 63.82% 2.21% 3.05% 2.74% 2.35% 100.00% 100.00%
Russia 48.78% 75.97% 19.21% 57.53% 27.74% 4.72% 4.27% 7.73% 100.00% 100.00%
France 27.91% 22.10% 28.84% 75.00% 41.40% 1.81% 1.86% 1.09% 100.00% 100.00%
United Kingdom 50.00% 12.62% 39.29% 85.44% 10.71% 1.94% 0.00% 0.00% 100.00% 100.00%
China 48.04% 41.52% 27.45% 19.88% 7.84% 15.79% 16.67% 22.81% 100.00% 100.00%
Germany 33.33% 29.46% 59.26% 67.44% 5.56% 3.10% 1.85% 0.00% 100.00% 100.00%
Italy 24.49% 22.73% 55.10% 63.64% 18.37% 6.82% 2.04% 6.82% 100.00% 100.00%
All Other European 40.56% 12.12% 36.36% 64.74% 13.29% 19.01% 9.79% 4.13% 100.00% 100.00%
All Others 65.14% 34.38% 11.01% 44.53% 14.68% 14.06% 9.17% 7.03% 100.00% 100.00%
Major West Europeana 30.06% 22.10% 38.15% 74.28% 30.06% 2.54% 1.73% 1.09% 100.00% 100.00%
TOTAL 28.85% 31.33% 54.47% 61.11% 12.39% 7.17% 4.29% 4.19% 100.00% 100.00%
Source: U.S. government.
a. Major West European category includes France, United Kingdom, Germany, and Italy.

Conventional Arms Transfers to Developing Nations, 2007-2014
CRS -33
Table 8. Percentage of Total Agreements Value by Supplier to Regions, 2008-2015
Asia Near East Latin America Africa
2008-2011 2012-2015 2008-2011 2012-2015 2008-2011 2012-2015 2008-2011 2012-2015
United States 27.53% 36.53% 75.08% 35.00% 9.17% 15.81% 32.77% 18.81%
Russia 26.23% 24.53% 5.47% 17.87% 34.73% 6.66% 15.43% 16.80%
France 9.84% 8.45% 5.38% 13.26% 33.96% 3.03% 4.41% 2.80%
United Kingdom 2.30% 1.80% 0.96% 5.64% 1.14% 1.21% 0.00% 0.00%
China 8.03% 9.84% 2.43% 2.18% 3.05% 16.35% 18.73% 36.40%
Germany 2.95% 5.27% 2.78% 5.57% 1.14% 2.42% 1.10% 0.00%
Italy 1.97% 1.39% 2.34% 1.79% 3.43% 1.82% 1.10% 2.80%
All Other European 9.51% 6.10% 4.52% 15.05% 7.25% 41.79% 15.43% 14.00%
All Others 11.64% 6.10% 1.04% 3.65% 6.11% 10.90% 11.02% 8.40%
Major West Europeana 17.05% 16.91% 11.46% 26.02% 39.69% 8.48% 6.61% 5.60%
TOTAL 100.00% 100.00% 100.00% 100.00% 100.00% 100.00% 100.00% 100.00%
Source: U.S. government.
a. Major West European category includes France, United Kingdom, Germany, and Italy.
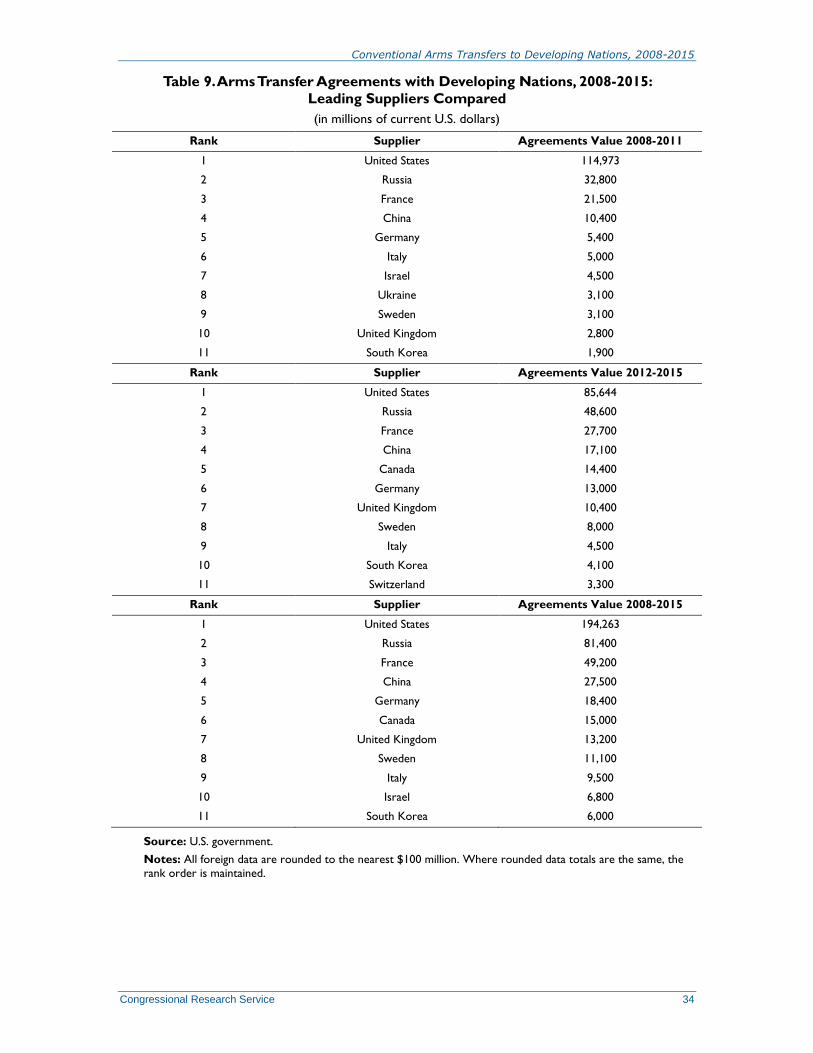
Conventional Arms Transfers to Developing Nations, 2008-2015
Congressional Research Service 34
Table 9. Arms Transfer Agreements with Developing Nations, 2008-2015:
Leading Suppliers Compared
(in millions of current U.S. dollars)
Rank Supplier Agreements Value 2008-2011
1 United States 114,973
2 Russia 32,800
3 France 21,500
4 China 10,400
5 Germany 5,400
6 Italy 5,000
7 Israel 4,500
8 Ukraine 3,100
9 Sweden 3,100
10 United Kingdom 2,800
11 South Korea 1,900
Rank Supplier Agreements Value 2012-2015
1 United States 85,644
2 Russia 48,600
3 France 27,700
4 China 17,100
5 Canada 14,400
6 Germany 13,000
7 United Kingdom 10,400
8 Sweden 8,000
9 Italy 4,500
10 South Korea 4,100
11 Switzerland 3,300
Rank Supplier Agreements Value 2008-2015
1 United States 194,263
2 Russia 81,400
3 France 49,200
4 China 27,500
5 Germany 18,400
6 Canada 15,000
7 United Kingdom 13,200
8 Sweden 11,100
9 Italy 9,500
10 Israel 6,800
11 South Korea 6,000
Source: U.S. government.
Notes: All foreign data are rounded to the nearest $100 million. Where rounded data totals are the same, the
rank order is maintained.
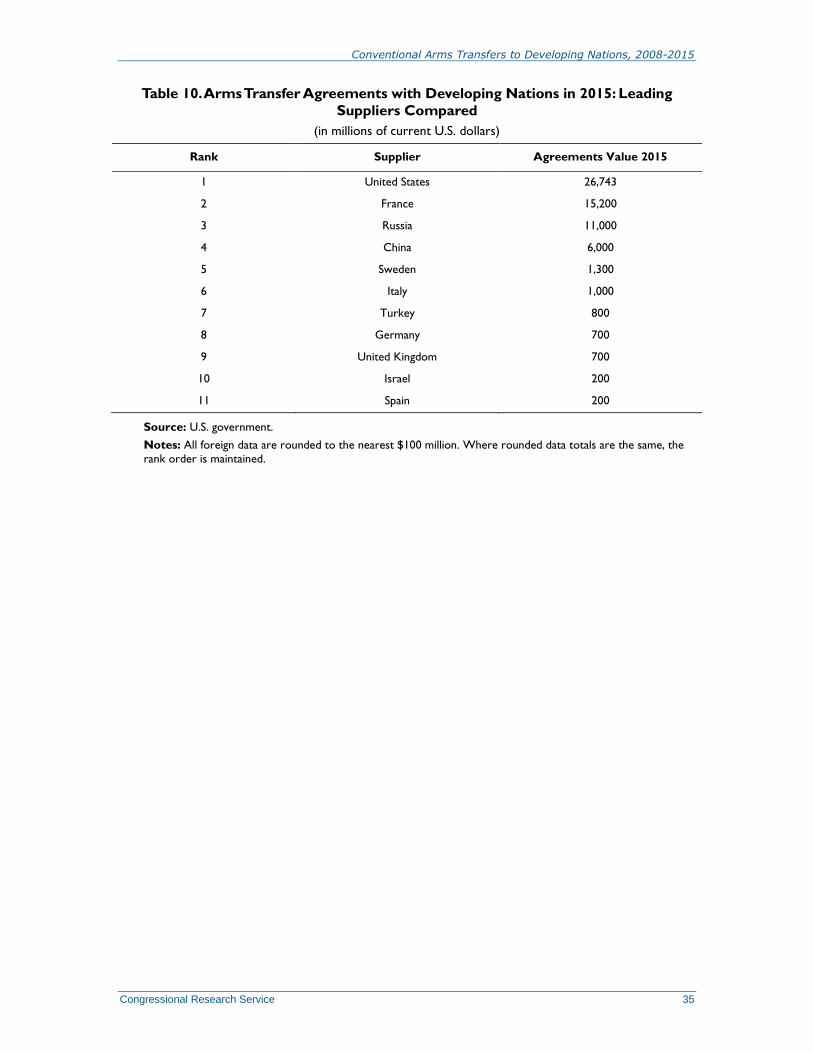
Conventional Arms Transfers to Developing Nations, 2008-2015
Congressional Research Service 35
Table 10. Arms Transfer Agreements with Developing Nations in 2015: Leading
Suppliers Compared
(in millions of current U.S. dollars)
Rank Supplier Agreements Value 2015
1 United States 26,743
2 France 15,200
3 Russia 11,000
4 China 6,000
5 Sweden 1,300
6 Italy 1,000
7 Turkey 800
8 Germany 700
9 United Kingdom 700
10 Israel 200
11 Spain 200
Source: U.S. government.
Notes: All foreign data are rounded to the nearest $100 million. Where rounded data totals are the same, the
rank order is maintained.

Conventional Arms Transfers to Developing Nations, 2008-2015
Congressional Research Service 36
Table 11. Arms Transfer Agreements with Near East, by Supplier
(in millions of current U.S. dollars)
Recipient
Country U.S. Russia China
Major West
Europeana
All Other
European
All
Others Total
2008-2011
Algeria 0 2,700 300 800 100 100 4,000
Bahrain 300 0 0 0 100 0 400
Egypt 6,800 500 800 200 300 0 8,600
Iran 0 100 0 0 100 100 300
Iraq 3,800 300 0 500 400 200 5,200
Israel 5,100 0 0 0 0 0 5,100
Jordan 1,600 0 0 0 100 0 1,700
Kuwait 2,400 600 300 0 0 0 3,300
Lebanon 200 0 0 0 0 200 400
Libya 0 100 0 500 200 0 800
Morocco 2,600 0 500 1,000 900 0 5,000
Oman 1,600 0 0 1,700 0 0 3,300
Qatar 200 0 0 800 0 0 1,000
Saudi Arabia 44,900 0 400 6,000 1,100 100 52,500
Syria 0 1,600 400 0 100 100 2,200
Tunisia 0 0 0 100 0 0 100
U.A.E. 14,100 100 0 1,600 1,500 300 17,600
Yemen 0 300 100 0 300 100 800
Recipient
Country U.S. Russia China
Major West
European
All Other
European
All
Others Total
2012-2015
Algeria 0 9,000 600 4,000 100 100 13,800
Bahrain 300 100 0 100 0 0 500
Egypt 1,300 9,300 400 9,400 700 400 21,500
Iran 0 600 0 0 0 0 600
Iraq 8,900 8,300 800 400 1,900 3,600 23,900
Israel 7,000 0 0 2,200 0 0 9,200
Jordan 1,300 0 200 0 300 200 2,000
Kuwait 4,400 0 0 200 0 100 4,700
Lebanon 500 100 0 0 0 0 600
Libya 0 0 0 0 300 100 400
Morocco 1,200 0 0 0 0 0 1,200
Oman 900 0 0 4,400 1,000 900 7,200
Qatar 9,900 0 0 12,100 900 0 22,900
Saudi Arabia 17,000 0 600 7,200 16,100 100 41,000
Syria 0 500 0 0 100 0 600
Tunisia 500 0 0 0 0 0 500
U.A.E. 4,200 0 800 900 2,000 200 8,100
Yemen 0 0 0 0 100 0 100
Source: U.S. government.
Notes: 0=data less than $50 million or nil. All data are rounded to the nearest $100 million.
a. Major West European category includes France, United Kingdom, Germany, and Italy totals as an aggregate
figure.

Conventional Arms Transfers to Developing Nations, 2008-2015
Congressional Research Service 37
Table 12. Arms Transfer Agreements with Developing Nations, 2008-2015:
Agreements by the Leading Recipients
(in millions of current U.S. dollars)
Rank Recipient Agreements Value 2008-2011
1 Saudi Arabia 52,500
2 India 21,300
3 United Arab Emirates 17,600
4 Brazil 9,400
5 Venezuela 9,000
6 Egypt 8,000
7 Taiwan 5,500
8 South Korea 5,200
9 Iraq 5,200
10 Israel 5,100
Rank Recipient Agreements Value 2012-2015
1 Saudi Arabia 41,000
2 Iraq 23,900
3 Qatar 22,900
4 Egypt 21,500
5 South Korea 15,200
6 Algeria 13,800
7 India 12,900
8 Israel 9,200
9 U.A.E. 8,100
10 Oman 7,200
Rank Recipient Agreements Value 2008-2015
1 Saudi Arabia 93,500
2 India 34,000
3 Egypt 30,100
4 Iraq 29,100
5 U.A.E. 25,700
6 Qatar 23,900
7 South Korea 20,400
8 Algeria 17,800
9 Brazil 16,500
10 Israel 14,300
Source: U.S. government.
Notes: All data are rounded to the nearest $100 million. Where rounded data totals are the same, the rank
order is maintained.

Conventional Arms Transfers to Developing Nations, 2008-2015
Congressional Research Service 38
Table 13. Arms Transfer Agreements with Developing Nations in 2015: Agreements
by Leading Recipients
(in millions of current U.S. dollars
Rank Recipient Agreements Value 2015
1 Qatar 17,500
2 Egypt 11,900
3 Saudi Arabia 8,600
4 South Korea 5,400
5 Pakistan 4,700
6 Israel 4,600
7 U.A.E. 4,100
8 Iraq 2,200
9 China 2,200
10 Algeria 2,100
Source: U.S. government.
Notes: All data are rounded to the nearest $100 million. Where rounded data totals are the same, the rank
order is maintained.

Conventional Arms Transfers to Developing Nations, 2007-2014
CRS-39
Table 14. Arms Deliveries to Developing Nations, by Supplier, 2008-2015
(in millions of current U.S. dollars)
2008 2009 2010 2011 2012 2013 2014 2015 2008-2015
United States 7,354 7,352 8,402 9,912 10,330 10,589 12,184 11,904 78,028
Russia 6,400 5,400 6,700 8,400 9,600 9,700 9,400 6,200 61,800
France 800 700 1,700 1,200 2,200 2,900 2,600 6,200 18,300
United Kingdom 1,300 1,200 1,600 1,500 1,100 1,600 2,600 200 11,100
China 2,200 1,800 3,200 1,700 2,100 2,600 1,900 2,900 18,400
Germany 1,400 1,900 1,400 1,200 800 400 1,600 1,100 9,800
Italy 200 600 1,200 1,300 1,400 800 600 1,500 7,600
All Other European 2,300 2,500 3,200 4,700 3,200 3,300 2,900 2,400 24,500
All Others 1,000 1,800 2,000 2,200 1,700 1,300 2,400 1,200 165,100
TOTAL 22,954 23,252 29,402 32,112 32,430 33,189 36,184 33,604 243,127
Source: U.S. government.
Note: Developing nations category excludes the United States, Europe, Canada, Japan, Australia, and New Zealand. All data are for the calendar year given except for U.S.
MAP (Military Assistance Program), IMET (International Military Education, and Training), and Excess Defense Article data, which are included for the particular fiscal year.
All amounts given include the values of all categories of weapons, spare parts, construction, all associated services, military assistance, excess defense articles, and training
programs. Statistics for foreign countries are based upon estimated selling prices. All foreign data are rounded to the nearest $100 million.

Conventional Arms Transfers to Developing Nations, 2007-2014
CRS-40
Table 15. Arms Deliveries to Developing Nations, by Supplier, 2008-2015
(in millions of constant 2015 U.S. dollars)
2008 2009 2010 2011 2012 2013 2014 2015 2008-2015
United States 8,304 8,190 9,142 10,573 10,841 10,927 12,393 11,904 82,273
Russia 7,227 6,015 7,290 8,960 10,075 10,009 9,562 6,200 65,337
France 903 780 1,850 1,280 2,309 2,992 2,645 6,200 18,959
United Kingdom 1,468 1,337 1,741 1,600 1,154 1,651 2,645 200 11,796
China 2,484 2,005 3,482 1,813 2,204 2,683 1,933 2,900 19,504
Germany 1,581 2,117 1,523 1,280 840 413 1,628 1,100 10,480
Italy 226 668 1,306 1,387 1,469 826 610 1,500 7,992
All Other European 2,597 2,785 3,482 5,013 3,358 3,405 2,950 2,400 25,990
All Others 1,129 2,005 2,176 2,347 1,784 1,341 2,441 1,200 14,424
TOTAL 25,919 25,902 31,990 34,253 34,033 34,247 36,806 33,604 256,754
Dollar Inflation index:
(2015=1)a 0.8856 0.8977 0.9191 0.9375 0.9529 0.9691 0.9831 1
Source: U.S. government.
a. Based on Department of Defense Price Deflator.

Conventional Arms Transfers to Developing Nations, 2007-2014
CRS-41
Table 16. Arms Deliveries to Developing Nations, by Supplier, 2008-2015
(expressed as a percent of total, by year)
2008 2009 2010 2011 2012 2013 2014 2015
United States 32.04% 31.62% 28.58% 30.87% 31.85% 31.91% 33.67% 35.42%
Russia 27.88% 23.22% 22.79% 26.16% 29.60% 29.23% 25.98% 18.45%
France 3.49% 3.01% 5.78% 3.74% 6.78% 8.74% 7.19% 18.45%
United Kingdom 5.66% 5.16% 5.44% 4.67% 3.39% 4.82% 7.19% 0.60%
China 9.58% 7.74% 10.88% 5.29% 6.48% 7.83% 5.25% 8.63%
Germany 6.10% 8.17% 4.76% 3.74% 2.47% 1.21% 4.42% 3.27%
Italy 0.87% 2.58% 4.08% 4.05% 4.32% 2.41% 1.66% 4.46%
All Other European 10.02% 10.75% 10.88% 14.64% 9.87% 9.94% 8.01% 7.14%
All Others 4.36% 7.74% 6.80% 6.85% 5.24% 3.92% 6.63% 3.57%
Major West Europeana 16.12% 18.92% 20.07% 16.19% 16.96% 17.17% 20.45% 26.78%
TOTAL 100.00% 100.00% 100.00% 100.00% 100.00% 100.00% 100.00% 100.00%
Source: U.S. government.
a. Major West European category includes France, United Kingdom, Germany, and Italy.

Conventional Arms Transfers to Developing Nations, 2007-2014
CRS-42
Table 17. Regional Arms Deliveries by Supplier, 2008-2015
(in millions of current U.S. dollars)
Asia Near East Latin America Africa
2008-2011 2012-2015 2008-2011 2012-2015 2008-2011 2012-2015 2008-2011 2012-2015
United States 9,377 11,981 20,847 30,549 1,446 1,472 1350 1006
Russia 13,800 17,200 8,600 11,700 3,300 5,500 1,200 500
France 1,700 4,100 1,900 8,600 500 1,000 300 200
United Kingdom 1,900 1,100 3,500 4,100 200 300 0 0
China 4,400 4,200 2,800 2,100 600 1,200 1,100 1,900
Germany 3,100 1,600 2,200 1,800 200 500 300 0
Italy 1,200 1,700 1,500 1,900 400 700 300 100
All Other European 4,400 4,600 3,100 4,300 2,800 1,300 2,400 1,500
All Others 4,200 4,200 700 1,700 1,500 800 500 700
Major West Europeana 7,900 8,500 9,100 16,400 1,300 2,500 900 300
TOTAL 44,077 50,681 45,147 66,749 10,946 12,772 7,450 5,906
Source: U.S. government.
Note: All foreign data are rounded to the nearest $100 million.
a. Major West European category includes France, United Kingdom, Germany, and Italy.

Conventional Arms Transfers to Developing Nations, 2007-2014
CRS-43
Table 18. Percentage of Supplier Deliveries Value by Region, 2008-2015
Asia Near East Latin America Africa TOTAL
2008-2011 2012-2015 2008-2011 2012-2015 2008-2011 2012-2015 2008-2011 2012-2015 2008-2011 2012-2015
United States 28.40% 26.62% 63.13% 67.87% 4.38% 3.27% 4.09% 2.24% 100.00% 100.00%
Russia 51.30% 49.28% 31.97% 33.52% 12.27% 15.76% 4.46% 1.43% 100.00% 100.00%
France 38.64% 29.50% 43.18% 61.87% 11.36% 7.19% 6.82% 1.44% 100.00% 100.00%
United Kingdom 33.93% 20.00% 62.50% 74.55% 3.57% 5.45% 0.00% 0.00% 100.00% 100.00%
China 49.44% 44.68% 31.46% 22.34% 6.74% 12.77% 12.36% 20.21% 100.00% 100.00%
Germany 53.45% 41.03% 37.93% 46.15% 3.45% 12.82% 5.17% 0.00% 100.00% 100.00%
Italy 35.29% 38.64% 44.12% 43.18% 11.76% 15.91% 8.82% 2.27% 100.00% 100.00%
All Other European 34.65% 39.32% 24.41% 36.75% 22.05% 11.11% 18.90% 12.82% 100.00% 100.00%
All Others 60.87% 56.76% 10.14% 22.97% 21.74% 10.81% 7.25% 9.46% 100.00% 100.00%
Major West Europeana 41.15% 30.69% 47.40% 59.21% 6.77% 9.03% 4.69% 1.08% 100.00% 100.00%
TOTAL 40.96% 37.24% 41.95% 49.04% 10.17% 9.38% 6.92% 4.34% 100.00% 100.00%
Source: U.S. government.
a. Major West European category includes France, United Kingdom, Germany, and Italy.

Conventional Arms Transfers to Developing Nations, 2007-2014
CRS-44
Table 19. Percentage of Total Deliveries Value by Supplier to Regions, 2008-2015
Asia Near East Latin America Africa
2008-2011 2012-2015 2008-2011 2012-2015 2008-2011 2012-2015 2008-2011 2012-2015
United States 21.27% 23.64% 46.18% 45.77% 13.21% 11.53% 18.12% 17.03%
Russia 31.31% 33.94% 19.05% 17.53% 30.15% 43.06% 16.11% 8.47%
France 3.86% 8.09% 4.21% 12.88% 4.57% 7.83% 4.03% 3.39%
United Kingdom 4.31% 2.17% 7.75% 6.14% 1.83% 2.35% 0.00% 0.00%
China 9.98% 8.29% 6.20% 3.15% 5.48% 9.40% 14.77% 32.17%
Germany 7.03% 3.16% 4.87% 2.70% 1.83% 3.91% 4.03% 0.00%
Italy 2.72% 3.35% 3.32% 2.85% 3.65% 5.48% 4.03% 1.69%
All Other European 9.98% 9.08% 6.87% 6.44% 25.58% 10.18% 32.21% 25.40%
All Others 9.53% 8.29% 1.55% 2.55% 13.70% 6.26% 6.71% 11.85%
Major West Europeana 17.92% 16.77% 20.16% 24.57% 11.88% 19.57% 12.08% 5.08%
TOTAL 100.00% 100.00% 100.00% 100.00% 100.00% 100.00% 100.00% 100.00%
Source: U.S. government.
a. Major West European category includes France, United Kingdom, Germany, and Italy.

Conventional Arms Transfers to Developing Nations, 2008-2015
Congressional Research Service 45
Table 20. Arms Deliveries to Developing Nations, 2008-2015 Leading Suppliers
Compared
(in millions of current U.S. dollars)
Rank Supplier Deliveries Value 2008-2011
1 United States 33,019
2 Russia 26,900
3 China 8,900
4 Germany 5,900
5 United Kingdom 5,600
6 France 4,400
7 Israel 4,000
8 Sweden 3,500
9 Italy 3,300
10 Spain 2,500
11 Ukraine 1,500
Rank Supplier Deliveries Value 2012-2015
1 United States 45,008
2 Russia 34,900
3 France 13,900
4 China 9,500
5 United Kingdom 5,500
6 Italy 4,300
7 Germany 3,900
8 Israel 2,100
9 Spain 2,000
10 Sweden 1,800
11 Switzerland 1,800
Rank Supplier Deliveries Value 2008-2015
1 United States 78,027
2 Russia 61,800
3 China 18,400
4 France 18,300
5 United Kingdom 11,100
6 Germany 9,800
7 Italy 7,600
8 Israel 6,100
9 Sweden 5,300
10 Spain 4,500
11 Ukraine 3,300
Source: U.S. government.
Notes: All foreign data are rounded to the nearest $100 million. Where rounded data totals are the same, the
rank order is maintained.

Conventional Arms Transfers to Developing Nations, 2008-2015
Congressional Research Service 46
Table 21. Arms Deliveries to Developing Nations in 2015: Leading Suppliers
Compared
(in millions of current U.S. dollars)
Rank Supplier Deliveries Value 2015
1 United States 11,903
2 Russia 6,200
3 France 6,200
4 China 2,900
5 Italy 1,500
6 Germany 1,100
7 Switzerland 700
8 Spain 400
9 Singapore 400
10 South Korea 300
11 Bulgaria 300
Source: U.S. government.
Notes: All foreign data are rounded to the nearest $100 million. Where rounded data totals are the same, the
rank order is maintained.

Conventional Arms Transfers to Developing Nations, 2008-2015
Congressional Research Service 47
Table 22. Arms Deliveries to Near East, by Supplier
(in millions of current U.S. dollars)
Recipient
Country U.S. Russia China
Major West
Europeana
All Other
European
All
Others Total
2008-2011
Algeria 0 4,700 500 300 0 0 5,500
Bahrain 400 0 0 0 0 0 400
Egypt 3,800 400 500 100 200 0 5,000
Iran 0 200 0 0 0 100 300
Iraq 2,600 300 0 300 300 200 3,700
Israel 3,800 200 0 0 0 0 4,000
Jordan 900 100 100 0 300 0 1,400
Kuwait 1,200 100 0 0 0 0 1,300
Lebanon 200 0 0 0 0 100 300
Libya 0 100 0 800 100 0 1,000
Morocco 900 0 500 300 400 0 2,100
Oman 200 0 0 700 0 0 500
Qatar 0 0 0 300 0 0 300
Saudi Arabia 5,800 0 700 5,600 900 0 13,000
Syria 0 2,000 400 0 100 200 2,700
Tunisia 0 0 0 0 0 0 0
U.A.E. 1,900 400 100 700 600 0 3,700
Yemen 0 100 0 0 200 100 400
Recipient
Country U.S. Russia China
Major West
Europeana
All Other
European
All
Others Total
2012-2015
Algeria 0 4,500 300 600 100 0 5,500
Bahrain 100 0 0 0 100 0 100
Egypt 4,800 1,300 600 2,900 200 0 9,800
Iran 0 100 0 0 0 0 100
Iraq 4,400 3,700 500 400 800 500 10,300
Israel 3,500 0 0 1,300 0 0 4,800
Jordan 1,100 100 0 0 100 200 1,500
Kuwait 1,500 300 100 0 0 0 1,900
Lebanon 300 0 0 0 0 0 300
Libya 0 0 0 0 100 100 200
Morocco 800 100 0 1,200 500 0 2,600
Oman 800 0 0 2,100 200 400 3,500
Qatar 100 0 0 900 700 0 1,700
Saudi Arabia 10,500 0 600 5,800 700 100 17,700
Syria 0 1,400 0 0 0 0 1,400
Tunisia 0 0 0 0 0 0 0
U.A.E. 3,000 200 0 1200 700 400 5,500
Yemen 0 0 0 100 0 100 200
Source: U.S. government.
Notes: 0=data less than $50 million or nil. All data are rounded to the nearest $100 million.
a. Major West European category includes France, United Kingdom, Germany, and Italy totals as an aggregate
figure.

Conventional Arms Transfers to Developing Nations, 2008-2015
Congressional Research Service 48
Table 23. Arms Deliveries to Developing Nations, 2008-2015: The Leading Recipients
(in millions of current U.S. dollars)
Rank Recipient Deliveries Value 2008-2011
1 Saudi Arabia 13,000
2 India 11,100
3 Pakistan 7,200
4 Algeria 5,500
5 Egypt 5,000
6 South Korea 4,500
7 China 4,100
8 Venezuela 4,100
9 Israel 4,000
10 U.A.E. 3,700
Rank Recipient Deliveries Value 2012-2015
1 Saudi Arabia 17,700
2 India 15,300
3 Iraq 10,300
4 Egypt 9,800
5 Venezuela 6,100
6 Algeria 5,500
7 U.A.E. 5,500
8 Israel 4,800
9 Taiwan 4,500
10 South Korea 4,400
Rank Recipient Deliveries Value 2008-2015
1 Saudi Arabia 30,700
2 India 26,400
3 Egypt 14,800
4 Iraq 14,000
5 Algeria 11,000
6 Venezuela 10,200
7 U.A.E. 9,200
8 South Korea 8,900
9 Israel 8,800
10 Taiwan 7,500
Source: U.S. government.
Notes: All data are rounded to the nearest $100 million. Where rounded data totals are the same, the rank
order is maintained.
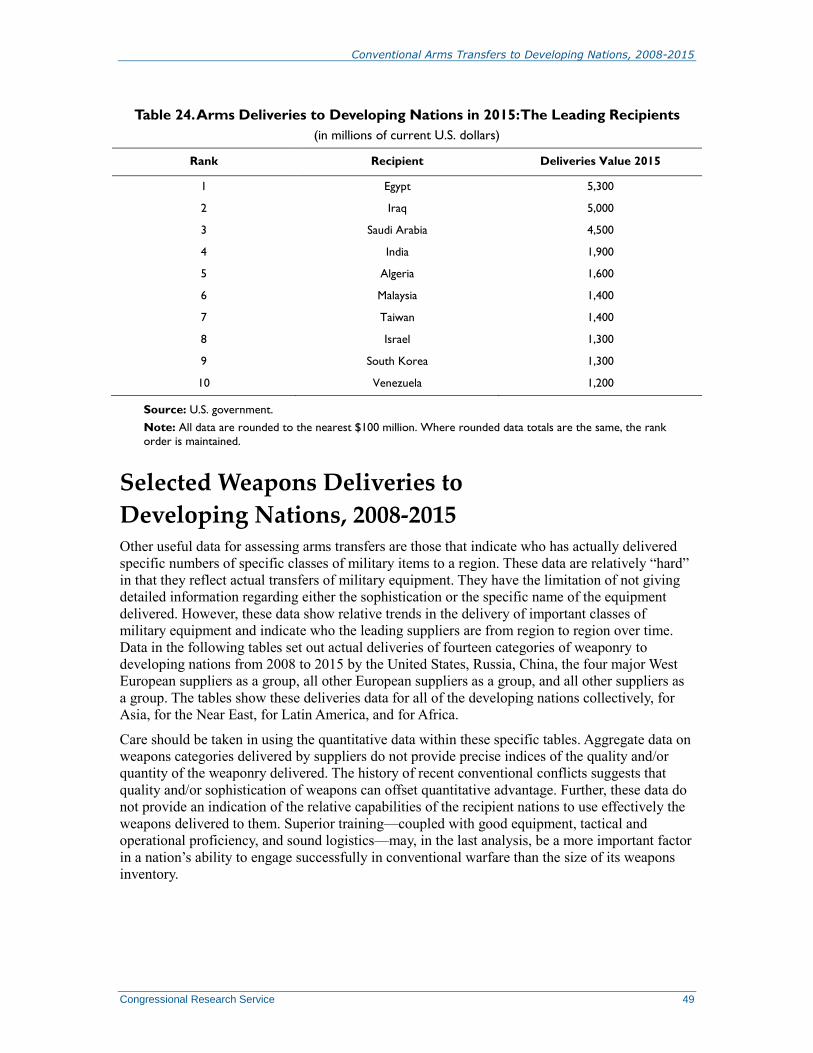
Conventional Arms Transfers to Developing Nations, 2008-2015
Congressional Research Service 49
Table 24. Arms Deliveries to Developing Nations in 2015: The Leading Recipients
(in millions of current U.S. dollars)
Rank Recipient Deliveries Value 2015
1 Egypt 5,300
2 Iraq 5,000
3 Saudi Arabia 4,500
4 India 1,900
5 Algeria 1,600
6 Malaysia 1,400
7 Taiwan 1,400
8 Israel 1,300
9 South Korea 1,300
10 Venezuela 1,200
Source: U.S. government.
Note: All data are rounded to the nearest $100 million. Where rounded data totals are the same, the rank
order is maintained.
Selected Weapons Deliveries to
Developing Nations, 2008-2015 Other useful data for assessing arms transfers are those that indicate who has actually delivered
specific numbers of specific classes of military items to a region. These data are relatively “hard”
in that they reflect actual transfers of military equipment. They have the limitation of not giving
detailed information regarding either the sophistication or the specific name of the equipment
delivered. However, these data show relative trends in the delivery of important classes of
military equipment and indicate who the leading suppliers are from region to region over time.
Data in the following tables set out actual deliveries of fourteen categories of weaponry to
developing nations from 2008 to 2015 by the United States, Russia, China, the four major West
European suppliers as a group, all other European suppliers as a group, and all other suppliers as
a group. The tables show these deliveries data for all of the developing nations collectively, for
Asia, for the Near East, for Latin America, and for Africa.
Care should be taken in using the quantitative data within these specific tables. Aggregate data on
weapons categories delivered by suppliers do not provide precise indices of the quality and/or
quantity of the weaponry delivered. The history of recent conventional conflicts suggests that
quality and/or sophistication of weapons can offset quantitative advantage. Further, these data do
not provide an indication of the relative capabilities of the recipient nations to use effectively the
weapons delivered to them. Superior training—coupled with good equipment, tactical and
operational proficiency, and sound logistics—may, in the last analysis, be a more important factor
in a nation’s ability to engage successfully in conventional warfare than the size of its weapons
inventory.

Conventional Arms Transfers to Developing Nations, 2008-2015
Congressional Research Service 50
Table 25. Numbers of Weapons Delivered by Suppliers to Developing Nations
Weapons Category U.S. Russia China
Major West
European* All Other European All Others
2008-2011
Tanks and Self-Propelled Guns 348 630 490 360 550 50
Artillery 155 110 340 140 600 190
APCs and Armored Cars 188 570 620 420 1,630 580
Major Surface Combatants 0 2 3 5 5 4
Minor Surface Combatants 0 8 113 64 52 118
Guided Missile Boats 0 2 0 0 0 4
Submarines 0 2 0 4 1 0
Supersonic Combat Aircraft 58 170 30 40 130 50
Subsonic Combat Aircraft 0 0 20 50 20 80
Other Aircraft 62 20 130 50 160 40
Helicopters 35 270 20 150 70 50
Surface-to-Air Missiles 1,088 8,160 2,080 360 650 500
Surface-to-Surface Missiles 1,285 70 0 0 0 10
Anti-Ship Missiles 133 260 80 80 10 50
2012-2015
Tanks and Self-Propelled Guns 76 430 130 80 390 10
Artillery 232 130 250 40 630 430
APCs and Armored Cars 1 680 760 960 920 460
Major Surface Combatants 0 3 6 13 2 4
Minor Surface Combatants 0 8 19 67 67 86
Guided Missile Boats 0 0 2 2 0 7
Submarines 0 4 0 8 0 2
Supersonic Combat Aircraft 45 100 20 20 20 40
Subsonic Combat Aircraft 0 0 0 20 10 30
Other Aircraft 35 20 50 130 260 50
Helicopters 2 280 40 140 30 50
Surface-to-Air Missiles 346 6,300 1,310 1,130 240 630
Surface-to-Surface Missiles 163 80 10 0 0 0
Anti-Ship Missiles 116 40 110 210 0 20
Source: U.S. government.
Note: Developing nations category excludes the United States, Russia, Europe, Canada, Japan, Australia, and
New Zealand. All data are for calendar years given. * Major West European includes France, United Kingdom,
Germany, and Italy totals as an aggregate figure. Data relating to surface-to-surface and anti-ship missiles by
foreign suppliers are estimates based on a variety of sources having a wide range of accuracy. As such, individual
data entries in these two weapons delivery categories are not necessarily definitive.

Conventional Arms Transfers to Developing Nations, 2008-2015
Congressional Research Service 51
Table 26. Number of Weapons Delivered by Suppliers to Asia and the Pacific
Weapons Category U.S. Russia China
Major West
European*
All Other
European All Others
2008-2011
Tanks and Self-Propelled Guns 0 390 230 100 40 10
Artillery 5 40 140 10 80 70
APCs and Armored Cars 25 310 130 0 610 100
Major Surface Combatants 0 2 3 2 3 2
Minor Surface Combatants 0 6 2 14 1 45
Guided Missile Boats 0 2 0 0 0 2
Submarines 0 0 0 3 1 0
Supersonic Combat Aircraft 18 130 10 10 10 0
Subsonic Combat Aircraft 0 0 10 50 0 20
Other Aircraft 14 0 60 30 50 20
Helicopters 2 110 10 30 20 20
Surface-to-Air Missiles 441 1,130 1,640 360 0 500
Surface-to-Surface Missiles 1,285 20 0 0 0 10
Anti-Ship Missiles 133 150 80 30 0 0
2012-2015
Tanks and Self-Propelled Guns 24 190 70 30 10 0
Artillery 96 10 70 20 100 30
APCs and Armored Cars 0 320 10 570 240 30
Major Surface Combatants 0 3 5 3 0 1
Minor Surface Combatants 0 8 2 13 0 36
Guided Missile Boats 0 0 2 0 0 0
Submarines 0 4 0 5 0 2
Supersonic Combat Aircraft 0 80 10 0 10 30
Subsonic Combat Aircraft 0 0 0 20 0 10
Other Aircraft 9 10 20 40 110 10
Helicopters 0 180 10 60 20 20
Surface-to-Air Missiles 110 160 430 210 130 0
Surface-to-Surface Missiles 149 20 0 0 0 0
Anti-Ship Missiles 94 40 110 40 0 0
Source: U.S. government.
Note: Developing nations category excludes the United States, Russia, Europe, Canada, Japan, Australia, and
New Zealand. All data are for calendar years given. * Major West European includes France, United Kingdom,
Germany, and Italy totals as an aggregate figure. Data relating to surface-to-surface and anti-ship missiles by
foreign suppliers are estimates based on a variety of sources having a wide range of accuracy. As such, individual
data entries in these two weapons delivery categories are not necessarily definitive.

Conventional Arms Transfers to Developing Nations, 2008-2015
Congressional Research Service 52
Table 27. Numbers of Weapons Delivered by Suppliers to Near East
Weapons Category U.S. Russia China
Major West
Europeana All Other European All Others
2008-2011
Tanks and Self-Propelled Guns 288 50 60 0 70 10
Artillery 149 0 120 100 340 50
APCs and Armored Cars 124 130 160 130 670 250
Major Surface Combatants 0 0 0 0 1 0
Minor Surface Combatants 0 2 0 32 23 17
Guided Missile Boats 0 0 0 0 0 0
Submarines 0 2 0 0 0 0
Supersonic Combat Aircraft 16 30 0 20 80 0
Subsonic Combat Aircraft 0 0 0 0 0 0
Other Aircraft 7 20 20 10 50 0
Helicopters 24 30 0 60 0 10
Surface-to-Air Missiles 647 3,830 330 0 150 0
Surface-to-Surface Missiles 4572 50 0 0 0 0
Anti-Ship Missiles 0 110 0 50 0 40
2012-2015
Tanks and Self-Propelled Guns 52 210 0 10 80 10
Artillery 136 40 60 0 170 280
APCs and Armored Cars 1 10 10 250 560 180
Major Surface Combatants 0 0 1 7 2 2
Minor Surface Combatants 0 0 0 18 32 0
Guided Missile Boats 0 0 0 0 0 0
Submarines 0 0 0 1 0 0
Supersonic Combat Aircraft 45 10 0 20 0 0
Subsonic Combat Aircraft 0 0 0 0 0 0
Other Aircraft 15 10 0 30 60 20
Helicopters 0 50 0 40 0 20
Surface-to-Air Missiles 236 3,880 390 920 20 270
Surface-to-Surface Missiles 14 60 0 0 0 0
Anti-Ship Missiles 20 0 0 170 0 0
Source: U.S. government.
Notes: Developing nations category excludes the United States, Russia, Europe, Canada, Japan, Australia, and
New Zealand. All data are for calendar years given. Data relating to surface-to-surface and anti-ship missiles by
foreign suppliers are estimates based on a variety of sources having a wide range of accuracy. As such, individual
data entries in these two weapons delivery categories are not necessarily definitive.
a. Major West European includes France, United Kingdom, Germany, and Italy totals as an aggregate figure.

Conventional Arms Transfers to Developing Nations, 2008-2015
Congressional Research Service 53
Table 28. Numbers of Weapons Delivered by Suppliers to Latin America
Weapons Category U.S. Russia China
Major West
Europeana All Other European All Others
2008-2011
Tanks and Self-Propelled Guns 0 110 0 260 0 0
Artillery 1 70 0 20 60 0
APCs and Armored Cars 39 60 20 160 230 50
Major Surface Combatants 0 0 0 3 0 2
Minor Surface Combatants 0 0 2 14 14 12
Guided Missile Boats 0 0 0 0 0 0
Submarines 0 0 0 0 0 0
Supersonic Combat Aircraft 0 10 0 10 20 30
Subsonic Combat Aircraft 0 0 0 0 0 60
Other Aircraft 41 0 30 0 40 10
Helicopters 9 60 0 30 10 10
Surface-to-Air Missiles 0 3,080 110 0 30 0
Surface-to-Surface Missiles 0 0 0 0 0 0
Anti-Ship Missiles 0 0 0 0 10 10
2012-2015
Tanks and Self-Propelled Guns 0 30 0 40 0 0
Artillery 0 80 40 10 70 0
APCs and Armored Cars 0 340 190 0 30 10
Major Surface Combatants 0 0 0 3 0 1
Minor Surface Combatants 0 0 1 13 8 11
Guided Missile Boats 0 0 0 0 0 0
Submarines 0 0 0 2 0 0
Supersonic Combat Aircraft 0 0 0 0 0 10
Subsonic Combat Aircraft 0 0 0 0 0 10
Other Aircraft 11 0 10 40 70 10
Helicopters 2 20 10 30 0 10
Surface-to-Air Missiles 0 2,260 0 0 30 0
Surface-to-Surface Missiles 0 0 0 0 0 0
Anti-Ship Missiles 2 0 0 0 0 20
Source: U.S. government.
Notes: Developing nations category excludes the United States, Russia, Europe, Canada, Japan, Australia, and
New Zealand. All data are for calendar years given. Data relating to surface-to-surface and anti-ship missiles by
foreign suppliers are estimates based on a variety of sources having a wide range of accuracy. As such, individual
data entries in these two weapons delivery categories are not necessarily definitive.
a. Major West European includes France, United Kingdom, Germany, and Italy totals as an aggregate figure.

Conventional Arms Transfers to Developing Nations, 2008-2015
Congressional Research Service 54
Table 29. Number of Weapons Delivered by Suppliers to Africa
Weapons Category U.S. Russia China
Major West
Europeana All Other European All Others
2008-2011
Tanks and Self-Propelled Guns 60 80 200 0 440 30
Artillery 0 0 80 10 120 70
APCs and Armored Cars 0 70 310 130 120 180
Major Surface Combatants 0 0 0 0 1 0
Minor Surface Combatants 0 0 109 4 14 44
Guided Missile Boats 0 0 0 0 0 2
Submarines 0 0 0 1 0 0
Supersonic Combat Aircraft 24 0 20 0 20 20
Subsonic Combat Aircraft 0 0 10 0 20 0
Other Aircraft 0 0 20 10 20 10
Helicopters 0 70 10 30 40 10
Surface-to-Air Missiles 0 120 0 0 470 0
Surface-to-Surface Missiles 0 0 0 0 0 0
Anti-Ship Missiles 0 0 0 0 0 0
2012-2015
Tanks and Self-Propelled Guns 0 0 60 0 300 0
Artillery 0 0 80 10 290 120
APCs and Armored Cars 0 10 550 140 90 240
Major Surface Combatants 0 0 0 0 0 0
Minor Surface Combatants 0 0 16 23 27 39
Guided Missile Boats 0 0 0 2 0 7
Submarines 0 0 0 0 0 0
Supersonic Combat Aircraft 0 10 10 0 10 0
Subsonic Combat Aircraft 0 0 0 0 10 10
Other Aircraft 0 0 20 20 20 10
Helicopters 0 30 20 10 10 0
Surface-to-Air Missiles 0 0 490 0 60 360
Surface-to-Surface Missiles 0 0 10 0 0 0
Anti-Ship Missiles 0 0 0 0 0 0
Source: U.S. government.
Note: Developing nations category excludes the United States, Russia, Europe, Canada, Japan, Australia, and
New Zealand. All data are for calendar years given. Data relating to surface-to-surface and anti-ship missiles by
foreign suppliers are estimates based on a variety of sources having a wide range of accuracy. As such, individual
data entries in these two weapons delivery categories are not necessarily definitive.
a. Major West European includes France, United Kingdom, Germany, and Italy totals as an aggregate figure.

Conventional Arms Transfers to Developing Nations, 2008-2015
Congressional Research Service 55
Worldwide Arms Transfer Agreements and
Deliveries Values, 2008-2015 Ten tables follow. Table 30, Table 31, Table 32, Table 35, Table 36, and Table 37 provide the
total dollar values for arms transfer agreements and arms deliveries worldwide for the years 2008-
2015. These tables use the same format and detail as Table 3, Table 4, Table 5, Table 14, Table
15, and Table 16, which provide the total dollar values for arms transfer agreements with and
arms deliveries to developing nations. Table 33, Table 34, Table 38, and Table 39 provide a list
of the top 11 arms suppliers to the world based on the total values (in current dollars) of their
arms transfer agreements and arms deliveries worldwide during calendar years 2008-2011, 2012-
2015, and 2011. These tables are set out in the same format and detail as Table 9 and Table 10
for arms transfer agreements with, and Table 21 for arms deliveries to developing nations,
respectively.
Total Worldwide Arms Transfer Agreements Values, 2008-2015.
Table 30 shows the annual current dollar values of arms transfer agreements worldwide. Since
these figures do not allow for the effects of inflation, they are, by themselves, of limited use. They
provide, however, the data from which Table 31 (constant dollars) and Based on Department of
Defense Price Deflator.
Table 32 (supplier percentages) are derived from data in Table 31.
Total Worldwide Delivery Values 2008-2015.
Table 35 shows the annual current dollar values of arms deliveries (items actually transferred)
worldwide by major suppliers from 2008-2015. The utility of these data is that they reflect
transfers that have occurred. They provide the data from which Table 36 (constant dollars) and
Based on Department of Defense Price Deflator.
Table 37 (supplier percentages) are derived from data in Table 36.
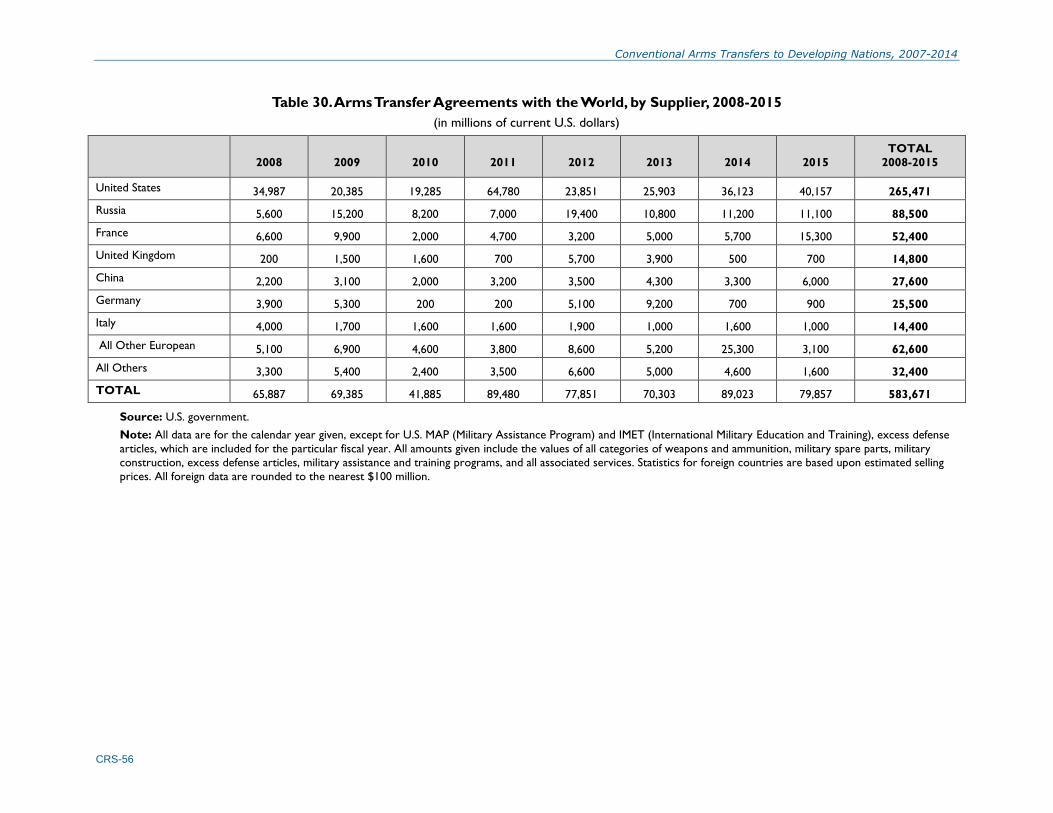
Conventional Arms Transfers to Developing Nations, 2007-2014
CRS-56
Table 30. Arms Transfer Agreements with the World, by Supplier, 2008-2015
(in millions of current U.S. dollars)
2008 2009 2010 2011 2012 2013 2014 2015
TOTAL
2008-2015
United States 34,987 20,385 19,285 64,780 23,851 25,903 36,123 40,157 265,471
Russia 5,600 15,200 8,200 7,000 19,400 10,800 11,200 11,100 88,500
France 6,600 9,900 2,000 4,700 3,200 5,000 5,700 15,300 52,400
United Kingdom 200 1,500 1,600 700 5,700 3,900 500 700 14,800
China 2,200 3,100 2,000 3,200 3,500 4,300 3,300 6,000 27,600
Germany 3,900 5,300 200 200 5,100 9,200 700 900 25,500
Italy 4,000 1,700 1,600 1,600 1,900 1,000 1,600 1,000 14,400
All Other European 5,100 6,900 4,600 3,800 8,600 5,200 25,300 3,100 62,600
All Others 3,300 5,400 2,400 3,500 6,600 5,000 4,600 1,600 32,400
TOTAL 65,887 69,385 41,885 89,480 77,851 70,303 89,023 79,857 583,671
Source: U.S. government.
Note: All data are for the calendar year given, except for U.S. MAP (Military Assistance Program) and IMET (International Military Education and Training), excess defense
articles, which are included for the particular fiscal year. All amounts given include the values of all categories of weapons and ammunition, military spare parts, military
construction, excess defense articles, military assistance and training programs, and all associated services. Statistics for foreign countries are based upon estimated selling
prices. All foreign data are rounded to the nearest $100 million.

Conventional Arms Transfers to Developing Nations, 2007-2014
CRS-57
Table 31. Arms Transfer Agreements with the World, by Supplier, 2008-2015
(in millions of constant 2015 U.S. dollars)
2008 2009 2010 2011 2012 2013 2014 2015
TOTAL
2008-2015
United States 39,507 22,708 20,982 69,099 25,030 26,729 36,744 40,157 280,956
Russia 6,323 16,932 8,922 7,467 20,359 11,144 11,393 11,100 93,640
France 7,453 11,028 2,176 5,013 3,358 5,159 5,798 15,300 55,286
United Kingdom 226 1,671 1,741 747 5,982 4,024 509 700 15,599
China 2,484 3,453 2,176 3,413 3,673 4,437 3,357 6,000 28,994
Germany 4,404 5,904 218 213 5,352 9,493 712 900 27,196
Italy 4,517 1,894 1,741 1,707 1,994 1,032 1,628 1,000 15,511
All Other European 5,759 7,686 5,005 4,053 9,025 5,366 25,753 3,100 55,557
All Others 3,726 6,015 2,611 3,733 6,926 5,159 4,679 1,600 34,451
TOTAL 74,398 77,292 45,572 95,445 81,699 72,545 90,553 79,857 607,189
Dollar inflation
index:(2015=1)a 0.8856 0.8977 0.9191 0.9375 0.9529 0.9691 0.9831 1
Source: U.S. government.
a. Based on Department of Defense Price Deflator.

Conventional Arms Transfers to Developing Nations, 2007-2014
CRS-58
Table 32. Arms Transfer Agreements with the World, by Supplier, 2008-2015
(expressed as a percentage of total, by year)
2008 2009 2010 2011 2012 2013 2014 2015
United States 53.10% 29.38% 46.04% 72.40% 30.64% 36.84% 40.58% 50.29%
Russia 8.50% 21.91% 19.58% 7.82% 24.92% 15.36% 12.58% 13.90%
France 10.02% 14.27% 4.77% 5.25% 4.11% 7.11% 6.40% 19.16%
United Kingdom 0.30% 2.16% 3.82% 0.78% 7.32% 5.55% 0.56% 0.88%
China 3.34% 4.47% 4.77% 3.58% 4.50% 6.12% 3.71% 7.51%
Germany 5.92% 7.64% 0.48% 0.22% 6.55% 13.09% 0.79% 1.13%
Italy 6.07% 2.45% 3.82% 1.79% 2.44% 1.42% 1.80% 1.25%
All Other European 7.74% 9.94% 10.98% 4.25% 11.05% 7.40% 28.42% 3.88%
All Others 5.01% 7.78% 5.73% 3.91% 8.48% 7.11% 5.17% 2.00%
Major West Europeana 22.31% 26.52% 12.89% 8.05% 20.42% 27.17% 9.55% 22.42%
TOTAL 100.00% 100.00% 100.00% 100.00% 100.00% 100.00% 100.00% 100.00%
Source: U.S. government.
Note: Columns may not total due to rounding.
a. Major West European category includes France, United Kingdom, Germany, and Italy.

Conventional Arms Transfers to Developing Nations, 2008-2015
Congressional Research Service 59
Table 33. Arms Transfer Agreements with the World, 2008-2015: Leading Suppliers
Compared
(in millions of current U.S. dollars)
Rank Supplier Agreements Value 2008-2011
1 United States 139,437
2 Russia 36,000
3 France 23,200
4 China 10,500
5 Germany 9,600
6 Italy 8,900
7 Israel 7,200
8 United Kingdom 4,000
9 Sweden 3,600
10 Ukraine 3,200
11 Spain 2,500
Rank Supplier Agreements Value 2012-2015
1 United States 126,034
2 Russia 52,500
3 France 29,200
4 China 17,100
5 Germany 15,900
6 Canada 14,500
7 United Kingdom 10,800
8 Sweden 10,600
9 Israel 5,600
10 Italy 5,500
11 South Korea 5,500
Rank Supplier Agreements Value 2008-2015
1 United States 265,471
2 Russia 88,500
3 France 52,400
4 China 27,600
5 Germany 25,500
6 Canada 15,200
7 United Kingdom 14,800
8 Italy 14,400
9 Sweden 14,200
10 Israel 12,800
11 South Korea 7,800
Source: U.S. government.
Notes: All foreign data are rounded to the nearest $100 million. Where rounded data totals are the same, the rank
order is maintained.
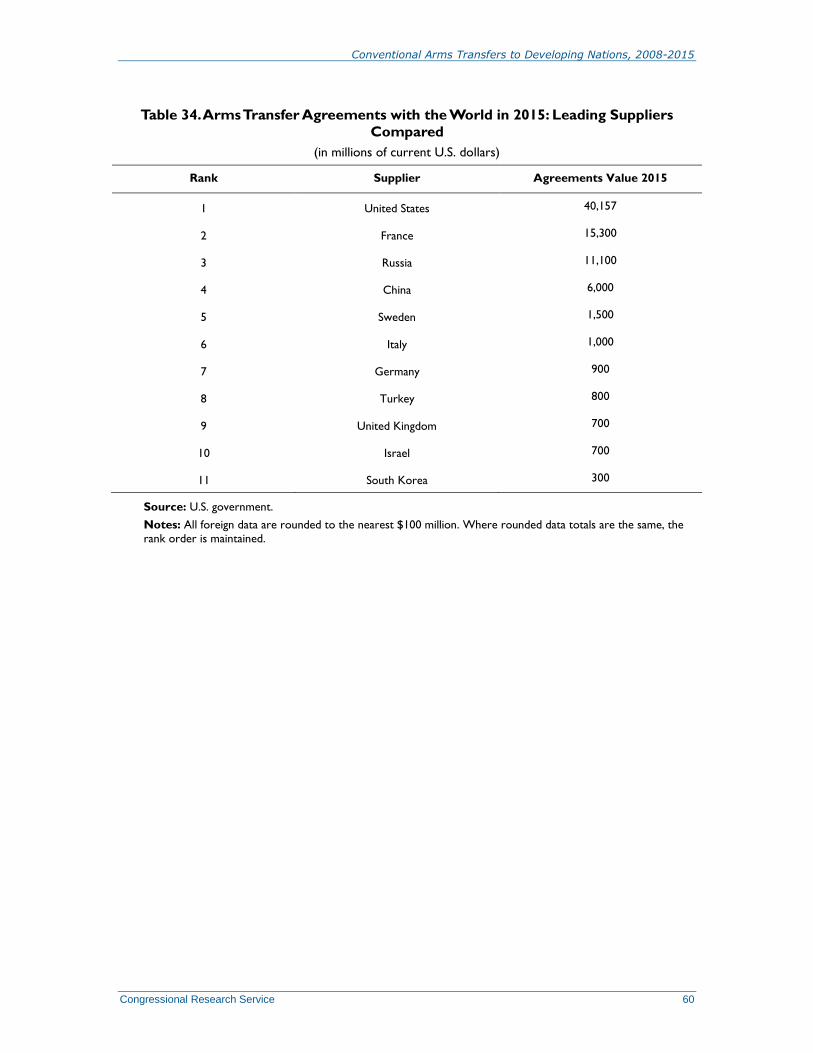
Conventional Arms Transfers to Developing Nations, 2008-2015
Congressional Research Service 60
Table 34. Arms Transfer Agreements with the World in 2015: Leading Suppliers
Compared
(in millions of current U.S. dollars)
Rank Supplier Agreements Value 2015
1 United States 40,157
2 France 15,300
3 Russia 11,100
4 China 6,000
5 Sweden 1,500
6 Italy 1,000
7 Germany 900
8 Turkey 800
9 United Kingdom 700
10 Israel 700
11 South Korea 300
Source: U.S. government.
Notes: All foreign data are rounded to the nearest $100 million. Where rounded data totals are the same, the
rank order is maintained.

Conventional Arms Transfers to Developing Nations, 2007-2014
CRS-61
Table 35. Arms Deliveries to the World, by Supplier, 2008-2015
(in millions of current U.S. dollars)
2008 2009 2010 2011 2012 2013 2014 2015
TOTAL
2008-2015
United States 11,927 13,938 11,901 14,869 14,921 15,135 17,653 16,931 117,275
Russia 6,500 5,500 7,200 9,200 10,300 10,500 10,100 7,200 66,500
France 1,400 1,500 2,800 3,200 3,800 4,100 5,500 7,000 29,300
United Kingdom 2,500 2,600 3,000 3200 2,600 3,000 4,000 1,300 22,200
China 2,200 1,800 3,200 1,700 2,100 2,600 2,000 2,900 18,500
Germany 4,200 4,300 4,200 2,500 1,700 1,300 2,200 1,600 22,000
Italy 11,000 1,100 1,900 2,300 2,100 1,700 1,200 1,800 23,100
All Other European 5,600 6,200 6,000 7,900 8,600 5,900 6,600 4,400 51,200
All Others 3,500 5,200 5,700 5,100 4,900 3,800 4,900 3,100 36,200
TOTAL 48,827 42,138 45,901 49,969 51,021 48,035 54,153 46,231 386,275
Source: U.S. government.
Note: All data are for the calendar year given, except for U.S. MAP (Military Assistance Program) and IMET (International Military Education and Training), excess defense
articles, which are included for the particular fiscal year. All amounts given include the values of all categories of weapons and ammunition, military spare parts, military
construction, excess defense articles, military assistance and training programs, and all associated services. Statistics for foreign countries are based upon estimated selling
prices. All foreign data are rounded to the nearest $100 million.

Conventional Arms Transfers to Developing Nations, 2007-2014
CRS-62
Table 36. Arms Deliveries to the World, by Supplier, 2008-2015
(in millions of constant 2015 U.S. dollars)
2008 2009 2010 2011 2012 2013 2014 2015
TOTAL
2008-2015
United States 13,468 15,526 12,949 15,860 15,659 15,618 17,956 16,931 123,966
Russia 7,340 6,127 7,834 9,813 10,809 10,835 10,274 7,200 70,231
France 1,581 1,671 3,046 3,413 3,988 4,231 5,595 7,000 30,525
United Kingdom 2,823 2,896 3,264 3,413 2,729 3,096 4,069 1,300 23,590
China 2,484 2,005 3,482 1,813 2,204 2,683 2,034 2,900 19,605
Germany 4,743 4,790 4,570 2,667 1,784 1,341 2,238 1,600 23,732
Italy 12,421 1,225 2,067 2,453 2,204 1,754 1,221 1,800 25,146
All Other European 6,323 6,907 6,528 8,427 9,025 6,088 6,713 4,400 54,411
All Others 3,952 5,793 6,202 5,440 5,142 3,921 4,984 3,100 38,534
TOTAL 55,134 46,940 49,941 53,300 53,543 49,567 55,084 46,231 409,740
Dollar inflation
index:(2015=1)a 0.8856 0.8977 0.9191 0.9375 0.9529 0.9691 0.9831 1
Source: U.S. government.
a. Based on Department of Defense Price Deflator.

Conventional Arms Transfers to Developing Nations, 2007-2014
CRS-63
Table 37. Arms Deliveries to the World, by Supplier 2008-2015
(expressed as a percentage of total, by year)
2008 2009 2010 2011 2012 2013 2014 2015
United States 24.43% 33.08% 25.93% 29.76% 29.24% 31.51% 32.60% 36.62%
Russia 13.31% 13.05% 15.69% 18.41% 20.19% 21.86% 18.65% 15.57%
France 2.87% 3.56% 6.10% 6.40% 7.45% 8.54% 10.16% 15.14%
United Kingdom 5.12% 6.17% 6.54% 6.40% 5.10% 6.25% 7.39% 2.81%
China 4.51% 4.27% 6.97% 3.40% 4.12% 5.41% 3.69% 6.27%
Germany 8.60% 10.20% 9.15% 5.00% 3.33% 2.71% 4.06% 3.46%
Italy 22.53% 2.61% 4.14% 4.60% 4.12% 3.54% 2.22% 3.89%
All Other European 11.47% 14.71% 13.07% 15.81% 16.86% 12.28% 12.19% 9.52%
All Others 7.17% 12.34% 12.42% 10.21% 9.60% 7.91% 9.05% 6.71%
Major West Europeana 39.12% 22.54% 25.93% 22.41% 19.99% 21.03% 23.82% 25.31%
TOTAL 100.00% 100.00% 100.00% 100.00% 100.00% 100.00% 100.00% 100.00%
Source: U.S. government.
a. Major West European category includes France, United Kingdom, Germany, and Italy.

Conventional Arms Transfers to Developing Nations, 2008-2015
Congressional Research Service 64
Table 38. Arms Deliveries to the World, 2008-2015: Leading Suppliers Compared
(in millions of current U.S. dollars)
Rank Supplier Deliveries Value 2008-2011
1 United States 52,635
2 Russia 28,400
3 Germany 15,200
4 United Kingdom 11,300
5 China 8,900
6 France 8,900
7 Israel 6,500
8 Sweden 6,400
9 Italy 6,400
10 Spain 4,500
11 Netherlands 2,200
Rank Supplier Deliveries Value 2012-2015
1 United States 64,640
2 Russia 38,100
3 France 20,400
4 China 9,600
5 United Kingdom 10,900
6 Italy 6,800
7 Germany 6,800
8 Spain 5,200
9 Israel 3,700
10 Sweden 3,100
11 Switzerland 2,300
Rank Supplier Deliveries Value 2008-2015
1 United States 117,275
2 Russia 66,500
3 France 29,300
4 United Kingdom 22,200
5 Germany 22,000
6 China 18,500
7 Italy 13,200
8 Israel 10,200
9 Spain 9,700
10 Sweden 9,500
11 Switzerland 4,200
Source: U.S. government.
Notes: All foreign data are rounded to the nearest $100 million. Where rounded data totals are the same, the
rank order is maintained.
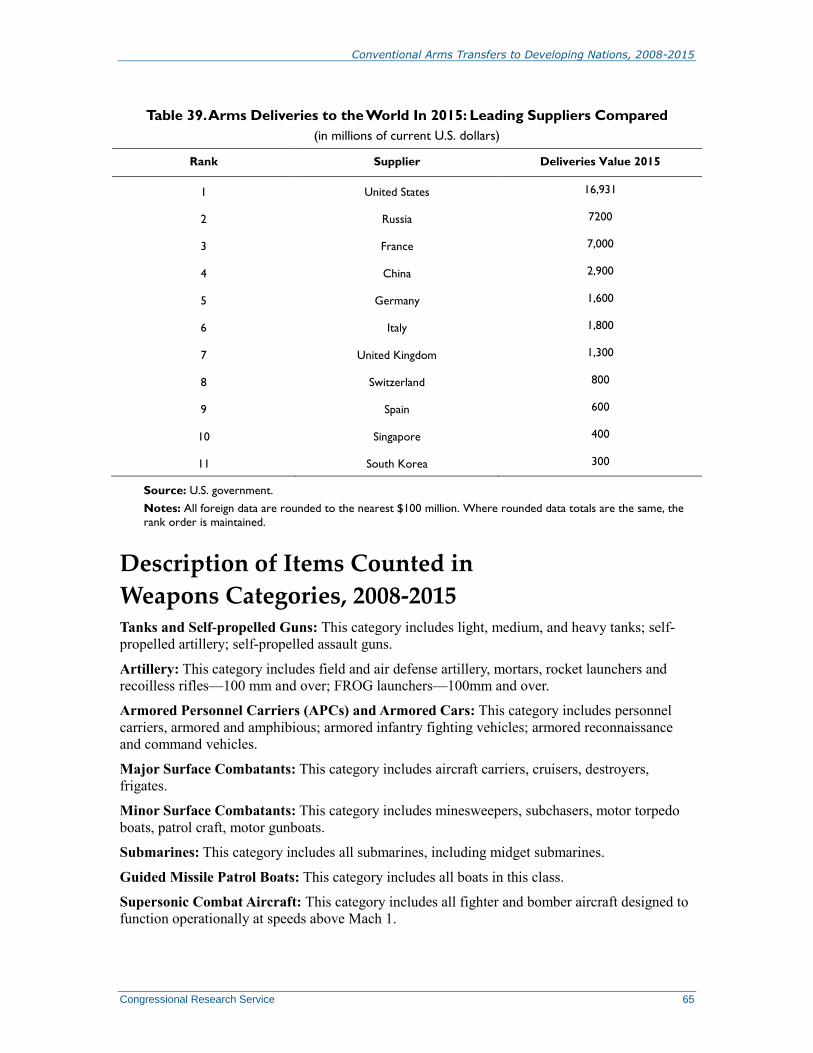
Conventional Arms Transfers to Developing Nations, 2008-2015
Congressional Research Service 65
Table 39. Arms Deliveries to the World In 2015: Leading Suppliers Compared
(in millions of current U.S. dollars)
Rank Supplier Deliveries Value 2015
1 United States 16,931
2 Russia 7200
3 France 7,000
4 China 2,900
5 Germany 1,600
6 Italy 1,800
7 United Kingdom 1,300
8 Switzerland 800
9 Spain 600
10 Singapore 400
11 South Korea 300
Source: U.S. government.
Notes: All foreign data are rounded to the nearest $100 million. Where rounded data totals are the same, the
rank order is maintained.
Description of Items Counted in
Weapons Categories, 2008-2015 Tanks and Self-propelled Guns: This category includes light, medium, and heavy tanks; self-
propelled artillery; self-propelled assault guns.
Artillery: This category includes field and air defense artillery, mortars, rocket launchers and
recoilless rifles—100 mm and over; FROG launchers—100mm and over.
Armored Personnel Carriers (APCs) and Armored Cars: This category includes personnel
carriers, armored and amphibious; armored infantry fighting vehicles; armored reconnaissance
and command vehicles.
Major Surface Combatants: This category includes aircraft carriers, cruisers, destroyers,
frigates.
Minor Surface Combatants: This category includes minesweepers, subchasers, motor torpedo
boats, patrol craft, motor gunboats.
Submarines: This category includes all submarines, including midget submarines.
Guided Missile Patrol Boats: This category includes all boats in this class.
Supersonic Combat Aircraft: This category includes all fighter and bomber aircraft designed to
function operationally at speeds above Mach 1.
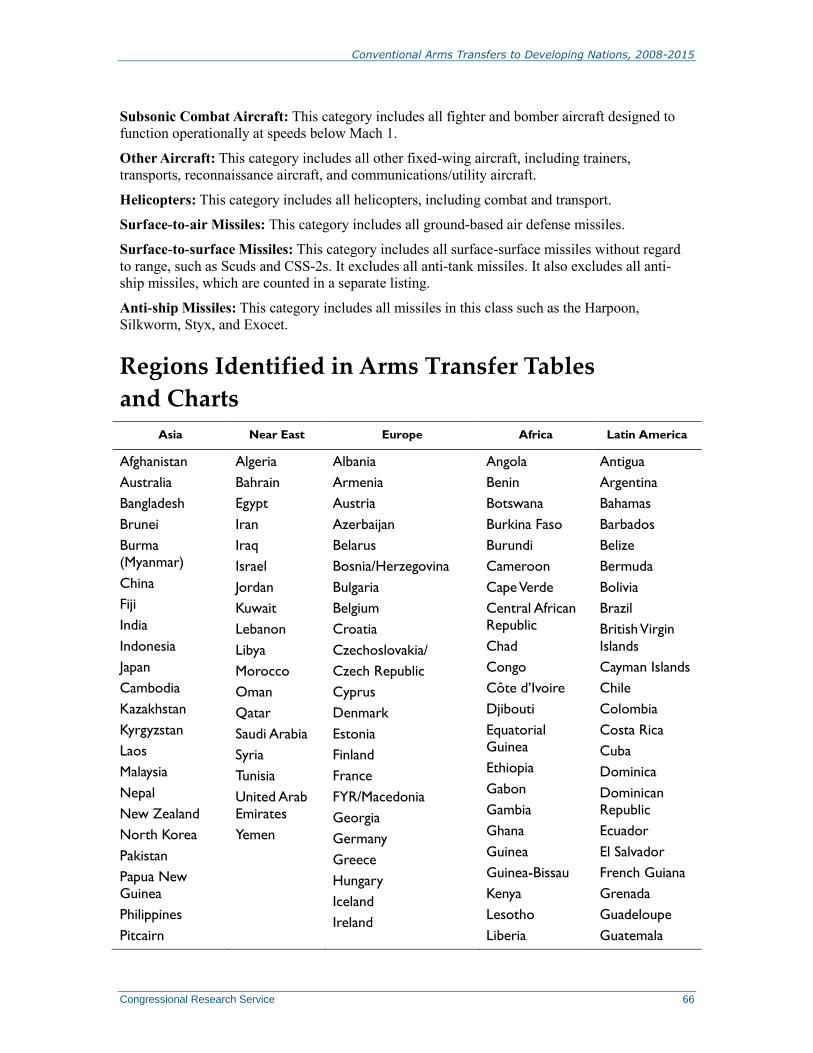
Conventional Arms Transfers to Developing Nations, 2008-2015
Congressional Research Service 66
Subsonic Combat Aircraft: This category includes all fighter and bomber aircraft designed to
function operationally at speeds below Mach 1.
Other Aircraft: This category includes all other fixed-wing aircraft, including trainers,
transports, reconnaissance aircraft, and communications/utility aircraft.
Helicopters: This category includes all helicopters, including combat and transport.
Surface-to-air Missiles: This category includes all ground-based air defense missiles.
Surface-to-surface Missiles: This category includes all surface-surface missiles without regard
to range, such as Scuds and CSS-2s. It excludes all anti-tank missiles. It also excludes all anti-
ship missiles, which are counted in a separate listing.
Anti-ship Missiles: This category includes all missiles in this class such as the Harpoon,
Silkworm, Styx, and Exocet.
Regions Identified in Arms Transfer Tables
and Charts
Asia Near East Europe Africa Latin America
Afghanistan
Australia
Bangladesh
Brunei
Burma
(Myanmar)
China
Fiji
India
Indonesia
Japan
Cambodia
Kazakhstan
Kyrgyzstan
Laos
Malaysia
Nepal
New Zealand
North Korea
Pakistan
Papua New
Guinea
Philippines
Pitcairn
Algeria
Bahrain
Egypt
Iran
Iraq
Israel
Jordan
Kuwait
Lebanon
Libya
Morocco
Oman
Qatar
Saudi Arabia
Syria
Tunisia
United Arab
Emirates
Yemen
Albania
Armenia
Austria
Azerbaijan
Belarus
Bosnia/Herzegovina
Bulgaria
Belgium
Croatia
Czechoslovakia/
Czech Republic
Cyprus
Denmark
Estonia
Finland
France
FYR/Macedonia
Georgia
Germany
Greece
Hungary
Iceland
Ireland
Angola
Benin
Botswana
Burkina Faso
Burundi
Cameroon
Cape Verde
Central African
Republic
Chad
Congo
Côte d’Ivoire
Djibouti
Equatorial
Guinea
Ethiopia
Gabon
Gambia
Ghana
Guinea
Guinea-Bissau
Kenya
Lesotho
Liberia
Antigua
Argentina
Bahamas
Barbados
Belize
Bermuda
Bolivia
Brazil
British Virgin
Islands
Cayman Islands
Chile
Colombia
Costa Rica
Cuba
Dominica
Dominican
Republic
Ecuador
El Salvador
French Guiana
Grenada
Guadeloupe
Guatemala

Conventional Arms Transfers to Developing Nations, 2008-2015
Congressional Research Service 67
Asia Near East Europe Africa Latin America
Singapore
South Korea
Sri Lanka
Taiwan
Tajikistan
Thailand
Turkmenistan
Uzbekistan
Vietnam
Italy
Latvia
Liechtenstein
Lithuania
Luxembourg
Malta
Moldova
Netherlands
Norway
Poland
Portugal
Romania
Russia
Slovak Republic
Slovenia
Spain
Sweden
Switzerland
Turkey
Ukraine
United Kingdom
Yugoslavia/Serbia/Mont
enegro
Madagascar
Malawi
Mali
Mauritania
Mauritius
Mozambique
Namibia
Niger
Nigeria
Réunion
Rwanda
Senegal
Seychelles
Sierra Leone
Somalia
South Africa
Sudan
Swaziland
Tanzania
Togo
Uganda
Zaire
Zambia
Zimbabwe
Guyana
Haiti
Honduras
Jamaica
Martinique
Mexico
Montserrat
Netherlands
Antilles
Nicaragua
Panama
Paraguay
Peru
St. Kitts &
Nevis
St. Lucia
St. Pierre &
Miquelon
St. Vincent
Suriname
Trinidad
Turks & Caicos
Venezuela
Author Contact Information
Catherine A. Theohary
Specialist in National Security Policy and
Information Operations
[email protected], 7-0844