Conventional and High-Strength Hooked Bars—Part 2: Data ...
48
267 ACI Structural Journal/January-February 2017 ACI STRUCTURAL JOURNAL TECHNICAL PAPER Empirical equations are developed to characterize the anchorage strength of hooked bars. The equations are based on tests of 245 simulated beam-column joint specimens with two hooked bars: 146 with confining reinforcement and 99 without. Bar stresses at failure for specimens used in the analysis ranged from 30,800 to 144,100 psi (212 to 994 MPa), and concrete compressive strengths ranged from 2570 to 16,200 psi (17.7 to 112 MPa). For the spec- imens analyzed, hooked bar anchorage strength was propor- tional to concrete compressive strength raised to the 0.29 power. For confining reinforcement parallel to and located within eight or 10 bar diameters of the straight portion of the hooked bar, the contribution to anchorage strength was proportional to the area of confining reinforcement; for confining reinforcement perpendic- ular to the straight portion of the bar, more legs of the confining reinforcement contributed to anchor strength, but each leg made a smaller contribution. Keywords: anchorage; beam-column joints; bond and development; high- strength concrete; high-strength steel; hooks; reinforcement. INTRODUCTION Since the early 1900s, many studies have investigated the development and splice strength of straight deformed bars for a wide range of material properties (Abrams [1913]; Lutz and Gergely [1967]; Azizinamini et al. [1993]; Darwin and Graham [1993]; Darwin et al. [1996]; Zuo and Darwin [2000], among others). The large number of physical tests performed in these studies provided a solid basis for devel- oping equations that accurately characterize bond strength for reinforcing steel with yield strengths up to 120,000 psi (827 MPa) and concrete compressive strengths up to 16,000 psi (110 MPa) (Darwin et al. 1996; Zuo and Darwin 2000; ACI Committee 408 2003; Darwin et al. 2005; Seliem et al. 2009). Similar equations, however, have not been formulated for hooked bars. Therefore, when describing the strength or behavior of hooked bars, researchers typi- cally compare test results with strengths calculated using the provisions for hooked bar development length ℓ dh in the ACI 318 Building Code (ACI Committee 318 2014). The main drawback of these provisions is that they were devel- oped based on a very small data set that does not include high-strength steel or high-strength concrete (Minor and Jirsa 1975; Marques and Jirsa 1975; and Pinc et al. 1977). Furthermore, the ACI 318 hooked bar development length equation is not meant to characterize the behavior of hooked bars, but rather to provide a safe estimate of development length for design. Thus, the anchorage strength of hooked bars, particularly in structural elements with high-strength materials, cannot be accurately calculated using the devel- opment length equation of ACI 318-14, as demonstrated by Sperry et al. (2015a,b; 2017). The goal of this study is to develop an expression that characterizes the anchorage strength of hooked bars and is applicable to the entire range of concrete and steel strengths currently available in construction practice. The equation for hooked bar development length in tension ℓ dh in ACI 318-14 is dh y e c r c b f f d = ′ ψψψ λ 50 (in.-lb) (1a) dh y e c r c b f f d = ′ 0 24 . ψψψ λ (SI) (1b) where ℓ dh is measured from the outside end of the hook at the point of tangency, toward the critical section (in. or mm); f y is the yield strength of the hooked bar (psi or MPa); d b is the nominal diameter of the hooked bar (in. or mm); λ is the modification factor that reflects the reduced mechan- ical properties of lightweight concrete compared to normal- weight concrete with the same compressive strength; and f c ′ is the specified concrete compressive strength (psi or MPa). Equation (1) also includes three modification factors ψ that account for bar coating ψ e , concrete cover ψ c , and confining reinforcement in the hook region ψ r . The stress corresponding to the anchorage capacity of an uncoated hooked bar cast in normalweight concrete, desig- nated f s,ACI , can be obtained from Eq. (1) by substituting f s,ACI for f y , the measured embedment length ℓ eh for ℓ dh , the measured concrete compressive strength f cm for f c ′, and setting ψ e and λ equal to 1.0. f f d s eh cm c r b , ACI = 50 ψψ (in.-lb) (2a) f f d s eh cm c r b , ACI = 0.24ψψ (SI) (2b) Title No. 114-S23 Conventional and High-Strength Hooked Bars— Part 2: Data Analysis by J. Sperry, D. Darwin, M. O’Reilly, R. D. Lequesne, S. Yasso, A. Matamoros, L. R. Feldman, and A. Lepage ACI Structural Journal, V. 114, No. 1, January-February 2017. MS No. S-2016-126, doi: 10.14359/51689457, was received March 24, 2016, and reviewed under Institute publication policies. Copyright © 2017, American Concrete Institute. All rights reserved, including the making of copies unless permission is obtained from the copyright proprietors. Pertinent discussion including author’s closure, if any, will be published ten months from this journal’s date if the discussion is received within four months of the paper’s print publication.
Transcript of Conventional and High-Strength Hooked Bars—Part 2: Data ...

267ACI Structural Journal/January-February 2017
ACI STRUCTURAL JOURNAL TECHNICAL PAPER
Empirical equations are developed to characterize the anchorage strength of hooked bars. The equations are based on tests of 245 simulated beam-column joint specimens with two hooked bars: 146 with confining reinforcement and 99 without. Bar stresses at failure for specimens used in the analysis ranged from 30,800 to 144,100 psi (212 to 994 MPa), and concrete compressive strengths ranged from 2570 to 16,200 psi (17.7 to 112 MPa). For the spec-imens analyzed, hooked bar anchorage strength was propor-tional to concrete compressive strength raised to the 0.29 power. For confining reinforcement parallel to and located within eight or 10 bar diameters of the straight portion of the hooked bar, the contribution to anchorage strength was proportional to the area of confining reinforcement; for confining reinforcement perpendic-ular to the straight portion of the bar, more legs of the confining reinforcement contributed to anchor strength, but each leg made a smaller contribution.
Keywords: anchorage; beam-column joints; bond and development; high-strength concrete; high-strength steel; hooks; reinforcement.
INTRODUCTIONSince the early 1900s, many studies have investigated the
development and splice strength of straight deformed bars for a wide range of material properties (Abrams [1913]; Lutz and Gergely [1967]; Azizinamini et al. [1993]; Darwin and Graham [1993]; Darwin et al. [1996]; Zuo and Darwin [2000], among others). The large number of physical tests performed in these studies provided a solid basis for devel-oping equations that accurately characterize bond strength for reinforcing steel with yield strengths up to 120,000 psi (827 MPa) and concrete compressive strengths up to 16,000 psi (110 MPa) (Darwin et al. 1996; Zuo and Darwin 2000; ACI Committee 408 2003; Darwin et al. 2005; Seliem et al. 2009). Similar equations, however, have not been formulated for hooked bars. Therefore, when describing the strength or behavior of hooked bars, researchers typi-cally compare test results with strengths calculated using the provisions for hooked bar development length ℓdh in the ACI 318 Building Code (ACI Committee 318 2014). The main drawback of these provisions is that they were devel-oped based on a very small data set that does not include high-strength steel or high-strength concrete (Minor and Jirsa 1975; Marques and Jirsa 1975; and Pinc et al. 1977). Furthermore, the ACI 318 hooked bar development length equation is not meant to characterize the behavior of hooked bars, but rather to provide a safe estimate of development length for design. Thus, the anchorage strength of hooked bars, particularly in structural elements with high-strength
materials, cannot be accurately calculated using the devel-opment length equation of ACI 318-14, as demonstrated by Sperry et al. (2015a,b; 2017). The goal of this study is to develop an expression that characterizes the anchorage strength of hooked bars and is applicable to the entire range of concrete and steel strengths currently available in construction practice.
The equation for hooked bar development length in tension ℓdh in ACI 318-14 is
dhy e c r
cb
f
fd=
′
ψ ψ ψ
λ50 (in.-lb) (1a)
dhy e c r
cb
f
fd=
′
0 24. ψ ψ ψ
λ (SI) (1b)
where ℓdh is measured from the outside end of the hook at the point of tangency, toward the critical section (in. or mm); fy is the yield strength of the hooked bar (psi or MPa); db is the nominal diameter of the hooked bar (in. or mm); λ is the modification factor that reflects the reduced mechan-ical properties of lightweight concrete compared to normal-weight concrete with the same compressive strength; and fc′ is the specified concrete compressive strength (psi or MPa). Equation (1) also includes three modification factors ψ that account for bar coating ψe, concrete cover ψc, and confining reinforcement in the hook region ψr.
The stress corresponding to the anchorage capacity of an uncoated hooked bar cast in normalweight concrete, desig-nated fs,ACI, can be obtained from Eq. (1) by substituting fs,ACI for fy, the measured embedment length ℓeh for ℓdh, the measured concrete compressive strength fcm for fc′, and setting ψe and λ equal to 1.0.
ffds
eh cm
c r b,ACI =
50ψ ψ
(in.-lb) (2a)
ffds
eh cm
c r b,ACI =
0.24ψ ψ (SI) (2b)
Title No. 114-S23
Conventional and High-Strength Hooked Bars— Part 2: Data Analysisby J. Sperry, D. Darwin, M. O’Reilly, R. D. Lequesne, S. Yasso, A. Matamoros, L. R. Feldman, and A. Lepage
ACI Structural Journal, V. 114, No. 1, January-February 2017.MS No. S-2016-126, doi: 10.14359/51689457, was received March 24, 2016, and
reviewed under Institute publication policies. Copyright © 2017, American Concrete Institute. All rights reserved, including the making of copies unless permission is obtained from the copyright proprietors. Pertinent discussion including author’s closure, if any, will be published ten months from this journal’s date if the discussion is received within four months of the paper’s print publication.

268 ACI Structural Journal/January-February 2017
ℓeh is shown in Fig. 1 for the specimens used in this study.Two modification factors, ψc and ψr, remain in Eq. (2).
As defined in Section 25.4.3.2 of ACI 318-14, the cover factor ψc is 0.7 for No. 11 and smaller hooked bars with side cover of at least 2.5 in. (65 mm) and for 90-degree hooks with at least 2 in. (50 mm) of clear cover to the tail of the hook; otherwise, ψc is 1.0. The factor ψr is 0.8 for No. 11 and smaller hooked bars with confining reinforcement parallel (90-degree hooks only) or perpendicular (90- and 180-degree hooks) to the straight portion of the hooked bar and spaced no further than 3db apart; otherwise, ψr is 1.0.
Equations (1) and (2) imply that the stress in a hooked bar at failure is proportional to the square root of the concrete compressive strength and inversely proportional to the bar diameter. It was shown by Sperry et al. (2015a,b; 2017), however, that as the concrete compressive strength increases, the development length calculated using Eq. (1) becomes less conservative. This trend implies that using the square root of the concrete compressive strength as a design parameter overstates the effect of compressive strength on anchorage strength. This is consistent with findings for straight bars, where studies have shown that the stress developed in a bar is proportional to the concrete compressive strength raised to the quarter power (Darwin et al. 1996; Zuo and Darwin 2000; Darwin et al. 2005). Sperry et al. (2015a,b; 2017) also showed that anchorage strengths calculated with Eq. (2) underestimate measured strengths in small hooked bars (No. 5 [No. 16]) and overestimate strengths for larger bars (No. 11 [No. 36]). This trend indi-cates that the inversely proportional relationship between anchorage strength and bar diameter in Eq. (2) is not accu-rate. Sperry et al. (2015a,b; 2017) observed that when
modification factors for cover and confining reinforcement in Section 25.4.3.2 of ACI 318-14 (equal to 0.7 and 0.8, respectively) were used; calculated anchorage strengths were unconservative, particularly for higher-strength concretes and larger diameter bars.
In light of the inconsistencies that arise when extrapo-lating the provisions of ACI 318-14 well beyond the range of material strengths and bars sizes for which they were originally calibrated, a new set of equations were developed to accurately characterize the effects of concrete compres-sive strength, bar diameter, and confining reinforcement on the anchorage strength of hooked bars. The effects of other parameters, such as hook bend angle, clear concrete side cover to the hooked bar, hooked bar placement inside or outside the column core, and spacing between hooked bars are described by Sperry et al. (2015a).
RESEARCH SIGNIFICANCEAlthough equations characterizing the development
length of straight deformed bars are available in the litera-ture for a wide range of material strengths and bar sizes, the same cannot be said for hooked bars. The research presented in this paper is aimed at developing anchorage strength equations for hooked bars that apply to the full range of concrete compressive strengths and reinforcing steel yield strengths currently used in practice. These equations are derived based on the results from a large-scale experimental study investigating key parameters affecting hooked bar anchorage strength.
HOOKED BAR DATABASETest data from 245 simulated exterior beam-column joint
specimen tests were used in the analysis. The data represent specimens containing two hooked bars, 214 from the recent study by Sperry et al. (2015a,b; 2017) and 31 from previous research (Marques and Jirsa 1975; Pinc et al. 1977; Hamad et al. 1993; Ramirez and Russell 2008; Lee and Park 2010). Details of the specimens used in the analysis are presented in Appendix A.*
The majority of the tests in the database, those by Sperry et al. (2015a,b, 2017), were used to study the effects on hooked bar anchorage strength of embedment length, side cover, amount of confining reinforcement, concrete compressive strength, hooked bar size, and hook bend angle. No. 5, 8, and 11 (No. 16, 25, and 36) hooked bars were tested in normalweight concrete with compressive strengths ranging from 4300 to 16,200 psi (30 to 112 MPa). Figure 1 shows the geometry and loading configuration of the simulated beam-column joints tested by Sperry et al. (2015a,b; 2017). The straight portions of two hooked bars, representing longitudinal beam reinforcement, protruded from the face of the column. The compression zone of the beam was simu-lated using a bearing member on the testing frame (Sperry et al. 2015a,b; 2017). For specimens with confining rein-forcement, the majority of that reinforcement was oriented
*The Appendix is available at www.concrete.org/publications in PDF format, appended to the online version of the published paper. It is also available in hard copy from ACI headquarters for a fee equal to the cost of reproduction plus handling at the time of the request.
Fig. 1—Beam-column specimens: (a) side view; (b) cross section without confining reinforcement; and (c) cross section of specimen with confining reinforcement parallel to straight portion of hooked bar.
269ACI Structural Journal/January-February 2017
parallel to the straight portion of hooked bars (Fig. 1). A limited number of specimens had confining reinforcement oriented perpendicular to the straight portion of the hooked bars, as shown in Fig. 2. Nominal clear cover from the side of the hooked bar to the side of the column (side cover) ranged from 2.5 to 3.5 in. (65 to 90 mm). Hooked bar center-to-center spacing was 11db. Hooked bar stresses at failure ranged from 33,000 to 144,100 psi (228 to 994 MPa). The 31 specimens from previous studies (Marques and Jirsa 1975; Pinc et al. 1977; Hamad et al. 1993; Ramirez and Russell 2008; Lee and Park 2010) included tests of No. 7, 9, and 11 (No. 22, 29, and 36) hooked bars in normalweight concrete with compressive strengths ranging from 2570 to 12,850 psi (17.7 to 88.6 MPa). Hooked bar stresses at failure ranged from 30,800 to 143,900 psi (212 to 992 MPa). Overall, the database used in this analysis included 99 specimens without confining reinforcement and 146 with confining reinforcement.
ANALYSIS OF TEST RESULTSIterative statistical analyses were conducted to determine
the effects of key parameters (embedment length, concrete compressive strength, hooked bar diameter, and quantity of confining reinforcement) on hooked bar anchorage strength using the test results included in the database.
Three different cases were addressed: hooked bars without confining reinforcement (Fig. 1(b)), hooked bars with differing quantities of confining reinforcement oriented parallel to the straight portion of the hooked bar (Fig. 1(c)), and hooked bars with differing quantities of confining rein-forcement oriented perpendicular to the straight portion of the hooked bar (Fig. 2). The average bar force at failure T is defined as the peak load on the specimen divided by the number (two) of hooked bars, and the embedment length ℓeh
refers to the average of the measured embedded lengths of the two bars in a specimen.
Descriptive equation for hooked bars without confining reinforcement
A least-squares regression technique including dummy variables (Draper and Smith 1981) was used to evaluate the influence of various design parameters on anchorage strength. This analysis technique consists of calculating linear regression equations with the same slope and different intercepts for data subsets that include one or more dummy variables. Linear regression equations derived in this manner produce a series of parallel lines, as shown in Fig. 3 and 4. The legends in these figures identify the data subsets in the order, top to bottom, in which they appear. The difference between the intercepts of these “dummy variable lines” shows the relative effect of the dummy variable on the dependent variable—for example, the effect of bar size on
Fig. 2—Beam-column specimen with confining reinforce-ment perpendicular to straight portion of hooked bar: (a) side view; and (b) cross section.
Fig. 3—Bar force at failure T versus embedment length ℓeh for hooked bars without confining reinforcement. (Note: 1 kip = 4.448 kN; 1 in. = 25.4 mm.)
Fig. 4—Bar force at failure T normalized to fcm0.29
versus embedment length ℓeh for hooked bars without confining reinforcement. T in lb and fcm in psi. (Note: 1 lb = 4.448 N; 1 psi = 0.006895 MPa; 1 in. = 25.4 mm.)

270 ACI Structural Journal/January-February 2017
failure force T (lb [N]) in Fig. 3. A small spread in the inter-cepts of the dummy variable lines with respect to the total range in the data indicates that the relationship between the variables could be represented satisfactorily by a single best-fit line, which is the ultimate goal of the optimization process. In this analysis, emphasis was placed on finding the best-fit equation for the data set, leaving simplifications and rounding of coefficients for the implementation of design provisions.
Figure 3 shows the measured average bar force at failure T as a function of embedment length ℓeh for the 99 beam-column joint specimens without confining reinforce-ment. The values of T ranged from 19 to 213 kip (84.5 to 947 kN). Bar stresses ranged from 30,800 to 136,700 psi (212 to 943 MPa), embedment lengths ℓeh ranged from 4.9 to 26.0 in. (124 to 660 mm), and concrete compressive strengths ranged from 2570 to 16,200 psi (17.7 to 112 MPa). The general trend shows that anchorage strength increases with increased embedment length.
The analysis shown in Fig. 3 did not include the influ-ence of concrete compressive strength. As the next step, dummy variables analysis was used to determine the appro-priate power of concrete compressive strength p1 for use in an expression to characterize anchorage capacity. The optimal value of the exponent p1 was determined by mini-mizing the spread in the intercepts when T fcm
p1 was plotted versus ℓeh. The magnitude of the spread was evaluated using the relative intercept, defined as the difference between the maximum and minimum intercepts of the dummy variable lines normalized with respect to the difference between the maximum and minimum values of T fcm
p1 . Using this method, the value of p1 was found to be 0.29. The results are shown in Fig. 4.
The value of p1 = 0.29 found in the analysis is signifi-cantly less than 1/2 (used in the design provisions of the ACI Code [ACI Committee 318 2014]), and is consistent with test results for straight bars that show that bond strength is proportional to concrete compressive strength raised to a power of 1/4 (Darwin et al. 1996; Zuo and Darwin 2000; Darwin et al. 2005). Similar to the bond strength of straight reinforcement, anchorage strength of hooked bars is governed by the combined effects of concrete tensile strength, which controls initial crack formation, and frac-ture energy, which controls crack propagation. Research shows that while the tensile strength of concrete increases with the compressive strength to a power between 1/2 and 2/3 (Ahmad and Shah 1985), the fracture energy of concrete is nearly independent of compressive strength (Darwin et al. 2001). It is hypothesized that the combined effects of tensile strength and fracture energy cause anchorage strength to be proportional to concrete compressive strength to a power well below 1/2.
In Fig. 4, trend lines for specimens with larger hooked bars have higher intercepts than those for specimens with smaller hooked bars, indicating that for the same embed-ment length, larger hooked bars provide greater anchorage strength. The relationship between the parameter T fcm
0 29. and embedment length times the bar diameter raised to a power
p2 was evaluated to establish the effect of bar diameter on anchorage strength for hooked bars without confining rein-forcement (Fig. 5). Statistical analyses showed that p2 = 0.47 minimized the spread in the intercepts of the dummy variable lines. Using the slope and average intercept of the lines in Fig. 5, the strength of hooked bars without confining reinforcement can be represented as
Tf
dc
cmeh b0 29
0 47422 417..= − (in.-lb) (3a)
Tf
dc
cmeh b0 29
0 4768 4 7855...= − (SI) (3b)
Ratios of bar force at failure to bar force calculated using Eq. (3), T/Tc, are plotted with respect to fcm in Fig. 6. The
Fig. 5—Bar force at failure T normalized to fcm0.29
versus product of embedment length ℓeh and bar diameter db to the 0.47 power for hooked bars without confining reinforce-ment. T in lb and fcm in psi. (Note: 1 lb = 4.448 N; 1 psi = 0.006895 MPa; 1 in. = 25.4 mm.)
Fig. 6—Ratio of bar force at failure T to calculated bar force based on Eq. (3) Tc versus concrete compressive strength for hooked bars without confining reinforcement. (Note: 1 ksi = 6.895 MPa.)
271ACI Structural Journal/January-February 2017
resulting dummy variable lines are nearly horizontal, indicating that Eq. (3) adequately represents the effect of concrete compressive strength on anchorage strength. The intercepts of the individual trend lines are relatively close, ranging from 0.94 to 1.07, with no order based on bar size, indicating that Eq. (3) adequately captures the effect of bar size. The mean value of the ratio T/Tc is 1.0, with a coefficient of variation of 0.12, and a range between 0.73 and 1.30.
In the analyses described thus far, it was assumed that the relationship between the anchorage force at failure T and embedment length ℓeh is linear. To further improve accuracy, the data were reanalyzed using a power regression model to characterize the relationship between T and embedment length ℓeh. The powers of ℓeh and db were chosen to minimize the sum of the squared differences (1 – T/Tc)2. The resulting equation is
T f dc cm eh b= 332 0 29 1 06 0 54. . . (in.-lb) (4a)
T f dc cm eh b= 35 4 0 29 1 06 0 54. . . . (SI) (4b)
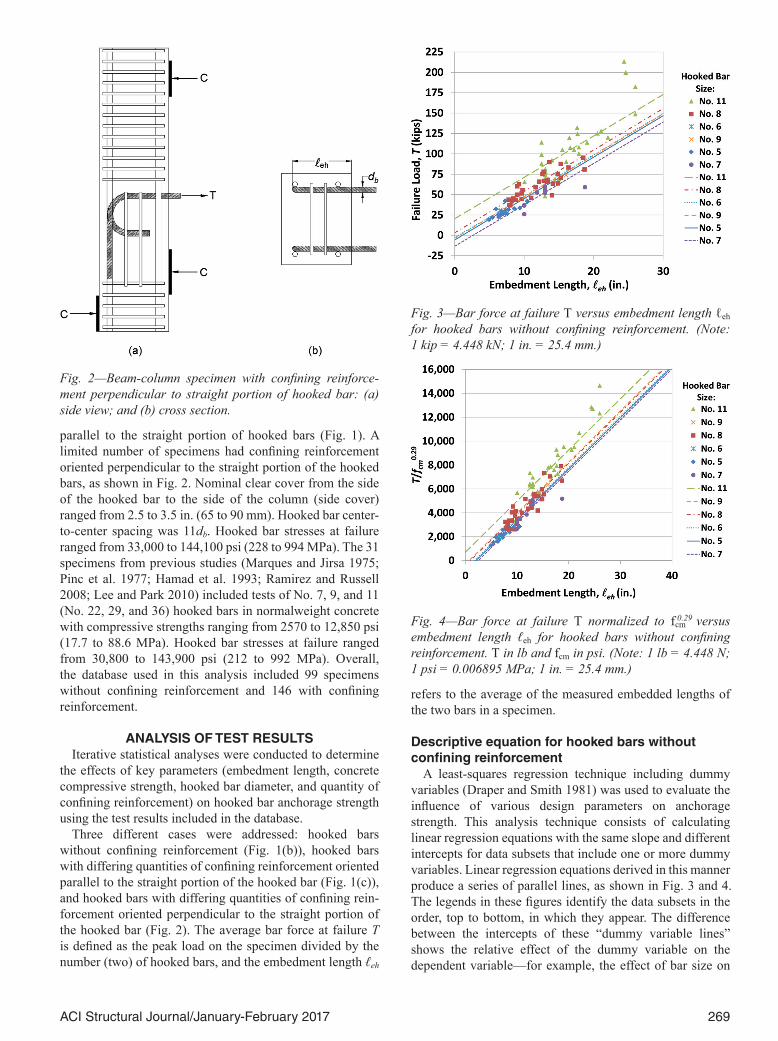
This nonlinear relationship, which has a power of ℓeh slightly greater than 1.0, is plausible considering that both the front and side failures described by Sperry et al. (2015a,b, 2017) involve a failure surface that becomes progressively larger as embedment length increases. Figure 7 shows a comparison between the bar forces at failure and the calculated bar forces Tc based on Eq. (4). The dashed line in Fig. 7 represents equality between the measured and calculated anchorage strengths and the solid line is the best fit line for the data set. The fact that the two lines are very close further indicates that Eq. (4) provides a good estimate of anchorage strength for the entire range of test results. The average test-to-calculated ratio using Eq. (4) is equal to 1.0 with a coefficient of variation of 0.12 and ratios of T/Tc ranging from 0.73 to 1.30. These values are identical (to two significant figures) to those calculated using Eq. (3). These
results show that a power of 1.06 on ℓeh produces similar results to a power of 1.0, with the most significant difference being for large bars with deep embedment lengths. Thus, for design, it would be justified to use the power of 1.0 for the embedment length.
Descriptive equations for hooked bars with confining reinforcement
The contribution of the confining reinforcement Ts to the anchorage strength was found by subtracting Tc (the bar force calculated using Eq. (4)) from the measured bar force at failure T for hooked bars with confining reinforcement. On average, the value of Tc represents 82% of the total anchorage strength of a hooked bar with confining rein-forcement. Due to the relatively small number of specimens (12) containing standard hooks with confining reinforce-ment tested prior to this study (Marques and Jirsa 1975; Hamad et al. 1993; Ramirez and Russell 2008; and Lee and Park 2010) and the inherent variability in the contribution of the confining steel to the strength of the hooked bars, only specimens that were tested in this study were used to develop the expression for Ts, eliminating the potential variability introduced by a small number of specimens with a narrow range of input parameters and different methods of testing.
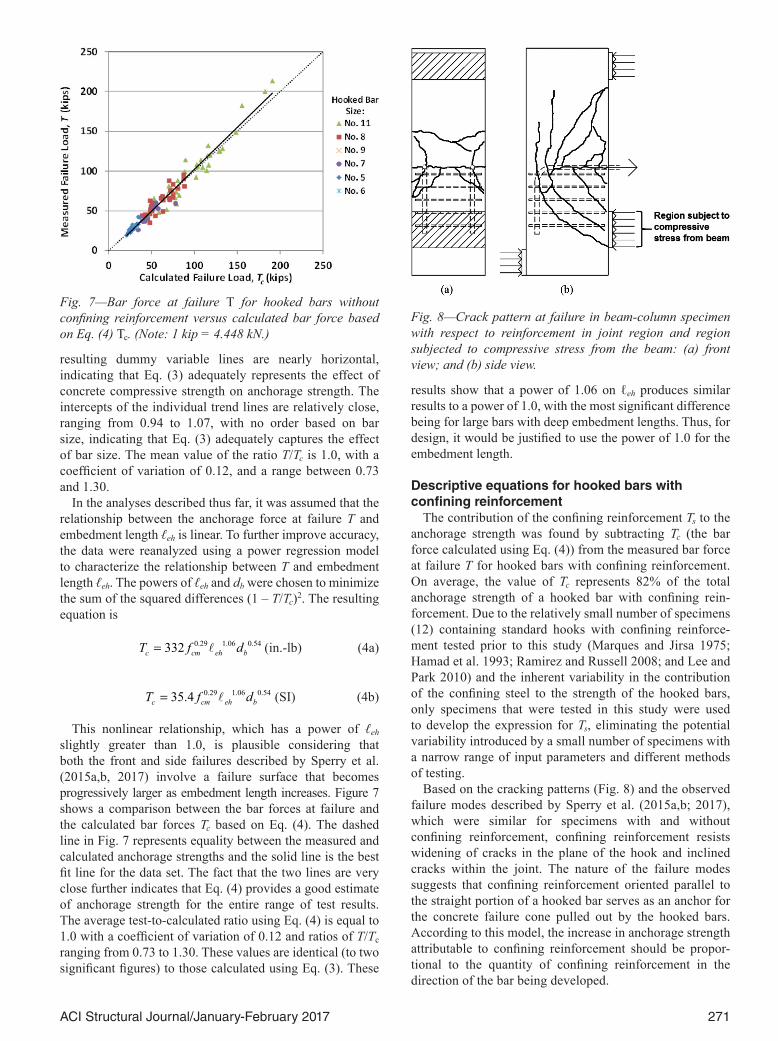
Based on the cracking patterns (Fig. 8) and the observed failure modes described by Sperry et al. (2015a,b; 2017), which were similar for specimens with and without confining reinforcement, confining reinforcement resists widening of cracks in the plane of the hook and inclined cracks within the joint. The nature of the failure modes suggests that confining reinforcement oriented parallel to the straight portion of a hooked bar serves as an anchor for the concrete failure cone pulled out by the hooked bars. According to this model, the increase in anchorage strength attributable to confining reinforcement should be propor-tional to the quantity of confining reinforcement in the direction of the bar being developed.
Fig. 7—Bar force at failure T for hooked bars without confining reinforcement versus calculated bar force based on Eq. (4) Tc. (Note: 1 kip = 4.448 kN.)
Fig. 8—Crack pattern at failure in beam-column specimen with respect to reinforcement in joint region and region subjected to compressive stress from the beam: (a) front view; and (b) side view.

272 ACI Structural Journal/January-February 2017
Figures 9 and 10, respectively, show the ratio T/Tc and T-Tc plotted as functions of NAtr/n, an index representing the effective amount of confining reinforcement within the hook region. The term N is the number of legs of confining reinforcement parallel to the straight portion of a hooked bar within a dimension equal to the outside diameter of a hooked bar bent in accordance with Table 25.3.1 of ACI 318-14 (that is, within 8db from the top of the hooked bar for No. 3 through No. 8 [No. 10 through No. 25] hooked bars or 10db from the top of the bar for No. 9 through No. 11 [No. 29 through No. 36] hooked bars), as shown in Fig. 11(a); or the number of legs perpendicular to the hooked bar over the length being developed, as shown in Fig. 11(b). The term Atr is the area of a single leg of confining reinforcement, and n is the number of hooked bars. For example, a configuration with two hooked bars confined by No. 3 (No. 10) ties spaced at 3db and oriented parallel to
the straight portion of the bar leads to three No. 3 [No. 10] ties for a total of six legs, resulting in NAtr/n = (6 × 0.11)/2 = 0.33 in.2/hook (213 mm2/hook). For the test specimens used in this analysis, NAtr/n ranged from 0.11 to 0.60 in.2/hook (71 to 387 mm2/hook), with maximum values of N equal to 6 and 10, respectively, for confining reinforcement oriented parallel and perpendicular to the straight portion of the bar.
In the current formulation, the definition of N for confining reinforcement parallel to the straight portion of a hooked bar is applicable to both 90- or 180-degree standard hooks (in contrast to ACI 318-14, which credits reinforcement parallel to the straight portion of the hooked bar as strength-ening only 90-degree hooks) and is based on the observa-tion that not all ties confining a hooked bar will contribute to the tensile capacity of the hook. For example, ties located within the region subjected to compressive stress from the beam, as shown in Fig. 8, are unlikely to carry significant tensile stress. Based on this observation, several definitions of N were systematically evaluated in the analysis of the test results. Using a dimension equal to the minimum outside bend diameter prescribed by ACI 318-14 for a hooked bar to define the region where ties are effective in resisting the pullout force of the hook resulted in the least scatter when compared with test results. This definition of N is also supported by visual observations of specimens after failure, which showed that the majority of the cracks at failure were confined by the ties closest to the straight portion of the hook (that is, those within 8 to 10db of the straight portion of the hooked bar). Some cracks on the side faces of the specimens extended past ties in the compression region, but the concrete failure cone on the front face of the spec-imen did not extend below the compression region. This crack pattern suggests that the majority of the tensile force resisted by the confining reinforcement is carried by those bars closest to the hooked bar—that is, outside the compres-sion zone of the beam.
The effect on anchorage strength was also investigated for cases of confining reinforcement placed perpendicular to the straight portion of a hooked bar. The provisions of ACI 318-14 allow the use of a development length modi-fication factor of 0.8 for 180- and 90-degree hooked bars
Fig. 9—Ratio of bar force at failure T for hooked bars confined by reinforcement parallel to straight portion of hooked bar to calculated anchorage strength provided by concrete based on Eq. (4) Tc. (Note: 1 in. = 25.4 mm.)
Fig. 10—Bar force at failure in excess of calculated concrete contribution based on Eq. (4) Tc versus amount of confining reinforcement parallel to straight portion of hooked bar. (Note: 1 kip = 4.448 kN; 1 in. = 25.4 mm.)
Fig. 11—Locations of effective confining reinforcement: (a) confining reinforcement parallel; or (b) perpendicular to straight portion of hooked bar.
273ACI Structural Journal/January-February 2017
where confining reinforcement is oriented perpendicular to the straight portion of the bar and spaced at 3db or less. The modification factor is also applicable to 90-degree hooked bars where confining reinforcement meeting the same spacing requirement is placed parallel to the straight portion of the bar. Although adding confining reinforcement perpendicular to the straight portion of a hooked bar was found to increase anchorage strength, the test results indicate that its effect on anchorage strength was different than if it was parallel to the straight portion of the bar. The observed modes of failure (Sperry et al. 2015b) indicate that confining reinforcement oriented parallel to the straight portion of the bar acts as anchor reinforcement, restraining the concrete from being pulled out the front of the column. In contrast, confining reinforcement oriented perpendicular to the straight portion of the bar restrains the propagation of cracks within the joint similar to the manner in which confining reinforcement restrains the propagation of splitting cracks for straight bars, but it does not act as anchor reinforcement and is pulled through the front of the column with the cone of concrete at failure (Sperry et al. 2015b). Thus, the two cases (confining reinforcement parallel versus perpendic-ular) were analyzed separately.
Confining reinforcement parallel to straight portion of hooked bar—Figure 9 shows the ratio of measured anchorage strength to the calculated anchorage strength provided by concrete (Eq. (4)) T/Tc versus the param-eter NAtr/n for hooked bars with confining reinforcement oriented parallel to the straight portion of the bar. The strength in excess of the concrete contribution Ts = T – Tc, is plotted versus the parameter NAtr/n in Fig. 10. The figures include results from 140 specimens with values of NAtr/n ranging from 0.11 to 0.60 in.2/hook (71 to 387 mm2/hook). The average bar force at failure ranged from 19 to 210 kip (84.5 to 934 kN), with the stress ranging from 41,000 to 144,100 psi (283 to 994 MPa). The average embedment lengths ranged from 3.75 to 23.5 in. (95.3 to 597 mm), and concrete compressive strengths ranged from 4300 to 16,200 psi (29.6 to 112 MPa). In the figures, a value of NAtr/n of 0.33 in.2/hook (213 mm2/hook) corresponds to No. 3 (No. 10) ties spaced at 3db (which satisfies the requirement for use of the development length modifica-tion factor ψr = 0.8). Values of NAtr/n of 0.40 in.2/hook (258 mm2/hook) for No. 8 (No. 25) bars and 0.60 in.2/hook (387 mm2/hook) for No. 11 (No. 36) bars correspond to the higher quantities of confining reinforcement required by Section 21.7.3 of ACI 318-11 (ACI Committee 318 2011) for joints in special moment frames. The trend lines for each bar size in Fig. 9 and Fig. 10 are, respectively, the best-fit lines and the lines resulting from a dummy vari-ables analysis. Figure 9 shows that T/Tc increased with an increase in NAtr/n, with smaller bars exhibiting a greater relative increase in T/Tc than the larger bars. This compar-ison shows that the increase in hooked bar anchorage strength provided by confining reinforcement cannot be expressed as a percentage of Tc for all bar sizes. This is contrary to the implication of Section 25.4.3.2 of ACI 318-14, which permits the use of the modification factor ψr
= 0.8 for hooked bar development lengths when confining ties are provided at a spacing not exceeding 3db.
Figure 10 shows T – Tc versus the parameter NAtr/n. The scatter in T – Tc was expected because there was scatter in T, and T – Tc is a small portion (on average 18%) of T. The figure shows that, on average, T – Tc increases proportionally to the parameter NAtr/n. The relationship between T – Tc and the parameter NAtr/n is similar for No. 8 and No. 11 (No. 25 and No. 36) hooked bars. The dummy variable analysis shows that the effect of confining reinforcement is greater for the larger hooked bars (No. 8 and No. 11, No. 25 and No. 36) than for the No. 5 (No. 16) bars.
Using statistical analysis procedures similar to those used for hooked bars without confining reinforcement, the following expression for Ts was obtained
TNAn
dstr
b=
54 2501 06
0 59,.
. (in.-lb) (5a)
TNAn
dstr
b=
37 61 06
0 59..
. (SI) (5b)
Similar to the nonlinear relationship between Tc and ℓeh for hooked bars without confining reinforcement, the power of 1.06 on the parameter NAtr/n is close to 1.0, so a linear relationship between Ts and NAtr/n is acceptable for design.
The anchorage strength of hooked bars with confining reinforcement oriented parallel to the straight portion of the bar in beam-column joints can be expressed as the sum of components corresponding to the contributions of concrete and the confining reinforcement using Eq. (4) and (5).
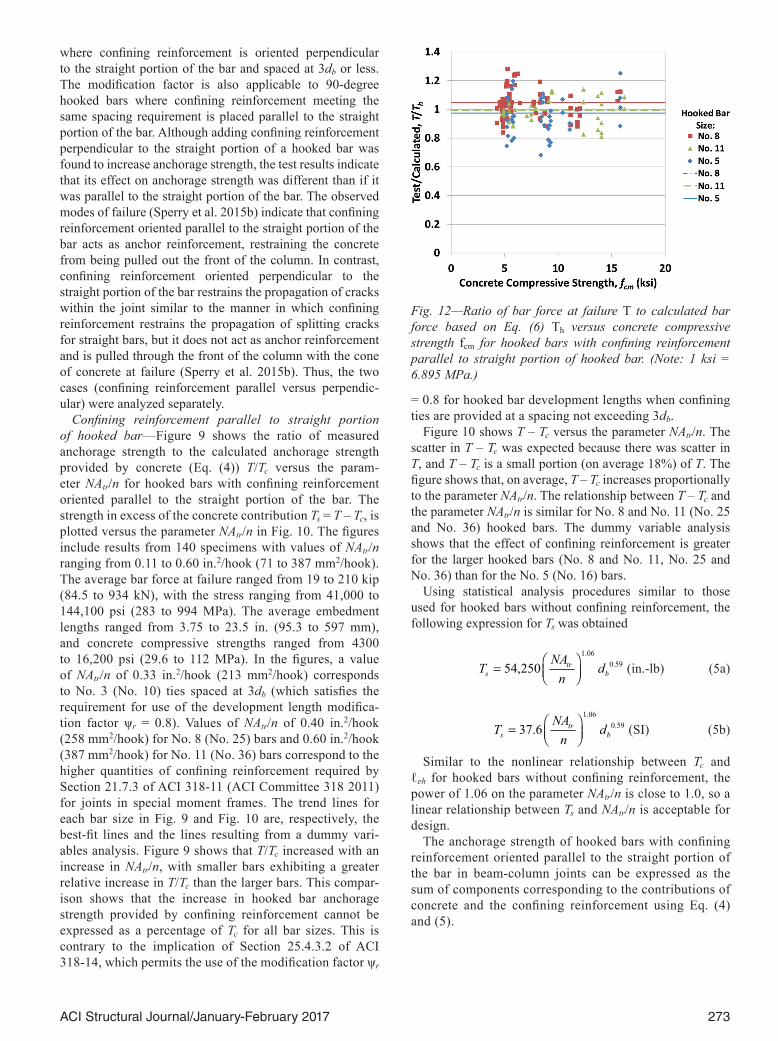
Fig. 12—Ratio of bar force at failure T to calculated bar force based on Eq. (6) Th versus concrete compressive strength fcm for hooked bars with confining reinforcement parallel to straight portion of hooked bar. (Note: 1 ksi = 6.895 MPa.)

274 ACI Structural Journal/January-February 2017
T f d NAn
dh cm eh btr
b= +
332 54 500 29 1 06 0 541 06
0 59. . ..
. ,2
(in.-lb) (6a)
T f d NAn
dh cm eh btr
b= +
35 4 37 60 29 1 06 0 541 06
0 59. .. . ..
. (SI) (6b)
Figure 12 shows T/Th as a function of measured concrete compressive strength fcm, where anchorage strength Th is calculated using Eq. (6) for the specimens with confining reinforcement. The trend lines from the dummy variable analyses are nearly horizontal, showing that the effect of concrete compressive strength is adequately represented by Eq. (6). The intercepts of the trend lines corresponding to specimens with No. 5, 8, and 11 (No. 16, 25, and 36) bars are 0.97, 1.05, and 1.00, respectively.
Figure 13 shows a comparison of anchorage forces measured in the tests with those calculated using Eq. (6). The dotted line represents cases in which the measured and calculated strengths are equal, while the solid line represents the best fit line for the data set. The two lines nearly match, indicating that Eq. (6) provides an accurate estimate of anchorage strength over the entire range of test data. The average test-to-calculated ratio using Eq. (6) is equal to 1.0 with a coefficient of variation of 0.11 and ratios to T/Th ranging from 0.68 to 1.28.
Confining reinforcement perpendicular to straight portion of hooked bar—Six specimens with confining reinforce-ment oriented perpendicular to the straight portion of the hooked bar (Fig. 2) were tested by Sperry et al. (2015a,b; 2017) to investigate whether this reinforcement configu-ration is equally effective to reinforcement parallel to the straight portion of the bar (Fig. 1). For these six specimens, anchorage strengths calculated using Eq. (6), with N equal to the number of legs perpendicular to the hooked bar over the length being developed, overestimated the component
Ts by a factor of three or more. In light of the large differ-ences in the calculated values of Ts, experimental results for the six specimens with vertical ties were re-evaluated. The resulting relationship is given by
TNAn
dsptr
b=
14,9501 06
0 59.
. (in.-lb) (7a)
TNAn
dsptr
b=
10.41 06
0 59.
. (SI) (7b)
Because of the small dataset, the powers of NAtr/n and db from Eq. (6) were retained in Eq. (7).
When combining Tc from Eq. (4) with Tsp from Eq. (7) to calculate Th for the six specimens with confining rein-forcement oriented parallel to the straight portion of the bar, the average test-to-calculated ratio T/Th was set 0.94, rather than 1.0, to match the average T/Th ratio of the companion specimens with confining reinforcement oriented parallel to the straight portion of the bar in this group. A compar-ison of Eq. (7) with Eq. (5) indicates that, on average, each leg of confining reinforcement perpendicular to the straight portion of a hooked bar provided 28% of the contribution of a leg of confining reinforcement parallel to the straight portion of a hooked bar. The calculations indicate that all the legs of reinforcement perpendicular to the straight portion of the bar contributed to Th, while only those legs that were within 8 or 10db of the top of the bar contributed for the configuration parallel to the straight portion of the hooked bar. Because this study was limited in scope and no other research addressing confining reinforcement perpen-dicular to the straight portion of a hooked bar is available for comparison with Eq. (7), additional research is needed to confidently establish the effect of orientation of confining reinforcement over the full range of material properties and bar sizes.
Equations (4) through (7) were developed to characterize the test results for specimens containing two hooked bars with and without confining reinforcement. Design provi-sions that are relatively easy to apply and that recognize other aspects not addressed by the equations developed in this paper, such as hooked bar spacing, hooked bar place-ment, additional hooked bars at a cross section, and struc-tural reliability, are the subject of continuing research.
SUMMARY AND CONCLUSIONSEquations were developed to characterize the anchorage
strength of hooked bars with and without confining rein-forcement. The equations are based on test results of 245 simulated beam-column joint specimens containing two hooked bars: 99 without confining reinforcement and 146 with confining reinforcement. The data set developed in this study was complemented with test results reported by Marques and Jirsa (1975), Pinc et al. (1977), Hamad et al. (1993), Ramirez and Russell (2008), and Lee and Park (2010). Bar stresses at failure ranged from 30,800 to 144,100 psi (212 to 994 MPa), and concrete compressive strengths ranged from 2570 to 16,200 psi (17.7 to 112 MPa).
Fig. 13—Bar force at failure T for hooked bars with confining reinforcement parallel to straight portion of hooked bar T versus calculated bar force based on Eq. (6) Th. (Note: 1 kip = 4.448 kN.)

275ACI Structural Journal/January-February 2017
The following conclusions are based on the analysis presented in this paper:
1. The effect of concrete compressive strength on the anchorage strength of hooked bars was proportional to the compressive strength raised to the 0.29 power.
2. The contribution to hooked bar anchorage strength of confining reinforcement oriented parallel to and located within eight or 10 bar diameters of the straight portion of the bar was proportional to the area of confining reinforcement.
3. For a given embedment length, the anchorage strength of hooked bars with and without confining reinforcement increased as the diameter of the hooked bar increased.
4. The behavior and contribution to hooked bar anchorage strength of confining reinforcement oriented perpendicular to the straight portion of the hooked bar differed from that of reinforcement oriented parallel to the bar, with more legs of the confining reinforcement contributing but with each leg making a smaller contribution.
AUTHOR BIOSACI member Jayne Sperry is a Graduate Engineer with Walter P. Moore, Orlando, FL. She received her BS, MS, and PhD from the University of Kansas, Lawrence, KS.
ACI member Samir Yasso is a PhD student in the Department of Civil, Environmental, and Architectural Engineering at the University of Kansas.
ACI Honorary Member David Darwin is the Deane E. Ackers Distin-guished Professor and Chair of the Department of Civil, Environmental, and Architectural Engineering at the University of Kansas.
ACI member Matthew O’Reilly is an Assistant Professor of Civil, Environ-mental, and Architectural Engineering at the University of Kansas.
Adolfo Matamoros, FACI, is the Peter T. Flawn Distinguished Professor of Civil and Environmental Engineering at the University of Texas at San Antonio, San Antonio, TX.
Lisa R. Feldman, FACI, is an Associate Professor of Civil and Geological Engineering at the University of Saskatchewan, Saskatoon, SK, Canada, and Director of the Saskatchewan Centre for Masonry Design, Saskatoon, SK, Canada.
Andrés Lepage, FACI, is an Associate Professor and Director of Labora-tories in the Department of Civil, Environmental, and Architectural Engi-neering at the University of Kansas
ACI member Rémy D. Lequesne is an Assistant Professor of Civil, Envi-ronmental, and Architectural Engineering at the University of Kansas.
ACKNOWLEDGMENTSSupport for the study was provided by the Electric Power Research
Institute (EPRI), Concrete Reinforcing Steel Institute Education and Research Foundation, University of Kansas Transportation Research Insti-tute, Charles Pankow Foundation, Commercial Metals Company, Gerdau Corporation, Nucor Corporation, and MMFX Technologies Corporation. Additional materials were supplied by Dayton Superior, Midwest Concrete Materials, and Grace Construction Products. Thanks are due to K. Barry and M. Ruis, who provided project oversight for the Advanced Nuclear Technology Program of EPRI, and to N. Anderson, C. Kopczynski, M. Mota, J. Munshi, and C. Paulson, who served as industry advisors.
NOTATIONdb = nominal diameter of hooked barfc′ = specified concrete compressive strengthfcm = measured average concrete compressive strengthfs,ACI = stress in hook as calculated by Section 25.4.3 of ACI 318-14fy = yield strength of hooked barℓdh = development length in tension of deformed bar with standard
hook, measured from outside end of hook, point of tangency, toward critical section
ℓeh = embedment length measured from outside end of hook, point of tangency, to front face of column
N = number of legs of confining reinforcement parallel to straight portion of hooked bar within 8db from top of hooked bar for No. 3 through No. 8 (No. 10 through No. 25) hooked bars or 10db from top of hooked bar for No. 9 through No. 11 (No. 29 through No. 36) hooked bars; or number of legs perpendicular to hooked bar over length being developed
n = number of hooked bars confined by N legsT = average bar force at failure on hooked bars in a specimen (failure
load)Tc = contribution of concrete to hooked bar anchorage strengthTh = hooked bar anchorage strengthTs = contribution of confining reinforcement oriented parallel to
straight portion of hooked bar to anchorage strengthTsp = contribution of confining reinforcement oriented perpendicular
to straight portion of hooked bar to anchorage strengthλ = modification factor to reflect reduced mechanical properties of
lightweight concrete relative to normalweight concrete of same compressive strength
ψc = factor used to modify development length based on cover as defined in ACI 318-14, Section 25.4.3.2
ψe = factor used to modify development length based on reinforce-ment coating as defined in ACI 318-14, Section 25.4.3.2
ψr = factor used to modify development length based on confining reinforcement in hook region as defined in ACI 318-14, Section 25.4.3.2
REFERENCESAbrams, D. A., 1913, “Tests of Bond between Concrete and Steel,”
Bulletin No. 71, Engineering Experiment Station, University of Illinois, Urbana, IL, 238 pp.
ACI Committee 318, 2011, “Building Code Requirements for Struc-tural Concrete (ACI 318-11) and Commentary (ACI 318R-11),” American Concrete Institute, Farmington Hills, MI, 503 pp.
ACI Committee 318, 2014, “Building Code Requirements for Struc-tural Concrete (ACI 318-14) and Commentary (ACI 318R-14),” American Concrete Institute, Farmington Hills, MI, 519 pp.
ACI Committee 408, 2003, “Bond and Development of Straight Rein-forcing Bars in Tension (ACI 408R-03),” American Concrete Institute, Farmington Hills, MI, 49 pp.
Ahmad, S. H., and Shah, S. P., 1985, “Structural Properties of High Strength Concrete and Its Implications for Precast Prestressed Concrete,” PCI Journal, V. 30, No. 6, Nov.-Dec., pp. 92-119
Azizinamini, A.; Stark, M.; Roller, J. J.; and Ghosh, S. K., 1993, “Bond Performance of Reinforcing Bars Embedded in High-Strength Concrete,” ACI Structural Journal, V. 90, No. 5, Sept.-Oct., pp. 554-561.
Darwin, D.; Barham, S.; Kozul, R.; and Luan, S., 2001, “Fracture Energy of High-Strength Concrete,” ACI Materials Journal, V. 98, No. 5, Sept.-Oct., pp. 410-417.
Darwin, D., and Graham, E. K., 1993, “Effect of Deformation Height and Spacing on Bond Strength of Reinforcing Bars,” ACI Structural Journal, V. 90, No. 6, Nov.-Dec., pp. 646-657.
Darwin, D.; Lutz, L. A.; and Zuo, J., 2005, “Recommended Provisions and Commentary on Development and Lap Splice Lengths for Deformed Reinforcing Bars in Tension,” ACI Structural Journal, V. 102, No. 6, Nov.-Dec., pp. 892-900.
Darwin, D.; Zuo, J.; Tholen, M. L.; and Idun, E. K., 1996, “Development Length Criteria for Conventional and High Relative Rib Area Reinforcing Bars,” ACI Structural Journal, V. 93, No. 3, May-June, pp. 347-359.
Draper, N. R., and Smith, H., 1981, Applied Regression Analysis, second edition, Wiley, New York, 709 pp.
Hamad, B. S.; Jirsa, J. O.; and D’Abreu de Paulo, N. I., 1993, “Effect of Epoxy Coating on Bond Anchorage of Reinforcing in Concrete Structures,” ACI Structural Journal, V. 90, No. 1, Jan.-Feb., pp. 77-88.
Lee, J., and Park, H., 2010, “Bending—Applicability Study of Ultra-Bar (SD 600) and Ultra-Bar for Rebar Stirrups and Ties (SD 500 and 600) for Compression Rebar,” KCI-R-10-006 Report, Korea Concrete Institute, Seoul, Korea, Aug., 504 pp. (in Korean)
Lutz, L. A., and Gergely, P., 1967, “Mechanics of Bond and Slip of Deformed Bars in Concrete,” ACI Journal Proceedings, V. 64, No. 11, Nov., pp. 711-721.
Marques, J. L., and Jirsa, J. O., 1975, “A Study of Hooked Bar Anchor-ages in Beam-Column Joints,” ACI Journal Proceedings, V. 72, No. 5, May-June, pp. 198-209.
Pinc, R.; Watkins, M.; and Jirsa, J. O., 1977, “The Strength of the Hooked Bar Anchorages in Beam-Column Joints,” CESRL Report No. 77-3, Depart-ment of Civil Engineering-Structures Research Laboratory, University of Texas at Austin, Austin, TX, 67 pp.
276 ACI Structural Journal/January-February 2017
Ramirez, J. A., and Russell, B. W., 2008, “Transfer, Development, and Splice Length for Strand/Reinforcement in High-Strength Concrete,” NCHRP Report 603, National Cooperative Highway Research Program, Transportation Research Board, Washington, DC, 122 pp.
Seliem, H. M.; Hosny, A.; Rizkalla, S.; Zia, P.; Briggs, M.; Miller, S.; Darwin, D.; Browning, J.; Glass, G. M.; Hoyt, K.; Donnelly, K.; and Jirsa, J. O., 2009, “Bond Characteristics of ASTM A1035 Steel Reinforcing Bars,” ACI Structural Journal, V. 106, No. 4, July-Aug., pp. 530-539.
Sperry, J.; Al-Yasso, S.; Searle, N.; DeRubeis, M.; Darwin, D.; O’Reilly, M.; Matamoros, A.; Feldman, L.; Lepage, A.; Lequesne, R.; and Ajaam, A., 2015a, “Anchorage of High-Strength Reinforcing Bars with Standard Hooks,” SM Report No. 111, University of Kansas Center for Research, Lawrence, KS, June, 243 pp.
Sperry, J.; Darwin, D.; O’Reilly, M.; and Lequesne, R., 2015b, “Anchorage Strength of Conventional and High-Strength Hooked Bars in Concrete,” SM Report No. 115, University of Kansas Center for Research, Lawrence, KS, Dec., 266 pp.
Sperry, J.; Yasso, S.; Searle, N.; DeRubeis, M.; Darwin, D.; O’Reilly, M.; Matamoros, A.; Feldman, L. R.; Lepage, A.; Lequesne, R.; and Ajaam, A., 2017, “Conventional and High-Strength Hooked Bars—Part 1: Anchorage Tests,” ACI Structural Journal, V. 114, No. 1, Jan.-Feb., pp. 251-262
Zuo, J., and Darwin, D., 2000, “Splice Strength of Conventional and High Relative Rib Area Bars in Normal and High-Strength Concrete,” ACI Structural Journal, V. 97, No. 4, July-Aug., pp. 630-641.
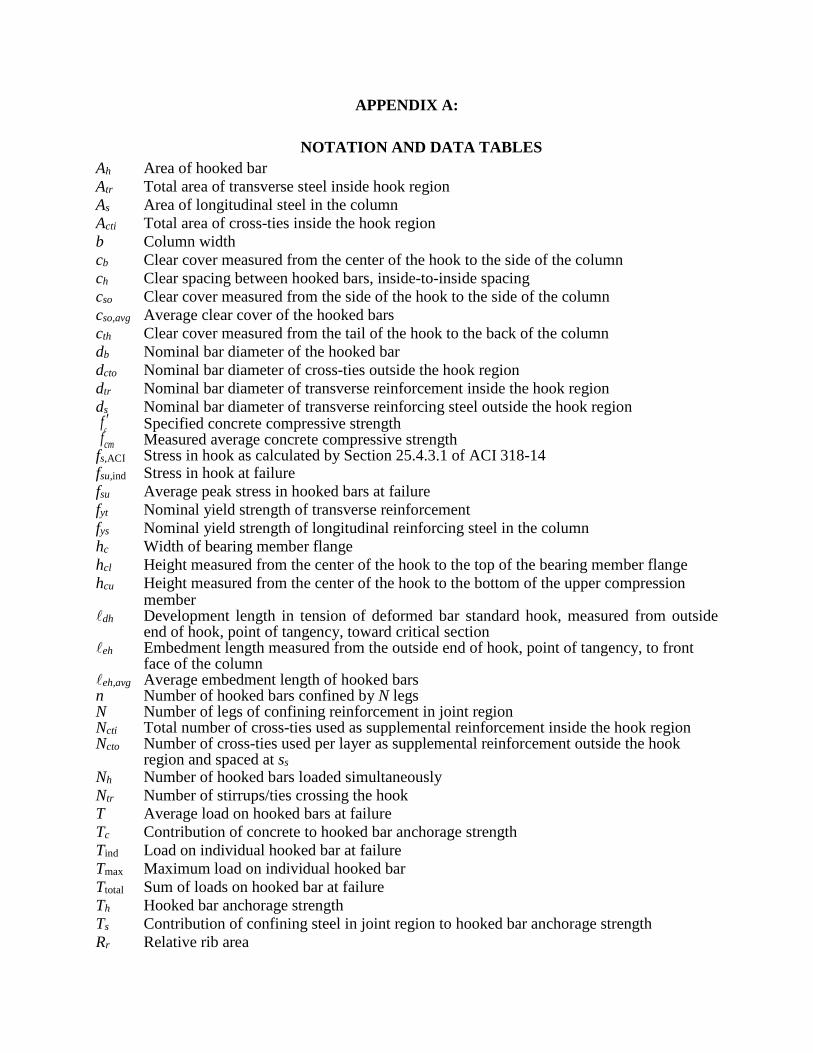
APPENDIX A:
NOTATION AND DATA TABLES Ah Area of hooked bar Atr Total area of transverse steel inside hook region As Area of longitudinal steel in the column Acti Total area of cross-ties inside the hook region b Column width cb Clear cover measured from the center of the hook to the side of the column ch Clear spacing between hooked bars, inside-to-inside spacing cso Clear cover measured from the side of the hook to the side of the column cso,avg Average clear cover of the hooked bars cth Clear cover measured from the tail of the hook to the back of the column db Nominal bar diameter of the hooked bar dcto Nominal bar diameter of cross-ties outside the hook region dtr Nominal bar diameter of transverse reinforcement inside the hook region ds Nominal bar diameter of transverse reinforcing steel outside the hook region
cf ′ Specified concrete compressive strength cmf Measured average concrete compressive strength
fs,ACI Stress in hook as calculated by Section 25.4.3.1 of ACI 318-14 fsu,ind Stress in hook at failure fsu Average peak stress in hooked bars at failure fyt Nominal yield strength of transverse reinforcement fys Nominal yield strength of longitudinal reinforcing steel in the column hc Width of bearing member flange hcl Height measured from the center of the hook to the top of the bearing member flange hcu Height measured from the center of the hook to the bottom of the upper compression
member dh Development length in tension of deformed bar standard hook, measured from outside
end of hook, point of tangency, toward critical section eh Embedment length measured from the outside end of hook, point of tangency, to front
face of the column eh,avg Average embedment length of hooked bars n Number of hooked bars confined by N legs N Number of legs of confining reinforcement in joint region Ncti Total number of cross-ties used as supplemental reinforcement inside the hook region Ncto Number of cross-ties used per layer as supplemental reinforcement outside the hook
region and spaced at ss Nh Number of hooked bars loaded simultaneously Ntr Number of stirrups/ties crossing the hook T Average load on hooked bars at failure Tc Contribution of concrete to hooked bar anchorage strength Tind Load on individual hooked bar at failure Tmax Maximum load on individual hooked bar Ttotal Sum of loads on hooked bar at failure Th Hooked bar anchorage strength Ts Contribution of confining steel in joint region to hooked bar anchorage strength Rr Relative rib area

scti Center-to-center spacing of cross-ties in the hook region str Center-to-center spacing of transverse reinforcement in the hook region ss Center-to-center spacing of stirrups/ties outside the hook region α Student’s t-test significance ψe Epoxy coating factor as defined in ACI 318-14 Section 25.4.3.2 ψc Factor for cover as defined in ACI 318-14 Section 25.4.3.2 ψr Factor for transverse reinforcement in the hook region ψo Factor for hooked bar location ψm Hooked bar spacing factor Failure types FP Front Pullout FB Front Blowout SS Side Splitting SB Side Blowout TK Tail Kickout FL Flexural Failure of column BY Yield of hooked bars Specimen identification (A@B) C-D-E-F#G-H-I-J-Kx(L) A Number of hooks in the specimen B Clear spacing between hooks in terms of bar diameter
(A@B = blank, indicates standard 2-hook specimen) C ASTM in.-lb bar size D Nominal compressive strength of concrete E Angle of bend F Number of bars used as transverse reinforcement within the hook region G ASTM in.-lb bar size of transverse reinforcement (if D#E = 0 = no transverse reinforcement) H Hooked bars placed inside (i) or outside (o) of longitudinal reinforcement I Nominal value of cso J Nominal value of cth K Nominal value of eh x Replication in a series, blank (or a), b, c, etc. L Replication not in a series
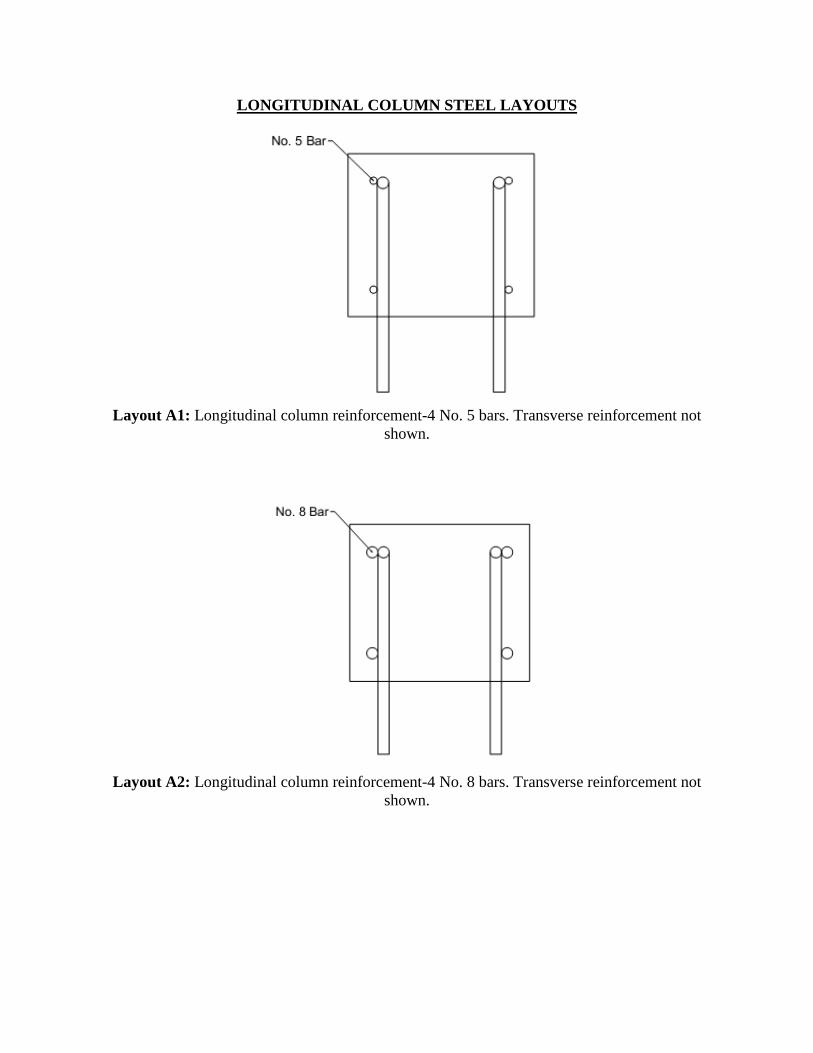
LONGITUDINAL COLUMN STEEL LAYOUTS
Layout A1: Longitudinal column reinforcement-4 No. 5 bars. Transverse reinforcement not
shown.
Layout A2: Longitudinal column reinforcement-4 No. 8 bars. Transverse reinforcement not
shown.

Layout A3: Longitudinal column reinforcement-5 No. 8 bars. Transverse reinforcement not
shown.
Layout A4: Longitudinal column reinforcement-6 No. 5 bars. Transverse reinforcement not
shown.

Layout A5: Longitudinal column reinforcement-5 No. 5 bars + 1 No. 3 bar. Transverse
reinforcement not shown.
Layout A6: Longitudinal column reinforcement-4 No. 8 bars + 2 No. 5 bars. Transverse
reinforcement not shown.
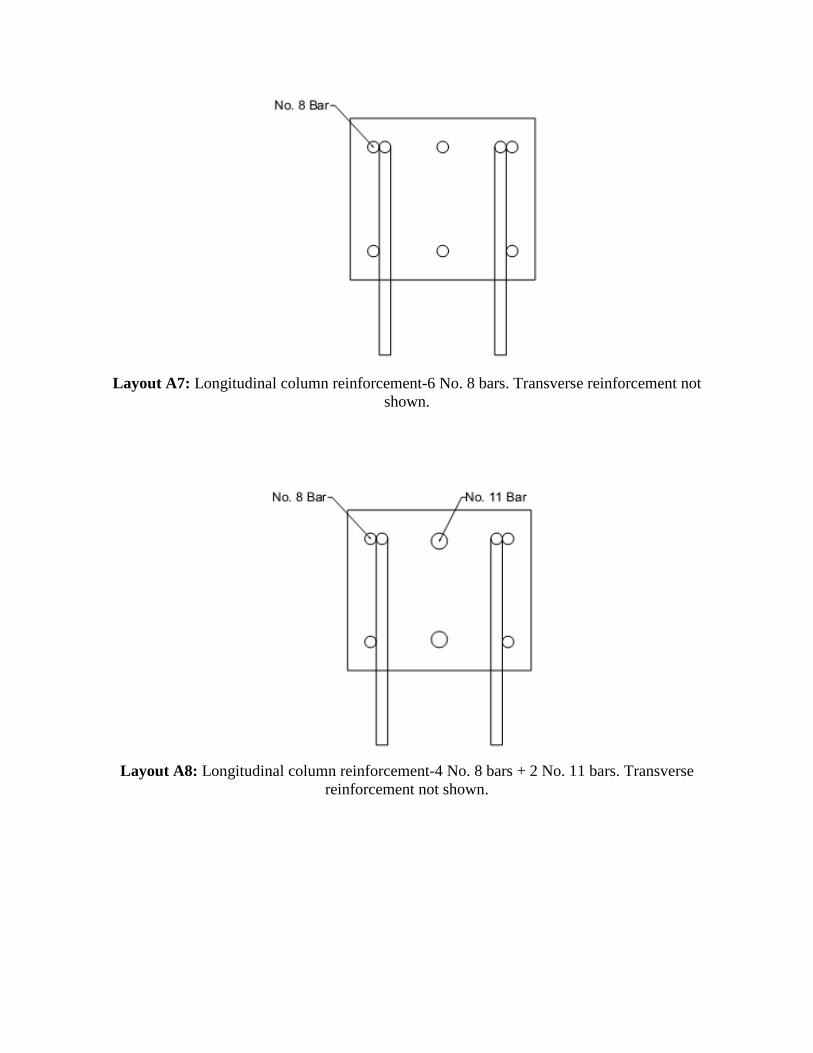
Layout A7: Longitudinal column reinforcement-6 No. 8 bars. Transverse reinforcement not
shown.
Layout A8: Longitudinal column reinforcement-4 No. 8 bars + 2 No. 11 bars. Transverse
reinforcement not shown.

Layout A9: Longitudinal column reinforcement-8 No. 5 bars. Transverse reinforcement not
shown.
Layout A10: Longitudinal column reinforcement-8 No. 8 bars (four bundles of two bars each).
Transverse reinforcement not shown.
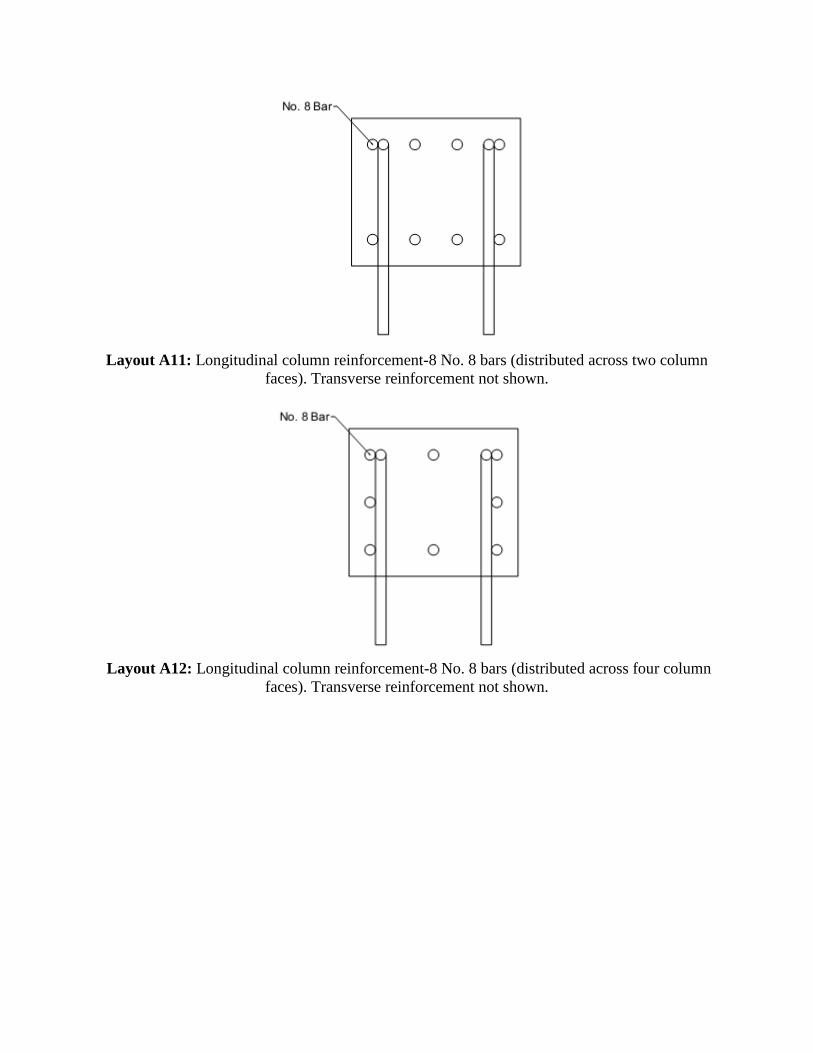
Layout A11: Longitudinal column reinforcement-8 No. 8 bars (distributed across two column
faces). Transverse reinforcement not shown.
Layout A12: Longitudinal column reinforcement-8 No. 8 bars (distributed across four column
faces). Transverse reinforcement not shown.
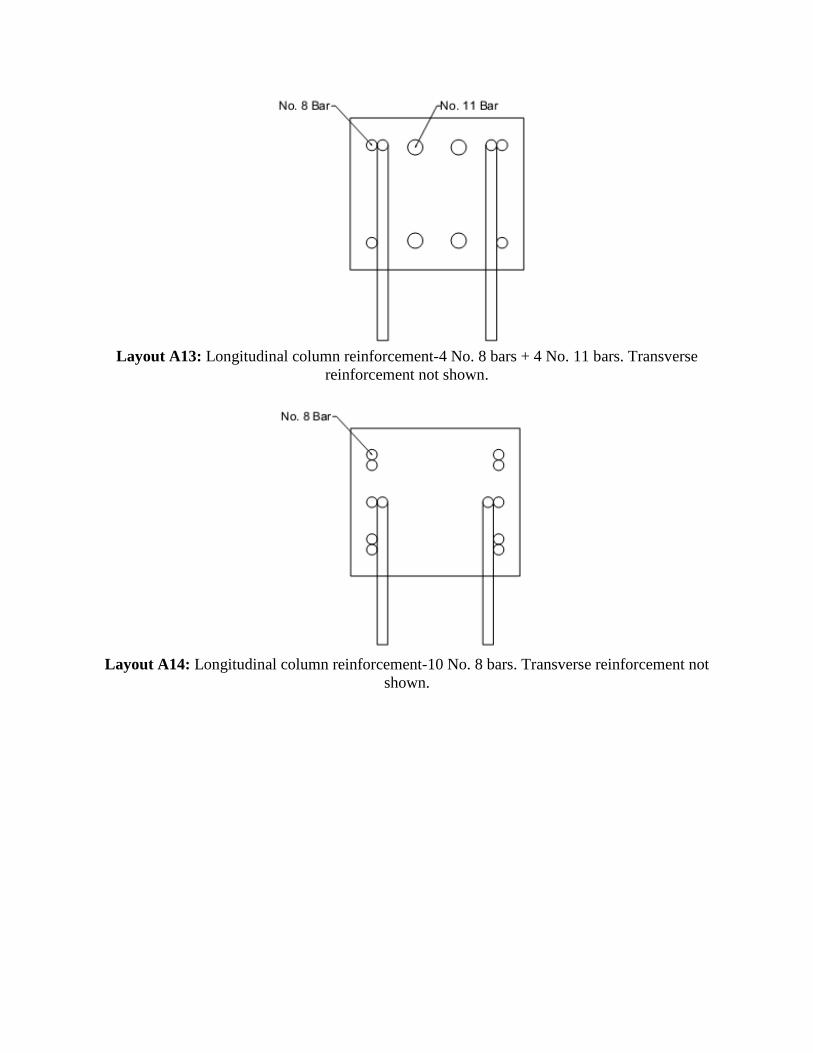
Layout A13: Longitudinal column reinforcement-4 No. 8 bars + 4 No. 11 bars. Transverse
reinforcement not shown.
Layout A14: Longitudinal column reinforcement-10 No. 8 bars. Transverse reinforcement not
shown.

Layout A15: Longitudinal column reinforcement-8 No. 8 bars + 2 No. 5 bars. Transverse
reinforcement not shown.
Layout A16: Longitudinal column reinforcement-12 No. 8 bars. Transverse reinforcement not
shown.
Note: In that tables that follow, 1 lb = 4.448 N, 1 psi = 0.006895 MPa, 1 in. = 25.4 mm

Table A.1 Comprehensive test results and data used in analysis for specimens without confining reinforcement
Specimen Hook Bend Angle
Trans. Reinf.
Orient.
Hook Bar
Type
eh eh,avg f'c Age db Rr b h hcl hc
in. in. psi days in. in. in. in. in.
1 5-5-90-0-i-2.5-2-10 A 90° - A1035 9.4 9.4 5230 6 0.6 0.073 13.1 12.3 5.25 8.375 B 9.4
2 5-5-90-0-i-2.5-2-7 A 90° - A1035 6.9 6.9 5190 7 0.6 0.073 13.0 9.6 5.25 8.375 B 7.0
3 5-8-90-0-i-2.5-2-6 A 90° - A615 6.8 6.8 8450 14 0.6 0.073 13.0 8.0 5.25 8.375 B 6.8
4 5-8-90-0-i-2.5-2-6(1) A 90° - A1035 6.1 6.3 9080 11 0.6 0.073 13.3 8.8 5.25 8.375 B 6.5
5 5-8-90-0-i-2.5-2-8 A 90° - A1035 8.0 7.8 8580 15 0.6 0.073 13.1 10.0 5.25 8.375 B 7.5
6 5-12-90-0-i-2.5-2-10 A 90° - A1035 10.0 10.5 10290 14 0.6 0.073 12.8 12.5 5.25 8.375 B 11.0
7 5-12-90-0-i-2.5-2-5 A 90° - A1035 5.1 4.9 11600 84 0.6 0.073 13.0 7.3 5.25 8.375 B 4.8
8 5-15-90-0-i-2.5-2-5.5 A 90° - A1035 6.1 5.9 15800 62 0.6 0.073 12.6 7.7 5.25 8.375 B 5.8
9 5-15-90-0-i-2.5-2-7.5 A 90° - A1035 7.3 7.3 15800 62 0.6 0.073 12.9 9.8 5.25 8.375 B 7.3
10 5-5-90-0-i-3.5-2-10 A 90° - A1035 10.5 10.4 5190 7 0.6 0.073 14.8 12.3 5.25 8.375 B 10.4
11 5-5-90-0-i-3.5-2-7 A 90° - A1035 7.5 7.6 5190 7 0.6 0.073 15.1 8.8 5.25 8.375 B 7.6
12 5-8-90-0-i-3.5-2-6 A 90° - A615 6.3 6.3 8580 15 0.6 0.073 15.0 8.0 5.38 8.375 B 6.4
13 5-8-90-0-i-3.5-2-6(1) A 90° - A1035 6.5 6.6 9300 13 0.6 0.073 15.6 8.6 5.25 8.375 B 6.6
14 5-8-90-0-i-3.5-2-8† A 90° - A1035 8.6 8.6 8380 13 0.6 0.060 15.5 10.0 5.25 8.375 B 8.5
15 5-12-90-0-i-3.5-2-5 A 90° - A1035 5.5 5.4 10410 15 0.6 0.073 15.5 7.2 5.25 8.375 B 5.4
16 5-12-90-0-i-3.5-2-10 A 90° - A1035 10.1 10.1 11600 84 0.6 0.073 15.0 12.1 5.25 8.375 B 10.0
17 5-8-180-0-i-2.5-2-7 A 180° - A1035 7.4 7.3 9080 11 0.6 0.073 12.6 9.5 5.25 8.375 B 7.1
18 5-8-180-0-i-3.5-2-7 A 180° - A1035 7.4 7.3 9080 11 0.6 0.073 15.4 9.3 5.25 8.375 B 7.3
19 8-5-90-0-i-2.5-2-16 A 90° - A1035b 16.0 16.4 4980 7 1 0.078 17.0 17.9 10.5 8.375 B 16.8
20 8-5-90-0-i-2.5-2-9.5 A 90° - A615 9.0 9.6 5140 8 1 0.078 16.8 12.0 10.5 8.375 B 10.3
21 8-5-90-0-i-2.5-2-12.5 A 90° - A615 13.3 13.3 5240 9 1 0.078 17.3 14.5 10.5 8.375 B 13.3
22 8-5-90-0-i-2.5-2-18 A 90° - A1035b 19.5 18.7 5380 11 1 0.078 17.5 20.3 10.5 8.375 B 17.9
23 8-5-90-0-i-2.5-2-13 A 90° - A1035b 13.3 13.4 5560 11 1 0.078 16.8 15.3 10.5 8.375 B 13.5
24 8-5-90-0-i-2.5-2-15(1) A 90° - A1035b 14.5 14.9 5910 14 1 0.073 16.7 17.3 10.5 8.375 B 15.3
25 8-5-90-0-i-2.5-2-15 A 90° - A1035b 15.3 14.8 6210 8 1 0.073 16.6 17.3 10.5 8.375 B 14.4 a Heat 1, b Heat 2, c Heat 3 as described in Table 2.3

Table A.2 Cont. Comprehensive test results and data used in analysis for specimens without confining reinforcement
Hook cso cso,avg cth ch Nh Axial Load Long.
Reinf. Layouto
Tmax Tind Ttotal T Th fsu,max fsu
in. in. in. in. kips lb lb lb lb lb psi psi
1 A 2.8 2.7 2.9 6.4 2 30 A4 37404 34303 67166 33583 33080 120656 108333 B 2.6 2.9 32864 32864 106012
2 A 2.5 2.5 2.8 6.8 2 30 A1 26607 26607 52529 26265 23988 85831 84724 B 2.5 2.6 26095 25922 84176
3 A 2.8 2.7 1.3 6.4 2 80 A1 27578 27102 59140 29570 26839 88961 95387 B 2.6 1.3 32135 32038 103663
4 A 2.5 2.5 2.6 7.0 2 30 A1 21741 21741 44849 22425 25525 70131 72338 B 2.5 2.3 24995 23109 80630
5 A 2.5 2.6 2.0 6.6 2 80 A1 31878 31469 63347 31673 31209 102831 102172 B 2.8 2.5 35934 31878 115915
6 A 2.4 2.4 2.5 6.6 2 30 A4 40823 40823 83314 41657 45391 131688 134377 B 2.5 1.5 42491 42491 137066
7 A 2.6 2.6 2.1 6.5 2 30 A1 19389 19389 38441 19220 21121 62546 62001 B 2.6 2.5 23171 19051 74745
8 A 2.4 2.4 1.6 6.6 2 30 A1 36163 32648 65021 32511 28089 116656 104873 B 2.4 1.9 32373 32373 104430
9 A 2.5 2.5 2.6 6.6 2 30 A2 42470 42464 84441 42221 34712 137001 136196 B 2.5 2.6 41977 41977 135410
10 A 3.5 3.5 1.8 6.5 2 30 A4 43228 43228 83855 41927 36985 139446 135250 B 3.5 1.9 41140 40626 132710
11 A 3.4 3.4 1.3 7.0 2 30 A1 27197 27197 53033 26516 26284 87732 85537 B 3.5 1.1 25884 25836 83498
12 A 3.6 3.6 1.8 6.6 2 80 A1 25129 25129 50950 25475 25110 81060 82178 B 3.5 1.6 29054 25822 93723
13 A 3.8 3.8 2.1 6.9 2 30 A1 24440 24440 49083 24541 26783 78838 79166 B 3.8 1.9 27541 24643 88842
14 A 3.6 3.6 1.4 7.1 2 80 A1 39109 31179 65490 32745 34452 126159 105629 B 3.5 1.5 34311 34311 110679
15 A 3.6 3.6 1.7 7.0 2 30 A1 22045 22040 44241 22121 22672 71114 71357 B 3.6 1.8 23158 22201 74702
16 A 3.5 3.5 2.5 6.8 2 30 A4 46085 46016 90864 45432 44924 148661 146556 B 3.5 1.5 46076 44849 148631
17 A 2.5 2.6 2.1 6.3 2 30 A1 26722 26722 54217 27108 29561 86199 87446 B 2.6 2.4 35215 27495 113596
18 A 3.6 3.5 1.9 7.1 2 30 A1 34057 30094 61508 30754 29831 109860 99206 B 3.4 2.0 31441 31414 101422
19 A 2.8 2.8 1.8 9.5 2 80 A2 83310 83310 166479 83239 75922 105455 105366 B 2.8 1.4 86063 83169 108940
20 A 2.8 2.6 3.0 9.5 2 80 A2 44627 44627 88971 44485 43624 56489 56311 B 2.5 1.8 65800 44344 83291
21 A 2.8 2.8 1.3 9.8 2 80 A2 65254 65254 131639 65819 61559 82600 83316 B 2.8 1.3 69872 66385 88446
22 A 2.5 2.5 0.8 10.5 2 30 A6 100169 82023 161763 80881 89312 126796 102381 B 2.5 2.4 79805 79740 101018
23 A 2.5 2.5 2.0 9.8 2 30 A2 73143 65881 131078 65539 63253 92586 82960 B 2.5 1.8 65197 65197 82527
24 A 2.5 2.5 2.8 9.6 2 30 A2 64532 64532 127534 63767 72061 81686 80718 B 2.6 2.0 87275 63002 110475
25 A 2.5 2.6 2.0 9.5 2 30 A2 76256 76162 150955 75478 72778 96527 95541 B 2.6 2.9 80724 74793 102182 º Longitudinal column configurations shown in Appendix A, Layouts A1 – A16
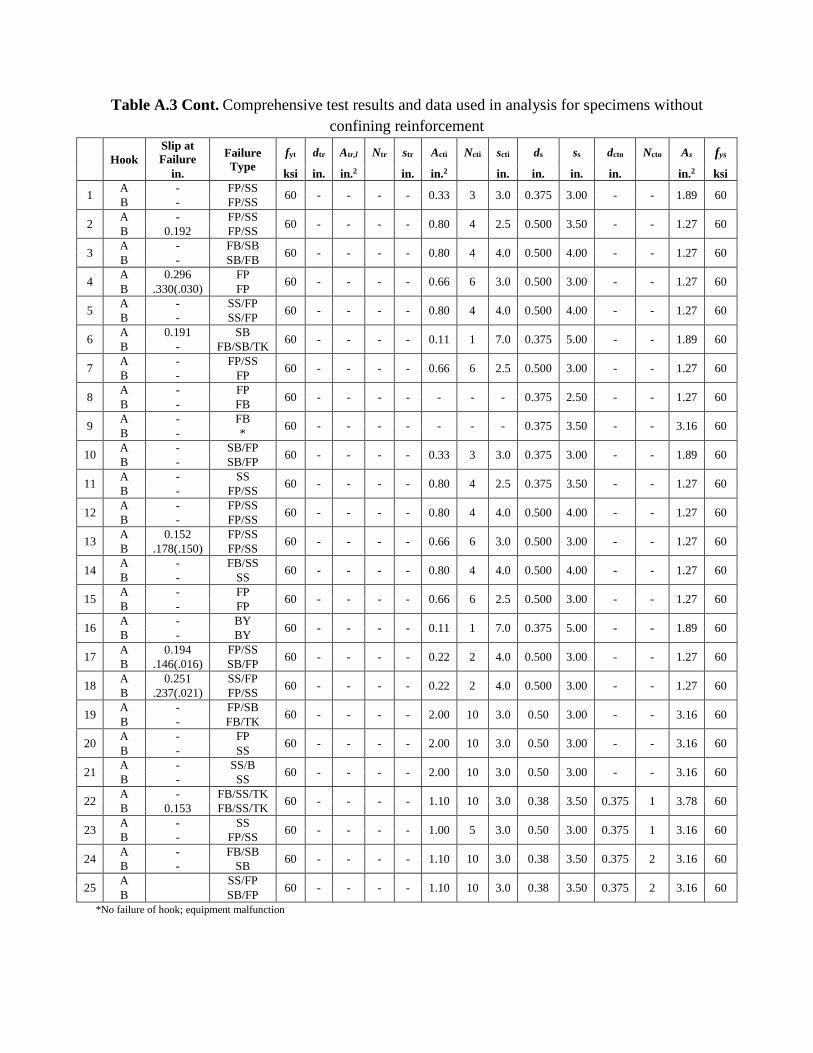
Table A.3 Cont. Comprehensive test results and data used in analysis for specimens without confining reinforcement
Hook Slip at Failure Failure
Type fyt dtr Atr,l Ntr str Acti Ncti scti ds ss dcto Ncto As fys
in. ksi in. in.2 in. in.2 in. in. in. in. in.2 ksi
1 A - FP/SS 60 - - - - 0.33 3 3.0 0.375 3.00 - - 1.89 60 B - FP/SS
2 A - FP/SS 60 - - - - 0.80 4 2.5 0.500 3.50 - - 1.27 60 B 0.192 FP/SS
3 A - FB/SB 60 - - - - 0.80 4 4.0 0.500 4.00 - - 1.27 60 B - SB/FB
4 A 0.296 FP 60 - - - - 0.66 6 3.0 0.500 3.00 - - 1.27 60 B .330(.030) FP
5 A - SS/FP 60 - - - - 0.80 4 4.0 0.500 4.00 - - 1.27 60 B - SS/FP
6 A 0.191 SB 60 - - - - 0.11 1 7.0 0.375 5.00 - - 1.89 60 B - FB/SB/TK
7 A - FP/SS 60 - - - - 0.66 6 2.5 0.500 3.00 - - 1.27 60 B - FP
8 A - FP 60 - - - - - - - 0.375 2.50 - - 1.27 60 B - FB
9 A - FB 60 - - - - - - - 0.375 3.50 - - 3.16 60 B - *
10 A - SB/FP 60 - - - - 0.33 3 3.0 0.375 3.00 - - 1.89 60 B - SB/FP
11 A - SS 60 - - - - 0.80 4 2.5 0.375 3.50 - - 1.27 60 B - FP/SS
12 A - FP/SS 60 - - - - 0.80 4 4.0 0.500 4.00 - - 1.27 60 B - FP/SS
13 A 0.152 FP/SS 60 - - - - 0.66 6 3.0 0.500 3.00 - - 1.27 60 B .178(.150) FP/SS
14 A - FB/SS 60 - - - - 0.80 4 4.0 0.500 4.00 - - 1.27 60 B - SS
15 A - FP 60 - - - - 0.66 6 2.5 0.500 3.00 - - 1.27 60 B - FP
16 A - BY 60 - - - - 0.11 1 7.0 0.375 5.00 - - 1.89 60 B - BY
17 A 0.194 FP/SS 60 - - - - 0.22 2 4.0 0.500 3.00 - - 1.27 60 B .146(.016) SB/FP
18 A 0.251 SS/FP 60 - - - - 0.22 2 4.0 0.500 3.00 - - 1.27 60 B .237(.021) FP/SS
19 A - FP/SB 60 - - - - 2.00 10 3.0 0.50 3.00 - - 3.16 60 B - FB/TK
20 A - FP 60 - - - - 2.00 10 3.0 0.50 3.00 - - 3.16 60 B - SS
21 A - SS/B 60 - - - - 2.00 10 3.0 0.50 3.00 - - 3.16 60 B - SS
22 A - FB/SS/TK 60 - - - - 1.10 10 3.0 0.38 3.50 0.375 1 3.78 60 B 0.153 FB/SS/TK
23 A - SS 60 - - - - 1.00 5 3.0 0.50 3.00 0.375 1 3.16 60 B - FP/SS
24 A - FB/SB 60 - - - - 1.10 10 3.0 0.38 3.50 0.375 2 3.16 60 B - SB
25 A SS/FP 60 - - - - 1.10 10 3.0 0.38 3.50 0.375 2 3.16 60 B SB/FP *No failure of hook; equipment malfunction

Table A.1 Cont. Comprehensive test results and data used in analysis for specimens without confining reinforcement
Specimen Hook Bend Angle
Trans. Reinf.
Orient.
Hook Bar
Type
eh eh,avg f'c Age db Rr b h hcl hc
in. in. psi days in. in. in. in. in.
26 (2@3) 8-5-90-0-i-2.5-2-10‡ A 90° - A615 10.4 10.5 4490 10 1 0.073 9.0 12.0 10.5 8.375 B 10.6
27 (2@5) 8-5-90-0-i-2.5-2-10‡ A 90° - A615 10.1 10.1 4490 10 1 0.073 10.9 12.0 10.5 8.375 B 10.1
28 8-8-90-0-i-2.5-2-8 A 90° - A1035b 8.9 8.4 7910 15 1 0.078 16.3 10.0 10.5 8.375 B 8.0
29 8-8-90-0-i-2.5-2-10 A 90° - A1035b 9.8 9.6 7700 14 1 0.078 16.6 12.0 10.5 8.375 B 9.5
30 8-8-90-0-i-2.5-2-8(1) A 90° - A1035b 8.0 8.0 8780 13 1 0.078 17.0 10.8 10.5 8.375 B 8.0
31 8-8-90-0-i-2.5sc-2tc-9‡ A 90° - A615 9.5 9.5 7710 25 1 0.073 17.3 11.0 10.5 8.375 B 9.5
32 8-12-90-0-i-2.5-2-9 A 90° - A1035b 9.0 9.0 11160 77 1 0.078 17.0 11.4 10.5 8.375 B 9.0
33 8-12-90-0-i-2.5-2-12.5 A 90° - A1035c 12.9 12.8 11850 39 1 0.073 17.4 14.6 10.5 8.375 B 12.8
34 8-12-90-0-i-2.5-2-12 A 90° - A1035c 12.1 12.1 11760 34 1 0.073 16.8 14.0 10.5 8.375 B 12.1
35 8-15-90-0-i-2.5-2-8.5 A 90° - A1035c 8.8 8.8 15800 61 1 0.073 17.0 10.8 10.5 8.375 B 8.9
36 8-15-90-0-i-2.5-2-13 A 90° - A1035c 12.8 12.8 15800 61 1 0.073 16.8 14.8 10.5 8.375 B 12.8
37 8-5-90-0-i-3.5-2-18 A 90° - A1035b 19.0 18.5 5380 11 1 0.078 18.5 20.4 10.5 8.375 B 18.0
38 8-5-90-0-i-3.5-2-13 A 90° - A1035b 13.4 13.4 5560 11 1 0.078 18.4 15.3 10.5 8.375 B 13.4
39 8-5-90-0-i-3.5-2-15(2) A 90° - A1035c 15.6 15.3 5180 8 1 0.073 18.5 17.3 10.5 8.375 B 14.9
40 8-5-90-0-i-3.5-2-15(1) A 90° - A1035c 15.4 15.3 6440 9 1 0.073 18.8 17.1 10.5 8.375 B 15.1
41 8-8-90-0-i-3.5-2-8(1) A 90° - A1035b 7.8 7.8 7910 15 1 0.078 18.3 10.0 10.5 8.375 B 7.8
42 8-8-90-0-i-3.5-2-10 A 90° - A1035b 8.8 9.8 7700 14 1 0.078 18.5 12.0 10.5 8.375 B 10.8
43 8-8-90-0-i-3.5-2-8(2) A 90° - A1035b 8.5 8.3 8780 13 1 0.078 19.4 10.6 10.5 8.375 B 8.0
44 8-12-90-0-i-3.5-2-9 A 90° - A1035b 9.0 9.0 11160 77 1 0.078 19.0 11.3 10.5 8.375 B 9.0
45 8-8-90-0-i-4-2-8 A 90° - A1035b 7.6 7.8 8740 12 1 0.078 19.9 10.5 10.5 8.375 B 8.0
46 8-5-180-0-i-2.5-2-11 A 180° - A615 11.0 11.0 4550 7 1 0.078 17.5 13.0 10.5 8.375 B 11.0
47 8-5-180-0-i-2.5-2-14 A 180° - A1035b 14.0 14.0 4840 8 1 0.078 17.1 16.0 10.5 8.375 B 14.0
48 8-8-180-0-i-2.5-2-11.5 A 180° - A1035b 9.3 9.3 8630 11 1 0.078 17.5 13.8 10.5 8.375 B 9.3
49 8-12-180-0-i-2.5-2-12.5 A 180° - A1035c 12.8 12.6 11850 39 1 0.073 17.1 14.9 10.5 8.375 B 12.5
50 8-5-180-0-i-3.5-2-11 A 180° - A615 11.6 11.6 4550 7 1 0.078 19.5 13.0 10.5 8.375 B 11.6 ‡ Specimen contained A1035 Grade 120 for column longitudinal steel a Heat 1, b Heat 2, c Heat 3 as described in Table 2.3
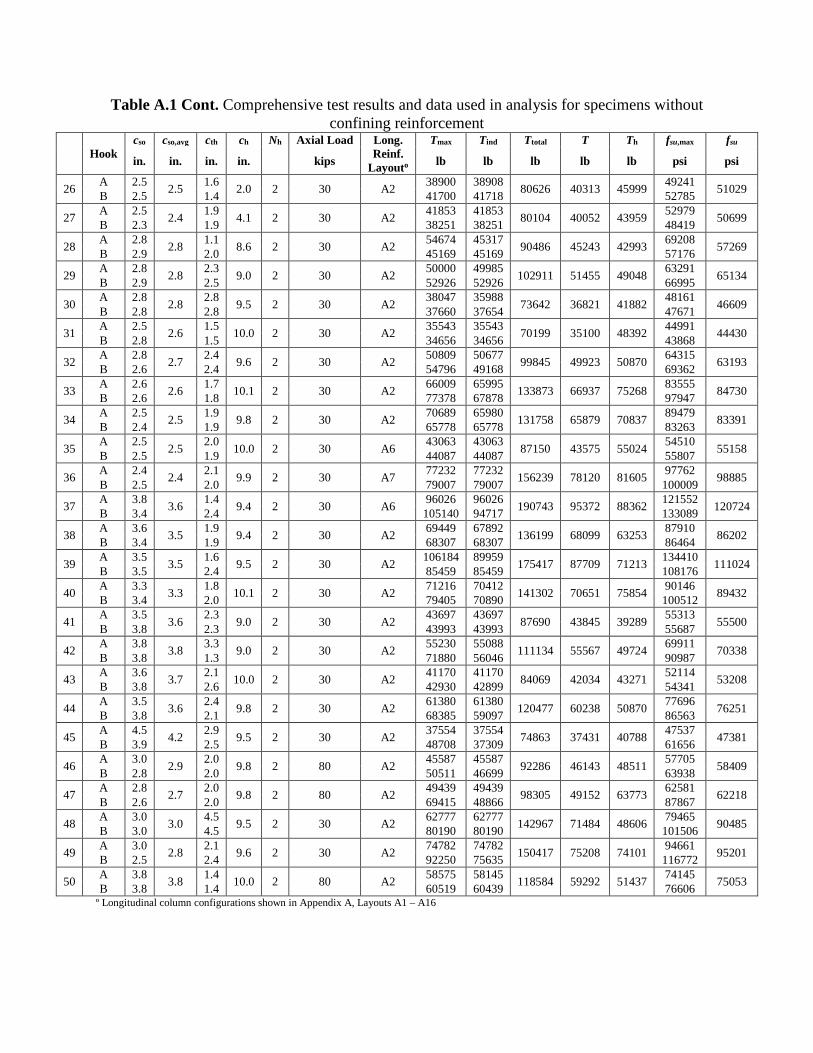
Table A.1 Cont. Comprehensive test results and data used in analysis for specimens without confining reinforcement
Hook cso cso,avg cth ch Nh Axial Load Long.
Reinf. Layouto
Tmax Tind Ttotal T Th fsu,max fsu
in. in. in. in. kips lb lb lb lb lb psi psi
26 A 2.5 2.5 1.6 2.0 2 30 A2 38900 38908 80626 40313 45999 49241 51029 B 2.5 1.4 41700 41718 52785
27 A 2.5 2.4 1.9 4.1 2 30 A2 41853 41853 80104 40052 43959 52979 50699 B 2.3 1.9 38251 38251 48419
28 A 2.8 2.8 1.1 8.6 2 30 A2 54674 45317 90486 45243 42993 69208 57269 B 2.9 2.0 45169 45169 57176
29 A 2.8 2.8 2.3 9.0 2 30 A2 50000 49985 102911 51455 49048 63291 65134 B 2.9 2.5 52926 52926 66995
30 A 2.8 2.8 2.8 9.5 2 30 A2 38047 35988 73642 36821 41882 48161 46609 B 2.8 2.8 37660 37654 47671
31 A 2.5 2.6 1.5 10.0 2 30 A2 35543 35543 70199 35100 48392 44991 44430 B 2.8 1.5 34656 34656 43868
32 A 2.8 2.7 2.4 9.6 2 30 A2 50809 50677 99845 49923 50870 64315 63193 B 2.6 2.4 54796 49168 69362
33 A 2.6 2.6 1.7 10.1 2 30 A2 66009 65995 133873 66937 75268 83555 84730 B 2.6 1.8 77378 67878 97947
34 A 2.5 2.5 1.9 9.8 2 30 A2 70689 65980 131758 65879 70837 89479 83391 B 2.4 1.9 65778 65778 83263
35 A 2.5 2.5 2.0 10.0 2 30 A6 43063 43063 87150 43575 55024 54510 55158 B 2.5 1.9 44087 44087 55807
36 A 2.4 2.4 2.1 9.9 2 30 A7 77232 77232 156239 78120 81605 97762 98885 B 2.5 2.0 79007 79007 100009
37 A 3.8 3.6 1.4 9.4 2 30 A6 96026 96026 190743 95372 88362 121552 120724 B 3.4 2.4 105140 94717 133089
38 A 3.6 3.5 1.9 9.4 2 30 A2 69449 67892 136199 68099 63253 87910 86202 B 3.4 1.9 68307 68307 86464
39 A 3.5 3.5 1.6 9.5 2 30 A2 106184 89959 175417 87709 71213 134410 111024 B 3.5 2.4 85459 85459 108176
40 A 3.3 3.3 1.8 10.1 2 30 A2 71216 70412 141302 70651 75854 90146 89432 B 3.4 2.0 79405 70890 100512
41 A 3.5 3.6 2.3 9.0 2 30 A2 43697 43697 87690 43845 39289 55313 55500 B 3.8 2.3 43993 43993 55687
42 A 3.8 3.8 3.3 9.0 2 30 A2 55230 55088 111134 55567 49724 69911 70338 B 3.8 1.3 71880 56046 90987
43 A 3.6 3.7 2.1 10.0 2 30 A2 41170 41170 84069 42034 43271 52114 53208 B 3.8 2.6 42930 42899 54341
44 A 3.5 3.6 2.4 9.8 2 30 A2 61380 61380 120477 60238 50870 77696 76251 B 3.8 2.1 68385 59097 86563
45 A 4.5 4.2 2.9 9.5 2 30 A2 37554 37554 74863 37431 40788 47537 47381 B 3.9 2.5 48708 37309 61656
46 A 3.0 2.9 2.0 9.8 2 80 A2 45587 45587 92286 46143 48511 57705 58409 B 2.8 2.0 50511 46699 63938
47 A 2.8 2.7 2.0 9.8 2 80 A2 49439 49439 98305 49152 63773 62581 62218 B 2.6 2.0 69415 48866 87867
48 A 3.0 3.0 4.5 9.5 2 30 A2 62777 62777 142967 71484 48606 79465 90485 B 3.0 4.5 80190 80190 101506
49 A 3.0 2.8 2.1 9.6 2 30 A2 74782 74782 150417 75208 74101 94661 95201 B 2.5 2.4 92250 75635 116772
50 A 3.8 3.8 1.4 10.0 2 80 A2 58575 58145 118584 59292 51437 74145 75053 B 3.8 1.4 60519 60439 76606 º Longitudinal column configurations shown in Appendix A, Layouts A1 – A16
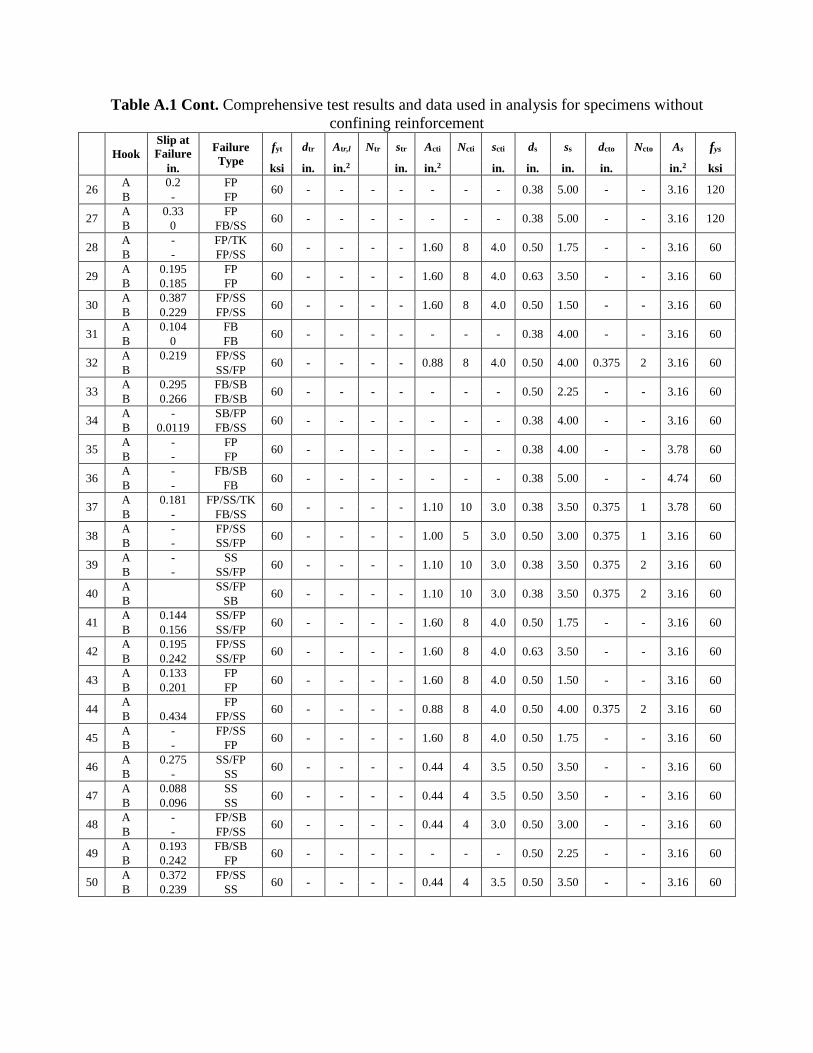
Table A.1 Cont. Comprehensive test results and data used in analysis for specimens without confining reinforcement
Hook Slip at Failure Failure
Type fyt dtr Atr,l Ntr str Acti Ncti scti ds ss dcto Ncto As fys
in. ksi in. in.2 in. in.2 in. in. in. in. in.2 ksi
26 A 0.2 FP 60 - - - - - - - 0.38 5.00 - - 3.16 120 B - FP
27 A 0.33 FP 60 - - - - - - - 0.38 5.00 - - 3.16 120 B 0 FB/SS
28 A - FP/TK 60 - - - - 1.60 8 4.0 0.50 1.75 - - 3.16 60 B - FP/SS
29 A 0.195 FP 60 - - - - 1.60 8 4.0 0.63 3.50 - - 3.16 60 B 0.185 FP
30 A 0.387 FP/SS 60 - - - - 1.60 8 4.0 0.50 1.50 - - 3.16 60 B 0.229 FP/SS
31 A 0.104 FB 60 - - - - - - - 0.38 4.00 - - 3.16 60 B 0 FB
32 A 0.219 FP/SS 60 - - - - 0.88 8 4.0 0.50 4.00 0.375 2 3.16 60 B SS/FP
33 A 0.295 FB/SB 60 - - - - - - - 0.50 2.25 - - 3.16 60 B 0.266 FB/SB
34 A - SB/FP 60 - - - - - - - 0.38 4.00 - - 3.16 60 B 0.0119 FB/SS
35 A - FP 60 - - - - - - - 0.38 4.00 - - 3.78 60 B - FP
36 A - FB/SB 60 - - - - - - - 0.38 5.00 - - 4.74 60 B - FB
37 A 0.181 FP/SS/TK 60 - - - - 1.10 10 3.0 0.38 3.50 0.375 1 3.78 60 B - FB/SS
38 A - FP/SS 60 - - - - 1.00 5 3.0 0.50 3.00 0.375 1 3.16 60 B - SS/FP
39 A - SS 60 - - - - 1.10 10 3.0 0.38 3.50 0.375 2 3.16 60 B - SS/FP
40 A SS/FP 60 - - - - 1.10 10 3.0 0.38 3.50 0.375 2 3.16 60 B SB
41 A 0.144 SS/FP 60 - - - - 1.60 8 4.0 0.50 1.75 - - 3.16 60 B 0.156 SS/FP
42 A 0.195 FP/SS 60 - - - - 1.60 8 4.0 0.63 3.50 - - 3.16 60 B 0.242 SS/FP
43 A 0.133 FP 60 - - - - 1.60 8 4.0 0.50 1.50 - - 3.16 60 B 0.201 FP
44 A FP 60 - - - - 0.88 8 4.0 0.50 4.00 0.375 2 3.16 60 B 0.434 FP/SS
45 A - FP/SS 60 - - - - 1.60 8 4.0 0.50 1.75 - - 3.16 60 B - FP
46 A 0.275 SS/FP 60 - - - - 0.44 4 3.5 0.50 3.50 - - 3.16 60 B - SS
47 A 0.088 SS 60 - - - - 0.44 4 3.5 0.50 3.50 - - 3.16 60 B 0.096 SS
48 A - FP/SB 60 - - - - 0.44 4 3.0 0.50 3.00 - - 3.16 60 B - FP/SS
49 A 0.193 FB/SB 60 - - - - - - - 0.50 2.25 - - 3.16 60 B 0.242 FP
50 A 0.372 FP/SS 60 - - - - 0.44 4 3.5 0.50 3.50 - - 3.16 60 B 0.239 SS
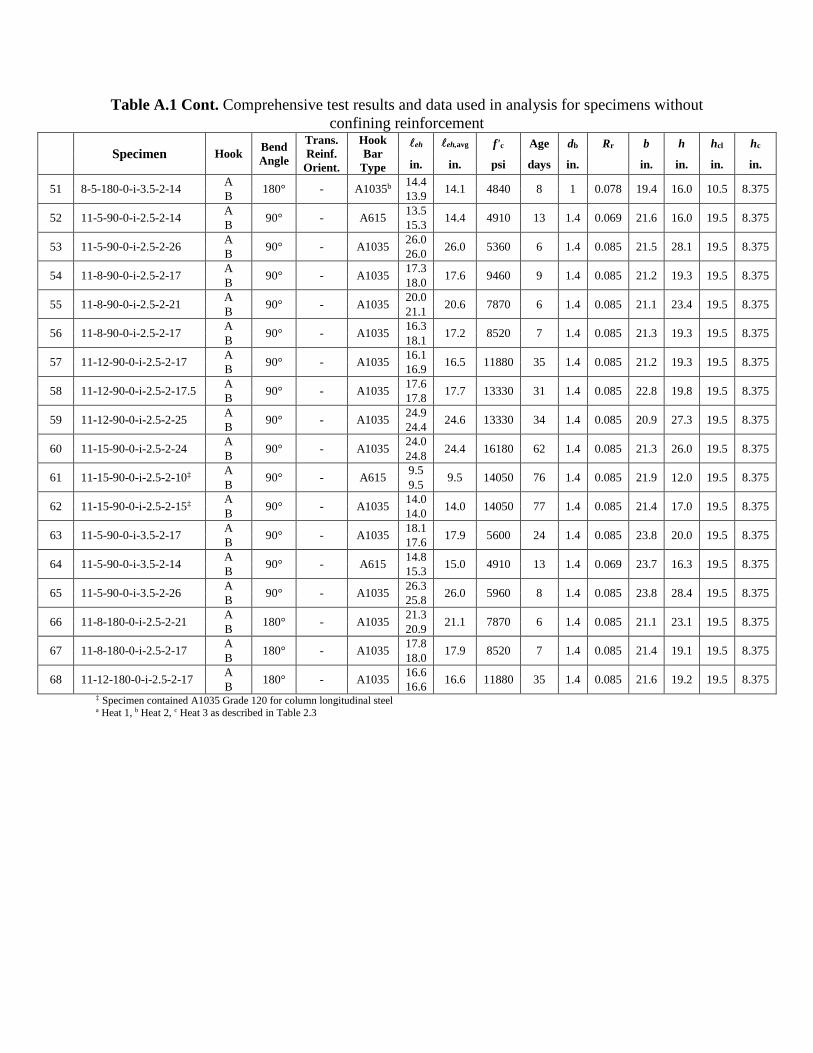
Table A.1 Cont. Comprehensive test results and data used in analysis for specimens without confining reinforcement
Specimen Hook Bend Angle
Trans. Reinf.
Orient.
Hook Bar
Type
eh eh,avg f'c Age db Rr b h hcl hc
in. in. psi days in. in. in. in. in.
51 8-5-180-0-i-3.5-2-14 A 180° - A1035b 14.4 14.1 4840 8 1 0.078 19.4 16.0 10.5 8.375 B 13.9
52 11-5-90-0-i-2.5-2-14 A 90° - A615 13.5 14.4 4910 13 1.4 0.069 21.6 16.0 19.5 8.375 B 15.3
53 11-5-90-0-i-2.5-2-26 A 90° - A1035 26.0 26.0 5360 6 1.4 0.085 21.5 28.1 19.5 8.375 B 26.0
54 11-8-90-0-i-2.5-2-17 A 90° - A1035 17.3 17.6 9460 9 1.4 0.085 21.2 19.3 19.5 8.375 B 18.0
55 11-8-90-0-i-2.5-2-21 A 90° - A1035 20.0 20.6 7870 6 1.4 0.085 21.1 23.4 19.5 8.375 B 21.1
56 11-8-90-0-i-2.5-2-17 A 90° - A1035 16.3 17.2 8520 7 1.4 0.085 21.3 19.3 19.5 8.375 B 18.1
57 11-12-90-0-i-2.5-2-17 A 90° - A1035 16.1 16.5 11880 35 1.4 0.085 21.2 19.3 19.5 8.375 B 16.9
58 11-12-90-0-i-2.5-2-17.5 A 90° - A1035 17.6 17.7 13330 31 1.4 0.085 22.8 19.8 19.5 8.375 B 17.8
59 11-12-90-0-i-2.5-2-25 A 90° - A1035 24.9 24.6 13330 34 1.4 0.085 20.9 27.3 19.5 8.375 B 24.4
60 11-15-90-0-i-2.5-2-24 A 90° - A1035 24.0 24.4 16180 62 1.4 0.085 21.3 26.0 19.5 8.375 B 24.8
61 11-15-90-0-i-2.5-2-10‡ A 90° - A615 9.5 9.5 14050 76 1.4 0.085 21.9 12.0 19.5 8.375 B 9.5
62 11-15-90-0-i-2.5-2-15‡ A 90° - A1035 14.0 14.0 14050 77 1.4 0.085 21.4 17.0 19.5 8.375 B 14.0
63 11-5-90-0-i-3.5-2-17 A 90° - A1035 18.1 17.9 5600 24 1.4 0.085 23.8 20.0 19.5 8.375 B 17.6
64 11-5-90-0-i-3.5-2-14 A 90° - A615 14.8 15.0 4910 13 1.4 0.069 23.7 16.3 19.5 8.375 B 15.3
65 11-5-90-0-i-3.5-2-26 A 90° - A1035 26.3 26.0 5960 8 1.4 0.085 23.8 28.4 19.5 8.375 B 25.8
66 11-8-180-0-i-2.5-2-21 A 180° - A1035 21.3 21.1 7870 6 1.4 0.085 21.1 23.1 19.5 8.375 B 20.9
67 11-8-180-0-i-2.5-2-17 A 180° - A1035 17.8 17.9 8520 7 1.4 0.085 21.4 19.1 19.5 8.375 B 18.0
68 11-12-180-0-i-2.5-2-17 A 180° - A1035 16.6 16.6 11880 35 1.4 0.085 21.6 19.2 19.5 8.375 B 16.6 ‡ Specimen contained A1035 Grade 120 for column longitudinal steel a Heat 1, b Heat 2, c Heat 3 as described in Table 2.3

Table A.1 Cont. Comprehensive test results and data used in analysis for specimens without confining reinforcement
Hook cso cso,avg cth ch Nh Axial Load Long.
Reinf. Layouto
Tmax Tind Ttotal T Th fsu,max fsu
in. in. in. in. kips lb lb lb lb lb psi psi
51 A 3.9 3.8 1.6 9.8 2 80 A2 63745 63689 127009 63504 64377 80690 80385 B 3.8 2.1 78050 63320 98797
52 A 2.8 2.8 2.5 13.3 2 97 A7 67249 67249 133180 66590 79286 43108 42686 B 2.8 0.8 81430 65931 52199
53 A 2.5 2.7 2.1 13.3 2 169 A12 165682 150653 297454 148727 152421 106206 95338 B 2.9 2.1 146801 146801 94103
54 A 2.5 2.5 2.0 13.4 2 114 A16 131998 131969 264111 132055 119020 84614 84651 B 2.5 1.3 141233 132141 90534
55 A 2.5 2.6 3.4 13.0 2 138 A13 127061 127061 250252 125126 132865 81449 80209 B 2.8 2.3 147904 123191 94810
56 A 2.5 2.5 3.0 13.5 2 115 A8 105626 105537 209557 104779 112427 67709 67166 B 2.5 1.1 115172 104020 73828
57 A 2.5 2.6 3.1 13.3 2 114 A13 148361 148361 268741 134371 118562 95103 86135 B 2.6 2.4 120380 120380 77167
58 A 3.8 3.1 2.1 13.8 2 126 A7 125648 125648 249245 124622 131960 80544 79886 B 2.5 2.0 123622 123597 79245
59 A 2.5 2.5 2.4 13.1 2 160 A12 205050 201395 399486 199743 187403 131443 128040 B 2.5 2.9 198110 198091 126994
60 A 2.5 2.5 2.0 13.5 2 155 A11 212601 212601 426530 213265 196102 136283 136708 B 2.5 1.3 231323 213928 148284
61 A 2.8 2.7 2.5 13.6 2 74 A15 52097 52097 102962 51481 69331 33395 33001 B 2.7 2.5 50882 50866 32617
62 A 2.8 2.8 3.0 13.0 2 102 A15 93327 93327 184335 92168 104578 59825 59082 B 2.8 3.0 91008 91008 58339
63 A 4.0 3.9 1.8 13.1 2 133 A7 105772 105772 216244 108122 103770 67803 69309 B 3.9 2.5 117570 110472 75366
64 A 3.8 3.8 1.5 13.3 2 108 A7 82601 70046 139027 69514 82944 52949 44560 B 3.9 1.0 68982 68982 44219
65 A 3.8 3.8 2.1 13.5 2 189 A12 198346 183026 364508 182254 157184 127145 116829 B 3.8 2.6 181661 181481 116449
66 A 2.9 2.7 1.8 13.0 2 137 A13 137773 129406 256246 128123 136292 88316 82130 B 2.4 2.2 126839 126839 81307
67 A 2.4 2.4 1.4 13.8 2 115 A8 101710 101710 200907 100453 117199 65199 64393 B 2.5 1.1 121269 99197 77737
68 A 3.0 2.8 2.5 13.3 2 116 A13 106726 106726 214921 107461 119514 68414 68885 B 2.5 2.5 108195 108195 69356 º Longitudinal column configurations shown in Appendix A, Layouts A1 – A16
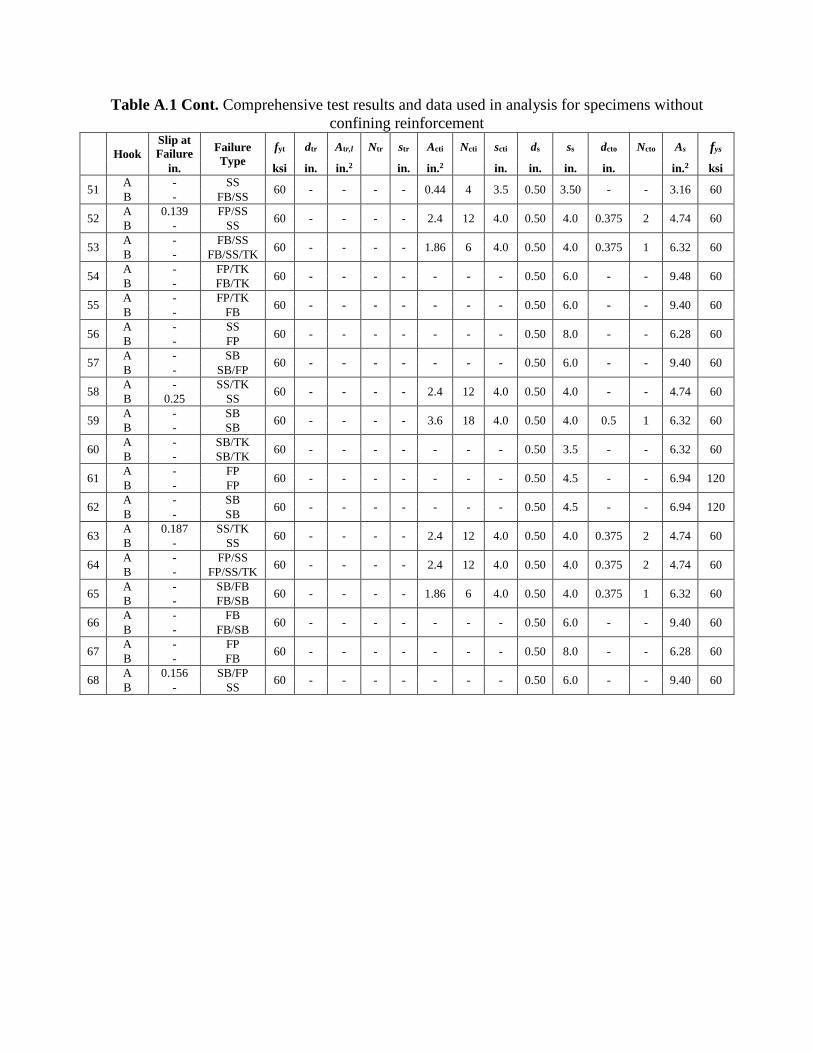
Table A.1 Cont. Comprehensive test results and data used in analysis for specimens without confining reinforcement
Hook Slip at Failure Failure
Type fyt dtr Atr,l Ntr str Acti Ncti scti ds ss dcto Ncto As fys
in. ksi in. in.2 in. in.2 in. in. in. in. in.2 ksi
51 A - SS 60 - - - - 0.44 4 3.5 0.50 3.50 - - 3.16 60 B - FB/SS
52 A 0.139 FP/SS 60 - - - - 2.4 12 4.0 0.50 4.0 0.375 2 4.74 60 B - SS
53 A - FB/SS 60 - - - - 1.86 6 4.0 0.50 4.0 0.375 1 6.32 60 B - FB/SS/TK
54 A - FP/TK 60 - - - - - - - 0.50 6.0 - - 9.48 60 B - FB/TK
55 A - FP/TK 60 - - - - - - - 0.50 6.0 - - 9.40 60 B - FB
56 A - SS 60 - - - - - - - 0.50 8.0 - - 6.28 60 B - FP
57 A - SB 60 - - - - - - - 0.50 6.0 - - 9.40 60 B - SB/FP
58 A - SS/TK 60 - - - - 2.4 12 4.0 0.50 4.0 - - 4.74 60 B 0.25 SS
59 A - SB 60 - - - - 3.6 18 4.0 0.50 4.0 0.5 1 6.32 60 B - SB
60 A - SB/TK 60 - - - - - - - 0.50 3.5 - - 6.32 60 B - SB/TK
61 A - FP 60 - - - - - - - 0.50 4.5 - - 6.94 120 B - FP
62 A - SB 60 - - - - - - - 0.50 4.5 - - 6.94 120 B - SB
63 A 0.187 SS/TK 60 - - - - 2.4 12 4.0 0.50 4.0 0.375 2 4.74 60 B - SS
64 A - FP/SS 60 - - - - 2.4 12 4.0 0.50 4.0 0.375 2 4.74 60 B - FP/SS/TK
65 A - SB/FB 60 - - - - 1.86 6 4.0 0.50 4.0 0.375 1 6.32 60 B - FB/SB
66 A - FB 60 - - - - - - - 0.50 6.0 - - 9.40 60 B - FB/SB
67 A - FP 60 - - - - - - - 0.50 8.0 - - 6.28 60 B - FB
68 A 0.156 SB/FP 60 - - - - - - - 0.50 6.0 - - 9.40 60 B - SS

Table A.2 Comprehensive test results and data used in analysis for specimens with confining reinforcement
Specimen Hook Bend Angle
Trans. Reinf.
Orient.
Hook Bar
Type
eh eh,avg f'c Age db Rr b h hcl hc
in. in. psi days in. in. in. in. in.
69 5-5-90-1#3-i-2.5-2-8 A 90° Para A1035 8.0 7.8 5310 6 0.6 0.073 13.1 10.4 5.25 8.375 B 7.6
70 5-5-90-1#3-i-2.5-2-6 A 90° Para A615 4.8 5.1 5800 9 0.6 0.060 13.1 8.0 5.25 8.375 B 5.5
71 5-8-90-1#3-i-2.5-2-6 A 90° Para A615 6.0 6.1 8450 14 0.6 0.060 12.9 8.0 5.25 8.375 B 6.3
72 5-8-90-1#3-i-2.5-2-6(1) A 90° Para A1035 6.1 5.9 9300 13 0.6 0.073 13.1 8.3 5.25 8.375 B 5.6
73 5-8-90-1#3-i-3.5-2-6 A 90° Para A1035 6.0 6.0 8710 16 0.6 0.060 15.3 8.0 5.25 8.375 B 6.0
74 5-8-90-1#3-i-3.5-2-6(1) A 90° Para A1035 6.3 6.3 9190 12 0.6 0.073 15.3 8.6 5.25 8.375 B 6.3
75 5-5-180-1#3-i-2.5-2-8 A 180° Para A1035 8.0 7.9 5670 7 0.6 0.073 13.0 10.3 5.25 8.375 B 7.8
76 5-5-180-1#3-i-2.5-2-6 A 180° Para A615 6.0 6.0 5800 9 0.6 0.060 13.1 8.0 5.25 8.375 B 6.0
77 5-8-180-1#3-i-2.5-2-7 A 180° Para A1035 7.1 7.2 9300 13 0.6 0.073 12.8 9.5 5.25 8.375 B 7.3
78 5-8-180-1#3-i-3.5-2-7 A 180° Para A1035 7.1 6.9 9190 12 0.6 0.073 15.3 9.3 5.25 8.375 B 6.8
79 5-5-90-1#4-i-2.5-2-8 A 90° Para A1035 7.4 7.6 5310 6 0.6 0.073 13.1 10.1 9.25 8.375 B 7.8
80 5-5-90-1#4-i-2.5-2-6 A 90° Para A615 5.3 5.5 5860 8 0.6 0.060 12.9 8.0 5.25 8.375 B 5.8
81 5-8-90-1#4-i-2.5-2-6 A 90° Para A1035 5.9 6.0 9300 13 0.6 0.073 12.9 8.8 5.25 8.375 B 6.0
82 5-8-90-1#4-i-3.5-2-6 A 90° Para A1035 6.0 6.5 9190 12 0.6 0.073 15.1 9.0 5.25 8.375 B 7.0
83 5-5-180-1#4-i-2.5-2-8 A 180° Para A1035 8.0 8.0 5310 6 0.6 0.073 12.9 10.0 5.25 8.375 B 8.0
84 5-5-180-1#4-i-2.5-2-6 A 180° Para A615 6.5 6.3 5670 7 0.6 0.060 13.0 8.5 5.25 8.375 B 6.0
85 5-5-90-2#3-i-2.5-2-8 A 90° Para A1035 8.0 7.8 5860 8 0.6 0.073 12.9 10.0 5.38 8.375 B 7.5
86 5-5-90-2#3-i-2.5-2-6 A 90° Para A615 6.0 5.9 5800 9 0.6 0.060 13.1 8.5 5.25 8.375 B 5.8
87 5-8-90-2#3-i-2.5-2-6 A 90° Para A1035 6.0 6.0 8580 15 0.6 0.073 13.0 8.0 5.25 8.375 B 6.0
88 5-8-90-2#3-i-2.5-2-8 A 90° Para A1035 8.3 8.4 8380 13 0.6 0.073 12.9 10.0 5.25 8.375 B 8.5
89 5-12-90-2#3-i-2.5-2-5 A 90° Para A1035 5.8 5.8 11090 83 0.6 0.073 13.0 8.8 5.25 8.375 B 5.8
90 5-15-90-2#3-i-2.5-2-6 A 90° Para A1035 6.3 6.4 15800 61 0.6 0.073 12.6 8.2 5.25 8.375 B 6.5
91 5-15-90-2#3-i-2.5-2-4 A 90° Para A1035 3.5 3.8 15800 61 0.6 0.073 13.0 6.1 5.25 8.375 B 4.0
92 5-5-90-2#3-i-3.5-2-6 A 90° Para A1035 6.0 5.9 5230 6 0.6 0.073 14.5 8.3 5.25 8.375 B 5.8
93 5-5-90-2#3-i-3.5-2-8 A 90° Para A1035 7.9 7.7 5190 7 0.6 0.073 14.9 10.3 5.25 8.375 B 7.5

Table A.2 Cont. Comprehensive test results and data used in analysis for specimens with confining reinforcement
Hook cso cso,avg cth ch Nh Axial Load Long.
Reinf. Layouto
Tmax Tind Ttotal T Th fsu,max fsu
in. in. in. in. kips lb lb lb lb lb psi psi
69 A 2.5 2.5 2.4 6.9 2 80 A1 32860 32628 66273 33136 31349 106001 106892 B 2.5 2.8 37440 33645 120776
70 A 2.5 2.5 3.3 6.9 2 80 A1 20038 19968 39830 19915 21933 64639 64242 B 2.5 2.5 29285 19863 94469
71 A 2.5 2.5 2.0 6.6 2 80 A1 26203 26172 53146 26573 28174 84524 85719 B 2.5 1.8 27858 26974 89865
72 A 2.6 2.7 2.1 6.5 2 30 A1 29328 29328 54758 27379 27780 94606 88319 B 2.8 2.6 25430 25430 82032
73 A 3.6 3.6 2.0 6.8 2 80 A1 41369 28996 60169 30084 27859 133448 97046 B 3.6 2.0 31173 31173 100558
74 A 3.8 3.6 2.4 6.8 2 30 A1 28967 25617 51811 25905 29307 93441 83565 B 3.5 2.4 26270 26194 84741
75 A 2.6 2.6 2.3 6.6 2 80 A1 36570 36332 72896 36448 32111 117967 117575 B 2.5 2.5 39949 36565 128867
76 A 2.6 2.6 2.0 6.6 2 80 A1 29091 23661 47832 23916 25201 93843 77148 B 2.6 2.0 24285 24171 78338
77 A 2.5 2.5 2.4 6.5 2 30 A1 34198 34198 65819 32909 33456 110316 106159 B 2.5 2.3 35367 31621 114087
78 A 3.5 3.5 2.1 7.0 2 30 A1 35824 35733 60999 30500 32272 115563 98386 B 3.5 2.5 28925 25266 93305
79 A 2.5 2.5 2.8 6.9 2 80 A1 35739 27537 55074 27537 33925 115288 88829 B 2.5 2.4 27537 27537 88829
80 A 2.5 2.5 2.8 6.6 2 80 A1 21633 21535 42914 21457 26892 69782 69217 B 2.5 2.3 26769 21379 86352
81 A 2.5 2.6 2.8 6.4 2 30 A1 23854 23854 48585 24292 31688 76947 78363 B 2.8 2.8 27932 24731 90103
82 A 3.6 3.6 3.0 6.8 2 30 A1 25266 25261 50482 25241 33887 81504 81423 B 3.5 2.0 25221 25221 81359
83 A 2.5 2.5 2.0 6.6 2 80 A1 43142 38421 76842 38421 35550 139167 123938 B 2.5 2.0 38421 38421 123938
84 A 2.5 2.6 2.0 6.6 2 80 A1 25321 23275 45954 22977 29499 81681 74119 B 2.6 2.5 22912 22679 73909
85 A 2.5 2.5 2.0 6.6 2 80 A1 37932 37807 74307 37154 31904 122360 119850 B 2.5 2.5 38949 36500 125642
86 A 2.6 2.6 2.5 6.6 2 80 A1 31846 29697 58888 29444 24732 102730 94980 B 2.6 2.8 29191 29191 94164
87 A 2.8 2.8 2.0 6.1 2 80 A1 33454 30402 61277 30638 27755 107916 98833 B 2.9 2.0 30874 30874 99595
88 A 2.6 2.6 1.8 6.5 2 80 A5 39822 39791 80336 40168 37614 128457 129574 B 2.5 1.5 40545 40545 130789
89 A 2.5 2.6 3.0 6.5 2 30 A1 25201 25120 48696 24348 28463 81295 78542 B 2.8 3.0 29393 23576 94816
90 A 2.4 2.4 1.9 6.6 2 30 A2 42381 42381 85276 42638 34250 136714 137542 B 2.4 1.7 42895 42895 138371
91 A 2.5 2.5 2.6 6.8 2 30 A9 18652 18652 37334 18667 21220 60167 60217 B 2.5 2.1 21256 18683 68569
92 A 3.4 3.4 2.3 6.5 2 30 A1 21341 21146 42186 21093 24118 68842 68042 B 3.4 2.5 21262 21040 68586
93 A 3.4 3.4 2.3 6.8 2 30 A1 43675 43675 89329 44665 30822 140887 144079 B 3.5 2.8 45654 45654 147271 º Longitudinal column configurations shown in Appendix A, Layouts A1 – A16

Table A.2 Cont. Comprehensive test results and data used in analysis for specimens with confining reinforcement
Hook Slip at Failure Failure
Type fyt dtr Atr,l Ntr str Acti Ncti scti ds ss dcto Ncto As fys
in. ksi in. in.2 in. in.2 in. in. in. in. in.2 ksi
69 A - FP 60 0.38 0.11 1 5.00 0.44 4 6.0 0.375 4.00 - - 1.27 60 B - SB/FB
70 A - SS 60 0.38 0.11 1 5.00 0.44 4 6.0 0.375 4.00 - - 1.27 60 B - SS/FP
71 A - FP 60 0.38 0.11 1 5.00 0.80 4 6.0 0.500 4.00 - - 1.27 60 B - SS
72 A - FP/SS 60 0.38 0.11 1 6.00 0.66 6 3.0 0.500 3.00 - - 1.27 60 B - FP/SS
73 A - FP/SS 60 0.38 0.11 1 5.00 0.80 4 6.0 0.500 4.00 - - 1.27 60 B - FP/SS
74 A 0.239 FP/SS 60 0.38 0.11 1 6.00 0.66 6 3.0 0.500 3.00 - - 1.27 60 B 0.158 FP/SS
75 A - SS 60 0.38 0.11 1 4.00 - - - 0.375 4.00 - - 1.27 60 B - SS/FP
76 A - SS/FP 60 0.38 0.11 1 4.00 - - - 0.375 4.00 - - 1.27 60 B - FP/SS
77 A 0.373 FP/SS 60 0.38 0.11 1 3.00 - - - 0.375 3.00 - - 1.27 60 B .261(.035) FP/SS
78 A 0.205 FP 60 0.38 0.11 1 3.00 - - - 0.375 3.00 - - 1.27 60 B 0.238 FP
79 A - FP/SS 60 0.5 0.20 1 5.00 0.44 4 6.0 0.375 4.00 - - 1.27 60 B - SB
80 A - SS 60 0.5 0.20 1 5.00 0.44 4 6.0 0.375 4.00 - - 1.27 60 B - SS
81 A 0.25 FP 60 0.5 0.20 1 6.00 0.44 4 6.0 0.500 3.00 - - 1.27 60 B 0.22 FP/SS
82 A - FP/SS 60 0.5 0.20 1 6.00 0.44 4 6.0 0.500 3.00 - - 1.27 60 B - FP/SS
83 A - FP/SS 60 0.5 0.20 1 4.00 - - - 0.375 4.00 - - 1.27 60 B - FP
84 A - FP/SS 60 0.5 0.20 1 4.00 - - - 0.375 4.00 - - 1.27 60 B - FP
85 A - SS/FP 60 0.38 0.11 2 4.00 - - - 0.375 4.00 - - 1.27 60 B - SS/FP
86 A - FP/SS 60 0.38 0.11 2 4.00 - - - 0.375 4.00 - - 1.27 60 B - FP/SS
87 A - FP/SS 60 0.38 0.11 2 4.00 - - - 0.500 4.00 - - 1.27 60 B - FP/SS
88 A - FP/SS 60 0.38 0.11 2 4.00 - - - 0.500 4.00 - - 1.67 60 B - FP/SS
89 A - FP/SS 60 0.38 0.11 2 3.30 0.33 3 3.3 0.500 3.00 - - 1.27 60 B - FP
90 A - FP 60 0.38 0.11 2 3.00 - - - 0.375 2.75 - - 3.16 60 B - FB
91 A - FB 60 0.38 0.11 2 3.00 - - - 0.375 1.75 - - 2.51 60 B - FP
92 A 0.183 SS/FP 60 0.38 0.11 2 3.50 0.11 1 3.5 0.375 3.50 - - 1.27 60 B - SS/FP
93 A - FP 60 0.38 0.11 2 3.50 - - - 0.375 4.00 - - 1.27 60 B - FP
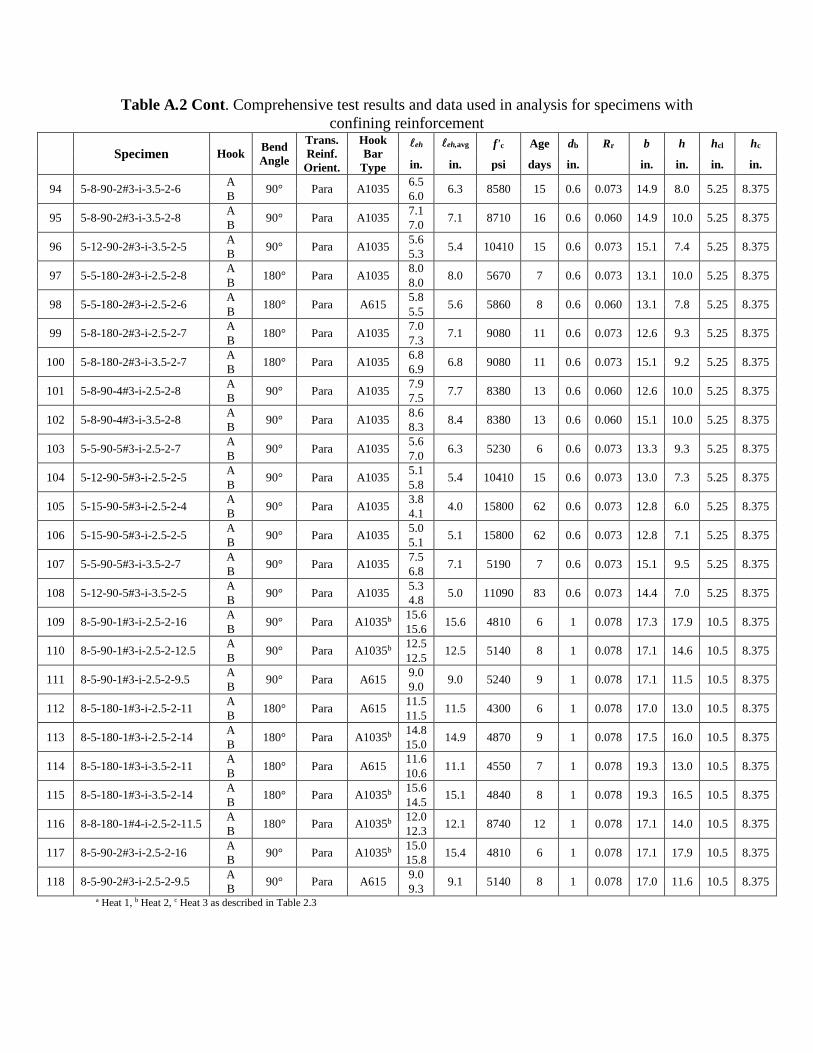
Table A.2 Cont. Comprehensive test results and data used in analysis for specimens with confining reinforcement
Specimen Hook Bend Angle
Trans. Reinf.
Orient.
Hook Bar
Type
eh eh,avg f'c Age db Rr b h hcl hc
in. in. psi days in. in. in. in. in.
94 5-8-90-2#3-i-3.5-2-6 A 90° Para A1035 6.5 6.3 8580 15 0.6 0.073 14.9 8.0 5.25 8.375 B 6.0
95 5-8-90-2#3-i-3.5-2-8 A 90° Para A1035 7.1 7.1 8710 16 0.6 0.060 14.9 10.0 5.25 8.375 B 7.0
96 5-12-90-2#3-i-3.5-2-5 A 90° Para A1035 5.6 5.4 10410 15 0.6 0.073 15.1 7.4 5.25 8.375 B 5.3
97 5-5-180-2#3-i-2.5-2-8 A 180° Para A1035 8.0 8.0 5670 7 0.6 0.073 13.1 10.0 5.25 8.375 B 8.0
98 5-5-180-2#3-i-2.5-2-6 A 180° Para A615 5.8 5.6 5860 8 0.6 0.060 13.1 7.8 5.25 8.375 B 5.5
99 5-8-180-2#3-i-2.5-2-7 A 180° Para A1035 7.0 7.1 9080 11 0.6 0.073 12.6 9.3 5.25 8.375 B 7.3
100 5-8-180-2#3-i-3.5-2-7 A 180° Para A1035 6.8 6.8 9080 11 0.6 0.073 15.1 9.2 5.25 8.375 B 6.9
101 5-8-90-4#3-i-2.5-2-8 A 90° Para A1035 7.9 7.7 8380 13 0.6 0.060 12.6 10.0 5.25 8.375 B 7.5
102 5-8-90-4#3-i-3.5-2-8 A 90° Para A1035 8.6 8.4 8380 13 0.6 0.060 15.1 10.0 5.25 8.375 B 8.3
103 5-5-90-5#3-i-2.5-2-7 A 90° Para A1035 5.6 6.3 5230 6 0.6 0.073 13.3 9.3 5.25 8.375 B 7.0
104 5-12-90-5#3-i-2.5-2-5 A 90° Para A1035 5.1 5.4 10410 15 0.6 0.073 13.0 7.3 5.25 8.375 B 5.8
105 5-15-90-5#3-i-2.5-2-4 A 90° Para A1035 3.8 4.0 15800 62 0.6 0.073 12.8 6.0 5.25 8.375 B 4.1
106 5-15-90-5#3-i-2.5-2-5 A 90° Para A1035 5.0 5.1 15800 62 0.6 0.073 12.8 7.1 5.25 8.375 B 5.1
107 5-5-90-5#3-i-3.5-2-7 A 90° Para A1035 7.5 7.1 5190 7 0.6 0.073 15.1 9.5 5.25 8.375 B 6.8
108 5-12-90-5#3-i-3.5-2-5 A 90° Para A1035 5.3 5.0 11090 83 0.6 0.073 14.4 7.0 5.25 8.375 B 4.8
109 8-5-90-1#3-i-2.5-2-16 A 90° Para A1035b 15.6 15.6 4810 6 1 0.078 17.3 17.9 10.5 8.375 B 15.6
110 8-5-90-1#3-i-2.5-2-12.5 A 90° Para A1035b 12.5 12.5 5140 8 1 0.078 17.1 14.6 10.5 8.375 B 12.5
111 8-5-90-1#3-i-2.5-2-9.5 A 90° Para A615 9.0 9.0 5240 9 1 0.078 17.1 11.5 10.5 8.375 B 9.0
112 8-5-180-1#3-i-2.5-2-11 A 180° Para A615 11.5 11.5 4300 6 1 0.078 17.0 13.0 10.5 8.375 B 11.5
113 8-5-180-1#3-i-2.5-2-14 A 180° Para A1035b 14.8 14.9 4870 9 1 0.078 17.5 16.0 10.5 8.375 B 15.0
114 8-5-180-1#3-i-3.5-2-11 A 180° Para A615 11.6 11.1 4550 7 1 0.078 19.3 13.0 10.5 8.375 B 10.6
115 8-5-180-1#3-i-3.5-2-14 A 180° Para A1035b 15.6 15.1 4840 8 1 0.078 19.3 16.5 10.5 8.375 B 14.5
116 8-8-180-1#4-i-2.5-2-11.5 A 180° Para A1035b 12.0 12.1 8740 12 1 0.078 17.1 14.0 10.5 8.375 B 12.3
117 8-5-90-2#3-i-2.5-2-16 A 90° Para A1035b 15.0 15.4 4810 6 1 0.078 17.1 17.9 10.5 8.375 B 15.8
118 8-5-90-2#3-i-2.5-2-9.5 A 90° Para A615 9.0 9.1 5140 8 1 0.078 17.0 11.6 10.5 8.375 B 9.3 a Heat 1, b Heat 2, c Heat 3 as described in Table 2.3

Table A.2 Cont. Comprehensive test results and data used in analysis for specimens with confining reinforcement
Hook cso cso,avg cth ch Nh Axial Load Long.
Reinf. Layouto
Tmax Tind Ttotal T Th fsu,max fsu
in. in. in. in. kips lb lb lb lb lb psi psi
94 A 3.5 3.6 1.5 6.4 2 80 A1 29930 29930 60069 30035 28807 96549 96886 B 3.8 2.0 30139 30139 97223
95 A 3.5 3.5 2.9 6.6 2 80 A5 38022 28716 57312 28656 32368 122652 92439 B 3.5 3.0 28596 28596 92246
96 A 3.8 3.6 1.8 6.6 2 30 A1 27860 27860 56728 28364 26634 89871 91497 B 3.5 2.2 28869 28869 93124
97 A 2.5 2.5 2.0 6.9 2 80 A1 34036 33674 68157 34078 36883 109795 109930 B 2.5 2.0 34483 34483 111236
98 A 2.6 2.6 2.0 6.6 2 80 A1 26852 26782 53456 26728 28154 86620 86220 B 2.6 2.3 26912 26674 86814
99 A 2.5 2.5 2.3 6.4 2 30 A1 34580 29762 58459 29230 37280 111548 94289 B 2.5 2.1 28697 28697 92572
100 A 3.4 3.4 2.4 7.0 2 30 A1 29310 29285 61862 30931 35933 94550 99777 B 3.5 2.3 32577 32577 105086
101 A 2.5 2.5 2.1 6.4 2 80 A5 33367 25867 52823 26411 38991 107636 85198 B 2.5 2.5 27016 26955 87150
102 A 3.5 3.5 1.4 6.9 2 80 A5 42471 37810 76960 38480 42178 137003 124130 B 3.5 1.8 39278 39150 126704
103 A 2.8 2.8 3.6 6.5 2 30 A1 32080 32080 63393 31696 34446 103484 102246 B 2.8 2.3 31340 31313 101095
104 A 2.6 2.6 2.1 6.5 2 30 A1 33923 33923 68839 34420 35366 109428 111031 B 2.6 1.5 34916 34916 112634
105 A 2.4 2.4 2.2 6.6 2 30 A9 31312 31312 62637 31318 31021 101006 101027 B 2.5 1.9 31325 31325 101048
106 A 2.4 2.4 2.1 6.8 2 30 A2 38574 38574 78312 39156 36416 124434 126309 B 2.3 1.9 46165 39737 148921
107 A 3.4 3.4 2.0 7.0 2 30 A1 44301 36844 72050 36025 37369 142906 116210 B 3.5 2.8 35206 35206 113568
108 A 3.3 3.3 2.5 6.6 2 30 A1 31472 31396 60882 30441 33822 101522 98196 B 3.3 1.5 31302 29485 100973
109 A 2.8 2.9 2.3 9.5 2 80 A2 94588 75682 149617 74809 76769 119731 94694 B 3.0 2.3 73936 73936 93589
110 A 2.6 2.7 2.1 9.8 2 80 A2 73919 64891 129674 64837 62777 93569 82072 B 2.8 2.1 64783 64783 82004
111 A 2.6 2.7 2.5 9.8 2 80 A2 62525 59716 124467 62233 46082 79145 78776 B 2.8 2.5 65289 64750 82645
112 A 2.5 2.5 1.5 10.0 2 80 A2 57294 48342 99464 49732 55252 72524 62952 B 2.5 1.5 68950 51122 87278
113 A 2.8 2.8 1.3 9.9 2 80 A2 67269 67183 138043 69021 73355 85150 87369 B 2.9 1.0 70909 70860 89758
114 A 3.8 3.6 1.4 10.0 2 80 A2 62945 54681 110781 55390 54323 79678 70114 B 3.5 2.4 56154 56100 71082
115 A 3.6 3.6 0.9 10.0 2 80 A2 78657 75069 151988 75994 74142 99565 96195 B 3.6 2.0 76919 76919 97366
116 A 2.9 2.8 2.0 9.5 2 30 A2 72047 71987 144462 72231 74846 91199 91432 B 2.8 1.8 72506 72475 91780
117 A 2.8 2.8 2.9 9.5 2 80 A2 80014 79629 159258 79629 75532 101284 100796 B 2.9 2.1 92780 79629 117443
118 A 2.5 2.5 2.6 10.0 2 80 A2 54916 53621 107242 53621 46453 69513 67874 B 2.5 2.3 53621 53621 67874 º Longitudinal column configurations shown in Appendix A, Layouts A1 – A16

Table A.2 Cont. Comprehensive test results and data used in analysis for specimens with confining reinforcement
Hook Slip at Failure Failure
Type fyt dtr Atr,l Ntr str Acti Ncti scti ds ss dcto Ncto As fys
in. ksi in. in.2 in. in.2 in. in. in. in. in.2 ksi
94 A - FP 60 0.38 0.11 2 4.00 - - - 0.500 4.00 - - 1.27 60 B - FP/SS
95 A - FP 60 0.38 0.11 2 4.00 - - - 0.500 4.00 - - 1.67 60 B - FP
96 A - FP 60 0.38 0.11 2 3.33 0.33 3 3.3 0.500 3.00 - - 1.27 60 B 0.349 FP
97 A - FP/SS 60 0.38 0.11 2 2.50 - - - 0.375 4.00 - - 1.27 60 B - FP/SS
98 A - FP/SS 60 0.38 0.11 2 2.50 - - - 0.375 4.00 - - 1.27 60 B - FP
99 A - FP/SS 60 0.38 0.11 2 2.00 - - - 0.375 3.00 - - 1.27 60 B .369(.081) FP/SS
100 A - FP/SS 60 0.38 0.11 2 2.00 - - - 0.375 3.00 - - 1.27 60 B .329(.028) FP
101 A - FP/SS 60 0.38 0.11 4 2.00 - - - 0.500 4.00 - - 1.67 60 B - FP/SS
102 A - FP 60 0.38 0.11 4 2.00 - - - 0.500 4.00 - - 1.67 60 B - SS/FP
103 A - FP 60 0.38 0.11 5 1.75 - - - 0.500 3.50 - - 1.27 60 B - FP/SS
104 A 0.292 FP/SS 60 0.38 0.11 5 1.67 - - - 0.500 3.00 - - 1.27 60 B 0.295 SS/FP
105 A 0.603 FP 60 0.38 0.11 5 1.75 - - - 0.375 1.75 - - 2.51 60 B 0.378 FP
106 A - FP 60 0.38 0.11 5 1.75 - - - 0.375 2.25 - - 3.16 60 B - BY
107 A - FP 60 0.38 0.11 5 1.75 - - - 0.500 3.50 - - 1.27 60 B - FP
108 A - FP 60 0.38 0.11 5 1.70 - - - 0.500 3.00 - - 1.27 60 B - FP
109 A - FP/SS 60 0.38 0.11 1 9.00 2.00 10 3.0 0.50 3.00 - - 3.16 60 B - FP/SS
110 A - FP/SS 60 0.38 0.11 1 9.00 2.00 10 3.0 0.50 3.00 - - 3.16 60 B - SS/FP
111 A - SB 60 0.38 0.11 1 9.00 2.00 10 3.0 0.50 3.00 - - 3.16 60 B - FP/SS
112 A 0.088 SS/FP 60 0.38 0.11 1 3.50 0.44 4 4.5 0.50 3.50 - - 3.16 60 B 0.341 SS/FP
113 A - SS/FP 60 0.38 0.11 1 3.50 0.44 4 4.5 0.50 3.50 - - 3.16 60 B 0.123 FP/SS
114 A 0.434 SS 60 0.38 0.11 1 3.50 0.44 4 4.5 0.50 3.50 - - 3.16 60 B 0.216 SS
115 A 0.232 SS/FP 60 0.38 0.11 1 3.50 0.44 4 4.5 0.50 3.50 - - 3.16 60 B 0.227 SS/FP
116 A - FP/SS 60 0.5 0.20 1 3.00 0.44 4 3.0 0.50 3.00 - - 3.16 60 B .(0.013) FP/SS
117 A - SS/FP 60 0.38 0.11 2 3.00 2.00 10 3.0 0.50 3.00 - - 3.16 60 B - FP
118 A - FP 60 0.38 0.11 2 3.00 2.00 10 3.0 0.50 3.00 - - 3.16 60 B - FP
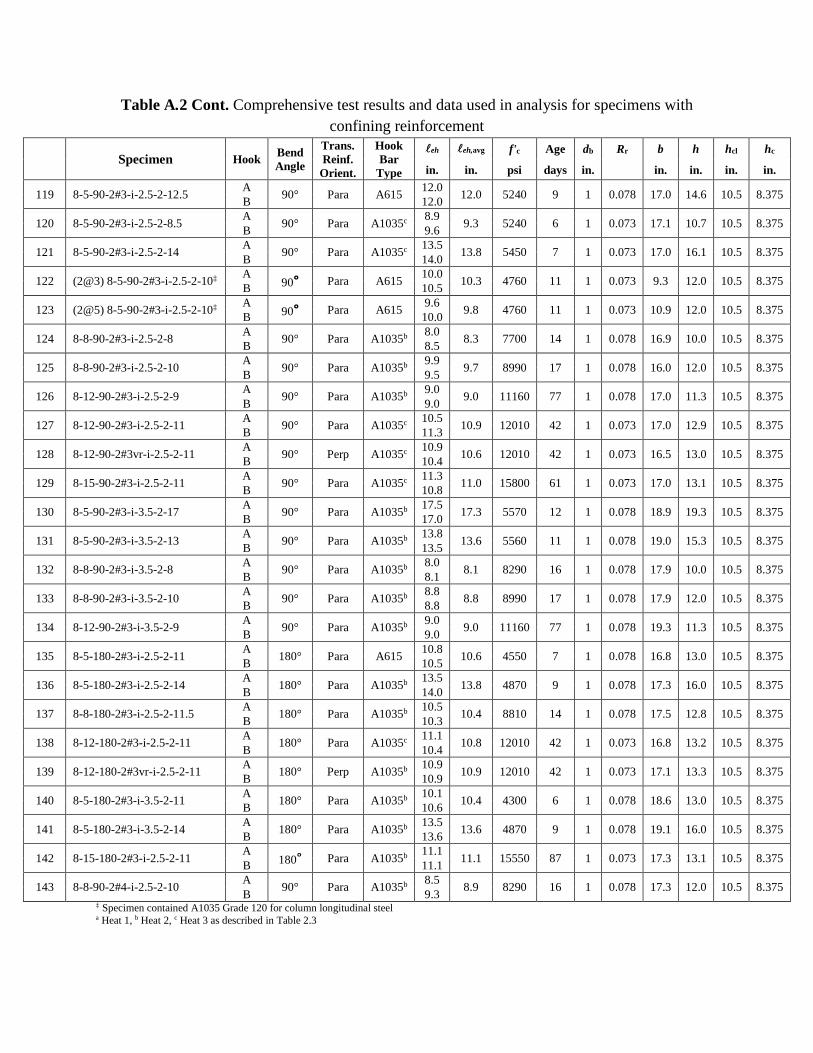
Table A.2 Cont. Comprehensive test results and data used in analysis for specimens with confining reinforcement
Specimen Hook Bend Angle
Trans. Reinf.
Orient.
Hook Bar
Type
eh eh,avg f'c Age db Rr b h hcl hc
in. in. psi days in. in. in. in. in.
119 8-5-90-2#3-i-2.5-2-12.5 A 90° Para A615 12.0 12.0 5240 9 1 0.078 17.0 14.6 10.5 8.375 B 12.0
120 8-5-90-2#3-i-2.5-2-8.5 A 90° Para A1035c 8.9 9.3 5240 6 1 0.073 17.1 10.7 10.5 8.375 B 9.6
121 8-5-90-2#3-i-2.5-2-14 A 90° Para A1035c 13.5 13.8 5450 7 1 0.073 17.0 16.1 10.5 8.375 B 14.0
122 (2@3) 8-5-90-2#3-i-2.5-2-10‡ A 90° Para A615 10.0 10.3 4760 11 1 0.073 9.3 12.0 10.5 8.375 B 10.5
123 (2@5) 8-5-90-2#3-i-2.5-2-10‡ A 90° Para A615 9.6 9.8 4760 11 1 0.073 10.9 12.0 10.5 8.375 B 10.0
124 8-8-90-2#3-i-2.5-2-8 A 90° Para A1035b 8.0 8.3 7700 14 1 0.078 16.9 10.0 10.5 8.375 B 8.5
125 8-8-90-2#3-i-2.5-2-10 A 90° Para A1035b 9.9 9.7 8990 17 1 0.078 16.0 12.0 10.5 8.375 B 9.5
126 8-12-90-2#3-i-2.5-2-9 A 90° Para A1035b 9.0 9.0 11160 77 1 0.078 17.0 11.3 10.5 8.375 B 9.0
127 8-12-90-2#3-i-2.5-2-11 A 90° Para A1035c 10.5 10.9 12010 42 1 0.073 17.0 12.9 10.5 8.375 B 11.3
128 8-12-90-2#3vr-i-2.5-2-11 A 90° Perp A1035c 10.9 10.6 12010 42 1 0.073 16.5 13.0 10.5 8.375 B 10.4
129 8-15-90-2#3-i-2.5-2-11 A 90° Para A1035c 11.3 11.0 15800 61 1 0.073 17.0 13.1 10.5 8.375 B 10.8
130 8-5-90-2#3-i-3.5-2-17 A 90° Para A1035b 17.5 17.3 5570 12 1 0.078 18.9 19.3 10.5 8.375 B 17.0
131 8-5-90-2#3-i-3.5-2-13 A 90° Para A1035b 13.8 13.6 5560 11 1 0.078 19.0 15.3 10.5 8.375 B 13.5
132 8-8-90-2#3-i-3.5-2-8 A 90° Para A1035b 8.0 8.1 8290 16 1 0.078 17.9 10.0 10.5 8.375 B 8.1
133 8-8-90-2#3-i-3.5-2-10 A 90° Para A1035b 8.8 8.8 8990 17 1 0.078 17.9 12.0 10.5 8.375 B 8.8
134 8-12-90-2#3-i-3.5-2-9 A 90° Para A1035b 9.0 9.0 11160 77 1 0.078 19.3 11.3 10.5 8.375 B 9.0
135 8-5-180-2#3-i-2.5-2-11 A 180° Para A615 10.8 10.6 4550 7 1 0.078 16.8 13.0 10.5 8.375 B 10.5
136 8-5-180-2#3-i-2.5-2-14 A 180° Para A1035b 13.5 13.8 4870 9 1 0.078 17.3 16.0 10.5 8.375 B 14.0
137 8-8-180-2#3-i-2.5-2-11.5 A 180° Para A1035b 10.5 10.4 8810 14 1 0.078 17.5 12.8 10.5 8.375 B 10.3
138 8-12-180-2#3-i-2.5-2-11 A 180° Para A1035c 11.1 10.8 12010 42 1 0.073 16.8 13.2 10.5 8.375 B 10.4
139 8-12-180-2#3vr-i-2.5-2-11 A 180° Perp A1035b 10.9 10.9 12010 42 1 0.073 17.1 13.3 10.5 8.375 B 10.9
140 8-5-180-2#3-i-3.5-2-11 A 180° Para A1035b 10.1 10.4 4300 6 1 0.078 18.6 13.0 10.5 8.375 B 10.6
141 8-5-180-2#3-i-3.5-2-14 A 180° Para A1035b 13.5 13.6 4870 9 1 0.078 19.1 16.0 10.5 8.375 B 13.6
142 8-15-180-2#3-i-2.5-2-11 A 180° Para A1035b 11.1 11.1 15550 87 1 0.073 17.3 13.1 10.5 8.375 B 11.1
143 8-8-90-2#4-i-2.5-2-10 A 90° Para A1035b 8.5 8.9 8290 16 1 0.078 17.3 12.0 10.5 8.375 B 9.3 ‡ Specimen contained A1035 Grade 120 for column longitudinal steel a Heat 1, b Heat 2, c Heat 3 as described in Table 2.3

Table A.2 Cont. Comprehensive test results and data used in analysis for specimens with confining reinforcement
Hook cso cso,avg cth ch Nh Axial Load Long.
Reinf. Layouto
Tmax Tind Ttotal T Th fsu,max fsu
in. in. in. in. kips lb lb lb lb lb psi psi
119 A 2.8 2.8 2.6 9.5 2 80 A2 74108 67801 144135 72067 60649 93808 91225 B 2.8 2.6 76334 76334 96625
120 A 3.0 3.0 1.8 9.1 2 30 A2 52863 52862 101122 50561 47286 66915 64001 B 3.0 1.1 48439 48260 61315
121 A 2.8 2.9 2.6 9.3 2 30 A2 76959 76388 153927 76964 69985 97416 97422 B 3.0 2.1 77540 77540 98151
122 A 2.5 2.5 2.0 2.3 2 30 A2 58584 58435 93619 46810 50832 74157 59253 B 2.5 1.5 47051 35184 59558
123 A 2.5 2.5 2.4 3.9 2 30 A2 48430 48412 97029 48515 48772 61303 61411 B 2.5 2.0 48617 48617 61541
124 A 3.0 2.9 2.0 9.0 2 30 A2 46211 46211 95751 47876 46882 58495 60602 B 2.9 1.5 55377 49540 70098
125 A 2.8 2.8 2.1 8.5 2 30 A2 60670 60670 122047 61024 56882 76797 77245 B 2.8 2.5 67001 61378 84812
126 A 2.9 2.8 2.3 9.5 2 30 A2 61813 61813 122026 61013 56097 78244 77232 B 2.6 2.3 60251 60213 76267
127 A 2.8 2.8 2.4 9.5 2 30 A2 68128 68101 137365 68683 68734 86237 86940 B 2.8 1.6 79794 69264 101004
128 A 2.5 2.4 2.1 9.8 2 30 A2 50709 50709 105346 52673 64971 64188 66674 B 2.3 2.6 66830 54637 84595
129 A 2.5 2.5 1.9 10.0 2 30 A11 99011 83072 166640 83320 74830 125330 105468 B 2.5 2.4 83603 83567 105827
130 A 3.3 3.4 1.8 10.1 2 30 A2 102613 91402 179829 89914 88104 129889 113816 B 3.5 2.3 88572 88426 112117
131 A 3.1 3.4 1.5 10.3 2 30 A2 81199 81199 160720 80360 69734 102783 101722 B 3.6 1.8 86858 79522 109946
132 A 3.6 3.7 2.0 8.5 2 30 A2 48324 48324 97545 48773 46759 61169 61738 B 3.8 1.9 49258 49222 62352
133 A 3.6 3.7 3.3 8.5 2 30 A2 53960 53960 107770 53885 51599 68304 68209 B 3.8 3.3 53810 53810 68113
134 A 3.6 3.8 2.3 9.6 2 30 A2 50266 50266 99555 49777 56097 63628 63009 B 4.0 2.4 49289 49289 62391
135 A 2.8 2.6 2.3 9.5 2 80 A2 64232 58650 120469 60235 57658 81306 76246 B 2.5 2.5 61892 61819 78345
136 A 2.8 2.8 2.5 9.8 2 80 A2 87080 75744 152558 76279 73578 110228 96556 B 2.8 2.0 76851 76814 97279
137 A 2.8 2.8 2.3 10.0 2 30 A2 70102 56934 116343 58171 66123 88737 73635 B 2.8 2.5 59494 59408 75309
138 A 2.5 2.6 2.1 9.6 2 30 A2 73700 63140 129310 64655 67961 93291 81842 B 2.6 2.8 66170 66170 83759
139 A 2.8 2.7 2.4 9.8 2 30 A2 67136 67136 131559 65780 66517 84983 83265 B 2.6 2.4 87053 64423 110194
140 A 3.4 3.4 2.9 9.8 2 80 A2 57158 56965 111737 55869 55752 72352 70720 B 3.5 2.4 54943 54772 69548
141 A 3.6 3.7 2.5 9.8 2 80 A2 68293 68293 126934 63467 72672 86446 80338 B 3.8 2.4 90408 58642 114441
142 A 2.8 2.8 2.1 9.8 2 30 A7 79626 79553 157845 78922 75135 100792 99902 B 2.8 2.0 78291 78291 99103
143 A 3.0 3.0 3.5 9.3 2 30 A2 61367 61286 122721 61360 55832 77680 77671 B 3.0 2.8 71322 61434 90281 º Longitudinal column configurations shown in Appendix A, Layouts A1 – A16

Table A.2 Cont. Comprehensive test results and data used in analysis for specimens with confining reinforcement
Hook Slip at Failure Failure
Type fyt dtr Atr,l Ntr str Acti Ncti scti ds ss dcto Ncto As fys
in. ksi in. in.2 in. in.2 in. in. in. in. in.2 ksi
119 A - FP 60 0.38 0.11 2 3.00 2.00 10 3.0 0.50 3.00 - - 3.16 60 B - FP/SS
120 A FP/SS 60 0.38 0.11 2 7.50 2.00 10 2.5 0.50 3.25 0.5 1 3.16 60 B SS
121 A SS/FP 60 0.38 0.11 2 6.00 0.88 8 3.0 0.50 3.50 0.5 1 3.16 60 B FP/SS
122 A 0.21 FP 60 0.38 0.11 2 3.00 - - - 0.38 4.00 - - 3.16 120 B - FP
123 A 0.23 FB 60 0.38 0.11 2 3.00 - - - 0.38 5.00 - - 3.16 120 B 0.108 FB
124 A - FP/SS 60 0.38 0.11 2 7.13 1.20 6 4.0 0.50 1.50 - - 3.16 60 B - FP/SS
125 A 0.186 FP 60 0.38 0.11 2 7.13 1.20 6 4.0 0.63 3.50 - - 3.16 60 B 0.152 FB
126 A 0.345 FP/SS 60 0.38 0.11 2 8.00 0.88 8 4.0 0.50 4.00 0.375 2 3.16 60 B 0.361 SS/FP
127 A 0.181 FP 60 0.38 0.11 2 8.00 - - - 0.50 2.00 - - 3.16 60 B 0.165 FP
128 A - FP/SS 60 0.38 0.11 2 2.67 - - - 0.50 2.00 - - 3.16 60 B 0.13 FP
129 A - FB 60 0.38 0.11 2 5.50 - - - 0.38 4.00 - - 6.32 60 B 0.123 FB
130 A - SS 60 0.38 0.11 2 8.00 0.80 4 4.0 0.50 4.00 0.375 1 3.16 60 B - SS/FP
131 A - SS/FP 60 0.38 0.11 2 8.00 0.44 4 4.0 0.50 3.00 - - 3.16 60 B - SS/FP
132 A 0.31 FP 60 0.38 0.11 2 7.13 1.20 6 4.0 0.50 1.50 - - 3.16 60 B .340(.147) FP
133 A - SS 60 0.38 0.11 2 7.13 1.20 6 4.0 0.63 3.50 - - 3.16 60 B - FP
134 A 0.15 FP/SS 60 0.38 0.11 2 8.00 0.88 8 4.0 0.50 4.00 0.375 2 3.16 60 B FP/SS
135 A 0.26 SS/FP 60 0.38 0.11 2 3.50 - - - 0.50 3.50 - - 3.16 60 B 0.087 SS/FP
136 A 0.774 FP 60 0.38 0.11 2 3.50 - - - 0.50 3.50 - - 3.16 60 B 0.199 FP/SS
137 A 0.261 FB/SS 60 0.38 0.11 2 3.00 - - - 0.50 3.00 - - 3.16 60 B .25(.027) FP/SS
138 A - FP 60 0.38 0.11 2 8.00 - - - 0.50 2.00 - - 3.16 60 B - FB
139 A - SS/FP 60 0.38 0.11 2 2.67 - - - 0.50 2.00 - - 3.16 60 B 0.369 FB/SB
140 A 0.167 SS/FP 60 0.38 0.11 2 3.50 - - - 0.50 3.50 - - 3.16 60 B 0.212 SS/FP
141 A - FP/SS 60 0.38 0.11 2 3.50 - - - 0.50 3.50 - - 3.16 60 B - FP/SS
142 A - FB/SS 60 0.38 0.11 2 5.00 - - - 0.50 4.00 - - 4.74 60 B - FP
143 A 0.171 FP/SS 60 0.5 0.20 2 7.13 1.20 6 4.0 0.50 2.00 - - 3.16 60 B .285(.129) FP/SS
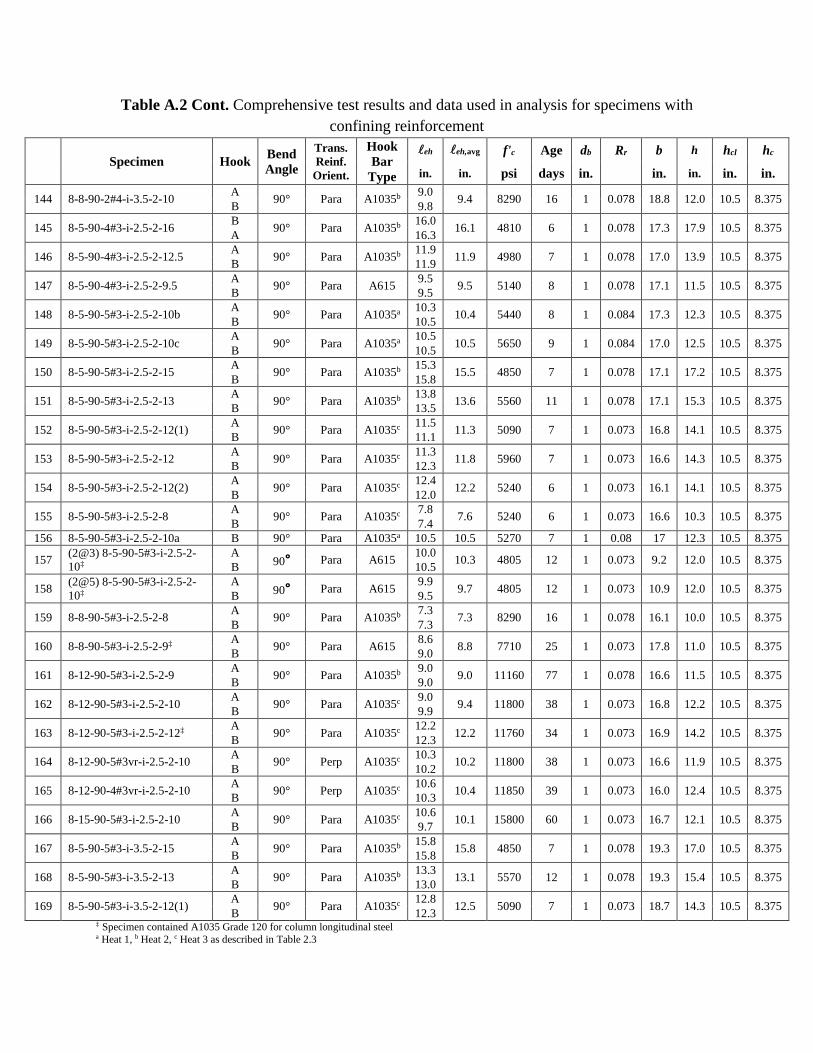
Table A.2 Cont. Comprehensive test results and data used in analysis for specimens with confining reinforcement
Specimen Hook Bend Angle
Trans. Reinf.
Orient.
Hook Bar
Type
eh eh,avg f'c Age db Rr b h hcl hc
in. in. psi days in. in. in. in. in.
144 8-8-90-2#4-i-3.5-2-10 A 90° Para A1035b 9.0 9.4 8290 16 1 0.078 18.8 12.0 10.5 8.375 B 9.8
145 8-5-90-4#3-i-2.5-2-16 B 90° Para A1035b 16.0 16.1 4810 6 1 0.078 17.3 17.9 10.5 8.375 A 16.3
146 8-5-90-4#3-i-2.5-2-12.5 A 90° Para A1035b 11.9 11.9 4980 7 1 0.078 17.0 13.9 10.5 8.375 B 11.9
147 8-5-90-4#3-i-2.5-2-9.5 A 90° Para A615 9.5 9.5 5140 8 1 0.078 17.1 11.5 10.5 8.375 B 9.5
148 8-5-90-5#3-i-2.5-2-10b A 90° Para A1035a 10.3 10.4 5440 8 1 0.084 17.3 12.3 10.5 8.375 B 10.5
149 8-5-90-5#3-i-2.5-2-10c A 90° Para A1035a 10.5 10.5 5650 9 1 0.084 17.0 12.5 10.5 8.375 B 10.5
150 8-5-90-5#3-i-2.5-2-15 A 90° Para A1035b 15.3 15.5 4850 7 1 0.078 17.1 17.2 10.5 8.375 B 15.8
151 8-5-90-5#3-i-2.5-2-13 A 90° Para A1035b 13.8 13.6 5560 11 1 0.078 17.1 15.3 10.5 8.375 B 13.5
152 8-5-90-5#3-i-2.5-2-12(1) A 90° Para A1035c 11.5 11.3 5090 7 1 0.073 16.8 14.1 10.5 8.375 B 11.1
153 8-5-90-5#3-i-2.5-2-12 A 90° Para A1035c 11.3 11.8 5960 7 1 0.073 16.6 14.3 10.5 8.375 B 12.3
154 8-5-90-5#3-i-2.5-2-12(2) A 90° Para A1035c 12.4 12.2 5240 6 1 0.073 16.1 14.1 10.5 8.375 B 12.0
155 8-5-90-5#3-i-2.5-2-8 A 90° Para A1035c 7.8 7.6 5240 6 1 0.073 16.6 10.3 10.5 8.375 B 7.4 156 8-5-90-5#3-i-2.5-2-10a B 90° Para A1035a 10.5 10.5 5270 7 1 0.08 17 12.3 10.5 8.375
157 (2@3) 8-5-90-5#3-i-2.5-2-10‡
A 90° Para A615 10.0 10.3 4805 12 1 0.073 9.2 12.0 10.5 8.375 B 10.5
158 (2@5) 8-5-90-5#3-i-2.5-2-10‡
A 90° Para A615 9.9 9.7 4805 12 1 0.073 10.9 12.0 10.5 8.375 B 9.5
159 8-8-90-5#3-i-2.5-2-8 A 90° Para A1035b 7.3 7.3 8290 16 1 0.078 16.1 10.0 10.5 8.375 B 7.3
160 8-8-90-5#3-i-2.5-2-9‡ A 90° Para A615 8.6 8.8 7710 25 1 0.073 17.8 11.0 10.5 8.375 B 9.0
161 8-12-90-5#3-i-2.5-2-9 A 90° Para A1035b 9.0 9.0 11160 77 1 0.078 16.6 11.5 10.5 8.375 B 9.0
162 8-12-90-5#3-i-2.5-2-10 A 90° Para A1035c 9.0 9.4 11800 38 1 0.073 16.8 12.2 10.5 8.375 B 9.9
163 8-12-90-5#3-i-2.5-2-12‡ A 90° Para A1035c 12.2 12.2 11760 34 1 0.073 16.9 14.2 10.5 8.375 B 12.3
164 8-12-90-5#3vr-i-2.5-2-10 A 90° Perp A1035c 10.3 10.2 11800 38 1 0.073 16.6 11.9 10.5 8.375 B 10.2
165 8-12-90-4#3vr-i-2.5-2-10 A 90° Perp A1035c 10.6 10.4 11850 39 1 0.073 16.0 12.4 10.5 8.375 B 10.3
166 8-15-90-5#3-i-2.5-2-10 A 90° Para A1035c 10.6 10.1 15800 60 1 0.073 16.7 12.1 10.5 8.375 B 9.7
167 8-5-90-5#3-i-3.5-2-15 A 90° Para A1035b 15.8 15.8 4850 7 1 0.078 19.3 17.0 10.5 8.375 B 15.8
168 8-5-90-5#3-i-3.5-2-13 A 90° Para A1035b 13.3 13.1 5570 12 1 0.078 19.3 15.4 10.5 8.375 B 13.0
169 8-5-90-5#3-i-3.5-2-12(1) A 90° Para A1035c 12.8 12.5 5090 7 1 0.073 18.7 14.3 10.5 8.375 B 12.3 ‡ Specimen contained A1035 Grade 120 for column longitudinal steel a Heat 1, b Heat 2, c Heat 3 as described in Table 2.3

Table A.2 Cont. Comprehensive test results and data used in analysis for specimens with confining reinforcement
Hook cso cso,avg cth ch Nh Axial Load Long.
Reinf. Layouto
Tmax Tind Ttotal T Th fsu,max fsu
in. in. in. in. kips lb lb lb lb lb psi psi
144 A 3.8 3.8 3.0 9.1 2 30 A2 69451 69451 138925 69463 58583 87913 87927 B 3.9 2.3 69474 69474 87942
145 B 2.8 2.9 1.9 9.5 2 80 A2 91801 91801 180857 90429 84844 116204 114467 A 3.0 1.6 97200 89056 123038
146 A 2.5 2.5 2.0 10.0 2 80 A2 83079 68532 137165 68583 64929 105164 86814 B 2.5 2.0 68634 68634 86878
147 A 2.8 2.8 2.0 9.5 2 80 A2 63275 55094 109827 54914 53922 80094 69511 B 2.9 2.0 54846 54733 69425
148 A 2.8 2.7 2.0 9.9 2 80 A2 78824 75418 139430 69715 64769 99777 88247 B 2.6 1.8 66728 64012 84466
149 A 2.5 2.5 2.0 10.0 2 80 A2 68947 68071 137674 68837 65920 87275 87136 B 2.5 2.0 69633 69604 88143
150 A 2.8 2.6 1.9 9.9 2 30 A2 77125 74150 146753 73377 87983 97627 92882 B 2.5 1.4 72603 72603 91903
151 A 2.5 2.4 1.5 10.3 2 30 A2 93116 83412 164752 82376 81257 117868 104273 B 2.4 1.8 81340 81340 102962
152 A 2.5 2.5 2.6 9.8 2 30 A2 66726 66726 132727 66363 68375 84463 84004 B 2.5 3.0 75878 66001 96048
153 A 2.5 2.4 3.0 9.8 2 30 A2 84900 * 72000 72000 73010 107468 91139 B 2.4 2.0 72000 72000 91139
154 A 2.5 2.6 1.8 9.0 2 30 A2 72359 72321 142939 71470 73090 91593 90468 B 2.6 2.1 77425 70619 98006
155 A 2.8 2.8 2.6 9.0 2 30 A2 48024 47948 94956 47478 50723 60790 60099 B 2.9 2.9 47008 47008 59503 156 B 2.5 2.5 1.8 9.8 2 80 A2 82800 82800 82800 82800 64937 104800 104800
157 A 2.4 2.6 2.0 2.0 2 30 A2 61451 57620 115845 57922 62480 77787 73319 B 2.8 1.5 58224 58224 73702
158 A 2.3 2.3 2.1 4.3 2 30 A2 59715 59715 111921 55960 59824 75589 70836 B 2.4 2.5 52232 52205 66116
159 A 2.9 2.8 2.8 8.5 2 30 A2 56006 49326 100532 50266 53859 70893 63628 B 2.8 2.8 51206 51206 64818
160 A 2.8 3.0 2.4 9.8 2 30 A2 64834 64834 128795 64397 61438 82068 81516 B 3.3 2.0 64027 63961 81047
161 A 2.5 2.6 2.5 9.5 2 30 A2 66512 66512 129507 64753 67620 84193 81966 B 2.6 2.5 63119 62994 79897
162 A 2.6 2.4 3.2 9.9 2 30 A2 66000 64479 129061 64530 71117 83544 81684 B 2.3 2.3 64599 64582 81771
163 A 2.4 2.4 2.0 10.0 2 30 A2 90544 88954 175422 87711 88168 114613 111027 B 2.5 1.9 86469 86469 109454
164 A 2.5 2.4 1.7 9.8 2 30 A2 59428 59428 120439 60219 67059 75225 76227 B 2.4 1.7 64145 61011 81196
165 A 2.5 2.5 1.8 9.0 2 30 A2 80288 59214 118481 59241 66818 101630 74988 B 2.5 2.1 59267 59267 75021
166 A 2.4 2.4 1.6 9.9 2 30 A11 111610 89783 180007 90003 80498 141278 113928 B 2.4 2.4 90223 90223 114207
167 A 3.6 3.5 1.3 10.3 2 30 A2 81187 81187 160681 80341 89047 102768 101697 B 3.5 1.3 87144 79494 110309
168 A 3.4 3.4 2.1 10.4 2 30 A2 89620 78290 154137 77069 78783 113443 97555 B 3.5 2.4 75971 75847 96166
169 A 3.5 3.5 1.6 9.8 2 30 A2 78862 78813 152863 76431 74137 99825 96749 B 3.4 2.1 75869 74050 96037 º Longitudinal column configurations shown in Appendix A, Layouts A1 – A16 *Data not available
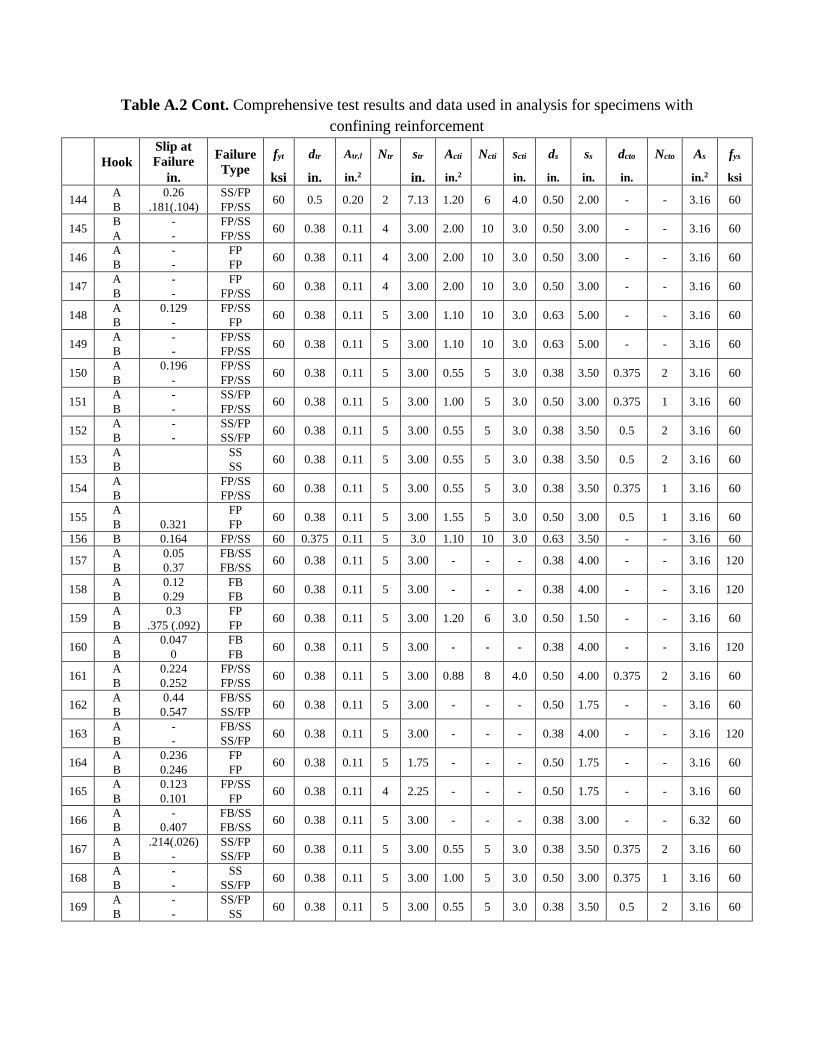
Table A.2 Cont. Comprehensive test results and data used in analysis for specimens with confining reinforcement
Hook Slip at Failure Failure
Type fyt dtr Atr,l Ntr str Acti Ncti scti ds ss dcto Ncto As fys
in. ksi in. in.2 in. in.2 in. in. in. in. in.2 ksi
144 A 0.26 SS/FP 60 0.5 0.20 2 7.13 1.20 6 4.0 0.50 2.00 - - 3.16 60 B .181(.104) FP/SS
145 B - FP/SS 60 0.38 0.11 4 3.00 2.00 10 3.0 0.50 3.00 - - 3.16 60 A - FP/SS
146 A - FP 60 0.38 0.11 4 3.00 2.00 10 3.0 0.50 3.00 - - 3.16 60 B - FP
147 A - FP 60 0.38 0.11 4 3.00 2.00 10 3.0 0.50 3.00 - - 3.16 60 B - FP/SS
148 A 0.129 FP/SS 60 0.38 0.11 5 3.00 1.10 10 3.0 0.63 5.00 - - 3.16 60 B - FP
149 A - FP/SS 60 0.38 0.11 5 3.00 1.10 10 3.0 0.63 5.00 - - 3.16 60 B - FP/SS
150 A 0.196 FP/SS 60 0.38 0.11 5 3.00 0.55 5 3.0 0.38 3.50 0.375 2 3.16 60 B - FP/SS
151 A - SS/FP 60 0.38 0.11 5 3.00 1.00 5 3.0 0.50 3.00 0.375 1 3.16 60 B - FP/SS
152 A - SS/FP 60 0.38 0.11 5 3.00 0.55 5 3.0 0.38 3.50 0.5 2 3.16 60 B - SS/FP
153 A SS 60 0.38 0.11 5 3.00 0.55 5 3.0 0.38 3.50 0.5 2 3.16 60 B SS
154 A FP/SS 60 0.38 0.11 5 3.00 0.55 5 3.0 0.38 3.50 0.375 1 3.16 60 B FP/SS
155 A FP 60 0.38 0.11 5 3.00 1.55 5 3.0 0.50 3.00 0.5 1 3.16 60 B 0.321 FP 156 B 0.164 FP/SS 60 0.375 0.11 5 3.0 1.10 10 3.0 0.63 3.50 - - 3.16 60
157 A 0.05 FB/SS 60 0.38 0.11 5 3.00 - - - 0.38 4.00 - - 3.16 120 B 0.37 FB/SS
158 A 0.12 FB 60 0.38 0.11 5 3.00 - - - 0.38 4.00 - - 3.16 120 B 0.29 FB
159 A 0.3 FP 60 0.38 0.11 5 3.00 1.20 6 3.0 0.50 1.50 - - 3.16 60 B .375 (.092) FP
160 A 0.047 FB 60 0.38 0.11 5 3.00 - - - 0.38 4.00 - - 3.16 120 B 0 FB
161 A 0.224 FP/SS 60 0.38 0.11 5 3.00 0.88 8 4.0 0.50 4.00 0.375 2 3.16 60 B 0.252 FP/SS
162 A 0.44 FB/SS 60 0.38 0.11 5 3.00 - - - 0.50 1.75 - - 3.16 60 B 0.547 SS/FP
163 A - FB/SS 60 0.38 0.11 5 3.00 - - - 0.38 4.00 - - 3.16 120 B - SS/FP
164 A 0.236 FP 60 0.38 0.11 5 1.75 - - - 0.50 1.75 - - 3.16 60 B 0.246 FP
165 A 0.123 FP/SS 60 0.38 0.11 4 2.25 - - - 0.50 1.75 - - 3.16 60 B 0.101 FP
166 A - FB/SS 60 0.38 0.11 5 3.00 - - - 0.38 3.00 - - 6.32 60 B 0.407 FB/SS
167 A .214(.026) SS/FP 60 0.38 0.11 5 3.00 0.55 5 3.0 0.38 3.50 0.375 2 3.16 60 B - SS/FP
168 A - SS 60 0.38 0.11 5 3.00 1.00 5 3.0 0.50 3.00 0.375 1 3.16 60 B - SS/FP
169 A - SS/FP 60 0.38 0.11 5 3.00 0.55 5 3.0 0.38 3.50 0.5 2 3.16 60 B - SS

Table A.2 Cont. Comprehensive test results and data used in analysis for specimens with confining reinforcement
Specimen Hook Bend Angle
Trans. Reinf.
Orient.
Hook Bar
Type
eh eh,avg f'c Age db Rr b h hcl hc
in. in. psi days in. in. in. in. in.
170 8-5-90-5#3-i-3.5-2-12 A 90° Para A1035c 12.5 12.1 6440 9 1 0.073 18.6 14.2 10.5 8.375 B 11.8
171 8-8-90-5#3-i-3.5-2-8 A 90° Para A1035b 8.0 8.0 7910 15 1 0.078 18.0 10.0 10.5 8.375 B 8.0
172 8-12-90-5#3-i-3.5-2-9 A 90° Para A1035b 9.0 9.0 11160 77 1 0.078 18.1 11.5 10.5 8.375 B 9.0
173 8-12-180-5#3-i-2.5-2-10 A 180° Para A1035c 9.9 9.8 11800 38 1 0.073 16.9 12.2 10.5 8.375 B 9.6
174 8-12-180-5#3vr-i-2.5-2-10
A 180° Perp A1035c 11.1 10.8 11800 38 1 0.073 16.8 12.4 10.5 8.375 B 10.5
175 8-12-180-4#3vr-i-2.5-2-10
A 180° Perp A1035c 10.5 10.3 11850 39 1 0.073 17.0 12.3 10.5 8.375 B 10.0
176 8-15-180-5#3-i-2.5-2-9.5 A 180° Para A1035c 9.6 9.7 15550 87 1 0.073 17.3 11.7 10.5 8.375 B 9.8
177 8-5-90-4#4s-i-2.5-2-15 A 90° Para A1035b 15.6 15.6 4810 6 1 0.078 17.0 17.3 10.5 8.375 B 15.6
178 8-5-90-4#4s-i-2.5-2-12(1) A 90° Para A1035c 12.3 12.4 5180 8 1 0.073 17.1 14.4 10.5 8.375 B 12.5
179 8-5-90-4#4s-i-2.5-2-12 A 90° Para A1035c 12.0 12.3 6210 8 1 0.073 16.6 14.3 10.5 8.375 B 12.6
180 8-5-90-4#4s-i-3.5-2-15 A 90° Para A1035b 15.5 15.3 4810 6 1 0.078 19.6 17.3 10.5 8.375 B 15.1
181 8-5-90-4#4s-i-3.5-2-12(1) A 90° Para A1035c 12.0 11.9 5910 14 1 0.073 19.0 14.3 10.5 8.375 B 11.9
182 8-5-90-4#4s-i-3.5-2-12 A 90° Para A1035c 12.0 12.3 5960 7 1 0.073 18.3 14.4 10.5 8.375 B 12.5
183 11-5-90-1#4-i-2.5-2-17 A 90° Para A1035 17.8 17.7 5790 25 1.4 0.085 21.4 19.6 19.5 8.375 B 17.6
184 11-5-90-1#4-i-3.5-2-17 A 90° Para A1035 17.8 17.8 5790 25 1.4 0.085 23.6 19.5 19.5 8.375 B 17.8
185 11-5-90-2#3-i-2.5-2-17 A 90° Para A1035 17.4 17.6 5600 24 1.4 0.085 21.3 19.6 19.5 8.375 B 17.8
186 11-5-90-2#3-i-2.5-2-14 A 90° Para A615 13.5 13.6 4910 13 1.4 0.069 21.7 16.0 19.5 8.375 B 13.8
187 11-12-90-2#3-i-2.5-2-17.5
A 90° Para A1035 18.0 17.8 13710 30 1.4 0.085 21.1 19.5 19.5 8.375 B 17.5
188 11-15-90-2#3-i-2.5-2-23 A 90° Para A1035 23.5 23.5 16180 62 1.4 0.085 21.3 25.0 19.5 8.375 B 23.5
189 11-15-90-2#3-i-2.5-2-10‡ A 90° Para A615 10.0 10.0 14045 76 1.4 0.085 22.0 12.0 19.5 8.375 B 10.0
190 11-15-90-2#3-i-2.5-2-15‡ A 90° Para A1035 14.0 14.1 14045 80 1.4 0.085 21.5 17.0 19.5 8.375 B 14.3
191 11-5-90-2#3-i-3.5-2-17 A 90° Para A1035 17.5 17.6 7070 28 1.4 0.085 23.4 19.7 19.5 8.375 B 17.8
192 11-5-90-2#3-i-3.5-2-14 A 90° Para A615 14.5 13.9 4910 12 1.4 0.069 23.7 16.1 19.5 8.375 B 13.4
193 11-5-90-5#3-i-2.5-2-14 A 90° Para A615 14.3 13.9 4910 12 1.4 0.069 21.8 16.0 19.5 8.375 B 13.5
194 11-5-90-5#3-i-3.5-2-14 A 90° Para A615 14.6 14.6 4910 14 1.4 0.069 23.7 16.0 19.5 8.375 B 14.5 ‡ Specimen contained A1035 Grade 120 for column longitudinal steel a Heat 1, b Heat 2, c Heat 3 as described in Table 2.3

Table A.2 Cont. Comprehensive test results and data used in analysis for specimens with confining reinforcement
Hook cso cso,avg cth ch Nh Axial Load Long.
Reinf. Layouto
Tmax Tind Ttotal T Th fsu,max fsu
in. in. in. in. kips lb lb lb lb lb psi psi
170 A 3.4 3.4 1.7 9.8 2 30 A2 79156 79156 158301 79150 76237 100198 100190 B 3.5 2.4 79258 79145 100327
171 A 3.5 3.6 2.0 8.9 2 30 A2 55391 55391 111619 55810 57384 70116 70645 B 3.6 2.0 56240 56228 71190
172 A 3.3 3.3 2.5 9.5 2 30 A2 68822 68822 135663 67831 67620 87116 85863 B 3.4 2.5 82227 66841 104084
173 A 2.3 2.5 2.3 9.9 2 30 A2 63041 63041 128214 64107 73027 79798 81148 B 2.8 2.6 81419 65173 103062
174 A 2.5 2.5 1.3 9.8 2 30 A2 67538 67538 135560 67780 70708 85491 85798 B 2.5 1.9 68023 68023 86105
175 A 2.8 2.6 1.8 9.8 2 30 A2 69654 69654 138377 69188 65665 88170 87580 B 2.5 2.3 68753 68723 87030
176 A 2.5 2.6 2.1 10.0 2 30 A10 85951 85951 171901 85951 77095 108798 108798 B 2.8 1.9 85951 85951 108798
177 A 3.0 2.9 1.6 9.1 2 30 A2 93337 93337 187306 93653 92056 118148 118548 B 2.9 1.6 107709 93969 136340
178 A 2.5 2.6 2.1 10.0 2 30 A2 100177 91540 181632 90816 77607 126806 114957 B 2.6 1.9 90092 90092 114041
179 A 2.6 2.6 2.3 9.5 2 30 A2 116352 99838 199509 99755 80367 147281 126272 B 2.5 1.6 99672 99672 126167
180 A 4.1 4.1 1.8 9.5 2 30 A2 105974 91613 181730 90865 90541 134144 115019 B 4.0 2.1 90156 90118 114121
181 A 3.8 3.6 2.3 9.8 2 30 A2 115165 113609 190910 95455 77612 145779 120829 B 3.5 2.4 92876 77301 117565
182 A 3.8 3.6 2.4 9.0 2 30 A2 103861 99392 196312 98156 79340 131470 124248 B 3.5 1.9 96919 96919 122683
183 A 2.8 2.8 1.8 13.1 2 117 A7 99443 99403 202995 101498 115679 63746 65063 B 2.8 2.0 119681 103592 76718
184 A 3.8 3.8 1.8 13.1 2 129 A7 105692 103693 212540 106270 116068 67751 68122 B 3.9 1.8 108846 108846 69773
185 A 2.5 2.6 2.3 13.4 2 117 A7 108406 98172 201390 100695 108250 69491 64548 B 2.6 1.8 103234 103218 66176
186 A 2.8 2.8 2.5 13.3 2 97 A7 77718 77718 154845 77422 81310 49819 49630 B 2.9 2.3 77214 77127 49496
187 A 2.5 2.5 1.5 13.3 2 115 A7 133178 132555 260779 130389 139941 85371 83583 B 2.5 2.0 129868 128223 83249
188 A 2.8 2.8 1.5 13.0 2 149 A11 232100 212550 419150 209575 195050 148782 134343 B 2.8 1.5 206900 206600 132628
189 A 2.8 2.9 2.0 13.4 2 74 A15 64250 64250 127881 63940 79600 41186 40987 B 3.0 2.0 63631 63631 40789
190 A 2.6 2.6 3.0 13.6 2 102 A15 115577 115577 230377 115189 111959 74088 73839 B 2.6 2.8 114801 114801 73590
191 A 3.6 3.6 2.1 13.4 2 129 A7 107807 107807 219287 109644 115784 69107 70284 B 3.6 2.0 111480 111480 71462
192 A 3.8 3.8 1.6 13.3 2 107 A7 92719 82732 164549 82275 83132 59435 52740 B 3.9 2.8 81848 81817 52467
193 A 2.8 2.8 1.8 13.4 2 98 A7 105597 96267 190339 95170 96880 67690 61006 B 2.9 2.5 94115 94072 60330
194 A 3.9 3.9 1.4 13.1 2 106 A7 101315 101315 195979 97989 100897 64946 62814 B 3.9 1.5 94663 94663 60682 º Longitudinal column configurations shown in Appendix A, Layouts A1 – A16

Table A.2 Cont. Comprehensive test results and data used in analysis for specimens with confining reinforcement
Hook Slip at Failure Failure
Type fyt dtr Atr,l Ntr str Acti Ncti scti ds ss dcto Ncto As fys
in. ksi in. in.2 in. in.2 in. in. in. in. in.2 ksi
170 A FP 60 0.38 0.11 5 3.00 0.55 5 3.0 0.38 3.50 0.5 2 3.16 60 B 0.162 FP/SS
171 A - FP 60 0.38 0.11 5 3.00 1.20 6 3.0 0.50 1.50 - - 3.16 60 B - FP
172 A FP/SS 60 0.38 0.11 5 3.00 0.88 8 4.0 0.50 4.00 0.375 2 3.16 60 B 0.415 FP/SS
173 A - FP/SS 60 0.38 0.11 5 3.00 - - - 0.50 1.75 - - 3.16 60 B 0.339 FP
174 A - FP 60 0.38 0.11 5 1.75 - - - 0.50 1.75 - - 3.16 60 B 0.321 FB
175 A - FP 60 0.38 0.11 4 2.25 - - - 0.50 1.75 - - 3.16 60 B - FP
176 A - SS 60 0.38 0.11 5 3.00 - - - 0.50 4.00 - - 6.32 60 B - FP/SS
177 A 0.21 SS/FP 60 0.5 0.20 4 4.00 0.88 8 4.0 0.38 3.50 0.375 2 3.16 60 B - FP/SS
178 A - FP/SS 60 0.5 0.20 4 4.00 1.60 8 4.0 0.50 3.50 0.5 1 3.16 60 B - FP/SS
179 A FP/SS 60 0.5 0.20 4 4.00 1.60 8 4.0 0.50 3.50 0.5 1 3.16 60 B SS/FP
180 A - FP/SS 60 0.5 0.20 4 4.00 0.88 8 4.0 0.38 3.50 0.375 2 3.16 60 B - SS/FP
181 A - SS 60 0.5 0.20 4 4.00 1.60 8 4.0 0.50 3.50 0.5 1 3.16 60 B - FP/SS
182 A SS/FP 60 0.5 0.20 4 4.00 1.60 8 4.0 0.50 3.50 0.5 1 3.16 60 B FP/SS
183 A - SS/FP 60 0.5 0.20 1 8.75 2.2 11 4.0 0.50 4.0 0.375 2 4.74 60 B - FP/SS
184 A - SS 60 0.5 0.20 1 8.75 2.2 11 4.0 0.50 4.0 0.375 2 4.74 60 B - SS/FP/TK
185 A - SS/FP 60 0.38 0.11 2 8.00 2 10 4.0 0.50 4.0 0.375 2 4.74 60 B - SS/FP
186 A 0.206 FP/SS 60 0.38 0.11 2 8.00 2.4 12 4.0 0.50 4.0 0.375 2 4.74 60 B - SS
187 A - SS 60 0.38 0.11 2 12.0 2.4 12 4.0 0.50 4.0 - - 4.74 60 B - SS
188 A - SB 60 0.38 0.11 2 8.00 - - - 0.50 3.0 - - 6.32 60 B - SB/FB
189 A - FP 60 0.38 0.11 2 8.00 - - - 0.50 4.5 - - 6.94 120 B FP
190 A - FP/SB 60 0.38 0.11 2 8.00 - - - 0.50 4.5 - - 6.94 120 B - FP/SB
191 A - SS/FP/TK 60 0.38 0.11 2 8.00 2 10 4.0 0.50 4.0 0.375 2 4.74 60 B - SS
192 A - FP/SS 60 0.38 0.11 2 8.00 2.4 12 4.0 0.50 4.0 0.375 2 4.74 60 B - SS/FP/TK
193 A 0.397 SS/FP 60 0.38 0.11 5 4.38 2.4 12 4.0 0.50 4.0 0.375 2 4.74 60 B 0.375 SS/FP
194 A - FP/SS 60 0.38 0.11 5 4.38 2.4 12 4.0 0.50 4.0 0.375 2 4.74 60 B - SS/FP
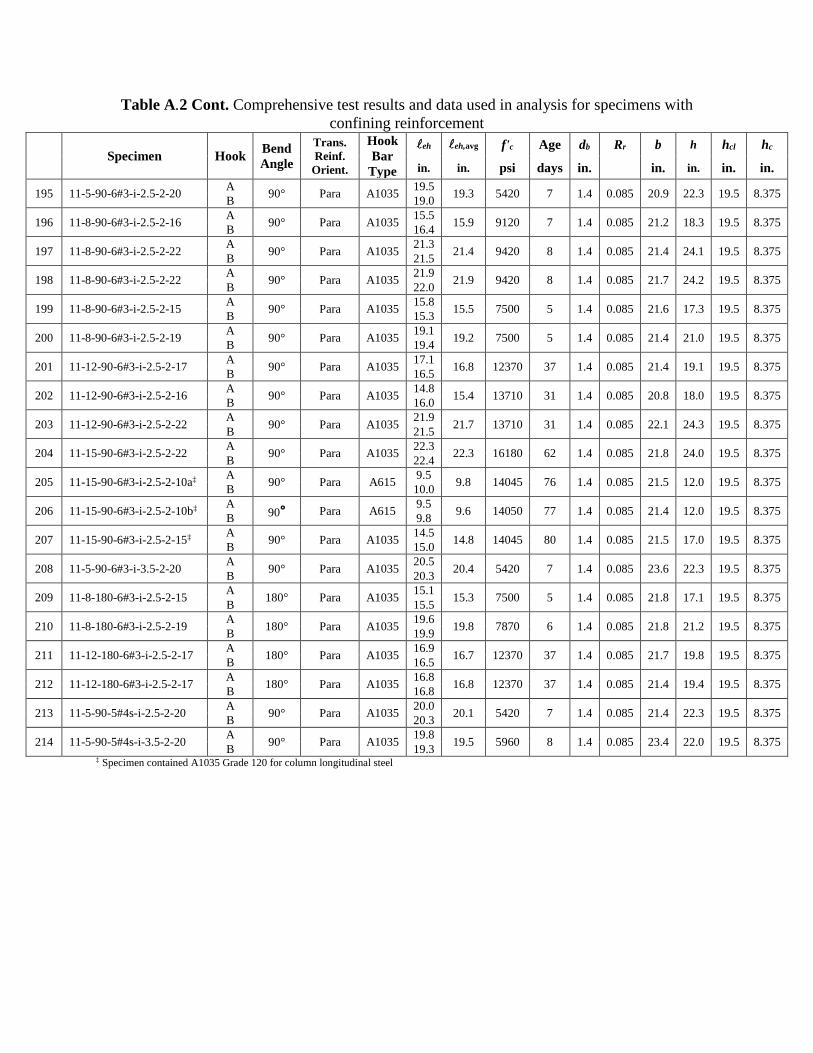
Table A.2 Cont. Comprehensive test results and data used in analysis for specimens with confining reinforcement
Specimen Hook Bend Angle
Trans. Reinf.
Orient.
Hook Bar
Type
eh eh,avg f'c Age db Rr b h hcl hc
in. in. psi days in. in. in. in. in.
195 11-5-90-6#3-i-2.5-2-20 A 90° Para A1035 19.5 19.3 5420 7 1.4 0.085 20.9 22.3 19.5 8.375 B 19.0
196 11-8-90-6#3-i-2.5-2-16 A 90° Para A1035 15.5 15.9 9120 7 1.4 0.085 21.2 18.3 19.5 8.375 B 16.4
197 11-8-90-6#3-i-2.5-2-22 A 90° Para A1035 21.3 21.4 9420 8 1.4 0.085 21.4 24.1 19.5 8.375 B 21.5
198 11-8-90-6#3-i-2.5-2-22 A 90° Para A1035 21.9 21.9 9420 8 1.4 0.085 21.7 24.2 19.5 8.375 B 22.0
199 11-8-90-6#3-i-2.5-2-15 A 90° Para A1035 15.8 15.5 7500 5 1.4 0.085 21.6 17.3 19.5 8.375 B 15.3
200 11-8-90-6#3-i-2.5-2-19 A 90° Para A1035 19.1 19.2 7500 5 1.4 0.085 21.4 21.0 19.5 8.375 B 19.4
201 11-12-90-6#3-i-2.5-2-17 A 90° Para A1035 17.1 16.8 12370 37 1.4 0.085 21.4 19.1 19.5 8.375 B 16.5
202 11-12-90-6#3-i-2.5-2-16 A 90° Para A1035 14.8 15.4 13710 31 1.4 0.085 20.8 18.0 19.5 8.375 B 16.0
203 11-12-90-6#3-i-2.5-2-22 A 90° Para A1035 21.9 21.7 13710 31 1.4 0.085 22.1 24.3 19.5 8.375 B 21.5
204 11-15-90-6#3-i-2.5-2-22 A 90° Para A1035 22.3 22.3 16180 62 1.4 0.085 21.8 24.0 19.5 8.375 B 22.4
205 11-15-90-6#3-i-2.5-2-10a‡ A 90° Para A615 9.5 9.8 14045 76 1.4 0.085 21.5 12.0 19.5 8.375 B 10.0
206 11-15-90-6#3-i-2.5-2-10b‡ A 90° Para A615 9.5 9.6 14050 77 1.4 0.085 21.4 12.0 19.5 8.375 B 9.8
207 11-15-90-6#3-i-2.5-2-15‡ A 90° Para A1035 14.5 14.8 14045 80 1.4 0.085 21.5 17.0 19.5 8.375 B 15.0
208 11-5-90-6#3-i-3.5-2-20 A 90° Para A1035 20.5 20.4 5420 7 1.4 0.085 23.6 22.3 19.5 8.375 B 20.3
209 11-8-180-6#3-i-2.5-2-15 A 180° Para A1035 15.1 15.3 7500 5 1.4 0.085 21.8 17.1 19.5 8.375 B 15.5
210 11-8-180-6#3-i-2.5-2-19 A 180° Para A1035 19.6 19.8 7870 6 1.4 0.085 21.8 21.2 19.5 8.375 B 19.9
211 11-12-180-6#3-i-2.5-2-17 A 180° Para A1035 16.9 16.7 12370 37 1.4 0.085 21.7 19.8 19.5 8.375 B 16.5
212 11-12-180-6#3-i-2.5-2-17 A 180° Para A1035 16.8 16.8 12370 37 1.4 0.085 21.4 19.4 19.5 8.375 B 16.8
213 11-5-90-5#4s-i-2.5-2-20 A 90° Para A1035 20.0 20.1 5420 7 1.4 0.085 21.4 22.3 19.5 8.375 B 20.3
214 11-5-90-5#4s-i-3.5-2-20 A 90° Para A1035 19.8 19.5 5960 8 1.4 0.085 23.4 22.0 19.5 8.375 B 19.3 ‡ Specimen contained A1035 Grade 120 for column longitudinal steel

Table A.2 Cont. Comprehensive test results and data used in analysis for specimens with confining reinforcement
Hook cso cso,avg cth ch Nh Axial Load Long.
Reinf. Layouto
Tmax Tind Ttotal T Th fsu,max fsu
in. in. in. in. kips lb lb lb lb lb psi psi
195 A 2.6 2.6 2.8 12.9 2 130 A7 153119 137617 272543 136272 131706 98153 87354 B 2.6 3.3 134977 134927 86524
196 A 2.5 2.5 2.8 13.4 2 108 A16 147508 136385 265971 132986 126362 94556 85247 B 2.5 1.9 129692 129586 83136
197 A 2.5 2.6 2.8 13.5 2 145 A11 204260 186246 369138 184569 166360 130936 118314 B 2.6 2.6 183175 182892 117420
198 A 2.6 2.8 2.3 13.4 2 147 A16 197739 190740 382084 191042 170431 126756 122463 B 2.9 2.2 191344 191344 122656
199 A 2.8 2.6 1.5 13.5 2 104 A13 142278 108602 216623 108312 117618 91204 69431 B 2.5 2.0 108021 108021 69245
200 A 2.5 2.6 2.0 13.5 2 126 A13 182735 144766 290860 145430 142479 117138 93224 B 2.6 1.7 146093 146093 93650
201 A 2.6 2.8 1.9 13.0 2 114 A13 179693 161019 323295 161648 142884 115188 103620 B 3.0 2.6 162285 162277 104029
202 A 2.5 2.5 3.3 13.0 2 105 A7 115139 115089 230394 115197 135193 73807 73844 B 2.5 2.0 127542 115306 81758
203 A 2.9 3.0 2.4 13.3 2 150 A12 206283 203983 402379 201189 185650 132233 128967 B 3.1 2.8 199234 198395 127714
204 A 3.0 2.8 1.8 13.5 2 147 A10 204557 200084 395618 197809 199073 131126 126801 B 2.5 1.6 195710 195534 125455
205 A 2.6 2.7 2.5 13.4 2 72 A15 83558 83558 165362 82681 91774 53563 53001 B 2.8 2.0 81804 81804 52438
206 A 2.8 2.8 2.5 13.0 2 72 A10 76605 76605 151158 75579 90813 49106 48448 B 2.8 2.3 74596 74553 47818
207 A 2.6 2.6 2.5 13.6 2 102 A15 145670 145664 290534 145267 131029 93378 93120 B 2.6 2.0 144870 144870 92866
208 A 3.8 3.8 1.8 13.1 2 147 A7 150216 136607 271643 135821 138606 96293 87065 B 3.9 2.0 135259 135036 86704
209 A 2.9 3.0 2.0 13.0 2 104 A13 112423 112423 223356 111678 116374 72066 71588 B 3.1 1.6 110981 110933 71142
210 A 2.9 2.9 1.5 13.3 2 129 A13 170000 149000 298000 149000 147821 108974 95513 B 2.9 1.3 149000 149000 95513
211 A 2.6 2.7 2.9 13.5 2 120 A7 123150 115105 232743 116371 141920 78942 74597 B 2.8 3.3 117638 117638 75409
212 A 2.5 2.6 2.7 13.4 2 117 A13 148872 148872 297356 148678 142643 95431 95306 B 2.8 2.6 173034 148484 110919
213 A 2.5 2.6 2.3 13.4 2 134 A7 141399 141399 282090 141045 155218 90640 90414 B 2.8 2.0 161640 140691 103615
214 A 3.8 3.8 2.3 13.1 2 144 A7 186703 152402 305934 152967 154532 119681 98056 B 3.8 2.8 153546 153532 98427 º Longitudinal column configurations shown in Appendix A, Layouts A1 – A16

Table A.2 Cont. Comprehensive test results and data used in analysis for specimens with confining reinforcement
Hook Slip at Failure Failure
Type fyt dtr Atr,l Ntr str Acti Ncti scti ds ss dcto Ncto As fys
in. ksi in. in.2 in. in.2 in. in. in. in. in.2 ksi
195 A 0.274 FP/SS 60 0.38 0.11 6 4.00 1.2 6 4.0 0.50 4.0 0.375 2 4.74 60 B - FP/SS
196 A - FP/SS 60 0.38 0.11 6 4.00 - - - 0.50 6.0 - - 9.48 60 B - FP/SS
197 A - * 60 0.38 0.11 6 4.00 - - - 0.50 2.5 - - 6.32 60 B - SS
198 A - * 60 0.38 0.11 6 4.00 - - - 0.50 6.0 - - 9.48 60 B - SB/FB
199 A - SS 60 0.38 0.11 6 4.00 - - - 0.50 6.0 - - 9.40 60 B - SS/FP
200 A - FB/SS 60 0.38 0.11 6 4.00 - - - 0.50 6.0 - - 9.40 60 B - FB/SS
201 A 0.334 FB/SB 60 0.38 0.11 6 4.00 - - - 0.50 6.0 - - 9.40 60 B - SP/SS
202 A - SS/FP 60 0.38 0.11 6 4.00 2.4 12 4.0 0.50 4.0 0.375 1 4.74 60 B 0.952 SB/FB
203 A - SS/FB 60 0.38 0.11 6 4.00 3.06 12 4.0 0.50 4.0 0.375 2 6.32 60 B - FB
204 A - FB/SS 60 0.38 0.11 6 4.00 - - - 0.50 3.0 - - 6.32 60 B - SB/FB
205 A - FP 60 0.38 0.11 6 4.00 - - - 0.50 4.5 - - 6.94 120 B - FP
206 A FP 60 0.38 0.11 6 4.00 - - - 0.50 4.5 - - 6.32 120 B - FP
207 A - FP 60 0.38 0.11 6 4.00 - - - 0.50 4.5 - - 6.94 120 B - FP
208 A - SS/FP 60 0.38 0.11 6 4.00 1.2 6 4.0 0.50 4.0 0.375 2 4.74 60 B - SS
209 A - SS 60 0.38 0.11 6 4.00 - - - 0.50 6.0 - - 9.40 60 B - SS
210 A - FB/SS 60 0.38 0.11 6 4.00 - - - 0.50 6.0 - - 9.40 60 B - FB/SS
211 A - FP 60 0.38 0.11 6 4.00 - - - 0.50 3.0 - - 4.74 60 B 0.379 FP/SB
212 A - FP/SS 60 0.38 0.11 6 4.00 - - - 0.50 6.0 - - 9.40 60 B - SB/FB
213 A - FP/SS 60 0.5 0.20 5 5.00 4 10 5.0 0.50 5.0 0.375 2 4.74 60 B - FP/SS
214 A - SS/FP 60 0.5 0.20 5 5.00 4 10 5.0 0.50 5.0 0.375 2 4.74 60 B - FP/SS *Test terminated prior to failure of second hooked bar

Table A.3 Test results for specimens from other researchers referenced in this study used in analysis for specimens without confining reinforcement
Specimen Bend Angle
eh fcm fy db b hcl hc cso cth ch Nh Ah dtr Atr† Ntr str T
in. psi psi in. in. in. in. in. in. in. in.2 in. in.2 in. lb
Mar
ques
and
Jir
sa (1
975)
J7-180-12-1H 180° 10.0 4350 64000 0.88 12 11.5 6 2.88 2.0 4.5 2 0.60 - - - - 36600
J7-180-15-1 H 180° 13.0 4000 64000 0.88 12 11.5 6 2.88 2.0 4.5 2 0.60 - - - - 52200
J7-90-12-1H 90° 10.0 4150 64000 0.88 12 11.5 6 2.88 2.0 4.5 2 0.60 - - - - 37200
J7-90-15-1-H 90° 13.0 4600 64000 0.88 12 11.5 6 2.88 2.0 4.5 2 0.60 - - - - 54600
J7-90-15-1- L 90° 13.0 4800 64000 0.88 12 11.5 6 2.88 2.0 4.5 2 0.60 - - - - 58200
J7-90-15-1M 90° 13.0 5050 64000 0.88 12 11.5 6 2.88 2.0 4.5 2 0.60 - - - - 60000 J11-180-15-1H 180° 13.1 4400 68000 1.41 12 11.3 6 2.88 1.5 3.4 2 1.56 - - - - 70200
J11-90-12-1H 90° 10.1 4600 68000 1.41 12 11.3 6 2.88 1.5 3.4 2 1.56 - - - - 65520
J11-90-15-1H 90° 13.1 4900 68000 1.41 12 11.3 6 2.88 1.5 3.4 2 1.56 - - - - 74880
J11-90-15-1L 90° 13.1 4750 68000 1.41 12 11.3 6 2.88 1.5 3.4 2 1.56 - - - - 81120
Pinc
et a
l. (1
977)
9-12 90° 10.0 4700 65000 1.13 12 * * 2.88 2 4 2 1.0 - - - 47000
9-18 90° 16.0 4700 65000 1.13 12 * * 2.88 2 4 2 1.0 - - - 74000
11-24 90° 22.1 4200 60000 1.41 12 * * 2.88 2 3.4 2 1.56 - - - 120120
11-15 90° 13.1 5400 60000 1.41 12 * * 2.88 2 3.4 2 1.56 - - - 78000
11-18 90° 16.1 4700 60000 1.41 12 * * 2.88 2 3.4 2 1.56 - - - 90480
11-21 90° 19.1 5200 60000 1.41 12 * * 2.88 2 3.4 2 1.56 - - - 113880
Ham
ad e
t al.
(199
3) 7-90-U 90° 10.0 2570 60000a 0.88 12 11 6 3 2 4.25 2 0.60 - - - - 25998
7-90-U' 90° 10.0 5400 60000a 0.88 12 11 6 3 2 4.25 2 0.60 - - - - 36732
11-90-U 90° 13.0 2570 60000a 1.41 12 11 6 3 2 3.18 2 1.56 - - - - 48048
11-90-U' 90° 13.0 5400 60000a 1.41 12 11 6 3 2 3.18 2 1.56 - - - - 75005
11-180-U-HS 180° 13.0 7200 60000a 1.41 12 11 6 3 2 3.18 2 1.56 - - - - 58843
11-90-U-HS 90° 13.0 7200 60000a 1.41 12 11 6 3 2 3.18 2 1.56 - - - - 73788
Ram
irez
& R
usse
l (20
08) I-1 90° 6.5 8910 81900 0.75 15 12 6 2.5 2.5 8.5 2 0.44 - - - - 30000
I-3 90° 6.5 12460 81900 0.75 15 12 6 2.5 2.5 8.5 2 0.44 - - - - 30000
I-5 90° 6.5 12850 81900 0.75 15 12 6 2.5 2.5 8.5 2 0.44 - - - - 30500
I-2 90° 12.5 8910 63100 1.41 15 12 6 2.5 2.5 7.18 2 1.56 - - - - 88000
I-2' 90° 15.5 9540 63100 1.41 15 12 6 2.5 2.5 7.18 2 1.56 - - - - 105000
I-4 90° 12.5 12460 63100 1.41 15 12 6 2.5 2.5 7.18 2 1.56 - - - - 99100
I-6 90° 12.5 12850 63100 1.41 15 12 6 2.5 2.5 7.18 2 1.56 - - - - 114000
Lee
&
Park
(2
010)
H1 90° 18.7 4450 87000 0.88 14.6 * * 3 2 7 2 0.6 - - - - 86345
H2 90° 11.9 8270 87000 0.88 14.6 * * 3 2 7 2 0.6 - - - - 76992 †60,000 psi nominal yield strength for all transverse reinforcement *Information not provided a Nominal value