Controversies about sepsis - ESIM2015 IN SEPSIS... · Controversies in sepsis Daniele Coen Doctor...
67
Controversies in sepsis Daniele Coen Doctor 1 Doctor 2
Transcript of Controversies about sepsis - ESIM2015 IN SEPSIS... · Controversies in sepsis Daniele Coen Doctor...
Controversies in sepsis
Daniele CoenDoctor 1Doctor 2
1
How do we define sepsis and septicshock ?
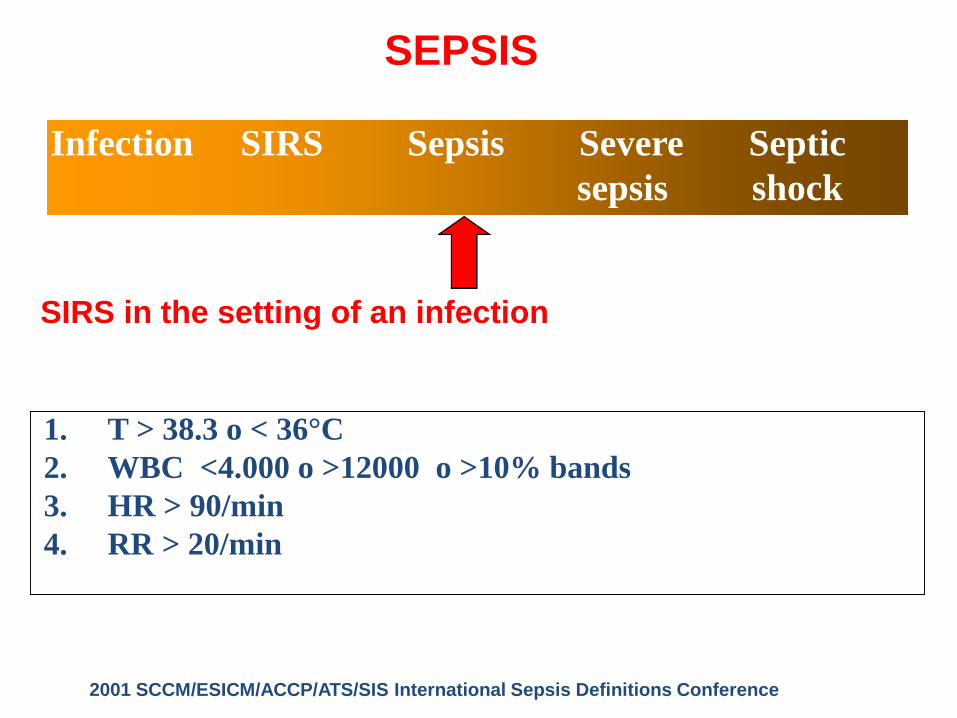
Infection SIRS Sepsis Severe Septicsepsis shock
1. T > 38.3 o < 36°C2. WBC <4.000 o >12000 o >10% bands3. HR > 90/min4. RR > 20/min
SEPSIS
2001 SCCM/ESICM/ACCP/ATS/SIS International Sepsis Definitions Conference
SIRS in the setting of an infection

Yet…

2001 SCCM/ESICM/ACCP/ATS/SISInternational Sepsis Definitions Conference Inte. Care Med (2003) 29:530–538
Diagnostic criteria forsepsis
N Engl J Med. 2015;372:1629-1638.
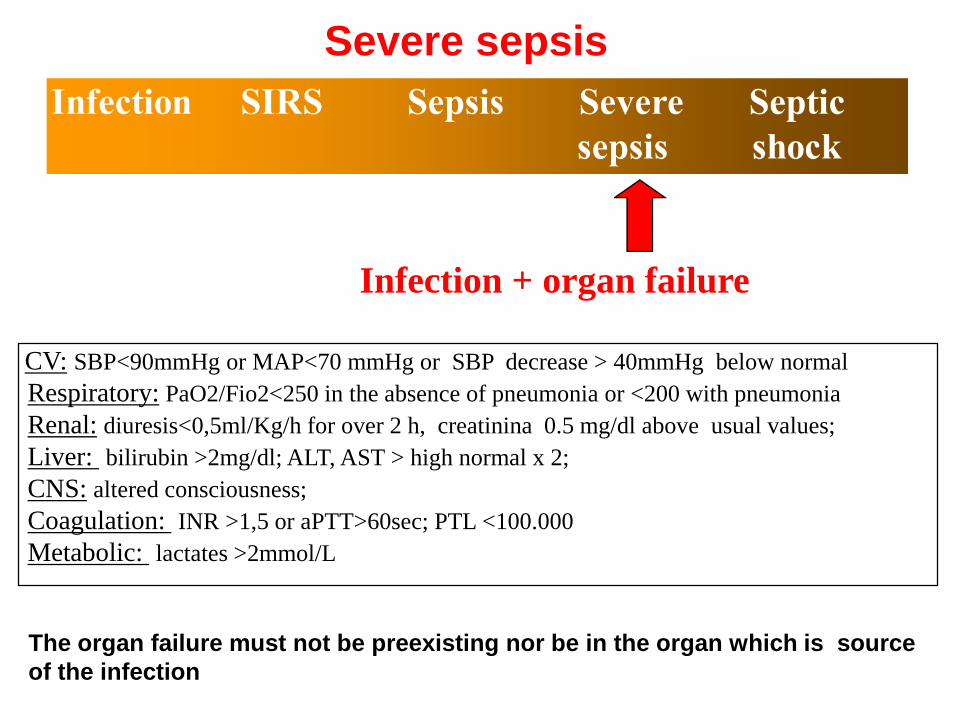
CV: SBP<90mmHg or MAP<70 mmHg or SBP decrease > 40mmHg below normal -Respiratory: PaO2/Fio2<250 in the absence of pneumonia or <200 with pneumonia-Renal: diuresis<0,5ml/Kg/h for over 2 h, creatinina 0.5 mg/dl above usual values;-Liver: bilirubin >2mg/dl; ALT, AST > high normal x 2;-CNS: altered consciousness;-Coagulation: INR >1,5 or aPTT>60sec; PTL <100.000 -Metabolic: lactates >2mmol/L
Infection + organ failure
Severe sepsis
The organ failure must not be preexisting nor be in the organ which is source of the infection
99
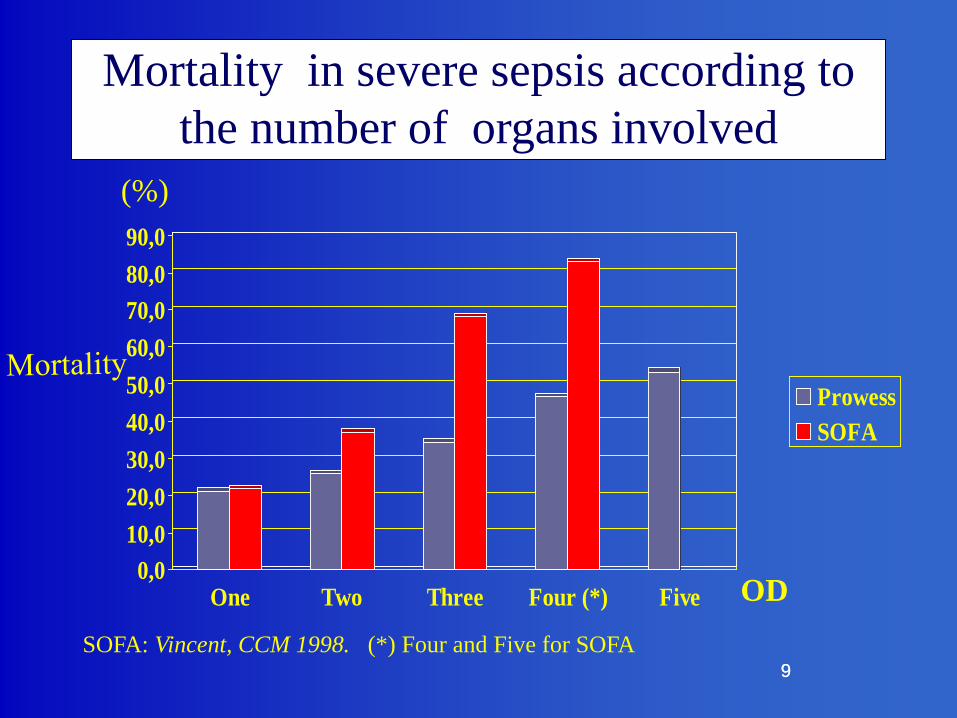
0,010,020,030,040,050,060,070,080,090,0
One Two Three Four (*) Five
ProwessSOFA
Mortality in severe sepsis according to the number of organs involved
(%)
ODSOFA: Vincent, CCM 1998. (*) Four and Five for SOFA
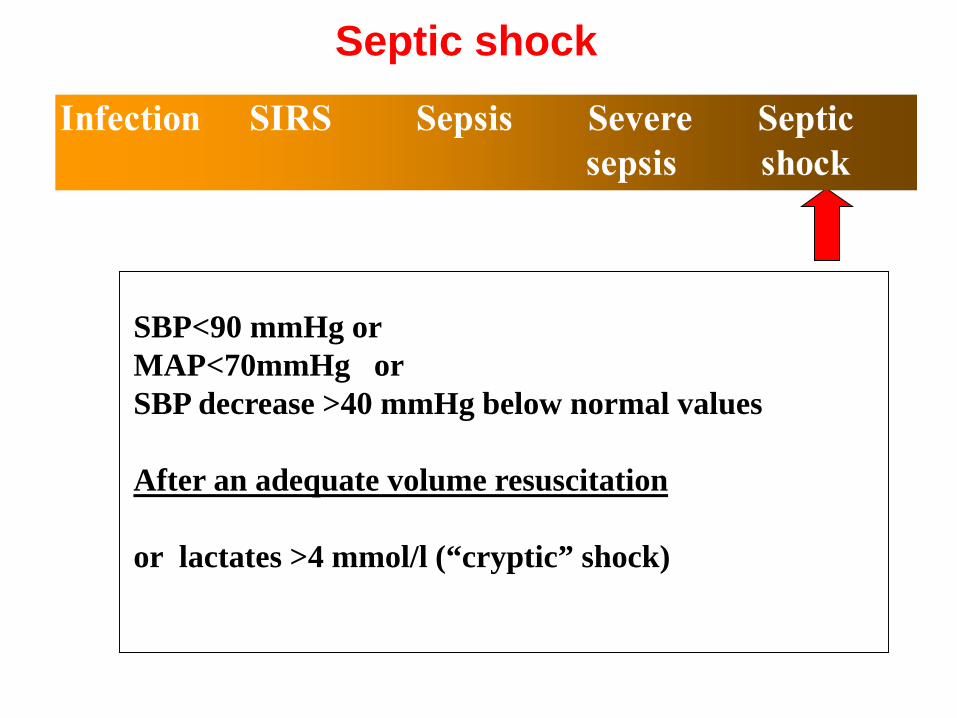
SBP<90 mmHg or MAP<70mmHg orSBP decrease >40 mmHg below normal values
After an adequate volume resuscitation
or lactates >4 mmol/l (“cryptic” shock)
Septic shock

Yet…
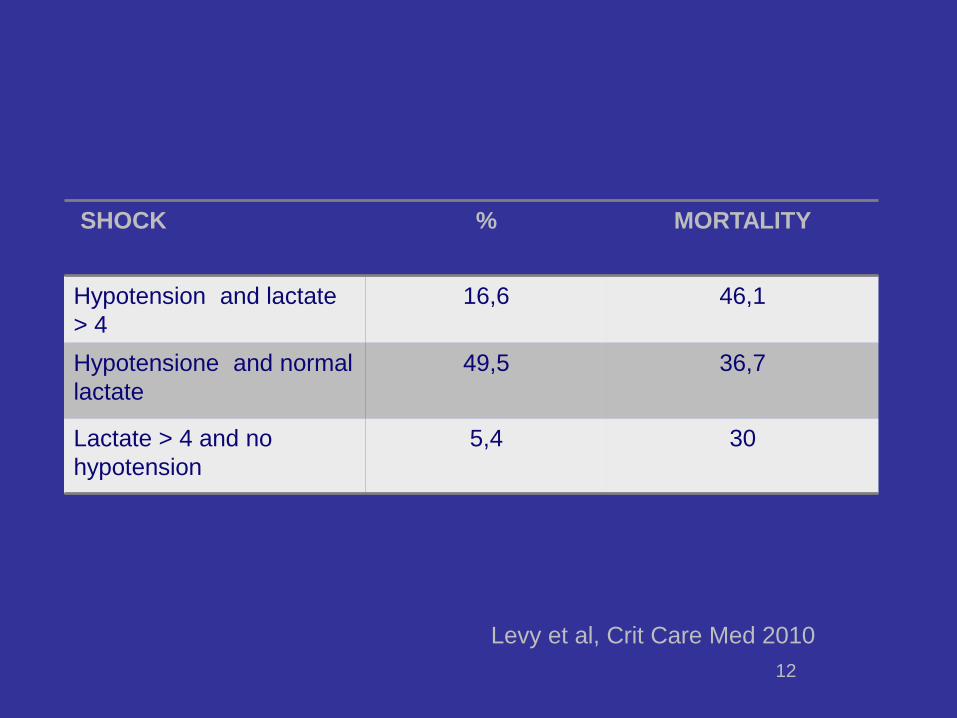
SHOCK % MORTALITY
Hypotension and lactate> 4
16,6 46,1
Hypotensione and normallactate
49,5 36,7
Lactate > 4 and no hypotension
5,4 30
Levy et al, Crit Care Med 201012
2
Should we use CVP as an index of fluidresponsiveness ?
Pros
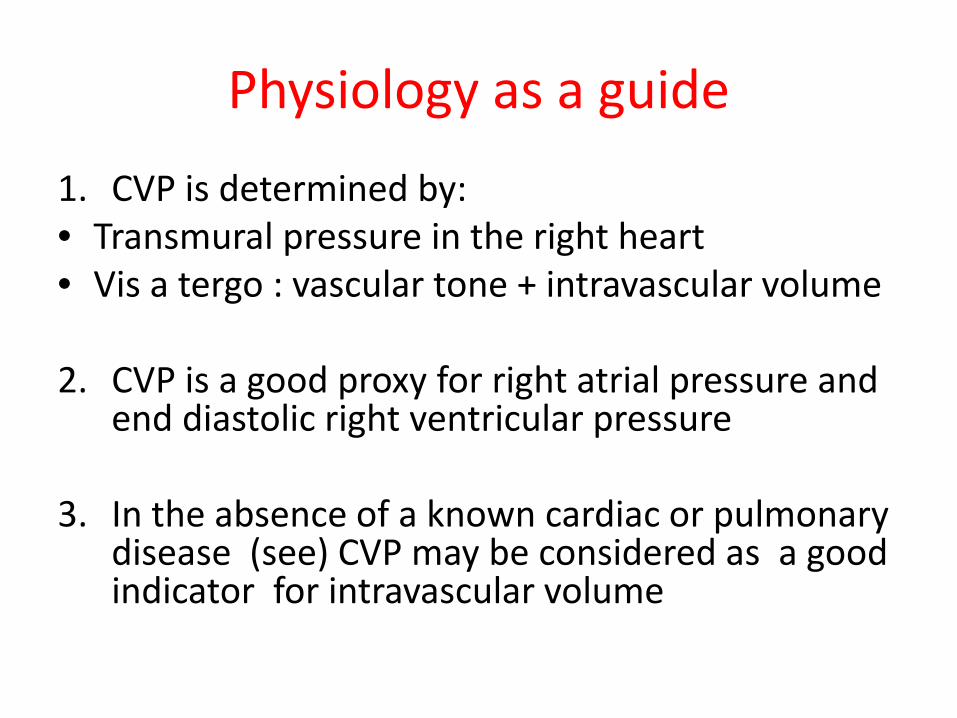
Physiology as a guide
1. CVP is determined by: • Transmural pressure in the right heart• Vis a tergo : vascular tone + intravascular volume
2. CVP is a good proxy for right atrial pressure and end diastolic right ventricular pressure
3. In the absence of a known cardiac or pulmonarydisease (see) CVP may be considered as a goodindicator for intravascular volume
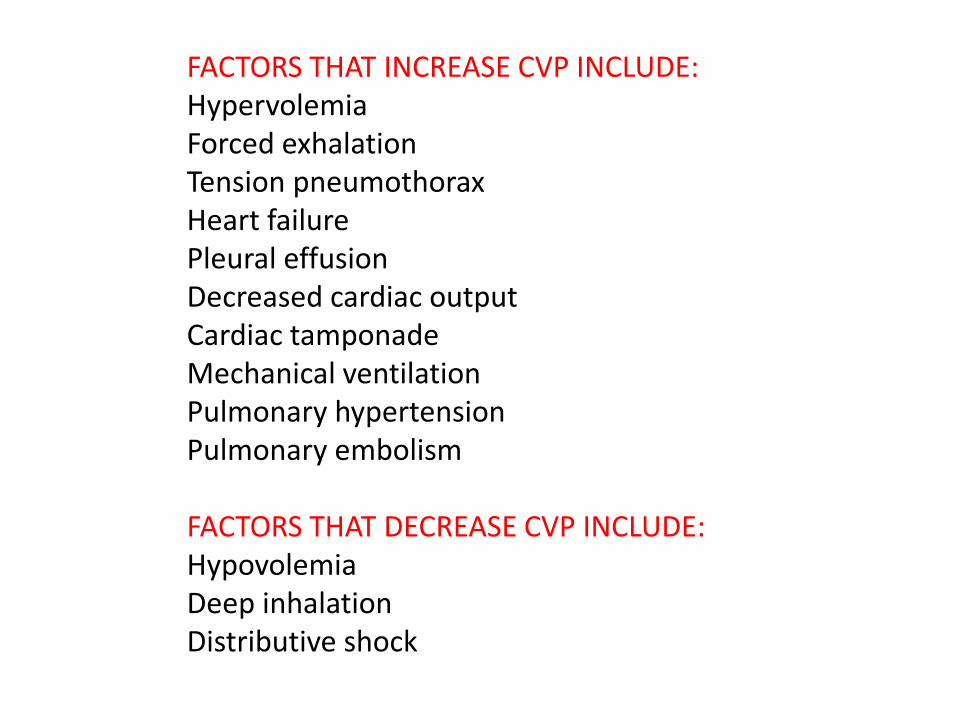
FACTORS THAT INCREASE CVP INCLUDE:HypervolemiaForced exhalationTension pneumothoraxHeart failurePleural effusionDecreased cardiac outputCardiac tamponadeMechanical ventilationPulmonary hypertensionPulmonary embolism
FACTORS THAT DECREASE CVP INCLUDE:HypovolemiaDeep inhalationDistributive shock
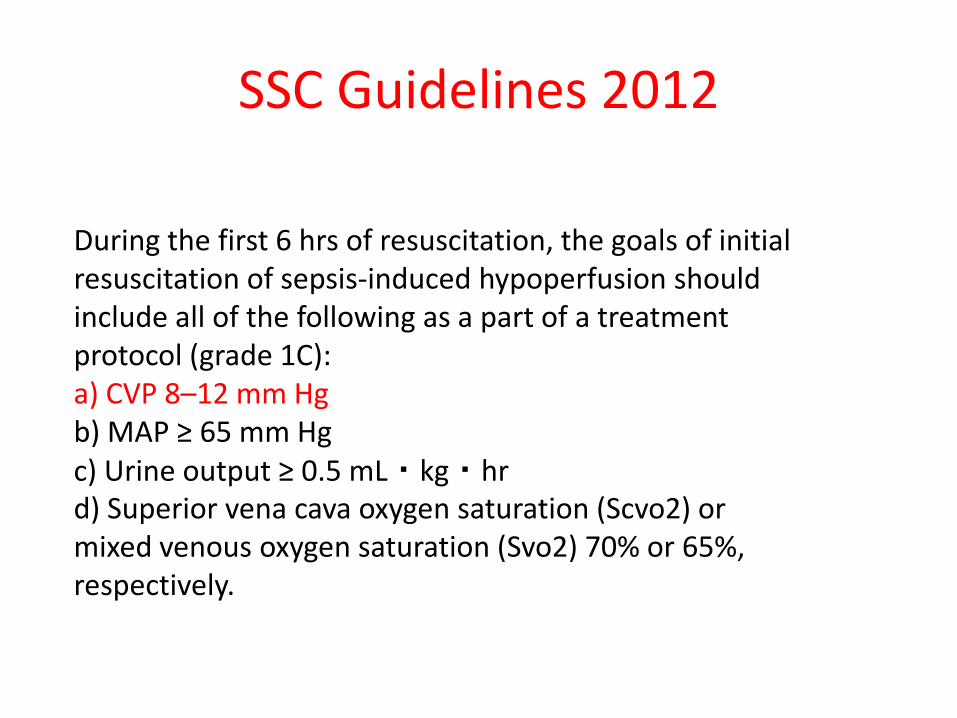
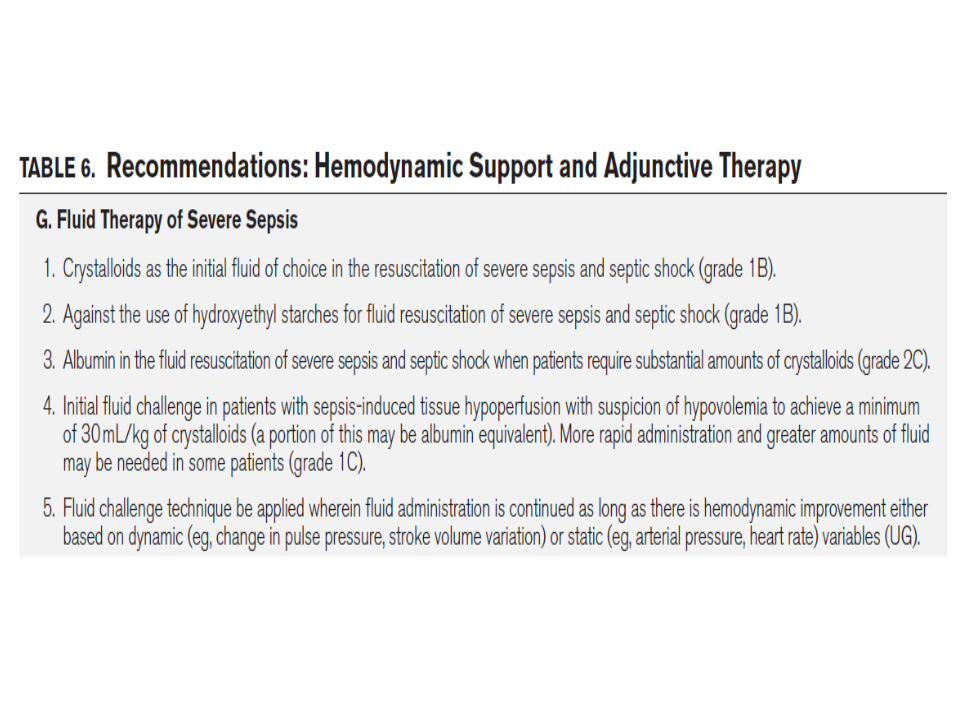
SSC Guidelines 2012
During the first 6 hrs of resuscitation, the goals of initial resuscitation of sepsis-induced hypoperfusion should include all of the following as a part of a treatment protocol (grade 1C):a) CVP 8–12 mm Hgb) MAP ≥ 65 mm Hgc) Urine output ≥ 0.5 mL・kg・hrd) Superior vena cava oxygen saturation (Scvo2) ormixed venous oxygen saturation (Svo2) 70% or 65%, respectively.
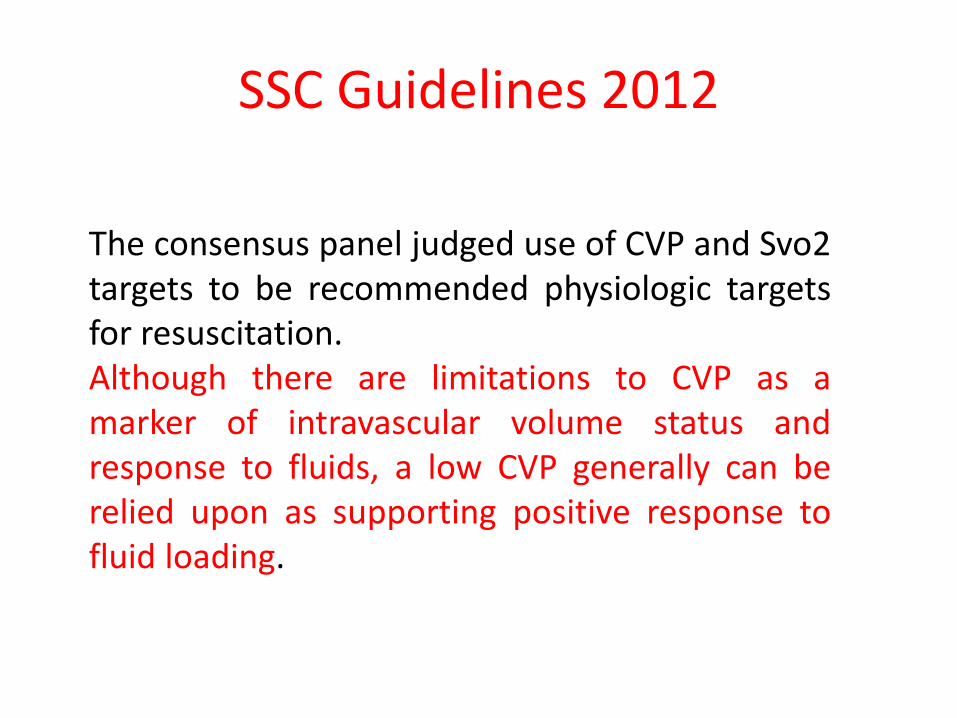
SSC Guidelines 2012
The consensus panel judged use of CVP and Svo2targets to be recommended physiologic targetsfor resuscitation.Although there are limitations to CVP as amarker of intravascular volume status andresponse to fluids, a low CVP generally can berelied upon as supporting positive response tofluid loading.
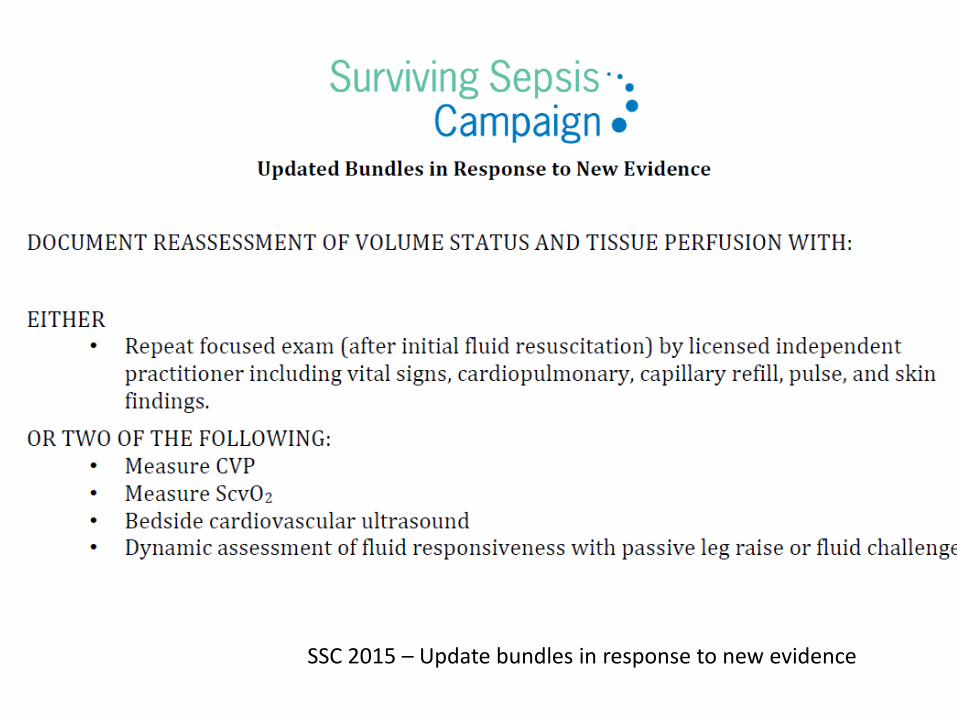
SSC 2015 – Update bundles in response to new evidence
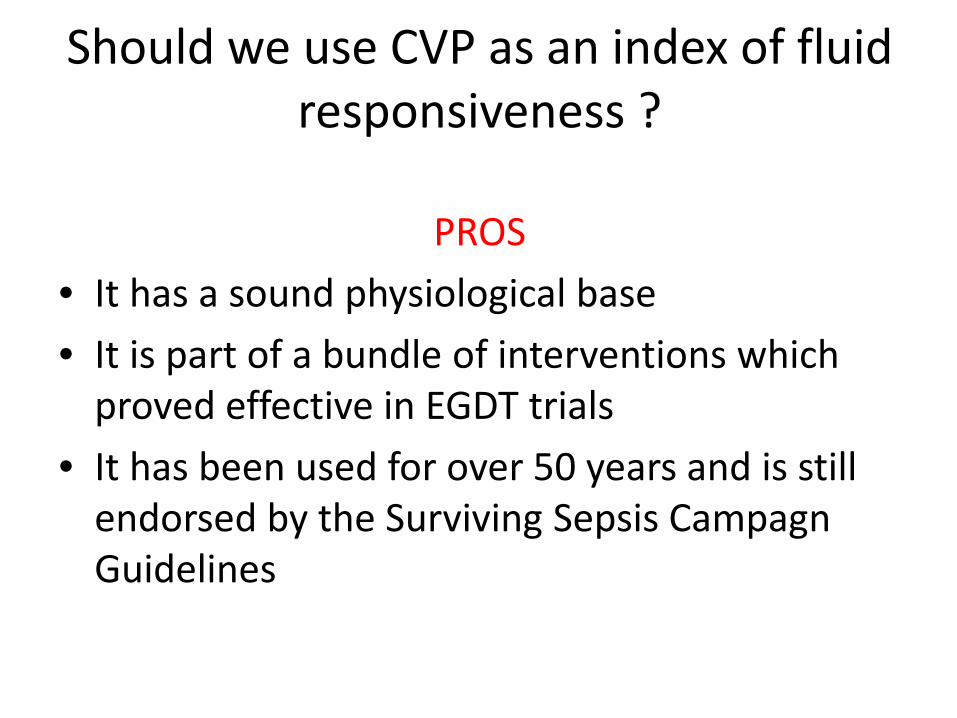
Should we use CVP as an index of fluidresponsiveness ?
PROS• It has a sound physiological base• It is part of a bundle of interventions which
proved effective in EGDT trials• It has been used for over 50 years and is still
endorsed by the Surviving Sepsis CampagnGuidelines
2
Should we use CVP as an index of fluidresponsiveness ?
Cons
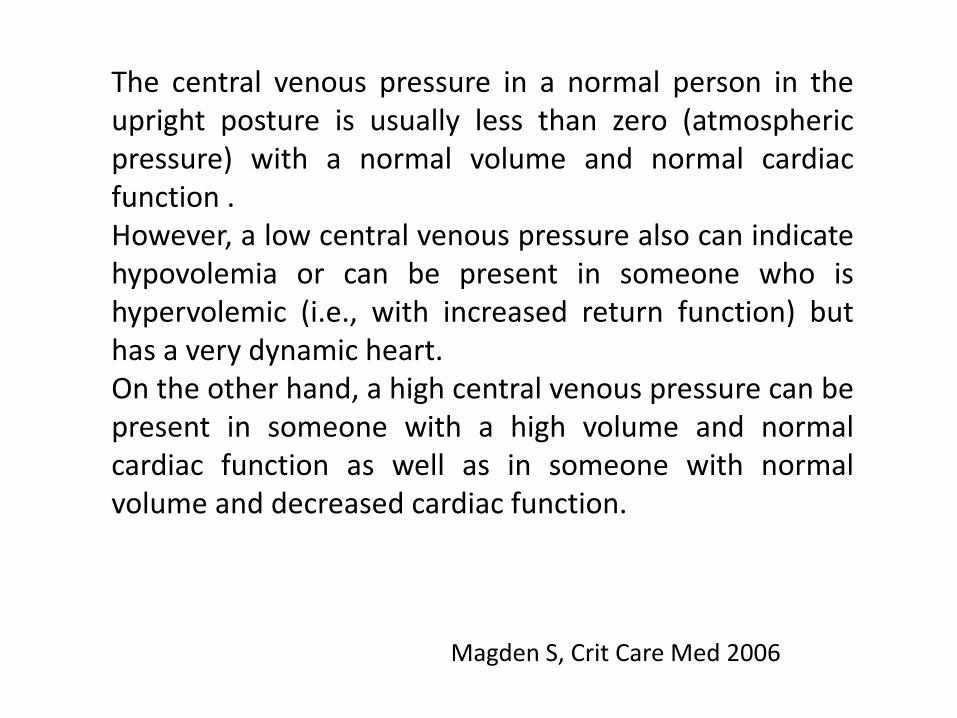
The central venous pressure in a normal person in theupright posture is usually less than zero (atmosphericpressure) with a normal volume and normal cardiacfunction .However, a low central venous pressure also can indicatehypovolemia or can be present in someone who ishypervolemic (i.e., with increased return function) buthas a very dynamic heart.On the other hand, a high central venous pressure can bepresent in someone with a high volume and normalcardiac function as well as in someone with normalvolume and decreased cardiac function.
Magden S, Crit Care Med 2006
Fundamentally, the only reason to give any patient a fluid challenge is to increase their stroke volume
Marik PE. BJA 2014
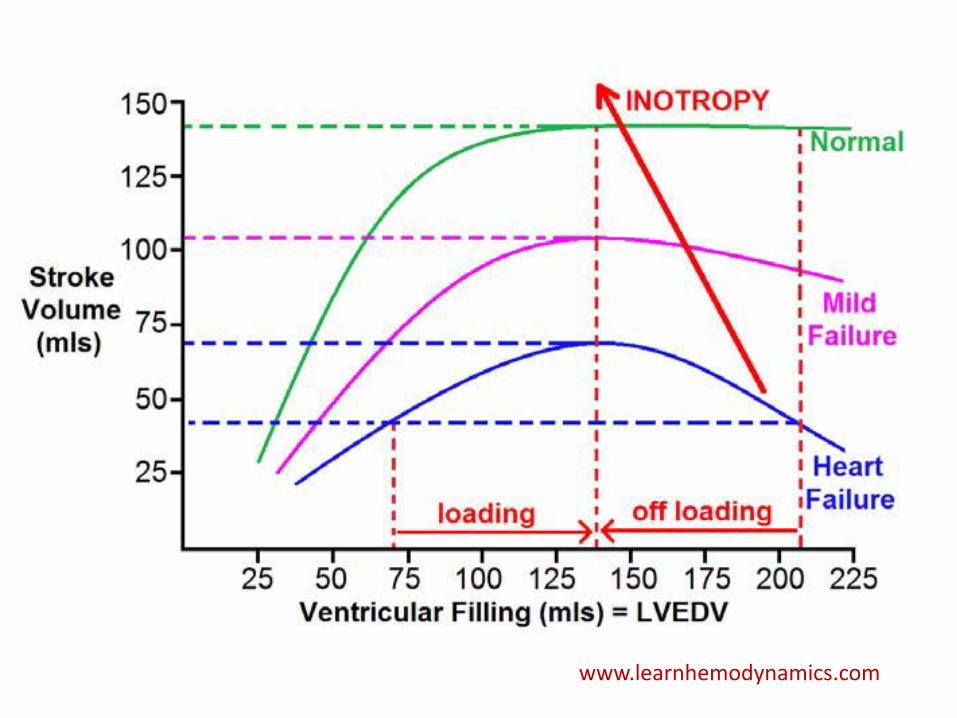
Think in terms of stroke volume

DO2 = CO x CaO2

www.learnhemodynamics.com
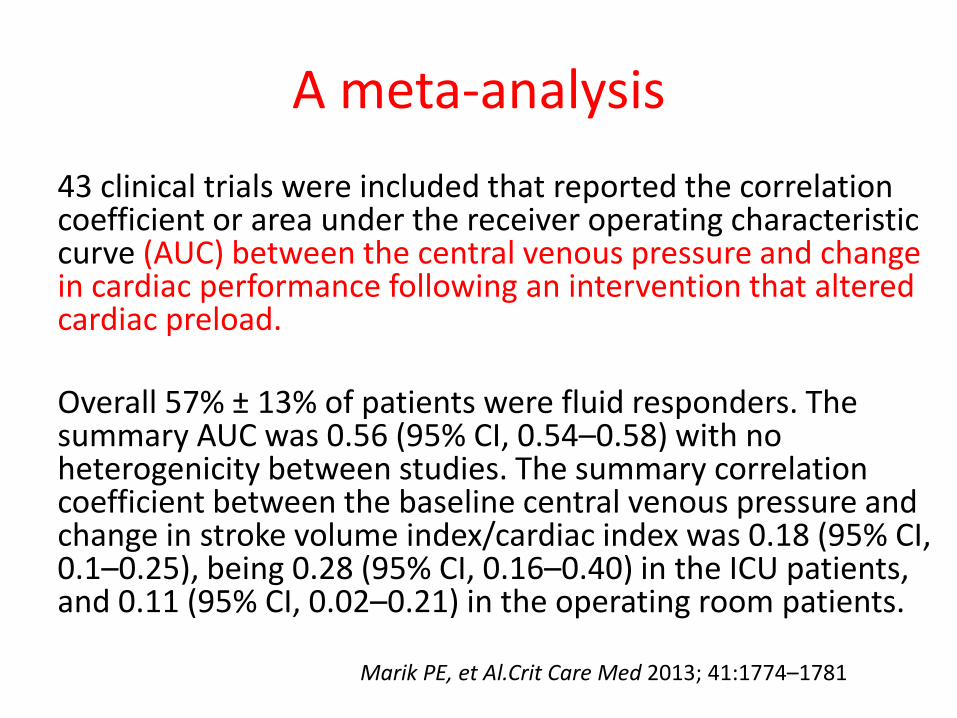
A meta-analysis43 clinical trials were included that reported the correlation coefficient or area under the receiver operating characteristic curve (AUC) between the central venous pressure and change in cardiac performance following an intervention that altered cardiac preload.
Overall 57% ± 13% of patients were fluid responders. The summary AUC was 0.56 (95% CI, 0.54–0.58) with no heterogenicity between studies. The summary correlation coefficient between the baseline central venous pressure and change in stroke volume index/cardiac index was 0.18 (95% CI, 0.1–0.25), being 0.28 (95% CI, 0.16–0.40) in the ICU patients, and 0.11 (95% CI, 0.02–0.21) in the operating room patients.
Marik PE, et Al.Crit Care Med 2013; 41:1774–1781
It has been well established that there is norelationship between the CVP and intravascularvolume and no relationship between the CVPand fluid responsiveness. Consequently, Ibelieve that the CVP should not be used toguide fluid therapy.
Marik PE, Chest 2014

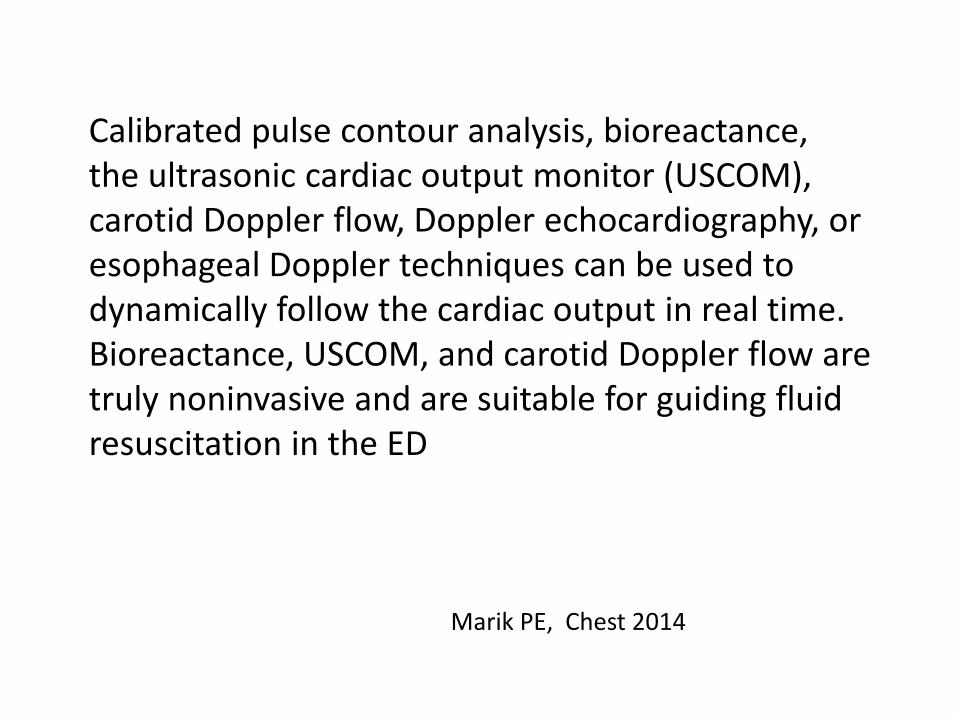
Calibrated pulse contour analysis, bioreactance,the ultrasonic cardiac output monitor (USCOM),carotid Doppler flow, Doppler echocardiography, oresophageal Doppler techniques can be used to dynamically follow the cardiac output in real time. Bioreactance, USCOM, and carotid Doppler flow are truly noninvasive and are suitable for guiding fluid resuscitation in the ED
Marik PE, Chest 2014
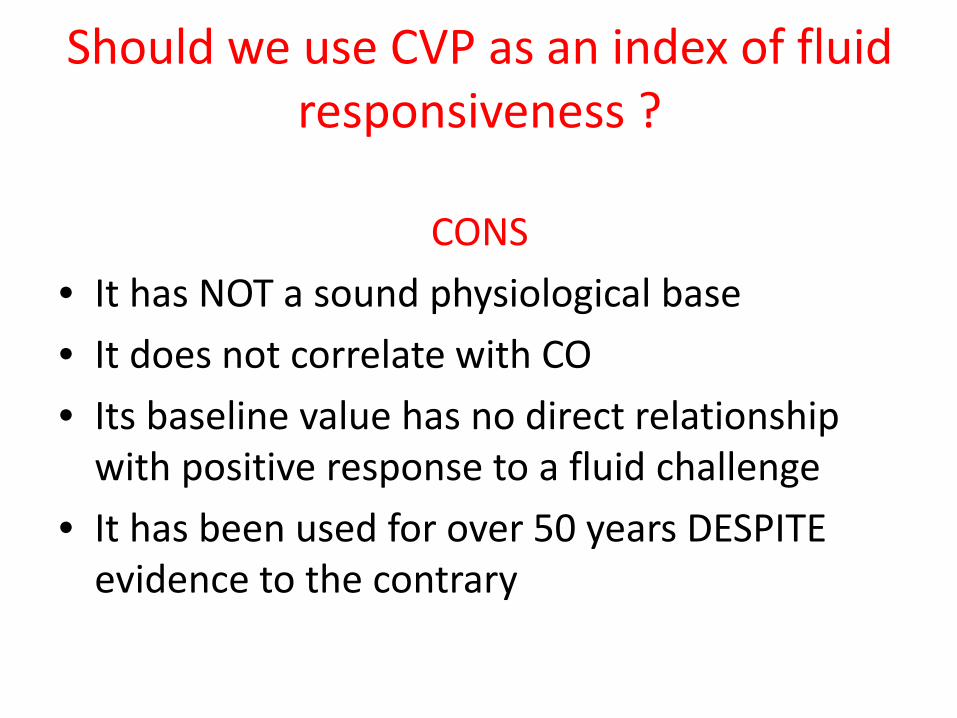
Should we use CVP as an index of fluidresponsiveness ?
CONS• It has NOT a sound physiological base• It does not correlate with CO• Its baseline value has no direct relationship
with positive response to a fluid challenge• It has been used for over 50 years DESPITE
evidence to the contrary
3
Should we give a large amount of fluids in the resuscitative phase of
severe sepsis?
Pros
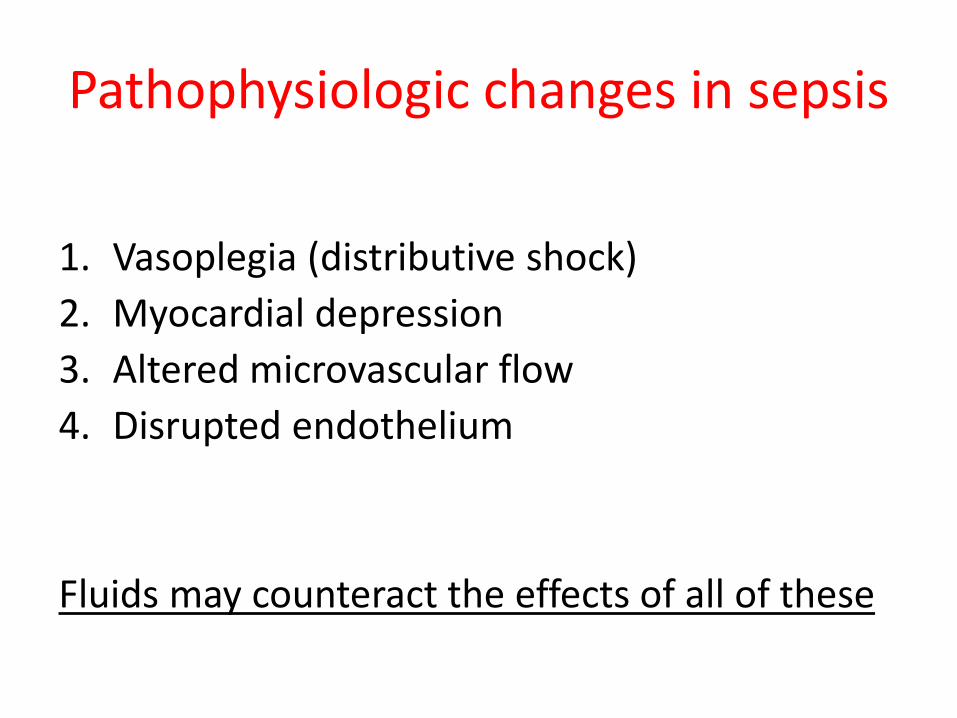
Pathophysiologic changes in sepsis
1. Vasoplegia (distributive shock)2. Myocardial depression3. Altered microvascular flow4. Disrupted endothelium
Fluids may counteract the effects of all of these
In-hospital mortality
(all patients)
0102030405060 Standard therapy
EGDT
28-day mortality
60-day mortality
Mo
rtal
ity
(%)
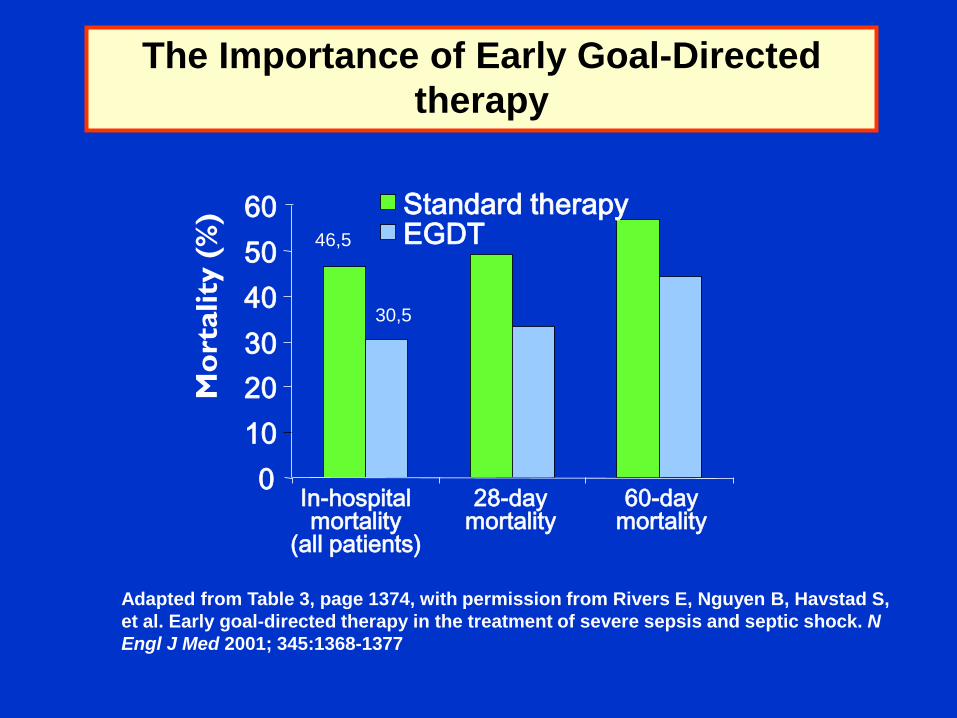
The Importance of Early Goal-Directed therapy
Adapted from Table 3, page 1374, with permission from Rivers E, Nguyen B, Havstad S, et al. Early goal-directed therapy in the treatment of severe sepsis and septic shock. N Engl J Med 2001; 345:1368-1377
46,5
30,5
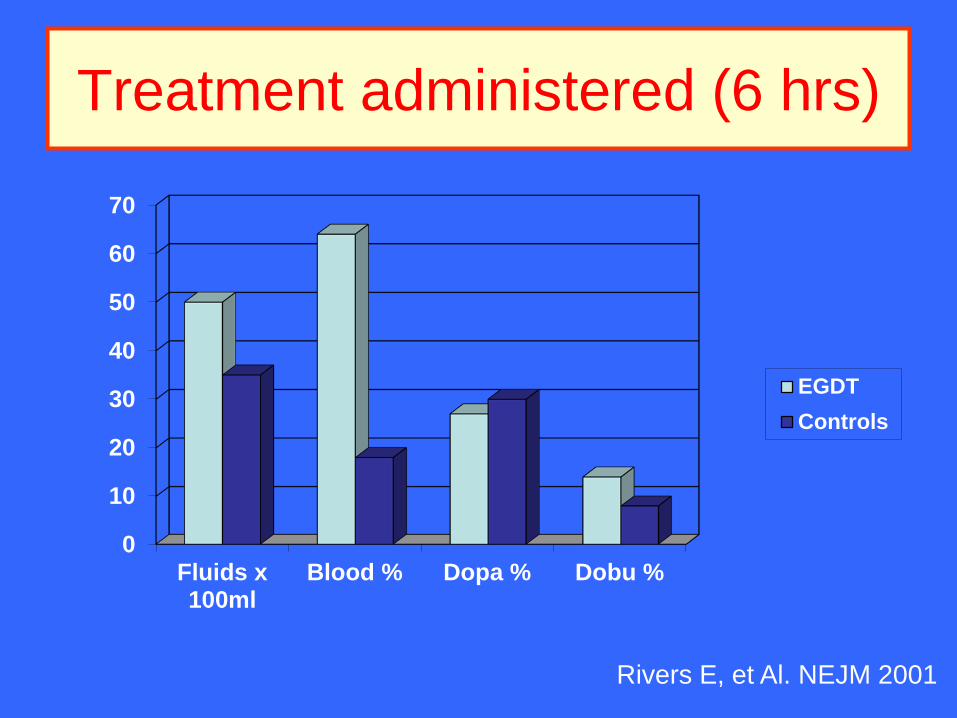
Treatment administered (6 hrs)
0
10
20
30
40
50
60
70
Fluids x100ml
Blood % Dopa % Dobu %
EGDTControls
Rivers E, et Al. NEJM 2001
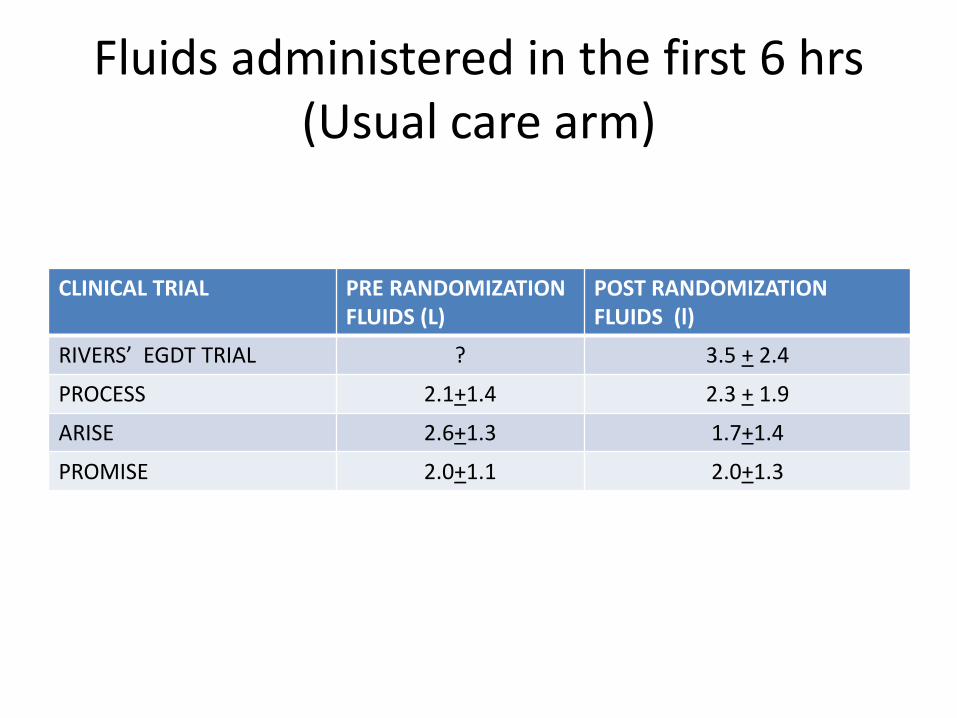
Fluids administered in the first 6 hrs(Usual care arm)
CLINICAL TRIAL PRE RANDOMIZATION FLUIDS (L)
POST RANDOMIZATION FLUIDS (l)
RIVERS’ EGDT TRIAL ? 3.5 + 2.4
PROCESS 2.1+1.4 2.3 + 1.9
ARISE 2.6+1.3 1.7+1.4
PROMISE 2.0+1.1 2.0+1.3
Should we give a large amount of fluids in the resuscitative phase of sepsis?
PROS
• Septic patients are hypovolemic because of vasoplegia and endothelial disruption
• Intravascular volume is a basic determinant of CO
• Patients in sepsis studies have all received an average of 4L fluids during thef first 6 hrs (and often more) with low mortality rates
3
Should we give a large amount of fluids in the resuscitative phase of
severe sepsis?
Cons
Physiology is not so simple• Because of the endothelial injury, capillary leak, and
increased hydrostatic pressures, 5% of infused crystalloid remains intravascular within 3 h after infusion, resulting in an increase in EVLW and further tissue edema.
• Increased EVLW has been demonstrated to be a strong independent predictor of death. In patients with pneumonia, large-volume fluid resuscitation may result in severe pulmonary edema. Myocardial edema due to excess fluid administration compounds the myocardialdysfunction.
Marik PE. Chest 2014
Clinical studies do not support positive fluid balance
• Many clinical studies have demonstrated an independent association between an increasingly positive fluid balance and increased mortality in patients with sepsis.
Boyd JH et Al. Crit Care Med 2011Maitland K et Al. NEJM 2011Micek ST, et Al. Crit Care 2013
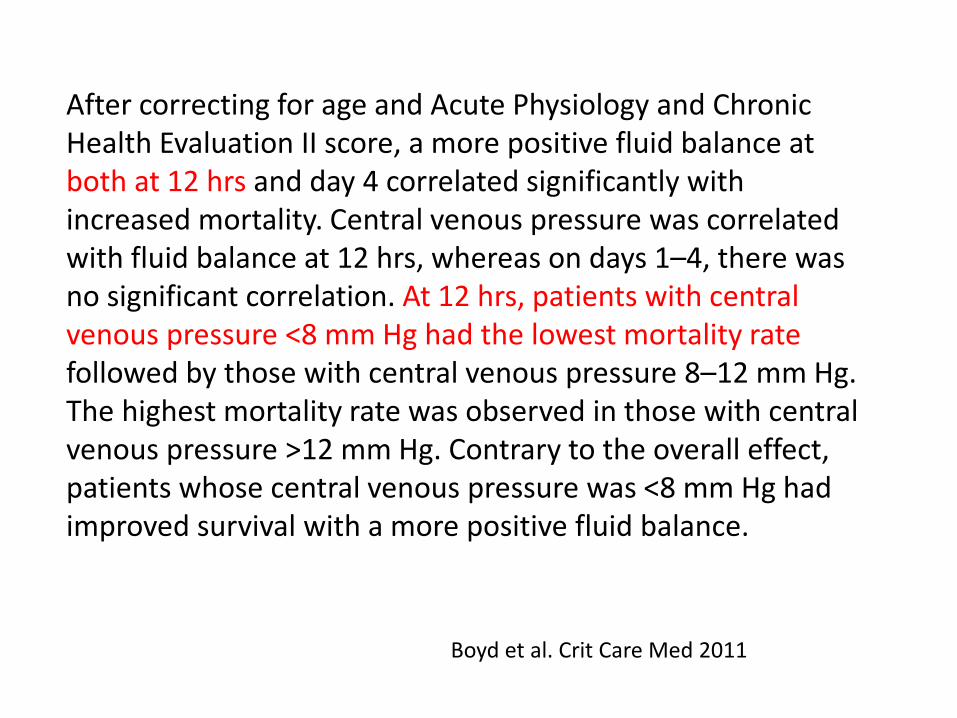
After correcting for age and Acute Physiology and Chronic Health Evaluation II score, a more positive fluid balance at both at 12 hrs and day 4 correlated significantly with increased mortality. Central venous pressure was correlated with fluid balance at 12 hrs, whereas on days 1–4, there was no significant correlation. At 12 hrs, patients with central venous pressure <8 mm Hg had the lowest mortality rate followed by those with central venous pressure 8–12 mm Hg. The highest mortality rate was observed in those with central venous pressure >12 mm Hg. Contrary to the overall effect, patients whose central venous pressure was <8 mm Hg had improved survival with a more positive fluid balance.
Boyd et al. Crit Care Med 2011
www.learnhemodynamics.com
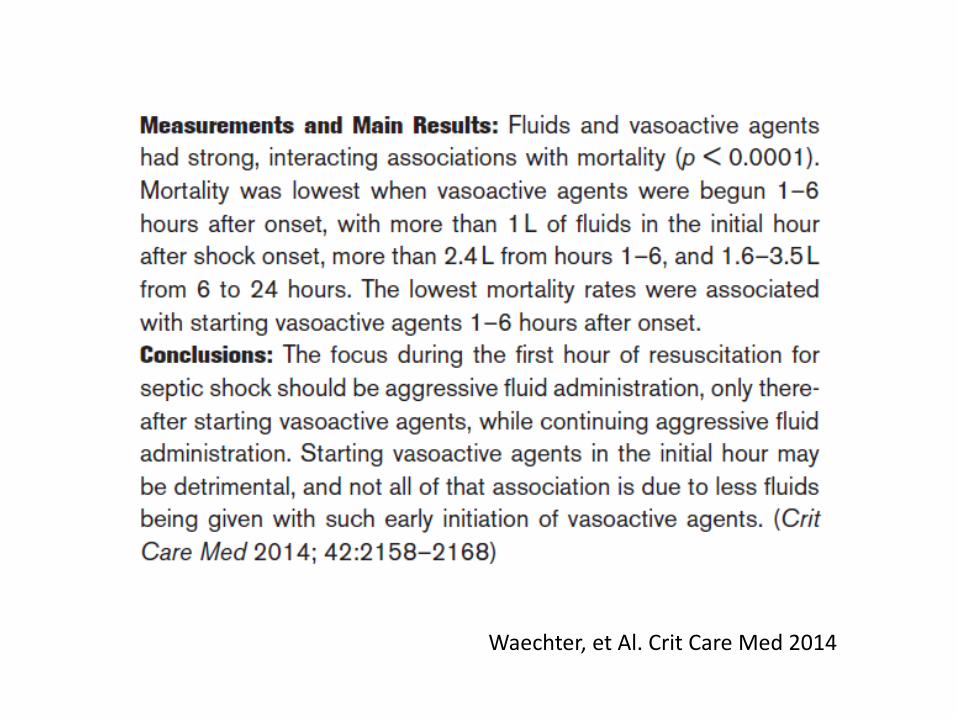
Waechter, et Al. Crit Care Med 2014
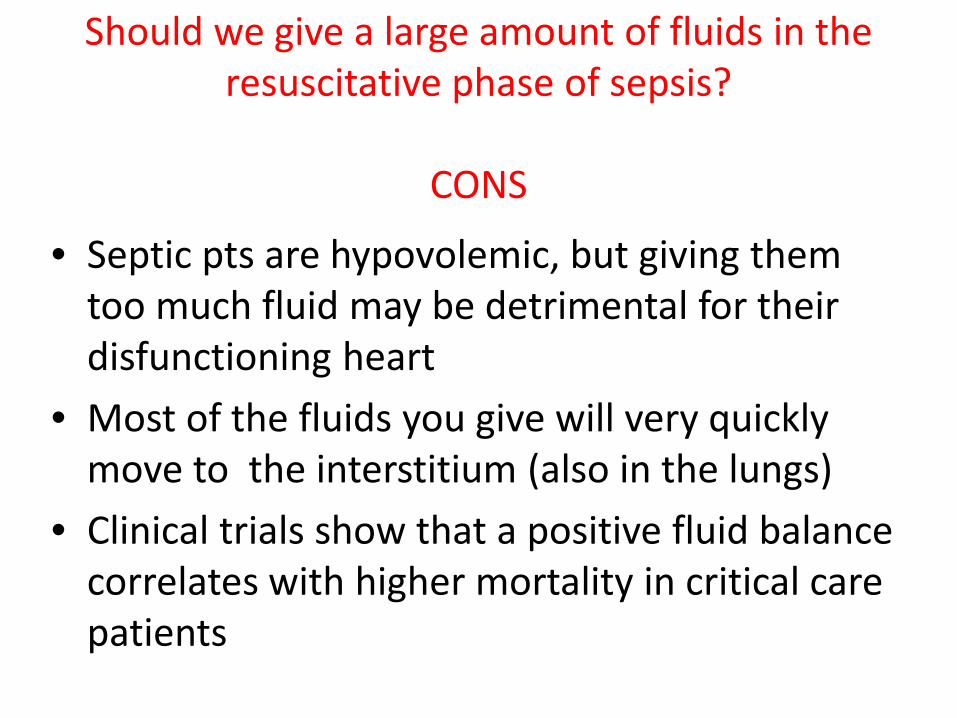
Should we give a large amount of fluids in the resuscitative phase of sepsis?
CONS
• Septic pts are hypovolemic, but giving themtoo much fluid may be detrimental for theirdisfunctioning heart
• Most of the fluids you give will very quicklymove to the interstitium (also in the lungs)
• Clinical trials show that a positive fluid balance correlates with higher mortality in critical care patients

SO WHAT ?
PATOPHYSIOLOGY AND DEFINITIONS
1. Levy MM , Fink MP , Marshall JC , et al ; SCCM/ESICM/ACCP/ATS/SIS . 2001 SCCM/ESICM/ACCP/ATS/SIS International Sepsis Definitions Conference . Crit Care Med . 2003 ; 31 ( 4 ): 1250 – 1256
2. Vincent JL , Opal SM , Marshall JC , Tracey KJ . Sepsis definitions: time for change . Lancet . 2013 ; 381 ( 9868 ): 774 - 775 .
3. Kaukonen KM, Bailey M, Pilcher D, et Al. Systemic inflammatory response syndrome criteria in defining severe sepsis. N Engl J Med. 2015;372:1629-1638.
4. Angus DC , van der Poll T . Severe sepsis and septic shock . N EnglJ Med . 2013 ; 369 (9): 840 - 851 .
5. Lee WL , Slutsky AS . Sepsis and endothelial permeability .N Engl J Med . 2010 ; 363 ( 7 ): 689 - 691 .
GUIDELINES AND MAJOR CLINCAL TRIALS1. Dellinger RP , Levy MM , Rhodes A , et al ; Surviving Sepsis Campaign Guidelines Committee
including the Pediatric Subgroup . Surviving sepsis campaign: international guidelines for management of severe sepsis and septic shock: 2012 . Crit Care Med . 2013 ; 41 ( 2 ): 580 - 637
2. Jozwiak M , Silva S , Persichini R , et al . Extravascular lung water is an independent prognostic factor in patients with acute respiratory distress syndrome . Crit Care Med . 2013 ; 41 ( 2 ): 472 - 480 .
3. Levy MM, Artigas A, Phillips GS, et al. Outcomes of the Surviving Sepsis Campaign in intensive care units in the USA and Europe: a prospective cohort study. Lancet Infect Dis 2012;12:919-24.
4. Rivers E , Nguyen B , Havstad S , et al ; Early Goal-Directed Therapy Collaborative Group . Early goal-directed therapy in the treatment of severe sepsis and septic shock . N Engl J Med 2001 ; 345 ( 19 ): 1368 - 1377 .
5. The ProCESS Investigators. A randomized trial of protocol-based care for early septic shock. N Engl J Med 2014; 370:1683-93.
6. Peake SL , Bailey M , Bellomo R , et al ; ARISE Investigators, for the Australian and New Zealand Intensive Care Society Clinical Trials Group . Australasian Resuscitation of Sepsis Evaluation (ARISE): a multi-centre, prospective, inception cohort study . Resuscitation . 2009 ; 80 ( 7 ): 811 - 818 .
7. Mouncey PR, Osborn TM, Power GS, et Al. Trial of early, goal-directed Rresuscitation for septic shock. N Engl J Med 2015;372:1301-11
ANTIMICROBIALS
1. Gaieski DF , Mikkelsen ME , Band RA , et al . Impact of time to antibiotics on survival in patients with severe sepsis or septic shock in whom early goal-directed therapy was initiated in the emergency department . Crit Care Med . 2010 ;38 ( 4 ): 1045 - 1053 .
2. Kumar A , Roberts D , Wood KE , et al . Duration of hypotension before initiation of effective antimicrobial therapy is the critical determinant of survival in human septic shock .Crit Care Med . 2006 ; 34 ( 6 ): 1589 - 1596 .
CENTRAL VENOUS PRESSURE
1. Marik PE , Baram M , Vahid B . Does central venous pressure predict fluid responsiveness? A systematic review of the literature and the tale of seven mares . Chest . 2008 ; 134 ( 1 ): 172 -178 .
2. Marik PE , Cavallazzi R . Does the central venous pressure predict fluid responsiveness? An updated meta-analysis and a plea for some common sense . Crit Care Med . 2013; 41 (7):1774 - 1781 .
3. Magder S. Central venous pressure: A useful but not so simple measurement. Crit Care Med 2006; 34:2224–2227
FLUID RESUSCITATION
1. Boyd JH , Forbes J , Nakada TA , Walley KR , Russell JA . Fluid resuscitation in septic shock: a positive fluid balance and elevated central venous pressure are associated with increased mortality . Crit Care Med . 2011 ; 39 ( 2 ): 259 - 265 .
2. Micek ST , McEvoy C , McKenzie M , Hampton N , Doherty JA , Kollef MH . Fluid balance and cardiac function in septic shock as predictors of hospital mortality . Crit Care . 2013; 17( 5): R246.
3. Maitland K , Kiguli S , Opoka RO , et al ; FEAST Trial Group . Mortality after fluid bolus in African children with severe infection . N Engl J Med . 2011 ; 364 ( 26 ): 2483 - 2495 .
4. Hoste EA, Maitland K, Brudney CS,et Al, for the ADQI XII Investigators Group. Four phases of intravenous fluid therapy: a conceptual model. BJA doi:10.1093/bja/aeu300
5. Vincent JL, Weil MH. Fluid challenge revisited. Crit Care Med 2006; 34:1333–13376. Waechter j, Kumar A, Lapinsky SE, et Al. Interaction between fluids and vasoactive
agents on mortality in septic shock: a multicenter, observational study. Crit Care Med 2014;42:2158-68.
CONTROVERSIES
1. Marik PE . Early management of severe sepsis: concepts and controversies. Chest 2014; 145 ( 6 ): 1407 – 1418
So what ? 1
• Beware of protocols, especially those with pre-defined physiological endpoints
• Adopt a multi-parametric approach when making a potentially critical decision.
So what ? 2
• Use dynamic measures (leg raising, inspiratory variation, fluid challenge) to evaluate fluid responsiveness
• CVP might be dear to you, but you shouldnevertheless get acquainted with the newer non invasive ways to measure stroke volume.
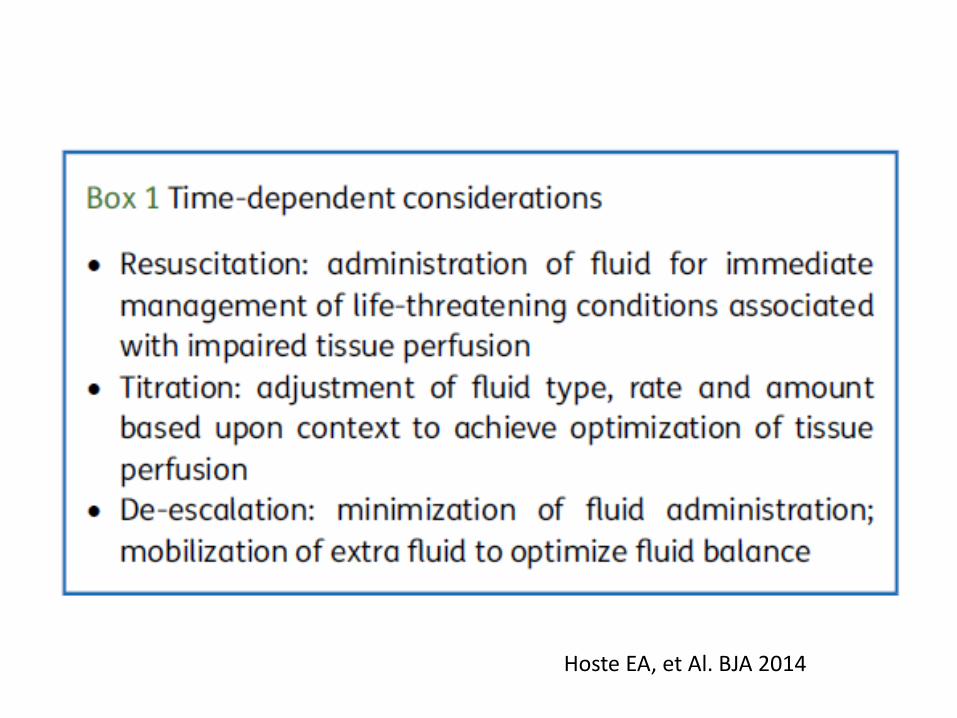
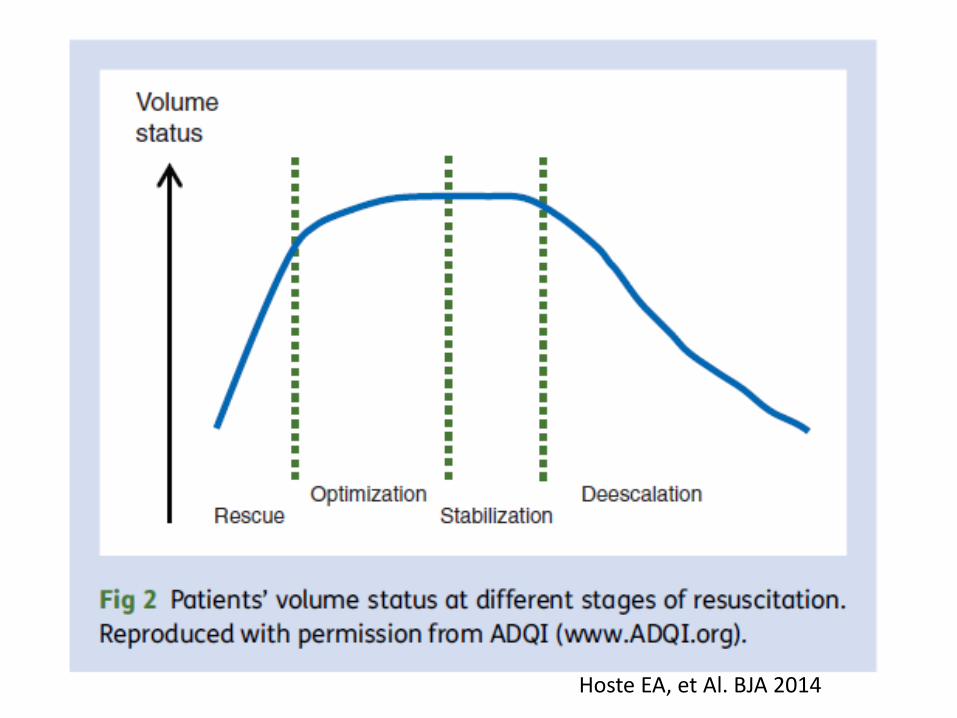
Hoste EA, et Al. BJA 2014
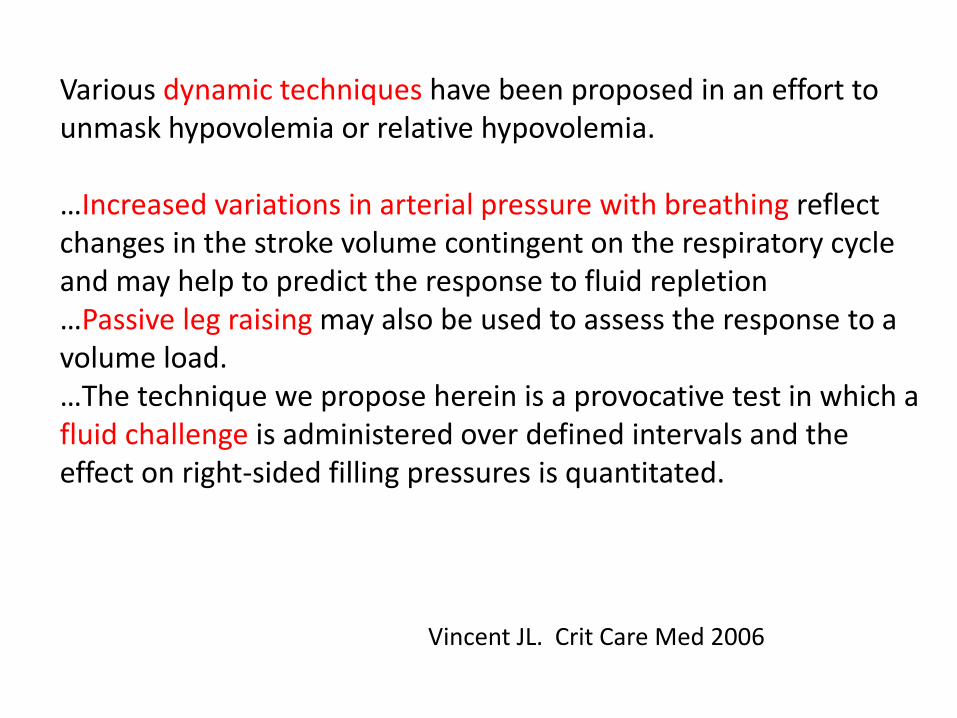
Various dynamic techniques have been proposed in an effort to unmask hypovolemia or relative hypovolemia.
…Increased variations in arterial pressure with breathing reflect changes in the stroke volume contingent on the respiratory cycle and may help to predict the response to fluid repletion…Passive leg raising may also be used to assess the response to a volume load.…The technique we propose herein is a provocative test in which a fluid challenge is administered over defined intervals and the effect on right-sided filling pressures is quantitated.
Vincent JL. Crit Care Med 2006
Calibrated pulse contour analysis, bioreactance,the ultrasonic cardiac output monitor (USCOM),carotid Doppler flow, Doppler echocardiography, oresophageal Doppler techniques can be used to dynamically follow the cardiac output in real time. Bioreactance, USCOM, and carotid Doppler flow are truly noninvasive and are suitable for guiding fluid resuscitation in the ED
Marik PE, Chest 2014
Hoste EA, et Al. BJA 2014
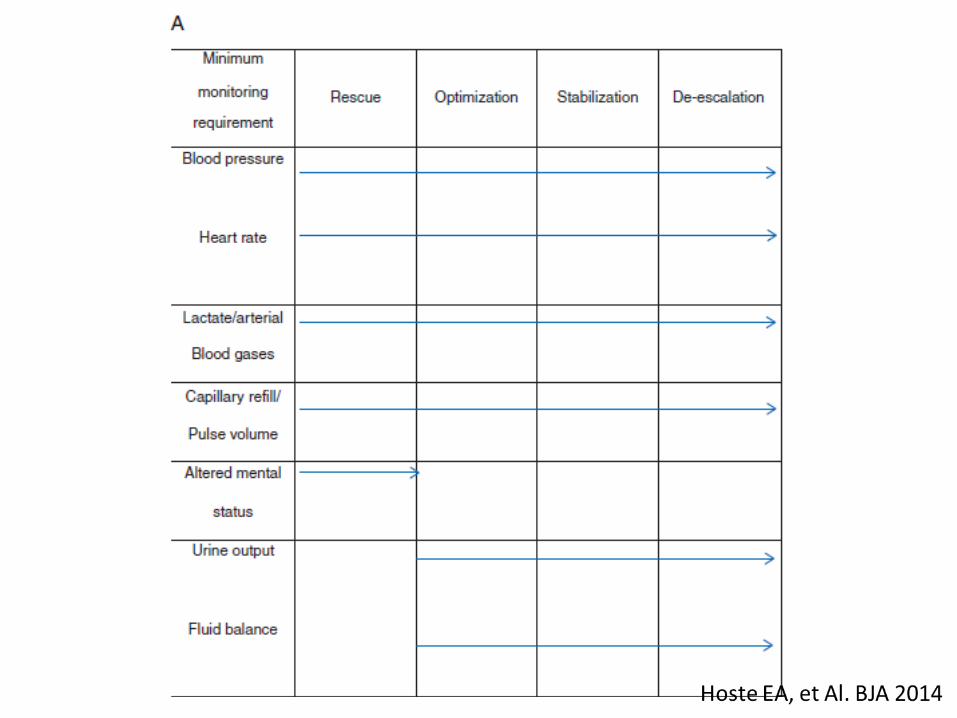
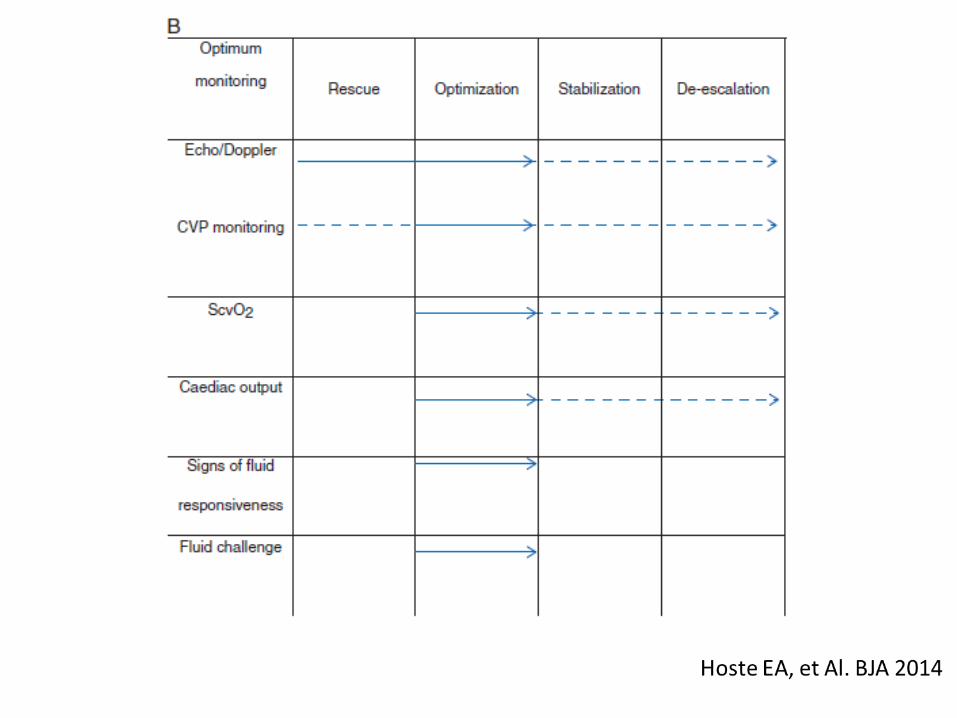


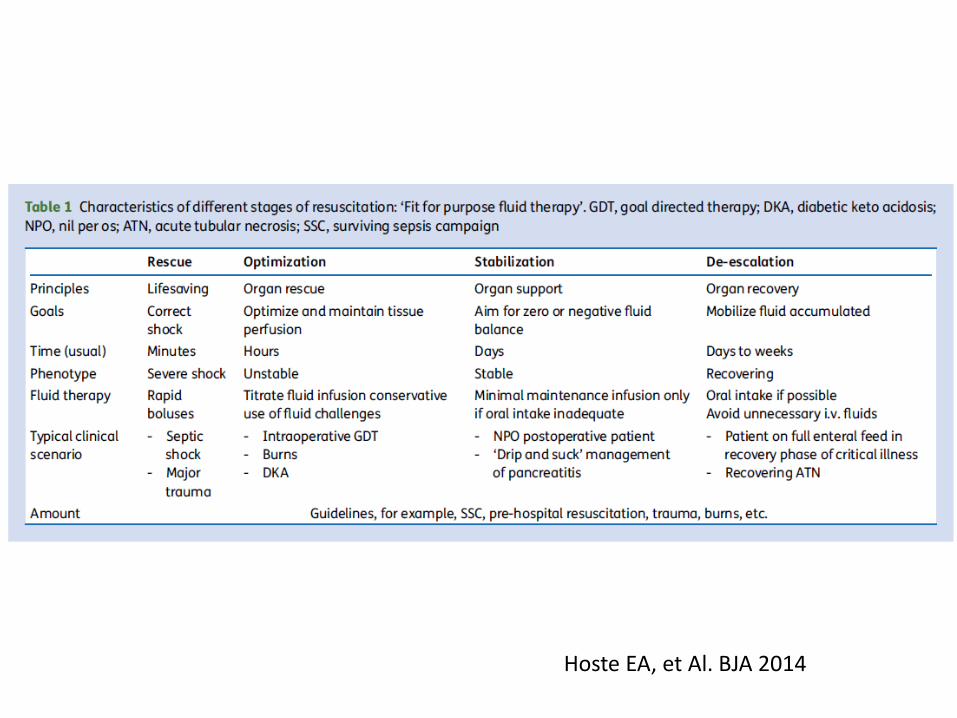
Hoste EA, et Al. BJA 2014
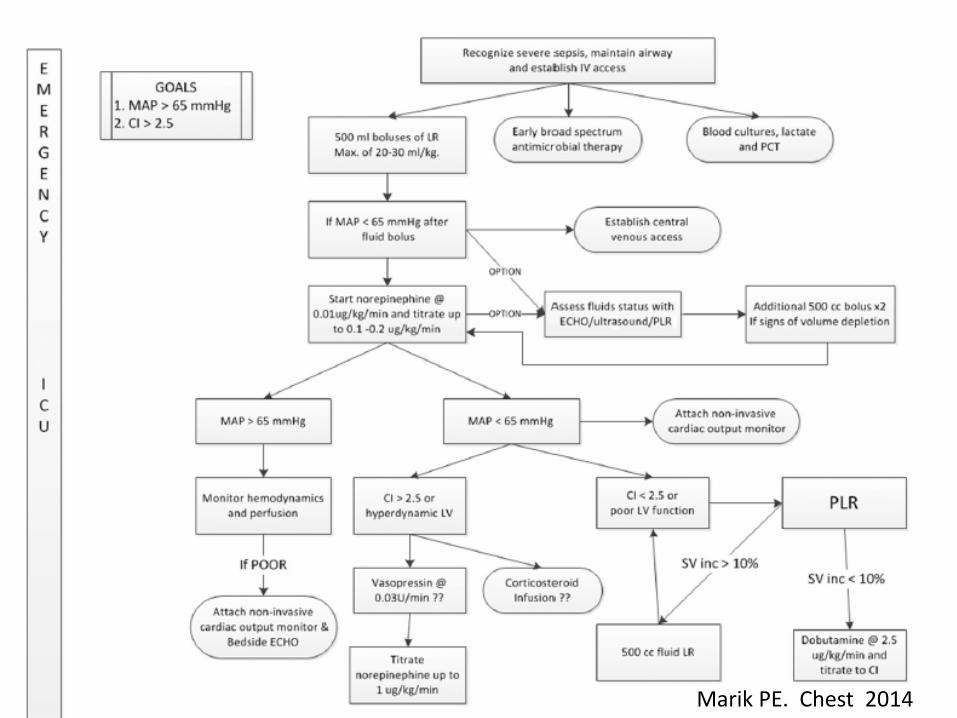
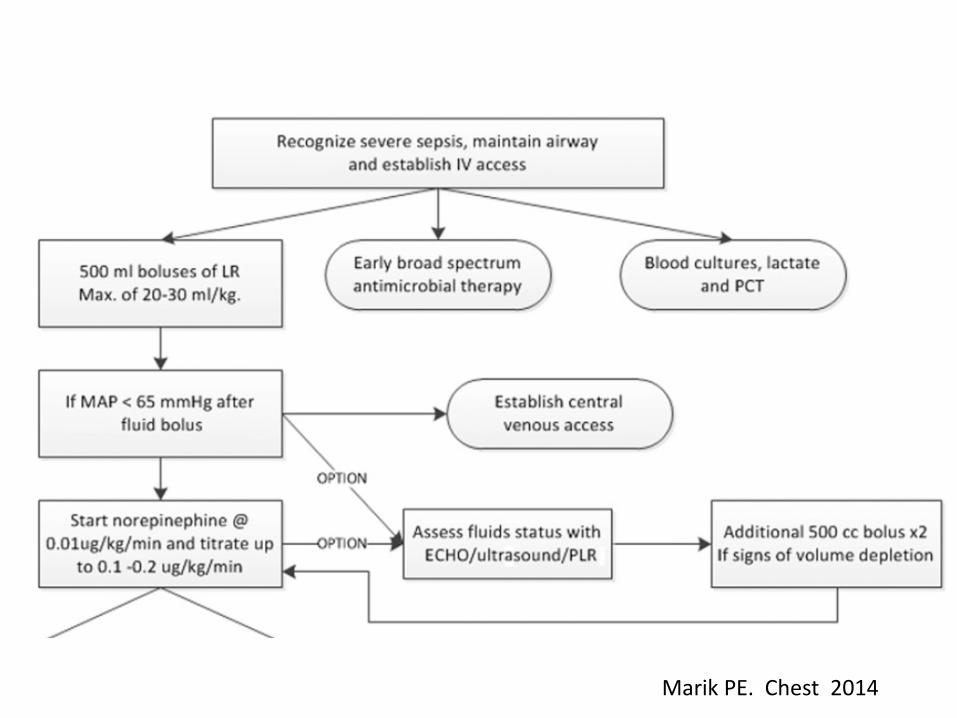
Marik PE. Chest 2014
Marik PE. Chest 2014
Marik PE. Chest 2014
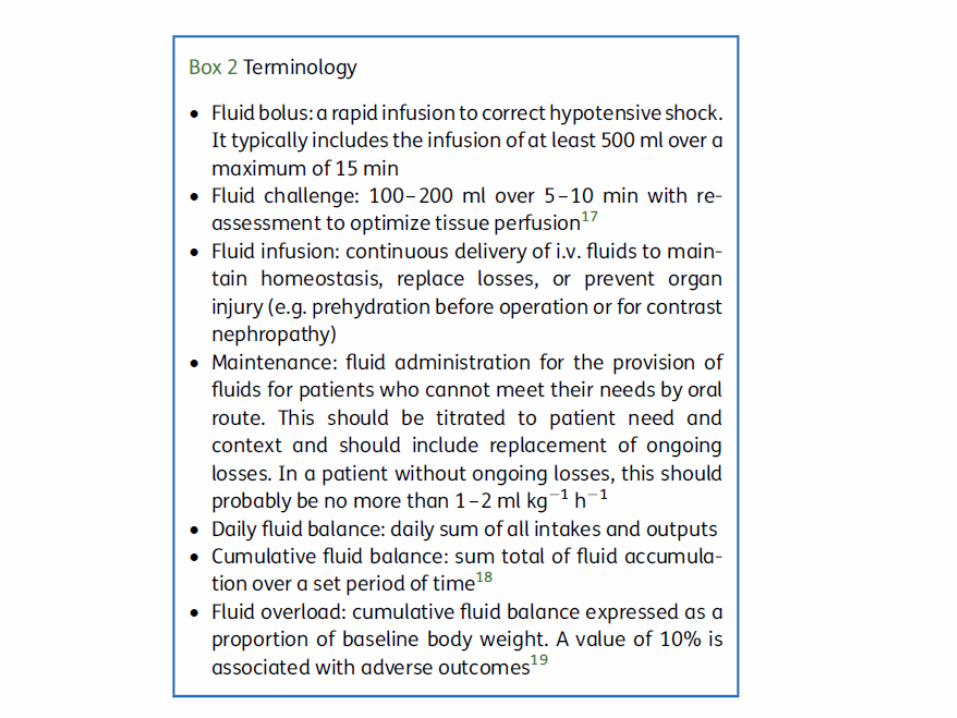
I suggest limiting the initial fluid resuscitation to approximately 20 to 30 mL/kg. Furthermore, I recommend this fluid be given as 500-mL fluid challenges. It is important to emphasize that this conservative approach to fluid management in patients with sepsis is based on indirectevidence and not on a randomized controlled trialspecifically designed to answer this question
Marik PE. Chest 2014
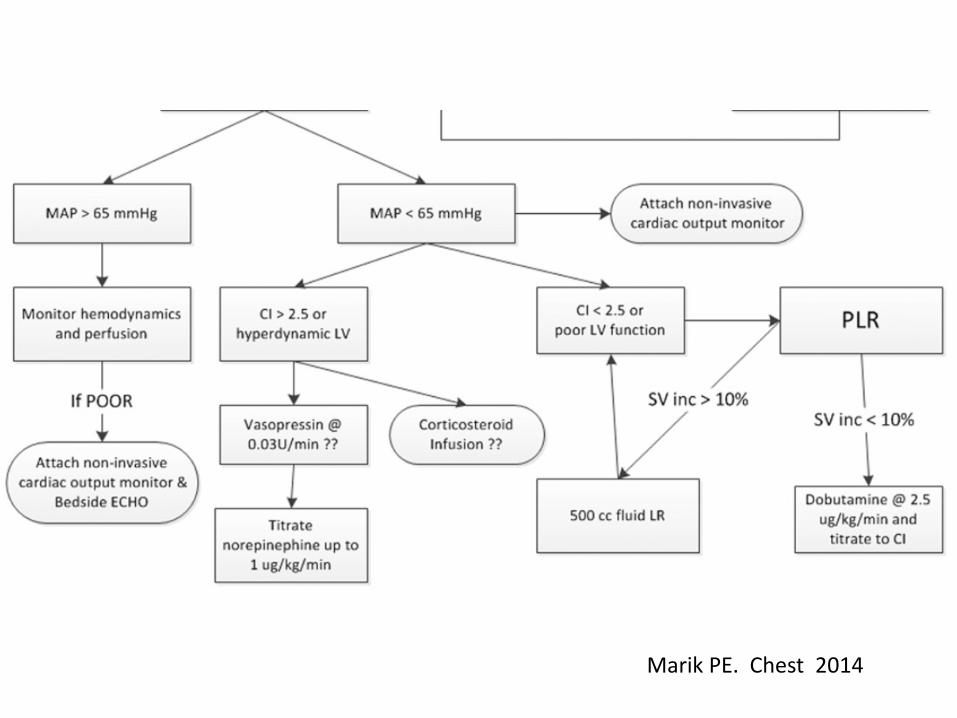
The optimal time to start a vasopressor agent inpatients with sepsis has not been well studied. However, after receiving 20 to 30 mL/kg of crystalloid, it seems unlikely that additional fluid boluses will increase the mean arterial pressure (MAP) in patients who remain hypotensive. I would, therefore, recommend the initiation of a vasopressor agent (norepinephrine) in patients who remain hypotensive (MAP , 65 mm Hg) after receiving 20 to 30 mL/kg of crystalloid solution.Additional fluid boluses (500 mL) may be given oncethe “target” norepinephrine dose is achieved (about0.1-0.2 m g/kg/min), and this should be based on adynamic assessment of volume responsiveness andventricular function .
Marik PE 2014
Several decades ago, Weil and Hennin(7) proposed the fluid challenge technique, based on the 2–5 rule using central venouspressure and the 3–7 rule for the pulmonary artery occlusionpressure.According to this scheme, the corresponding filling pressurewas measured at 10-min intervals. If the change in pulmonaryartery occlusion pressure was 3 mm Hg (2 mm Hg for centralvenous pressure), the infusion was continued, if it was in the 3–7 mm Hg range (2–5 mm Hg for central venous pressure), theinfusion was interrupted and reevaluated after a 10-min wait. Ifthe change was an increase of _7 mm Hg (5 mm Hg forcentral venous pressure), the infusion was stopped.
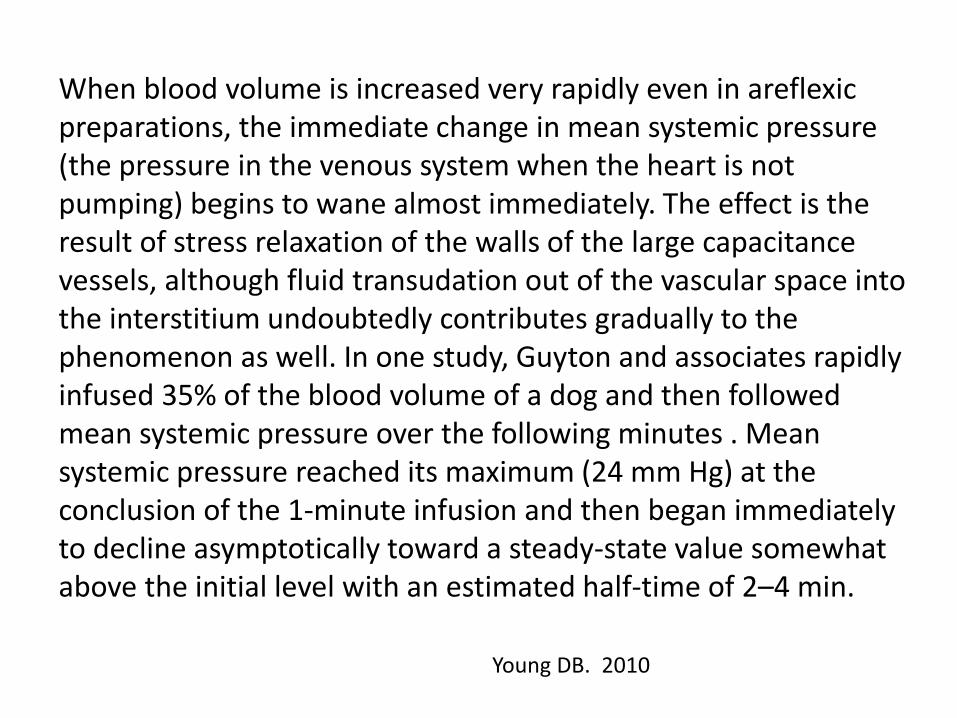
When blood volume is increased very rapidly even in areflexicpreparations, the immediate change in mean systemic pressure (the pressure in the venous system when the heart is not pumping) begins to wane almost immediately. The effect is the result of stress relaxation of the walls of the large capacitance vessels, although fluid transudation out of the vascular space into the interstitium undoubtedly contributes gradually to the phenomenon as well. In one study, Guyton and associates rapidly infused 35% of the blood volume of a dog and then followed mean systemic pressure over the following minutes . Mean systemic pressure reached its maximum (24 mm Hg) at the conclusion of the 1-minute infusion and then began immediately to decline asymptotically toward a steady-state value somewhat above the initial level with an estimated half-time of 2–4 min.
Young DB. 2010