Controlling Project Performance by using a Project Defect Model, Ben Linders, QA&Test Conference...
30
Controlling Project Performance by Using a Defect Model Ben Linders Ericsson Telecommunicatie B.V., Rijen The Netherlands Affiliate Software Engineering Institute, Pittsburgh, PA
-
Upload
ben-linders -
Category
Business
-
view
1.393 -
download
0
Transcript of Controlling Project Performance by using a Project Defect Model, Ben Linders, QA&Test Conference...

Controlling Project Performance by Using a Defect Model
Ben Linders
Ericsson Telecommunicatie B.V., Rijen The Netherlands
Affiliate Software Engineering Institute, Pittsburgh, PA
© Ericsson Telecommunicatie B.V., Rijen, The Netherlands 2007-08-312
Overview
Business NeedsProject Defect ModelExperiencesConclusions
Product quality and process effectiveness
© Ericsson Telecommunicatie B.V., Rijen, The Netherlands 2007-08-313
Ericsson, The Netherlands
Market Unit Northern Europe & R&D Center R&D: Value Added Services
– Strategic product management– Marketing & technical sales support– Development & maintenance– Customization– Supply & support
+/- 1300 employees, of which +/- 350 in R&D

© Ericsson Telecommunicatie B.V., Rijen, The Netherlands 2007-08-314
Business Need for Quality
Multimedia functionalityStability & PerformanceCustomizations, flexibilityOutsourcing
© Ericsson Telecommunicatie B.V., Rijen, The Netherlands 2007-08-315
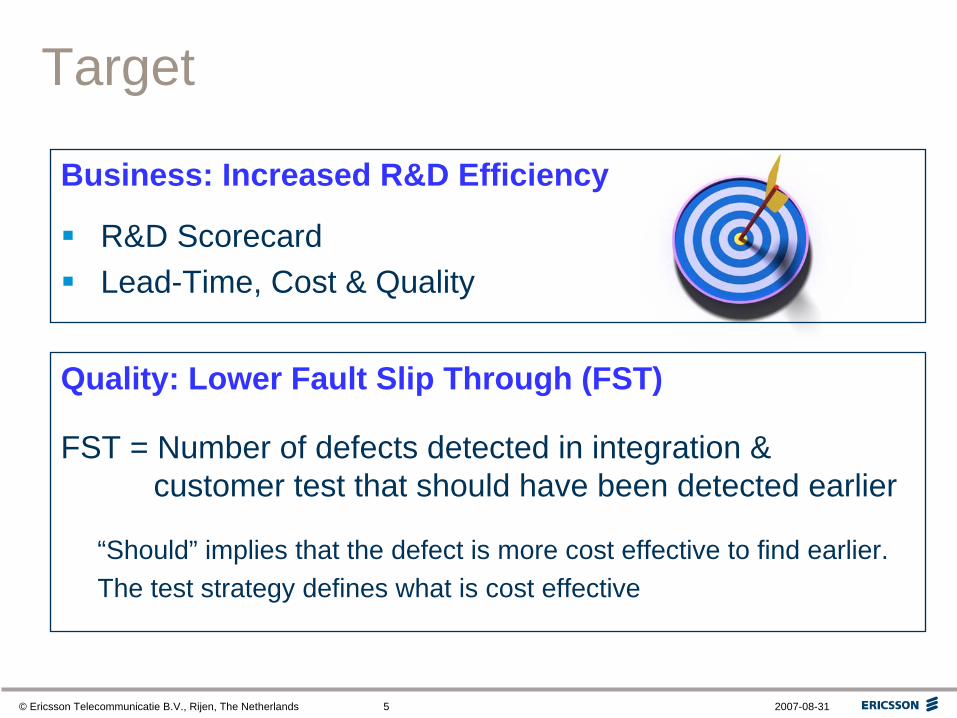
Target
Business: Increased R&D Efficiency
R&D ScorecardLead-Time, Cost & Quality
Quality: Lower Fault Slip Through (FST)
FST = Number of defects detected in integration & customer test that should have been detected earlier
“Should” implies that the defect is more cost effective to find earlier.The test strategy defines what is cost effective
© Ericsson Telecommunicatie B.V., Rijen, The Netherlands 2007-08-316
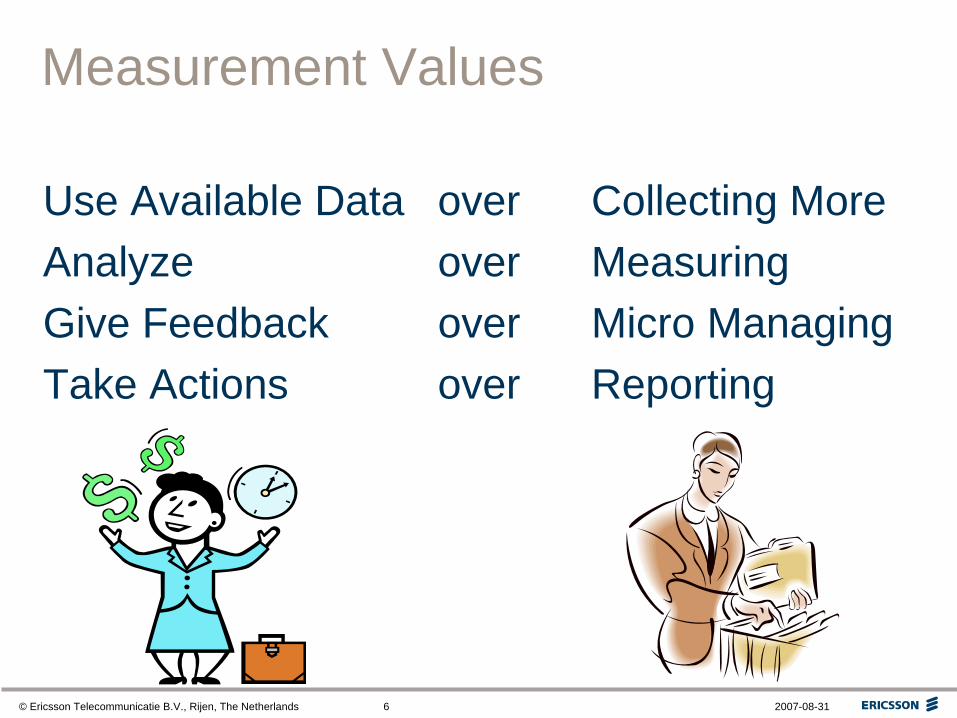
Measurement Values
Use Available Data over Collecting MoreAnalyze over MeasuringGive Feedback over Micro ManagingTake Actions over Reporting

© Ericsson Telecommunicatie B.V., Rijen, The Netherlands 2007-08-317
Required
Control of Quality:Clear requirementsQuality planned & tracked.Fact based decisionsKnown release qualityDeliver on timeLower maintenance
© Ericsson Telecommunicatie B.V., Rijen, The Netherlands 2007-08-318
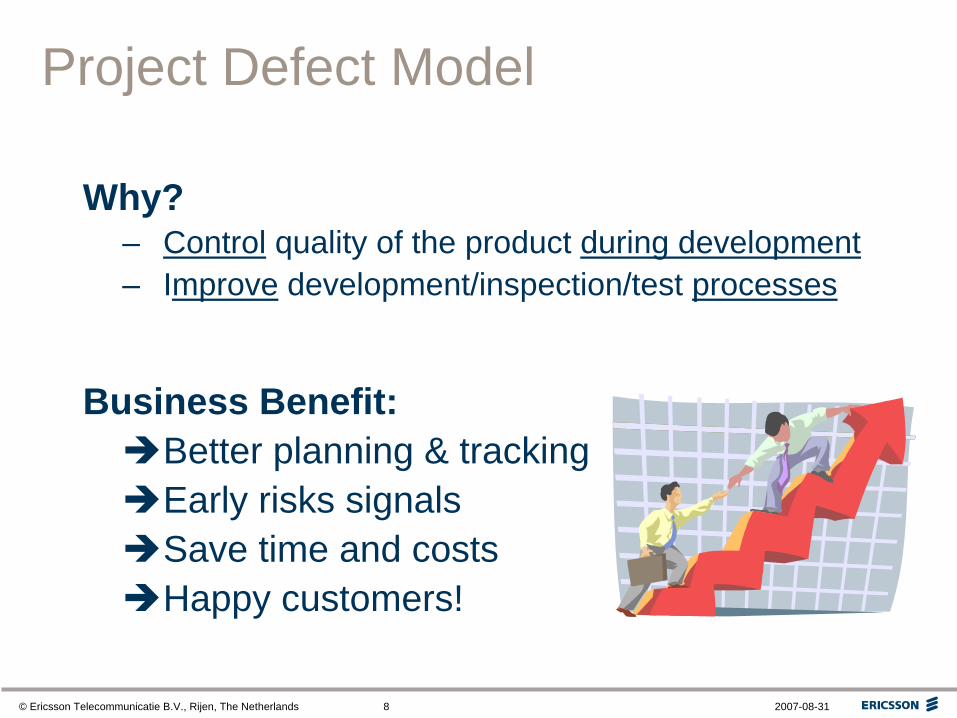
Project Defect Model
Why?– Control quality of the product during development– Improve development/inspection/test processes
Business Benefit:Better planning & trackingEarly risks signalsSave time and costsHappy customers!
© Ericsson Telecommunicatie B.V., Rijen, The Netherlands 2007-08-319
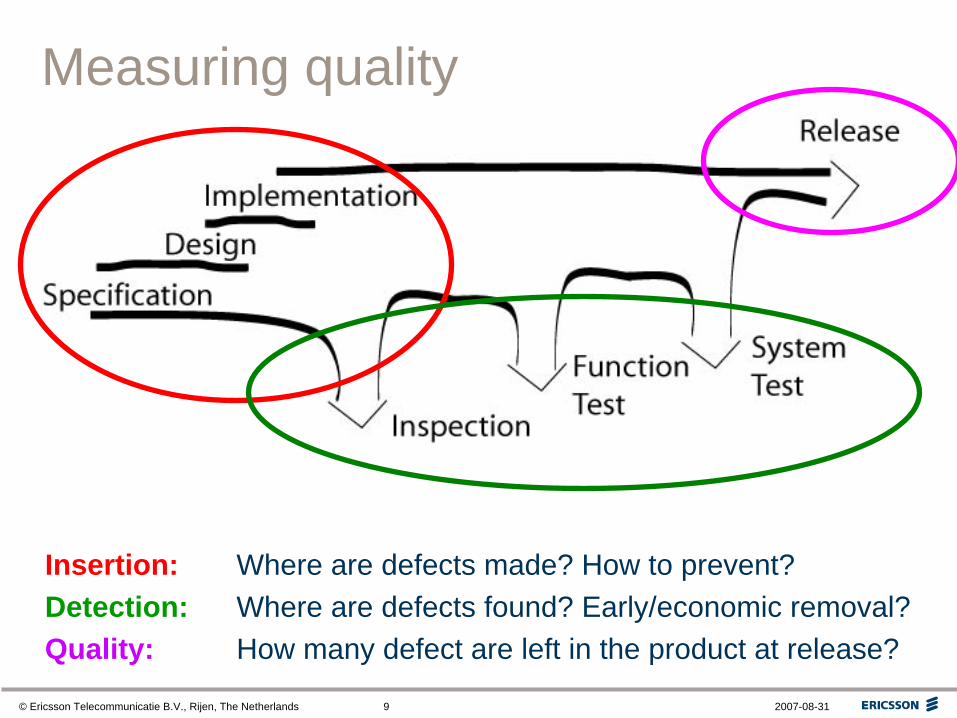
Measuring quality
Insertion: Where are defects made? How to prevent?Detection: Where are defects found? Early/economic removal?Quality: How many defect are left in the product at release?
© Ericsson Telecommunicatie B.V., Rijen, The Netherlands 2007-08-3110
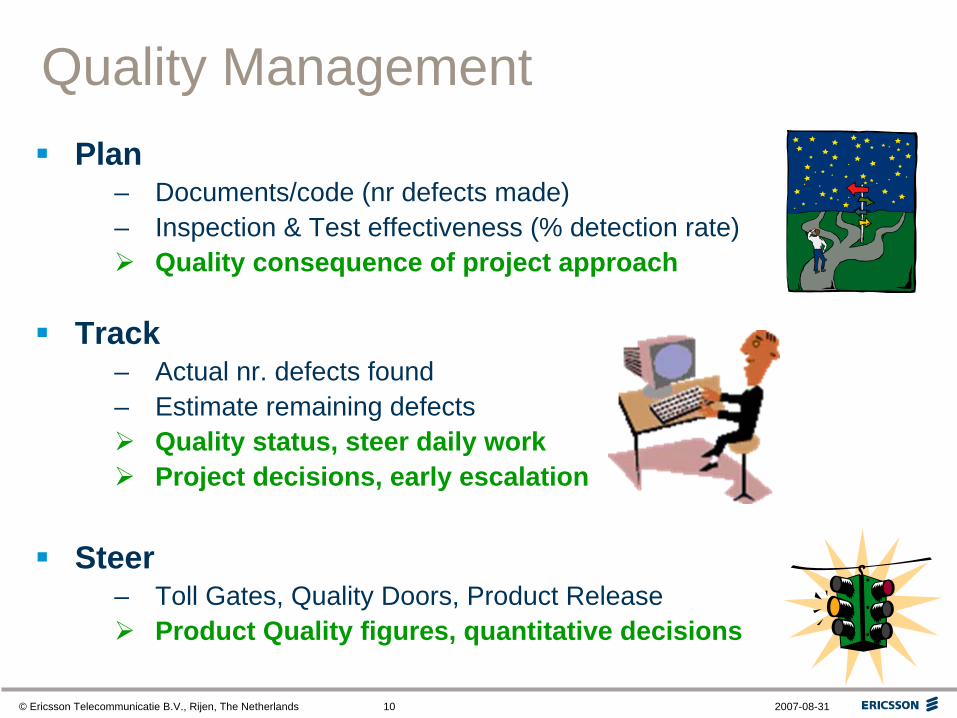
Quality ManagementPlan
– Documents/code (nr defects made)– Inspection & Test effectiveness (% detection rate)
Quality consequence of project approach
Track– Actual nr. defects found– Estimate remaining defects
Quality status, steer daily workProject decisions, early escalation
Steer– Toll Gates, Quality Doors, Product Release
Product Quality figures, quantitative decisions

© Ericsson Telecommunicatie B.V., Rijen, The Netherlands 2007-08-3111
Project Status Deviation Report regarding QualityProject Status Deviation Report regarding Quality
Corrective actions Corrective actions (Mandatory for targets with Minor or Major deviations.)
WhatWhat When (due date)When (due date) WhoWho
…………………………..…………………………..…………………………..
200y-mm-dd200y-mm-dd200y-mm-dd
xxxxxxxxxxxxxxx
Status
Analysis of current situationAnalysis of current situation
Targets – ………………………..
Fact – …………………………..
Reason – ………………………….
Consequence – …………………..
TG2 baseline actual Min Maxactual estimate
0
10
20
30
40
50
60
70
80
# FST to Test # GA Defects DR % 20%
30%
40%
50%
60%
70%
80%
90%
100%
[#]
FST,
GA
Def
ects
[%] D
etection Rate
Reporting
© Ericsson Telecommunicatie B.V., Rijen, The Netherlands 2007-08-3112
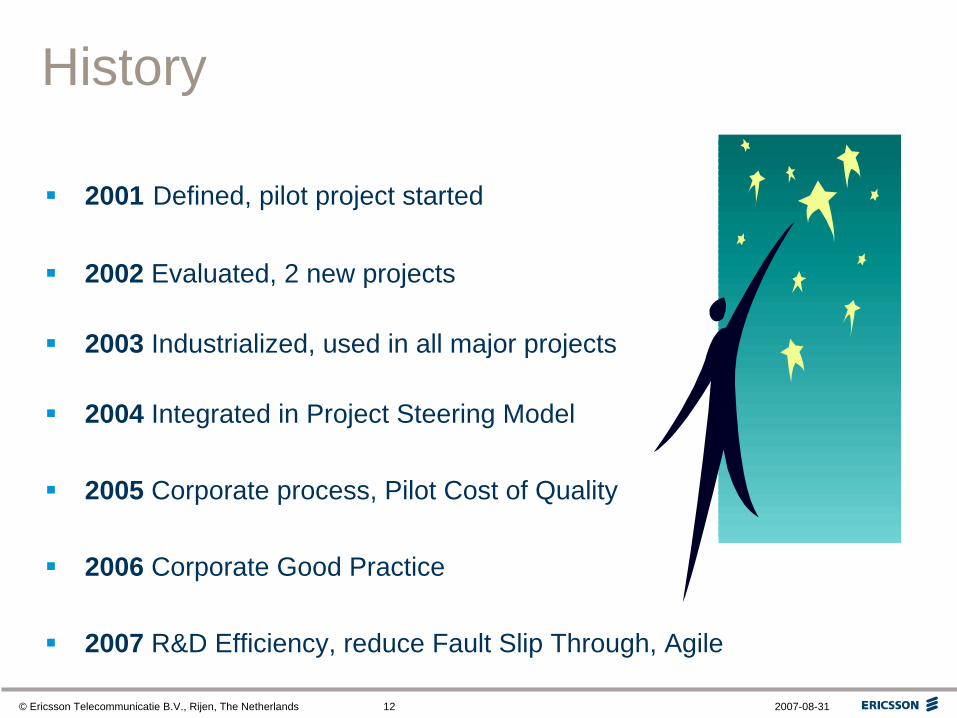
History
2001 Defined, pilot project started
2002 Evaluated, 2 new projects
2003 Industrialized, used in all major projects
2004 Integrated in Project Steering Model
2005 Corporate process, Pilot Cost of Quality
2006 Corporate Good Practice
2007 R&D Efficiency, reduce Fault Slip Through, Agile
© Ericsson Telecommunicatie B.V., Rijen, The Netherlands 2007-08-3113
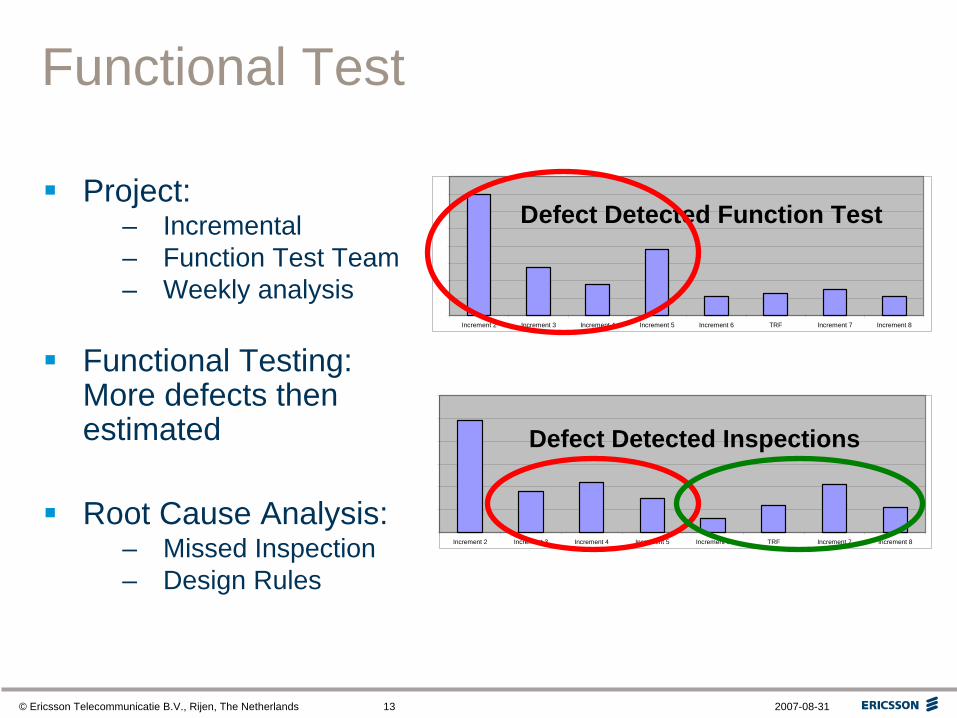
Functional Test
Project:– Incremental – Function Test Team– Weekly analysis
Functional Testing:More defects then estimated
Root Cause Analysis:– Missed Inspection– Design Rules
Defect Detected Function Test
Increment 2 Increment 3 Increment 4 Increment 5 Increment 6 TRF Increment 7 Increment 8
Defect Detected Inspections
Increment 2 Increment 3 Increment 4 Increment 5 Increment 6 TRF Increment 7 Increment 8

© Ericsson Telecommunicatie B.V., Rijen, The Netherlands 2007-08-3114
Improve Inspections
Re-introduce Design RulesCoach Inspections
More defects inspectionAdditional defects in test
Detection RateInspection
Increm
ent 2
Increm
ent 3
Increm
ent 4
Increm
ent5
Increm
ent6 TR
FInc
rement
7Inc
rement
8
Actual total
Target
Detection RateFunction Test
Increm
ent 2
Increm
ent 3
Increm
ent 4
Increm
ent 5
Increm
ent 6 TR
FInc
rement
7Inc
rement
8
Actual total
Target
Improved Inspection and Function Test
© Ericsson Telecommunicatie B.V., Rijen, The Netherlands 2007-08-3115
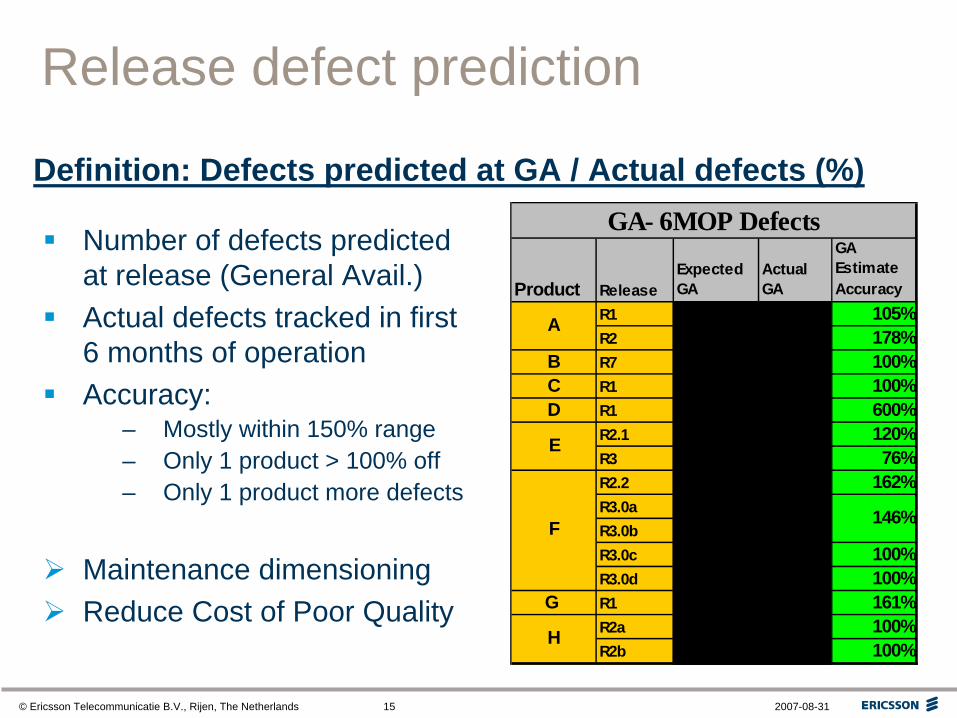
Release defect prediction
Number of defects predicted at release (General Avail.)Actual defects tracked in first 6 months of operationAccuracy:
– Mostly within 150% range– Only 1 product > 100% off– Only 1 product more defects
Maintenance dimensioningReduce Cost of Poor Quality
Definition: Defects predicted at GA / Actual defects (%)
Product ReleaseExpected GA
Actual GA
GA Estimate Accuracy
R1 21 20 105%R2 32 18 178%
B R7 2 2 100%C R1 5 5 100%D R1 6 1 600%
R2.1 18 15 120%R3 13 17 76%R2.2 84 52 162%R3.0aR3.0bR3.0c 60 60 100%R3.0d 9 9 100%
G R1 66 41 161%R2a 25 25 100%R2b 0 0 100%
E
A
GA- 6MOP Defects
H
104 71146%F

© Ericsson Telecommunicatie B.V., Rijen, The Netherlands 2007-08-3116
Agile Approach
Planning game: Analyze Quality
Demo: Deliver
Network test: Verify
Team meeting: Feedback
Balance Quality - Time – CostsEarly Risk signalsOptimized process
© Ericsson Telecommunicatie B.V., Rijen, The Netherlands 2007-08-3117
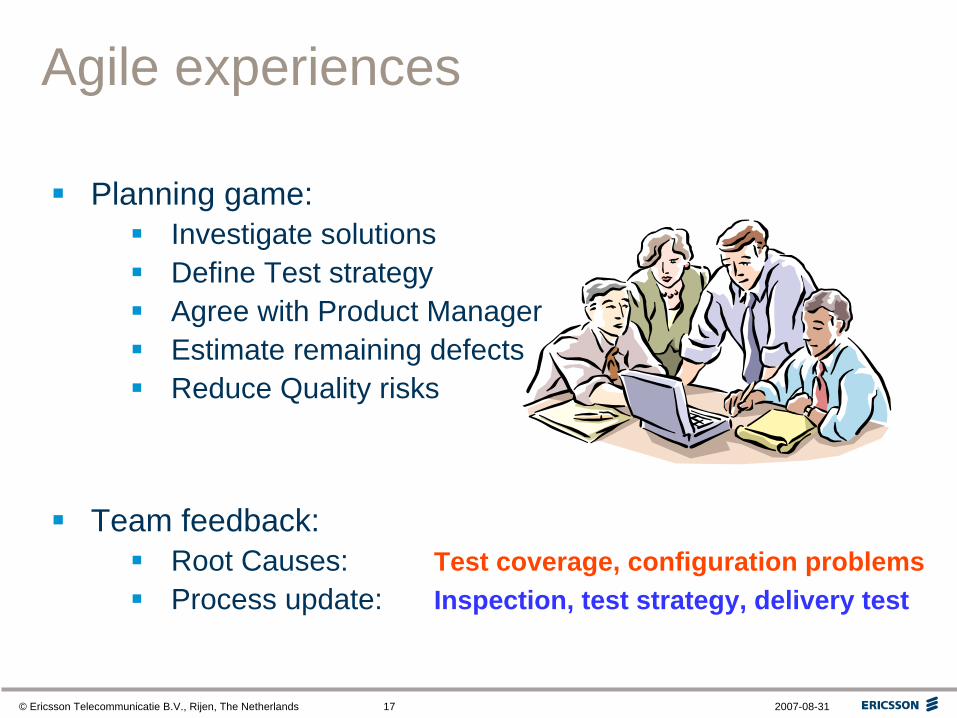
Agile experiences
Planning game:Investigate solutionsDefine Test strategyAgree with Product ManagerEstimate remaining defectsReduce Quality risks
Team feedback:Root Causes: Test coverage, configuration problemsProcess update: Inspection, test strategy, delivery test
© Ericsson Telecommunicatie B.V., Rijen, The Netherlands 2007-08-3118
Key Success Factors
Management CommitmentEverybody involvedDefect classificationFrequent feedback

© Ericsson Telecommunicatie B.V., Rijen, The Netherlands 2007-08-3119
Management Targets
Target Target OwnerGA Defects Strategic Product Manager
Defect Detection Rate Project Office Manager
Fault Slip Through Design Manager
© Ericsson Telecommunicatie B.V., Rijen, The Netherlands 2007-08-3120
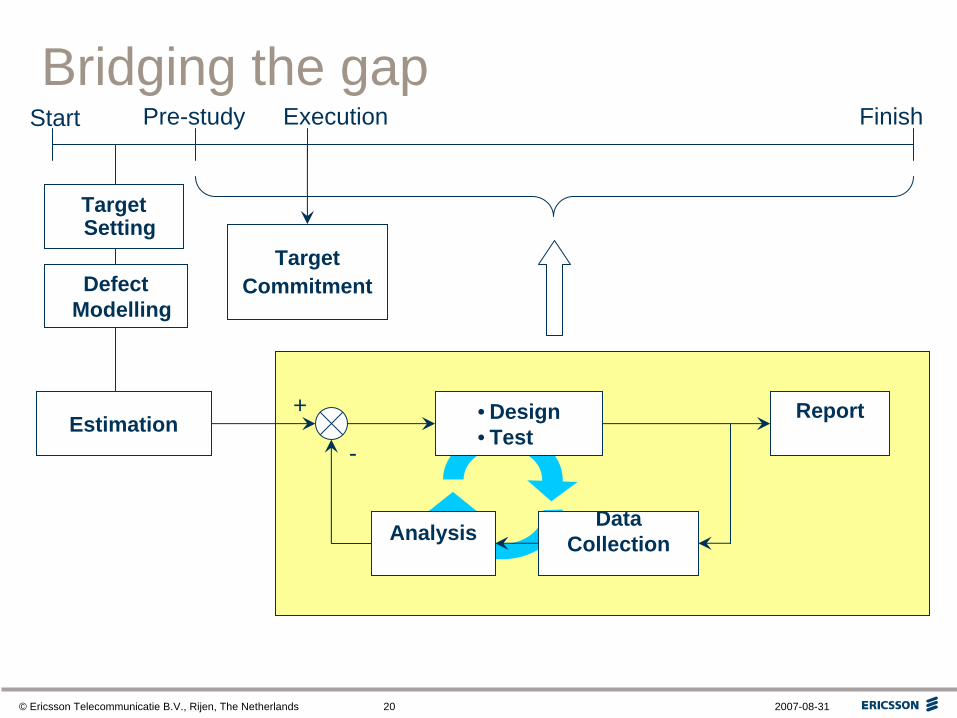
Estimation
Analysis
Report
Defect Modelling
Target Setting
+
-
Start Pre-study Execution Finish
DataCollection
• Design• Test
TargetCommitment
Bridging the gap

© Ericsson Telecommunicatie B.V., Rijen, The Netherlands 2007-08-3121
Defect Classification
Fault Slip Through: Could have been found?
Orthogonal Defect Classification Triggers
Test Matrices Focus
Discipline maps Proces Flow
Agree & deploy consistently

© Ericsson Telecommunicatie B.V., Rijen, The Netherlands 2007-08-3122
Feedback
Frequent, shortAt the workplaceAll data availableDesign/test leaders
Show data ask questions form conclusions take needed actions
Feedback: Collected data delivered to the people that have done the work, in orderto support understanding of the situationand help them to take needed actions

© Ericsson Telecommunicatie B.V., Rijen, The Netherlands 2007-08-3123
Benefits
QualitativeEarlier risk signals: Deliver on timeIncremental Development: Collaboration design-testBetter decisions: Release qualityProcess adherence: Increased efficiencyLess defects after release: Maintenance ReductionLess disturbances: Employee motivated
QuantitativeHigher qualityReduced lead time Lower costs
ROI 5:1
© Ericsson Telecommunicatie B.V., Rijen, The Netherlands 2007-08-3124
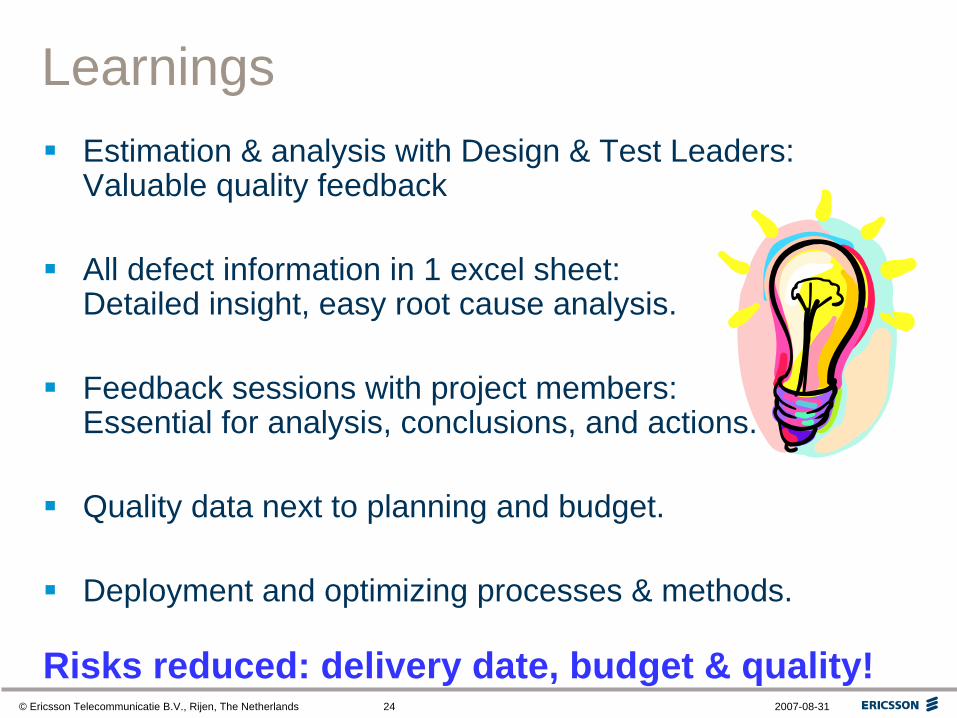
LearningsEstimation & analysis with Design & Test Leaders:Valuable quality feedback
All defect information in 1 excel sheet:Detailed insight, easy root cause analysis.
Feedback sessions with project members:Essential for analysis, conclusions, and actions.
Quality data next to planning and budget.
Deployment and optimizing processes & methods.
Risks reduced: delivery date, budget & quality!

© Ericsson Telecommunicatie B.V., Rijen, The Netherlands 2007-08-3125
Quality Prediction
Current Model: Estimation– Extrapolate past performance– Based on inserted/detected defects– Plan & track
Wanted: Prediction– Causes of defects– What if Scenarios– Decision taking
All models are wrongSome models are useful
Deming
© Ericsson Telecommunicatie B.V., Rijen, The Netherlands 2007-08-3126
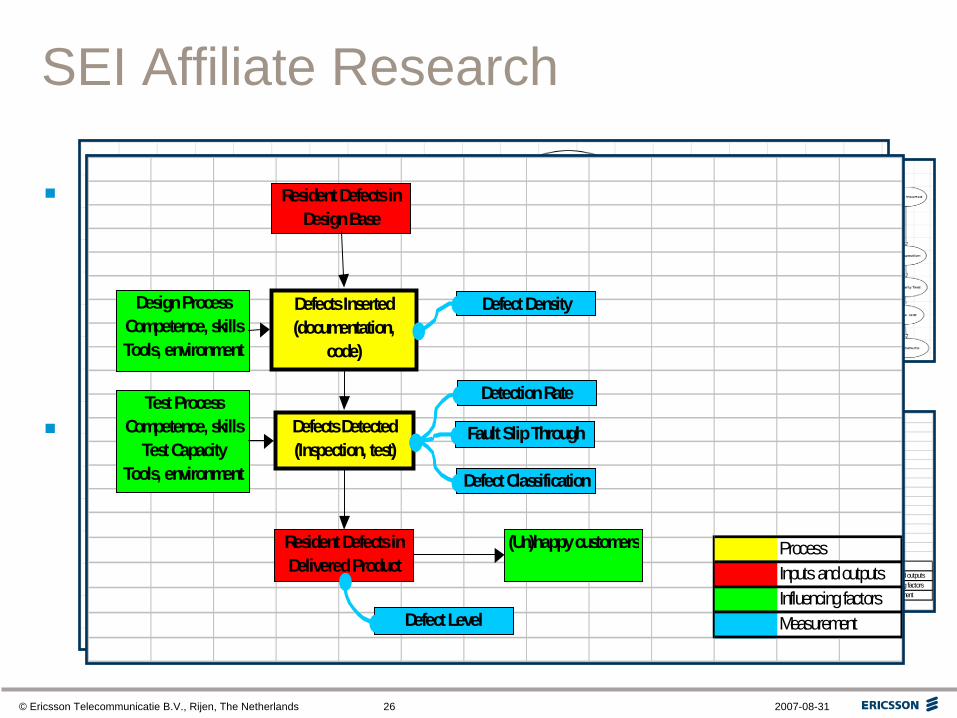
SEI Affiliate Research
Quality Factor Model– Expert opinion, with data– Quick Quality Scan– Rough Prediction– Improvement Areas
Defect Prediction Model– Data, tuned with expert opinion– Detailed Prediction– Improvement Business Case
ProcessInputs and outputsInfluencing factorsMeasurement
Defects Inserted (documentation,
code)
Defects Detected (Inspection, test)
(Un)happy customers
Design ProcessCompetence, skillsTools, environment
Test ProcessCompetence, skills
Test CapacityTools, environment
Resident Defects in Delivered Product
Resident Defects in Design Base
Detection Rate
Defect Density
Fault Slip Through
Defect Level
Defect Classification
© Ericsson Telecommunicatie B.V., Rijen, The Netherlands 2007-08-3127
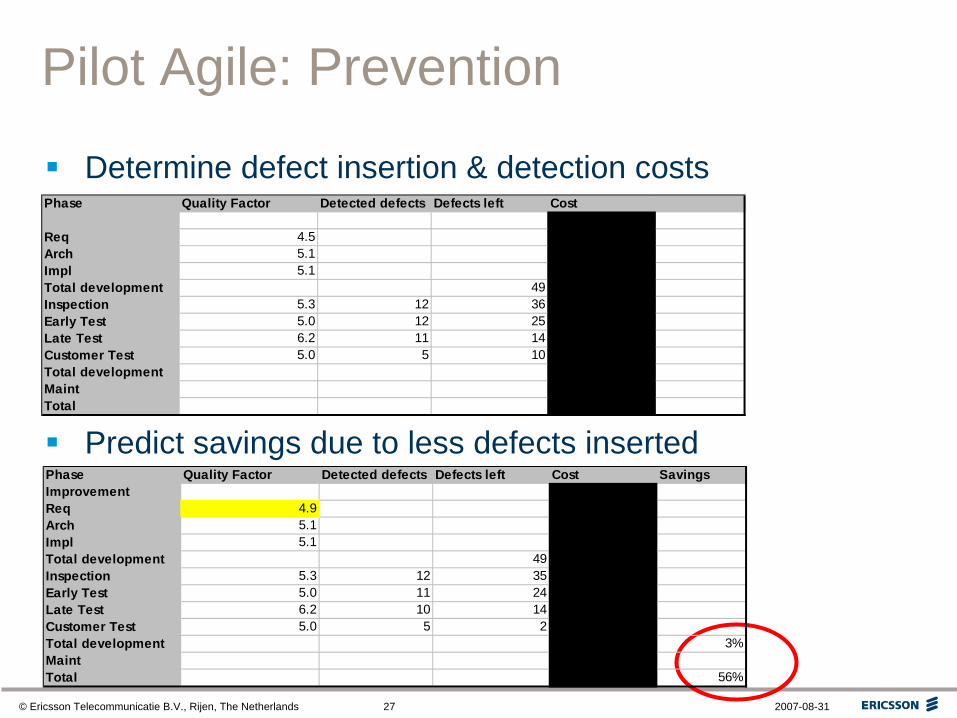
Pilot Agile: Prevention
Determine defect insertion & detection costs
Predict savings due to less defects inserted
Phase Quality Factor Detected defects Defects left Cost
Req 4.5Arch 5.1Impl 5.1Total development 49Inspection 5.3 12 36 72Early Test 5.0 12 25 132Late Test 6.2 11 14 1136Customer Test 5.0 5 10 516Total development 1856Maint 4000Total 5856
Phase Quality Factor Detected defects Defects left Cost SavingsImprovement 50Req 4.9Arch 5.1Impl 5.1Total development 49Inspection 5.3 12 35 72Early Test 5.0 11 24 121Late Test 6.2 10 14 1033Customer Test 5.0 5 2 516Total development 1792 3%Maint 800Total 2592 56%
© Ericsson Telecommunicatie B.V., Rijen, The Netherlands 2007-08-3128
Conclusions
Quality has Business Value
You can Measure & Manage Quality
Estimate, Analyze, and Feedback:– Prevention– Early detection– Risk Management
Why not start today?– Inspections & test– Release & maintenance– Agile

© Ericsson Telecommunicatie B.V., Rijen, The Netherlands 2007-08-3129
Further reading
Papers– Controlling Product Quality During Development with a Defect Model, in
Proceedings ESEPG 2003 & ESEPG 2004 conferences– Make what’s counted count, in Better Software magazine march 2004– Measuring Defects to Control product Quality, in Measure! Knowledge! Action! The
NESMA anniversary book. Oct 2004. ISBN: 90-76258-18-X– A Proactive Attitude Towards Quality: The Project Defect Model, in Software Quality
Professional Dec 2004 (with Hans Sassenburg)– Controlling Project Performance Using the Project Defect Model, in Proceedings
Practical Software Quality & Testing 2005 conference
References– Managing the software process. Watts Humphrey. – Metrics and models in Software Quality Engineering. Stephen H. Kan.
Ben LindersEricsson Telecommunicatie B.V., Rijen, The [email protected], +31 161 24 9885

© Ericsson Telecommunicatie B.V., Rijen, The Netherlands 2007-08-3130