Controlled Gas Metal Arc-2011
15
Measuring the Process Efficiency of Controlled Gas Metal Arc Welding Processes By Nuno Pépe 1 , Stephan Egerland 2 , Paul A. Colegrove 1 , David Yapp 1 , and Andreas Leonhartsberger 2 and Americo Scotti 3 1 Cranfield University, Cranfield, Bedfordshire MK43 0AL, United Kingdom 2 FRONIUS International GmbH, Welding Technology Division, Buxbaumstrasse 2, A-4600 Wels Austria 3 Mechanical Engineering Faculty, Federal University of Uberlandia, Campus Santa Monica, 38400-902 Uberlandia, MG, Brazil
-
Upload
murdock-howling-mad -
Category
Documents
-
view
222 -
download
2
Transcript of Controlled Gas Metal Arc-2011
Measuring the Process Efficiency of Controlled Gas Metal Arc
Welding Processes
By Nuno Pépe1, Stephan Egerland
2, Paul A. Colegrove
1, David Yapp
1, and Andreas
Leonhartsberger2 and Americo Scotti
3
1Cranfield University, Cranfield, Bedfordshire MK43 0AL, United Kingdom
2FRONIUS International GmbH, Welding Technology Division, Buxbaumstrasse 2, A-4600
Wels Austria
3Mechanical Engineering Faculty, Federal University of Uberlandia, Campus Santa Monica,
38400-902 Uberlandia, MG, Brazil
e101466
Text Box
Science and Technology of Welding & Joining, Volume 16, Issue 5, 2011, Pages 412-417
2
Abstract
The thermal or process efficiency in Gas Metal Arc Welding (GMAW) is a crucial input to
numerical models of the process, and requires the use of an accurate welding calorimeter. In
this paper we compare a liquid nitrogen calorimeter with an insulated box calorimeter for
measuring the process efficiency of Fronius CMT, Lincoln STT and Rapid Arc, Kemppi
FastRoot and standard pulsed GMAW. All the controlled dip transfer processes had a process
efficiency of around 85% when measured with the liquid nitrogen calorimeter.
This value was slightly higher when welding in a groove and slightly lower for the RapidArc
and pulsed GMAW. The efficiency measured with the insulated box calorimeter was slightly
lower, but it had the advantage of much smaller random error.
3
1 Introduction When undertaking numerical modelling of a welding process it is important to know the
process efficiency and to understand how this varies with the welding waveform and weld
geometry. The process efficiency, η can be calculated with the following equation1:
nom
weld
Q
Q (1)
where
Qweld is the calorimetric energy input to the plate;
Qnom is the nominal energy input from the power supply, i.e. arc energy.
Although a number of methods can be used to calculate the nominal energy input from the
power supply, the most accurate method is2:
dtVIQweldt
nom
0
(2)
where:
V is the voltage at the arc;
I is the current;
t is the time
tweld is the total time to make the weld.
When this is divided by the duration of the weld, it is often called the ‘average instantaneous
power’.
The weld arc power input to the plate is commonly measured with the Seebeck calorimeter3-6
which calculates the heat loss from an insulated box. The box is closed after welding and
water is subsequently used to cool it down to room temperature. The temperature difference
between the inlet and outlet water flows is measured and integrated to give an estimate of the
total energy input to the plate. Although it is claimed that the method is accurate to within 1%
once the sample is in the calorimeter4, each measurement can take up to six hours
6 and the
heat losses that occur prior to the sample being put into the calorimeter need to be considered.
More recently, a number of authors have used a liquid nitrogen calorimeter7-10
, since
measurements can be made much more rapidly. After completing the weld, the plate is rapidly
inserted into a Dewar containing liquid nitrogen and the amount of liquid boiled off is
measured. By knowing the vaporisation energy of liquid nitrogen, the calorimetric energy
input to the plate can be determined with:
vRTW Tweld LmmQ (3)
where:
ΔmWT is the mass loss when the sample is cooled from welding temperature to the
liquid nitrogen boiling temperature;
ΔmRT is the mass loss when cooling the same plate from room temperature to the
liquid nitrogen boiling temperature.
Lv is the latent heat of vaporisation for liquid nitrogen which equals 199.5 J/g.
In the final method used by Cantin and Francis11
the weld is performed in an insulated box
and the final stabilised temperature of the welded plates and backing bar is measured. The
calorimetric energy input to the plate is found by:
4
e eT
T
T
T
pbbpwwweld dTTcmdTTcmQ
0 0
(4)
where:
mw,mb = Mass of the workpiece and backing bar respectively;
pbpw cc , = Specific heat of the workpiece and backing bar respectively;
T = Temperature;
T0,Te = initial and equilibrium temperatures.
One disadvantage common to all of the above methods are the uncontrolled heat losses which
occur. Some examples are the heat losses which occur prior to insertion into the calorimeter
or prior to the calorimeter being sealed. The dry calorimeter method described above also has
the problem of the heat losses through the insulated box. A method which overcomes these
problems is to back calculate the value from a numerical model12
. Although this method
overcomes this problem, there are other problems with this method such as the uncertainty in
thermocouple measurements, material properties and in particular the boundary condition
which exists between the sample and the backing bar.
These methods have been applied to a variety of processes including Gas Tungsten Arc
Welding (GTAW) 3,4,6,11
, Gas Metal Arc Welding (GMAW) 4,7,8,10,13
, and Plasma Arc
Welding3,4
. The process efficiency for consumable electrode processes is generally about 10-
20% higher than non-consumable processes4. Different authors have reported widely varying
values of process efficiency for GMAW which is the subject of this investigation. Although
most articles claim it lies between 80-90%4,10,13
, some articles have reported values as low as
70%7,8
.
Although there are different transfer modes in GMAW, the ones relevant to this article are
spray, pulsed, dip (sometimes called short circuiting) and controlled dip transfer which are
described in Norrish14
. Spray transfer occurs at large currents and wire feed speeds and
involves a continuous stream of small diameter droplets. Pulsed transfer is characterised by a
pulsed current waveform and a droplet is detached with each pulse. The droplet has a similar
size to the wire diameter and the process has low levels of spatter. Dip transfer occurs when
the currents and voltages are generally low and the wire ‘dips’ into the weld pool. Without
electronic control of the power supply, the short circuit causes a significant increase in current,
which results in an explosive rupture of the wire and high levels of spatter. A number of
power supply manufacturers have developed methods for overcoming this problem based on
the early work of Broughton and MacGregor15
which involve detecting and reducing the
current before the short circuit occurs. Examples are Lincoln Surface Tension Transfer (STT),
and Kemppi FastROOT, and as the name suggests metal is transferred to the weld pool by
surface tension. All these processes have low levels of heat input. Fronius have developed a
process based on the work of Huismann16
called Cold Metal Transfer (CMT)17
which
combines controlled dip transfer with an oscillating wire motion and it is claimed that this
power supply has an even lower heat input. One final power supply which is relevant to this
work is Lincoln RapidArc where there is sufficient current during arcing to cause spray
transfer. Although it is claimed that short circuiting occurs in this process, an extensive
investigation by Pepe10
indicated no evidence for this, and the process was characterised by
pulsed spray transfer.
When comparing the process efficiency of the different transfer modes, investigators have
found little difference between constant voltage and pulsed transfer7,13
. However two articles
5
have reported that the efficiency with dip or STT (controlled dip) modes is significantly
higher – up to 95%8,13
.
One of the interesting questions raised about process efficiency measurements is what
happens to the energy which is not transferred to the workpiece? The heat losses will be in the
form of either evaporation of the weld metal, radiation, convection or conduction from the
welding torch. Obtaining accurate values of each of these contributions is difficult. Dupont et
al.4 claimed that the losses from the weld pool and surrounding area combined accounted for
only 1-2%. Presumably the remaining heat losses (10-20%) come from arc radiation. This is
supported by the theoretical work of Tanaka and Lowke18
who claimed that 18% of the heat
loss was from arc radiation and a further 5% came from conduction and radiation from the
tungsten cathode in GTAW.
This still does not explain the approximately 10-20% difference in process efficiency
measured between consumable and non-consumable processes. Dupont and Marder4 claimed
that the higher efficiency in GMAW is because the electrode heating is added to the heat of
the process, while in GTAW this heat is lost in the torch. However, if the heat loss from the
electrode in GTAW is about 5% as claimed by Tanaka and Lowke18
a further explanation is
required. This may be provided by the difference in arc temperature between GMAW and
GTAW. Interestingly, few measurements have been made of the arc temperature in GMAW,
and it has often been assumed that temperatures similar to GTAW (up to 20,000 K under the
electrode) are obtained19
. Recent arc temperature measurements by Zielińska et al.20
indicate
that this may not be the case and that a peak temperature of 13000 K may occur in GMAW.
It was postulated that this lower temperature was due to the cooling effect of iron vapour from
the wire. The reduced radiation losses from the lower temperature arc may explain the higher
efficiency of GMAW. Finally, numerical investigations such as those of Lim et al.21
state that
energy transfer to the welded plate is from the both the arc and the liquid metal transfer from
the wire. To the author’s knowledge no investigations have examined the efficiencies of
these individual contributions.
In this paper we aim to better understand the process efficiency of controlled dip transfer
GMAW processes and compare them with a standard pulsed GMAW process. In addition, a
liquid nitrogen calorimeter is compared with an insulated box calorimeter to determine the
most effective method for measuring the process efficiency.
2 Experimental
2.1 Liquid nitrogen calorimeter
In the experiments we used mild steel EN 440 G3Si1 - S355JR of size 100x200x2 mm. Prior
to welding the surface of each of the plates was ground and degreased with acetone. The filler
metal used was 1 mm diameter EN 10025 – S355JR with a shielding gas mixture containing
20% CO2 and 80% Ar. The plates were clamped away from the weld with aluminium clamps.
Three trials were performed with the liquid nitrogen calorimeter. In the first trial we
investigated the effect of the welding duration time on the process efficiency. The trial used
the Fronius Cold Metal Transfer (CMT)17
process. The standard synergic line for this material
was used with a wire-feed speed of 7.8 m min-1
, a welding speed of 0.5 m min-1
and a contact
tip to work distance of 13.5 mm. The welding duration time was varied between 5 and 24
seconds. In the second trial, the delay time between completing the weld and inserting the
sample in the liquid nitrogen Dewar was varied. The delay time is required to unclamp the
plate and transfer it to the Dewar and the average time for this operation under normal
6
conditions was about 5 seconds. These tests varied the delay time between 5 and 900 seconds,
while keeping the welding time constant at 10 seconds.
The third trial involved a comparison between the Fronius CMT, Lincoln RapidArc and STT
and Kemppi FastROOT processes. These trials used wire-feed speeds between 3 and 9.4 m
min-1
, a contact tip to work distance of 13.5 mm, welding speeds between 0.2 and 0.8 m min-1
and a welding time of approximately 10 seconds.
In all the welding trials, the arc voltage was measured at the contact tip, and the current was
measured by a LEM PR1030 probe attached to the power cable which gave an output voltage
which is proportional to the current. A Yokagawa oscilloscope was used to record
instantaneous values of arc voltage and current (via the probe), and wire-feed speed (via a
tachometer) at a sampling rate of 5000 Hz. The energy input from the power supply was
calculated with equation (2).
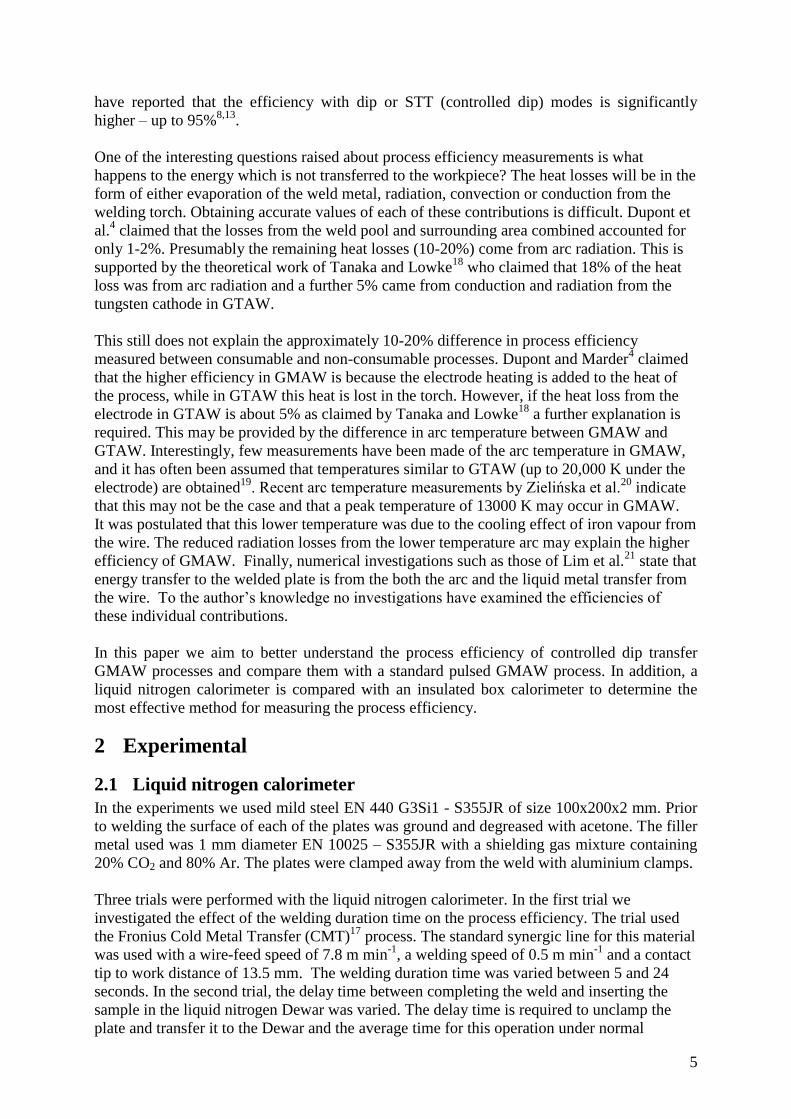
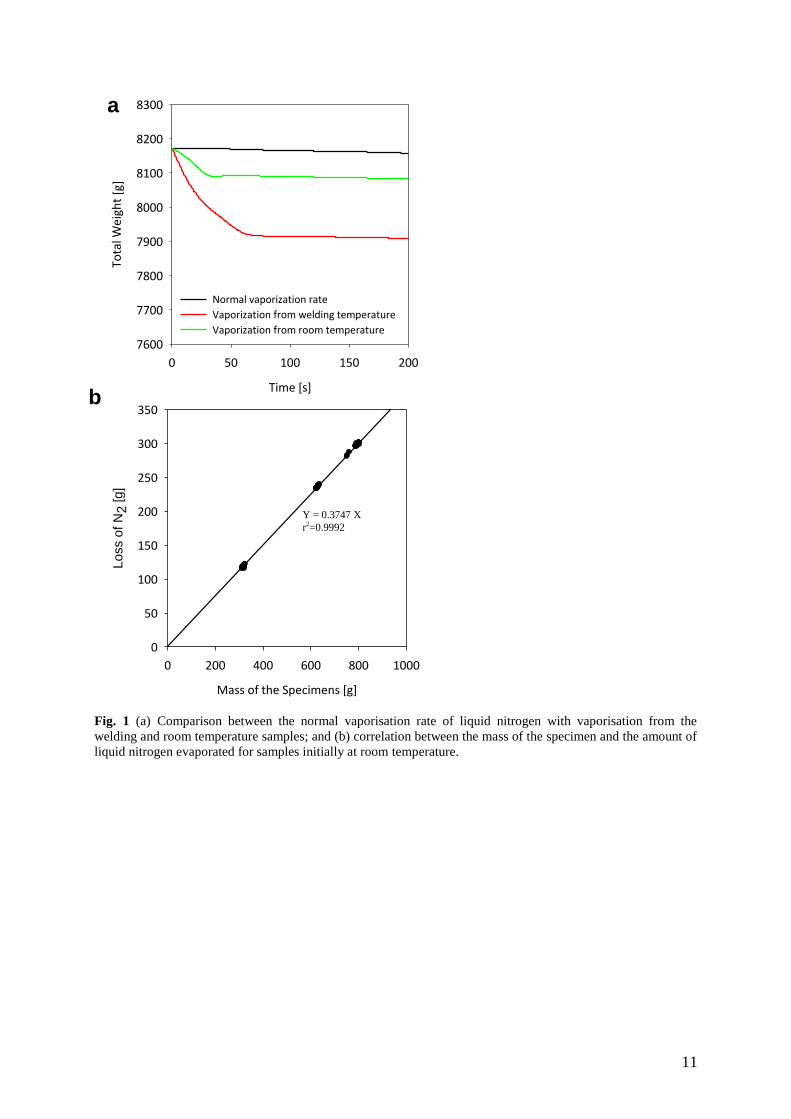
The liquid nitrogen was contained in a Statebourne Cryogenics Dewar which was 150 mm in
diameter and 297 mm in height. The Dewar was always filled to less than 75% capacity
which avoided liquid nitrogen being lost due to splashing. The weight loss due to liquid
nitrogen vaporization was measured using a Salter Brecknell B220 scale and was used to
calculate ΔmWT and ΔmRT (see equation (3)). Typical plots of the change in mass of the
Dewar due to normal vaporisation, and welding and room temperature samples is shown in
Fig. 1(a). Note that the mass loss due to normal vaporisation is accounted for in the
calculations. Rather than doing a separate test for each room temperature sample it is possible
to determine a calibration curve which relates the nitrogen mass loss to the mass of the
specimen, which is shown in Fig. 1(b).
2.2 Insulated box calorimeter
The base material used for the experiments was S235 J2 and two material sizes were used for
the analysis. The first, which was used for the bead on plate (BOP) experiments was 250 mm
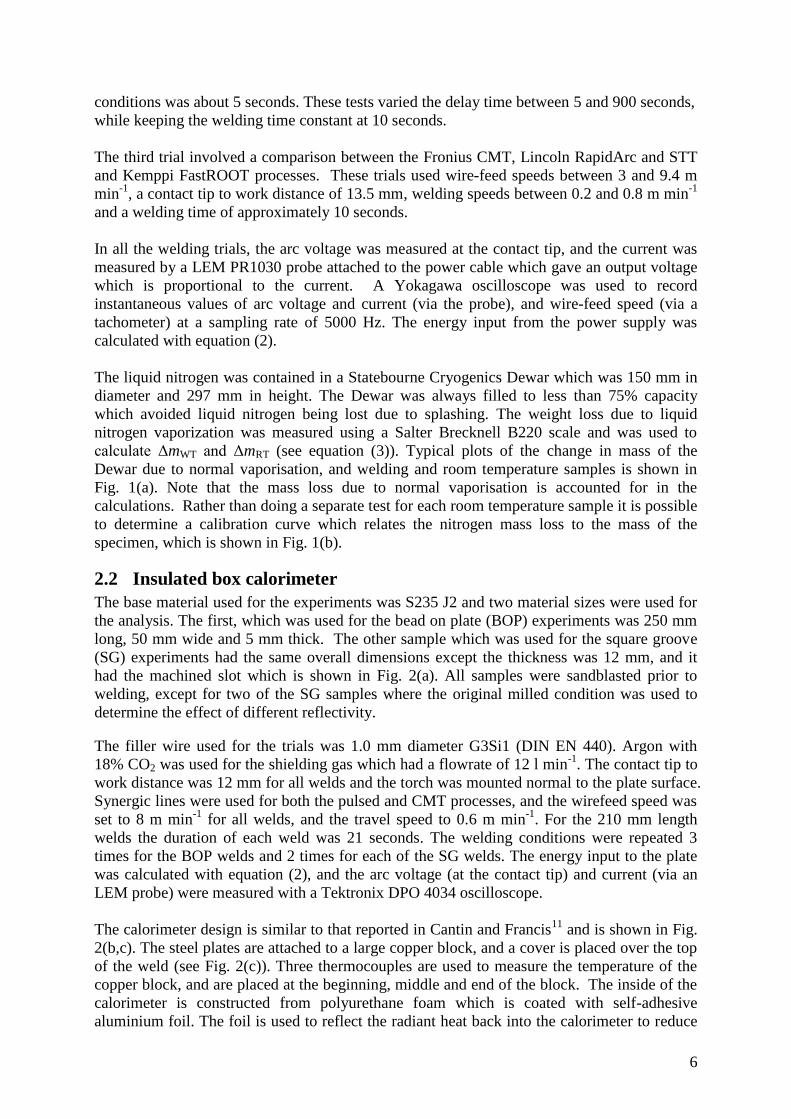
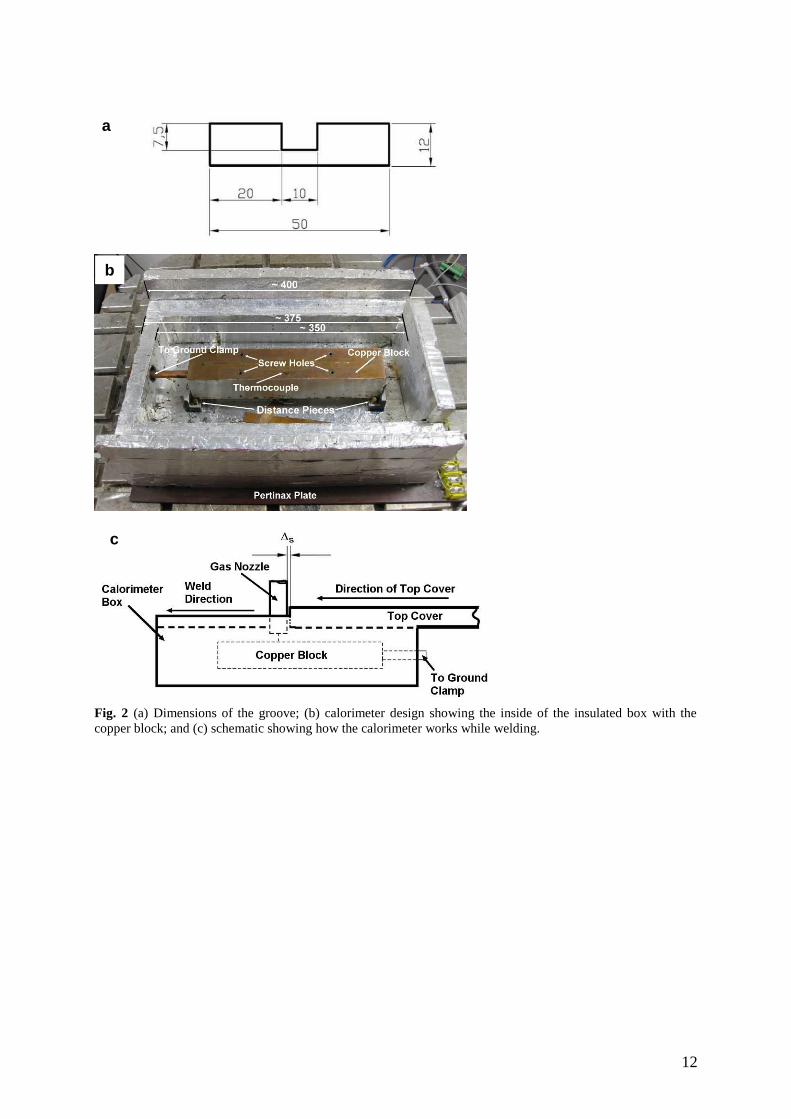
long, 50 mm wide and 5 mm thick. The other sample which was used for the square groove
(SG) experiments had the same overall dimensions except the thickness was 12 mm, and it
had the machined slot which is shown in Fig. 2(a). All samples were sandblasted prior to
welding, except for two of the SG samples where the original milled condition was used to
determine the effect of different reflectivity.
The filler wire used for the trials was 1.0 mm diameter G3Si1 (DIN EN 440). Argon with
18% CO2 was used for the shielding gas which had a flowrate of 12 l min-1
. The contact tip to
work distance was 12 mm for all welds and the torch was mounted normal to the plate surface.
Synergic lines were used for both the pulsed and CMT processes, and the wirefeed speed was
set to 8 m min-1
for all welds, and the travel speed to 0.6 m min-1
. For the 210 mm length
welds the duration of each weld was 21 seconds. The welding conditions were repeated 3
times for the BOP welds and 2 times for each of the SG welds. The energy input to the plate
was calculated with equation (2), and the arc voltage (at the contact tip) and current (via an
LEM probe) were measured with a Tektronix DPO 4034 oscilloscope.
The calorimeter design is similar to that reported in Cantin and Francis11
and is shown in Fig.
2(b,c). The steel plates are attached to a large copper block, and a cover is placed over the top
of the weld (see Fig. 2(c)). Three thermocouples are used to measure the temperature of the
copper block, and are placed at the beginning, middle and end of the block. The inside of the
calorimeter is constructed from polyurethane foam which is coated with self-adhesive
aluminium foil. The foil is used to reflect the radiant heat back into the calorimeter to reduce
7
heat loss. Although there will be some heat loss with the device, both the specific heat and
thermal conductivity of the polyurethane are very low.
The calorimetric energy input to the plate is calculated with equation (4). Since the total
temperature rise is usually relatively small 20-30oC, constant values of specific heat were
used and multiplied by the temperature difference before and after welding. A value of
484 J kg-1
K-1
was used for the specific heat of S235 and a value of 388 J kg-1
K-1
was used for
the copper backing bar. Both these values were obtained from unpublished sources, but are
similar to those reported in Holman22
. The total mass of the steel and copper components was
measured with an accurate scale.
3 Results and discussion
3.1 Liquid nitrogen calorimeter
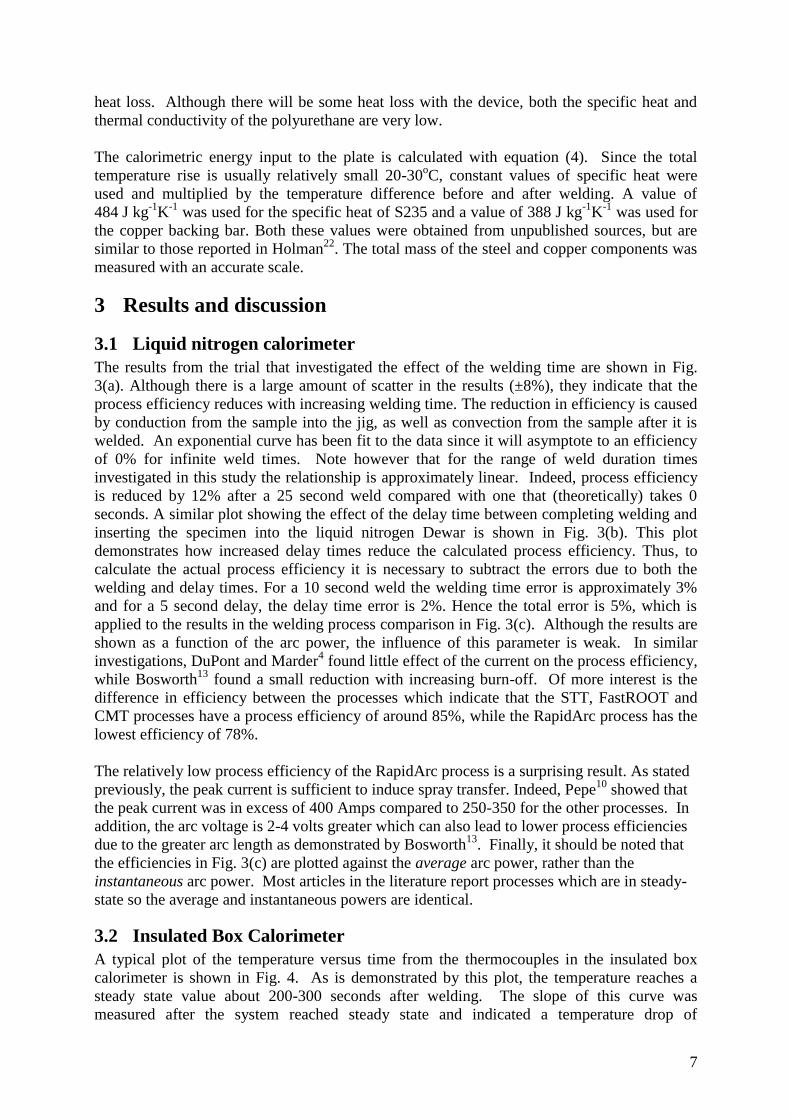
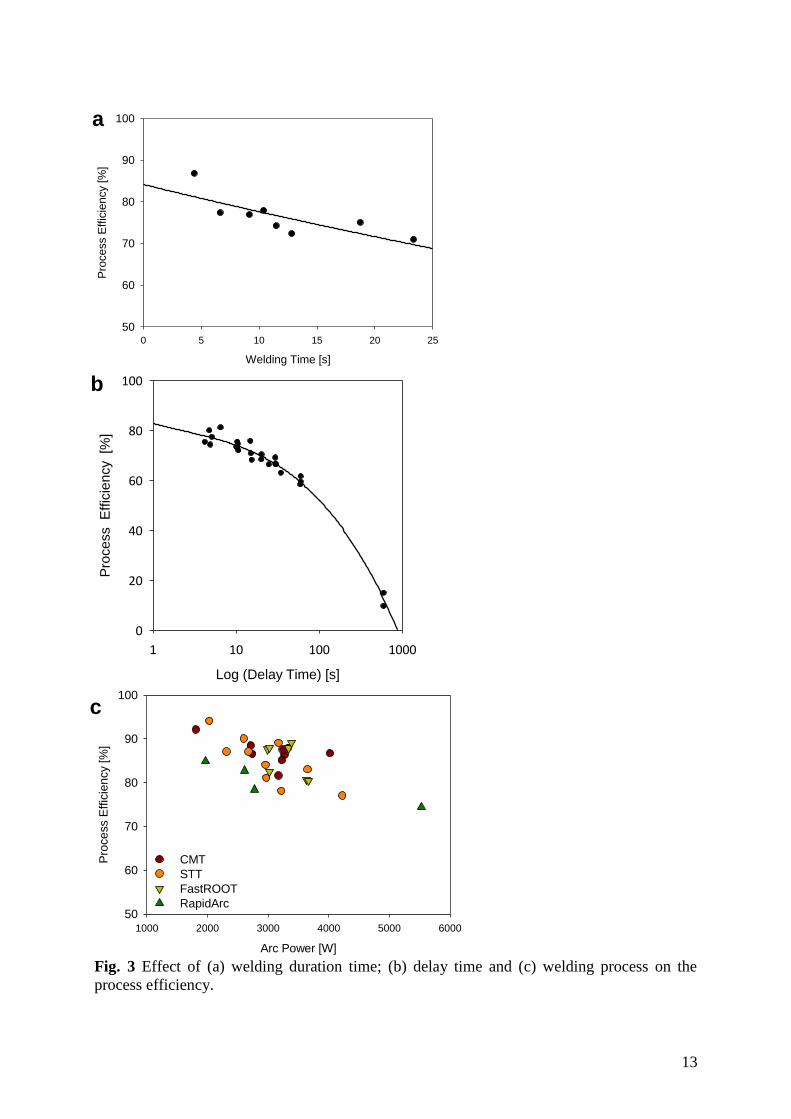
The results from the trial that investigated the effect of the welding time are shown in Fig.
3(a). Although there is a large amount of scatter in the results (±8%), they indicate that the
process efficiency reduces with increasing welding time. The reduction in efficiency is caused
by conduction from the sample into the jig, as well as convection from the sample after it is
welded. An exponential curve has been fit to the data since it will asymptote to an efficiency
of 0% for infinite weld times. Note however that for the range of weld duration times
investigated in this study the relationship is approximately linear. Indeed, process efficiency
is reduced by 12% after a 25 second weld compared with one that (theoretically) takes 0
seconds. A similar plot showing the effect of the delay time between completing welding and
inserting the specimen into the liquid nitrogen Dewar is shown in Fig. 3(b). This plot
demonstrates how increased delay times reduce the calculated process efficiency. Thus, to
calculate the actual process efficiency it is necessary to subtract the errors due to both the
welding and delay times. For a 10 second weld the welding time error is approximately 3%
and for a 5 second delay, the delay time error is 2%. Hence the total error is 5%, which is
applied to the results in the welding process comparison in Fig. 3(c). Although the results are
shown as a function of the arc power, the influence of this parameter is weak. In similar
investigations, DuPont and Marder4 found little effect of the current on the process efficiency,
while Bosworth13
found a small reduction with increasing burn-off. Of more interest is the
difference in efficiency between the processes which indicate that the STT, FastROOT and
CMT processes have a process efficiency of around 85%, while the RapidArc process has the
lowest efficiency of 78%.
The relatively low process efficiency of the RapidArc process is a surprising result. As stated
previously, the peak current is sufficient to induce spray transfer. Indeed, Pepe10
showed that
the peak current was in excess of 400 Amps compared to 250-350 for the other processes. In
addition, the arc voltage is 2-4 volts greater which can also lead to lower process efficiencies
due to the greater arc length as demonstrated by Bosworth13
. Finally, it should be noted that
the efficiencies in Fig. 3(c) are plotted against the average arc power, rather than the
instantaneous arc power. Most articles in the literature report processes which are in steady-
state so the average and instantaneous powers are identical.
3.2 Insulated Box Calorimeter
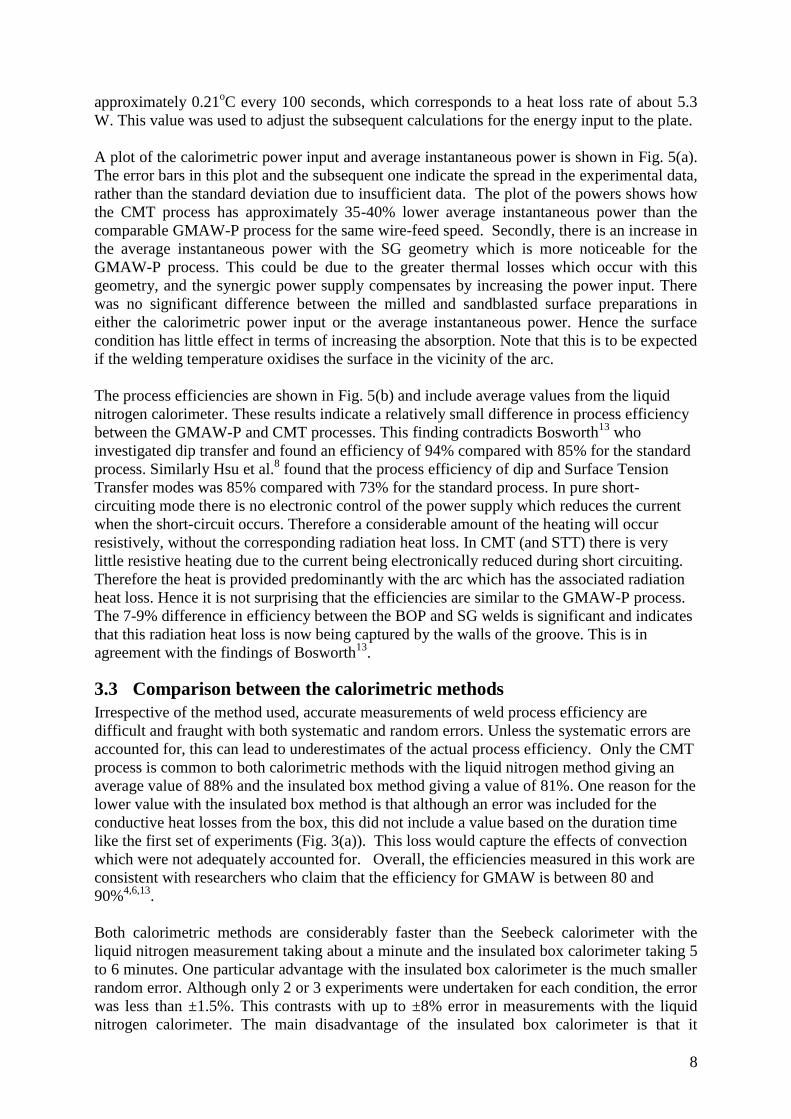
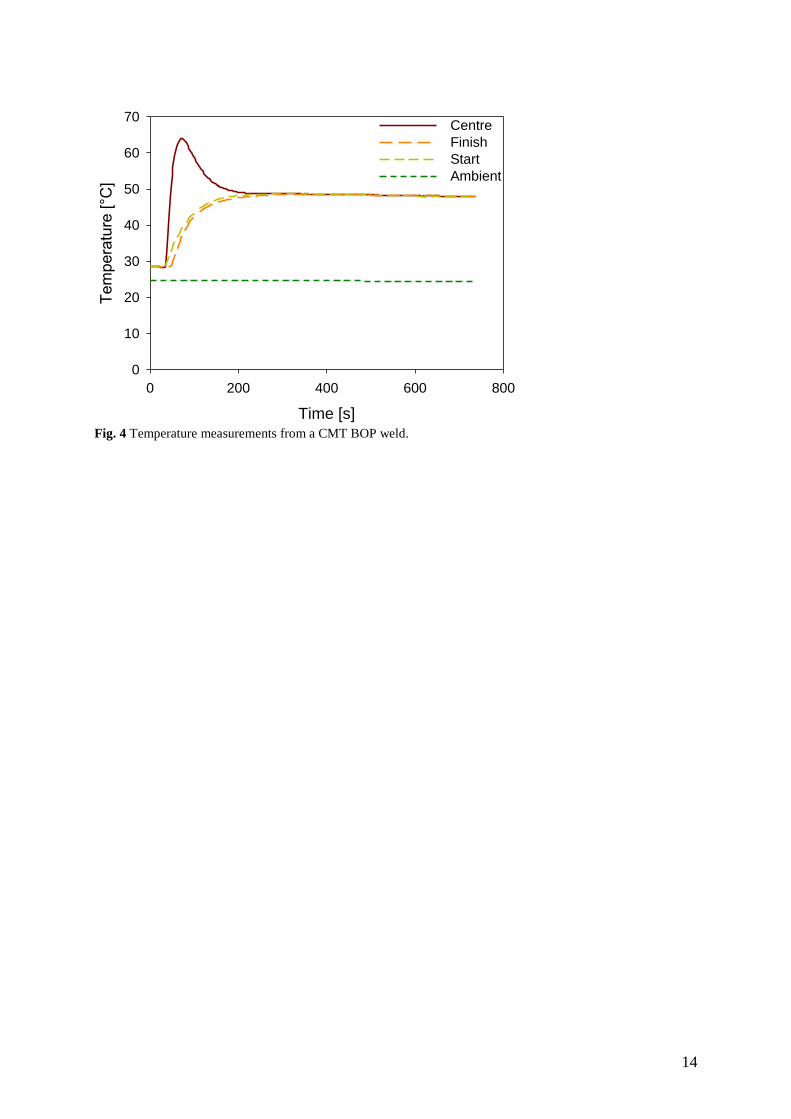
A typical plot of the temperature versus time from the thermocouples in the insulated box
calorimeter is shown in Fig. 4. As is demonstrated by this plot, the temperature reaches a
steady state value about 200-300 seconds after welding. The slope of this curve was
measured after the system reached steady state and indicated a temperature drop of
8
approximately 0.21oC every 100 seconds, which corresponds to a heat loss rate of about 5.3
W. This value was used to adjust the subsequent calculations for the energy input to the plate.
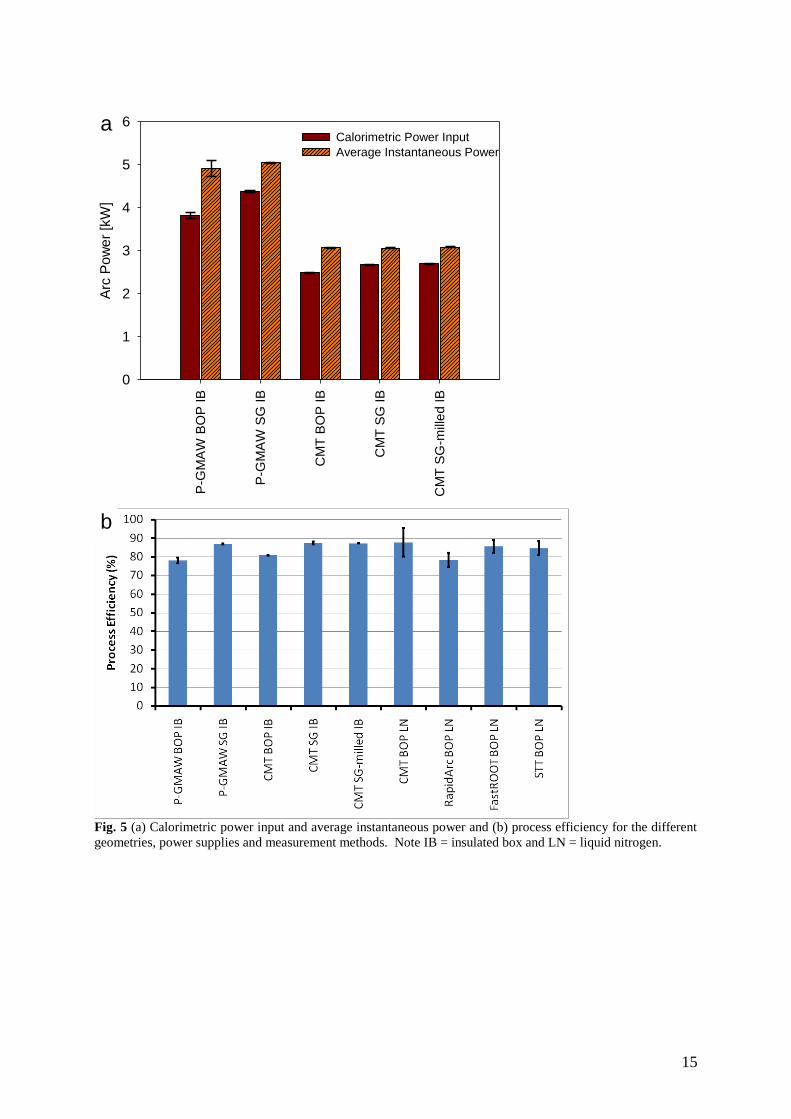
A plot of the calorimetric power input and average instantaneous power is shown in Fig. 5(a).
The error bars in this plot and the subsequent one indicate the spread in the experimental data,
rather than the standard deviation due to insufficient data. The plot of the powers shows how
the CMT process has approximately 35-40% lower average instantaneous power than the
comparable GMAW-P process for the same wire-feed speed. Secondly, there is an increase in
the average instantaneous power with the SG geometry which is more noticeable for the
GMAW-P process. This could be due to the greater thermal losses which occur with this
geometry, and the synergic power supply compensates by increasing the power input. There
was no significant difference between the milled and sandblasted surface preparations in
either the calorimetric power input or the average instantaneous power. Hence the surface
condition has little effect in terms of increasing the absorption. Note that this is to be expected
if the welding temperature oxidises the surface in the vicinity of the arc.
The process efficiencies are shown in Fig. 5(b) and include average values from the liquid
nitrogen calorimeter. These results indicate a relatively small difference in process efficiency
between the GMAW-P and CMT processes. This finding contradicts Bosworth13
who
investigated dip transfer and found an efficiency of 94% compared with 85% for the standard
process. Similarly Hsu et al.8 found that the process efficiency of dip and Surface Tension
Transfer modes was 85% compared with 73% for the standard process. In pure short-
circuiting mode there is no electronic control of the power supply which reduces the current
when the short-circuit occurs. Therefore a considerable amount of the heating will occur
resistively, without the corresponding radiation heat loss. In CMT (and STT) there is very
little resistive heating due to the current being electronically reduced during short circuiting.
Therefore the heat is provided predominantly with the arc which has the associated radiation
heat loss. Hence it is not surprising that the efficiencies are similar to the GMAW-P process.
The 7-9% difference in efficiency between the BOP and SG welds is significant and indicates
that this radiation heat loss is now being captured by the walls of the groove. This is in
agreement with the findings of Bosworth13
.
3.3 Comparison between the calorimetric methods
Irrespective of the method used, accurate measurements of weld process efficiency are
difficult and fraught with both systematic and random errors. Unless the systematic errors are
accounted for, this can lead to underestimates of the actual process efficiency. Only the CMT
process is common to both calorimetric methods with the liquid nitrogen method giving an
average value of 88% and the insulated box method giving a value of 81%. One reason for the
lower value with the insulated box method is that although an error was included for the
conductive heat losses from the box, this did not include a value based on the duration time
like the first set of experiments (Fig. 3(a)). This loss would capture the effects of convection
which were not adequately accounted for. Overall, the efficiencies measured in this work are
consistent with researchers who claim that the efficiency for GMAW is between 80 and
90%4,6,13
.
Both calorimetric methods are considerably faster than the Seebeck calorimeter with the
liquid nitrogen measurement taking about a minute and the insulated box calorimeter taking 5
to 6 minutes. One particular advantage with the insulated box calorimeter is the much smaller
random error. Although only 2 or 3 experiments were undertaken for each condition, the error
was less than ±1.5%. This contrasts with up to ±8% error in measurements with the liquid
nitrogen calorimeter. The main disadvantage of the insulated box calorimeter is that it
9
requires a reasonably accurate prediction of the specific heat for the materials being welded.
This may be difficult to obtain for exotic materials.
4 Conclusions In this paper we demonstrated how both the liquid nitrogen and insulated box calorimeters
can be used to measure the process efficiency of various controlled GMAW processes. It was
demonstrated that:
The causes of systematic error need to be estimated and included in the calculations.
All the controlled dip transfer processes measured with the liquid nitrogen calorimeter
had a process efficiency around 85%. This compared with 78% for the Lincoln
RapidArc process. It was postulated that the lower efficiency of this process was due
to the higher peak current and/or voltage which causes spray transfer.
The process efficiency of Fronius CMT, was only marginally greater (3%) than
GMAW-P when measured by the insulated box calorimeter.
Welding in a groove increased the process efficiency to around 90% since much of the
radiation heat loss was absorbed by the side walls.
The welding efficiency for the CMT process was lower (7%) when measured with the
insulated box calorimeter compared with the liquid nitrogen calorimeter. It was
suggested that this may be due to the absence of the welding duration time error in the
insulated box calculations.
Both calorimetric methods are considerably faster than the Seebeck calorimeter. The
insulated box calorimeter has the advantage of much less random error than the liquid
nitrogen calorimeter.
5 Acknowledgements The authors would like to thank BP for their financial support of this work as well as
FRONIUS International GmbH, Wels Austria, which provided the facilities to perform the
insulated box experiments. In addition the authors wish to thank Mr. B. Brooks, Mr. F.
Nielsen, Mr H. Hackl, Mr W. Stieglbauer, Mr A. Leonhartsberger, Mr G. Miessbacher and Dr.
A. Eder for their support and guidance.
6 References 1. S. Kou: 'Welding Metallurgy', 461; 2003, New York, USA, Wiley-Interscience.
2. A. Joseph, D. Harwig, D. F. Farson and R. Richardson: 'Measurement and calculation of
arc power and heat transfer efficiency in pulsed gas metal arc welding', Science and
Technology of Welding and Joining, 2003, 8, 400-406.
3. P. W. Fuerschbach and G. A. Knorovsky: 'A study of melting efficiency in plasma arc and
gas tungsten arc welding', Welding Journal, 1991, 70, 287s-297s.
4. J. N. DuPont and A. R. Marder: 'Thermal efficiency of arc welding processes', Weld J
(Miami Fla), 1995, 74, 406-s.
5. D. M. Evans, D. Huang, J. C. McClure and A. C. Nunes: 'Arc efficiency of plasma arc
welding', Weld J (Miami Fla), 1998, 77, 53-s.
6. W. H. Giedt, L. N. Tallerico and P. W. Fuerschbach: 'GTA welding efficiency: calorimetric
and temperature field measurements', Welding Journal, 1989, 68, 28s-32s.
7. A. Joseph, D. Harwig, D. F. Farson and R. Richardson: 'Measurement and calculation of
arc power and heat transfer efficiency in pulsed gas metal arc welding', Science and
Technology of Welding and Joining, 2003, 8, 400-406.
8. C. Hsu and P. Soltis: Proc. ASM Proceedings of the International Conference: Trends in
Welding Research, 369-374.
10
9. D. Yapp and N. C. Pepe: Proc. IIW Commission IV, XII and SG212 Intermediate Meeting,
Fjerritslev, Denmark, 22nd - 24th April, 2008, .
10. N. C. Pepe: 'Advances in Gas Metal Arc Welding and Application to Corrosion Resistant
Alloy Pipes', 2010, PhD Thesis, Cranfield University.
11. G. M. D. Cantin and J. A. Francis: 'Arc power and efficiency in gas tungsten arc welding
of aluminium', Science and Technology of Welding and Joining, 2005, 10, 200-210.
12. P. A. Colegrove, C. Ikeagu, A. Thistlethwaite, S. W. Williams, T. Nagy, W. Suder, S.
Steuwer and T. Pirling: 'The welding process impact on residual stress and distortion', Science
and Technology of Welding & Joining, 2009, 14, 717-725.
13. M. R. Bosworth: 'Effective heat input in pulsed gas metal arc welding with solid wire
electrodes', Welding Journal, 1991, 70, 111s-117s.
14. J. Norrish: 'Advanced Welding Processes', 2006, Cambridge, England, Woodhead
Publishing Limited.
15. P. Broughton and G. J. MacGregor: 'Control of short circuiting in MIG welding', Welding
Research International, 1974, 4, 31-53.
16. G. Huismann: 6-8.
17. A. Schierl: 'The CMT - Process - A Revolution in welding technology', Weld. World,
2005, 49, 38.
18. M. Tanaka and J. J. Lowke: 'Predictions of weld pool profiles using plasma physics', J.
Phys. D, 2007, 40, R1-R23.
19. M. Schnick, U. Füssel, M. Hertel, A. Spille-Kohoff and A. B. Murphy: 'Metal vapour
causes a central minimum in arc temperature in gas-metal arc welding through increased
radiative emission', J. Phys. D, 2010, 43.
20. S. Zielińska, K. Musioł, K. Dzierga, S. Pellerin, F. Valensi, C. De Izarra and F. Briand:
'Investigations of GMAW plasma by optical emission spectroscopy', Plasma Sources Sci.
Technol., 2007, 16, 832-838.
21. Y. C. Lim, D. F. Farson, M. H. Cho and J. H. Cho: 'Stationary GMAW-P weld metal
deposit spreading', Science and Technology of Welding and Joining, 2009, 14, 626-635.
22. J. P. Holman: 'Heat Transfer, 7th Edition', 1990, San Francisco, McGraw Hill.
11
Time [s]
0 50 100 150 200
Tota
l We
igh
t [g
]
7600
7700
7800
7900
8000
8100
8200
8300
Normal vaporization rate
Vaporization from welding temperature
Vaporization from room temperature
Mass of the Specimens [g]
0 200 400 600 800 1000
Loss o
f N
2 [g]
0
50
100
150
200
250
300
350
Fig. 1 (a) Comparison between the normal vaporisation rate of liquid nitrogen with vaporisation from the
welding and room temperature samples; and (b) correlation between the mass of the specimen and the amount of
liquid nitrogen evaporated for samples initially at room temperature.
a
b
Y = 0.3747 X
r2=0.9992
12
Fig. 2 (a) Dimensions of the groove; (b) calorimeter design showing the inside of the insulated box with the
copper block; and (c) schematic showing how the calorimeter works while welding.
b
c
a
13
Welding Time [s]
0 5 10 15 20 25
Pro
cess E
ffic
iency [%
]
50
60
70
80
90
100
Log (Delay Time) [s]
1 10 100 1000
Pro
ce
ss E
ffic
ien
cy [%
]
0
20
40
60
80
100
Arc Power [W]
1000 2000 3000 4000 5000 6000
Pro
ce
ss E
ffic
ien
cy [%
]
50
60
70
80
90
100
CMT
STT
FastROOT
RapidArc
Fig. 3 Effect of (a) welding duration time; (b) delay time and (c) welding process on the
process efficiency.
a
b
c
14
Time [s]
0 200 400 600 800
Tem
pera
ture
[°C
]
0
10
20
30
40
50
60
70Centre
Finish
Start
Ambient
Fig. 4 Temperature measurements from a CMT BOP weld.
15
P-G
MA
W B
OP
IB
P-G
MA
W S
G IB
CM
T B
OP
IB
CM
T S
G IB
CM
T S
G-m
ille
d IB
Arc
Po
we
r [k
W]
0
1
2
3
4
5
6Calorimetric Power Input
Average Instantaneous Power
Fig. 5 (a) Calorimetric power input and average instantaneous power and (b) process efficiency for the different
geometries, power supplies and measurement methods. Note IB = insulated box and LN = liquid nitrogen.
b
a