Control Tower: Transforming the Supply...
26
Copyright © 2013 Accenture All Rights Reserved. Accenture, its logo, and High Performance Delivered are trademarks of Accenture. Control Tower: Transforming the Supply Chain William Kammerer Roderick Martin Managing Directors
Transcript of Control Tower: Transforming the Supply...
Copyright © 2013 Accenture All Rights Reserved. Accenture, its logo, and High Performance Delivered are trademarks of Accenture.
Control Tower:
Transforming the Supply Chain William Kammerer
Roderick Martin
Managing Directors
Copyright © 2012 Accenture. All rights reserved. 2
Accenture by the numbers Industry Spectrum & Growth Platforms
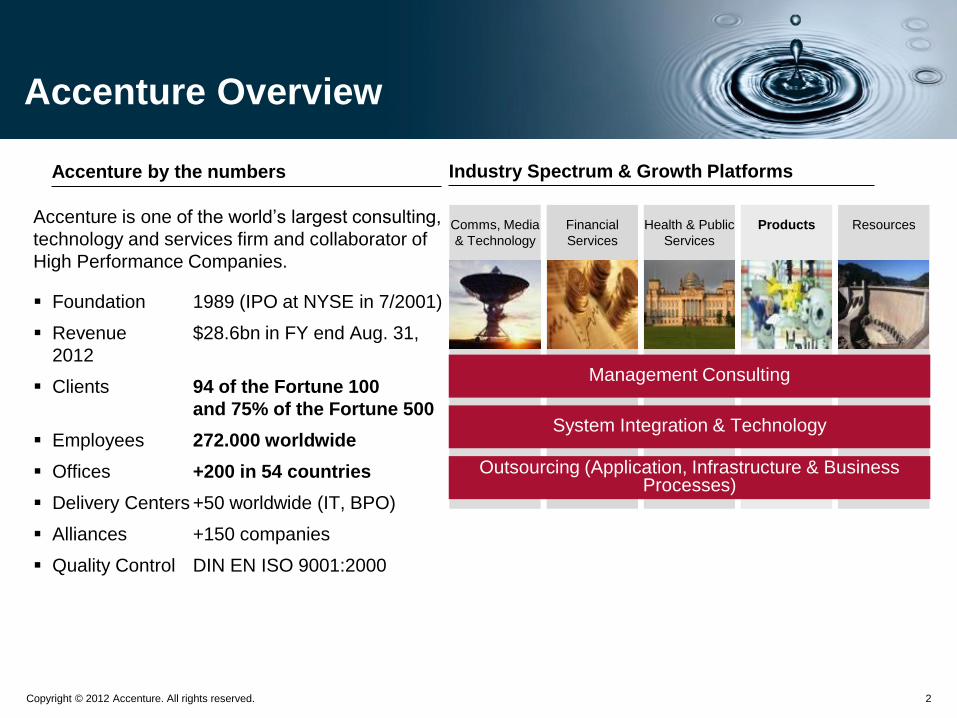
Accenture is one of the world’s largest consulting,
technology and services firm and collaborator of
High Performance Companies.
Foundation 1989 (IPO at NYSE in 7/2001)
Revenue $28.6bn in FY end Aug. 31,
2012
Clients 94 of the Fortune 100
and 75% of the Fortune 500
Employees 272.000 worldwide
Offices +200 in 54 countries
Delivery Centers +50 worldwide (IT, BPO)
Alliances +150 companies
Quality Control DIN EN ISO 9001:2000
Comms, Media
& Technology
Financial
Services
Products
Health & Public
Services
Resources
Management Consulting
System Integration & Technology
Outsourcing (Application, Infrastructure & Business Processes)
Accenture Overview
Copyright © 2012 Accenture. All rights reserved. 3
Management Consulting
Resources Communications,
Media & Tech
Financial
Services
Health & Public
Service
Products
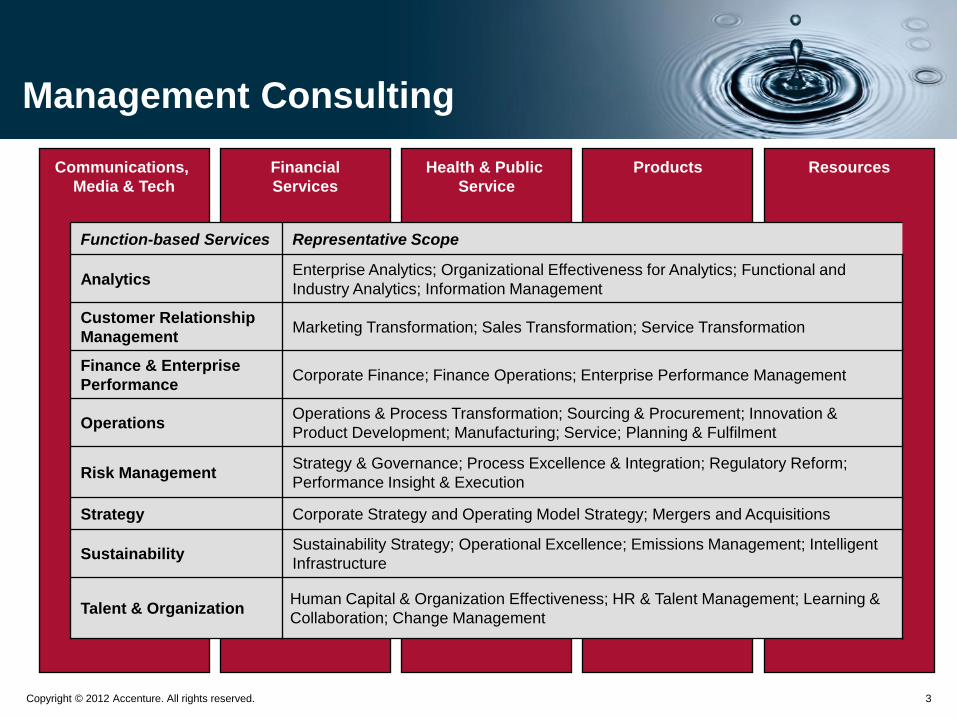
Function-based Services Representative Scope
Analytics Enterprise Analytics; Organizational Effectiveness for Analytics; Functional and
Industry Analytics; Information Management
Customer Relationship
Management Marketing Transformation; Sales Transformation; Service Transformation
Finance & Enterprise
Performance Corporate Finance; Finance Operations; Enterprise Performance Management
Operations Operations & Process Transformation; Sourcing & Procurement; Innovation &
Product Development; Manufacturing; Service; Planning & Fulfilment
Risk Management Strategy & Governance; Process Excellence & Integration; Regulatory Reform;
Performance Insight & Execution
Strategy Corporate Strategy and Operating Model Strategy; Mergers and Acquisitions
Sustainability Sustainability Strategy; Operational Excellence; Emissions Management; Intelligent
Infrastructure
Talent & Organization Human Capital & Organization Effectiveness; HR & Talent Management; Learning &
Collaboration; Change Management
Copyright © 2012 Accenture. All rights reserved. 4
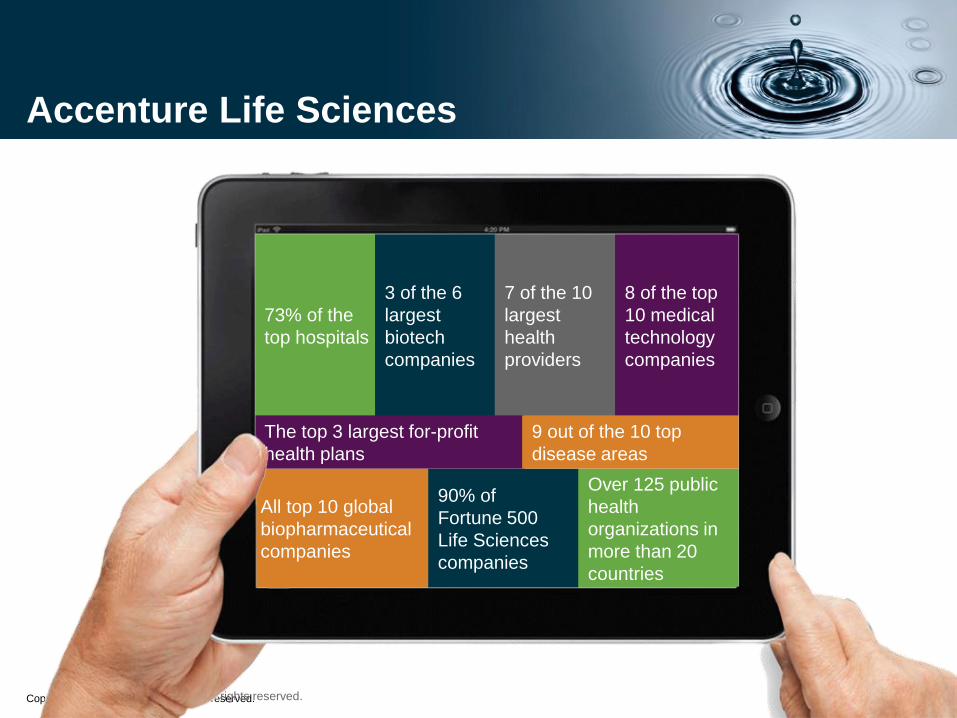
Accenture Life Sciences
73% of the
top hospitals
3 of the 6
largest
biotech
companies
7 of the 10
largest
health
providers
8 of the top
10 medical
technology
companies
Copyright © 2013 Accenture All rights reserved. 4
All top 10 global
biopharmaceutical
companies
90% of
Fortune 500
Life Sciences
companies
Over 125 public
health
organizations in
more than 20
countries
The top 3 largest for-profit
health plans
9 out of the 10 top
disease areas
Copyright © 2011 Accenture. All rights reserved. 5
Elements of Change and Impact on Supply Chain
Copyright © 2012 Accenture. All rights reserved. 6
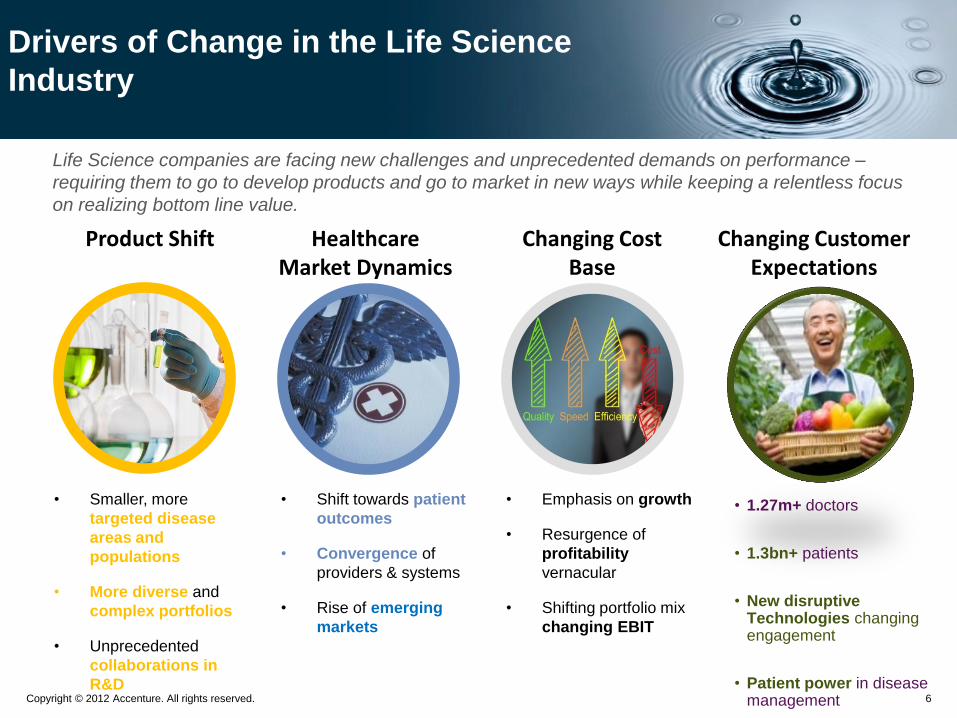
Life Science companies are facing new challenges and unprecedented demands on performance –
requiring them to go to develop products and go to market in new ways while keeping a relentless focus
on realizing bottom line value.
Product Shift Healthcare Market Dynamics
• Smaller, more
targeted disease
areas and
populations
• More diverse and
complex portfolios
• Unprecedented
collaborations in
R&D
• Shift towards patient
outcomes
• Convergence of
providers & systems
• Rise of emerging
markets
Changing Cost Base
• Emphasis on growth
• Resurgence of
profitability
vernacular
• Shifting portfolio mix
changing EBIT
Drivers of Change in the Life Science
Industry
• 1.27m+ doctors
• 1.3bn+ patients
• New disruptive Technologies changing engagement
• Patient power in disease management
Changing Customer Expectations

Copyright © 2012 Accenture. All rights reserved. 7
Drivers of change are pulling the Supply
Chain…
Manage business cost to
serve and profitability while
reducing total supply chain
costs and complexity
Become more agile and
flexible to sense and adapt
to demand changes and
shape demand for growth
Support growth
opportunities by improving
service levels, new
markets penetration or new
services
Manage End to
End Supply Chain
Security and Risk
Meet increasing
customer
requirements and
service level goals
Ensure supply and
supplier performance
& reliability
Copyright © 2012 Accenture. All rights reserved. 8
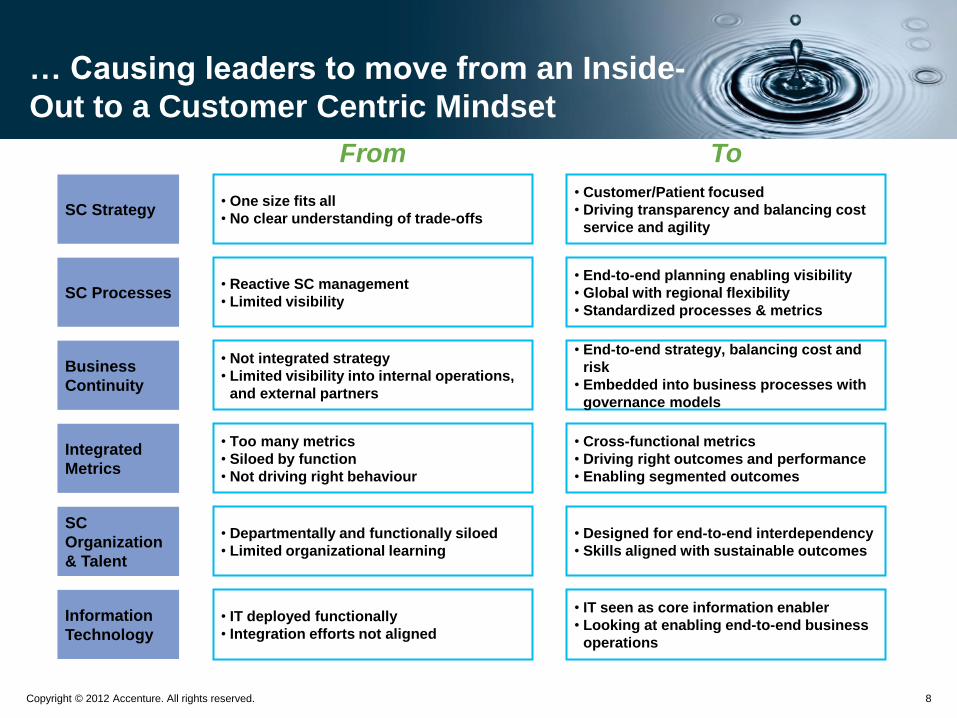
SC Strategy
SC Processes
Business
Continuity
Integrated
Metrics
SC
Organization
& Talent
Information
Technology
• One size fits all
• No clear understanding of trade-offs
• Reactive SC management
• Limited visibility
• Not integrated strategy
• Limited visibility into internal operations,
and external partners
• Too many metrics
• Siloed by function
• Not driving right behaviour
• Departmentally and functionally siloed
• Limited organizational learning
• IT deployed functionally
• Integration efforts not aligned
• Customer/Patient focused
• Driving transparency and balancing cost
service and agility
• End-to-end planning enabling visibility
• Global with regional flexibility
• Standardized processes & metrics
• End-to-end strategy, balancing cost and
risk
• Embedded into business processes with
governance models
• Cross-functional metrics
• Driving right outcomes and performance
• Enabling segmented outcomes
• Designed for end-to-end interdependency
• Skills aligned with sustainable outcomes
• IT seen as core information enabler
• Looking at enabling end-to-end business
operations
From To
… Causing leaders to move from an Inside-
Out to a Customer Centric Mindset
Copyright © 2012 Accenture. All rights reserved. 9
Bu
ye
r, C
on
su
me
r ,
Use
r, C
usto
me
r
Products
&
Services
“T
he
Ma
rke
t”
Product & Services
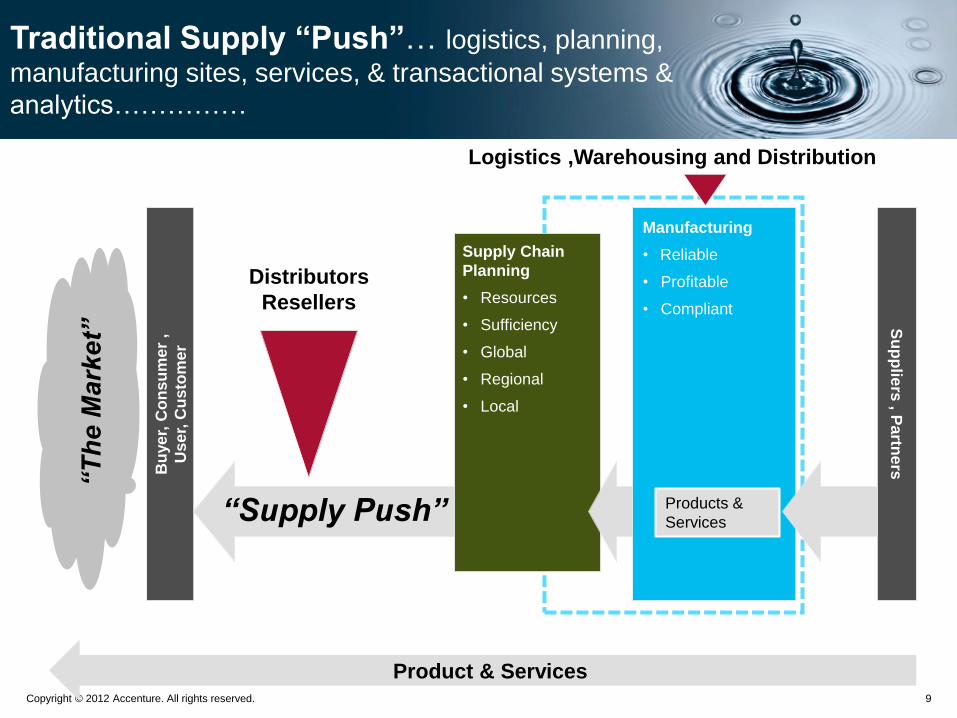
Traditional Supply “Push”… logistics, planning,
manufacturing sites, services, & transactional systems &
analytics……………
Su
pp
liers
, Pa
rtne
rs
Manufacturing
• Reliable
• Profitable
• Compliant
Supply Chain
Planning
• Resources
• Sufficiency
• Global
• Regional
• Local
Products &
Services
Distributors
Resellers
Logistics ,Warehousing and Distribution
“Supply Push”
Copyright © 2012 Accenture. All rights reserved. 10
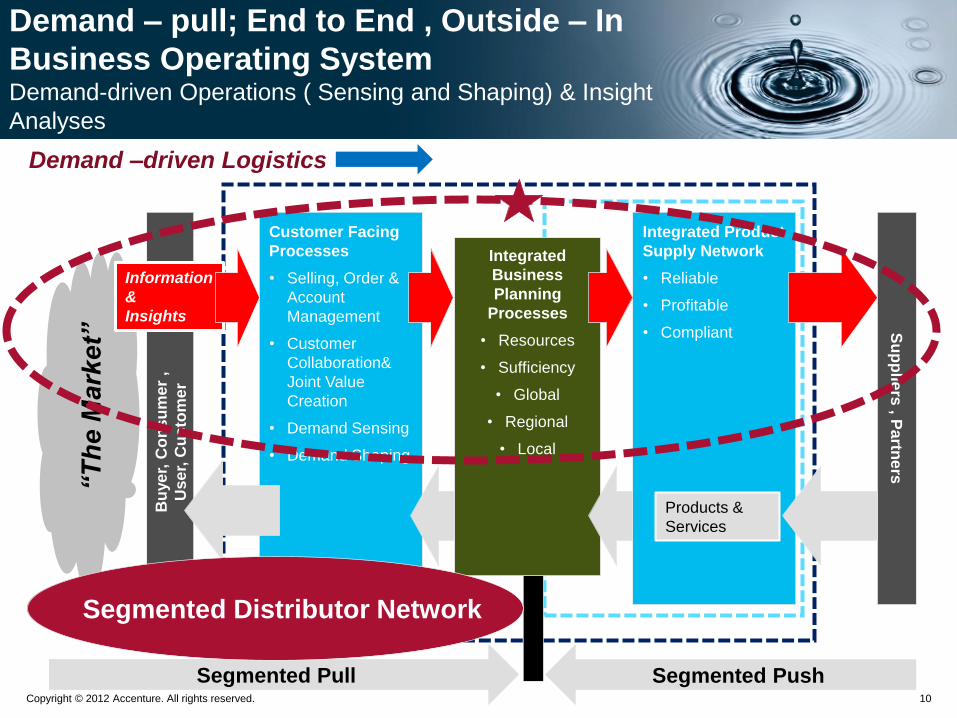
Customer Facing
Processes
• Selling, Order &
Account
Management
• Customer
Collaboration&
Joint Value
Creation
• Demand Sensing
• Demand Shaping
Bu
ye
r, C
on
su
me
r ,
Use
r, C
usto
me
r
Products
&
Services
“T
he
Ma
rke
t”
Segmented Pull Segmented Push
Demand – pull; End to End , Outside – In
Business Operating System Demand-driven Operations ( Sensing and Shaping) & Insight
Analyses
Su
pp
liers
, Pa
rtne
rs
Integrated Product
Supply Network
• Reliable
• Profitable
• Compliant
Integrated
Business
Planning
Processes
• Resources
• Sufficiency
• Global
• Regional
• Local
Products &
Services
Segmented Distributor Network
Information
&
Insights
Demand –driven Logistics
Copyright © 2011 Accenture. All rights reserved. 11
Transformation Evolution and Maturity
Copyright © 2012 Accenture. All rights reserved. 12
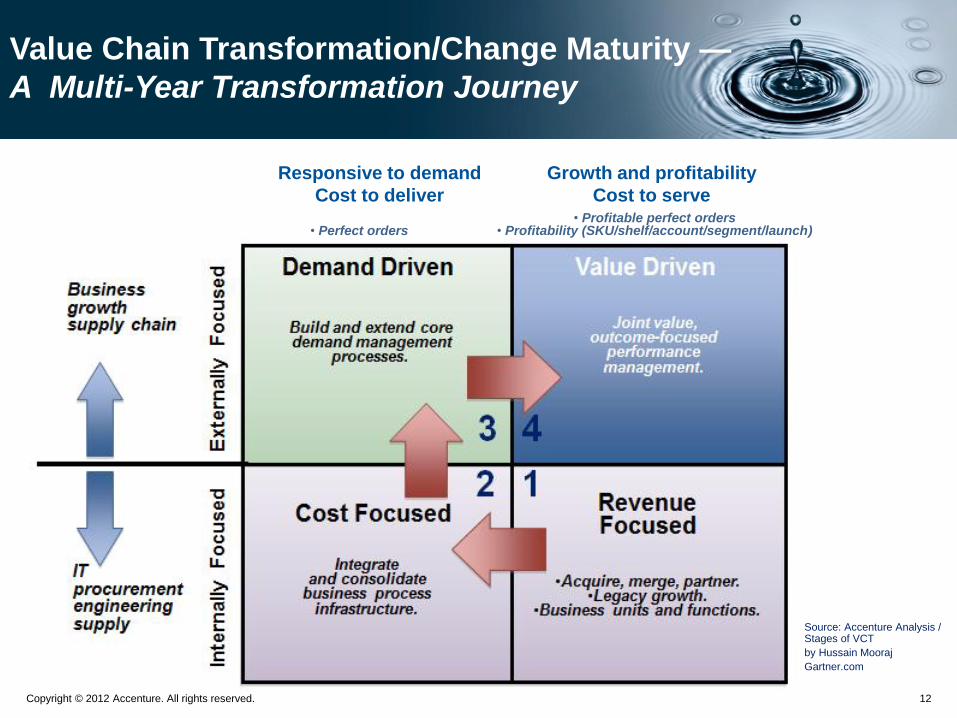
Value Chain Transformation/Change Maturity —
A Multi-Year Transformation Journey
Growth and profitability
Cost to serve
Responsive to demand
Cost to deliver
Value Driven
• Profitable perfect orders • Profitability (SKU/shelf/account/segment/launch) • Perfect orders
Source: Accenture Analysis / Stages of VCT
by Hussain Mooraj
Gartner.com
Copyright © 2012 Accenture. All rights reserved. 13
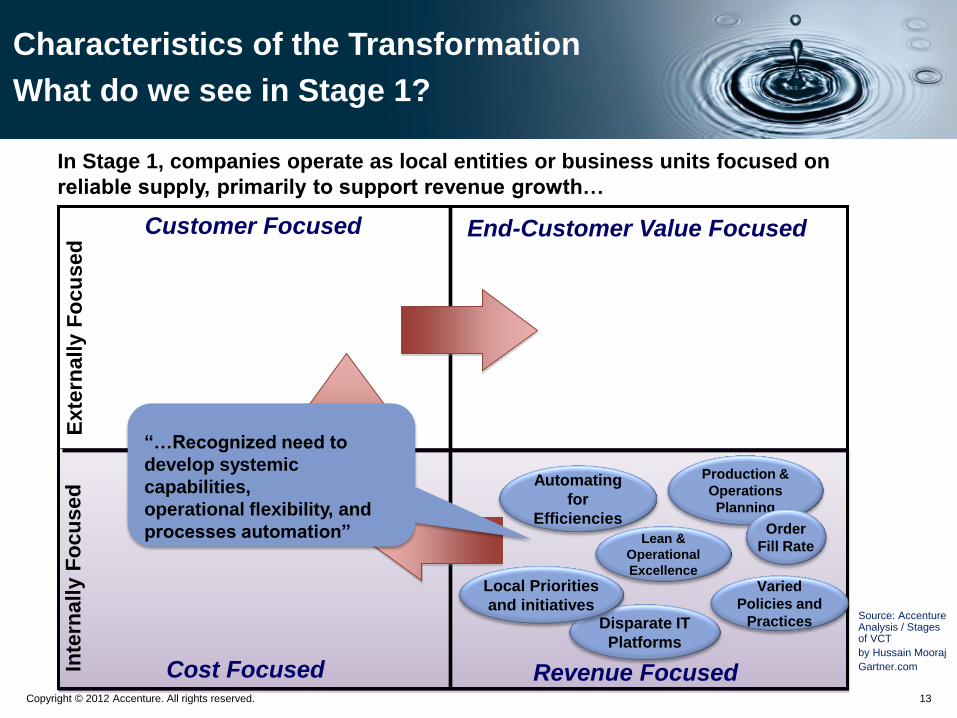
Characteristics of the Transformation
What do we see in Stage 1?
In Stage 1, companies operate as local entities or business units focused on
reliable supply, primarily to support revenue growth…
Inte
rnall
y F
ocu
sed
E
xte
rnally F
ocu
se
d
Automating
for
Efficiencies
Varied
Policies and
Practices
Cost Focused Revenue Focused
Customer Focused End-Customer Value Focused
Disparate IT
Platforms
Lean &
Operational
Excellence
Production &
Operations
Planning
Local Priorities
and initiatives
Order
Fill Rate
“…Recognized need to
develop systemic
capabilities,
operational flexibility, and
processes automation”
Source: Accenture Analysis / Stages of VCT
by Hussain Mooraj
Gartner.com
Copyright © 2012 Accenture. All rights reserved. 14
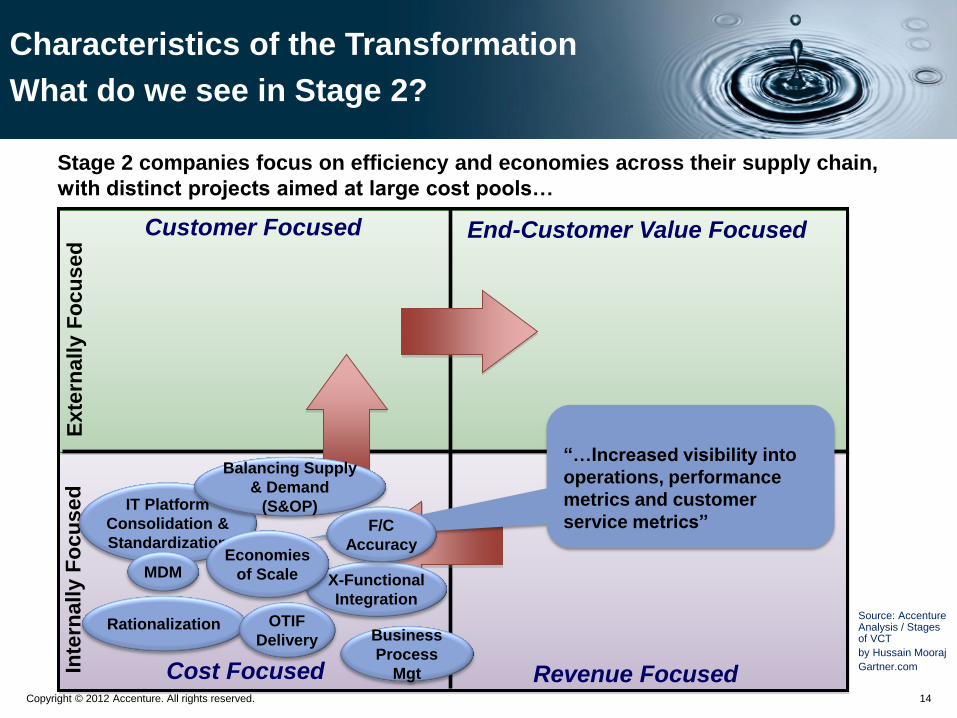
Characteristics of the Transformation
What do we see in Stage 2?
Stage 2 companies focus on efficiency and economies across their supply chain,
with distinct projects aimed at large cost pools…
Inte
rnall
y F
ocu
sed
E
xte
rnally F
ocu
sed
IT Platform
Consolidation &
Standardization
X-Functional
Integration
Cost Focused Revenue Focused
Rationalization Business
Process
Mgt
Balancing Supply
& Demand
(S&OP)
Economies
of Scale
OTIF
Delivery
MDM
“…Increased visibility into
operations, performance
metrics and customer
service metrics” F/C
Accuracy
Customer Focused End-Customer Value Focused
Source: Accenture Analysis / Stages of VCT
by Hussain Mooraj
Gartner.com
Copyright © 2012 Accenture. All rights reserved. 15
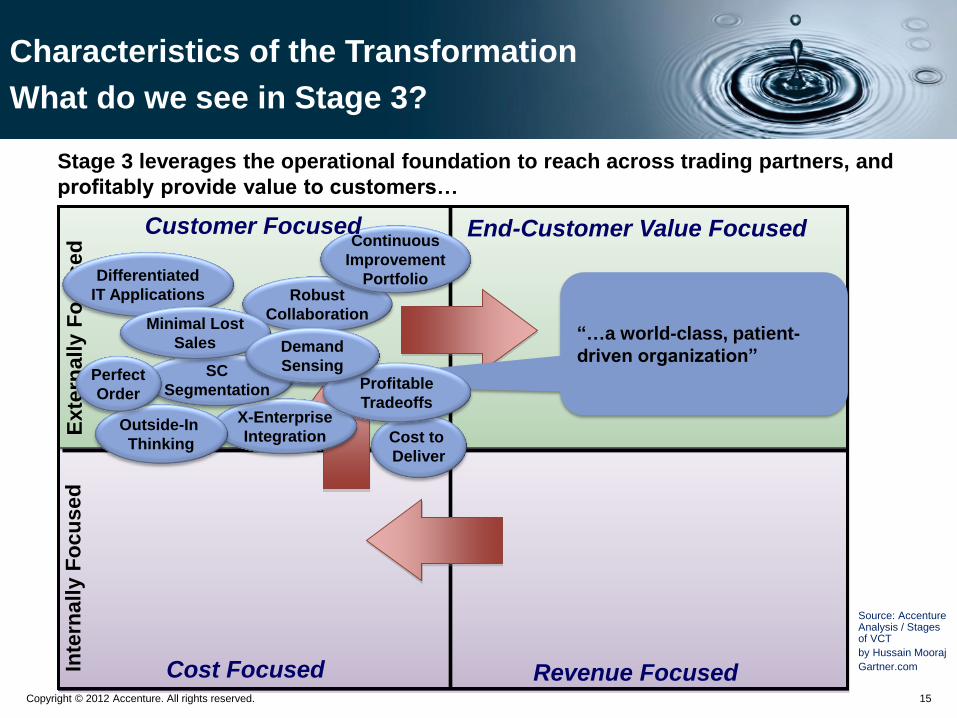
Characteristics of the Transformation
What do we see in Stage 3?
Stage 3 leverages the operational foundation to reach across trading partners, and
profitably provide value to customers…
Inte
rnall
y F
ocu
sed
E
xte
rnally F
ocu
se
d
Differentiated
IT Applications
X-Enterprise
Integration
Cost Focused Revenue Focused
Robust
Collaboration
Outside-In
Thinking Cost to
Deliver
Continuous
Improvement
Portfolio
“…a world-class, patient-
driven organization” SC
Segmentation Perfect
Order Profitable
Tradeoffs
Minimal Lost
Sales
Customer Focused End-Customer Value Focused
Demand
Sensing
Source: Accenture Analysis / Stages of VCT
by Hussain Mooraj
Gartner.com
Copyright © 2012 Accenture. All rights reserved. 16
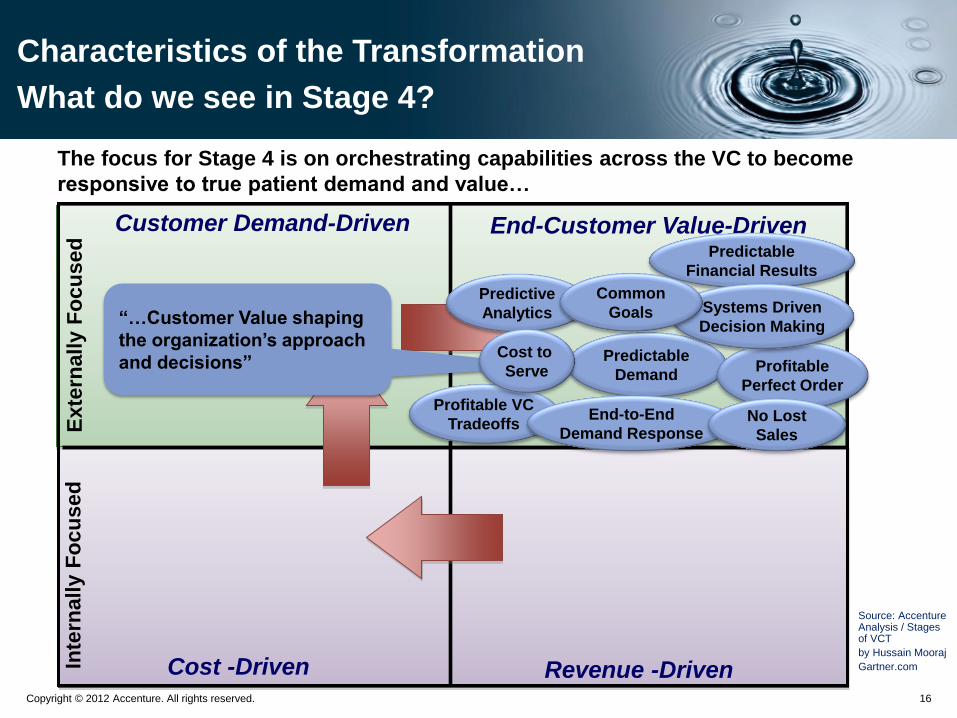
Characteristics of the Transformation
What do we see in Stage 4?
The focus for Stage 4 is on orchestrating capabilities across the VC to become
responsive to true patient demand and value…
Inte
rnall
y F
ocu
sed
E
xte
rnally F
ocu
sed
Predictive
Analytics
Customer Demand-Driven End-Customer Value-Driven
Profitable VC
Tradeoffs
Predictable
Demand
End-to-End
Demand Response
Profitable
Perfect Order
Predictable
Financial Results
“…Customer Value shaping
the organization’s approach
and decisions” Cost to
Serve
Systems Driven
Decision Making
Common
Goals
No Lost
Sales
Cost -Driven Revenue -Driven
Source: Accenture Analysis / Stages of VCT
by Hussain Mooraj
Gartner.com
Copyright © 2012 Accenture. All rights reserved. 17
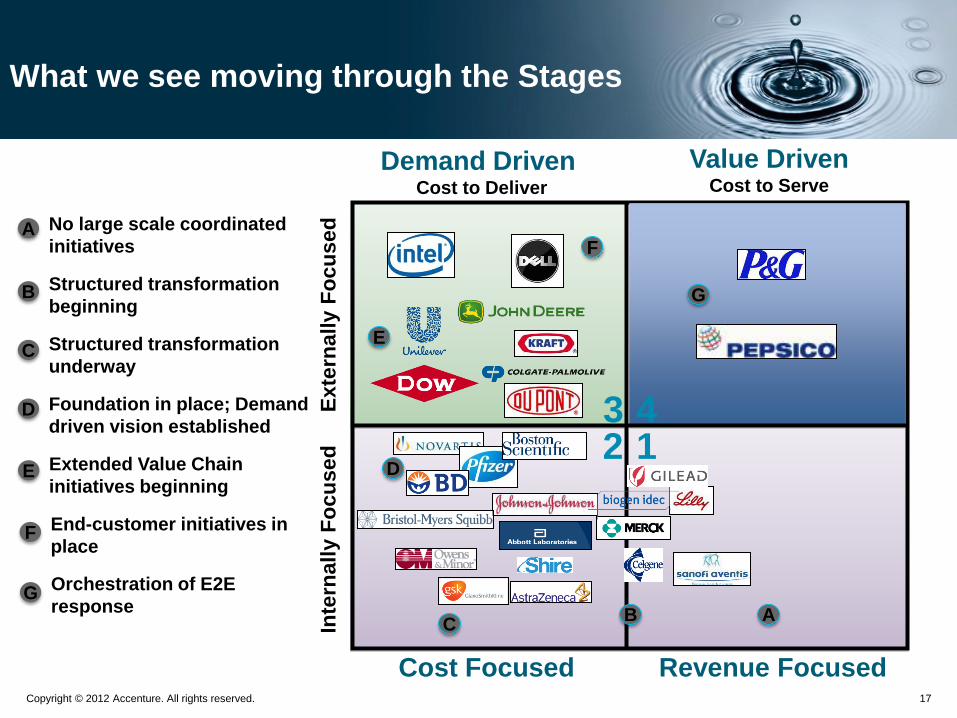
What we see moving through the Stages
Inte
rnall
y F
ocu
se
d
E
xte
rnally F
ocu
sed
Cost Focused Revenue Focused
Value Driven Cost to Serve
Demand Driven Cost to Deliver
1 2 3 4
D
C B A
A
B
C
D
Structured transformation
underway
Structured transformation
beginning
No large scale coordinated
initiatives
Foundation in place; Demand
driven vision established
E
E Extended Value Chain
initiatives beginning
F
F End-customer initiatives in
place
G
G Orchestration of E2E
response
Copyright © 2012 Accenture. All rights reserved. 18
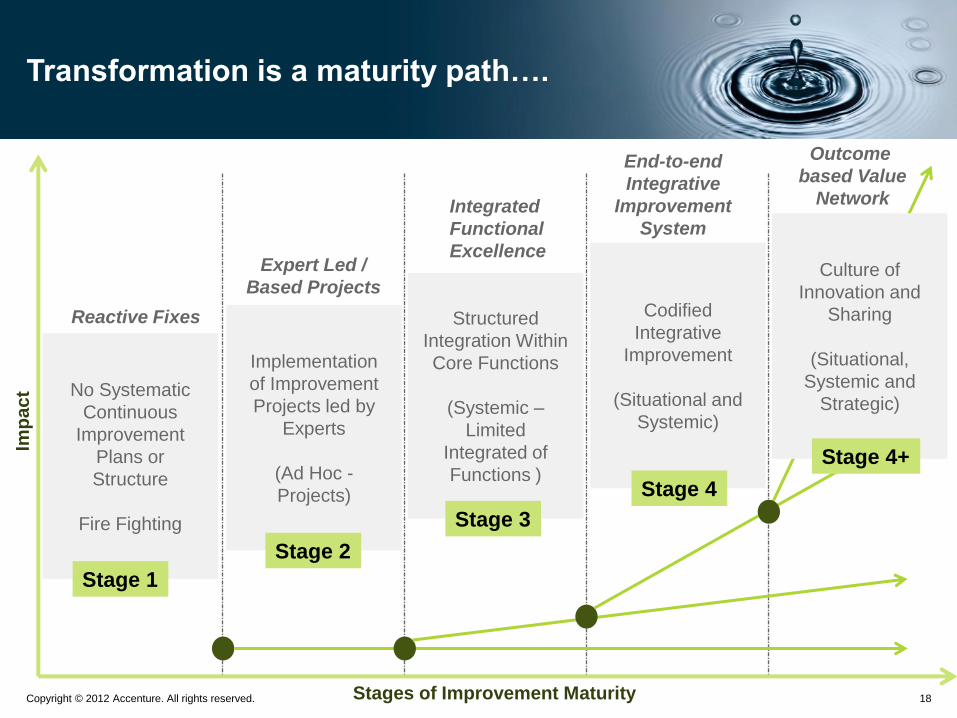
Implementation
of Improvement
Projects led by
Experts
(Ad Hoc -
Projects)
Structured
Integration Within
Core Functions
(Systemic –
Limited
Integrated of
Functions )
Codified
Integrative
Improvement
(Situational and
Systemic)
Culture of
Innovation and
Sharing
(Situational,
Systemic and
Strategic) No Systematic
Continuous
Improvement
Plans or
Structure
Fire Fighting
Transformation is a maturity path….
Stage 1
Stage 2
Stage 3
Stage 4
Integrated
Functional
Excellence
Stage 4+
Stages of Improvement Maturity
Imp
ac
t
End-to-end
Integrative
Improvement
System
Outcome
based Value
Network
Expert Led /
Based Projects
Reactive Fixes
Copyright © 2011 Accenture. All rights reserved. 19
Control Tower Framework
Copyright © 2012 Accenture. All rights reserved. 20
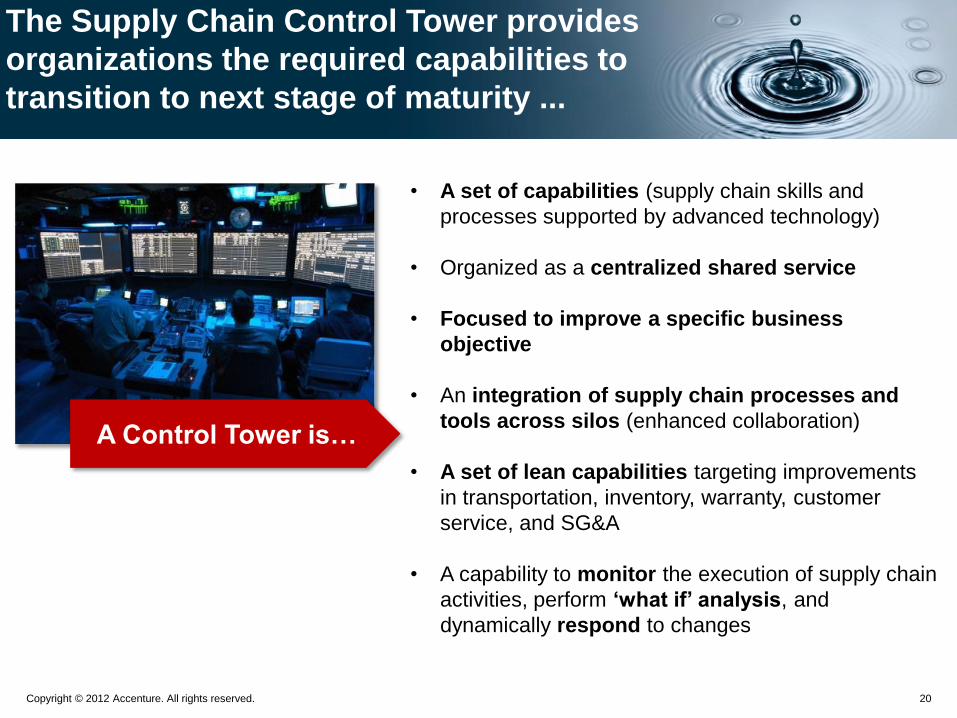
The Supply Chain Control Tower provides
organizations the required capabilities to
transition to next stage of maturity ...
• A set of capabilities (supply chain skills and
processes supported by advanced technology)
• Organized as a centralized shared service
• Focused to improve a specific business
objective
• An integration of supply chain processes and
tools across silos (enhanced collaboration)
• A set of lean capabilities targeting improvements
in transportation, inventory, warranty, customer
service, and SG&A
• A capability to monitor the execution of supply chain
activities, perform ‘what if’ analysis, and
dynamically respond to changes
A Control Tower is…
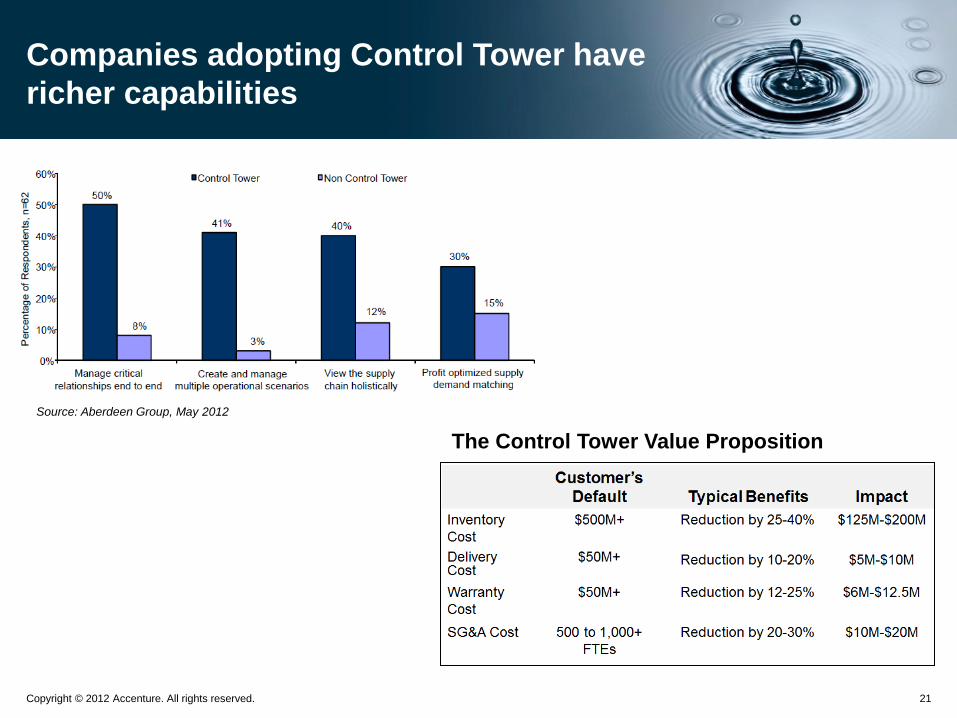
Copyright © 2012 Accenture. All rights reserved. 21
Companies adopting Control Tower have
richer capabilities
Source: Aberdeen Group, May 2012
The Control Tower Value Proposition
Copyright © 2012 Accenture. All rights reserved. 22
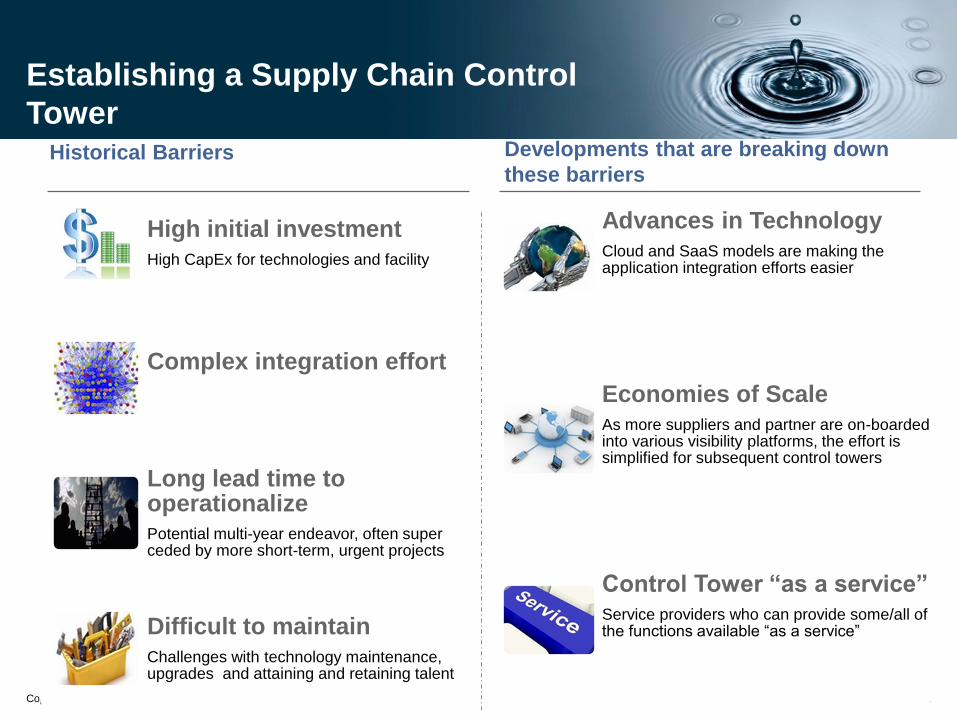
Establishing a Supply Chain Control
Tower
High initial investment High CapEx for technologies and facility
Complex integration effort
Long lead time to operationalize Potential multi-year endeavor, often super ceded by more short-term, urgent projects
Difficult to maintain Challenges with technology maintenance, upgrades and attaining and retaining talent
Advances in Technology Cloud and SaaS models are making the application integration efforts easier
Economies of Scale As more suppliers and partner are on-boarded into various visibility platforms, the effort is simplified for subsequent control towers
Control Tower “as a service” Service providers who can provide some/all of the functions available “as a service”
Historical Barriers Developments that are breaking down
these barriers
Copyright © 2012 Accenture. All rights reserved. 23
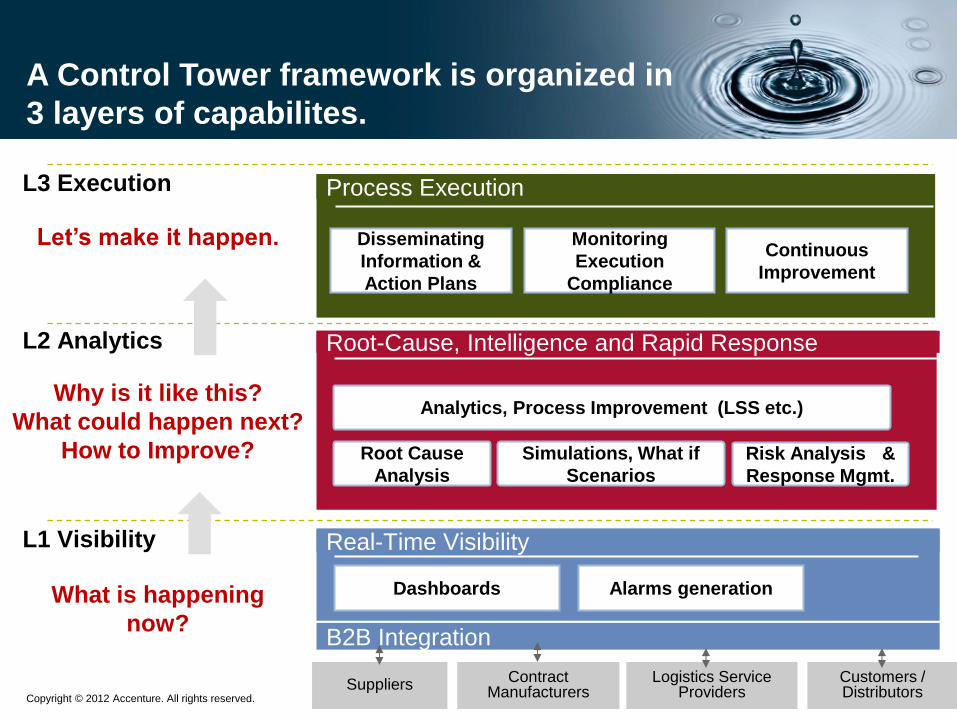
A Control Tower framework is organized in
3 layers of capabilites.
Let’s make it happen.
Why is it like this?
What could happen next?
How to Improve?
What is happening
now?
L1 Visibility
L2 Analytics
L3 Execution
Dashboards Alarms generation
B2B Integration
Suppliers Contract
Manufacturers Logistics Service
Providers Customers / Distributors
Real-Time Visibility
Root-Cause, Intelligence and Rapid Response
Process Execution
Disseminating
Information &
Action Plans
Monitoring
Execution
Compliance
Continuous
Improvement
Root Cause
Analysis
Simulations, What if
Scenarios
Risk Analysis &
Response Mgmt.
Analytics, Process Improvement (LSS etc.)
Copyright © 2012 Accenture. All rights reserved. 24
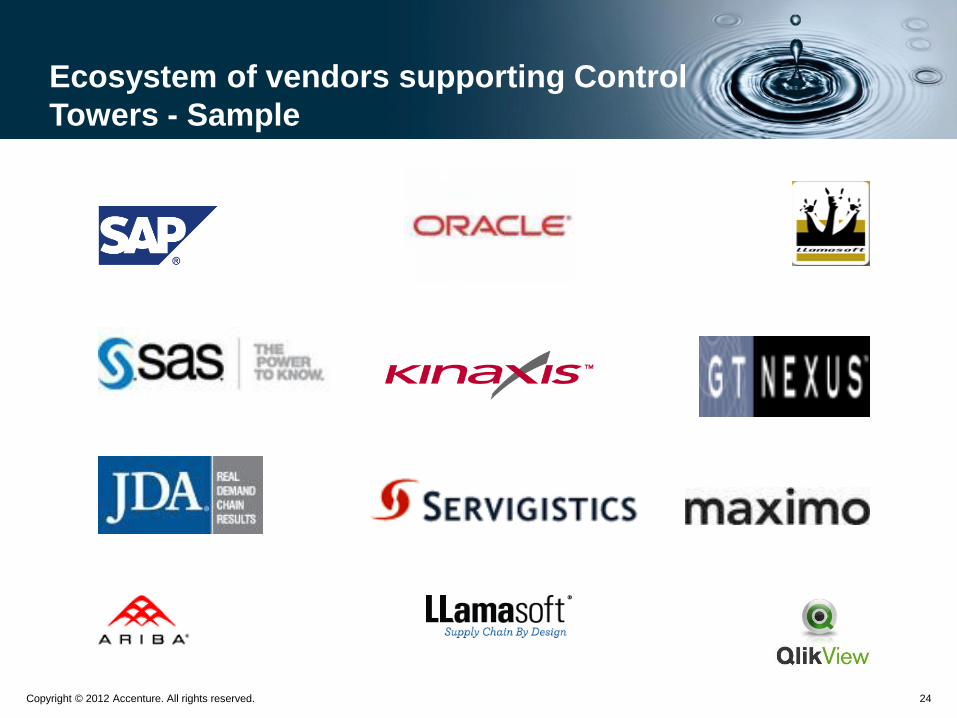
Ecosystem of vendors supporting Control
Towers - Sample
Copyright © 2012 Accenture. All rights reserved. 25
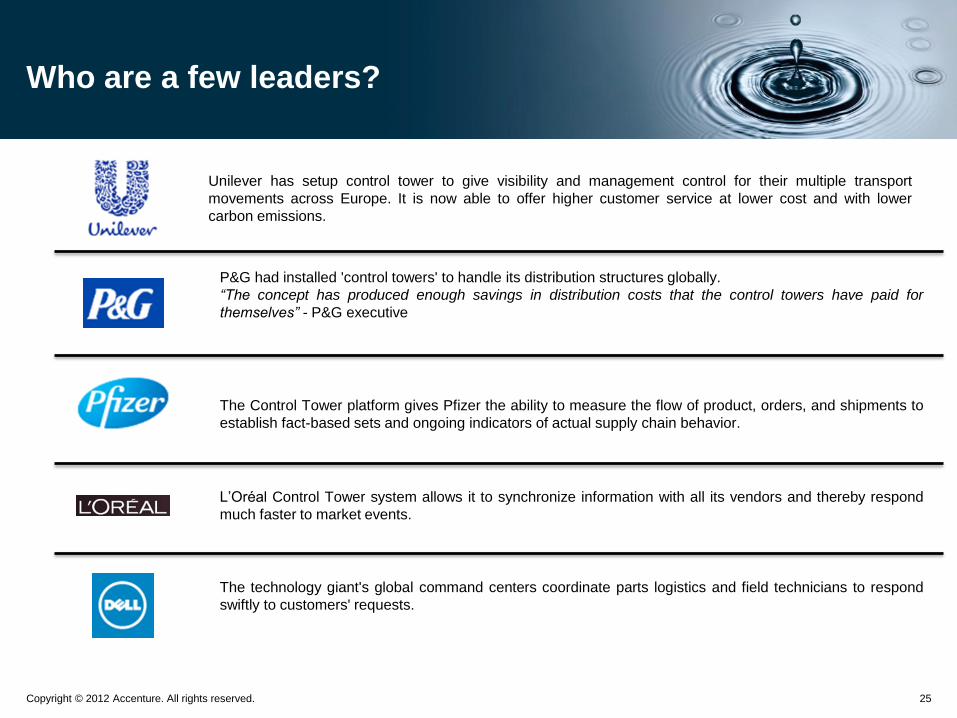
Who are a few leaders?
Unilever has setup control tower to give visibility and management control for their multiple transport
movements across Europe. It is now able to offer higher customer service at lower cost and with lower
carbon emissions.
The Control Tower platform gives Pfizer the ability to measure the flow of product, orders, and shipments to
establish fact-based sets and ongoing indicators of actual supply chain behavior.
L’Oréal Control Tower system allows it to synchronize information with all its vendors and thereby respond
much faster to market events.
The technology giant's global command centers coordinate parts logistics and field technicians to respond
swiftly to customers' requests.
P&G had installed 'control towers' to handle its distribution structures globally.
“The concept has produced enough savings in distribution costs that the control towers have paid for
themselves” - P&G executive
Copyright © 2011 Accenture. All rights reserved. 26
Questions and Discussion
Thank You !