
Control of nanoparticle size and agglomeration through ...
17
RESEARCH PAPER Control of nanoparticle size and agglomeration through electric-field-enhanced flame synthesis Hong Zhao Xiaofei Liu Stephen D. Tse Received: 8 November 2007 / Accepted: 15 November 2007 / Published online: 6 December 2007 Ó Springer Science+Business Media B.V. 2007 Abstract The isolated study of electrophoretic transport of nanoparticles (that are innately charged through thermionic emission), with no ionic wind, has been conducted under uniform electric fields. Titania nanoparticles are produced using a burner-supported low-pressure premixed flame in a stagnation-point geometry from corresponding organometallic vapor precursor. The material processing flow field is probed in-situ using laser-induced fluorescence (LIF) to map OH-radical concentrations and gas-phase tempera- tures. The experimental results of particle growth under different applied electric fields are compared with computations using monodisperse and sectional models. The results show that such electric field application can decrease aggregate particle size (e.g. from 40 to 18 nm), maintain metastable phases and particle crystallinity, and non-monotonically affect primary particle size (e.g. from 6 to 5 nm) and powder surface area. A specific surface area (SSA) for anatase titania nanopowder of 310 m 2 /g, when synthesized under an applied electric field of 125 V/cm, is reported. Results are also given for the synthesis of alumina nanoparticles. Keywords Nanoparticles Electrical field LIF Residence time Synthesis Processing Introduction Among the many techniques that have been developed for the production of nanoparticles, flame processes offer the advantage of scalability and thus manufac- ture of commercial quantities of nanopowders (Kammler et al. 2001). However, agglomeration (i.e. the adhesion of particles to each other due to Van der Waals forces) presents a limiting problem. The use of non-agglomerated nanoparticles as the starting mate- rial is essential due to the difficulties associated with aggregated nanoparticles in dispersing in a liquid medium, mixing uniformly, sintering to full density, forming coatings, and preserving nanoscale quantum properties (Chen et al. 1997). Moreover, these aggre- gated masses of nanoparticles can be difficult to cleave into their individual primary particles. Thus, despite having small primary nanoparticles, the for- mation of large aggregates ( [ 100 nm) due to particle coalescence can obviate the point of creating a high- surface-area powder (Singhal et al. 1999). Subjecting an external electric field to nanoparti- cles during their formation has been found to have a noticeable effect on primary particle size, agglomer- ate size, and crystallinity. Early on, Hardesty and Weinberg (1973) demonstrated influence over the size of primary particles in silica agglomerates in the H. Zhao X. Liu S. D. Tse (&) Department of Mechanical and Aerospace Engineering, Rutgers, The State University of New Jersey, 98 Brett Road, Piscataway, NJ 08854, USA e-mail: [email protected] 123 J Nanopart Res (2008) 10:907–923 DOI 10.1007/s11051-007-9330-7
Transcript of Control of nanoparticle size and agglomeration through ...

RESEARCH PAPER
Control of nanoparticle size and agglomerationthrough electric-field-enhanced flame synthesis
Hong Zhao Æ Xiaofei Liu Æ Stephen D. Tse
Received: 8 November 2007 / Accepted: 15 November 2007 / Published online: 6 December 2007
� Springer Science+Business Media B.V. 2007
Abstract The isolated study of electrophoretic
transport of nanoparticles (that are innately charged
through thermionic emission), with no ionic wind, has
been conducted under uniform electric fields. Titania
nanoparticles are produced using a burner-supported
low-pressure premixed flame in a stagnation-point
geometry from corresponding organometallic vapor
precursor. The material processing flow field is probed
in-situ using laser-induced fluorescence (LIF) to map
OH-radical concentrations and gas-phase tempera-
tures. The experimental results of particle growth
under different applied electric fields are compared
with computations using monodisperse and sectional
models. The results show that such electric field
application can decrease aggregate particle size (e.g.
from 40 to 18 nm), maintain metastable phases and
particle crystallinity, and non-monotonically affect
primary particle size (e.g. from 6 to 5 nm) and powder
surface area. A specific surface area (SSA) for anatase
titania nanopowder of 310 m2/g, when synthesized
under an applied electric field of 125 V/cm, is
reported. Results are also given for the synthesis of
alumina nanoparticles.
Keywords Nanoparticles � Electrical field �LIF � Residence time � Synthesis � Processing
Introduction
Among the many techniques that have been developed
for the production of nanoparticles, flame processes
offer the advantage of scalability and thus manufac-
ture of commercial quantities of nanopowders
(Kammler et al. 2001). However, agglomeration (i.e.
the adhesion of particles to each other due to Van der
Waals forces) presents a limiting problem. The use of
non-agglomerated nanoparticles as the starting mate-
rial is essential due to the difficulties associated with
aggregated nanoparticles in dispersing in a liquid
medium, mixing uniformly, sintering to full density,
forming coatings, and preserving nanoscale quantum
properties (Chen et al. 1997). Moreover, these aggre-
gated masses of nanoparticles can be difficult to
cleave into their individual primary particles. Thus,
despite having small primary nanoparticles, the for-
mation of large aggregates ([100 nm) due to particle
coalescence can obviate the point of creating a high-
surface-area powder (Singhal et al. 1999).
Subjecting an external electric field to nanoparti-
cles during their formation has been found to have a
noticeable effect on primary particle size, agglomer-
ate size, and crystallinity. Early on, Hardesty and
Weinberg (1973) demonstrated influence over the
size of primary particles in silica agglomerates in the
H. Zhao � X. Liu � S. D. Tse (&)
Department of Mechanical and Aerospace Engineering,
Rutgers, The State University of New Jersey,
98 Brett Road, Piscataway, NJ 08854, USA
e-mail: [email protected]
123
J Nanopart Res (2008) 10:907–923
DOI 10.1007/s11051-007-9330-7

presence of an electric field. They injected hexame-
thyldisiloxane (HMDS) vapor into a Meker-burner-
supported, premixed methane/air flame, with an
electric field applied coincident to the gas-stream
lines. The primary particle size of the resulting SiO2
powders was reduced by a factor of three for a 6 kV
potential. They attributed the results to decreased
particle residence time for sintering of the thermion-
ically-positively-charged SiO2 particles in the
oxidizer-rich, high-temperature, product gas. How-
ever, Katz and Hung (1990, 1992) found an opposite
trend in particle size due to an applied electric field
(e.g. 1,250 V/cm). They injected precursors such as
SiCl4, SiH4, and GeCl4 into a H2/O2 counterflow
diffusion flame, with an electric field applied parallel
to the issued flow velocities. Regardless of the
polarity of the bottom electrode, dynamic laser
scattering and TEM probing data showed a significant
increase in the diameter (3–10 times) of the particles
produced (e.g. TiO2, SiO2, and GeO2) compared with
those synthesized without an electric field. The laser
scattering data indicated that the particles exited the
burner at an earlier location (corresponding to
decreased particle residence time) when the electric
field was applied.
Much of the recent work in electrically-assisted
flame synthesis of particles has been done by
Pratsinis et al. (Vemury and Pratsinis 1995a; Vemury
et al. 1997; Morrison et al. 1997; Kammler and
Pratsinis 2000). Vemury and Pratsinis (1995a) pro-
duced ultrafine titania particles generated from a
CH4/air/Ar jet diffusion flame using a corona dis-
charge to charge the particles (for repulsion and
dispersion) and to reduce residence time through
ionic wind effects by flow mixing. Increased electric
potential reduced the particle size and the rutile
content. Vemury et al. (1997) produced TiO2, SiO2,
and SnO2 nanopowders generated by burner-stabi-
lized flat flames and non-stabilized laminar (bunsen-
like) flames. The fields (applied perpendicular to the
direction of flow) were created either by needle
electrodes to introduce ions and wind in the flame or
by plate electrodes to attract flame-generated ions.
The electric fields reduced the primary particle size of
TiO2, the agglomerate size of SnO2, and both the
agglomerate and primary sizes of SiO2. Kammler and
Pratsinis (2000) were able to reduce primary particle
diameter (by a factor of two) of fumed silica
produced at high rates (up to 87 g/h) using a co-flow
double diffusion flame with needle electrodes. Their
results have been met with much success in terms of
influencing particle size, agglomerate size, and crys-
tallinity; and their investigation of electrically-
assisted flame synthesis in various geometries have
paved the way for such research. However, an
isolated, fundamental study of the electrophoretic
effect, without ionic wind influence (Chattock 1899),
on nanoparticle synthesis is still needed. At the same
time, the contrasting results of Katz and Hung (1990,
1992) warrant further study.
The present investigation utilizes a flame synthesis
configuration based on the axi-symmetric stagnation
point flame (characterized by a simple, well-defined,
quasi-one-dimensional flow field), along with a
uniform electric field applied between the burner
and the (cooled) substrate. This strategic geometry
facilitates experimental comparisons with modeling
and computations. Since small particles residing in a
flame, with or without an electric field, tend to
become charged either due to charge transfer from
naturally ionized flame species or electron emission,
electrostatic manipulation can provide additional
time/temperature histories for the particles beyond
that capable of flow transport. For a given temper-
ature distribution, electrophoretic effects should aid
thermophoretic effects in transporting particles faster
to a cooled substrate, reducing the residence time. In
this one-dimensional geometry, no ionic wind is
generated (maintaining fixed gas-phase residence
times), thereby isolating the electrophoretic effect
on manipulating particle residence time.
Experimental
Apparatus
The employed setup utilizes operation at low pres-
sures, which increases characteristic gas-flow
velocities, for the same mass flow rate, and increases
thermophoretic velocities, minimizing residence time
and thus aggregate particle size and agglomeration, as
found in works by Glumac et al. (1998, 1999) and
Singhal et al. (2001). The axi-symmetric, stagnation-
point premixed flame (Fig. 1) is formed by flowing
premixed reactants, seeded with chemical precursor
vapor, through a flat-flame burner impinging onto a
cold substrate. Ceramic nanopowders such as TiO2
908 J Nanopart Res (2008) 10:907–923
123

(and Al2O3) are investigated. Liquid precursors (i.e.
titanum tetra-iso-propoxide (TTIP) and aluminum tri
sec-butoxide (ATSB), respectively) are vaporized and
entrained into a carrier gas via a heated and
temperature-controlled bubbling unit and then com-
bined with combustible premixed gases (e.g.
hydrogen/oxygen) and delivered to the burner. The
flow system is metered with mass flow controllers,
and the flow lines are heated and temperature
controlled to prevent precursor condensation (see
Fig. 2). A dual-polarity high-voltage source
(0 ± 10 kV, 3–10 mA) establishes the uniform elec-
tric field. The chemical precursors pyrolyze and
oxidize in the flame and condense into nanoparticles
as the gases cool upon reaching the substrate, where
they deposit thermophoretically.
The synthesis reactor (Fig. 2) consists of a 47-cm
diameter cold-wall vacuum chamber, which is main-
tained at the desired pressure by a vacuum pump,
throttle valve, and closed-loop pressure controller.
Inside the chamber, the burner and substrate are fixed
rigidly to a mount. Both the burner and substrate are
water-cooled, and their temperatures are monitored
with type K thermocouples. The chamber is config-
ured with four orthogonal quartz view ports for
optical access, and the entire chamber is mounted to a
3-axis positioner to enable spatial probing of the
flame structure by laser-based diagnostics.
The flames examined in this study use premixed
hydrogen and oxygen with an equivalence ratio of
*0.4 and a system of pressure of *20 torr. We will
use the term ‘‘negative electric field’’ to refer to the
cases where a negative voltage is applied to the
substrate, and ‘‘positive electric field’’ where a
positive voltage is applied to the substrate. The
burner is grounded. For titania synthesis, a precursor
loading rate of 7.185 9 10-4 mol/min of TTIP is
used.
In-situ laser-based diagnostics
Non-intrusive laser-based diagnostics (Fig. 3) are
utilized in the experiments to obtain the axial
Flame
Cooling Water
Substrate
Plate Electrode
Premixed H2 + O2&
Precursor vapor + Carrier gas
Temperature
Flat Flame Burner
DC High Voltage(0 to +/- 1kV)
Fig. 1 Burner setup for electrically-enhanced premixed flame
MFC
MFC
MFC
MFC
MFC
Temperature Controllers (forprecursor lines, bubblers, mixture lines)
Precursor Bubbler
Nd: Y
AG Las
er
Dye L
aser
ICCD for OHFluorescence
Spectr
omete
r + IC
CD
for R
aman
PressureTransducer
H2 O2
LNTrap Vac
uum
Pump
Heater Coil
PressureRegulator
UV Lens
Refrigerated Bath/Circulator(for chill plate,chamber wall, and burner)
Optics for Raman
Sheet Forming Opticsfor Fluorescence
Exhaust
3-AxesTranslationStage
RemovableMirror
QuartzWindow
ProbeAccess
Precursor Bubbler
Precursor BubblerTo Gas/PrecursorDelivery System
To Chamber
H.V. Source forElectric Field
Variac for Ignition
Fig. 2 Low-pressure flame
synthesis facility
J Nanopart Res (2008) 10:907–923 909
123

temperature and OH concentration profiles. An injec-
tion-seeded, frequency-doubled, 532 nm Nd:YAG
laser (Spectra-Physics Quanta Ray LAB-170) pumps
a Sirah dye laser (PrecisionScan D-24) circulating
Rhodamine 6G dye. The output of the dye laser is
frequency doubled and then attenuated from 0.2 to
0.014 W by the use of beam splitters, which pass part
of the laser beam to a photodiode for power monitor-
ing. A 500 mm focal length fused-silica lens focuses
the main beam to a small probe volume on the axial
centerline between the burner and the substrate. Laser-
induced fluorescence (LIF) of the OH radical is
collected at right angles to the excitation source with
f/6 optics into an f/6.5-imaging spectrometer (Acton
SpectrPro-2558), with an ICCD camera (Princeton
Instruments PIMAX: 1300HQ) as detector. A 50 lm
diameter pinhole allows for a 150 lm spatial resolu-
tion of the flow field. A 3,600 g/mm UV grating and slit
width of 100 lm, gives a 11.5 nm spectral coverage
with a resolution of 0.01 nm. The ICCD camera, with a
100 ns gate width, is externally-triggered by the 10 Hz
Q-switch pulse from the Nd:YAG laser.
The Q1(7) transition is chosen to measure the
relative OH concentration profile, since the relative
population does not change much over the range of
temperatures in the setup (Ben-Yakar et al. 1998).
This eliminates the need for temperature correction to
the fluorescence signal profile. The uncertainty of OH
concentration measurements is within ±5%. For the
two-line temperature measurements, P2(7) and P2(9)
transitions of the (1–0) band of the A2P ? X2Q are
excited, as used by Glumac et al. (1998). These
transitions have similar values of B(g1 + g2)/g2,
where B is the Einstein absorption coefficient and
g1 and g2 are the upper and lower state degeneracies,
respectively, so that the saturation effect on the
derived temperature is reduced and a linear, steady-
state regime can be assumed (Glumac et al. 1998).
The uncertainty in the LIF temperature measurements
is ±25 K.
Ex-situ characterization
Dynamic light scattering (DLS) measures the aggre-
gate size of the synthesized nanopowder. Multipoint
Brunauer–Emmet–Teller (BET) nitrogen adsorption
determines the specific surface area (SSA) and the
equivalent BET primary particle size. X-ray diffraction
(XRD) obtains the phase composition, crystallinity,
and crystallite size of the nanoparticles. Transmission
Electron Microscopy (TEM) characterizes the mor-
phologies of the synthesized nanoparticles and
ascertains their grain sizes. High resolution TEM
(HRTEM) reveals the atomic-level structures of the
nanoparticles. Selected area diffraction (SAD) evalu-
ates the crystallinity and phase composition of
individual (and groups of) nanoparticles. Thermo-
gravimeteric Analysis (TGA) determines the extent of
the precursor decomposition (or conversion).
Computational modelling
Gas-phase flame structure
The axial gas-phase flame structure of the premixed
flame in the experiment is simulated using the Sandia
SPIN code (Coltrin et al. 1991) (generally used for
CVD processes), by turning off disk rotation and using
the appropriate boundary conditions at the substrate. A
flow/chemistry model treats the flow and transport
between the burner and the substrate, as well as the
chemical reactions occurring in the gas-phase and at
the substrate. Gas-phase and surface chemical kinetics
are handled by CHEMKIN (Kee et al. 1996) and
SURFACE CHEMKIN (Coltrin et al. 1996) subrou-
tines, respectively, while variable transport properties
are determined by TRANSPORT (Kee et al. 1986).
Tunable Dye LaserM
M
BS
Photo-diode
ImagingSpectrometer
L
BeamDump
x
yz
3-D translationSynthesis Chamberwith optical access
Pumpingbeam
Excitingbeam
2x Nd:YAG Laser
PinholeFilter
ComputerDigital
Oscilloscope ICCD
Camera
Delay/GateGenerator
Tunable Dye LaserM
M
BS
Photo-diode
ImagingSpectrometer
L
BeamDump
x
yz
x
yz
3-D translationSynthesis Chamberwith optical access
Pumpingbeam
Excitingbeam
2x Nd:YAG Laser
PinholeFilter
ComputerDigital
Oscilloscope ICCD
Camera
Delay/GateGenerator
Fig. 3 Experiment setup for gas-phase LIF
910 J Nanopart Res (2008) 10:907–923
123

Conservation equations are solved for continuity,
radial and circumferential momentum, thermal energy,
and chemical species, along with a pressure-explicit
equation of state. The detailed chemical kinetic
mechanism of Mueller et al. (1999) for hydrogen
chemistry involving nine species and 21 elementary
reactions is applied for the gas phase.
The boundary conditions are: (i) experimentally
specified inlet mass flux and temperature at the
burner; (ii) no-slip condition and constant surface
temperature at the substrate; (iii) recombination of H,
O, OH, and HO2 with unit sticking probability at the
substrate surface; and (iv) the gas-phase mass flux of
each species to the substrate jk balanced by the
creation or depletion of that species by surface
reactions, i.e.
jk ¼ _skMk ðk ¼ 1; . . .;KgÞ: ð1Þ
The gas-phase mass flux of species k at the
substrate is a combination of diffusive and convective
processes, i.e.
jk ¼ qYkuþ qYkVk ðk ¼ 1; . . .;KgÞ; ð2Þ
where Vk is the diffusion velocity of the kth species.
The surface reactions of Aghalayam et al. (1998) are
employed at the substrate, where surface recombina-
tion reactions are taken to have zero activation energy.
Particle growth
Two models are applied to simulate the nanoparticle
growth dynamics: (i) a monodisperse model, assum-
ing a uniform size distribution during the coagulation
process; and (ii) a simplified sectional model, which
allows for a particle size distribution.
Monodisperse model
The monodisperse model neglects the polydispersity
of the aggregates and primary particles. We employ a
model developed by Kruis et al. (1993). The simpli-
fied General Dynamic Equations (GDEs) are (Koch
and Friedlander 1990):
dN
dt¼ � 1
2bN2; ð3aÞ
dva
dt¼ � 1
N
dN
dtva; ð3bÞ
daa
dt¼ � 1
N
dN
dtaa �
1
sfðaa � asÞ with as
¼ p6va
p
� �2=3
; ð3cÞ
where N is the particle number concentration, va the
volume of an aggregate, and as the surface area of a
completely fused spherical particle.
The equations describe a process where for each
collision, there is a reduction of one in the number of
particles in a unit volume. Thus, the rate of collisions
is numerically equivalent to the rate of change in the
number concentration. These equations can be
derived by considering a single particle and how
other particles diffuse to its collision surface (Hinds
1982). A coalescence term is added to the surface
area equation due to the surface area decrease during
the process. This term depends on the characteristic
coalescence time sf and the driving force for coales-
cence, i.e. the difference between the surface area of
aggregates aa and that of the completely fused
spherical particle as.
We assume that (i) the precursor decays instanta-
neously at a fixed temperature (800 K) that is chosen
based upon the location of the emission features in
our metalorganic H2/O2 flames (Glumac et al. 1998);
(ii) the critical size of homogeneously nucleated
nanoparticles is 1 nm in diameter; (iii) the particle
velocity is the same as that of the gas-phase at the
location of instantaneous nucleation; and (iv) there is
a negligible difference in time/temperature histories
for particles that are formed at different radii near the
centerline.
By introducing the collision factor s, the particle
shape and the accessible surface area are taken into
consideration in the collision frequency function
(Xiong et al. 1992). The characteristic coalescence
time for fusion of two primary particles (Kobata et al.
1991) and group-wise coalescence for aggregates
(Lehtinen et al. 1996; Schwade and Roth 2004;
Giesen et al. 2004) are applied in the calculation of
the aggregate characteristic coalescence time. The
initial particle concentration at precursor decomposi-
J Nanopart Res (2008) 10:907–923 911
123

tion is estimated from the precursor-loading rate and
the total volume flow rates of the gas mixture. The
density of the TiO2 nanoparticles is taken to be the
same as the bulk density of 3.84 9 103 kg/m3.
Sectional model
In this work, the one dimensional, zero-order sectional
model based on Prakash et al.’s (2003) work is utilized
and extended. The validation of this sectional model
was carried out by the authors for coagulation using an
initially monodisperse aerosol. The size sections are
defined for volume; and within each volume section, all
particles are of the same size though not necessarily
fully coalesced. Instead, particles are assumed to have
an average surface area within each volume section
(Vemury et al. 1994; Muhlenweg et al. 2002). Another
surface area equation, which takes coalescence into
consideration, is added to the volume sectional model.
Assuming that the density of newly formed particles
have the same density as the initial primary particles,
coalescence changes neither the particle number nor
particle volume; it only changes the surface area. Thus
the coalescence term appears only in the surface area
equation. As stated previously, group-wise coales-
cence of aggregates as proposed by Lehtinen et al.
(1996), and as applied by Schwade and Roth (2004)
and Giesen et al. (2004), is assumed. For example, an
n-primary-particle aggregate is divided into n/m
groups, in each of which the coalescence law holds;
and coalescence in larger aggregates occurs in steps.
The characteristic coalescence time for aggregates is
defined as
sfn ¼ sfmðv�ÞXk�1
i¼0
m4i=3
where k = ln n/ln m (Schwade and Roth 2004; Gie-
sen et al. 2004). The value of m is taken as 3 in this
work (see Schwade and Roth 2004).
Particle volumes with sizes ranging from 10-27 to
10-20 m3 are considered (which correspond to diam-
eters of range from *1 nm to *0.3 lm) by defining
102 size sections at a geometric spacing factor q of 1.2
on a logarithmic volume scale. Equations for popula-
tion balance (Prakash et al. 2003) and average surface
area (Muhlenweg et al. 2002) are solved considering
precursor decomposition (Tsantilis et al. 2002),
homogeneous particle nucleation (Girshick and Chiu
1990), coagulation (Friedlander 2000), coalescence
(Kobata et al. 1991; Lehtinen et al. 1996; Schwade and
Roth 2004; Giesen et al. 2004), and surface growth
(Prakash et al. 2003). Monomers of TiO2 are given a
diameter of 0.4 nm, corresponding to the volume
equivalent diameter of a titania molecule.
Particle transport and external forces
In many particle-laden gas flows, the aerosol con-
centrations are dilute. Hence, the aerosol dynamics
do not affect mass and momentum transfer in the
carrier gas, and the overall mass and momentum
balance equations can be solved independently of the
GDE. Employing this assumption, our solution pro-
cedure involves two steps. In the first step, the SPIN
code solves the mass and momentum balance, as well
as the energy equations to obtain the velocity profile,
temperature profile, and thermodynamic properties.
In the second step, GDE is solved making use of the
solutions from the first step, and a Lagrangian
approach is used to numerically compute the nano-
particle trajectory.
We solve the equation of motion for a spherical
particle in a moving fluid subjected to Stokes viscous
drag (including slip coefficient), thermophoretic
force, and electrophoretic force. The density of the
solid particle is assumed much greater than that of the
gas mixture, so that the pressure gradient force on the
particle, the fluid resistance to an accelerating sphere,
and the drag force associated with unsteady motion
can be neglected.
The electrophoretic force (i.e. FES = qE, where q is
the charge on a particle, and E the electric field) affects
particles when they acquire positive charges due to
thermo-ionization. By taking the ionization energy for
TiO2 to be 3 eV (Campbell et al. 1999), the electrons
emitted per particle per second Ne can be calculated
from the Richardson–Dushmann equation:
J ¼ AT2 exp�W
kBT
� �
; ð4Þ
Ne ¼ 4pr2J=e; ð5Þ
where J is the emitted current density, W the work
function (or ionization energy), h the Planck’s
912 J Nanopart Res (2008) 10:907–923
123

constant, m and e the mass and charge of an electron,
respectively, and A the Richardson’s constant, i.e.
A ¼ 4pmk2Be
h3¼ 1:20173� 106(A/m2=K):
As seen from Fig. 4, the number of electrons
emitted increases dramatically with increasing tem-
perature at a turning point around 1,400–1,500 K. As
a result, we assume that nanoparticles become
positively charged once they reach a critical temper-
ature of 1,450 K.
We also assume that aggregate particles carry one
unit charge since unit charge is dominant from
charging theory (Fuchs 1963). Singly charged parti-
cles have also been confirmed in similar synthesis
environments (Janzen and Roth 2001). For the H2–O2
flame, two primary charge carriers, H3O+ and e-, are
found naturally from chemi-ionization (Fialkov
1997). Due to the high mobility of the electrons,
the outer region of the reaction zone can be
negatively charged by electrons, while the inner
flame region is likely to be positively charged by
positive ions. Therefore, the particles are initially
neutral if not positively charged. When the temper-
ature reaches 1,400–1,500 K, particles start to eject
an electron due to thermal-impact ionization, result-
ing in one unit of positive charge. As they travel
through the flame structure, inter-particle collisions
allow the particles to grow larger, while the charge
redistributes on the particle surface. Some electrons
return to the growing particle surface, and the
particles remain singly charged. Note that we do
not consider electrostatic or Van der Waals forces
between particles.
Flame structure characterization (isolation of the
electrophoretic effect)
In flame synthesis, gas-phase temperature history
plays a critical role in particle growth and evolution.
Therefore, it is important to know precisely the flame
structure and flow field. Particle image velocimetry
(PIV) and laser Doppler velocimetry (LDV) are two
methods to measure the velocity of flow fields. In
both cases, tracer particles (larger than the nanopar-
ticles produced in this study) are seeded into the flow;
and the tracer velocity is extracted through Mie
scattering either from measuring the movements of
those particles, or from the Doppler signals collected.
Assuming that the particles follow the flow, the flow
velocities are then deduced. However, given the
strong thermophoretic and electrophoretic forces in
this synthesis system, the trajectories of the tracer
particles are not expected to follow the streamlines.
As such, the velocity of seed particles may not
correctly represent the flow field velocities. In fact, it
is the very manipulation of nanoparticle trajectories
with respect to the flow field that is being sought.
In this work, simulation of the gas-phase flame
structure is performed using the Sandia SPIN code,
which is written for a quasi-1-D stagnation flow. The
flame structure is then probed in-situ using LIF to
map the OH radical concentrations and gas-phase
temperature distributions along the axial centerline.
By comparing the simulation and measurements, the
nature of the material processing flow field can be
revealed.
The axial gas-phase temperature and OH concen-
tration profiles in the synthesis flame (mass
flux = 2.498 mg/s/cm2, H2/O2 = 0.833) with (e.g. -
500 V applied to substrate and burner grounded) and
without an electric field are shown in Figs. 5 and 6,
respectively. As shown in Fig. 5, the measurements
compare very well with the simulation for the
temperature profile. Furthermore, the LIF measure-
ments reveal that there are negligible differences
between cases with and without uniform electric field
application. Therefore, there is virtually no influence
on the gas-phase temperature by the electric fields
imposed.
The electric field effect is also examined with
respect to chemical species. With the OH radical
being a key combustion intermediate, the OH
concentration profiles from the LIF measurements
0
0.2
0.4
0.6
0.8
1
1.2
1.4
1.6
1000 1100 1200 1300 1400 1500 1600 1700 1800
Temperature (K)
snortcele fo rebmu
N
Fig. 4 Electrons emitted per aggregate particle per integral
step as a function of temperature
J Nanopart Res (2008) 10:907–923 913
123

in the synthesis flames with and without electric field
are compared to the ones predicted by the simulation,
as shown in Fig. 6. Similarly, there is good agree-
ment between computations and measurements; and
again, the application of electric fields has negligible
effect on the OH concentration. Although not shown,
there is no noticeable change in flame chemilumi-
nescence when negative/positive voltages are applied
to the substrate. These results imply that although
chemical effects induced by transposing and re-
distributing ionic species by the action of the
electrical fields may exist, they seem to play a very
minor role in terms of our synthesis flow field. As
such, we can be sure that, for this geometry, the
electrophoretic effect is isolated, and its effect on
manipulating particle residence time under fixed gas-
phase conditions is what is being studied. In addition,
the agreement between the quasi one-dimensional
model and the experimental measurements for these
stagnation point flames suggests that the model
predicts accurately the material processing flow field.
Thus, the temperature and velocity profiles from the
simulations can be used for particle transport and
growth modeling.
Experimental results and discussion
Effect on aggregate particle size and extent of
agglomeration
The aggregate particle sizes of the as-synthesized
TiO2 powders produced under different electric fields
are obtained using DLS, as shown in Fig. 7 using
0
200
400
600
800
1000
1200
1400
1600
1800
2000
0 0.5 1 1.5 2 2.5 3 3.5
Substrate-burner-gap (cm)
)K( erutarep
m eT
4
SPIN simulation
w/o electric fieldwith electric field
Fig. 5 Axial gas-phase temperature profile without precursor.
Comparison between simulation, with (i.e. -500 V is applied
to the substrate and the burner is grounded) and without an
electric field at 20 torr. The symbols are the results of the LIF
measurements, and the line is the model prediction
0.000
0.005
0.010
0.015
0.020
0.025
0.030
0 0.5 1 1.5 2 2.5 3 3.5
Substrate-burner-gap (cm)
4
SPIN simulation
w/o electric field
with electric field
SPIN simulation
w/o electric field
with electric field
rfelo
MH
Oac
oitn
Fig. 6 Axial gas-phase OH radical mole fraction without
precursor. Comparison between simulation, with (i.e. -500 V
is applied to the substrate and the burner is grounded) and
without an electric field at 20 torr. The symbols are the results
of LIF measurements, and the line is the model prediction
0
20
40
60
80
100
-600 -400 -200 0 200 400 600
Electric field (V/4cm)
id naeM
maet
re)
mn(
(a)
0
20
40
60
80
100
-600 -400 -200 0 200 400 600
Electric field (V/4cm)
id naeM
maet
re)
mn(
0
20
40
60
80
100
120
140
-600 -400 -200 0 200 400 600
Electric field (V/4cm)
eM
)mn( rete
maid na
(b)
0
20
40
60
80
100
120
140
-600 -400 -200 0 200 400 600
Electric field (V/4cm)
eM
)mn( rete
maid na
Fig. 7 Mean aggregate particle size (as measured by DLS of
titania powder collected from substrate post-experiment)
synthesized under different electric fields (with voltages
applied to substrate with burner grounded): (a) using the
number-weighted method, (b) using the volume-weighted
method
914 J Nanopart Res (2008) 10:907–923
123

number-weighted and volume-weighted methods,
respectively.
For negative/positive voltages applied to the
substrate, the hydrodynamic diameters of the aggre-
gates (for both weighting methods) decrease/increase
significantly due to the shorter/longer residence
times, confirming that the particles are positively
charged by the flame. However, under higher applied
voltages (e.g. -500 V for TiO2 in Fig. 7), the
aggregate particle size increases. The simulations
verify that this result is not due to small particles
bouncing off the substrate due to their high acceler-
ation. Instead, the reason is likely due to charging of
the small particles by the highly negatively-biased
substrate. As the local particles acquire negative
charges, they are repelled, or levitated (Baron and
Willeke 2001), from the substrate, with only larger
particles remaining. As such, not only is the electric
field itself a parameter but also the magnitude of the
voltage applied. For this reason, the x-axis of Fig. 7 is
labeled as it is, with the actual voltage applied
divided by the gap distance.
Establishing electric fields by applying negative/
positive voltages to the burner with the substrate
grounded generated different results than those by
applying voltage to the substrate with the burner
grounded, even for the same electric field. Larger
agglomerated particles are always attained. Again,
the magnitude of the voltage itself plays a role. It is
likely that the decomposition of the precursor near
the burner is affected, resulting in larger particles.
Nonetheless, more study is needed. In all experiments
reported otherwise, voltages are applied to the
substrate with the burner grounded, as shown in
Fig. 7.
The morphologies and primary particle sizes of the
TiO2 nanoparticles produced without an electric field
and with -300 V applied to the substrate are
examined by TEM. Without an electric field, the
particles are agglomerated (Fig. 8a), whereas the
agglomeration with negative electric fields has been
decreased significantly as shown in Fig. 8b. The
primary particle sizes in Fig. 8a and b vary from 4 to
7 nm, with average primary particle sizes of about
5.9 nm for the case without an electric field and about
5.2 nm for the one with -300 V applied to the
substrate. These results further confirm that the
nanoparticles are positively charged and are trans-
ported through the flow field with shorter residence
times. HRTEM, Fig. 8c, shows that the nanoparticles
possess high crystallinity, as indicated by the circled
particle fringes and confirmed by the SAD pattern
(inset in Fig. 8c).
Effect on SSA and primary particle size
DLS measurements substantiate that the use of the
electric fields can be advantageous for process control
in terms of minimizing aggregate particle size (i.e.
degree of agglomeration). The SSA of the powders
also increases when the electric field application is
concurrent with the flow direction (negative electric
field), as verified by BET.
As seen from Fig. 9, higher negative electric fields
result in nanopowders of higher surface areas, and
thus smaller primary particle sizes. Surprisingly, the
SSA of TiO2 also increases when the electric field
application is countercurrent to the flow direction
(positive electric field). The reason for this is that
primary particle size can also decrease due to a longer
characteristic coalescence time (which is highly
dependent on the temperature), during which larger
aggregate particles are produced through coagulation.
This effect is confirmed in the computations and
discussed in more detail in Sect. ‘‘Computational
results and discussion (TiO2)’’. The 0 V case, or no
electric field, appears to be a local minimum.
However, as will be discussed in Sect. ‘‘Computa-
tional results and discussion (TiO2)’’, it is only by
coincidence that the minimum occurs at 0 V here. It
will be seen that the voltage (or electric field)
corresponding to minimum SSA is highly dependent
on the specific conditions (e.g. particle residence
time) involved under different operating conditions.
The SSA of the TiO2 nanopowder is as large as
310 m2/g for the -500 V case. Note that this is one
of the largest SSA values for TiO2 nanopowder to be
reported in the literature. The average primary
particle sizes calculated from TEM images compare
well to the average particle sizes calculated from the
SSA, further demonstrating that the particles have
limited degrees of agglomeration. Typically, in flame
synthesis, the average primary particle size from
TEM is smaller than that obtained by BET because
necking between the particles increases the corre-
sponding particle diameter.
J Nanopart Res (2008) 10:907–923 915
123

Effect on crystallinity and phase composition
Despite the reduced particle residence times, electric
field application does not seem to affect the
crystallinity for the TiO2 system. XRD analysis of
all TiO2 samples collected from the substrate
evinces that the nanoparticles are anatase dominant,
as illustrated in Fig. 10. Although rutile is thermo-
dynamically more stable than anatase, anatase is
readily formed at low temperatures due to its
relatively fast crystallization kinetics (Rulison et al.
1996). In our flame, peak temperature is around
1,600 K, and electrical fields exert no effect on the
temperature profile. Formation of rutile from anatase
requires *1 s at 1,200�C to finish the atomic
Fig. 8 (a) TEM image of
TiO2 particles synthesized
without electric field
application. (b) TEM image
of loosely agglomerated
TiO2 particles synthesized
with -300 V applied to the
substrate. (c) HRTEM
image of TiO2 with -300 V
applied to the substrate. The
circles in the figure
highlight individual primary
particle fringes; the primary
particle size is about
5.2 nm. The insert is an
SAD pattern of TiO2
particles
-600 -400 -200 0 200 400200
250
300
350
SSA
m( A
SS
2)g/
Electric field (V/4cm)
0
2
4
6
8
10
12
14
16
18
20
dBET
d E
BT
mn( )
Fig. 9 Specific surface area of titania powder synthesized as a
function of applied electric field. dBET represents the equivalent
particle diameter based on BET surface area measurement
916 J Nanopart Res (2008) 10:907–923
123
rearrangement (where oxygens are in a distorted
face-centered cubic arrangement for anatase, while
for rutile, they are in a distorted hexagonal
arrangement (Shannon and Pask 1964)). However,
in our setup, particle residence time is on the order
of 12–30 ms. Given the low temperature profile,
short residence time, and fast crystallization kinetics
for anatase, we invariably produce crystalline ana-
tase in our flame. From the relative intensity of its
primary peak in the XRD pattern, rutile is deter-
mined to be less than 5% weight fraction in the
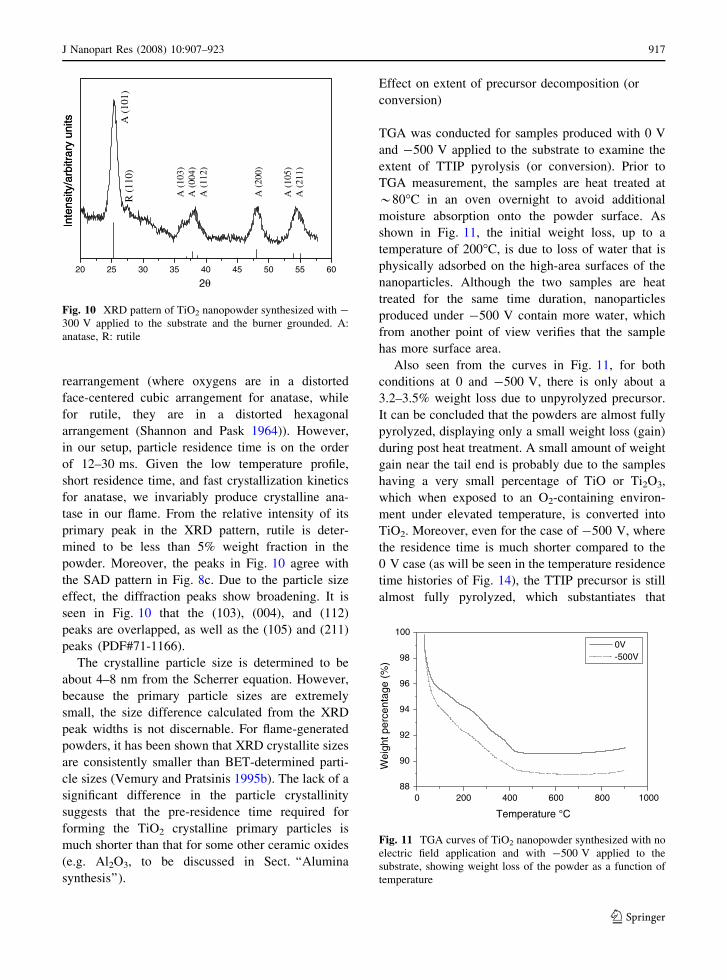
powder. Moreover, the peaks in Fig. 10 agree with
the SAD pattern in Fig. 8c. Due to the particle size
effect, the diffraction peaks show broadening. It is
seen in Fig. 10 that the (103), (004), and (112)
peaks are overlapped, as well as the (105) and (211)
peaks (PDF#71-1166).
The crystalline particle size is determined to be
about 4–8 nm from the Scherrer equation. However,
because the primary particle sizes are extremely
small, the size difference calculated from the XRD
peak widths is not discernable. For flame-generated
powders, it has been shown that XRD crystallite sizes
are consistently smaller than BET-determined parti-
cle sizes (Vemury and Pratsinis 1995b). The lack of a
significant difference in the particle crystallinity
suggests that the pre-residence time required for
forming the TiO2 crystalline primary particles is
much shorter than that for some other ceramic oxides
(e.g. Al2O3, to be discussed in Sect. ‘‘Alumina
synthesis’’).
Effect on extent of precursor decomposition (or
conversion)
TGA was conducted for samples produced with 0 V
and -500 V applied to the substrate to examine the
extent of TTIP pyrolysis (or conversion). Prior to
TGA measurement, the samples are heat treated at
*80�C in an oven overnight to avoid additional
moisture absorption onto the powder surface. As
shown in Fig. 11, the initial weight loss, up to a
temperature of 200�C, is due to loss of water that is
physically adsorbed on the high-area surfaces of the
nanoparticles. Although the two samples are heat
treated for the same time duration, nanoparticles
produced under -500 V contain more water, which
from another point of view verifies that the sample
has more surface area.
Also seen from the curves in Fig. 11, for both
conditions at 0 and -500 V, there is only about a
3.2–3.5% weight loss due to unpyrolyzed precursor.
It can be concluded that the powders are almost fully
pyrolyzed, displaying only a small weight loss (gain)
during post heat treatment. A small amount of weight
gain near the tail end is probably due to the samples
having a very small percentage of TiO or Ti2O3,
which when exposed to an O2-containing environ-
ment under elevated temperature, is converted into
TiO2. Moreover, even for the case of -500 V, where
the residence time is much shorter compared to the
0 V case (as will be seen in the temperature residence
time histories of Fig. 14), the TTIP precursor is still
almost fully pyrolyzed, which substantiates that
20 25 30 35 40 45 50 55 60
inu yrartibra/ytisnetnIst
2θ
inu yrartibra/ytisnetnIst A (
101)
R (
110)
A (
103)
A (
004)
A (
112)
A (
200)
A (
105)
A (
211)
Fig. 10 XRD pattern of TiO2 nanopowder synthesized with -
300 V applied to the substrate and the burner grounded. A:
anatase, R: rutile
0 200 400 600 800 100088
90
92
94
96
98
100 0V -500V
)%( egatnecrep thgie
W
Temperature °C
Fig. 11 TGA curves of TiO2 nanopowder synthesized with no
electric field application and with -500 V applied to the
substrate, showing weight loss of the powder as a function of
temperature
J Nanopart Res (2008) 10:907–923 917
123

shorter residence time has little effect on the pyro-
lysis process. This is consistent with the previous
statement that the electric field seems to have no
obvious effect on crystallinity because the precursor
has enough residence time to pyrolyze completely,
for the cases studied. Thus, the experiments with the
application of electric fields are not in the regime
where shorter residence times lead to insufficient
pyrolysis, where partially pyrolyzed precursor species
would condense to form bigger aggregates. However,
since residence times can be readily manipulated, this
implies that the crystallinity can also be controlled
through electric field application.
Alumina synthesis
Presented briefly, the trends for electric field effect on
nanoparticle characteristics for Al2O3 synthesis is
also experimentally examined. As seen from Fig. 12,
the aggregate particle size shows a similar trend,
decreasing/increasing significantly due to the shorter/
longer residence times, when applying negative/
positive voltages to the substrate. However, the
charging effect (from large voltage biases on the
substrate) may not be as strong for the Al2O3 system.
More investigation is needed. Note that the modeling
and computation of Al2O3 particle growth are not
presented in this work.
Figure 13 divulges the crystalline structure of cphase alumina produced without electric field
application. XRD shows that the application of
intense electric fields can be detrimental, resulting
in more amorphous structures for alumina, with TGA
showing incomplete pyrolysis. Both particle agglom-
eration and particle crystallinity are strongly affected
by residence time and temperature. As such flame
structure and electrical field conditions must be
optimized to realize high nanoparticle crystallinity
at significantly reduced agglomeration.
Computational results and discussion (TiO2)
The experiment cases in Sect. ‘‘Experimental results
and discussion’’ for titania synthesis are simulated
using both the monodisperse model and the sectional
model. Since particles are positively charged due to
thermo-ionization in the flame, applying electric
fields (concurrently) in the direction of the axial flow
velocity (by applying negative voltages to the sub-
strate) will accelerate the particles towards the
substrate and thus shorten the residence times, as
shown in Fig. 14. However, applying electric fields
countercurrent to the axial flow velocity (by applying
positive voltages to the substrate) will decelerate the
movement of the particles. Worse yet, particles could
be forced back to the burner due to a combination of
electrophoretic and thermophoretic effects (note: a
large temperature gradient exists between the burner
and the flame zone), as shown in Figs. 14 and 15 (e.g.
case +700 V), growing into larger particles and then
retracing their steps towards the substrate.
0
100
200
300
400
500
600
700
-1000 -800 -600 -400 -200 0 200 400 600 800
Electric field (V/4cm)
)m
n( ezis elcitrap eta
gerg
gA
Fig. 12 Mean aggregate particle size, as measured by DLS of
alumina powder collected from substrate post-experiment,
synthesized under different electric fields (with voltage applied
to the substrate and the burner grounded) using the intensity-
weighted method (Intensity-weighted distribution gives the
fraction of the total scattered light intensity of the particles
contributed by particles in any size range)
20 30 40 50 60 70 80
rtibra/ytisnetnIra
stinu y
2θ
Fig. 13 XRD pattern of Al2O3 nanopowder synthesized
without electric field application
918 J Nanopart Res (2008) 10:907–923
123

Therefore, as seen from Figs. 15 and 16, when
applying negative (concurrent) electric fields, the
synthesized nanoparticles leave the reaction zone
earlier, leading to fewer particle-to-particle colli-
sions. The aggregate particle sizes decrease as the
negative (concurrent) electric field intensity
increases. However, in applying positive (counter-
current) electric fields, the electrophoretic effect
keeps the nanoparticles longer in the reaction zone,
and the aggregate particle sizes increase as the
positive (countercurrent) electric field intensity
increases. The trends in the aggregate particle size
are in good agreement with the experimental results
presented in Sect. ‘‘Experimental results and
discussion’’.
The evolution of the GSDs, as shown in Fig. 17,
changes only slightly with respect to the applied
electric field magnitude, except for the case in which
0.000 0.005 0.010 0.015 0.020 0.025 0.030 0.035 0.040400
600
800
1000
1200
1400
1600
1800
+700V+500V+300V-500V -300V 0V
Te
K( erutarepm
)
Particle residence time (s)
Fig. 14 Sectional model assessment of the influence of
electric field application on particle temperature history, for
titania
0.0 0.5 1.0 1.5 2.0 2.5 3.0 3.5 4.0
0.0 0.5 1.0 1.5 2.0 2.5 3.0 3.5 4.0
0
5
10
15
20
25
30
35
40
45
50
+700V+500V+300V
-500V
- 03 V0
0V
Burner
etagerggA
p itrac
s eli
( ezn
)m
Substrate-burner-gap (cm)
(a)
0
5
10
15
20
25
30
35
40
45
50
+700V+500V+300V
-500V
- 03 V0
0V
etagerggA
p itrac
s eli
( ezn
)m
0
5
10
15
20
25
30
35
40
45
50
0V-300V-500V
+300V
+500V
Burner
Ag
citrap etagergle
ezis )
mn(
Substrate-burner-gap (cm)
(b)
0
5
10
15
20
25
30
35
40
45
50
0V-300V-500V
+300V
+500V
Ag
citrap etagergle
ezis )
mn(
Fig. 15 Assessment of the influence of electric field applica-
tion on the aggregate particle size as a function of position in
the flow field using (a) the sectional model and (b) the
monodisperse model, for titania. Note: the branch point is
thermo-ionization point
0.000 0.005 0.010 0.015 0.020 0.025 0.030 0.035 0.0400
5
10
15
20
25
30
35
+500V
+300V
-500V-300V
0V
rggA
tagetrap e
s elcii
)mn( ez
Particle residence time (s)
(a)
0
5
10
15
20
25
30
35
+500V
+300V
-500V-300V
0V
rggA
tagetrap e
s elcii
)mn( ez
0.000 0.005 0.010 0.015 0.020 0.0250
5
10
15
20
25
30
35
40
45
50
0V
-300V-500V
+300V
+500V
rggA
tagecitrap e
s eli
mn( ez)
Particle residence time (s)
(b)
0
5
10
15
20
25
30
35
40
45
50
0V
-300V-500V
+300V
+500V
rggA
tagecitrap e
s eli
mn( ez)
Fig. 16 Assessment of the influence of electric field applica-
tion on the aggregate particle size as a function of particle
residence time using (a) the sectional model and (b) the
monodisperse model, for titania
J Nanopart Res (2008) 10:907–923 919
123

the nanoparticles are attracted back to the burner (e.g.
+700 V), as discussed previously. When the equiva-
lent solid sphere diameter is much smaller than the
mean-free path of the gas, chemical reactions are
rapid; and particle growth is dominated by coagula-
tion in the free molecule regime rather than by surface
reaction. In this case, particles grow by Brownian
coagulation and reach an asymptotic self-preserving
size distribution. All of the GSDs converge to a
similar value between 1.460 and 1.462 (the limit for
the free molecular regime of the polydispersity of
particles grown by coagulation) by the time these
nanoparticles reach the substrate. As seen from
Fig. 17, the processes of nucleation and TTIP decom-
position are not affected by electric-field application
because they are accomplished before the nanoparti-
cles become thermally ionized and carry unit charge.
In contrast to the trends in aggregate particle size,
the trends in primary particle size can be non-
monotonic as a function of applied substrate voltage,
as experimentally shown in Fig. 9. Similarly,
Figs. 18 and 19 show that, depending on the precur-
sor-loading rate, there is a local maximum for the
primary particle size with respect to electric field
strength. In Fig. 19a, with the primary particle size
peaking around +300 V, as computed by the sectional
model, increasing the negative field strength or the
positive field strength larger than this critical value
(i.e. +300 V) results in a smaller primary particle
size. In the monodisperse model calculations, the
local maximum primary particle size occurs at an
electric field of +20 V/4 cm, corresponding to
Fig. 19b. As the precursor-loading rate increases,
the position where the peak value of the primary
particle size occurs moves towards larger magnitudes
of negative electric field. This non-monotonic trend
in the primary particle size with the application of
electric fields agrees with the experimental results
presented previously in Sect. ‘‘Experimental results
and discussion’’, where the BET SSA increases with
increasing field strength under both concurrent and
countercurrent electric fields (since the SSA equive-
lent particle size, to some extent, can be treated as the
primary particle size as shown in Fig. 9). In the hot
flame, the particles start growing from molecular size
by coagulation. They coalesce as they collide, where
they gradually partially coalesce after collisions due
to the longer characteristic coalescence time for the
aggregates. With a group-wise coalescence process
occurring, the more primary particles there are within
an aggregate, the longer it takes an aggregate to
0.0 0.5 1.0 1.5 2.0 2.5 3.0 3.5 4.01.0
1.2
1.4
1.6
1.8
2.0
+300V +500V +700V
-500V -300V 0V
Burner
S cirtemoe
Gt
D dradrae
noitaiv
Substrate-burner-gap (cm)
Fig. 17 Geometric standard deviation of particle size distri-
bution (computed using the sectional model) as a function of
particle position in the flow field, for different electric field
application, for titania
0.0 0.5 1.0 1.5 2.0 2.5 3.0 3.5 4.00.0
0.5
1.0
1.5
2.0
2.5
3.0
3.5
4.0
4.5
5.0
5.5
6.0
-500V -300V +700V
0V +500V +300V
Burner
Pr
elcitrap yrami
mn( ezis)
Substrate-burner-gap (cm)
(a)
0.0 0.5 1.0 1.5 2.0 2.5 3.0 3.5 4.00.0
0.5
1.0
1.5
2.0
2.5
3.0
3.5
4.0
4.5
5.0
5.5
6.0
-500V -300V +700V
0V +500V +300V
Burner
Pr
elcitrap yrami
mn( ezis)
Substrate-burner-gap (cm)
0.0 0.5 1.0 1.5 2.0 2.5 3.0 3.5 4.00
1
2
3
4
5
6
+500V -500V -300V
0V +300V
Burner
Pr
itrap yrami
cle
ezis )
mn(
Substrate-burner-gap (cm)
(b)
0.0 0.5 1.0 1.5 2.0 2.5 3.0 3.5 4.00
1
2
3
4
5
6
+500V -500V -300V
0V +300V
Burner
Pr
itrap yrami
cle
ezis )
mn(
Substrate-burner-gap (cm)
Fig. 18 Assessment of the influence of electric field applica-
tion on primary particle size as a function of particle position in
the flow field using (a) the sectional model and (b) the
monodisperse model, for titania
920 J Nanopart Res (2008) 10:907–923
123
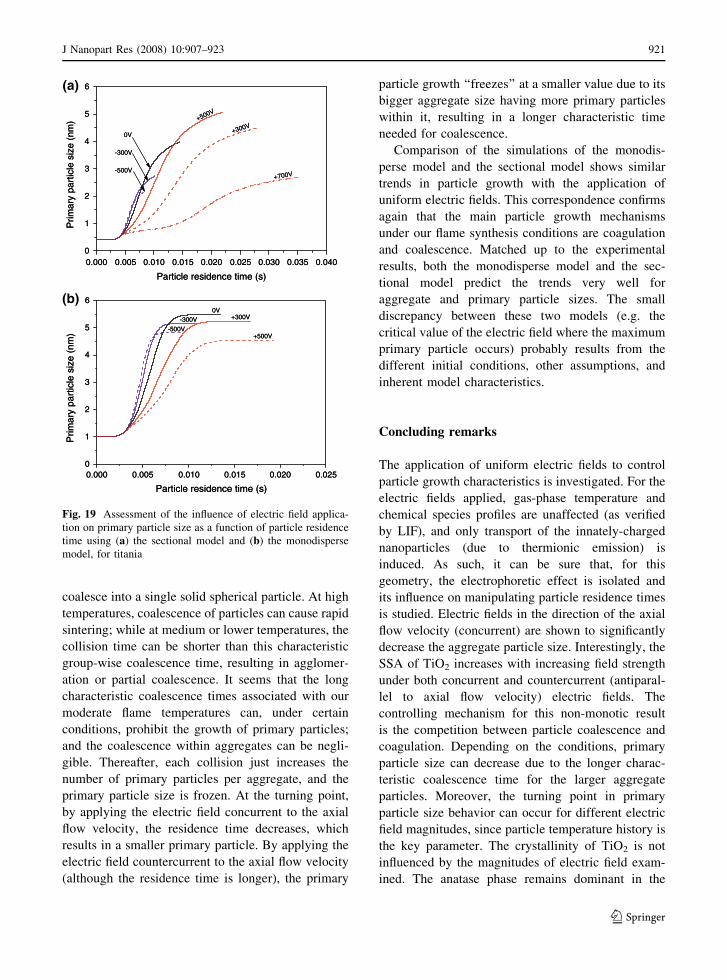
coalesce into a single solid spherical particle. At high
temperatures, coalescence of particles can cause rapid
sintering; while at medium or lower temperatures, the
collision time can be shorter than this characteristic
group-wise coalescence time, resulting in agglomer-
ation or partial coalescence. It seems that the long
characteristic coalescence times associated with our
moderate flame temperatures can, under certain
conditions, prohibit the growth of primary particles;
and the coalescence within aggregates can be negli-
gible. Thereafter, each collision just increases the
number of primary particles per aggregate, and the
primary particle size is frozen. At the turning point,
by applying the electric field concurrent to the axial
flow velocity, the residence time decreases, which
results in a smaller primary particle. By applying the
electric field countercurrent to the axial flow velocity
(although the residence time is longer), the primary
particle growth ‘‘freezes’’ at a smaller value due to its
bigger aggregate size having more primary particles
within it, resulting in a longer characteristic time
needed for coalescence.
Comparison of the simulations of the monodis-
perse model and the sectional model shows similar
trends in particle growth with the application of
uniform electric fields. This correspondence confirms
again that the main particle growth mechanisms
under our flame synthesis conditions are coagulation
and coalescence. Matched up to the experimental
results, both the monodisperse model and the sec-
tional model predict the trends very well for
aggregate and primary particle sizes. The small
discrepancy between these two models (e.g. the
critical value of the electric field where the maximum
primary particle occurs) probably results from the
different initial conditions, other assumptions, and
inherent model characteristics.
Concluding remarks
The application of uniform electric fields to control
particle growth characteristics is investigated. For the
electric fields applied, gas-phase temperature and
chemical species profiles are unaffected (as verified
by LIF), and only transport of the innately-charged
nanoparticles (due to thermionic emission) is
induced. As such, it can be sure that, for this
geometry, the electrophoretic effect is isolated and
its influence on manipulating particle residence times
is studied. Electric fields in the direction of the axial
flow velocity (concurrent) are shown to significantly
decrease the aggregate particle size. Interestingly, the
SSA of TiO2 increases with increasing field strength
under both concurrent and countercurrent (antiparal-
lel to axial flow velocity) electric fields. The
controlling mechanism for this non-monotic result
is the competition between particle coalescence and
coagulation. Depending on the conditions, primary
particle size can decrease due to the longer charac-
teristic coalescence time for the larger aggregate
particles. Moreover, the turning point in primary
particle size behavior can occur for different electric
field magnitudes, since particle temperature history is
the key parameter. The crystallinity of TiO2 is not
influenced by the magnitudes of electric field exam-
ined. The anatase phase remains dominant in the
0.000 0.005 0.010 0.015 0.020 0.025 0.030 0.035 0.0400
1
2
3
4
5
6
0V
-300V
-500V+700V
+500V
+300V
rP
rami
yp
artci
les i
ez( n
)m
Particle residence time (s)
(a)
0.000 0.005 0.010 0.015 0.020 0.025 0.030 0.035 0.0400
1
2
3
4
5
6
0V
-300V
-500V+700V
+500V
+300V
rP
rami
yp
artci
les i
ez( n
)m
Particle residence time (s)
0.000 0.005 0.010 0.015 0.020 0.0250
1
2
3
4
5
6
+500V
+300V
-500V
-300V0V
is elcitrap yramir
Pez
n()
m
Particle residence time (s)
(b)
0.000 0.005 0.010 0.015 0.020 0.0250
1
2
3
4
5
6
+500V
+300V
-500V
-300V0V
is elcitrap yramir
Pez
n()
m
Particle residence time (s)
Fig. 19 Assessment of the influence of electric field applica-
tion on primary particle size as a function of particle residence
time using (a) the sectional model and (b) the monodisperse
model, for titania
J Nanopart Res (2008) 10:907–923 921
123

synthesized powders due to fast crystallization
kinetics, moderate flame temperatures, and short
residence times. Even with electric field application,
TGA reveals that the precursor is still almost fully
converted, indicating that the experiments with the
application of electric fields are not in the regime
where short residence times can lead to insufficient
pyrolysis, with partially pyrolyzed precursor species
condensing to form bigger aggregates. However, as
seen from the nano-alumina results, residence time
can greatly affect crystallinity given the overall flame
conditions, and electric field application can have a
significant effect by shifting particle residence time
into another formation regime.
Acknowledgments This work was supported by the National
Science Foundation through grants NSF-CTS-0213929 and
NSF-CTS-0325057. Initial seed funding from the New Jersey
Space Grant Consortium is acknowledged. Special thanks are
due to Joshua Dewanaga, Venkata Rapaka, Fusheng Xu, and
John Petrowski for their help with the experiments.
References
Aghalayam P, Bui PA, Vlachos DG (1998) The role of radical
wall quenching in flame stability and wall heat flux:
hydrogen-air mixtures. Combust Theory Model 2:515–
530
Baron P, Willeke K (2001) Aerosol measurement: principles,
techniques, and applications. Wiley & Sons, New York
Ben-Yakar A, Kamel M, Morris C, Hanson RK (1998)
Hypersonic combustion and mixing studies using simul-
taneous OH-PLIF and schlieren imaging. Paper AIAA-
1998-940 presented at the 36th aerospace sciences meet-
ing and exhibit, Reno, NV, 12–15 January 1998
Campbell SA, Kim HS, Gilmer DC, He B, Ma T, Gladfelter
WL (1999) Titanium dioxide (TiO2) based gate insulators.
IBM J Res Dev 43:383–392
Chattock AP (1899) On the velocity and mass of ions in the
electric wind in air. Philos Mag 48:401–420
Chen Y, Glumac N, Kear BH, Skanden G (1997) High rate
synthesis of nanophase materials. Nanostruct Mater
9:101–104
Coltrin ME, Kee RJ, Evans GH, Meeks E, Rupley FM, Grcar
JF (1991) SPIN: a Fortran program for modeling one-
dimensional rotating-disk/stagnation-flow chemical vapor
deposition reactors. Technical report SAND91-8003,
Sandia National Laboratories
Coltrin ME, Kee RJ, Rupley FM, Meeks E (1996) Surface
Chemkin-III: a Fortran package for analyzing heteroge-
neous chemical kinetics at a solid-surface—gas-phase
interface. Technical report SAND96-8217, Sandia
National Laboratories
Fialkov AB (1997) Investigations on ions in flame. Prog
Energy Combust Sci 23:399–528
Friedlander SK (2000) Smoke, dust and haze. Oxford Uni-
versity Press, Oxford
Fuchs NA (1963) On the stationary charge distribution on
aerosol particles in a bipolar ionic atmosphere. Geofis
Pura Appl 56:185–193
Giesen B, Orthner HR, Kowalik A, Roth P (2004) On the
interaction of coagulation and coalescence during gas-
phase synthesis of Fe-nanoparticle agglomerates. Chem
Eng Sci 59:2201–2211
Girshick SL, Chiu CP (1990) Kinetic nucleation theory: a new
expression for the rate of homogeneous nucleation from
an ideal supersaturated vapor. J Chem Phys 93:1273–1277
Glumac NG, Chen YJ, Skandan G (1998) Diagnostics and
modeling of nanopowder synthesis in low pressure flames.
J Mater Res 13(9):2572–2579
Glumac NG, Skandan G, Chen YJ, Kear BH (1999) Particle
size control during flat flame synthesis of nanophase oxide
powders. Nanostruct Mater 12:253–258
Hardesty DR, Weinberg FJ (1973) Electrical control of par-
ticulate pollutants from flames. Proc Combust Inst
14:907–918
Hinds WC (1982) Aerosol technology, properties, behavior,
and measurement of airborne particles. John Wiley &
Sons, New York
Janzen C, Roth P (2001) Formation and characteristics of
Fe2O3 nano particles in doped low pressure H2/O2/Ar
flames. Combust Flame 125:1150–1161
Kammler HK, Pratsinis SE (2000) Electrically-assisted flame
aerosol synthesis of fumed silica at high production rates.
Chem Eng Process 39:219–227
Kammler HK, Madler L, Pratsinis SE (2001) Flame synthesis
of nanoparticles. Chem Eng Technol 24(6):583–596
Katz JL, Hung CH (1990) Initial studies of electric field effects
on ceramic powder formation in flames. Proc Combust
Inst 23:1733–1738
Katz JL, Hung CH (1992) Ultrafine refractory particle forma-
tion in counterflow diffusion flames. Combust Sci Technol
82:169–183
Kee RJ, Dixon-Lewis G, Warnatz J, Coltrin ME, Miller JA
(1986) A Fortran computer code package for the evalua-
tion of gas-phase multicomponent transport properties.
Technical report SAND86-8246, Sandia National
Laboratories
Kee RJ, Rupley FM, Meeks E, Miller JA (1996) Chemkin-III: a
Fortran chemical kinetics package for the analysis of gas-
phase chemical and plasma kinetics. Technical report
SAND96-8216, Sandia National Laboratories
Kobata A, Kusakabe K, Morooka S (1991) Growth and
transformation of TiO2 crystallites in aerosol reactor.
AIChE J 37(3):347–359
Koch W, Friedlander SK (1990) The effect of particle coa-
lescence on the surface area of a coagulating aerosol. J
Colloid Interface Sci 140(22):419–427
Kruis FE, Kusters KA, Scarlett B, Pratsinis SE (1993) A simple
model for the evolution of the characteristics of aggregate
particles undergoing coagulation and sintering. Aerosol
Sci Technol 19:514
Lehtinen K, Windeler R, Friedlander S (1996) A note on the
growth of primary particles in agglomerate structures by
coalescence. J Colloid Interface Sci 182:606–608
922 J Nanopart Res (2008) 10:907–923
123

Morrison PW Jr, Raghavan R, Timpone AJ, Artelt CP, Prat-
sinis SE (1997) In situ fourier transform infrared
characterization of the effect of electrical fields on the
flame synthesis of TiO2 particles. Chem Mater 9:2702–
2708
Mueller MA, Kim TJ, Yetter RA, Dryer FL (1999) Flow
reactor studies and kinetic modeling of the H2/O2 reac-
tion. Int J Chem Kinet 31:113–125
Muhlenweg H, Gutsch A, Schild A, Pratsinis SE (2002) Pro-
cess simulation of gas to particle synthesis via population
balances: investigation of three models. Chem Eng Sci
57:2305–2322
Prakash A, Bapat AP, Zachariah MR (2003) A simple
numerical algorithm and software for solution of nucle-
ation, surface growth, and coagulation problems. Aerosol
Sci Technol 37:892–898
Rulison AJ, Miquel PF, Katz JL (1996) Titania and silica
powders produced in a counterflow diffusion flame. J
Mater Res 11:3083–3089
Schwade B, Roth P (2004) Simulation of nano-particle for-
mation in a wall-heated aerosol reactor including
coalescence. J Aerosol Sci 34:339–357
Shannon RD, Pask JA (1964) Topotaxy in the anatase-rutile
transformation. Am Minerol 49:1707–1717
Singhal A, Skandan G, Wang A, Glumac N, Kear BH, Hunt
RD (1999) On nanoparticle aggregation during vapor
phase synthesis. Nanostruct Mater 11:545–552
Singhal A, Skandan G, Glumac N, Kear BH (2001) Minimizing
aggregation effects in flame synthesized nanoparticles.
Scripta Mater 44:2203–2207
Tsantilis S, Kammler HK, Pratsinis SE (2002) Population
balance modeling of flame synthesis of titania nanoparti-
cles. Chem Eng Sci 57:2139–2156
Vemury S, Pratsinis SE (1995a) Corona-assisted flame syn-
thesis of ultrafine titania particles. Appl Phys Lett
66(24):3275–3277
Vemury S, Pratsinis SE (1995b) Dopants in flame synthesis of
titania. J Am Ceram Soc 78:2984–2992
Vemury S, Kusters KA, Pratsinis SE (1994) Modeling of
coagulation and sintering aggregates. Proc First Int PTF
AIChE 2:350
Vemury S, Pratsinis SE, Kibbey L (1997) Electrically con-
trolled flame synthesis of nanophase TiO2, SiO2, and
SnO2 powders. J Mater Res 12:1031–1042
Xiong Y, Pratsinis SE, Weimer A (1992) Modeling the for-
mation of boron carbide particles in an aerosol reactor.
AIChE J 38(11):1685–1692
J Nanopart Res (2008) 10:907–923 923
123


![Rapid determination of plasmonic nanoparticle agglomeration ......Surface enhanced Raman spectroscopy (SERS) has been used to identifycirculating tumor cells in blood [40] and detect](https://static.fdocuments.in/doc/165x107/604fcfc19bdc5911ab5110d7/rapid-determination-of-plasmonic-nanoparticle-agglomeration-surface-enhanced.jpg)
