
Control of Multiple-Input, Multiple-Output (MIMO) Processes
38
Control of Multiple-Input, Multiple-Output (MIMO) Processes ions and Control Loop Interactions olled and Manipulated Variables nalysis oop PID Control Systems ultivariable Control Strategies educing Control Loop Interactions Chapter 18
-
Upload
ciaran-caldwell -
Category
Documents
-
view
95 -
download
2
description
Control of Multiple-Input, Multiple-Output (MIMO) Processes. 18.1 Process Interactions and Control Loop Interactions 18.2 Pairing of Controlled and Manipulated Variables 18.3 Singular Value Analysis 18.4 Tuning of Multiloop PID Control Systems - PowerPoint PPT Presentation
Transcript of Control of Multiple-Input, Multiple-Output (MIMO) Processes

Control of Multiple-Input, Multiple-
Output (MIMO) Processes
18.1 Process Interactions and Control Loop Interactions
18.2 Pairing of Controlled and Manipulated Variables
18.3 Singular Value Analysis
18.4 Tuning of Multiloop PID Control Systems
18.5 Decoupling and Multivariable Control Strategies
18.6 Strategies for Reducing Control Loop Interactions
1
Ch
apte
r 18

Control of Multivariable Processes
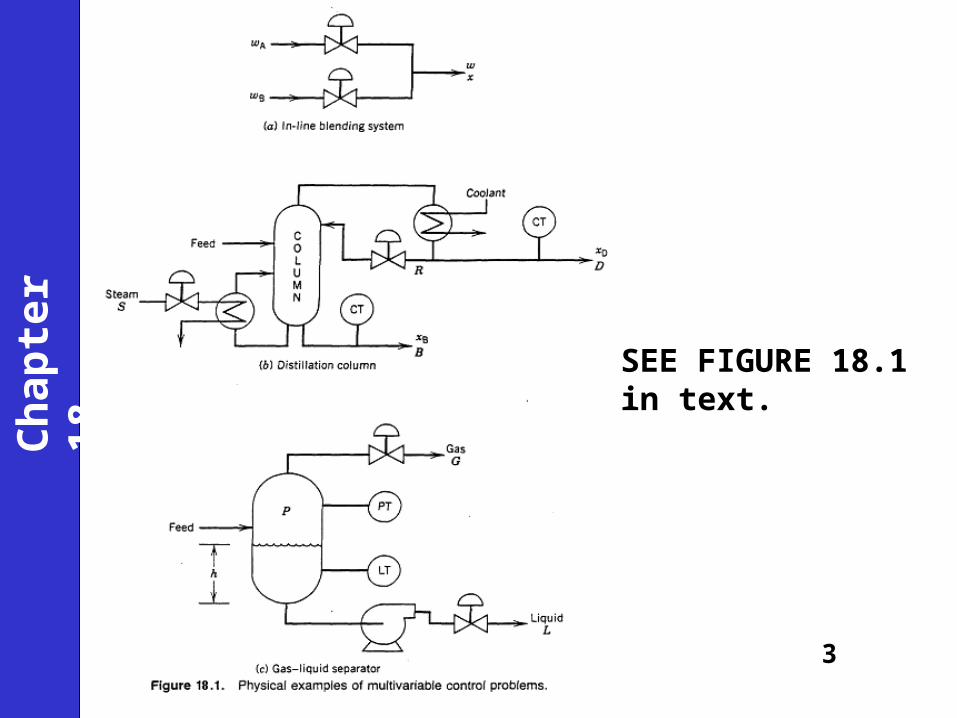
In practical control problems there typically are a number of process variables which must be controlled and a number which can be manipulated.
Example: product quality and throughput must usually be controlled.
• Several simple physical examples are shown in Fig. 18.1. Note the "process interactions" between controlled and manipulated variables.
2
Ch
apte
r 18
SEE FIGURE 18.1in text.
Ch
apte
r 18
3

Ch
apte
r 18
4

• Controlled Variables:
• Manipulated Variables:
BDBD hhPxx and ,,,,
, , , , and D BD B R Q Q
Ch
apte
r 18
5
Note: Possible multiloop control strategies = 5! = 120

In this chapter we will be concerned with characterizing process interactions and selecting an appropriate multiloop control configuration.
If process interactions are significant, even the best multiloop control system may not provide satisfactory control.
In these situations there are incentives for considering multivariable control strategies.
Definitions:
• Multiloop control: Each manipulated variable depends on only a single controlled variable, i.e., a set of conventional feedback controllers.
• Multivariable Control: Each manipulated variable can depend on two or more of the controlled variables.
Examples: decoupling control, model predictive control
Ch
apte
r 18
6
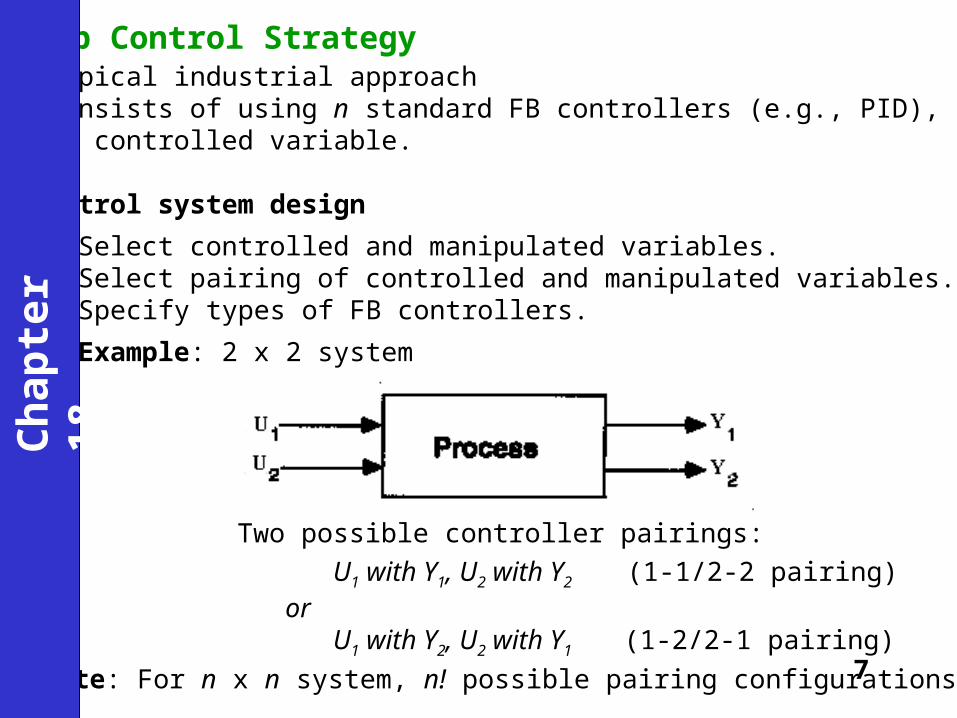
Multiloop Control Strategy• Typical industrial approach• Consists of using n standard FB controllers (e.g., PID), one for
each controlled variable.
• Control system design
1. Select controlled and manipulated variables.2. Select pairing of controlled and manipulated variables.3. Specify types of FB controllers.
Example: 2 x 2 system
Two possible controller pairings:
U1 with Y1, U2 with Y2 (1-1/2-2 pairing) or
U1 with Y2, U2 with Y1 (1-2/2-1 pairing)
Note: For n x n system, n! possible pairing configurations.
Ch
apte
r 18
7

Transfer Function Model (2 x 2 system)
Two controlled variables and two manipulated variables(4 transfer functions required)
Thus, the input-output relations for the process can be written as:
1 111 12
1 2
2 221 22
1 2
18 1
P P
P P
Y ( s ) Y ( s )G ( s ), G ( s )
U ( s ) U ( s )
Y ( s ) Y ( s )G ( s ), G ( s )
U ( s ) U ( s )
1 11 1 12 2
2 21 1 22 2
18 2
18 3
P P
P P
Y ( s ) G ( s )U ( s ) G ( s )U ( s )
Y ( s ) G ( s )U ( s ) G ( s )U ( s )
Ch
apte
r 18
8

Or in vector-matrix notation as,
where Y(s) and U(s) are vectors,
And Gp(s) is the transfer function matrix for the process
18 4ps s s Y G U
1 1
2 218 5
Y s U ss s
Y s U s
( ) ( )Y ( ) U( )
( ) ( )
11 12
21 2218 6P P
pP P
G ( s ) G ( s )( s )
G ( s ) G ( s )
G
Ch
apte
r 18
9

Ch
apte
r 18
10

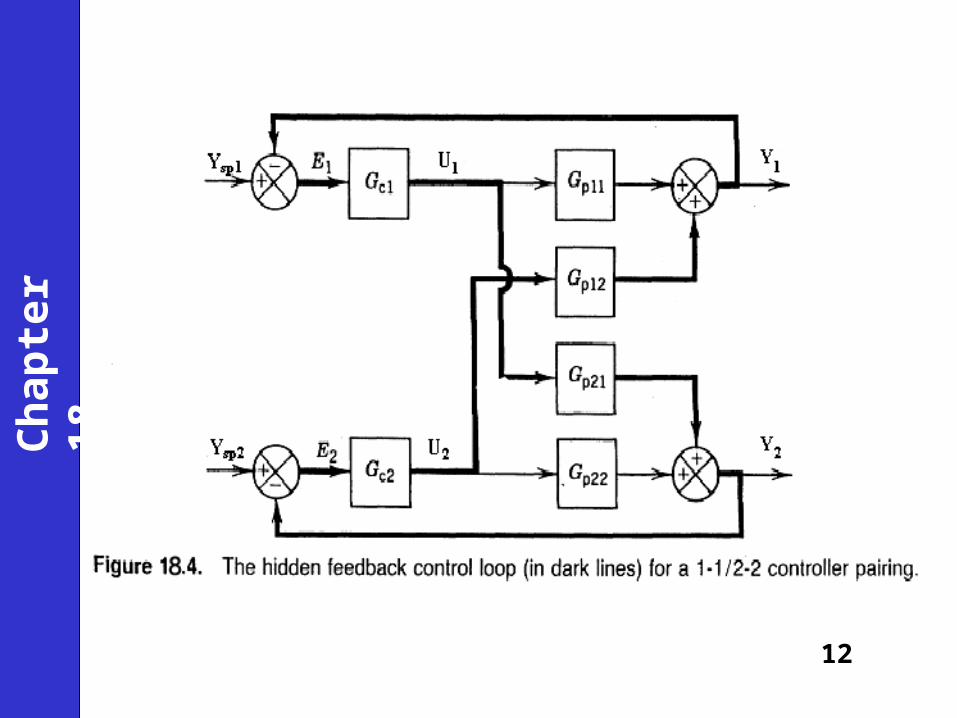
Control-loop Interactions
• Process interactions may induce undesirable
interactions between two or more control loops.
Example: 2 x 2 systemControl loop interactions are due to the presence
of a third feedback loop.
• Problems arising from control loop interactions
i. Closed-loop system may become destabilized.
ii. Controller tuning becomes more difficult.
Ch
apte
r 18
11
Ch
apte
r 18
12

Ch
apte
r 18
13

Block Diagram Analysis
For the multiloop control configuration, the transfer function between a controlled and a manipulated variable depends on whether the other feedback control loops are open or closed.
Example: 2 x 2 system, 1-1/2 -2 pairingFrom block diagram algebra we can show
Note that the last expression contains GC2.
111
1P
Y ( s )G ( s ),
U ( s )
12 21 2111
1 2 221P P C
PC P
G G GY ( s )G
U ( s ) G G
Ch
apte
r 18
(second loop open) (18-7)
(second loop closed) (18-11)
14

Ch
apte
r 18
15

Ch
apte
r 18
16

Ch
apte
r 18
17

Ch
apte
r 18
18

Relative Gain Array
• Provides two types of useful information:
1. Measure of process interactions
2. Recommendation about best pairing of
controlled and manipulated variables.
• Requires knowledge of steady-state gains
but not process dynamics.
Ch
apte
r 18
19

Example of RGA Analysis: 2 x 2 system
• Steady-state process model,
The RGA, , is defined as:
where the relative gain, ij, relates the ith controlled variable and the jth manipulated variable
1 11 1 12 2
2 21 1 22 2
y K u K u
y K u K u
11 12
21 22
18 24
i j uij
i j y
y / u
y / u
open-loop gain
closed-loop gain
Ch
apte
r 18
20

Scaling Properties:
i. ij is dimensionless
ii.
For a 2 x 2 system,
Recommended Controller Pairing
It corresponds to the ij which have the largest positive values that are closest to one.
0.1j
iji
ij
11 12 11 2112 21
11 22
11
1,
K K
K K
Ch
apte
r 18
(18-34)
21

In general:In general:1. Pairings which correspond to negative pairings should not be selected.2. Otherwise, choose the pairing which has ij closest
to one.
Examples:Examples:
Process Gain Relative Gain
Matrix, K : Array, :
11
22
0
0
K
K
12
21
0
0
K
K
11 12
220
K K
K
11
21 22
0K
K K
10
01
01
10
10
01
10
01
Ch
apte
r 18
22
11 12 11 2112 21
11 22
1, 1
1K K
K K
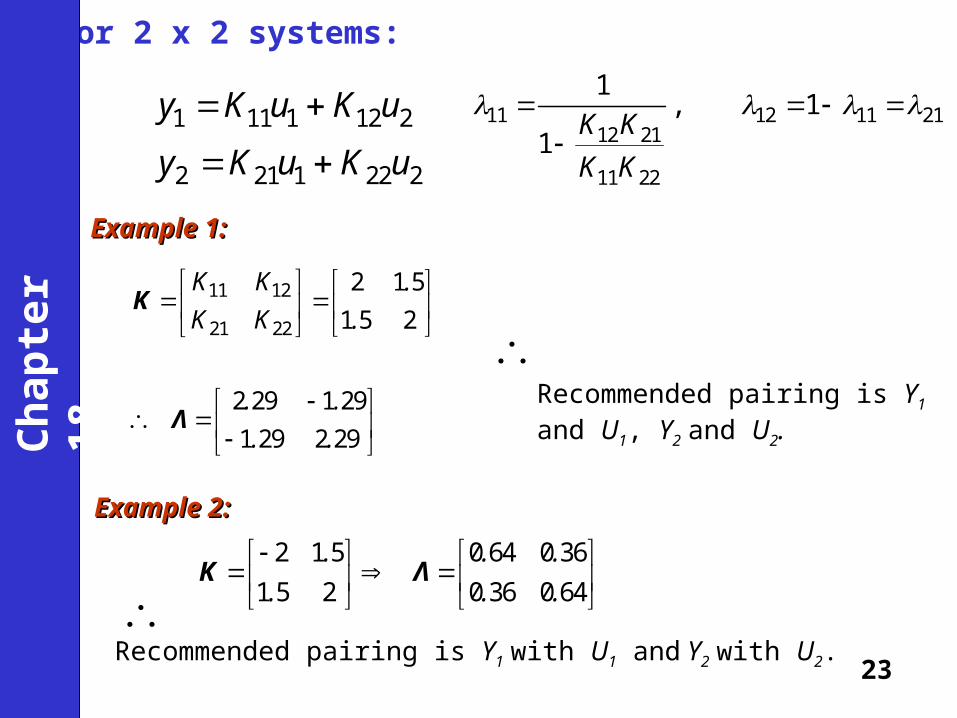
For 2 x 2 systems:
1 11 1 12 2
2 21 1 22 2
y K u K u
y K u K u
Example 1:Example 1:
11 12
21 22
2 1 5
1 5 2
2 29 1 29
1 29 2 29
K K .
K K .
. .
. .
K
Λ Recommended pairing is Y1 and U1, Y2 and U2.
Example 2:Example 2:
2 1 5 0 64 0 36
1 5 2 0 36 0 64
. . .
. . .
K Λ
Recommended pairing is Y1 with U1 and Y2 with U2.
Ch
apte
r 18
23

EXAMPLE: Thermal Mixing SystemEXAMPLE: Thermal Mixing System
The RGA can be expressed in two equivalent forms:
Note that each relative gain is between 0 and 1. The recommendedcontroller pairing depends on nominal values of T, Th, and Tc.
and
h c h c
c h c h
h c h c c h c h
h c h c
h c h c c h c h
W W W WT T T T W W
W WT T T T W W W W
T T T T W WT T
T T T T W W W W
K Λ
Ch
apte
r 18
24

RGA for Higher-Order SystemsFor and n x n system,
Each ij can be calculated from the relation,
where Kij is the (i,j) -element of the steady-state gain K matrix,
Hij is the (i,j) -element of the .
Note :
1 2
1 11 12 1
2 21 22 2
1 1
18 25
n
n
n
n n n nn
u u uy
y
y
Λ
18 37ij ij ijK H
y Ku
1 T-H K
Λ KH
Ch
apte
r 18

Example: HydrocrackerExample: Hydrocracker
The RGA for a hydrocracker has been reported as,
Recommended controller pairing?
1 2 3 4
1
2
3
4
0 931 0 150 0 080 0 164
0 011 0 429 0 286 1 154
0 135 3 314 0 270 1 910
0 215 2 030 0 900 1 919
u u u uy . . . .
y . . . .
y . . . .
y . . . .
Λ
Ch
apte
r 18
26

Singular Value Analysis• Any real m x n matrix can be factored as,
K = W VT
• Matrix is a diagonal matrix of singular values:
= diag (1, 2, …, r)
• The singular values are the positive square roots of the eigenvalues of K
TK ( r = the rank of K
TK).
• The columns of matrices W and V are orthonormal. Thus,
WWT = I and VV
T = I
• Can calculate , W, and V using MATLAB command, svd.
• Condition number (CN) is defined to be the ratio of the largest to the smallest singular value,
• A large value of CN indicates that K is ill-conditioned.
Ch
apte
r 18
27
1
r
CN

• CN is a measure of sensitivity of the matrix properties to changes in individual elements.
• Consider the RGA for a 2x2 process,
• If K12 changes from 0 to 0.1, then K becomes a singular matrix, which corresponds to a process that is difficult to control.
• RGA and SVA used together can indicate whether a process is easy (or difficult) to control.
• K is poorly conditioned when CN is a large number (e.g., > 10). Thus small changes in the model for this process can make it very difficult to control.
1 0
10 1
K Λ I
10.1 0( ) = CN = 101
0 0.1
K
Ch
apte
r 18
28
Condition Number

Selection of Inputs and Outputs• Arrange the singular values in order of largest to
smallest and look for any σi/σi-1 > 10; then one or more inputs (or outputs) can be deleted.
• Delete one row and one column of K at a time and evaluate the properties of the reduced gain matrix.
• Example:
0.48 0.90 0.006
0.52 0.95 0.008
0.90 0.95 0.020
K
Ch
apte
r 18
29

•
CN = 166.5 (σ1/σ3)
The RGA is:
Preliminary pairing: y1-u2, y2-u3, y3-u1.
CN suggests only two output variables can be controlled. Eliminate one input and one output (3x3→2x2).
0.5714 0.3766 0.7292
0.6035 0.4093 0.6843
0.5561 0.8311 0.0066
W
1.618 0 0
0 1.143 0
0 0 0.0097
0.0541 0.9984 0.0151
0.9985 0.0540 0.0068
0.0060 0.0154 0.9999
V
2.4376 3.0241 0.4135
1.2211 0.7617 0.5407
2.2165 1.2623 0.0458
ΛCh
apte
r 18
Ch
apte
r 18
30

Ch
apte
r 18
Question:
How sensitive are these results to the scaling of inputs andoutputs?
31

1. "Detune" one or more FB controllers.2. Select different manipulated or controlled variables. e.g., nonlinear functions of original variables3. Use a decoupling control scheme.4. Use some other type of multivariable control scheme.
Decoupling Control Systems
Basic Idea: Use additional controllers to compensate for process interactions and thus reduce control loop interactions
Ideally, decoupling control allows setpoint changes to affect only the desired controlled variables.
Typically, decoupling controllers are designed using a simple process model (e.g., a steady-state model or transfer function model)
Ch
apte
r 18
Alternative Strategies for Dealing with Undesirable Control Loop Interactions
32

Ch
apte
r 18
33

Decoupler Design Equations
We want cross-controller, T12, to cancel the effect of U2 on Y1.Thus, we would like,
Because U22 0 in general, then
Similarly, we want T12 to cancel the effect of U1 on Y2. Thus, werequire that,
Compare with the design equations for feedforward control based on block diagram analysis
12 11 22 12 22 0 18 79P PT G U G U
1212
11
18 80P
P
GT
G
21 22 11 21 11
2121
22
0 18 76
18 78
P P
P
P
T G U G U
GT
G
Ch
apte
r 18
34
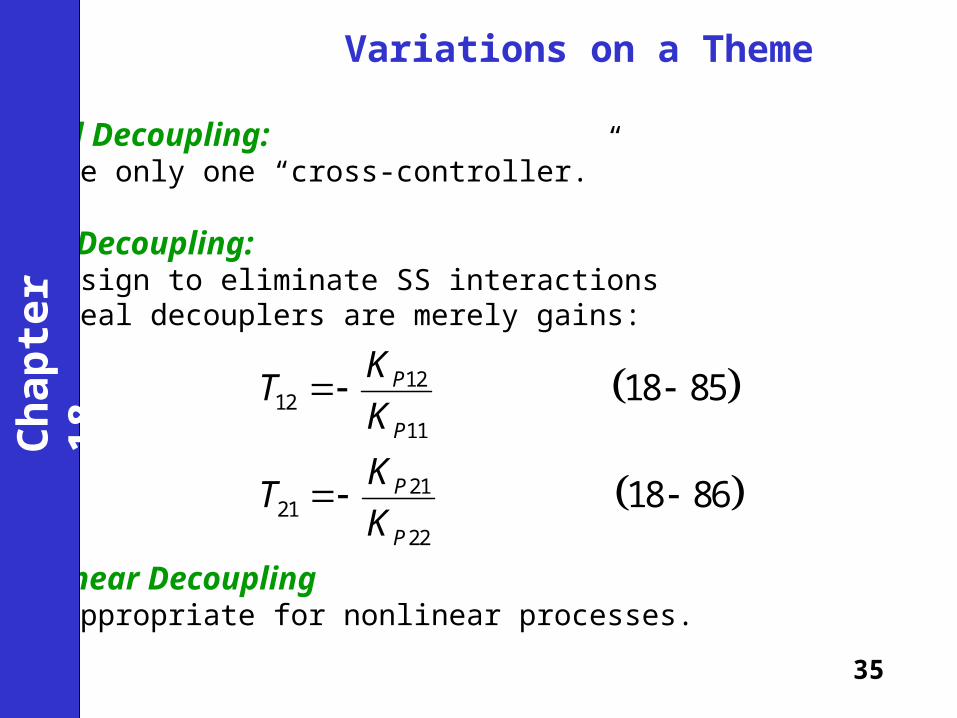
Variations on a Theme
1. Partial Decoupling: Use only one “cross-controller.”
2. Static Decoupling: Design to eliminate SS interactions Ideal decouplers are merely gains:
3. Nonlinear Decoupling Appropriate for nonlinear processes.
1212
11
2121
22
18 85
18 86
P
P
P
P
KT
K
KT
K
Ch
apte
r 18
35

Wood-Berry Distillation Column Model (methanol-water separation)
CT
CT
Feed F
Reflux R Distillate D,composition (wt. %) XD
Bottoms B,composition (wt. %) XB
Steam SCh
apte
r 18
36 36

3
1 1
2 27 3
1
2
1
12.8 18.9
16.7 1 21 1( ) ( )(18 12)
( ) ( )6.6 19.4
10.9 1 14.4 1
where:
distillate composition, %MeOH
bottoms composition, %MeOH
reflux f
s s
s s
D
B
e e
s sy s u s
y s u se e
s s
y x
y x
u R
1
low rate, lb/min
reflux flow rate, lb/minu S
Wood-Berry Distillation Column ModelC
hap
ter
18
37 37

Ch
apte
r 18


![Printed Multi-Band MIMO Antenna Systems and Their ... · the diversity performance of the MIMO antenna system [3]. A ... Multiple-input-multiple-output (MIMO) antenna systems are](https://static.fdocuments.in/doc/165x107/601832972ff2e95336029d17/printed-multi-band-mimo-antenna-systems-and-their-the-diversity-performance.jpg)


