Control of Gluconeogenesis in Liver - jbc.org · 1426 Control of Gluconeogenesis in Liver. III Vol....
11
THE JOURNAL OF BIOLOGICAL CHEMISTRY Vol. 244, No. 6, Issue of March 26, PP. 1424-1433, 1969 Printed in U.S.A. Control of Gluconeogenesis in Liver III. EFFECTS OF L-LACTATE, PYRUVATE, FRUCTOSE, GLUCAGON, EPINEPHRINE, AND ADENOSINE 3’) !j’-MONOPHOSPHATE ON GLUCONEOGENIC INTERMEDIATES IN THE PERFUSED RAT LIVER* (Received for publication, October 18, 1968) J. H. EXTON~ AND C. R. PARK From the Department of Physiology, Vanderbilt University, Nashville, Tennessee S?I?OS SUMMARY The levels of intermediary metabolites in the perfused liver have been measured to determine the location of the rate-limiting step for gluconeogenesis from lactate and the site at which glucagon, epinephrine, and cyclic AMP exert control. The reaction limiting maximum gluconeogenesis from lactate is situated between pyruvate and phosphopyruvate. Glucagon or epinephrine, acting through cyclic AMP, appears to activate a reaction in this portion of the pathway. At less than saturating levels of lactate, the rate of gluconeogenesis is determined by the activities of the above reaction and also of lactate dehydrogenase. The latter step is not under hormonal control. Gluconeogenesis is not limited by the supply of NAD+ or NADH and is virtually independent of the oxidation-reduction potential of the extramitochondrial NAD+-NADH couple as reflected by the lactate-pyruvate ratio of the tissue. The liver has potent mechanisms to restore a displaced oxidation-reduction potential to normal. Glucagon does not stimulate gluconeogenesis or inhibit lactate formation from fructose or dihydroxyacetone. It is suggested that a sparing of pyruvate oxidation or inhibition of the pyruvate kinase reaction is not responsible for the gluconeogenic action of glucagon and that effects, if any, of glucagon on reactions at the level of triose phosphate dehy- drogenase, fructose diphosphatase, or glucose 6-phosphatase are of no physiological importance. Although the enzymatic reactions involved in gluconeogenesis appear to be known, comparatively little is understood about the regulation of this process. In order to elucidate the control mechanisms it is first essential to identify the reactions which * This work was supported by program project Grant AM-07462 from the National Institutes of Health. United States Public Health Service. Preliminary reports of Some of this work have appeared (14). $ Investigator of the Howard Hughes Medical Institute. control the flow of substrate in the pathway. This paper is concerned with this identification. In the first paper of this series (5) it wasfound that the maxi- mum rate of glucose production from dihydroxyacetone or fructose in the perfusedliver was greater than from lactate or pyruvate. Since dihydroxyacetone and fructose are believed to enter the gluconeogenic pathway mainly at the level of the triose phosphates (6, 7), these results were interpreted as indi- cating that the step limiting maximum gluconeogenesis from lactate is situated between pyruvate and triose phosphatein the gluconeogenic pathway. Krebs et al. have reported similar results in rat livers perfused by a different technique (8, 9). In the second paper of this series (lo), glucagon, epinephrine, norepinephrine, and adenosine 3’) 5’-monophosphate(cyclic AMP) were found to stimulate gluconeogenesis from lactate and pyruvate but not from fructose or dihydroxyacetone in the perfusedrat liver. It was proposed that the hormones acted by raising the intracellular cyclic AMP concentration and that cyclic AMP stimulated a reaction in the gluconeogenic pathway betweenpyruvate and triose phosphate. In the presentpaper, the effectsof different concentrations of lactate, pyruvate, and fructose on the levels of gluconeogenic intermediateshave been determinedin the perfused liver in an effort to localize further the limiting reactions for gluconeogene- sis. In addition, the effectsof glucagon, epinephrine, and cyclic AMP on gluconeogenic intermediates in rat livers perfused with lactate or fructose have been examinedin an attempt to define the site of action of the hormones. EXPERIMENTAL PROCEDURE The sources of animals, the technique of perfusion,and some of the methods of liver and medium analysis have been described in detail (5). At the end of a perfusion period, about 3 g of liver were rapidly removed and clamped in aluminum tongs previ- ously cooledin liquid Ns (11). Part of the frozen sample was used for glycogen determination (12) while the remainderwas weighedand powdered with a stainless steel mortar and pestle driven by a percussion hammer and cooled in liquid Nz (13). The dry weight of part of the powder was determined after desiccation for 24 hours. The remainder was extracted with 3 M HClOJ by the method of Lowry et al. (14) as described 1424 by guest on August 16, 2019 http://www.jbc.org/ Downloaded from
Transcript of Control of Gluconeogenesis in Liver - jbc.org · 1426 Control of Gluconeogenesis in Liver. III Vol....
THE JOURNAL OF BIOLOGICAL CHEMISTRY Vol. 244, No. 6, Issue of March 26, PP. 1424-1433, 1969
Printed in U.S.A.
Control of Gluconeogenesis in Liver
III. EFFECTS OF L-LACTATE, PYRUVATE, FRUCTOSE, GLUCAGON, EPINEPHRINE, AND ADENOSINE 3’) !j’-MONOPHOSPHATE ON GLUCONEOGENIC INTERMEDIATES IN THE PERFUSED RAT LIVER*
(Received for publication, October 18, 1968)
J. H. EXTON~ AND C. R. PARK
From the Department of Physiology, Vanderbilt University, Nashville, Tennessee S?I?OS
SUMMARY
The levels of intermediary metabolites in the perfused liver have been measured to determine the location of the rate-limiting step for gluconeogenesis from lactate and the site at which glucagon, epinephrine, and cyclic AMP exert control.
The reaction limiting maximum gluconeogenesis from lactate is situated between pyruvate and phosphopyruvate. Glucagon or epinephrine, acting through cyclic AMP, appears to activate a reaction in this portion of the pathway. At less than saturating levels of lactate, the rate of gluconeogenesis is determined by the activities of the above reaction and also of lactate dehydrogenase. The latter step is not under hormonal control. Gluconeogenesis is not limited by the supply of NAD+ or NADH and is virtually independent of the oxidation-reduction potential of the extramitochondrial NAD+-NADH couple as reflected by the lactate-pyruvate ratio of the tissue. The liver has potent mechanisms to restore a displaced oxidation-reduction potential to normal.
Glucagon does not stimulate gluconeogenesis or inhibit lactate formation from fructose or dihydroxyacetone. It is suggested that a sparing of pyruvate oxidation or inhibition of the pyruvate kinase reaction is not responsible for the gluconeogenic action of glucagon and that effects, if any, of glucagon on reactions at the level of triose phosphate dehy- drogenase, fructose diphosphatase, or glucose 6-phosphatase are of no physiological importance.
Although the enzymatic reactions involved in gluconeogenesis appear to be known, comparatively little is understood about the regulation of this process. In order to elucidate the control mechanisms it is first essential to identify the reactions which
* This work was supported by program project Grant AM-07462 from the National Institutes of Health. United States Public Health Service. Preliminary reports of Some of this work have appeared (14).
$ Investigator of the Howard Hughes Medical Institute.
control the flow of substrate in the pathway. This paper is concerned with this identification.
In the first paper of this series (5) it was found that the maxi- mum rate of glucose production from dihydroxyacetone or fructose in the perfused liver was greater than from lactate or pyruvate. Since dihydroxyacetone and fructose are believed to enter the gluconeogenic pathway mainly at the level of the triose phosphates (6, 7), these results were interpreted as indi- cating that the step limiting maximum gluconeogenesis from lactate is situated between pyruvate and triose phosphate in the gluconeogenic pathway. Krebs et al. have reported similar results in rat livers perfused by a different technique (8, 9).
In the second paper of this series (lo), glucagon, epinephrine, norepinephrine, and adenosine 3’) 5’-monophosphate (cyclic AMP) were found to stimulate gluconeogenesis from lactate and pyruvate but not from fructose or dihydroxyacetone in the perfused rat liver. It was proposed that the hormones acted by raising the intracellular cyclic AMP concentration and that cyclic AMP stimulated a reaction in the gluconeogenic pathway between pyruvate and triose phosphate.
In the present paper, the effects of different concentrations of lactate, pyruvate, and fructose on the levels of gluconeogenic intermediates have been determined in the perfused liver in an effort to localize further the limiting reactions for gluconeogene- sis. In addition, the effects of glucagon, epinephrine, and cyclic AMP on gluconeogenic intermediates in rat livers perfused with lactate or fructose have been examined in an attempt to define the site of action of the hormones.
EXPERIMENTAL PROCEDURE
The sources of animals, the technique of perfusion, and some of the methods of liver and medium analysis have been described in detail (5). At the end of a perfusion period, about 3 g of liver were rapidly removed and clamped in aluminum tongs previ- ously cooled in liquid Ns (11). Part of the frozen sample was used for glycogen determination (12) while the remainder was weighed and powdered with a stainless steel mortar and pestle driven by a percussion hammer and cooled in liquid Nz (13). The dry weight of part of the powder was determined after desiccation for 24 hours. The remainder was extracted with 3 M HClOJ by the method of Lowry et al. (14) as described
1424
by guest on August 16, 2019
http://ww
w.jbc.org/
Dow
nloaded from

Issue of March 25, 1969 J. H. Exton and C. R. Park
TABLE I
1425
Effects of lactate, pyruvate, and fructose on levels of gluconeogenic intermediates Livers from rats fasted for 18 to 22 hours were perfused for 1 hour with recirculating medium containing substrates at the initial
concentrations noted. After 1 hour, a portion of the liver was rapidly frozen and analyzed as described under “Experimental Proce- dure.”
Substrate added ..............
No. of livers For intermediates ........... For nucleotides .............
Lactate ....................... Pyruvate ..................... Malate ........................ P-Pyruvate ................... 2-P-Glycerate ................. 3-P-Glycerate ................. Dihydroxyacetone -P. ......... Glycerol-l-P. ................. Fructose-di-P .................. Fructose-6-P .................. Glucose-6-P. .................. Glucose” ...................... ATP .......................... ADP. ......................... AMP ......................... Pi ............................
-
None 10 mM L-lactate 20 mM L-lactate 20 mrd pyruvate 20 rnM fructose
19 21 17 6 11 10 19 9 8
1,050 f 90 5,480 f 630 70 f 5 535 f 45
423 f 30 970 f 91 144 f 14 546 f 43 39 f 5 140 f 12
343 f 30 1,280 f 70 49 i 5 87 f 7
480 f 34 870 f 67 25 f 2 43 f 4 23 f 3 48 f 4 68 f 5 237 f 24
3,550 f 200 15,006 f 750 8,290 f 530 9,480 f 290 4,150 f 260 4,400 f 130 1,250 f 150 1,550 f 70 2,660 f 340 2,950 i 140
-
lamolesjg liner, dry weight
16,900 f 520 1,370 f 67 1,340 f 79
538 i 54 120 f 17
1,140 f 95 79 i 9
919 f 66 38 f 3 42 f 5
231 f 23 13,800 f 670 9,240 f 410 4,220 i 240 1,450 f 140
9,970 f 706 1,020 f 120 1,080 f 190
590 f 68 119 * 28
1,090 f 60 82 f 13
620 f 110 36 f 5
203 f 18 12,990 f 830
16,500 f 350 1,250 f 140
710 i 59 1,660 f 170
550 f 50 3,430 f 300
144 f 12 2,400 i 450
96 z!z 8 130 f 18 457 f 30
24,200 f 1400 9,100 ZlY 480 4,229 f 210 1,640 f 130
= Under the conditions of these experiments, the glucose concentrations indicate the relative rates of gluconeogenesis.
earlier (5), except that the mixture of powder with HClOd was homogenized at 0’ in a glass homogenizer before neutralization with 5 M K&03. The neutralized extracts were analyzed for ATP (15), AMP, and ADP (16), pyruvate, P-pyruvate, 2-P- glycerate, and 3-P-glycerate (17), glucose-6-P, fructose-6-P, L-lactate, n-malate, and glycerol-l-P (18), dihydroxyacetone-P and fructose-l ,6di-P (19), and glucose (20). In some experi- ments, part of the frozen liver powder was used for the deter- mination of inorganic phosphate (21).
Enzymes used in the determinations were of analytical grade from Boehringer. Coenzymes were from Sigma. Glucagon, epinepbrine, and cyclic AMP solutions were prepared as de- scribed previously (10).
Values are expressed as means f standard error of the mean and are given per g, dry weight, of perfused liver, The signifi- cance of differences between means was determined with the Student t test.
RESULTS
Levels of Gluconeogenk Intermediaks in Livers Perfused with Recirculating Medium-Livers from fasted rats perfused for 1 hour with recirculating medium containing no added substrate produced a small amount of glucose and had low concentrations of gluconeogenic intermediates (Table I). With 10 rnM n-lactate, there was a 4-fold increase in the rate of glucose production. This was accompanied by substantial increases in all of the intermediates but the concentrations of adenine nucleotides and inorganic phosphate were not changed (Table I). The values for metabolite levels were similar to those reported by Krebs in livers perfused under similar conditions (9). No
changes in the ATP-ADP and ATP-AMP ratios were observed with lactate (cf. Reference 8). Increasing the level of L-lactate in the medium to 20 or 30 mM increased further the tissue levels of lactate, pyruvate, and malate but did not change the levels of other intermediates or the rate of glucose synthesis (Fig. 1). The lactate-pyruvate ratio was increased at the higher levels of lactate but the adenine nucleotide concentrations were unaltered (Table I). As discussed below, these results are consistent with a rate-limiting step for lactate gluconeogenesis between pyruvate and P-pyruvate. With 20 mu pyruvate, the rate of glucose production and the concentrations of tissue intermediates were similar to those seen with 20 mM lactate except that pyruvate and lactate were lower, indicating greater utilization of pyruvate by other pathways (see Table IV in Reference 5) (Table I). In livers perfused with either substrate, the final lactate-pyruvate ratio was close to the value in viva of 10. These results indicate that, with saturating levels of substrate, the rate of gluconeo- genesis is largely independent of the lactate-pyruvate ratio of the medium and that the liver acts to restore this ratio to the physiological range.
The rate of glucose production and the tissue levels of all intermediates except malate were higher in livers perfused with fructose than with lactate or pyruvate (Table I). The glucose- 6-P-fructose-l, 6-di-P ratio and the levels of adenine nucleotides were not significantly different with the two substrates.1 It therefore seems that the fructose diphosphatase reaction does
1 Perfusion with a higher concentration (40 mM) of fructose caused a decrease of 409r, in the total liver adenine nucleotides but did not alter the ATP-ADP or ATP-AMP ratio. A similar effect has been observed in vivo (22).
by guest on August 16, 2019
http://ww
w.jbc.org/
Dow
nloaded from

1426 Control of Gluconeogenesis in Liver. III Vol. 244, No. 6
not limit maximum gluconeogenesis from fructose and that, with lactate or fructose, the supply of ATP is adequate for the needs of glucose synthesis.
Levels of Glwloneogenic Intermediates in Livers Perfused with Nonrecirculating Me&urn-Livers from fasted rats perfused with nonrecirculating medium containing no added substrate produced glucose at a high rate initially which rapidly declined to a steady low rate. Levels of gluconeogenic intermediates
w 700 2 t; 3 600
1 = I S.E.M. 1
ZE f 5oo /30mM LACTATE (4)
Li 5 300
20mM LACTATE (91
k
0’1 ’ ’ ’ ’ ’ ’ ’ ’ ’ ’ ’ LAC MAL 2PG DHAP FDP G6P
PYR PEP 3PG GLYP F6P GLU FIQ. 1. Levels of intermediates in livers from fasted rats per-
fused for 1 hour with 20 and 30 mu L-lactate plotted as percentages of levels with 10 mu L-lactate. Control values are given in Table I. LAC, lactate; PYR, pyruvate; MAL, malate; PEP, P-pyru- vate; ZPG, 2-P-glycerate; dPG, 3-P-glycerate; DHAP, dihydroxy- acetone-P; GLYP, glycerol-l-P; FDP, fructose-1,6-di9; F6P, fructose-6-P; G6P, glucose-6-P; GLU, glucose. The numbers of livers are given in parentheses.
in such livers perfused for 16 to 18 min were similar to those found in livers perfused with unsupplemented recirculating medium except that lactate, malate, and glycerol-l-P were increased, reflecting a higher reduction state of cytoplasmic NAD (Table II compared with Table I). Addition to the medium of low concentrations of L-lactate and pyruvate in a molar ratio of 10: 1 caused increases in the rate of glucose produc- tion (Fig. 2) and in the tissue levels of all intermediates (Table II and Fig. 3). Increasing the concentrations of lactate and pyruvate in the medium above 3 mu and 0.3 mu, respectively, raised the tissue lactate, pyruvate, and malate levels further but did not elevate other intermediates or change significantly the rate of glucose formation (Figs. 2 and 3). These changes
I I I I I
2 4 6 8 IO 1
PYRUVATE 0.2 0.4 0.6 0.8 I.0
CONCENTRATION,mM
FIG. 2. Glucose production plotted as a function of the concen- trations of lactate plus pyruvate. Livers from fasted rats were perfused without recirculation for 18 min with medium containing dierent concentrations of lactate plus pyruvate in a molar ratio of 1O:l.
TABLE II Levels of intermediates in livers perfused with nonrecirculating medium containing lactate and pyruvate
Livers from 107- to 139-g rats fasted for 18 to 22 hours were perfused for 18 min with nonrecirculating medium containing L-lactate and pyruvate at the concentrations noted.
Lactate (mhr). . . . . Pyruvate (mM) . . . . .
No. of livers.. 11 I
Lactate................ 3,050 f 54 Pyruvate. . .
19,630 f 1,310 77 f 9 262 f 46
Malate................ 1,800 f 110 4,770 f 660 P-Pyruvate. . 99 f 14 199 f 35 3-P-Glycerate.. . . . . 145 f 21 371 f 62 Dihydroxyacetone-P. 36 f 2 67 f 9 Glycerol-l-P. 3,490 f 360 Fructose-di-P
4,650 f 410 19 f 1 27 f 4
Glucose-6-P. . . 73 f 7 162 & 17 Glucosea. . 560 f 105
I I 1 I 2,610 f 480
a Under the conditions of these experiments, the glucose concentrations indicate the relative rates of gluconeogenesis.
9 mwles
10,110 f 1,400 163 i 21
3,450 f 150 151 i 14 260 f 58
49 f 2 4,160 f 470
26 f 3 166 f 11
2,240 f 160
/g liver, dry weight
26,300 f 1,800 401 f 51
4,350 f 340 191 f 19 357 f 50
64f4 5,180 f 460
35 i 4 187 i 23
2,710 zk 260
6
by guest on August 16, 2019
http://ww
w.jbc.org/
Dow
nloaded from
Issue of March 25, 1969 J. H. Exton and C. R. Park 1427
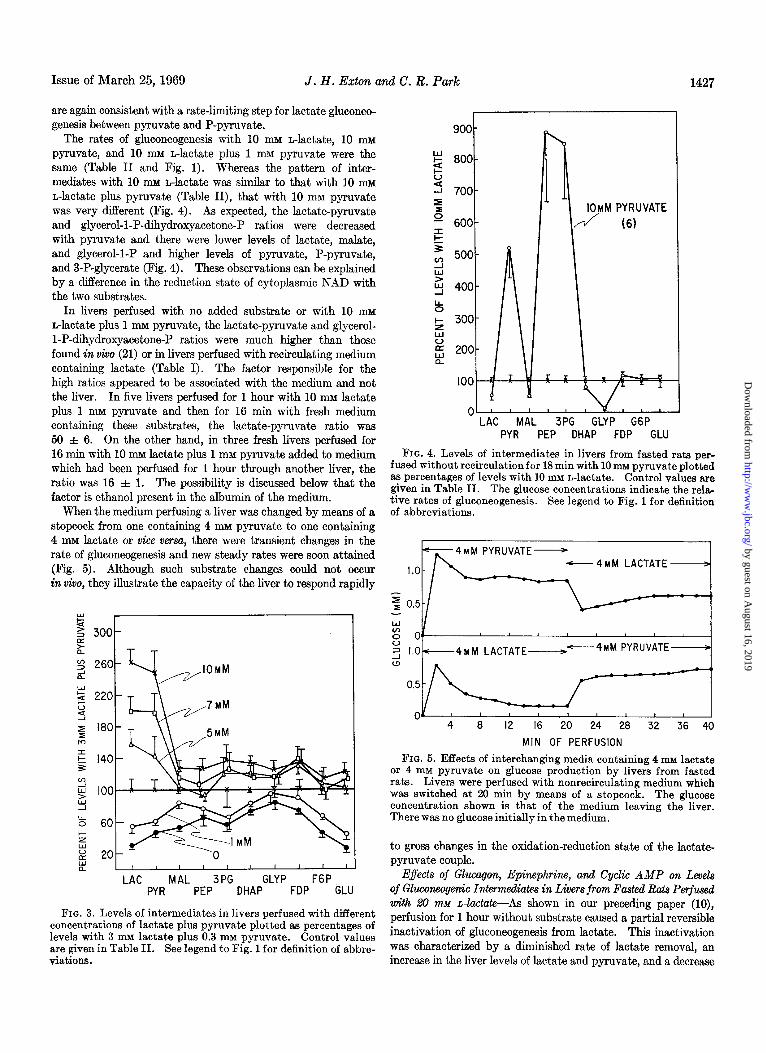
are again consistent with a rate-limiting step for lactate gluconeo- genesis between pyruvate and P-pyruvate.
The rates of gluconeogenesis with 10 mu n-lactate, 10 mu pyruvate, and 10 mu n-lactate plus 1 mu pyruvate were the same (Table II and Fig. 1). Whereas the pattern of inter- mediates with 10 mu n-lactate was similar to that with 10 mu n-lactate plus pyruvate (Table II), that with 10 mM pyruvate was very different (Fig. 4). As expected, the lactate-pyruvate and glycerol-1-P-dihydroxyacetone-P ratios were decreased with pyruvate and there were lower levels of lactate, malate, and glycerol-l-P and higher levels of pyruvate, P-pyruvate, and 3-P-glycerate (Fig. 4). These observations can be explained by a difference in the reduction state of cytoplasmic NAD with the two substrates.
In livers perfused with no added substrate or with 10 mu n-lactate plus 1 mu pyruvate, the lactate-pyruvate and glycerol- 1-P-dihydroxyacetone-P ratios were much higher than those found in vivo (21) or in livers perfused with recirculating medium containing lactate (Table I). The factor responsible for the high ratios appeared to be associated with the medium and not the liver. In five livers perfused for 1 hour with 10 mu lactate plus 1 mM pyruvate and then for 16 min with fresh medium containing these substrates, the lactate-pyruvate ratio was 50 & 6. On the other hand, in three fresh livers perfused for 16 min with 10 mu lactate plus 1 mM pyruvate added to medium which had been perfused for 1 hour through another liver, the ratio was 16 f 1. The possibility is discussed below that the factor is ethanol present in the albumin of the medium.
When the medium perfusing a liver was changed by means of a stopcock from one containing 4 mu pyruvate to one containing 4 mM lactate or vice versa, there were transient changes in the rate of gluconeogenesis and new steady rates were soon attained (Fig. 5). Although such substrate changes could not occur in viva, they illustrate the capacity of the liver to respond rapidly
260
Y /-‘OMM
180
60
+ 7t4M
II LAC MAL 3PG GLYP F6P
PYR PEP DHAP FDP GLU
FIQ. 3. Levels of intermediates in livers perfused with different concentrations of lactate plus pyruvate plotted as percentages of levels with 3 mu lactate plus 0.3 IMI pyruvate. Control values are given in Table II. See legend to Fig. 1 for definition of abbre- viations.
LAC MAL 3PG GLYP G6P PYR PEP DHAP FDP GLU
FIG. 4. Levels of intermediates in livers from fasted rats per- fused without recirculation for 18 min with 10 mM pyruvate plotted as percentages of levels with 10 mu n-lactate. Control values are given in Table II. The glucose concentrations indicate the rela- tive rates of gluconeogenesis. See legend to Fig. 1 for definition of abbreviations.
-~MM PYRUVATE- --MM LACTATE z
-44M PYRUVATE 2 l.O-~MM LACTATE- >
01 I I I I I 4 8 12 16 20 24 28 32 36 40
MIN. OF PERFUSION
FIG. 5. Effects of interchanging media containing 4 mM lactate or 4 mM pyruvate on glucose production by livers from fasted rats. Livers were perfused with nonrecirculating medium which was switched at 20 min by means of a stopcock. The glucose concentration shown is that of the medium leaving the liver. There was no glucose initially in the medium.
to gross changes in the oxidation-reduction state of the lactate- pyruvate couple.
Effects of Glucagon, Epinephrine, and Cyclic AMP on Levels of Gluconeogenic Intermediates in Livers from Fasted Rats Perfused with 20 rnM &rctate--As shown in our preceding paper (lo), perfusion for 1 hour without substrate caused a partial reversible inactivation of gluconeogenesis from lactate. This inactivation was characterized by a diminished rate of lactate removal, an increase in the liver levels of lactate and pyruvate, and a decrease
by guest on August 16, 2019
http://ww
w.jbc.org/
Dow
nloaded from

1428 Control of Gluconeogenesis in Liver. III Vol. 244, No. 6
g 180
E PRE-PERFUSED LIVER
5 140
II I 1; t 8 1 " LAC MAL 2PG 'DHAP FDP
PYR PEP 3PG GLYP G6P
FIG. 6. Effects of preliminary perfusion on gluconeogenic inter- mediates in fasted rats. Levels of intermediates in livers per- fused for 1 hour without substrate and then for 1 hour with 20 mu lactate plotted as percentages of levels in livers perfused for 1 hour with 26 rnr+r lactate. Control values are given in Table I. Seelegend to Fig. 1 for definition of abbreviations.
300 EPINEPHRINE
47--- (9)
:YcLIc I AMP T 200
150
100 I h/
250
50ty I I I I I I I f 1 ”
LAC MAL 2PG DHAP FDP GLU PYR PEP 3PG GLYP G6P
FIG. 7. Effects of glueagon, epinephrine, and cyclic AMP on levels of intermediates in previously perfused livers from fasted rats. Intermediates were determined in livers perfused for 1 hour without substrate and then for 1 hour with 20 mu lactate. Con- centrations of additions were: glucagon, 1 X 10-S M; epinephrine, 1 X 10-G M; and cyclic AMP, 1 X 10m3 M. Control values in nmoles per g of dry weight are: lactate @AC), 31,200; pyruvate (PYR), 2,010; malate (MAL), 1,510; P-pyruvate (PEP), 290; 2-P-glycerate (WG), 80; 3-P-glycerate @PG), 726; dihydroxyacetone-P (DHAP), 66; glycerol-l-P (GLYP), 770; fructose-1,6-di-P (FDP), 32; glucose-6-P (GW), 167; glucose (GLU), 13,800.
in the concentrations of P-pyruvate and subsequent inter- mediates in the pathway to glucose2 (Fig. 6). The changes in
x Although preliminary perfusion reduced gluconeogenesis from lactate by 67% (lo), the tissue glucose levels did not accu- rately reflect this since, in the experiments with preperfused liver, larger rats were used and measurements were made after 120 min of perfusion compared with 60 min for the controls.
intermediates indicated that the step inactivated lay between pyruvate and P-pyruvate. Addition of 1 x 10-a M glucagon, 1 X lo-’ M epinephrine, and 1 MM cyclic AMP at 60 min restored the rate of gluconeogenesis. All three agents stimulated lactate utilization, decreased tissue levels of lactate and pyruvate, and increased P-pyruvate, 2-P-glycerate, 3-P-glycerate, and glucose- 6-P (Fig. 7). There were smaller changes of questionable significance in the levels of the other intermediates and no in- creases in the lactate-pyruvate or glycerol-1-P-dihydroxyace- tone-P ratios. With glucagon and cyclic AMP, the “crossover point” in the metabolite profile was between pyruvate and P-pyruvate, whereas with epinephrine it was between malate and P-pyruvate.
A similar pattern of changes in the levels of intermediates was seen when glucagon was added at the start of a perfusion although the increase in glucose production was much smaller than when the hormone was added to livers previously perfused for 1 hour (Fig. 8). The metabolite changes produced by
LAC MA1 2PG DHAP FDP GLU PYR PEP 3PG GLYP G6P
FIG. 8. Effects of glucagon on intermediates in nonpreviously perfused livers. Levels in livers from fasted rats perfused with 20 mu lactate plus 1 X 10-E M glucagon plotted as percentages of those in livers perfused with 20 mM lactate. Control values are given in Table I. See legend to Fig. 1 for definition of abbrevia- tions.
TABLE III Effects of glucagon on fructose and dihydroxyacetone metabolism
in perfused livers Livers from NO- to 140-g rats fasted for 18 to 22 hours were used.
In experimental Series A, they were perfused for 1 hour without substrate and then for 1 hour with 30 mu fructose or 40 mM dihy- droxyacetone; in Series B, they were perfused for 1 hour with 30 loll fructose. Glucagon was infused at the rate of 4 nmoles per hour.
Series and substrate Gluca- CPn
A. Fructose.. . . . . . . . - A. Fructose.. . . . . . . . . . . . + A. Dihydroxyacetone . . . - A. Dihydroxyacetone . . . . . + B. Fructose.. . . . . . . . . . . . . - B. Fructose.. . . . +
I I
pmoles/g liw/hr
92 f 4 44 f 2 22 f 2 111 f 8 42 f 7 3 f 1 101 f 1022 f 320 f 3 122 f 10 22 zt 3 2 f 1 101 zk 8 55 f 2 11 f 1 121*1049*4 2fl
by guest on August 16, 2019
http://ww
w.jbc.org/
Dow
nloaded from

Issue of March 25, 1969 J. H. Exton and C. R. Park 1429
glucagon in livers perfused without recirculation with medium containing 20 IDA lactate were also similar to those seen with recirculating medium but were of borderline significance in most cases (data not shown).
E$ects of Glucqon on Lactate Production in Livers from Fasted Rats Perfused with Fructose OT Dihgdroxgacetone--In agreement with earlier findings (lo), glucose production from fructose and dihydroxyacetone in livers from fasted rats was not reduced by prior perfusion of livers from fasted rats for 1 hour without substrate. Under these conditions, glucagon did not affect gluconeogenesis (glucose plus glycogen) or lactate production.
LAC MAL 2PG DHAP FDP GLU PYR PEP 3PG GLYP G6P
FIG. 9. Effects of feeding on intermediates in livers perfused for 1 hour with 20 mu lactate. Intermediate levels in livers from rats fed ad Zibitum plotted as percentages of those in livers from rats fasted for 18 to 22 hours. Control values are given in Table I. See legend to Fig. 1 for definition of abbreviations.
100
50""""""' LAC MAL 2PG DHAP FDP GLU
PYR PEP 3PG GLYP G6P
FIG. 10. Effects of glucagon and epinephrine in livers from fed rats. Levels of intermediates in livers perfused with 20 mM lac- tate plus 1 X 10-a M glucagon or 1 X lo+ M epinephrine plotted as percentages of those in livers perfused with 20 mM lactate. Control values in nmoles per g of dry weight are: lactate (UC), 21,500; pyruvate (PYR), 1,520; malate (&ML), 1,670; P-pyruvate (PEP), 417; 2-P-glycerate @PC), 107; 3-P-glycerate @PG), 909; dihydroxyacetone-P @HAP), 68; glycerol-l-P (GLYP), 933; fructose-1,6-di-P (FDP), 33; glucose-6-P (GW), 302; glucose (GLU), 17,600.
There was, however, a small stimulation of glucose production which could be attributed to glycogenolysis (Table III). Gluca- gon was also without effect on gluconeogenesis or lactate produc- tion from fructose added at the start of the perfusion (Table III).
Effects of Glumgon and Epinephrine on Levels of Gluconcogenic Intermediates in Livers from Fed Rats Perfused with Lactate- Livers from fed rats perfused with 20 mu n-lactate had higher levels of lactate, pyruvate, malate, glucose-6-P, and glucose and lower levels of P-pyruvate and 3-P-glycerate than similarly perfused livers from fasted rats (Fig. 9). These changes reflect a higher rate of glucose production, due to glycogenolysis, and a lower rate of gluconeogenesis, due to slowing of the conversion of pyruvate to P-pyruvate. In fed livers, glucagon and epineph- rine produced very similar changes to those in fasted livers but the increases in glucose and glucose-6-P were more marked as a result of glycogenolysis (Fig. 10). In these experiments the concentration of epinepbrine was such that the stimulation of glucose production was not maximal for the entire perfusion period. Consequently, the changes with epinephrine were not as marked as with glucagon.
DISCUSSION
IdentiJication of Control Points in Gluconeogenesis-In general terms, gluconeogenesis is regulated by hormones, neurosecretions, and other factors which act, first, on the peripheral tissues to control the release of substrates for glucose production and, second, on the liver itself to affect the extraction of these sub- strates and their conversion to glucose. Some agents, e.g. cortisol and insulin, appear to affect both the liver and the periphery whereas others, e.g. glucagon, affect only the liver. Since the release processes for many substrates, including the amino acids, are reversible, stimulation of hepatic uptake may indirectly promote release by lowering the levels of the substrates in the plasma. In this way the effects of agents acting primarily on the liver can affect secondarily the substrate supply.
Several approaches have been taken in attempts to identify control points in gluconeogenesis at the hepatic level. First, the activities of enzymes in the pathway have been assayed in liver homogenates on the postulate that the lowest activities would limit the rate of substrate flow. The lowest activities have been found to be those of fructose 1,6-diphosphatase, glucose 6-phosphatase, aldolase, enolase, pyruvate carboxylase, and P-pyruvate carboxykinase (23, 24). The activities ob- served are nevertheless higher than those necessary to support the rates of gluconeogenesis observed in vivo or in the intact tissue in vitro. This discrepancy reflects the major difficulty of this approach. The assays are carried out under near optimal conditions whereas the enzymes operate in vivo in restricted regions of the cell under generally suboptimal substrate concen- trations, pH, and ionic strength, and in the presence of various incompletely known activators and inhibitors.
In a second approach, the control of glucose production has been studied in homogenates of pigeon liver (25-28). Produc- tion appears to be controlled principally by P-fructokinase, fructose diphosphatase, and glyceraldehyde-P dehydrogenase. Many results with this preparation, however, seem not to apply to control of gluconeogenesis in rat liver in vivo or in vitro (28). The discrepancies may be due to species differences in part, but, more importantly, to loss of physiological control mechanisms upon disruption of the cells.
A third approach has been to measure the rate of gluconeogene-
by guest on August 16, 2019
http://ww
w.jbc.org/
Dow
nloaded from

1430 Control of Gluconeogenesis in Liver. II1 Vol. 244, No. 6
sis from substrates entering the pathway at different levels. This has been applied to pigeon liver homogenates (29), mouse and rat liver slices (30,31), and the perfused rat liver preparation (1, 5, 8, 9), but the results with pigeon liver homogenates again differ from those seen with the other preparations. Although the method is limited by such considerations as the low permea- bility of intact cells to some key intermediates, it has neverthe- less permitted some conclusions to be drawn regarding the site of the limiting reaction. The gluconeogenic pathway in rat liver involves both intra- and extramitochondrial reactions. Pyruvate carboxylase (EC 6.4.1.1) which catalyzes the con- version of pyruvate to oxalacetate is located for the most part in the mitochondria (32-34), whereas P-pyruvate carboxykinase (EC 4.1.1.32), which converts oxalacetate to P-pyruvate, is present almost exclusively in the cytoplasm (35). According to Lardy (3638), Haynes (39), and Krebs (40) oxalacetate penetrates liver mitochondrial membranes very slowly and must be converted to aspartate, malate, or fumarate which pass through the mitochondrial membrane more rapidly and are reconverted to oxalacetate in the cytosol.
In our present and earlier studies (1, 5) and in that of Ross, Hems, and Krebs (9) with a perfused rat liver preparation, the maximum rates of glucose production from fructose and dihy- droxyacetone are substantially higher than from pyruvate and lactate. Since fructose enters the pathway at various points above P-pyruvate3 and dihydroxyacetone through triose-P, the step (steps) which limit maximum gluconeogenesis from pyruvate and lactate must lie before triose-P. Ross et al. (9) have ob- served that oxalacetate gives a rate of glucose formation which is no faster than from lactate or pyruvate, a finding which would appear to localize the limiting step to a reaction between oxalace- tate and triose-P. This interpretation appears questionable, however, since utilization of exogenous oxalacetate, like that of other citric acid intermediates, may be limited by permea- bility of the plasma membrane (5, 10). Pyruvate and lactate, by contrast, enter hepatic cells with great rapidity (5).
A fourth approach to the problem of identifying the rate- limiting steps in gluconeogenesis involves measurement of the levels of intermediates in the tissue at various saturating con-
3 There is some disagreement about the manner in which fruc- tose is converted to glucose in the liver. According to Cori, Hers, Leuthardt, Lamprecht, and others (6, 7, 41-43) n-fructose is phosphorylated by fru&okinase (41, 42) to n-fructose-l-P which is cleaved by ketose-1-P aldolase (43, 44) to n-glyceraldehyde and dihydroxyacetone-P. The glyceraldehyde is then converted to triose-P in various ways (6, 7, 43, 45-50) and the two 3-carbon fraaments are condensed bv aldolase to fructose-1.6-di-P which is converted to glucose by fructose diphosphatase, hexose-P isomerase, and glucose-6-phosphatase. Although hexokinase is present in rat liver in low activity (relative to other tissues), Di Pietro has suggested that fructose can react with this enzyme to yield glucose more directly (51). Although the distribution of isotope in glucose produced by intravenous or intraportal injection of variously labeled fructose in vivo is consistent with the metabo- lism of fructose mainly by a pathway involving cleavage (6, 7, 5%55), it is possible that part of the hexose may be utilized via hexokinase. The high rate of lactate production and the levels of intermediates in livers perfused with fructose (Tables I and III) support the view that a large fraction of the hexose is cleaved. Furthermore, fructose utilization by hexokinase would be ex- pected to be low in the presence of glucose which has a higher affinity for the enzyme (41, 56). Presumably dihydroxyacetone reacts with glycerol kinase to yield dihydroxyacetone-P directly (57).
centrations of substrate. An increase in substrate concentration under these conditions should cause elevations in the levels of intermediates prior to the rate-limiting step and no change in subsequent intermediates. On this basis, the rate-limiting reaction for lactate gluconeogenesis lies in the sequence of steps between pyruvate and P-pyruvate (Fig. 1). It is not possible, however, to pinpoint a specific reaction from these results. The rise in the level of malate with 20 or 30 mu lactate in the perfu- sion medium probably reflects a higher reduction state of extra- mitochondrial NAD, as indicated by the higher lactate-pyruvate ratios, and not a block in malate or oxalacetate utilization. Along the same lines, the experiments in Fig. 3 with lactate and pyruvate in a ratio of 1O:l are of better design. With noncirculation of the medium, the substrate concentration remains constant; the system operates therefore in a more nearly steady state and the tissue lactate-pyruvate and glycerol-l-P- dihydroxyacetone-P ratios are relatively constant at all sub- strate levels. In these experiments, if the extramitochondrial malate-oxalacetate ratio also remains constant, as seems likely, the failure of malate to rise eliminates the P-pyruvate carboxy- kinase reaction as the primary limiting step for maximum gluconeogenesis. Pyruvate carboxylase, or possibly a mito- chondrial transfer reaction, would therefore be the most likely restricting reaction.4
4 Present techniques for the extraction of intermediates from whole tissues involve destruction of cellular and intracellular barriers and may obscure important differences in concentrations of metabolites in different cell types and intracellular structures. Since gluconeogenesis appears to be a function of the parenchymal cells, which make up 60 to 70% of the liver mass, cell heterogeneity is probably not an important complication in the present study. However, compartmentation of metabolites in subcellular organ- elles may present difliculties since gluconeogenesis in rat liver involves the transfer of metabolites between cytoplasm and mitochondria and there are probably marked differences between the intra- and extramitochondrial concentrations of many metab- olites (36-40, 58-60). We feel, however, that considerations relating to compartmentation should not invalidate our conclu- sions about the rate-limiting step for maximum lactate gluconeo- genesis for the following reasons. (a) The intermediates in the gluconeogenic pathway between P-pyruvate and glucose and the enzymes involved in their metabolism appear to be located only in the extramitochondrial compartment. Since the rate of gluconeo- genesis from lactate is much greater than the rate of glycolysis or the hexose monophosphate pathway, alterations in the tissue levels of these intermediates probably reflect mainly changes in the rate of gluconeogenesis. (6) Lactate and glucose are located in both the extracellular and extramitochondrial compartments but no differences between the tissue and perfusate plasma concen- trations of these compounds were detected in the present study (see Reference 61). (c) The oxidation-reduction states of the intra- and extramitochondrial NAD+-NADH couples appear to be major determinants of the distribution of many intermediates such as malate and oxalacetate between mitochondria and cytosol (21, 58, 60, 62, 63). Many studies (64-67) have indicated that the perfused liver has potent mechanisms for maintaining constant lactate-pyruvate and o-hydroxybutyrate-acetoacetate ratios in the perfusion medium. The constancy of these ratios indicates a stability of the NADH-NAD+ ratios of the cytosol and mitochon- dria. In the exneriments of Fig. 3 in which livers were perfused with steady levels of lactate and pyruvate in a fixed molar ratio, it seems reasonable to assume that the oxidation-reduction states of the two NAD+-NADH systems were constant. Accordingly, the failure of malate to increase with increasing concentrations of substrate seems to indicate a limitation of the intramitochondrial formation of oxalacetate. It seems improbable that the reduction of oxalacetate to malate was limiting in view of the high activity
by guest on August 16, 2019
http://ww
w.jbc.org/
Dow
nloaded from

Issue of March 25, 1969 J. H. Exton and C. R. Park 1431
Independence of Gluconeogenmis from Lactate-Pyruvate Ratb- ‘The same rate of gluconeogenesis is achieved with saturating levels of lactate or pyruvate in both the recirculating and non- recirculating perfusion systems, indicating that maximum gluconeogenesis is largely independent of the lactate-pyruvate ratio of the medium and that neither the supply of NADH nor that of NAD+ is limiting under these conditions. In livers perfused for 1 hour with recirculating medium containing 20 mM pyruvate, the rapid production and release of lactate into the medium constitute a heavy drain on NADH. Nevertheless, mitochondrial NADH remains sufhcient for ATP generation and extramitochondrial NADH is high enough to maintain flow through the glyceraldehyde-P dehydrogenase step. Further- more, there is progressive adjustment of the lactate-pyruvate ratio in the medium and tissues toward the physiological value of 10. The necessary NADH is generated largely under these conditions from oxidation of a fraction of the pyruvate utilized (5). With 30 mru lactate in the medium, the restoration of the lactate-pyruvate ratio to normal is slower. Any pyruvate formed from lactate is converted with high efficiency to glucose presumably because loss through the pyruvate dehydrogenase reaction is prevented by the high NADH-NAD+ ratio. The energy required for gluconeogenesis is supplied by oxidation of endogenous fatty acids which compete with pyruvate de- hydrogenase for CoA and NAD. Although there is no net requirement of NAD+ for gluconeogenesis from lactate, the supply of this cofactor is probably limited by the rate of ATP splitting through control of electron transfer.
In contrast to these results with saturating levels of substrate, at lower concentrations, gluconeogenesis from pyruvate is greater than from lactate, indicating that glucose synthesis from lactate is limited at the lactate dehydrogenase step. This is not surprising in view of the high K,,, of the enzyme for this substrate.
The high glycerol-1-P-dihydroxyacetone-P ratios in livers perfused with nonrecirculating medium containing no added substrate or with 10 mM lactate f 1 mu pyruvate indicate an unexpectedly high reduction state of extramitochondrial NAD. A similar pattern is also seen in the early phases of perfusions with recirculating medium containing lactate. The factor responsible is clearly present in the medium but appears to be removed during prolonged perfusion. Similar observations have been made by Dr. Roland Scholz and have been attributed by him to ethanol present in the albumin preparation used.6 This is also likely to be the factor involved in our experiments for the following reasons. (a) The albumin used was obtained by ethanol precipitation. (A contamination by weight of 0.201, would give a 1 mu solution in the medium.) (b) Ethanol has been shown to increase the lactate-pyruvate ratio in the perfused liver and in the liver in viva (65, 67-69). (c) Utilization or evaporation of ethanol during prolonged perfusion would account for the disappearance of the effect.
The possibility that ethanol might have limited gluconeogene- sis from lactate in the present experiments appears to be dis- counted by two facts. First, glucose production with saturating
of malate dehydrogenase in mitochondria (40). Since the concen- tration of malate in the mitochondria is probably higher than in the cytosol (66) it also seems unlikely that a rise in intramitochon- drial malate was obscured by a large unchanged concentration of extramitochondrial malate.
6 R. Scholz, personal communication.
concentrations of lactate remained linear for 1 hour despite a presumed decrease in the concentration of ethanol. Second, maximum gluconeogenesis from pyruvate was no faster than that from lactate.
In livers perfused with nonrecirculating medium, the differ- ences between the intermediate levels with pyruvate and lactate as substrate are consistent with a very marked shift in the reduc- tion state of NAD.s A crossover plot shows that the inter- mediates immediately prior to dihydroxyacetone-P are higher in the perfusion with pyruvate. This would suggest that the principal rate-limiting step was shifted to the level of glyceralde- hyde-P-dehydrogenase. Ross et al. (70) have reported that high levels of pyruvate become inhibitory to gluconeogenesis and the present experiment is compatible with the early develop- ment of a new metabolic block due, presumably, to NADH deficiency. An actual lowering of glucose production may have been prevented by ethanol contamination of the albumin as noted earlier. We would emphasize, however, that perfusion with a high level of pyruvate in a nonrecirculating system gen- erates an extreme demand for NADH. It seems very improba- ble that NADH generation would limit gluconeogenesis under any circumstance in tivo.
Although the decrease in gluconeogenesis observed when low concentrations of pyruvate are changed to lactate can be ascribed primarily to the high Km of lactate dehydrogenase for lactate, other factors exert transient effects. For example, the sudden shift in the reduction state of NAD induces diversion of carbon flow into the tissue pools of malate and glycerol-l-P, accentuating the fall in gluconeogenesis. When the pools approach a new equilibrium state, a gradual rise ensues. Presumably the lack of analogous transient effects on gluconeogenesis on changing from low levels of lactate to pyruvate is because the changes in metabolite pools are small in comparison to the increased rate of gluconeogenesis. At saturating levels of substrate, i.e. when there is little or no increase in the final rate of gluconeogenesis, a transient increase on changing from lactate to pyruvate does become apparent?
Site of Action of Glucagon on Gluconeogenesis-The similarity between the changes in tissue intermediates induced by glucagon, epinephrine, and cyclic AMP supports the view that the action of the hormones on gluconeogenesis is mediated by the nucleotide.
The most striking effect of glucagon on gluconeogenesis from lactate was observed in livers which had been perfused for 1 hour without substrate. In the 1st hour, inactivation of the gluconeo- genie process was associated with decreased utilization of lactate, elevated tissue levels of lactate and pyruvate, and decreased concentrations of intermediates between P-pyruvate and glucose. These findings point to a slowing of a reaction in the sequence between pyruvate and P-pyruvate. Although this region is the same as that in which the limiting reaction for maximum lactate gluconeogenesis is located, the two reactions are not necessarily identical. The changes in tissue metabolite levels produced by glucagon, epinephrine, and cyclic AMP produce a crossover point between pyruvate and P-pyruvate. This is associated with an accelerated rate of substrate flow, as reflected
6 Perfusion with lactate or pyruvate without recirculation exerts a particularly heavy stress on the supply of NAD+ or NADH since much of the hydrogen accepted or donated at the lactate dehydrogenase step is permanently lost into the medium by out- ward passage of the lactate or pyruvate formed.
7 Unpublished observations.
by guest on August 16, 2019
http://ww
w.jbc.org/
Dow
nloaded from

1432 Control of Gluconeogenesis in Liver. III Vol. 244, No. 6
by faster glucose synthesis, and therefore indicates activation of a reaction (or reactions) in the sequence between pyruvate and P-pyruvate. The levels of intermediates subsequent to P- pyruvate are in general elevated as expected with a higher rate of glucose production.* Although no other significant crossover points occur, the possible presence of other points of activation cannot be excluded. The significance, if any, of the differences between the levels of intermediates with epinephrine and gluca- gon and cyclic AMP is not known. Since glucagon did not affect glucose production from dihydroxyacetone or fructose, a physiologically meaningful stimulation of any reaction between triose-P and glucose seems unlikely. We have, in fact, failed to find any circumstance to date in which a change in enzyme activities at the levels of fructose diphosphatase and P-fructo- kinase or glucose-6-P and glucokinase plays any regulatory role in gluconeogenesis.
The mechanism of the above activation remains obscure. Ashmore, Wieland, Williamson, and others have proposed that the gluconeogenic effect of the hormone is secondary to activa- tion of a hepatic triglyceride lipase (71-76). The chief experi- mental support for this hypothesis is the demonstration that exogenous fatty acids can increase gluconeogenesis in the per- fused liver (66, 71, 77-79) and that glucagon produces changes consistent with increased fatty acid oxidation (71-75). As will be discussed in detail in a separate paper, this proposal appears to be inadequate to explain the action of glucagon. F’urther- more, the metabolite changes of the present study and those reported by Williamson (74, 75) are not consistent with any of the proposed mechanisms for activation of gluconeogenesis by fatty acids. In particular, the reduced level of oxalacetate reported by Williamson (74, 75) does not support the hypothesis that gluconeogenesis is increased because of activation of pyru- vate carboxylase by an increased acetyl-CoA concentration. The association of a diminished oxaloacetate level with an elevated P-pyruvate concentration is more consistent with the activation of P-pyruvate carboxykinase. The elevated malate concentration observed by Williamson cannot be accepted as evidence of pyruvate carboxylase activation since there were simultaneous increases in the lactate-pyruvate and glycerol-l-P- dihydroxyacetone-P ratios reflecting a shift of the oxidation-
* An increased flow of substrate through a reaction in the face of a decreased substrate concentration indicates facilitation of the reaction (e.g. by changes in the concentration of cofactors or allosteric regulators) only when the product concentration is unchanged or increased. The association of an increased flow with an unchanged substrate concentration is similarly only significant when the product concentration is unchanged or elevated. This is because a decrease in product concentration (due to changes in a subsequent reaction) may lead to increased flow through a reaction because of diminished product inhibition or decreased reverse flow (if the reaction is reversible). It is not nossible to draw any conclusions from the differences in the magni- tude of the increases in intermediate levels induced by glucagon, eninenhrine. and cvclic AMP. This is because, for many of the enzymes involved, the relationship between substrate concentra- tion and reaction rate is nonlinear and very complex because of allosteric regulation. In short, the crossovers in the diagrams are the only points where interpretation is justified. With regard to the conversion of fructose-1,6-di-P to fructose-6-P, there is the added possibility that there may be substantial reverse flow through P-fructokinase so that a small increase in the forward (fructose diphosphatase) reaction may lead to a substantially greater increase in net hexose phosphate formation.
reduction potential of the cytoplasmic NAD system to a more negative value.
There is no evidence in the present study that glucagon facilitates the glyceraldehyde-P dehydrogenase step because of an increased supply of cytoplasmic NADH as suggested by Williamson in the case of gluconeogenesis from alanine. The observation that the effects of glucagon and ethanol on gluconeo- genesis from pyruvate are additive (10) is also not consistent with this suggestion.
The changes in metabolite levels clearly exclude the possibility that gluconeogenesis is increased merely because utilization of pyruvate by other pathways is spared. If this were the case, the tissue level of pyruvate would be expected to increase and utilization of lactate would decrease. It is possible, however, that there could be inhibition of oxidation of pyruvate coupled with simultaneous activation of gluconeogenesis.
The fact that glucose was synthesized in both control and treated livers in all of our experiments indicates that any recon- version of P-pyruvate to pyruvate by pyruvate kinase must be at a slower rate than formation of P-pyruvate. Nevertheless, it might be argued that the changes produced by glucagon, epinephrine, and cyclic AMP result from inhibition of pyruvate kinase rather than acceleration of P-pyruvate formation. This possibility is not supported, however, by the action of glucagon on fructose or dihydroxyacetone metabolism. The results of Table III indicate that fructose and dihydroxyacetone are rapidly converted to lactate by the perfused liver and glucagon produces little change. Substantial inhibition of lactate formation would have been expected if glucagon acted by inhibiting pyruvate kinase.
Acknowledgments-We wish to thank T. B. Miller, Jr., J. G. Corbin, and J. P. Brineaux for their expert and conscientious technical assistance.
REFERENCES
1. EXTON, J. H., AND PARK, C. R., J. Biol. Chem., 240, PC955 (1965).
2. EXTON, J. H., AND PARK, C. R., Pharmacol. Rev., 18,181 (1966). 3. EXTON, J. H., JEFFERSON, L. S., JR., BUTCHER, R. W., AND
PARK, C. R., Amer. J. Med., 40,709 (1966). 4. EXTON, J. H., AND PARK, C. R., Fed. Proc., 24,537 (1965). 5. EXTON, J. H., AND PARK, C. R., J. Biol. Chem., 242, 2622
(1967). 6. HERS, H. G., Le m6tabolisme du fructose, Editions Arscia,
Brussels, 1957. 7. RAUSCHENBACH, P., AND LAMPRECHT, W., Hoppe-Seyler’s Z.
Physiol. Chem., 339, 277 (1964). 8. HEMS, R., Ross, B. D., BERRY, M. N., AND KREBS, H. A.,
Biochem. J., 101, 284 (1966). 9. Ross, B. D., HEMS, R., AND KREBS, H. A., Biochem. J., 102,
942 (1967). 10. EXTON, J. II., AND PARK, C. R., J. Biol. Chem., 243, 4189
(1968). 11. WOLLENBERGER, A., RISTAU, O., AND SCHOFFA, G., Pjluegers
Arch. Gesamte Phusiol. Menschen Tiere, 270,399 (1960). 12. W~LAAS, O., AND W~LAAS, E., J. Biol. Chem.,.187,769 (1950). 13. NEELY, J. R., LIEBERMEISTER, H., AND MORGAN, H. E., Amer.
J. Physiol., 212, 815 (1967). 14. LOWRY, 0. H., PASSONNEAU, J. V., HASSELBERGER, F. X., AND
SCHULZ, D. W., J. Biol. Chem.,239,18 (1964). 15. LAMPRECHT, W., AND TRAUTSCHOLD, I., in H. U. BERGMEYER
(Editor), Methods of enzymatic analysis, Academic Press, New York, 1963, p. 543.
by guest on August 16, 2019
http://ww
w.jbc.org/
Dow
nloaded from

Issue of March 25, 1969 J. H. Extm and C. R. Park
16.
17.
ADAM, H., in H. U. BERGMEYER (Editor), Methods of enzy- matic analysis, Academic Press, New York, 1963, p. 573.
CZOK, R., AND ECKERT, L., in H. U. BERGMEYER (Editor), Methods of enzymatic analysis, Academic Press, New York, 1963, p. 229.
18. HOHORST, H. J., in H. U. BERGMEYER (Editor), Methods of enzymatic anaZysis, Academic Press, New York, 1963, pp. 134, 215, 266, 328.
19. BUTCHER, T., AND HOHORST, H. J., in H. U. BERGMEYER (Edi- tor), Methods of enzymatic analysis, Academic Press, New York, 1963, p. 246.
20.
21.
22.
23.
24.
SLEIN, M. W., in H. U. BERGMEYER (Editor), Methods of enzymatic analysis, Academic Press, New York, 1963, p. 117.
HOHORST, H. J., KREUTZ, F. H., AND BUTCHER, T., Biochem. Z., 332, 18 (1959).
MHENPBH, P. H., RAIVIO, K. O., AND KEKOMXHI, M. P., Science,161, 1253 (1968).
VON FELLENBERG, R., EPPENBERGER, H., RICHTERICH, R., AND AEBI, H., Biochem. Z., 336,334 (1962).
WEBER, G., SINGHAL, R. L., STAMM, N. B., FISHER, E. A., AND MENTENDIEK, M. A., Advan. Enzyme Regul. Proc. Symp. Regul. Enzyme Activ. Syn. Norm. Neoplast. Tissues, 2, 1 (1964).
25. KREBS, H. A., Proc. Roy. Sot. Ser. B, Biol. Sci., 169, 545 (1964). 26. KREBS, H. A., AND HEMS, R., Biochem. J., 93,623 (1964). 27. GEVERS, W., AND KREBS, H. A., Biochem. J., 98,720 (1966). 28. GEVERS; W., Biochem. J., 103,141 (1967). 29. KREBS. H. A., DIERKS, C.. AND GASCOYNE, T., Biochem. J.,
30.
31.
32.
33.
34. 35.
36.
37.
E- 40: 41.
42.
43.
44.
45.
46.
93, li2 (1964). ’ ,
KREBS, H. A., NOTTON, B. M., AND HEMS, R., Biochem. J., 101, 607 (1966).
WAGLE, S. R., GASKINS, R. K., JACOBY, A., AND ASHMORE, J., 66. Life k’ci., 6; 655 (1966).
UTTER, M. F., AND KEECH, D. B., J. Biol. Chem., 236, PC17 (1960).
HENNING, H. V., SEIFFERT, I., AND SEUBERT, W., Biochim. Biophys. Acta, 77, 345 (1963).
FREEDMAN, A. D., AND KOHN, L., Science, 145,58 (1964). NORDLIE, R. C., AND LARDY, H. A., J. Biol. Chem., 238, 2259
(1963). LARDY, H. A., PAETKAU, V., AND WALTER, P., Proc. Nat.
Acad. Sci. U.S. A., 63,141O (1965). WALTER, P., PAETKAU, V., AND LARDY, H. A., J. Biol. Chem.,
241, 2523 (1966). SHRAGO, E., AND LARDY, H. A., J. Biol. Chem., 241,663 (1966). HAYNES, R. C., JR., J. Biol. Chem., 240,4103 (1965). HASLAM, J. M., AND KREBS, H. A., Biochem. J., 107,659 (1968). SLEIN, M. W., CORI, G. T., AND CORI, C. F., J. Biol. Chem.,
186, 763 (1950). CORI. G. T.. OCHOA. S.. SLEIN. M. W.. AND CORI, C. F., Bio- - ihi& Biobhys. Acta, i, 304 (1951). ’ LEUTHARDT, F., TESTA, E., AND WOLF, H. P., Helv. Chim.
Acta, 36, 227 (1953). LEUTHARDT, F., AND WOLF, H. P., Helv. Chim. Acta, 37, 1734
(1954). HERS, H. G., AND KUSAKA, T., Biochim. Biophys. Acta, 11,427
(1953). WOLF, H. P., AND LEUTHARDT, F., Helv. Chim. Acta, 36, 1463
(1953).
47.
48.
LAMPRECHT, W., DIAMANTSTEIN, T., HEINZ, F., AND BALDE, P., Hoppe-Seyler’s 2. Physiol. Chem., 316,97 (1959).
LAMPRECHT, W., AND HEINZ, F., Z. Naturjorsch., 136, 464 (1958).
49. HOLZER, H., AND HOLLDORF, A., Biochem. Z., 329,283 (1957). 50. HOLLDORF, A., HOLLDORF, C., SCHNEIDER, S., AND HOLZER, H.,
51. 52. 53. 54.
Z. Naturjorsch., 146, 229 (1959). DI PIETRO, D. L., J. Biol. Chem., 239,451 (1964). HERS, H. G.,J. Biol. Chem., 214,373 (1955). MUNTZ, J. A., AND VANKO, M., J. Biol. Chem., 237,3582 (1962). LANDAU, B. R., AND MERLEVEDE, W., J. Biol. Chem., 233,861
(1963). 55. MUNTZ, J. A., J. Biol. Chem., 243,2788 (1968). 56. SOLS, A., AND CRANE, R. K., J. Biol. Chem., 210,581(1954). 57. BUBLITZ, C., AND KENNEDY, E. P., J. Biol. Chem., 211, 951
(1954). 58. BORST, P., in P. KARLSON (Editor), Funktionelle und Mor-
phologische Organisation de; Zelle,. Springer-Verlag, Berlin, 1963, 13. 137.
AMOO&, J. E., Biochem. J.,70,718 (1958). WILLIAMSON, D. H., LUND, P., AND KREBS, H. A., Biochem. J.,
103, 514 (1967). WILLIAMS, T. F., EXTON, J. H., PARK, C. R., AND REGEN, D.
M., Amer. J. Physiol., 216,120O (1968). 61.
62. HOLZER, H., SCHULTZ, G., AND LYNEN, F., Biochem. Z., 323, 252 (1956).
63. B~~cHE&, T., AND KLINGENBERG, M., Angew. Chem. Int. Ed. Engl., 70, 552 (1958).
SCHIMASSEK, H., Biochem. Z., 336,468 (1963). FORSANDER, 0. A., RBIHH, N., SALASPURO, M., AND MBENPHH,
P. H., Biochem. J.. 94. 259 (1965).
64. 65.
S~LING,‘H. D., WILL&S, b., F&EDR&S, D., AND KLEINEKE, J., Eur. J. Biochem., 4,364 (1968).
KREISBERG, R. A., Diabetes, 16,784 (1967). KREBS, H. A., Advan. Enzyme Regul. Proc. Symp. Regul.
Enzyme Activ. Syn. Norm. Neoplast. Tissues, 6, in press. AMMON, H. P. T., AND ESTLER, C. J., Nature, 216,152 (1967). Ross, B. D., HEMS, R., FREEDLAND, R. A., AND KREBS, H. A.,
Biochem. J., 106, 869 (1967). STRUCK, E., ASHMORE, J., AND WIELAND, O., Biochem. Z., 343.
107 (1965). WILLIAMSON, J. R., WRIGHT, P. H., MALAISSE, W. J., AND
ABHMORE, J., Biochem. Biophys. Res. Commun., 24, 765 (1966).
WILLIAMSON, J. R., HERCZEG, B., COLES, H., AND DANISH, R., Biochem. Biophys. Res. Commun., 24,437 (1966).
WILLIAMSON, J. R., Biochem. J., 101, llc (1966). -
67. 68.
69. 70.
71.
72.
73.
74. 40. WILLIAMSON, J. R., Advan. Enzyme Regul. Proc. Symp. Regul.
Enzyme Activ. Syn. Norm. Neoplast. Tissues, 6,229 (1967). 76. BEWSHER, P. D., AND ASHMORE, J., Biochem. Biophys. Res.
Commun., 24, 431 (1966). 77. WILLIAMSON, J. R., KREISBERG, R. A., AND FELTS, P. W.,
Proc. Nat. Acad. Sci. U. S. A.. 66.247 (1966). 78. TEUFEL, H., MENAHAN, L. A.,‘SH~PP, j. C.; BBNING, S., AND
WIELAND, O., Eur. J. Biochem.,2,182 (1967). 79. HERRERA, M. G., KAMM, D., RUDERMANN, N., AND CAHILL, G.
F., JR., Advan. Enzyme Regul. Proc. Symp. Regul. Enzyme Activ. Syn. Norm. Neoplast Tissues,4,225 (1966).
by guest on August 16, 2019
http://ww
w.jbc.org/
Dow
nloaded from

J. H. Exton and C. R. ParkINTERMEDIATES IN THE PERFUSED RAT LIVER
ADENOSINE 3',5'-MONOPHOSPHATE ON GLUCONEOGENICPYRUVATE, FRUCTOSE, GLUCAGON, EPINEPHRINE, AND
Control of Gluconeogenesis in Liver: III. EFFECTS OF l-LACTATE,
1969, 244:1424-1433.J. Biol. Chem.
http://www.jbc.org/content/244/6/1424Access the most updated version of this article at
Alerts:
When a correction for this article is posted•
When this article is cited•
to choose from all of JBC's e-mail alertsClick here
http://www.jbc.org/content/244/6/1424.full.html#ref-list-1
This article cites 0 references, 0 of which can be accessed free at
by guest on August 16, 2019
http://ww
w.jbc.org/
Dow
nloaded from