Control of EVI-1 oncogene expression in metastatic breast ... · Control of EVI-1 oncogene...
13
See discussions, stats, and author profiles for this publication at: https://www.researchgate.net/publication/47701384 Control of EVI-1 oncogene expression in metastatic breast cancer cells through microRNA miR-22 Article in Oncogene · November 2010 DOI: 10.1038/onc.2010.510 · Source: PubMed CITATIONS 81 12 authors, including: Some of the authors of this publication are also working on these related projects: Breast cancer subtyping in Kenya View project Hitesh Appaiah Indiana University-Purdue University Indianapolis 36 PUBLICATIONS 540 CITATIONS SEE PROFILE Riesa Burnett University of Cincinnati 10 PUBLICATIONS 118 CITATIONS SEE PROFILE Rutika Mehta Roswell Park Cancer Institute 30 PUBLICATIONS 669 CITATIONS SEE PROFILE Sunil Badve Indiana University-Purdue University Indianapolis 434 PUBLICATIONS 13,875 CITATIONS SEE PROFILE All content following this page was uploaded by Rutika Mehta on 18 August 2016. The user has requested enhancement of the downloaded file.
Transcript of Control of EVI-1 oncogene expression in metastatic breast ... · Control of EVI-1 oncogene...

See discussions, stats, and author profiles for this publication at: https://www.researchgate.net/publication/47701384
Control of EVI-1 oncogene expression in metastatic breast cancer cells
through microRNA miR-22
Article in Oncogene · November 2010
DOI: 10.1038/onc.2010.510 · Source: PubMed
CITATIONS
81
12 authors, including:
Some of the authors of this publication are also working on these related projects:
Breast cancer subtyping in Kenya View project
Hitesh Appaiah
Indiana University-Purdue University Indianapolis
36 PUBLICATIONS 540 CITATIONS
SEE PROFILE
Riesa Burnett
University of Cincinnati
10 PUBLICATIONS 118 CITATIONS
SEE PROFILE
Rutika Mehta
Roswell Park Cancer Institute
30 PUBLICATIONS 669 CITATIONS
SEE PROFILE
Sunil Badve
Indiana University-Purdue University Indianapolis
434 PUBLICATIONS 13,875 CITATIONS
SEE PROFILE
All content following this page was uploaded by Rutika Mehta on 18 August 2016.
The user has requested enhancement of the downloaded file.
ORIGINAL ARTICLE
Control of EVI-1 oncogene expression in metastatic breast cancer cells
through microRNA miR-22
JB Patel1,8, HN Appaiah1,8, RM Burnett1, P Bhat-Nakshatri1, G Wang2, R Mehta3, S Badve3,MJ Thomson4, S Hammond5, P Steeg6, Y Liu2 and H Nakshatri1,7
1Department of Surgery, Indiana University School of Medicine, Indianapolis, IN, USA; 2Department of Medicine, Indiana UniversitySchool of Medicine, Indianapolis, IN, USA; 3Department of Pathology, Indiana University School of Medicine, Indianapolis, IN,USA; 4Department of Cancer Biology, Vanderbilt-Ingram Cancer Center, Vanderbilt University Medical School, Nashville, TN,USA; 5Department of Cell and Developmental Biology, Lineberger Comprehensive Cancer Center, University of North Carolina,Chapel Hill, NC, USA; 6Laboratory of Molecular Pharmacology, Center for Cancer Research National Cancer Institute, Bethesda,MD, USA and 7Department of Biochemistry and Molecular Biology, Indiana University School of Medicine, Indianapolis, IN, USA
Metastasis in breast cancer carries a disproportionatelyworse prognosis than localized primary disease. Toidentify microRNAs (miRNA) involved in metastasis,the expression of 254 miRNAs was measured across thefollowing cell lines using microarray analysis: MDA-MB-231 breast cancer cells, cells that grew as a tumor in themammary fat pad of nude mice (TMD-231), metastaticdisease to the lungs (LMD-231), bone (BMD-231) andadrenal gland (ADMD-231). A brain-seeking variant ofthis cell line (231-BR) was used additionally in validationstudies. Twenty miRNAs were upregulated and seven weredownregulated in metastatic cancer cells compared withTMD-231 cells. The expression of the tumor suppressormiRNAs let-7 and miR-22 was consistently downregulatedin metastatic cancer cells. These metastatic cells ex-pressed higher levels of putative/proven miR-22 targetoncogenes ERBB3, CDC25C and EVI-1. Introduction ofmiR-22 into cancer cells reduced the levels of ERBB3 andEVI-1 as well as phospho-AKT, an EVI-1 downstreamtarget. The miR-22 primary transcript is located in the50-untranslated region of an open reading frame C17orf91,and the promoter/enhancer of C17orf91 drives miR-22expression. We observed elevated C17orf91 expression innon-basal subtype compared with basal subtype breastcancers. In contrast, elevated expression of EVI-1 wasobserved in basal subtype and was associated with pooroutcome in estrogen receptor-negative breast cancerpatients. These results suggest that metastatic cancercells increase specific oncogenic signaling proteins throughdownregulation of miRNAs. Identifying such metastasis-specific oncogenic pathways may help to manipulatetumor behavior and aid in the design of more effectivetargeted therapies.Oncogene (2011) 30, 1290–1301; doi:10.1038/onc.2010.510;published online 8 November 2010
Keywords: breast cancer; metastasis; microRNA;miR-22; let-7
Introduction
Breast cancer metastasis is the dominant mechanismunderlying treatment failure and mortality (Steeg, 2006).Metastatic cancer cells have been shown to carry adistinct biological profile from that of primary tumorcells by displaying characteristics such as enhancedsurvival, motility, invasiveness and resistance to che-motherapy (Kang et al., 2003; Gupta et al., 2005).Investigating the extent to which metastatic cancer cellsdiffer from primary tumor cells with respect to geneexpression is a newly developing field. At the center ofthese investigations are microRNAs (miRNAs). Thesesmall non-coding RNAs are now thought to be one ofthe major regulators of gene expression (Nicoloso et al.,2009).
The role of miRNAs in cancer pathogenesis is tumorsubtype specific. Recent reports describe miRNAexpression patterns in breast cancer in relation tohormone receptor status (Mattie et al., 2006; Blenkironet al., 2007). For example, the expression of let-7 familymembers is lower in HER-2(ERBB2)-positive breastcancers compared with other cancer types. In total, 43miRNAs are expressed at a higher level in HER-2-positve breast cancers compared with HER-2-negativebreast cancers. Similarly, 43 miRNAs are expressed athigher levels in estrogen receptor a (ERa)-positivebreast cancers compared with ERa-negative breastcancers. Luminal type A breast cancers, which expressERa and correspond to a good prognostic subgroup,show elevated expression of miR-10a, miR-10b, miR-21,miR-126*, miR-130a, miR-31, miR-382, miR-152, miR-100, miR-99a, miR-30-a-3p, miR-30a-5p, miR-224,miR-214, let-7a, let-7b, let-7c, let-7f and miR-342.Estrogen regulates the expression of several of thesemiRNAs (Bhat-Nakshatri et al., 2009; Castellano et al.,2009; Maillot et al., 2009). Basal type of breast cancers,which are hormone receptor negative and correspond to
Received 6 May 2010; revised and accepted 30 September 2010;published online 8 November 2010
Correspondence: Dr H Nakshatri, Department of Surgery,Biochemistry, Molecular Biology, Indiana University School of Medicine,980 West Walnut Street C218E, Indianapolis, IN 46202, USA.E-mail: [email protected] authors contributed equally to this work.
Oncogene (2011) 30, 1290–1301& 2011 Macmillan Publishers Limited All rights reserved 0950-9232/11
www.nature.com/onc

a significantly worse prognostic subgroup, expresshigher levels of miR-150, miR-142-3p, miR-142-5p,miR-148a, miR-106a, miR-106b, miR-18a, miR-93,miR-155, miR-25, miR-187 and miR-135b. Interest-ingly, HER-2-positive tumors show a similar miRNAexpression profile to basal type tumors with theexceptions of miR-106a, miR-18a, miR-93, miR-155and miR-135b. However, none of these studies com-pared the miRNA expression pattern between primaryand metastatic tumors. Utilizing the highly aggressiveand basal type MDA-MB-231 (called MD-231 here-after) breast cancer cell line as a metastasis model, wecompared the miRNA expression profiles of parentalMD-231 cells, primary tumor cells (TMD-231) as well asmetastatic disease from the brain (231-BR), lung (LMD-231), adrenal (ADMD-231) and bone (BMD-231).Using microarray analysis, we found differential expres-sion of miRNAs between metastatic cell lines comparedwith the primary tumor. Most notable among miRNAs
that showed altered expression was miR-22, which wasdownregulated in the metastatic clones. We describe apattern of metastatic site-specific differential proteinexpression of predicted/proven targets of miR-22 anddescribe how reduced levels of miR-22 in metastatic cellscontribute to activation of oncogenic pathways.
Results
MiRNA expressionMiRNA expression profiling of the five cell linesincluding parental MD-231, primary tumor-derivedTMD-231, bone metastatic BMD-231, lung metastaticLMD-231 and adrenal metastatic ADMD-231 revealedsignificant differential expression between different celltypes (Figure 1a). The miRNA profile was similarbetween duplicate experiments (Figure 1b). Metastatic
LMD-231
TMD-231
106.83.60.4-2.8-6-9.2-15.6 -12.4-18.8
PC
#2
13.7
%
-17
-14.3
-11.6
-8.9
-6.2
-3.5
-0.8
1.9
4.6
7.3
10
PC #1 19.8%
MD-231
BMD-231ADMD-231
-1.9 0 1.9
+1.9-1.9 0
TMD-231
ADMD-231
LMD-231
BMD-231
BMD-231
MD-231MD
Samples
MD
MD
BMD
BMD
BMD
BMD
ADMD
ADMD
BMD
BMD
LMD
LMD
LMD
LMD
TMD
Figure 1 MicroRNA expression profile in parental (MD-231), tumor (TMD-231), bone metastatic (BMD-231), lung metastatic(LMD-231) and adrenal metastatic (ADMD-231) variants of MDA-MB-231 cells. (a) Heat map showing the expression pattern ofmicroRNAs in different cell types. (b) Principal component analysis (PCA) of microRNA expression profiles in different cell types.Each circle represents a cell type sample plotted based on their first three components (x, y and z axis in the plot). Samples are coloredaccording to the cell types. The figure clearly shows the similarity in microRNA expression between duplicate samples.
Breast cancer metastasisJB Patel et al
1291
Oncogene
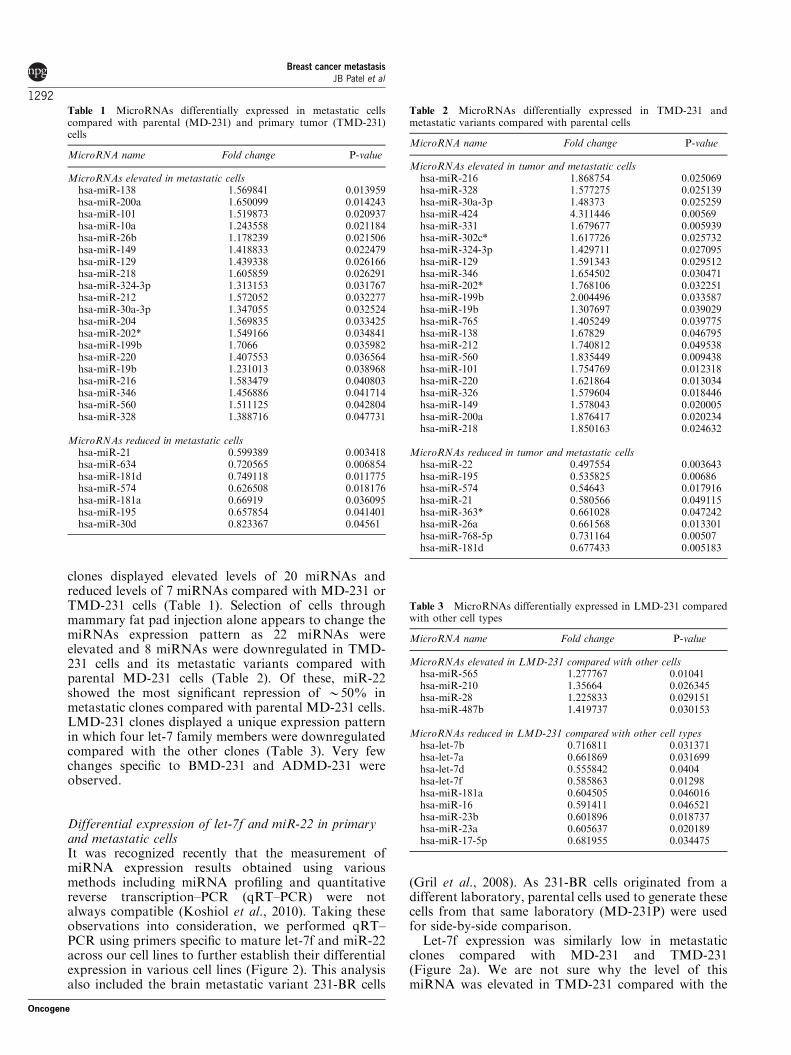
clones displayed elevated levels of 20 miRNAs andreduced levels of 7 miRNAs compared with MD-231 orTMD-231 cells (Table 1). Selection of cells throughmammary fat pad injection alone appears to change themiRNAs expression pattern as 22 miRNAs wereelevated and 8 miRNAs were downregulated in TMD-231 cells and its metastatic variants compared withparental MD-231 cells (Table 2). Of these, miR-22showed the most significant repression of B50% inmetastatic clones compared with parental MD-231 cells.LMD-231 clones displayed a unique expression patternin which four let-7 family members were downregulatedcompared with the other clones (Table 3). Very fewchanges specific to BMD-231 and ADMD-231 wereobserved.
Differential expression of let-7f and miR-22 in primaryand metastatic cellsIt was recognized recently that the measurement ofmiRNA expression results obtained using variousmethods including miRNA profiling and quantitativereverse transcription–PCR (qRT–PCR) were notalways compatible (Koshiol et al., 2010). Taking theseobservations into consideration, we performed qRT–PCR using primers specific to mature let-7f and miR-22across our cell lines to further establish their differentialexpression in various cell lines (Figure 2). This analysisalso included the brain metastatic variant 231-BR cells
(Gril et al., 2008). As 231-BR cells originated from adifferent laboratory, parental cells used to generate thesecells from that same laboratory (MD-231P) were usedfor side-by-side comparison.
Let-7f expression was similarly low in metastaticclones compared with MD-231 and TMD-231(Figure 2a). We are not sure why the level of thismiRNA was elevated in TMD-231 compared with the
Table 1 MicroRNAs differentially expressed in metastatic cellscompared with parental (MD-231) and primary tumor (TMD-231)cells
MicroRNA name Fold change P-value
MicroRNAs elevated in metastatic cellshsa-miR-138 1.569841 0.013959hsa-miR-200a 1.650099 0.014243hsa-miR-101 1.519873 0.020937hsa-miR-10a 1.243558 0.021184hsa-miR-26b 1.178239 0.021506hsa-miR-149 1.418833 0.022479hsa-miR-129 1.439338 0.026166hsa-miR-218 1.605859 0.026291hsa-miR-324-3p 1.313153 0.031767hsa-miR-212 1.572052 0.032277hsa-miR-30a-3p 1.347055 0.032524hsa-miR-204 1.569835 0.033425hsa-miR-202* 1.549166 0.034841hsa-miR-199b 1.7066 0.035982hsa-miR-220 1.407553 0.036564hsa-miR-19b 1.231013 0.038968hsa-miR-216 1.583479 0.040803hsa-miR-346 1.456886 0.041714hsa-miR-560 1.511125 0.042804hsa-miR-328 1.388716 0.047731
MicroRNAs reduced in metastatic cellshsa-miR-21 0.599389 0.003418hsa-miR-634 0.720565 0.006854hsa-miR-181d 0.749118 0.011775hsa-miR-574 0.626508 0.018176hsa-miR-181a 0.66919 0.036095hsa-miR-195 0.657854 0.041401hsa-miR-30d 0.823367 0.04561
Table 2 MicroRNAs differentially expressed in TMD-231 andmetastatic variants compared with parental cells
MicroRNA name Fold change P-value
MicroRNAs elevated in tumor and metastatic cellshsa-miR-216 1.868754 0.025069hsa-miR-328 1.577275 0.025139hsa-miR-30a-3p 1.48373 0.025259hsa-miR-424 4.311446 0.00569hsa-miR-331 1.679677 0.005939hsa-miR-302c* 1.617726 0.025732hsa-miR-324-3p 1.429711 0.027095hsa-miR-129 1.591343 0.029512hsa-miR-346 1.654502 0.030471hsa-miR-202* 1.768106 0.032251hsa-miR-199b 2.004496 0.033587hsa-miR-19b 1.307697 0.039029hsa-miR-765 1.405249 0.039775hsa-miR-138 1.67829 0.046795hsa-miR-212 1.740812 0.049538hsa-miR-560 1.835449 0.009438hsa-miR-101 1.754769 0.012318hsa-miR-220 1.621864 0.013034hsa-miR-326 1.579604 0.018446hsa-miR-149 1.578043 0.020005hsa-miR-200a 1.876417 0.020234hsa-miR-218 1.850163 0.024632
MicroRNAs reduced in tumor and metastatic cellshsa-miR-22 0.497554 0.003643hsa-miR-195 0.535825 0.00686hsa-miR-574 0.54643 0.017916hsa-miR-21 0.580566 0.049115hsa-miR-363* 0.661028 0.047242hsa-miR-26a 0.661568 0.013301hsa-miR-768-5p 0.731164 0.00507hsa-miR-181d 0.677433 0.005183
Table 3 MicroRNAs differentially expressed in LMD-231 comparedwith other cell types
MicroRNA name Fold change P-value
MicroRNAs elevated in LMD-231 compared with other cellshsa-miR-565 1.277767 0.01041hsa-miR-210 1.35664 0.026345hsa-miR-28 1.225833 0.029151hsa-miR-487b 1.419737 0.030153
MicroRNAs reduced in LMD-231 compared with other cell typeshsa-let-7b 0.716811 0.031371hsa-let-7a 0.661869 0.031699hsa-let-7d 0.555842 0.0404hsa-let-7f 0.585863 0.01298hsa-miR-181a 0.604505 0.046016hsa-miR-16 0.591411 0.046521hsa-miR-23b 0.601896 0.018737hsa-miR-23a 0.605637 0.020189hsa-miR-17-5p 0.681955 0.034475
Breast cancer metastasisJB Patel et al
1292
Oncogene
parental cell line. Differences between the variants of aparticular metastatic clone were not statistically sig-nificant, which was discordant with the microarrayresults (Table 3). Nonetheless, the results clearly showedreduced expression of let-7f in metastatic clonescompared with parental and/or primary tumor-derivedclones with minimal difference among metastatic clones.
MD-231 and TMD-231 showed a modest differencein the expression of miR-22 with metastatic clonesshowing even further reduction in expression of thismiRNA (Pp0.0005). Expression was least in 231-BRfollowed by BMD-231 (Figure 2b). The expression ofmiR-22 was lower in LMD-231 and BMD-231 cellscompared with MD-231 cells with U6 or 5S as normal-ization controls (data not shown).
MiR-424 displayed 4.3-fold elevated expression inTMD-231 and metastatic clones compared with MD-231 cells (Table 2). MiR-424 is located on the X-chromosome and the corresponding region is activatedin sporadic basal breast cancers as well as in BRCA1mutant cancers suggesting its relevance to these aggres-sive types of cancer (Richardson et al., 2006). As per
miRgen, PCDHA13 (procadherin 13), PTCH1 (patched1, a tumor suppressor in hedgehog pathway) and RARb(retinoic acid receptor b, a tumor suppressor) are itspredicted targets. In qRT–PCR validation assays,although there was considerable experimental variationin expression in metastatic cell lines, a statisticallysignificant increase was observed only in TMD-231 cellscompared with MD-231 cells with RNU66 as a normal-ization control (Figure 2c and data not shown). With 5SRNA as a normalization control, a 3.3-fold increase inexpression (P¼ 0.01) was observed in ADMD-231 cellscompared with MD-231 cells (data not shown).
Expression levels of predicted miR-22 targets in primarytumor and metastatic cellsBased on targetscan and miRGen predictions, morethan 200 genes are putative targets of miR-22. Genesrelevant to breast cancer include AKT3, ERBB3,SATB2, HDAC4, CDC25C and SIRT1. Additionally,miR-22 has been shown to target the transcriptionfactors SP-1, EVI-1 oncogene, ERBB3 and ERa
Figure 2 Let-7f, miR-22 and miR-424 expression pattern in various cell types. Mature microRNAs were measured by quantitativereverse transcription polymerase chain reaction (qRT–PCR) and were normalized to RNU66 or 5S RNA. (a) Let-7f expression indifferent cell types with RNU66 as normalization control. Right panel shows expression of Let-7f in MD-231P and its brain metastaticvariant (231-BR) using 5S RNA as a normalization control. Average and standard error of the mean are shown. (b) miR-22 expressionin various cell types measured as in (a). (c) miR-424 expression in MD-231 and TMD-231 cells with RNU66 as a normalizationcontrol. Statistically significant difference in expression (P¼ 0.003 as indicated by an asterisk) was observed only between these two celltypes.
Breast cancer metastasisJB Patel et al
1293
Oncogene

(Sun et al., 2008; Pandey and Picard, 2009; Nagarajaet al., 2010). miR-22-mediated regulation of ERa is notrelevant to this study as cells used in this study are ERa-negative. First, we determined whether miR-22 expres-sion levels showed any correlation with the levels of itsputative/proven target genes. ERBB3 protein, but notAKT3 and CBL proteins, was elevated in metastatic
clones, particularly in LMD-231 and ADMD-231 cells,compared with MD-231 cells (Figure 3a). Similarly,EVI-1 expression showed negative correlation with miR-22. In particular, 231-BR cells showed remarkablyhigher levels of EVI-1 compared with MD-231Pcells. EGFR, although not a direct target of miR-22,but is functionally linked to ERBB3, is differentially
Figure 3 Expression pattern of potential miR-22 targets in various cell types. (a) Western blot analysis shows expression of EGFR,ERBB3, EVI-1, CBL, CDC25C, AKT3 and SP-1 in various cell types. Three distinct isoforms of EVI-1 (MDA/EVI-1, EVI-1 and EVI-1d are indicated. (b) EGFR transcripts levels are elevated in tumorigenic and metastatic cells compared with parental cells. EGFRtranscripts were measured by qRT–PCR. (c) Generation of miR-22 overexpressing MD-231P cells. qRT–PCR was used to measuremiR-22 expression in vector control (MD-231P-pQXIN) and miR-22 overexpressing cells (MD-231-miR-22). (d) Expression levels ofmiR-22 targets in MD-231P-pQXIN and MD-231-miR-22 cells. Western blotting was used to measure the expression levels of ERBB3and EVI-1. (e) Basal phospho-AKT levels in MD-231P, 231-BR, MD-231P-pQXIN and MD-231P-miR-22 cells under serum starved(24 h) or normal growth media condition. (f) Migration assay. Scratch wound migration assay shows differences in migration capacityof MD-231P-pQXIN and MD-231-miR-22 cells (left panel). Cells were plated in regular media and migration was monitored for 48 hafter creating a wound. Cell migration as measured by quantitative CyoSelect also shows differences in migration capacity of two celltypes (right panel, P¼ 0.004 as indicated by an asterisk).
Breast cancer metastasisJB Patel et al
1294
Oncogene

expressed; both protein and transcript levels wereelevated in TMD-231 and all metastatic clones com-pared with parental MD-231 cells (Figures 3a and b).Both SP-1 and CDC25C showed variable expressionamong different cell lines; however, their expressiondid not negatively correlate with miR-22 expressionin all cell types. Between MD-231p and 231-BRcells, CDC25C expression was higher in 231-BR cells(Figure 3a).
The degree of miRNA-mediated target downregula-tion often tends to be quantitatively modest and isevident mostly upon overexpression (Inui et al., 2010).To investigate whether miR-22 directly regulates theexpression of above genes, we generated MD-231P cellsoverexpressing miR-22 (MD-231-miR-22) (Figure 3c).The expression levels of EVI-1 and ERBB3, but notAKT3, SP-1 and SP-3, were substantially lower in MD-231-miR-22 cells compared with MD-231P cells withvector alone (MD-231P-pQXIN) (Figure 3d and datanot shown).
EVI-1 expression is linked to PI3Kinase-dependentactivation of AKT and miR-22 overexpression isexpected to reduce AKT activation (Liu et al., 2006;Nagaraja et al., 2010). We examined this possibility bymeasuring phospho-AKT levels in MD-231P-pQXINand MD-231P-miR-22 cells. Basal phospho-AKT levelswere substantially lower in MD-231P-miR-22 cellscompared with MD-231P-pQXIN cells (Figure 3e). Wealso note that 231-BR cells, which express lower levels ofmiR-22, but higher levels of EVI-1 compared with MD-231P cells, contain higher levels of pAKT (Figure 3e).MD-231P-pQXIN cells were more migratory comparedwith MD-231P-miR-22 cells in scratch wound assay,which may be linked to differential levels of pAKT inthese cells (Figure 3f). Additionally, a quantitativemigration assay revealed B25% lower migration ofMD-231P-miR-22 cells compared with MD-231P-pQXIN cells over a 24-h period (Figure 3f). Takentogether, these results reveal specific changes in theexpression levels of oncogenic proteins in metastaticvariants compared with primary tumor cells in ourmodel system. Some of these changes may be linked todifferential miRNA expression.
Elevated expression levels of C17orf91, which harbormiR-22, correlate with better outcome, luminal phenotypeand lower ERBB3 and EVI-1 levels in primary tumorsPrevious studies with limited breast cancer samples haveshown lower miR-22 expression in ERBB2-positivebreast cancers compared with ERBB2-negative tumorsand higher expression in ERþ and PRþ tumorscompared with ER� and PR� tumors, respectively;however, its expression status in basal or triple negativebreast cancer is unknown (Mattie et al., 2006). We tookadvantage of the fact that miR-22 is located in the50-untranslated region of a transcript called C17orf91 onchromosome 17 and utilizes the enhancer/promoterregion of this gene for transcription to indirectlydetermine the expression levels of miR-22 in publishedgene expression databases (Chang et al., 2008). We usedthe recently reported online tool to correlate C17orf91
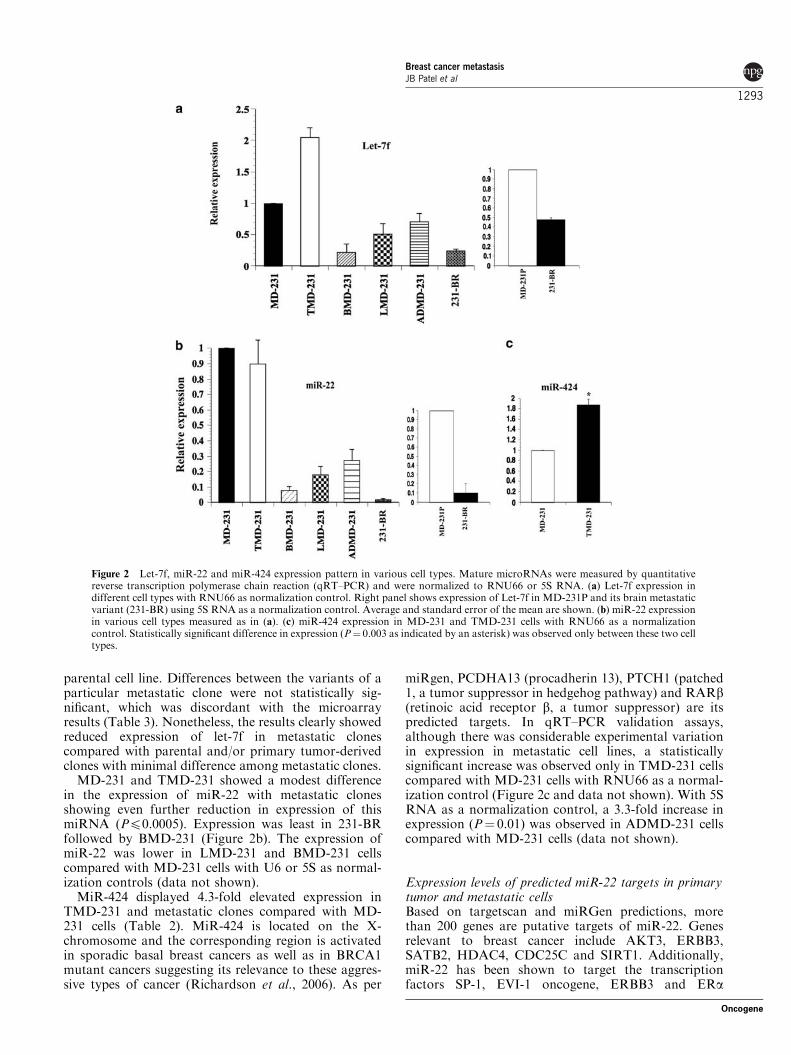
expression with outcome in breast cancer patients(Gyorffy et al., 2010). Elevated C17orf91 expressioncorrelated with significantly higher relapse-free survival(Figure 4a). Metastasis-free survival also showed asimilar trend, but did not reach statistical significance.When truly prognostic data sets (no systemic therapy)were used in the analysis, elevated C17orf91 expressioncorrelated with poor relapse-free survival (data notshown). Whether these contrasting observations arelinked to the therapeutic response is unknown.
We used additional microarray data sets in GeneExpression Omnibus to determine correlation betweenC17orf91 and EVI-1 expression. C17orf91 expressionwas lowest in basal breast cancers compared with non-basal cancers or normal breast cells (Figure 4b). Incontrast, EVI-1 expression was elevated in basal breastcancers compared with non-basal cancers or normalbreast. C17orf91 (miR-22) expression appeared to benegatively regulated by hypoxia-inducible transcriptionfactors as MCF-7 cells exposed to hypoxia expressedlower levels of C17orf91 compared with the same cellsexposed to hypoxia under HIF1a, HIF2a or bothdepleted conditions (Figure 4c). In the same set ofexperiments, EVI-1 expression under hypoxic conditionswas lower in cells depleted of HIF2a and both HIF1aand HIF2a compared with cells depleted of HIF1a ortreated with control siRNA (Figure 4c).
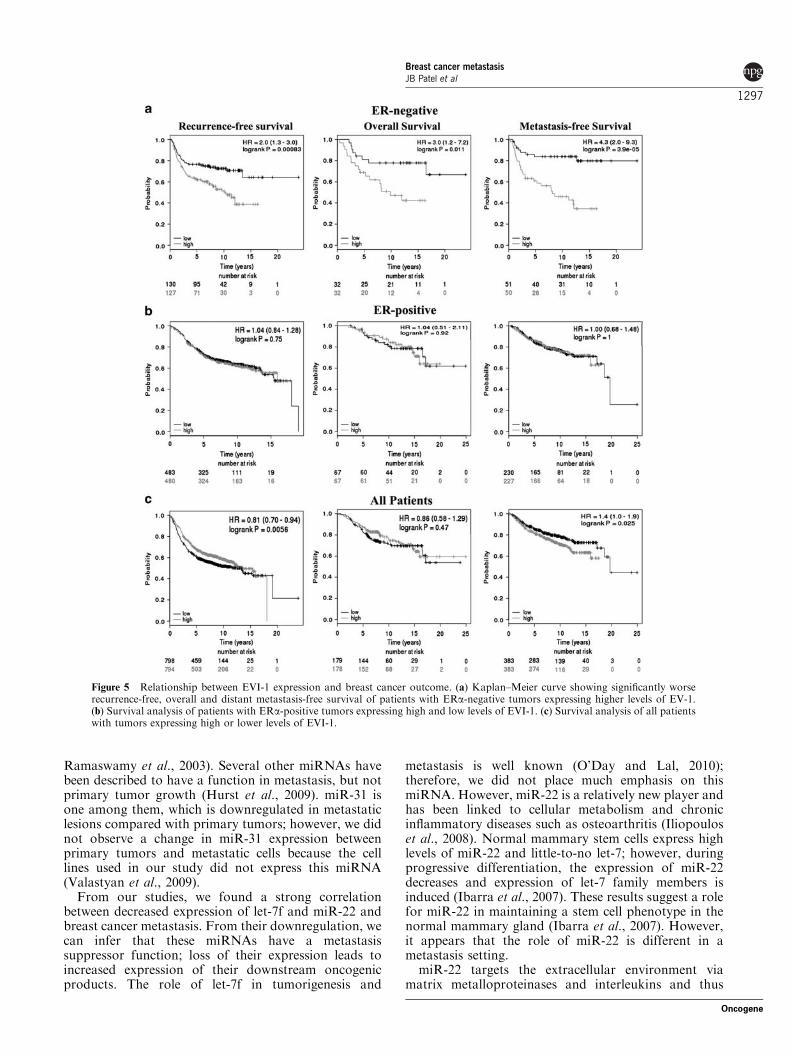
EVI-1 expression in ERa-negative breast cancers isassociated with poor outcomeThe results of our in vitro studies showing clear negativecorrelation between miR-22 and EVI-1 expression inmetastatic breast cancer cells prompted additionalevaluation of EVI-1 for its relevance in breast cancerprognosis. In ERa-negative subgroup of patients, whooften develop metastatic disease, higher expression ofEVI-1 in tumors was associated with reduced relapse-free, metastasis-free and overall survival (Figure 5a). InERa-positive subgroup, EVI-1 expression did not showany correlation with patient outcome (Figure 5b). Whenall patients were considered, elevated EVI-1 expressionwas associated with reduced metastasis-free but notoverall survival. For unknown reason, higher EVI-1expression appeared to correlate with improved relapse-free survival (Figure 5c). When the analysis wasrestricted to truly prognostic data sets, elevated EVI-1expression was associated with poor distant metastasis-free (P¼ 0.031) but not recurrence-free or overallsurvival. Overall, our results showed an associationbetween reduced miR-22/C17orf91 levels, elevatedEVI-1 and poor patient outcome.
Discussion
There is an explosion of data emerging from labora-tories worldwide describing the pivotal role of miRNAsin tumorigenesis. From their discovery in 1997 to thepresent, over 700 such molecules have been identified(O’Day and Lal, 2010). These non-coding RNAs have
Breast cancer metastasisJB Patel et al
1295
Oncogene
been linked to all aspects of cancer from initiation,proliferation, motility and invasion to metastasis (Hurstet al., 2009; Inui et al., 2010). They are thought tofunction much like proto-oncogenes and tumor sup-pressor genes, whereby alterations in their expressionlead to aberrant cellular behavior. Examples of tumorsuppressor miRNAs include let-7, miR-335, miR-126and miR-206 (Tavazoie et al., 2008). The downregula-tion of these miRNAs had many effects, but the mostpredominant function is increasing the metastaticpotential via upregulation of genes involved in motilityand proliferation. Specifically, miR-335 loss leads to
altered expression of genes such as SOX4, neuropilin 1and semaphoring 3C, which control progenitor celldevelopment and migration (Hoser et al., 2007). Studieson miR-126 show the context-specific actions intumorigenesis. In breast cancer, loss of miR-126 leadsto increased cell proliferation without effects onmotility, whereas in non-small cell lung cancers, loss ofmiR-126 leads to increased motility without effects onproliferation (Nicoloso et al., 2009). Other suchmiRNAs include miR-29c involvement in modulatingthe tumor microenvironment and miR-146 modulationof amoeboid motility (Friedl and Wolf, 2003;
Recurrence free Survival Metastasis-free SurvivalOverall Survival
Time (in years)Numbers at risk
Time (in years)Numbers at risk
Pro
babi
lity
Pro
babi
lity
Pro
babi
lity
0.8
1.0
0.6
0.4
0.2
0.0
0.8
1.0
0.6
0.4
0.2
0.0
0.8
1.0
0.6
0.4
0.2
0.0high
15 201050
BRCA1 BasalNon-BasalNormal BRCA1 BasalNon-BasalNormal
EVI-1
EVI-1
160
140
120
100
80
180
2.35
2.30
2.25
2.20
2.15
2.05
2.10
20 0 011729401175214617711
6
36
39
206507796
9
8
7
6
5
4
600
500
400
300
200
100
Control HIF1αdepleted
Bothdepleted
HIF2αdepleted
Control HIF1αdepleted
Bothdepleted
HIF2αdepleted
Exp
ress
ion
leve
lsE
xpre
ssio
n le
vels
p=0.0001
p=0.0001p=0.0001
p=0.013
C17orf91 (mir-22)
C17orf91 (miR-22)
796 455 144 36 10
0 263 3 0138 49383383
23976150180
15 20 251050 15 20 251050
lowhighlow
highlow
Time (in years)Numbers at risk
HR = 0.81 (0.69 - 0.94)Iogrank P = 0.0047
HR = 0.82 (0.54 - 1.23)Iogrank P = 0.33
HR = 0.76 (0.56 - 1.01)Iogrank P = 0.06
Figure 4 Relationship between C17orf91 (miR-22) and EVI-1 expression and breast cancer outcome. (a) Kaplan–Meier survivalanalysis showing significantly improved recurrence-free survival of patients with tumors that express higher levels of C17orf91, whichharbors miR-22 (left panel). Overall survival (center panel) and distant metastasis-free survival (right panel) are shown; onlymetastasis-free survival showed a trend of positive correlation with elevated C17orf21 expression. Number of patients with higherexpression (grey) and lower expression (black) are indicated along with number of patients at risk at specific time points. All data setsirrespective of systemic therapy were included in the analysis. (b) Basal breast cancers express lower levels of C17orf91 compared withnormal breast and non-basal breast cancers (left panel); the same cancer type expresses higher levels of EVI-1, an miR-22 target (rightpanel). (c) Hypoxia-inducible factors regulate C17orf91 and EVI-1 expression in opposite ways. The expression levels of C17orf91 werehigher in MCF-7 breast cancer cells depleted of hypoxia-inducible factors HIF1a, HIF2a or both (left panel). In contrast, HIF2a-depleted or HIF1a and HIF2a-depleted cells show lower EVI-1 expression (right panel).
Breast cancer metastasisJB Patel et al
1296
Oncogene
Ramaswamy et al., 2003). Several other miRNAs havebeen described to have a function in metastasis, but notprimary tumor growth (Hurst et al., 2009). miR-31 isone among them, which is downregulated in metastaticlesions compared with primary tumors; however, we didnot observe a change in miR-31 expression betweenprimary tumors and metastatic cells because the celllines used in our study did not express this miRNA(Valastyan et al., 2009).
From our studies, we found a strong correlationbetween decreased expression of let-7f and miR-22 andbreast cancer metastasis. From their downregulation, wecan infer that these miRNAs have a metastasissuppressor function; loss of their expression leads toincreased expression of their downstream oncogenicproducts. The role of let-7f in tumorigenesis and
metastasis is well known (O’Day and Lal, 2010);therefore, we did not place much emphasis on thismiRNA. However, miR-22 is a relatively new player andhas been linked to cellular metabolism and chronicinflammatory diseases such as osteoarthritis (Iliopouloset al., 2008). Normal mammary stem cells express highlevels of miR-22 and little-to-no let-7; however, duringprogressive differentiation, the expression of miR-22decreases and expression of let-7 family members isinduced (Ibarra et al., 2007). These results suggest a rolefor miR-22 in maintaining a stem cell phenotype in thenormal mammary gland (Ibarra et al., 2007). However,it appears that the role of miR-22 is different in ametastasis setting.
miR-22 targets the extracellular environment viamatrix metalloproteinases and interleukins and thus
Figure 5 Relationship between EVI-1 expression and breast cancer outcome. (a) Kaplan–Meier curve showing significantly worserecurrence-free, overall and distant metastasis-free survival of patients with ERa-negative tumors expressing higher levels of EV-1.(b) Survival analysis of patients with ERa-positive tumors expressing high and low levels of EVI-1. (c) Survival analysis of all patientswith tumors expressing high or lower levels of EVI-1.
Breast cancer metastasisJB Patel et al
1297
Oncogene

has a function in inflammatory conditions (Iliopouloset al., 2008). Putative downstream targets of miR-22include ERBB3, CDC25C, EVI-1, SIRT1, AKT3,SATB2, HDAC4, CBL, peroxisome proliferator acti-vated receptor a and BMP7. Peroxisome proliferatoractivated receptor a and BMP7 have been validated inother studies as targets of miR-22 (Iliopoulos et al.,2008); however, we did not find them to be targets ofmiR-22 in breast cancer cells (data not shown). ERBB3and EVI-1 have recently been shown to be targets ofmiR-22 in clear cell ovarian cancer (Nagaraja et al.,2010). Overexpression of miR-22 reduced the levels ofERBB3 and EVI-1 in breast cancer cells confirming thatthey both were targets of miR-22. Collectively, itappears that potent oncogenes linked to breast cancerprogression are the targets of miR-22. Although it isextremely unlikely that only miR-22 regulates the levelsof these proteins in metastatic cancer cells comparedwith parental tumor cells, several organ-specific variantsexpressed higher levels of miR-22 targets compared withprimary tumor cells. For example, ERBB3 levels werehigher in the lung and adrenal metastatic clonescompared with MD-231 cells. ERBB3, EVI-1 andCDC25C levels were higher in 231-BR cells comparedwith MD-231P cells. All metastatic cancer cells ex-pressed higher levels of EGFR both at the transcript andprotein levels; therefore, EGFR:ERBB3 heterodimersmay be predominant in metastatic cancer cells comparedwith tumors cells.
ERBB3 lacks kinase activity and, therefore, it receivedlittle attention until recently. It is now believed to have asignificant function in conferring resistance to growthfactor receptor tyrosine kinase inhibitors (Sergina et al.,2007). Whether metastatic cancer cells are more resistantto these inhibitors compared with primary tumors cellsremains to be determined. PI3Kinase/AKT is one of themajor downstream targets of ERBB3 (Campbell et al.,2010). Interestingly, EVI-1 also activates this pathway;activation of PI3 kinase/AKT is linked to drugresistance (Liu et al., 2006). It is likely that tworedundant pathways of PI3Kinase/AKT activation inmetastatic cancer cells make these cells highly resistantto chemotherapeutic drugs. Indeed, in our in vitrostudies, the metastatic variants were resistant todoxorubicin compared with parental cells (data notshown). However, miR-22 overexpression alone did notchange sensitivity of MD-231P cells to doxorubicin ordocetaxel, suggesting the involvement of additionalsignaling networks in resistance to chemotherapy (datanot shown).
In addition to its role in PI3Kinase/AKT activation,EVI-1 is a major epigenetic regulator of gene expressionand mainly targets genes associated with stemnessphenotype (Kumano and Kurokawa, 2010). EVI-1induces PBX1, one of the major stemness-associatedgene (Shimabe et al., 2009). Therefore, reduced miR-22expression in metastatic cells may lead to elevatedexpression of stemness-associated genes. EVI-1 haspreviously been linked to myeloid leukemia andmyelodysplastic syndrome (Wieser, 2007). Our studiesin breast cancer cell lines, as well as the analysis of gene
expression arrays from primary breast tumor samplessuggest a role for this protein in breast cancermetastasis. As EVI-1 is a transcription factor capableof causing epigenetic changes through recruitment ofhistone methyltransferases (Goyama et al., 2010), amodest alteration in its expression levels may besufficient to cause a major shift in gene expressionprograms, helping cancer cells to adapt to sites ofmetastasis.
While most of our studies were confined to miR-22,we also observed several other miRNAs, whose alteredexpression may potentially contribute to metastasis. Oneexample is miR-200a. Reduced expression of miR-200ain primary tumors is essential for cancer cells to acquireinvasive phenotype through epithelial-to-mesenchymaltransition (Gibbons et al., 2009), whereas its over-expression in mammary tumor cell lines enhancesmesenchymal-to-epithelial transition and increasesmacrometastasis (Dykxhoorn et al., 2009). Consistentwith this possibility, we observed elevated miR-200a inmetastatic cancer cells compared with parental cells orTMD-231 cells. miR-17-5P has been suggested as atumor suppressor in breast cancer; its expression waslower in lung metastatic cancer cells compared withother cell types (O’Day and Lal, 2010). The protumori-genic and prometastatic miRNA miR-19b was upregu-lated in metastatic cells (Table 2), whereas theantimetastatic miR-16 was downregulated in lungmetastatic cells (Table 3) (Hurst et al., 2009). However,there were few exceptions: metastatic cells expressedelevated levels of miR-101, which has been described astumor suppressor in other cancer types (Varamballyet al., 2008). In summary, we have described results thatsuggest a role for miRNAs in changing the proteinexpression pattern in cancer cells depending on the siteof metastasis. Further studies are required to investigatethe impact of manipulating individual miRNAs onorgan-specific metastasis and sensitivity to specifictherapies.
Materials and methods
Cell linesMDA-MB-231, TMD-231, BMD-231, LMD-231, ADMD-231and 231-BR cells were maintained in MEM media supple-mented with 10% fetal bovine serum, 10 nM insulin andpenicillin/streptomycin. Our metastasis model involved injec-tion of parental MDA-MB-231 into the mammary fat pad ofnude mice. After B8 weeks time, the mice were killed, theprimary tumors were harvested and select distant sitesincluding bone, lung, adrenal and brain were examined forevidence of metastatic disease. Using this model system, onlylung metastatic (LMD-231) cells could be obtained (Helbiget al., 2003). Therefore, a slight variation on the previousmodel system was implemented. TMD-231 cells were injectedvia intracardiac route and after 8 weeks, the mice were killed,and BMD-231, ADMD-231 and 231-BR metastatic cell lineswere successfully generated. Two variants of LMD-231 wereused for microarray analysis, one that had metastasized fromthe mammary fat pad to the lungs and the other viaintracardiac injection. Similarly, three clones of BMD-231
Breast cancer metastasisJB Patel et al
1298
Oncogene
were used for microarray analysis—one isolated from themandible, one from the vertebral column and the other fromthe tibia; all generated via intracardiac injection. Typically,metastatic lesions or whole organs were minced and incubatedin 50ml media containing collagenase IV (0.72mg/ml) andhyaluronidase (0.2mg/ml) for 3 h. Cells were washed in PBSand plated in regular media. After 2–3 days, cells wereincubated in serum-free media for 2 days to reduce the numberof fibroblasts. Additionally, flow cytometry with EpCAMconfirmed that 495% of cells are cancer cells (data notshown). As 231-BR cells were developed in a differentlaboratory, the expression pattern of miRNAs and theirtargets in 231-BR was compared with parental cells main-tained in that laboratory (MD-231P) (Gril et al., 2008).
miRNA expression analysisThe small RNA fraction from all cell lines was prepared usingthe mirVana miRNA isolation kit (Ambion Inc., Austin, TX,USA). Hybridization to miRNA arrays has been describedpreviously (Yu et al., 2007). Assays were carried out induplicate with RNA from MD-231, TMD-231, ADMD-231,two independent clones of LMD-231 and three independentclones of BMD-231. As all of the probes were printed twice onthe microarray in two independent blocks, four measurementswere available for every miRNA in each experimentalcondition. Signal intensity of tRNA-Thr was used for normal-ization between samples. Differentially expressed miRNAswere identified using a linear model that describes therelationship between cell type and probe blocks. Changes inlet-7f and miR-22 expression were verified in three independentRNA preparations by qRT–PCR using TaqMan miRNAassays designed to detect and accurately quantify maturemiRNAs (Applied Biosystems, Foster City, CA, USA).Primers specific to miR-22 (catalog #000398), miR-424(catalog #000604), let-7f (catalog #000382) and RNU66(catalog number 001002) were purchased from AppliedBiosystems. Primers specific for 5S (catalog #201509) werepurchased from Exiqon (Vedbaek, Denmark). Target genesof differentially expressed miRNAs were predicted usingTargetScan and miRgen programs (Lewis et al., 2005).
RT–PCR and quantitative real-time RT–PCRIndependent samples of total RNA were prepared using theRNAeasy kit (Qiagen, Valencia, CA, USA). First strandcDNA was synthesized using random hexamers and super-script II reverse transcriptase (Invitrogen, Carlsbad, CA,USA). To quantify the level of EGFR mRNA, qRT–PCRwas performed using the SyBr green mix according to themanufacturer’s protocol (Applied Biosystems). Expression ofb-actin was used as an internal control. Sequences of primersused will be provided upon request.
Generation of miR-22 overexpressing cell line andmigration assayGenomic DNA harboring mature miR-22 sequences wereamplified by PCR using the primers 50-GGGGGATCCCTGGGGCAGGACCCT-30 and GGGGAATTCAACGTATCATCCACCC-30 (chromosome 17:1563850–1564149, under-
lined sequences are cloning restriction enzyme sites) andcloned into BamH1-EcoR1 sites of the bicistronic retrovirusvector pcQXIN. Retrovirus packaging, transduction andselection of cells overexpressing miR-22 have been describedpreviously (Chua et al., 2007). Cell migration assay wasperformed using CytoSelect 24-well Cell Migration assay kit asper instruction from manufacturers (Cell Biolabs, Inc., SanDiego, CA, USA).
Western blot analysisWhole cell lysates were prepared in RIPA buffer and westernblotting was performed as previously described (Bhat-Nak-shatri et al., 2004). The primary antibodies used were c-Myc,EGFR, TLR4, ERBB2, ERBB3 (Santa Cruz Biotechnology,Santa Cruz, CA), AKT3, EVI-1 (Cell Signaling, Danvers, MA,USA) and b-actin (Sigma Chemical Co., St Louis, MO, USA).
Statistical analysisAll experiments were performed at least in duplicate. Theresults of qRT–PCR were analyzed using GraphPad software(Graphpad.com). Analysis of variance was used to determinethe P-values between mean measurements. A P-value ofo0.05was deemed statistically significant. Error bars on allhistograms represent the standard error of the mean.
Expression analysis of primary tumorsRelationship between the expression levels of C17orf91,ERBB3 and EVI-1 in different breast cancer subtypes as wellas in MCF-7 cells depleted of hypoxia-inducible factors wasdetermined using the expression array data sets in GeneExpression Omnibus (Elvidge et al., 2006). Relationshipbetween EVI-1 expression and breast cancer outcome wasdetermined using the gene expression data of 22 277 genes in1809 breast cancer patients (Gyorffy et al., 2010). All or onlytrue prognostic data sets (no systemic therapy) were includedin the analysis. These data sets are described in GeneExpression Omnibus accession numbers GSE11121 (Schmidtet al., 2008), GSE7390 (Desmedt et al., 2007) and select datafrom GSE3494, GSE2990 and GSE2034 (Miller et al., 2005;Wang et al., 2005; Sotiriou et al., 2006). C17orf91 expressionwas analyzed using the affymetrix probe set 214696_at(excellent probe set), whereas EVI-1 (MECOM) was measuredusing the probe set 221884_at (intermediate probe set).
Conflict of interest
The authors declare no conflict of interest.
Acknowledgements
This work is supported by Indiana University Simon CancerCenter Pilot grant and by Komen for Cure grantBCTR0601111 to HN. JBP and RMB are supported byNational Institutes of Health Training Grants T32 DK07519and T32 CA111198, respectively. HN is Marian J MorrisonProfessor of Breast Cancer Research.
References
Bhat-Nakshatri P, Campbell RA, Patel NM, Newton TR, King AJ,Marshall MS et al. (2004). Tumour necrosis factor and PI3-kinasecontrol oestrogen receptor alpha protein level and its transrepres-sion function. Br J Cancer 90: 853–859.
Bhat-Nakshatri P, Wang G, Collins NR, Thomson MJ, GeistlingerTR, Carroll JS et al. (2009). Estradiol-regulated microRNAscontrol estradiol response in breast cancer cells. Nucleic Acids Res
37: 4850–4861.
Breast cancer metastasisJB Patel et al
1299
Oncogene

Blenkiron C, Goldstein LD, Thorne NP, Spiteri I, Chin SF, DunningMJ et al. (2007). MicroRNA expression profiling of human breastcancer identifies new markers of tumour subtype. Genome Biol 8:R214.
Campbell MR, Amin D, Moasser MM. (2010). HER3 comes of age:new insights into its functions and role in signaling, tumor biology,and cancer therapy. Clin Cancer Res 16: 1373–1383.
Castellano L, Giamas G, Jacob J, Coombes RC, Lucchesi W,Thiruchelvam P et al. (2009). The estrogen receptor-alpha-inducedmicroRNA signature regulates itself and its transcriptionalresponse. Proc Natl Acad Sci USA 106: 15732–15737.
Chang TC, Yu D, Lee YS, Wentzel EA, Arking DE, West KM et al.(2008). Widespread microRNA repression by Myc contributes totumorigenesis. Nat Genet 40: 43–50.
Chua HL, Bhat-Nakshatri P, Clare SE, Morimiya A, Badve S,Nakshatri H. (2007). NF-kappaB represses E-cadherin expressionand enhances epithelial to mesenchymal transition of mammaryepithelial cells: potential involvement of ZEB-1 and ZEB-2.Oncogene 26: 711–724.
Desmedt C, Piette F, Loi S, Wang Y, Lallemand F, Haibe-Kains Bet al. (2007). Strong time dependence of the 76-gene prognosticsignature for node-negative breast cancer patients in the TRANS-BIG multicenter independent validation series. Clin Cancer Res 13:3207–3214.
Dykxhoorn DM, Wu Y, Xie H, Yu F, Lal A, Petrocca F et al. (2009).miR-200 enhances mouse breast cancer cell colonization to formdistant metastases. PLoS One 4: e7181.
Elvidge GP, Glenny L, Appelhoff RJ, Ratcliffe PJ, Ragoussis J,Gleadle JM. (2006). Concordant regulation of gene expression byhypoxia and 2-oxoglutarate-dependent dioxygenase inhibition: therole of HIF-1alpha, HIF-2alpha, and other pathways. J Biol Chem
281: 15215–15226.Friedl P, Wolf K. (2003). Tumour-cell invasion and migration:
diversity and escape mechanisms. Nat Rev Cancer 3: 362–374.Gibbons DL, Lin W, Creighton CJ, Rizvi ZH, Gregory PA, Goodall
GJ et al. (2009). Contextual extracellular cues promote tumor cellEMT and metastasis by regulating miR-200 family expression.Genes Dev 23: 2140–2151.
Goyama S, Nitta E, Yoshino T, Kako S, Watanabe-Okochi N,Shimabe M et al. (2010). EVI-1 interacts with histone methyl-transferases SUV39H1 and G9a for transcriptional repression andbone marrow immortalization. Leukemia 24: 81–88.
Gril B, Palmieri D, Bronder JL, Herring JM, Vega-Valle E,Feigenbaum L et al. (2008). Effect of lapatinib on the outgrowthof metastatic breast cancer cells to the brain. J Natl Cancer Inst 100:1092–1103.
Gupta GP, Minn AJ, Kang Y, Siegel PM, Serganova I, Cordon-CardoC et al. (2005). Identifying site-specific metastasis genes andfunctions. Cold Spring Harb Symp Quant Biol 70: 149–158.
Gyorffy B, Lanczky A, Eklund AC, Denkert C, Budczies J, Li Q et al.(2010). An online survival analysis tool to rapidly assess the effect of22 277 genes on breast cancer prognosis using microarray data of1809 patients. Breast Cancer Res Treat 123: 725–731.
Helbig G, Christopherson II KW, Bhat-Nakshatri P, Kumar S,Kishimoto H, Miller KD et al. (2003). NF-kappaB promotes breastcancer cell migration and metastasis by inducing the expression ofthe chemokine receptor CXCR4. J Biol Chem 278: 21631–21638.
Hoser M, Baader SL, Bosl MR, Ihmer A, Wegner M, Sock E. (2007).Prolonged glial expression of Sox4 in the CNS leads to architecturalcerebellar defects and ataxia. J Neurosci 27: 5495–5505.
Hurst DR, Edmonds MD, Welch DR. (2009). Metastamir: the fieldof metastasis-regulatory microRNA is spreading. Cancer Res 69:7495–7498.
Ibarra I, Erlich Y, Muthuswamy SK, Sachidanandam R, Hannon GJ.(2007). A role for microRNAs in maintenance of mouse mammaryepithelial progenitor cells. Genes Dev 21: 3238–3243.
Iliopoulos D, Malizos KN, Oikonomou P, Tsezou A. (2008).Integrative microRNA and proteomic approaches identify novelosteoarthritis genes and their collaborative metabolic and inflam-matory networks. PLoS One 3: e3740.
Inui M, Martello G, Piccolo S. (2010). MicroRNA control of signaltransduction. Nat Rev Mol Cell Biol 11: 252–263.
Kang Y, Siegel PM, Shu W, Drobnjak M, Kakonen SM, Cordon-Cardo C et al. (2003). A multigenic program mediating breastcancer metastasis to bone. Cancer Cell 3: 537–549.
Koshiol J, Wang E, Zhao Y, Marincola F, Landi MT. (2010).Strengths and limitations of laboratory procedures for microRNAdetection. Cancer Epidemiol Biomarkers Prev 19: 907–911.
Kumano K, Kurokawa M. (2010). The role of Runx1/AML1 and Evi-1 in the regulation of hematopoietic stem cells. J Cell Physiol 222:282–285.
Lewis BP, Burge CB, Bartel DP. (2005). Conserved seed pairing, oftenflanked by adenosines, indicates that thousands of human genes aremicroRNA targets. Cell 120: 15–20.
Liu Y, Chen L, Ko TC, Fields AP, Thompson EA. (2006).Evi1 is a survival factor which conveys resistance to bothTGFbeta- and taxol-mediated cell death via PI3K/AKT. Oncogene
25: 3565–3575.Maillot G, Lacroix-Triki M, Pierredon S, Gratadou L, Schmidt S,
Benes V et al. (2009). Widespread estrogen-dependent repression ofmicrornas involved in breast tumor cell growth. Cancer Res 69:8332–8340.
Mattie MD, Benz CC, Bowers J, Sensinger K, Wong L, Scott GK et al.(2006). Optimized high-throughput microRNA expression profilingprovides novel biomarker assessment of clinical prostate and breastcancer biopsies. Mol Cancer 5: 24.
Miller LD, Smeds J, George J, Vega VB, Vergara L, Ploner A et al.(2005). An expression signature for p53 status in human breastcancer predicts mutation status, transcriptional effects, and patientsurvival. Proc Natl Acad Sci USA 102: 13550–13555.
Nagaraja AK, Creighton CJ, Yu Z, Zhu H, Gunaratne PH, Reid JGet al. (2010). A link between mir-100 and FRAP1/mTOR in clearcell ovarian cancer. Mol Endocrinol 24: 447–463.
Nicoloso MS, Spizzo R, Shimizu M, Rossi S, Calin GA. (2009).MicroRNAs—the micro steering wheel of tumour metastases. Nat
Rev Cancer 9: 293–302.O’Day E, Lal A. (2010). MicroRNAs and their target gene networks in
breast cancer. Breast Cancer Res 12: 201.Pandey DP, Picard D. (2009). miR-22 inhibits estrogen signaling by
directly targeting the estrogen receptor alpha mRNA. Mol Cell Biol
29: 3783–3790.Ramaswamy S, Ross KN, Lander ES, Golub TR. (2003). A molecular
signature of metastasis in primary solid tumors. Nat Genet 33:49–54.
Richardson AL, Wang ZC, De Nicolo A, Lu X, Brown M, Miron Aet al. (2006). X chromosomal abnormalities in basal-like humanbreast cancer. Cancer Cell 9: 121–132.
Schmidt M, Bohm D, von Torne C, Steiner E, Puhl A, Pilch H et al.(2008). The humoral immune system has a key prognostic impact innode-negative breast cancer. Cancer Res 68: 5405–5413.
Sergina NV, Rausch M, Wang D, Blair J, Hann B, Shokat KM et al.(2007). Escape from HER-family tyrosine kinase inhibitor therapyby the kinase-inactive HER3. Nature 445: 437–441.
Shimabe M, Goyama S, Watanabe-Okochi N, Yoshimi A, IchikawaM, Imai Y et al. (2009). Pbx1 is a downstream target of Evi-1 inhematopoietic stem/progenitors and leukemic cells. Oncogene 28:4364–4374.
Sotiriou C, Wirapati P, Loi S, Harris A, Fox S, Smeds J et al. (2006).Gene expression profiling in breast cancer: understanding themolecular basis of histologic grade to improve prognosis. J Natl
Cancer Inst 98: 262–272.Steeg PS. (2006). Tumor metastasis: mechanistic insights and clinical
challenges. Nat Med 12: 895–904.Sun M, Estrov Z, Ji Y, Coombes KR, Harris DH, Kurzrock R. (2008).
Curcumin (diferuloylmethane) alters the expression profiles ofmicroRNAs in human pancreatic cancer cells. Mol Cancer Ther 7:464–473.
Tavazoie SF, Alarcon C, Oskarsson T, Padua D, Wang Q, Bos PDet al. (2008). Endogenous human microRNAs that suppress breastcancer metastasis. Nature 451: 147–152.
Breast cancer metastasisJB Patel et al
1300
Oncogene

Valastyan S, Reinhardt F, Benaich N, Calogrias D, Szasz AM, WangZC et al. (2009). A pleiotropically acting microRNA, miR-31,inhibits breast cancer metastasis. Cell 137: 1032–1046.
Varambally S, Cao Q, Mani RS, Shankar S, Wang X, Ateeq B et al.(2008). Genomic loss of microRNA-101 leads to overexpression ofhistone methyltransferase EZH2 in cancer. Science 322: 1695–1699.
Wang Y, Klijn JG, Zhang Y, Sieuwerts AM, Look MP,Yang F et al. (2005). Gene-expression profiles to predict distant
metastasis of lymph-node-negative primary breast cancer. Lancet
365: 671–679.Wieser R. (2007). The oncogene and developmental regulator EVI1:
expression, biochemical properties, and biological functions. Gene
396: 346–357.Yu J, Vodyanik MA, Smuga-Otto K, Antosiewicz-Bourget J, Frane
JL, Tian S et al. (2007). Induced pluripotent stem cell lines derivedfrom human somatic cells. Science 318: 1917–1920.
Breast cancer metastasisJB Patel et al
1301
Oncogene
View publication statsView publication stats