Control Measure for Ocean-Going Vessels ... - ww3.arb.ca.gov · Table V. Auxiliary Engine Effective...
29
Control Measure for Ocean-Going Vessels At Berth Cost Analysis Inputs and Assumptions for Standardized Regulatory Impact Assessment Revised: 5/10/19 This document was prepared by California Air Resources Board (CARB) Staff to document inputs and assumptions used in the development of preliminary cost estimates for the Draft Control Measure for Ocean-Going Vessels At Berth. Staff is developing the cost estimates for the Standardized Regulatory Impact Assessment (SRIA), which is required by Senate Bill (SB) 617 for proposed regulations that have an economic impact exceeding $50 million. This document, and the accompanying cost calculations, are preliminary discussion drafts and are still under development. To date, Staff has incorporated information received from various sources including many industry stakeholders, and continues to request additional data to further refine the cost analysis. Staff requests that industry stakeholders submit any additional information to Staff by May 29, 2019 to be considered for the SRIA.
Transcript of Control Measure for Ocean-Going Vessels ... - ww3.arb.ca.gov · Table V. Auxiliary Engine Effective...
Control Measure for Ocean-Going Vessels At Berth
Cost Analysis Inputs and Assumptions for Standardized Regulatory Impact Assessment
Revised: 5/10/19
This document was prepared by California Air Resources Board (CARB) Staff to document inputs and assumptions used in the development of preliminary cost estimates for the Draft Control Measure for Ocean-Going Vessels At Berth.
Staff is developing the cost estimates for the Standardized Regulatory Impact Assessment (SRIA), which is required by Senate Bill (SB) 617 for proposed regulations that have an economic impact exceeding $50 million. This document, and the accompanying cost calculations, are preliminary discussion drafts and are still under development. To date, Staff has incorporated information received from various sources including many industry stakeholders, and continues to request additional data to further refine the cost analysis. Staff requests that industry stakeholders submit any additional information to Staff by May 29, 2019 to be considered for the SRIA.
PRELIMINARY DISCUSSION DRAFT – DO NOT CITE OR QUOTE Updated: May 10, 2019
Page 2
Contents Table I. Scope and Timing of Analysis .......................................................................................................................................... 3
Table II. Barge-Based Capture and Control Systems – Cost Inputs .............................................................................................. 5
Table III. Land-Based Capture and Control Systems – Cost Inputs ............................................................................................... 7
Table IV. Tanker Terminal Infrastructure Feasibility, Engineering and Permitting Costs .............................................................. 8
Table V. Auxiliary Engine Effective Power Values ........................................................................................................................ 9
Table VI. Duration of Emission Control at Berth .......................................................................................................................... 9
Table VII. Administrative Cost Inputs ........................................................................................................................................... 9
Table VIII. Electricity and Fuel Cost Inputs ................................................................................................................................. 11
Table IX. Growth Factors ............................................................................................................................................................ 12
Table X. Cost Apportionment to Ports and Terminals ................................................................................................................ 13
Table XI. Berth and Terminal Counts, Anticipated Infrastructure Needs, and Unique Vessels ................................................... 14
Table XII. Shore Power Infrastructure, Maintenance and Labor – Cost Inputs ........................................................................... 18
Table XIII. Annual Vessel Visits – Container/Reefer .................................................................................................................... 20
Table XIV. Annual Vessel Visits – Cruise ..................................................................................................................................... 22
Table XV. Annual Vessel Visits – Auto/RoRo .............................................................................................................................. 24
Table XVI. Annual Vessel Visits – Tankers ................................................................................................................................... 26
Table XVII. Flexibility Adjustments ............................................................................................................................................. 28
Table XVIII. Remediation Fee Costs ........................................................................................................................................... 29
PRELIMINARY DISCUSSION DRAFT – DO NOT CITE OR QUOTE Updated: May 10, 2019
Page 3
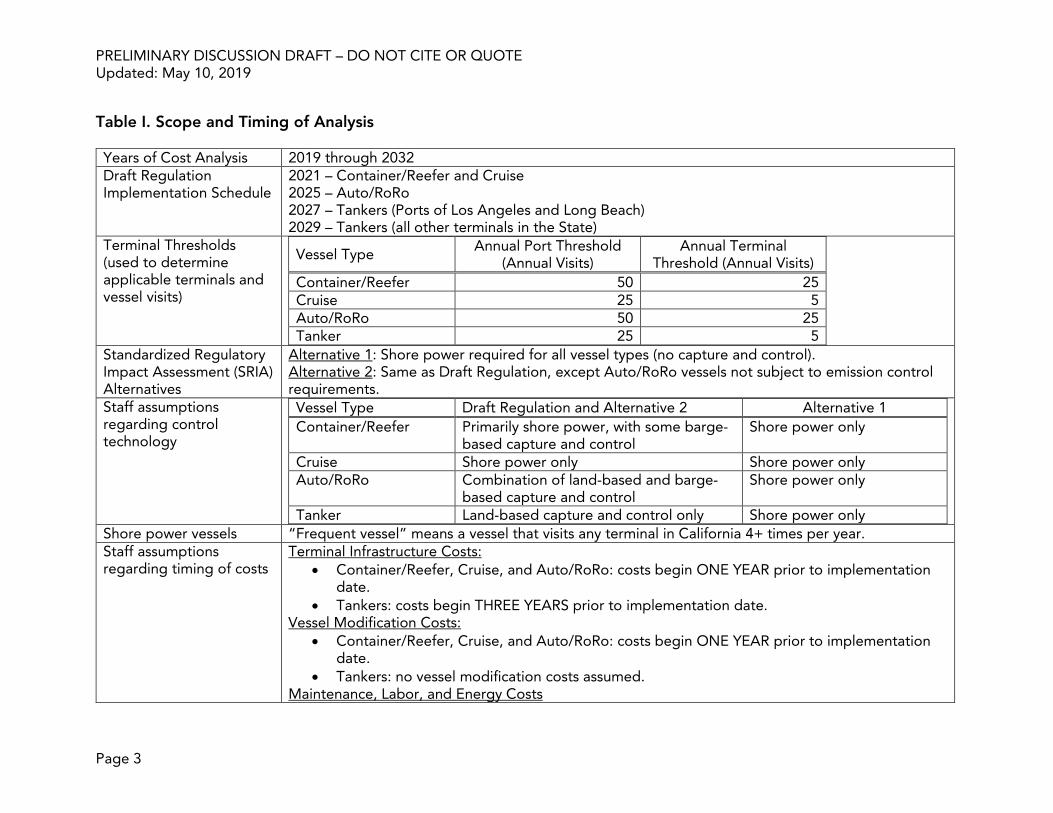
Table I. Scope and Timing of Analysis Years of Cost Analysis 2019 through 2032 Draft Regulation Implementation Schedule
2021 – Container/Reefer and Cruise 2025 – Auto/RoRo 2027 – Tankers (Ports of Los Angeles and Long Beach) 2029 – Tankers (all other terminals in the State)
Terminal Thresholds (used to determine applicable terminals and vessel visits)
Vessel Type Annual Port Threshold (Annual Visits)
Annual Terminal Threshold (Annual Visits)
Container/Reefer 50 25 Cruise 25 5 Auto/RoRo 50 25 Tanker 25 5
Standardized Regulatory Impact Assessment (SRIA) Alternatives
Alternative 1: Shore power required for all vessel types (no capture and control). Alternative 2: Same as Draft Regulation, except Auto/RoRo vessels not subject to emission control requirements.
Staff assumptions regarding control technology
Vessel Type Draft Regulation and Alternative 2 Alternative 1 Container/Reefer Primarily shore power, with some barge-
based capture and control Shore power only
Cruise Shore power only Shore power only Auto/RoRo Combination of land-based and barge-
based capture and control Shore power only
Tanker Land-based capture and control only Shore power only
Shore power vessels “Frequent vessel” means a vessel that visits any terminal in California 4+ times per year. Staff assumptions regarding timing of costs
Terminal Infrastructure Costs: • Container/Reefer, Cruise, and Auto/RoRo: costs begin ONE YEAR prior to implementation
date. • Tankers: costs begin THREE YEARS prior to implementation date.
Vessel Modification Costs: • Container/Reefer, Cruise, and Auto/RoRo: costs begin ONE YEAR prior to implementation
date. • Tankers: no vessel modification costs assumed.
Maintenance, Labor, and Energy Costs
PRELIMINARY DISCUSSION DRAFT – DO NOT CITE OR QUOTE Updated: May 10, 2019
Page 4
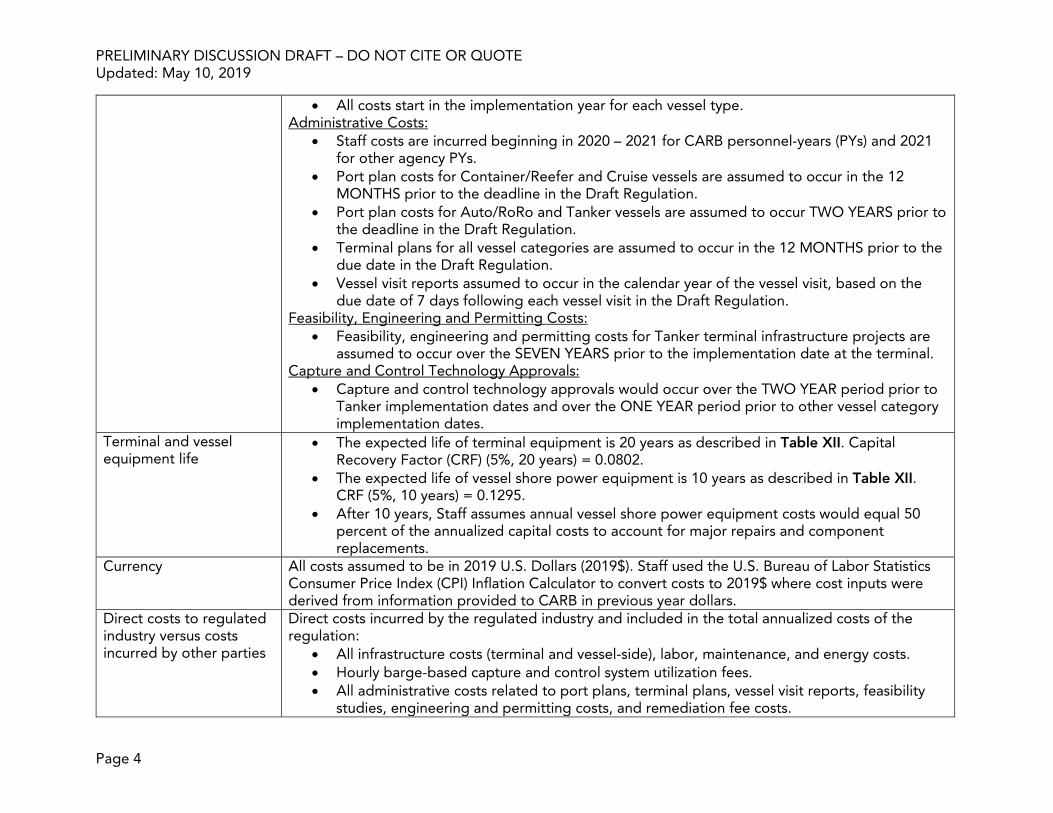
• All costs start in the implementation year for each vessel type. Administrative Costs:
• Staff costs are incurred beginning in 2020 – 2021 for CARB personnel-years (PYs) and 2021 for other agency PYs.
• Port plan costs for Container/Reefer and Cruise vessels are assumed to occur in the 12 MONTHS prior to the deadline in the Draft Regulation.
• Port plan costs for Auto/RoRo and Tanker vessels are assumed to occur TWO YEARS prior to the deadline in the Draft Regulation.
• Terminal plans for all vessel categories are assumed to occur in the 12 MONTHS prior to the due date in the Draft Regulation.
• Vessel visit reports assumed to occur in the calendar year of the vessel visit, based on the due date of 7 days following each vessel visit in the Draft Regulation.
Feasibility, Engineering and Permitting Costs: • Feasibility, engineering and permitting costs for Tanker terminal infrastructure projects are
assumed to occur over the SEVEN YEARS prior to the implementation date at the terminal. Capture and Control Technology Approvals:
• Capture and control technology approvals would occur over the TWO YEAR period prior to Tanker implementation dates and over the ONE YEAR period prior to other vessel category implementation dates.
Terminal and vessel equipment life
• The expected life of terminal equipment is 20 years as described in Table XII. Capital Recovery Factor (CRF) (5%, 20 years) = 0.0802.
• The expected life of vessel shore power equipment is 10 years as described in Table XII. CRF (5%, 10 years) = 0.1295.
• After 10 years, Staff assumes annual vessel shore power equipment costs would equal 50 percent of the annualized capital costs to account for major repairs and component replacements.
Currency All costs assumed to be in 2019 U.S. Dollars (2019$). Staff used the U.S. Bureau of Labor Statistics Consumer Price Index (CPI) Inflation Calculator to convert costs to 2019$ where cost inputs were derived from information provided to CARB in previous year dollars.
Direct costs to regulated industry versus costs incurred by other parties
Direct costs incurred by the regulated industry and included in the total annualized costs of the regulation:
• All infrastructure costs (terminal and vessel-side), labor, maintenance, and energy costs. • Hourly barge-based capture and control system utilization fees. • All administrative costs related to port plans, terminal plans, vessel visit reports, feasibility
studies, engineering and permitting costs, and remediation fee costs.
PRELIMINARY DISCUSSION DRAFT – DO NOT CITE OR QUOTE Updated: May 10, 2019
Page 5
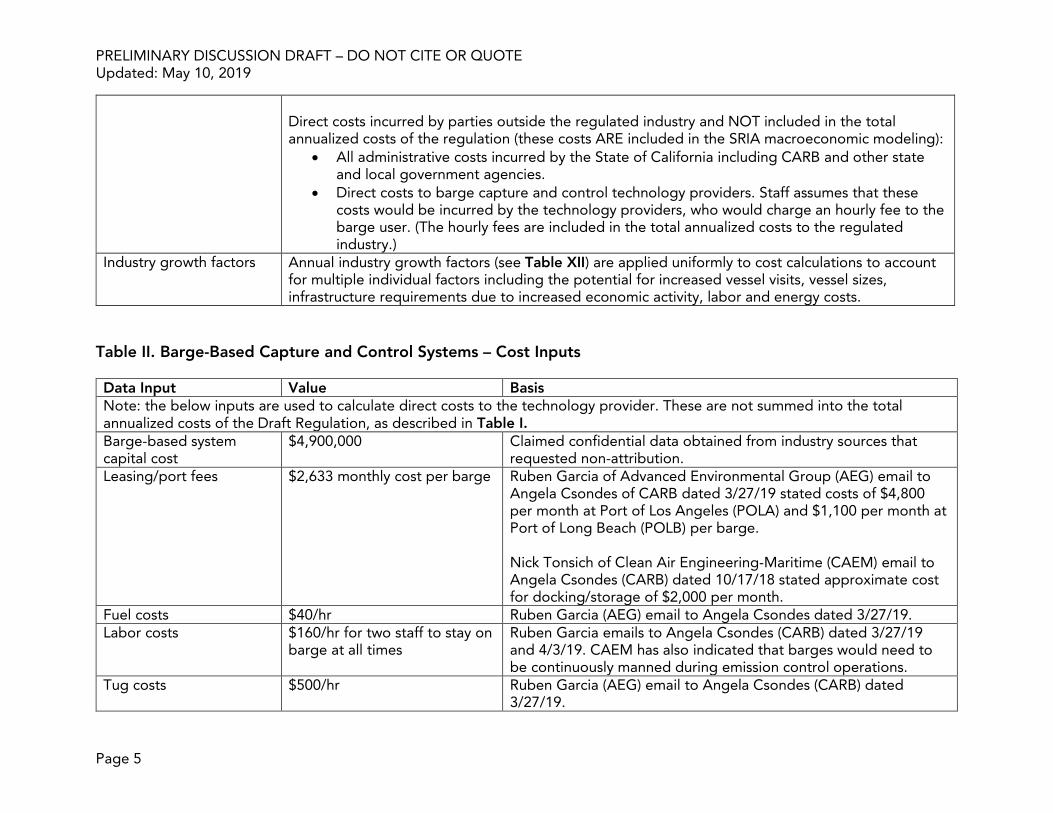
Direct costs incurred by parties outside the regulated industry and NOT included in the total annualized costs of the regulation (these costs ARE included in the SRIA macroeconomic modeling):
• All administrative costs incurred by the State of California including CARB and other state and local government agencies.
• Direct costs to barge capture and control technology providers. Staff assumes that these costs would be incurred by the technology providers, who would charge an hourly fee to the barge user. (The hourly fees are included in the total annualized costs to the regulated industry.)
Industry growth factors Annual industry growth factors (see Table XII) are applied uniformly to cost calculations to account for multiple individual factors including the potential for increased vessel visits, vessel sizes, infrastructure requirements due to increased economic activity, labor and energy costs.
Table II. Barge-Based Capture and Control Systems – Cost Inputs Data Input Value Basis Note: the below inputs are used to calculate direct costs to the technology provider. These are not summed into the total annualized costs of the Draft Regulation, as described in Table I. Barge-based system capital cost
$4,900,000
Claimed confidential data obtained from industry sources that requested non-attribution.
Leasing/port fees $2,633 monthly cost per barge Ruben Garcia of Advanced Environmental Group (AEG) email to Angela Csondes of CARB dated 3/27/19 stated costs of $4,800 per month at Port of Los Angeles (POLA) and $1,100 per month at Port of Long Beach (POLB) per barge. Nick Tonsich of Clean Air Engineering-Maritime (CAEM) email to Angela Csondes (CARB) dated 10/17/18 stated approximate cost for docking/storage of $2,000 per month.
Fuel costs $40/hr Ruben Garcia (AEG) email to Angela Csondes dated 3/27/19. Labor costs $160/hr for two staff to stay on
barge at all times Ruben Garcia emails to Angela Csondes (CARB) dated 3/27/19 and 4/3/19. CAEM has also indicated that barges would need to be continuously manned during emission control operations.
Tug costs $500/hr Ruben Garcia (AEG) email to Angela Csondes (CARB) dated 3/27/19.
PRELIMINARY DISCUSSION DRAFT – DO NOT CITE OR QUOTE Updated: May 10, 2019
Page 6
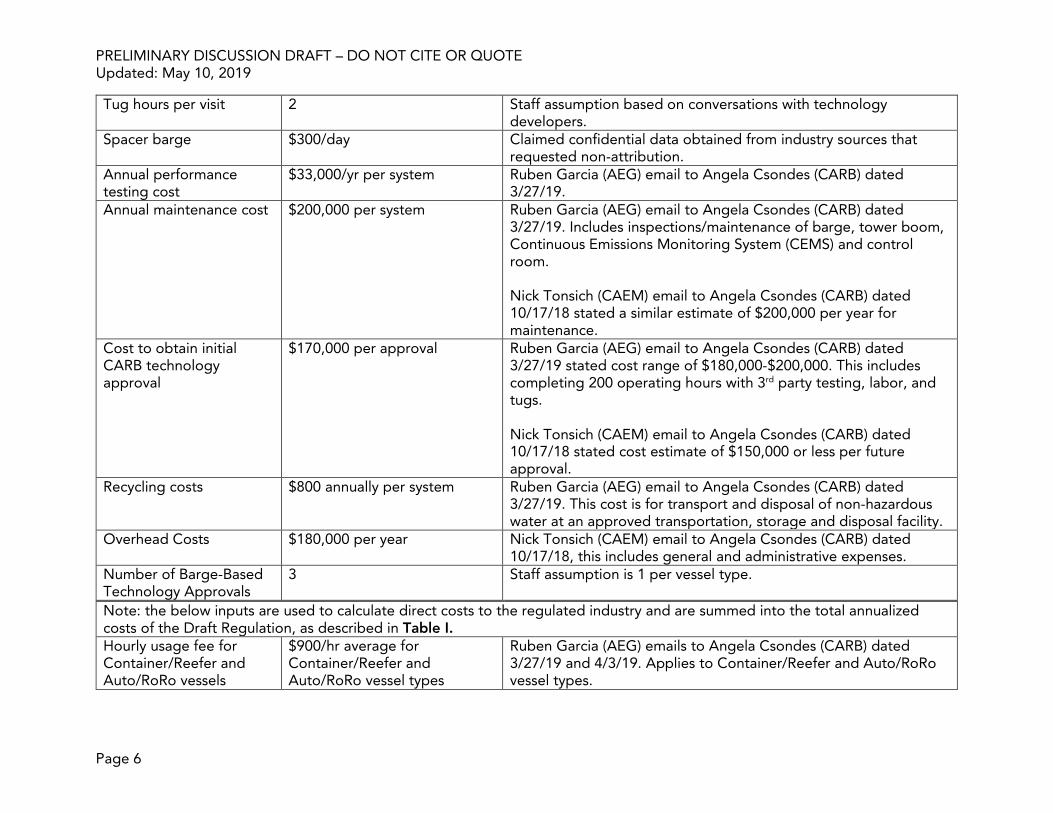
Tug hours per visit 2 Staff assumption based on conversations with technology developers.
Spacer barge $300/day Claimed confidential data obtained from industry sources that requested non-attribution.
Annual performance testing cost
$33,000/yr per system Ruben Garcia (AEG) email to Angela Csondes (CARB) dated 3/27/19.
Annual maintenance cost $200,000 per system Ruben Garcia (AEG) email to Angela Csondes (CARB) dated 3/27/19. Includes inspections/maintenance of barge, tower boom, Continuous Emissions Monitoring System (CEMS) and control room. Nick Tonsich (CAEM) email to Angela Csondes (CARB) dated 10/17/18 stated a similar estimate of $200,000 per year for maintenance.
Cost to obtain initial CARB technology approval
$170,000 per approval Ruben Garcia (AEG) email to Angela Csondes (CARB) dated 3/27/19 stated cost range of $180,000-$200,000. This includes completing 200 operating hours with 3rd party testing, labor, and tugs. Nick Tonsich (CAEM) email to Angela Csondes (CARB) dated 10/17/18 stated cost estimate of $150,000 or less per future approval.
Recycling costs $800 annually per system Ruben Garcia (AEG) email to Angela Csondes (CARB) dated 3/27/19. This cost is for transport and disposal of non-hazardous water at an approved transportation, storage and disposal facility.
Overhead Costs $180,000 per year Nick Tonsich (CAEM) email to Angela Csondes (CARB) dated 10/17/18, this includes general and administrative expenses.
Number of Barge-Based Technology Approvals
3 Staff assumption is 1 per vessel type.
Note: the below inputs are used to calculate direct costs to the regulated industry and are summed into the total annualized costs of the Draft Regulation, as described in Table I. Hourly usage fee for Container/Reefer and Auto/RoRo vessels
$900/hr average for Container/Reefer and Auto/RoRo vessel types
Ruben Garcia (AEG) emails to Angela Csondes (CARB) dated 3/27/19 and 4/3/19. Applies to Container/Reefer and Auto/RoRo vessel types.
PRELIMINARY DISCUSSION DRAFT – DO NOT CITE OR QUOTE Updated: May 10, 2019
Page 7
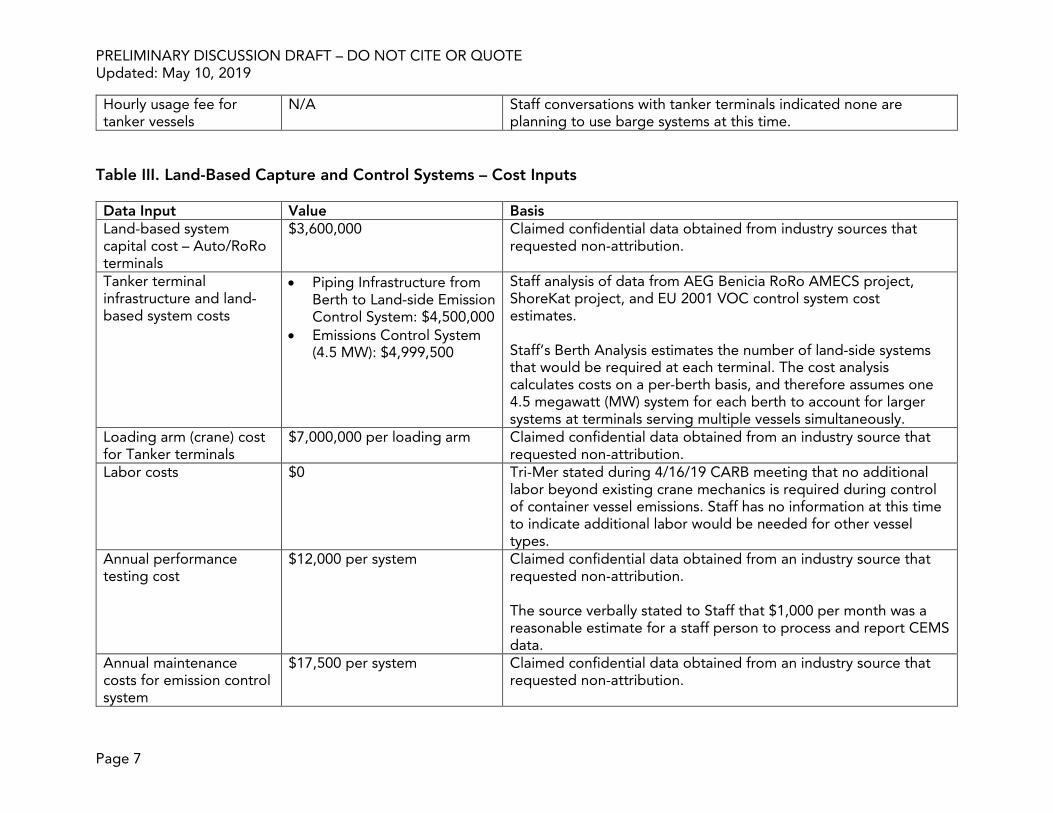
Hourly usage fee for tanker vessels
N/A Staff conversations with tanker terminals indicated none are planning to use barge systems at this time.
Table III. Land-Based Capture and Control Systems – Cost Inputs Data Input Value Basis Land-based system capital cost – Auto/RoRo terminals
$3,600,000 Claimed confidential data obtained from industry sources that requested non-attribution.
Tanker terminal infrastructure and land-based system costs
• Piping Infrastructure from Berth to Land-side Emission Control System: $4,500,000
• Emissions Control System (4.5 MW): $4,999,500
Staff analysis of data from AEG Benicia RoRo AMECS project, ShoreKat project, and EU 2001 VOC control system cost estimates. Staff’s Berth Analysis estimates the number of land-side systems that would be required at each terminal. The cost analysis calculates costs on a per-berth basis, and therefore assumes one 4.5 megawatt (MW) system for each berth to account for larger systems at terminals serving multiple vessels simultaneously.
Loading arm (crane) cost for Tanker terminals
$7,000,000 per loading arm Claimed confidential data obtained from an industry source that requested non-attribution.
Labor costs $0 Tri-Mer stated during 4/16/19 CARB meeting that no additional labor beyond existing crane mechanics is required during control of container vessel emissions. Staff has no information at this time to indicate additional labor would be needed for other vessel types.
Annual performance testing cost
$12,000 per system Claimed confidential data obtained from an industry source that requested non-attribution. The source verbally stated to Staff that $1,000 per month was a reasonable estimate for a staff person to process and report CEMS data.
Annual maintenance costs for emission control system
$17,500 per system Claimed confidential data obtained from an industry source that requested non-attribution.
PRELIMINARY DISCUSSION DRAFT – DO NOT CITE OR QUOTE Updated: May 10, 2019
Page 8
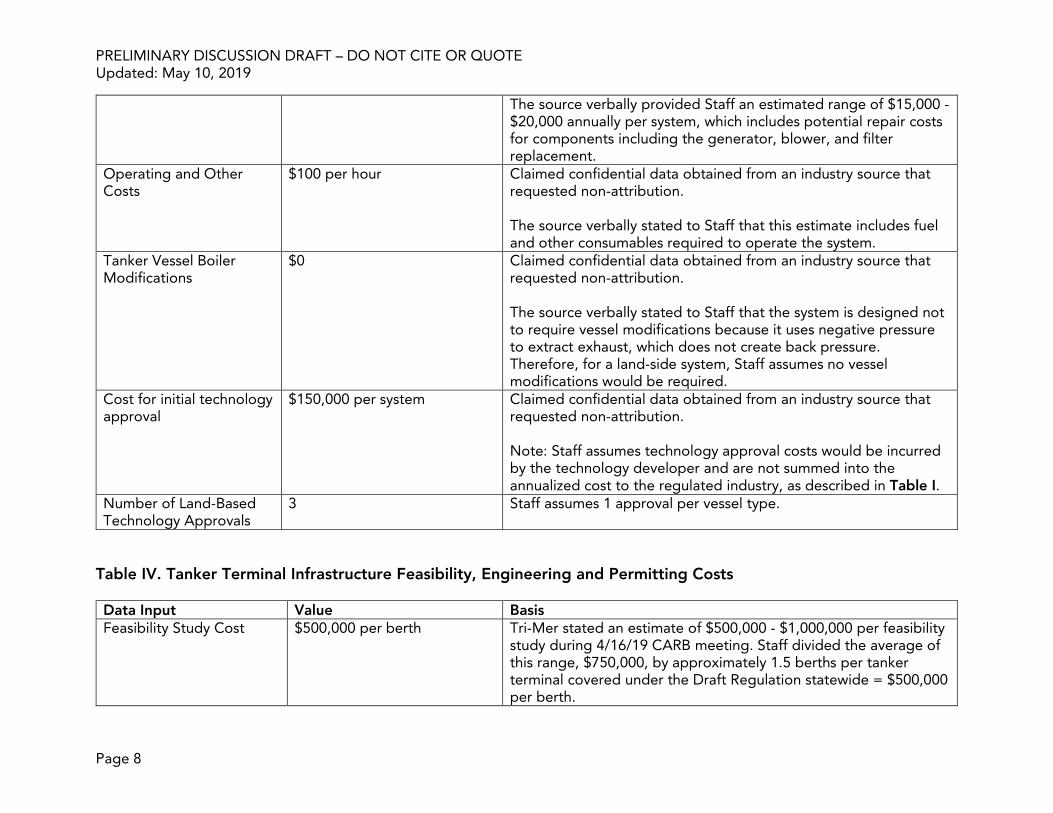
The source verbally provided Staff an estimated range of $15,000 - $20,000 annually per system, which includes potential repair costs for components including the generator, blower, and filter replacement.
Operating and Other Costs
$100 per hour Claimed confidential data obtained from an industry source that requested non-attribution. The source verbally stated to Staff that this estimate includes fuel and other consumables required to operate the system.
Tanker Vessel Boiler Modifications
$0 Claimed confidential data obtained from an industry source that requested non-attribution. The source verbally stated to Staff that the system is designed not to require vessel modifications because it uses negative pressure to extract exhaust, which does not create back pressure. Therefore, for a land-side system, Staff assumes no vessel modifications would be required.
Cost for initial technology approval
$150,000 per system Claimed confidential data obtained from an industry source that requested non-attribution. Note: Staff assumes technology approval costs would be incurred by the technology developer and are not summed into the annualized cost to the regulated industry, as described in Table I.
Number of Land-Based Technology Approvals
3 Staff assumes 1 approval per vessel type.
Table IV. Tanker Terminal Infrastructure Feasibility, Engineering and Permitting Costs Data Input Value Basis Feasibility Study Cost $500,000 per berth Tri-Mer stated an estimate of $500,000 - $1,000,000 per feasibility
study during 4/16/19 CARB meeting. Staff divided the average of this range, $750,000, by approximately 1.5 berths per tanker terminal covered under the Draft Regulation statewide = $500,000 per berth.
PRELIMINARY DISCUSSION DRAFT – DO NOT CITE OR QUOTE Updated: May 10, 2019
Page 9
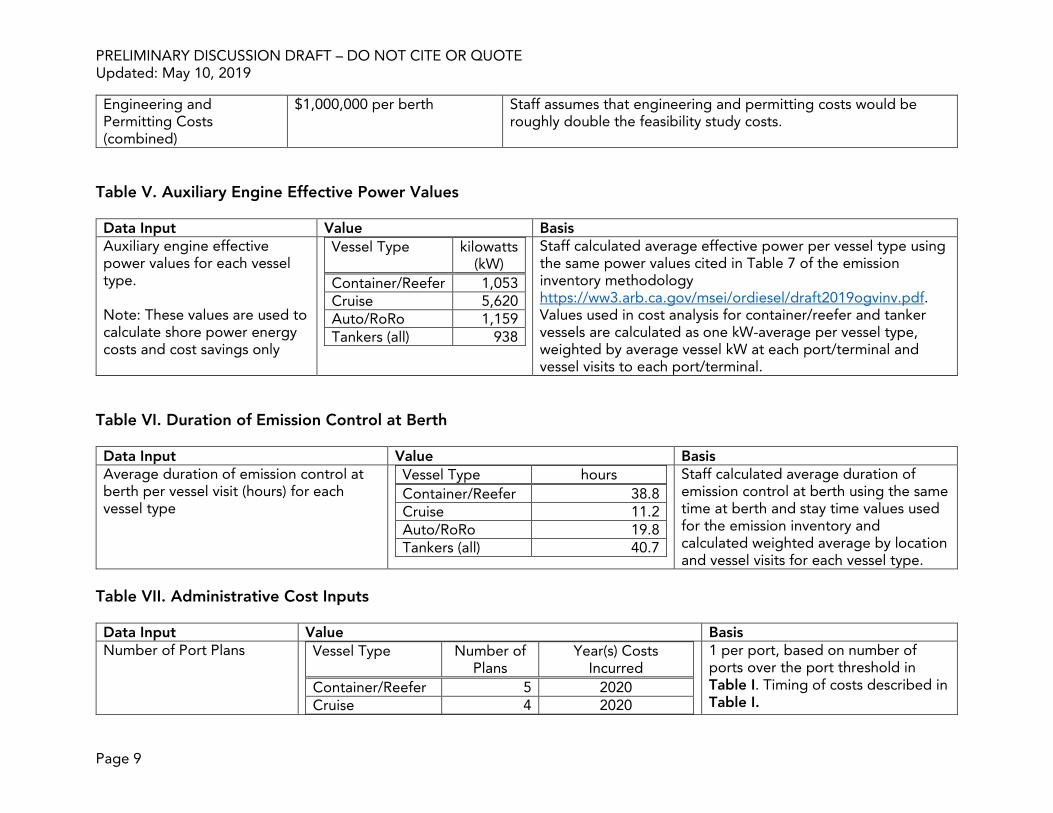
Engineering and Permitting Costs (combined)
$1,000,000 per berth Staff assumes that engineering and permitting costs would be roughly double the feasibility study costs.
Table V. Auxiliary Engine Effective Power Values Data Input Value Basis Auxiliary engine effective power values for each vessel type. Note: These values are used to calculate shore power energy costs and cost savings only
Vessel Type kilowatts (kW)
Container/Reefer 1,053 Cruise 5,620 Auto/RoRo 1,159 Tankers (all) 938
Staff calculated average effective power per vessel type using the same power values cited in Table 7 of the emission inventory methodology https://ww3.arb.ca.gov/msei/ordiesel/draft2019ogvinv.pdf. Values used in cost analysis for container/reefer and tanker vessels are calculated as one kW-average per vessel type, weighted by average vessel kW at each port/terminal and vessel visits to each port/terminal.
Table VI. Duration of Emission Control at Berth Data Input Value Basis Average duration of emission control at berth per vessel visit (hours) for each vessel type
Vessel Type hours Container/Reefer 38.8 Cruise 11.2 Auto/RoRo 19.8 Tankers (all) 40.7
Staff calculated average duration of emission control at berth using the same time at berth and stay time values used for the emission inventory and calculated weighted average by location and vessel visits for each vessel type.
Table VII. Administrative Cost Inputs Data Input Value Basis Number of Port Plans Vessel Type Number of
Plans Year(s) Costs
Incurred Container/Reefer 5 2020 Cruise 4 2020
1 per port, based on number of ports over the port threshold in Table I. Timing of costs described in Table I.
PRELIMINARY DISCUSSION DRAFT – DO NOT CITE OR QUOTE Updated: May 10, 2019
Page 10
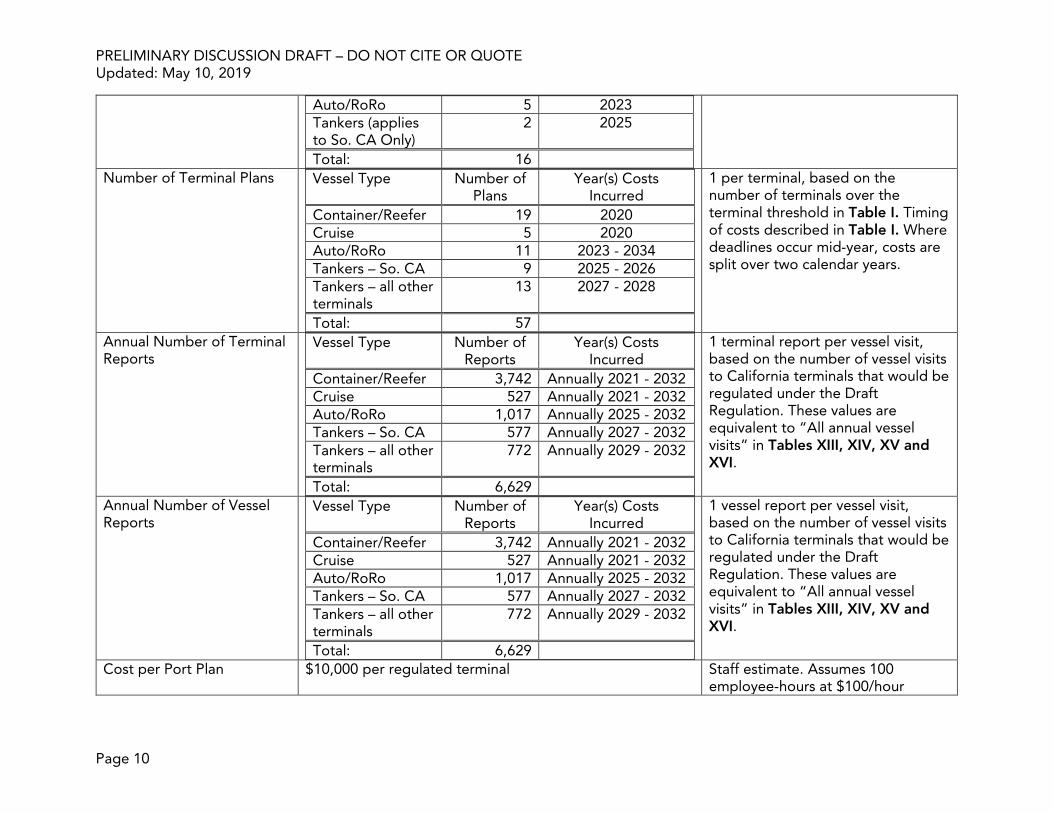
Auto/RoRo 5 2023 Tankers (applies to So. CA Only)
2 2025
Total: 16
Number of Terminal Plans Vessel Type Number of Plans
Year(s) Costs Incurred
Container/Reefer 19 2020 Cruise 5 2020 Auto/RoRo 11 2023 - 2034 Tankers – So. CA 9 2025 - 2026 Tankers – all other terminals
13 2027 - 2028
Total: 57
1 per terminal, based on the number of terminals over the terminal threshold in Table I. Timing of costs described in Table I. Where deadlines occur mid-year, costs are split over two calendar years.
Annual Number of Terminal Reports
Vessel Type Number of Reports
Year(s) Costs Incurred
Container/Reefer 3,742 Annually 2021 - 2032 Cruise 527 Annually 2021 - 2032 Auto/RoRo 1,017 Annually 2025 - 2032 Tankers – So. CA 577 Annually 2027 - 2032 Tankers – all other terminals
772 Annually 2029 - 2032
Total: 6,629
1 terminal report per vessel visit, based on the number of vessel visits to California terminals that would be regulated under the Draft Regulation. These values are equivalent to “All annual vessel visits” in Tables XIII, XIV, XV and XVI.
Annual Number of Vessel Reports
Vessel Type Number of Reports
Year(s) Costs Incurred
Container/Reefer 3,742 Annually 2021 - 2032 Cruise 527 Annually 2021 - 2032 Auto/RoRo 1,017 Annually 2025 - 2032 Tankers – So. CA 577 Annually 2027 - 2032 Tankers – all other terminals
772 Annually 2029 - 2032
Total: 6,629
1 vessel report per vessel visit, based on the number of vessel visits to California terminals that would be regulated under the Draft Regulation. These values are equivalent to “All annual vessel visits” in Tables XIII, XIV, XV and XVI.
Cost per Port Plan $10,000 per regulated terminal Staff estimate. Assumes 100 employee-hours at $100/hour
PRELIMINARY DISCUSSION DRAFT – DO NOT CITE OR QUOTE Updated: May 10, 2019
Page 11
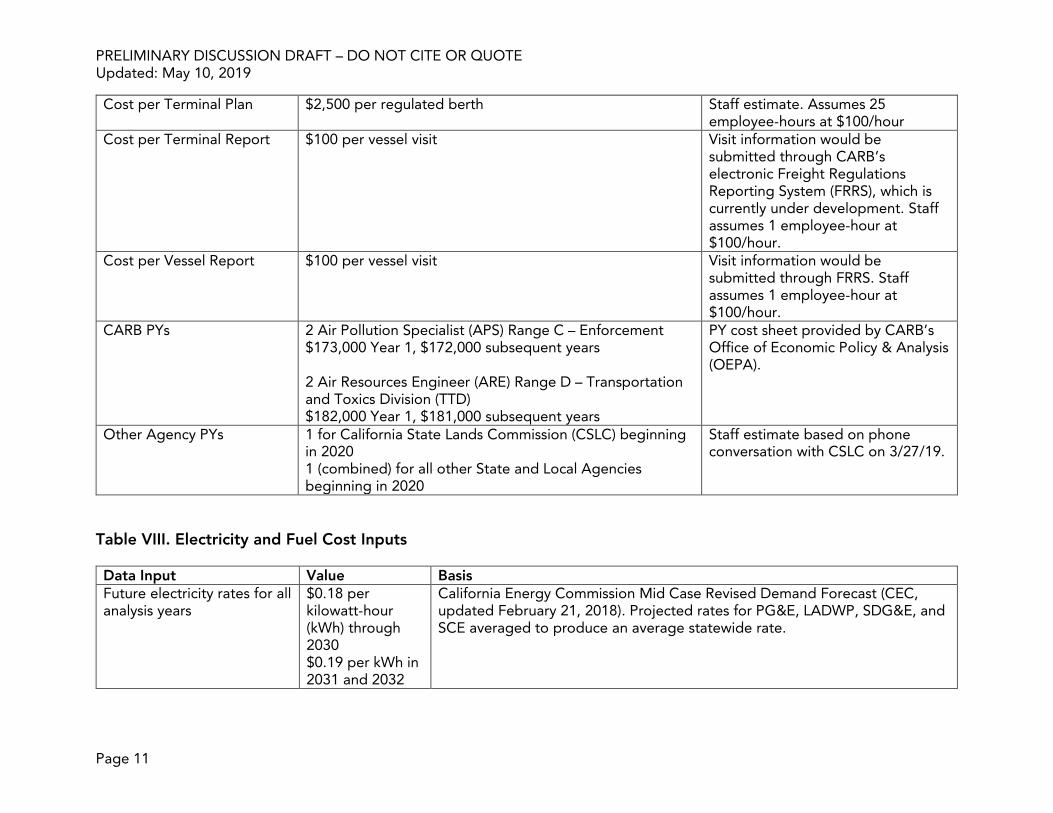
Cost per Terminal Plan $2,500 per regulated berth Staff estimate. Assumes 25 employee-hours at $100/hour
Cost per Terminal Report $100 per vessel visit Visit information would be submitted through CARB’s electronic Freight Regulations Reporting System (FRRS), which is currently under development. Staff assumes 1 employee-hour at $100/hour.
Cost per Vessel Report $100 per vessel visit Visit information would be submitted through FRRS. Staff assumes 1 employee-hour at $100/hour.
CARB PYs 2 Air Pollution Specialist (APS) Range C – Enforcement $173,000 Year 1, $172,000 subsequent years 2 Air Resources Engineer (ARE) Range D – Transportation and Toxics Division (TTD) $182,000 Year 1, $181,000 subsequent years
PY cost sheet provided by CARB’s Office of Economic Policy & Analysis (OEPA).
Other Agency PYs 1 for California State Lands Commission (CSLC) beginning in 2020 1 (combined) for all other State and Local Agencies beginning in 2020
Staff estimate based on phone conversation with CSLC on 3/27/19.
Table VIII. Electricity and Fuel Cost Inputs Data Input Value Basis Future electricity rates for all analysis years
$0.18 per kilowatt-hour (kWh) through 2030 $0.19 per kWh in 2031 and 2032
California Energy Commission Mid Case Revised Demand Forecast (CEC, updated February 21, 2018). Projected rates for PG&E, LADWP, SDG&E, and SCE averaged to produce an average statewide rate.
PRELIMINARY DISCUSSION DRAFT – DO NOT CITE OR QUOTE Updated: May 10, 2019
Page 12
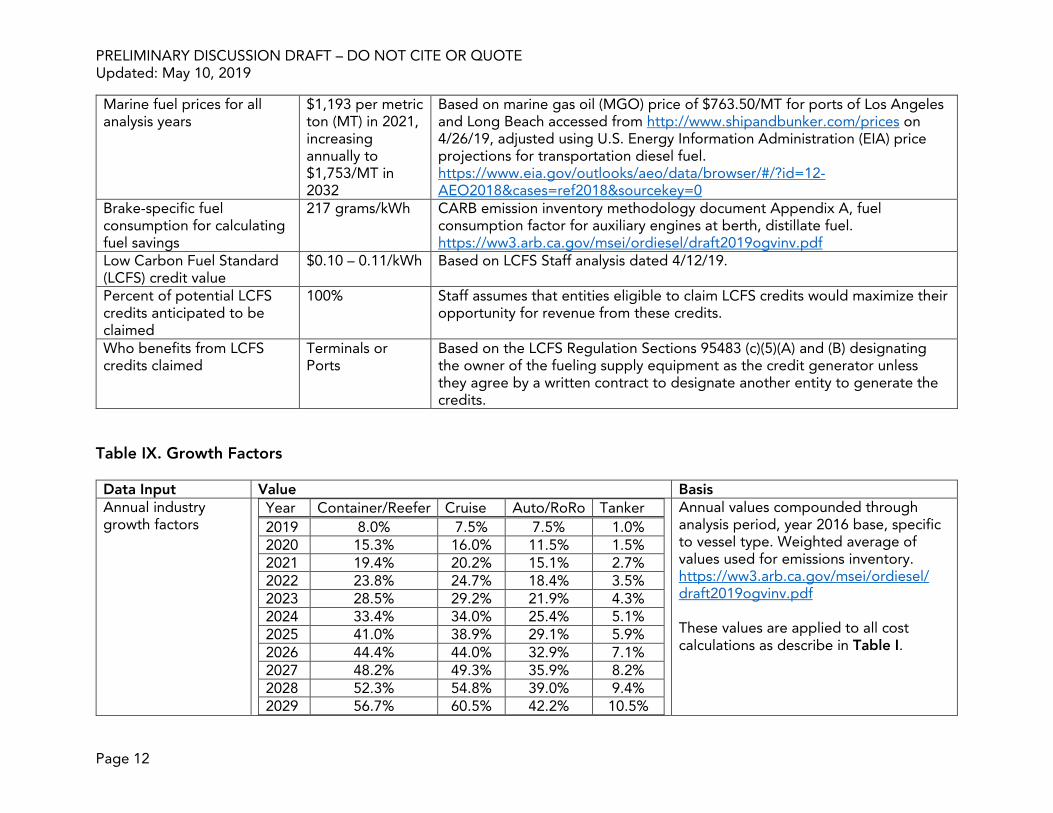
Marine fuel prices for all analysis years
$1,193 per metric ton (MT) in 2021, increasing annually to $1,753/MT in 2032
Based on marine gas oil (MGO) price of $763.50/MT for ports of Los Angeles and Long Beach accessed from http://www.shipandbunker.com/prices on 4/26/19, adjusted using U.S. Energy Information Administration (EIA) price projections for transportation diesel fuel. https://www.eia.gov/outlooks/aeo/data/browser/#/?id=12-AEO2018&cases=ref2018&sourcekey=0
Brake-specific fuel consumption for calculating fuel savings
217 grams/kWh CARB emission inventory methodology document Appendix A, fuel consumption factor for auxiliary engines at berth, distillate fuel. https://ww3.arb.ca.gov/msei/ordiesel/draft2019ogvinv.pdf
Low Carbon Fuel Standard (LCFS) credit value
$0.10 – 0.11/kWh Based on LCFS Staff analysis dated 4/12/19.
Percent of potential LCFS credits anticipated to be claimed
100% Staff assumes that entities eligible to claim LCFS credits would maximize their opportunity for revenue from these credits.
Who benefits from LCFS credits claimed
Terminals or Ports
Based on the LCFS Regulation Sections 95483 (c)(5)(A) and (B) designating the owner of the fueling supply equipment as the credit generator unless they agree by a written contract to designate another entity to generate the credits.
Table IX. Growth Factors Data Input Value Basis Annual industry growth factors
Year Container/Reefer Cruise Auto/RoRo Tanker 2019 8.0% 7.5% 7.5% 1.0% 2020 15.3% 16.0% 11.5% 1.5% 2021 19.4% 20.2% 15.1% 2.7% 2022 23.8% 24.7% 18.4% 3.5% 2023 28.5% 29.2% 21.9% 4.3% 2024 33.4% 34.0% 25.4% 5.1% 2025 41.0% 38.9% 29.1% 5.9% 2026 44.4% 44.0% 32.9% 7.1% 2027 48.2% 49.3% 35.9% 8.2% 2028 52.3% 54.8% 39.0% 9.4% 2029 56.7% 60.5% 42.2% 10.5%
Annual values compounded through analysis period, year 2016 base, specific to vessel type. Weighted average of values used for emissions inventory. https://ww3.arb.ca.gov/msei/ordiesel/ draft2019ogvinv.pdf These values are applied to all cost calculations as describe in Table I.
PRELIMINARY DISCUSSION DRAFT – DO NOT CITE OR QUOTE Updated: May 10, 2019
Page 13
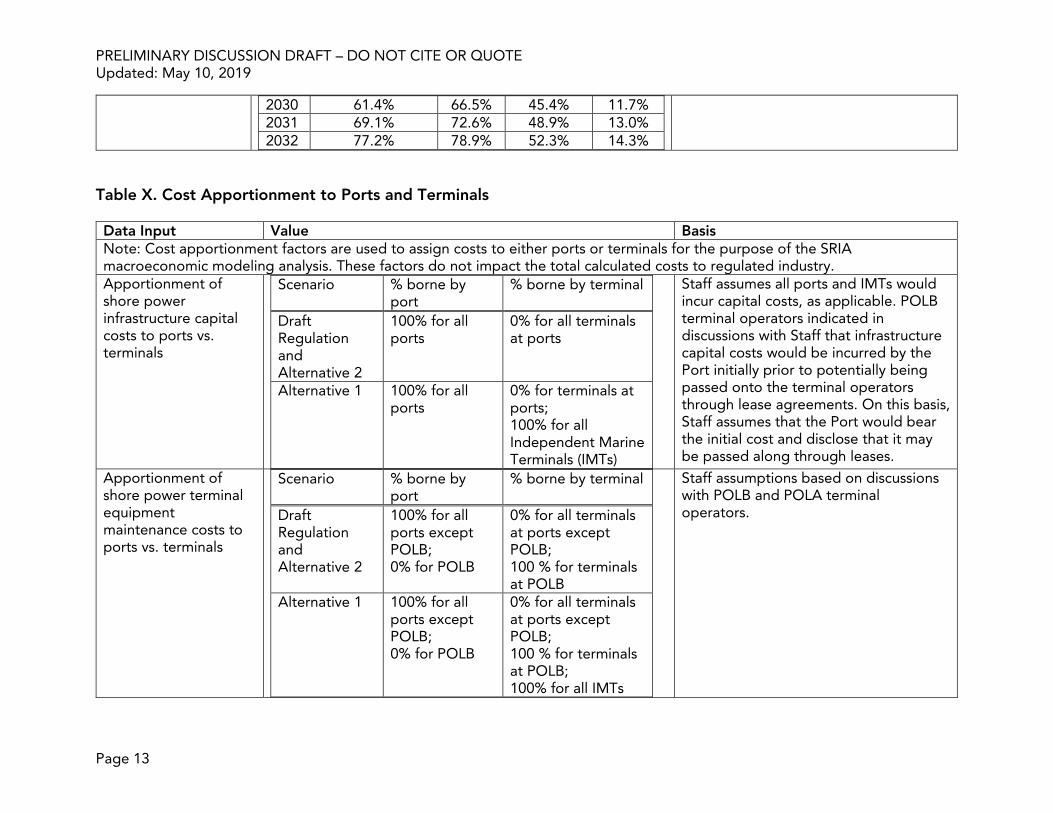
2030 61.4% 66.5% 45.4% 11.7% 2031 69.1% 72.6% 48.9% 13.0% 2032 77.2% 78.9% 52.3% 14.3%
Table X. Cost Apportionment to Ports and Terminals Data Input Value Basis Note: Cost apportionment factors are used to assign costs to either ports or terminals for the purpose of the SRIA macroeconomic modeling analysis. These factors do not impact the total calculated costs to regulated industry. Apportionment of shore power infrastructure capital costs to ports vs. terminals
Scenario % borne by port
% borne by terminal
Draft Regulation and Alternative 2
100% for all ports
0% for all terminals at ports
Alternative 1 100% for all ports
0% for terminals at ports; 100% for all Independent Marine Terminals (IMTs)
Staff assumes all ports and IMTs would incur capital costs, as applicable. POLB terminal operators indicated in discussions with Staff that infrastructure capital costs would be incurred by the Port initially prior to potentially being passed onto the terminal operators through lease agreements. On this basis, Staff assumes that the Port would bear the initial cost and disclose that it may be passed along through leases.
Apportionment of shore power terminal equipment maintenance costs to ports vs. terminals
Scenario % borne by port
% borne by terminal
Draft Regulation and Alternative 2
100% for all ports except POLB; 0% for POLB
0% for all terminals at ports except POLB; 100 % for terminals at POLB
Alternative 1 100% for all ports except POLB; 0% for POLB
0% for all terminals at ports except POLB; 100 % for terminals at POLB; 100% for all IMTs
Staff assumptions based on discussions with POLB and POLA terminal operators.
PRELIMINARY DISCUSSION DRAFT – DO NOT CITE OR QUOTE Updated: May 10, 2019
Page 14
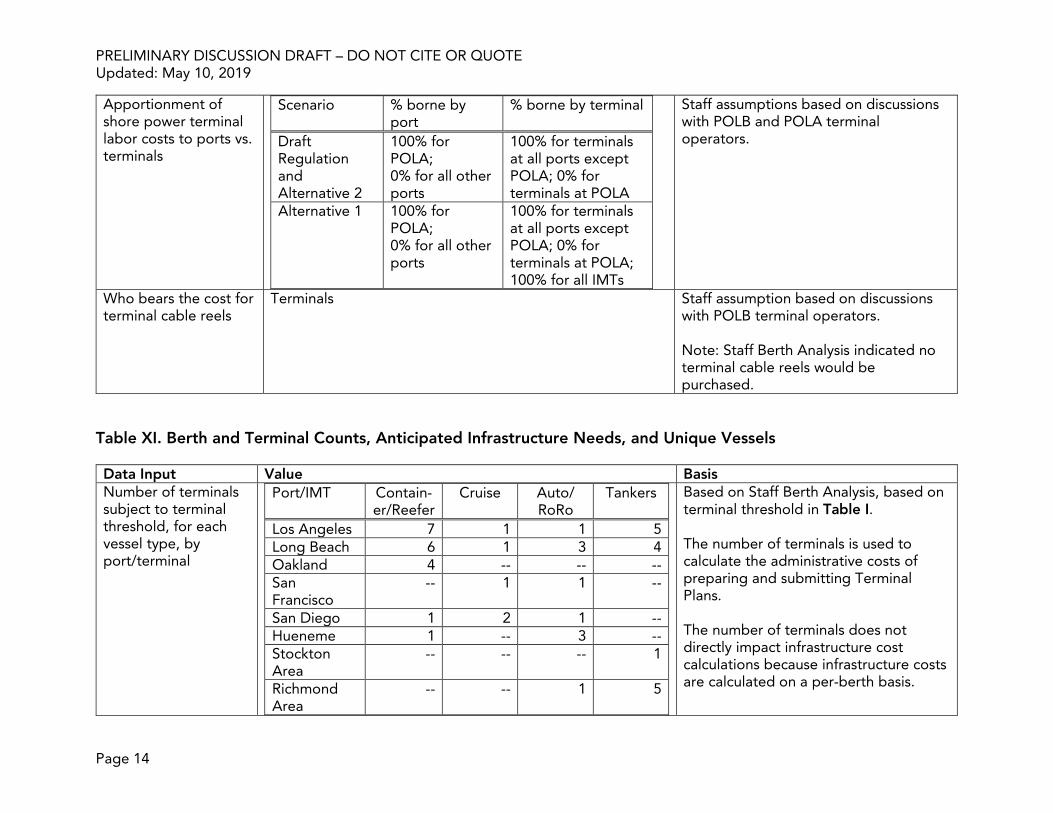
Apportionment of shore power terminal labor costs to ports vs. terminals
Scenario % borne by port
% borne by terminal
Draft Regulation and Alternative 2
100% for POLA; 0% for all other ports
100% for terminals at all ports except POLA; 0% for terminals at POLA
Alternative 1 100% for POLA; 0% for all other ports
100% for terminals at all ports except POLA; 0% for terminals at POLA; 100% for all IMTs
Staff assumptions based on discussions with POLB and POLA terminal operators.
Who bears the cost for terminal cable reels
Terminals Staff assumption based on discussions with POLB terminal operators. Note: Staff Berth Analysis indicated no terminal cable reels would be purchased.
Table XI. Berth and Terminal Counts, Anticipated Infrastructure Needs, and Unique Vessels Data Input Value Basis Number of terminals subject to terminal threshold, for each vessel type, by port/terminal
Port/IMT Contain-er/Reefer
Cruise Auto/ RoRo
Tankers
Los Angeles 7 1 1 5 Long Beach 6 1 3 4 Oakland 4 -- -- -- San Francisco
-- 1 1 --
San Diego 1 2 1 -- Hueneme 1 -- 3 -- Stockton Area
-- -- -- 1
Richmond Area
-- -- 1 5
Based on Staff Berth Analysis, based on terminal threshold in Table I. The number of terminals is used to calculate the administrative costs of preparing and submitting Terminal Plans. The number of terminals does not directly impact infrastructure cost calculations because infrastructure costs are calculated on a per-berth basis.
PRELIMINARY DISCUSSION DRAFT – DO NOT CITE OR QUOTE Updated: May 10, 2019
Page 15
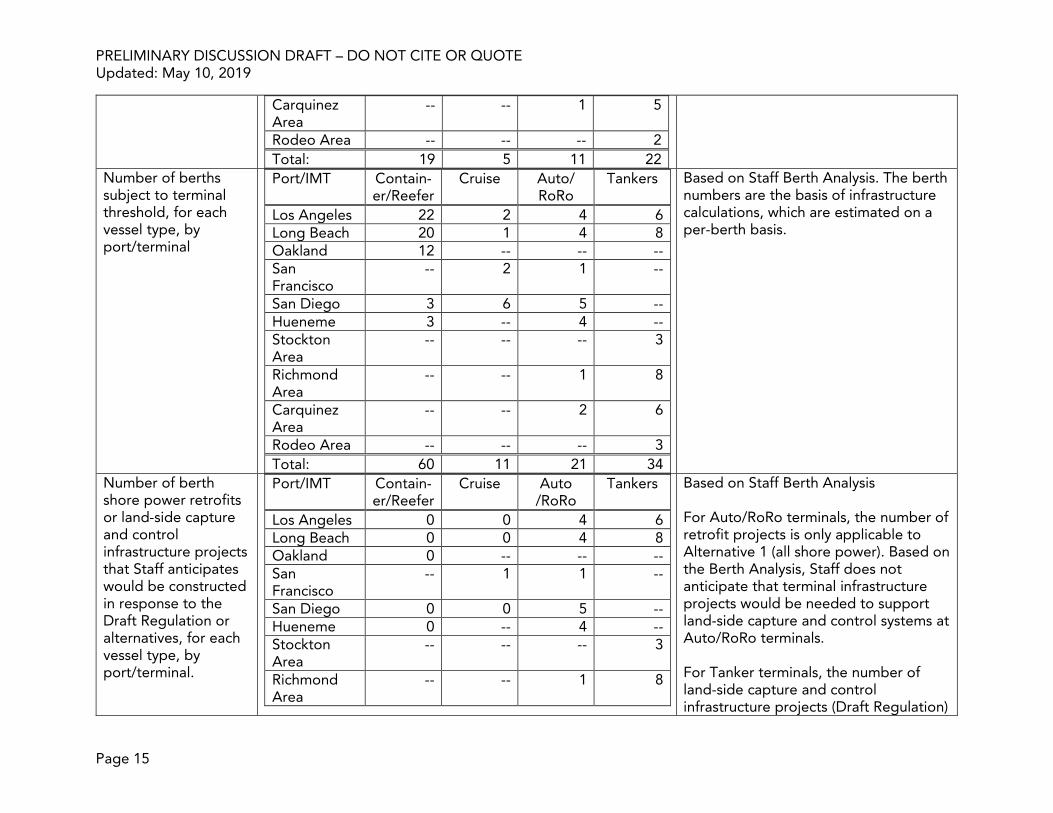
Carquinez Area
-- -- 1 5
Rodeo Area -- -- -- 2 Total: 19 5 11 22
Number of berths subject to terminal threshold, for each vessel type, by port/terminal
Port/IMT Contain-er/Reefer
Cruise Auto/ RoRo
Tankers
Los Angeles 22 2 4 6 Long Beach 20 1 4 8 Oakland 12 -- -- -- San Francisco
-- 2 1 --
San Diego 3 6 5 -- Hueneme 3 -- 4 -- Stockton Area
-- -- -- 3
Richmond Area
-- -- 1 8
Carquinez Area
-- -- 2 6
Rodeo Area -- -- -- 3 Total: 60 11 21 34
Based on Staff Berth Analysis. The berth numbers are the basis of infrastructure calculations, which are estimated on a per-berth basis.
Number of berth shore power retrofits or land-side capture and control infrastructure projects that Staff anticipates would be constructed in response to the Draft Regulation or alternatives, for each vessel type, by port/terminal.
Port/IMT Contain-er/Reefer
Cruise Auto /RoRo
Tankers
Los Angeles 0 0 4 6 Long Beach 0 0 4 8 Oakland 0 -- -- -- San Francisco
-- 1 1 --
San Diego 0 0 5 -- Hueneme 0 -- 4 -- Stockton Area
-- -- -- 3
Richmond Area
-- -- 1 8
Based on Staff Berth Analysis For Auto/RoRo terminals, the number of retrofit projects is only applicable to Alternative 1 (all shore power). Based on the Berth Analysis, Staff does not anticipate that terminal infrastructure projects would be needed to support land-side capture and control systems at Auto/RoRo terminals. For Tanker terminals, the number of land-side capture and control infrastructure projects (Draft Regulation)
PRELIMINARY DISCUSSION DRAFT – DO NOT CITE OR QUOTE Updated: May 10, 2019
Page 16
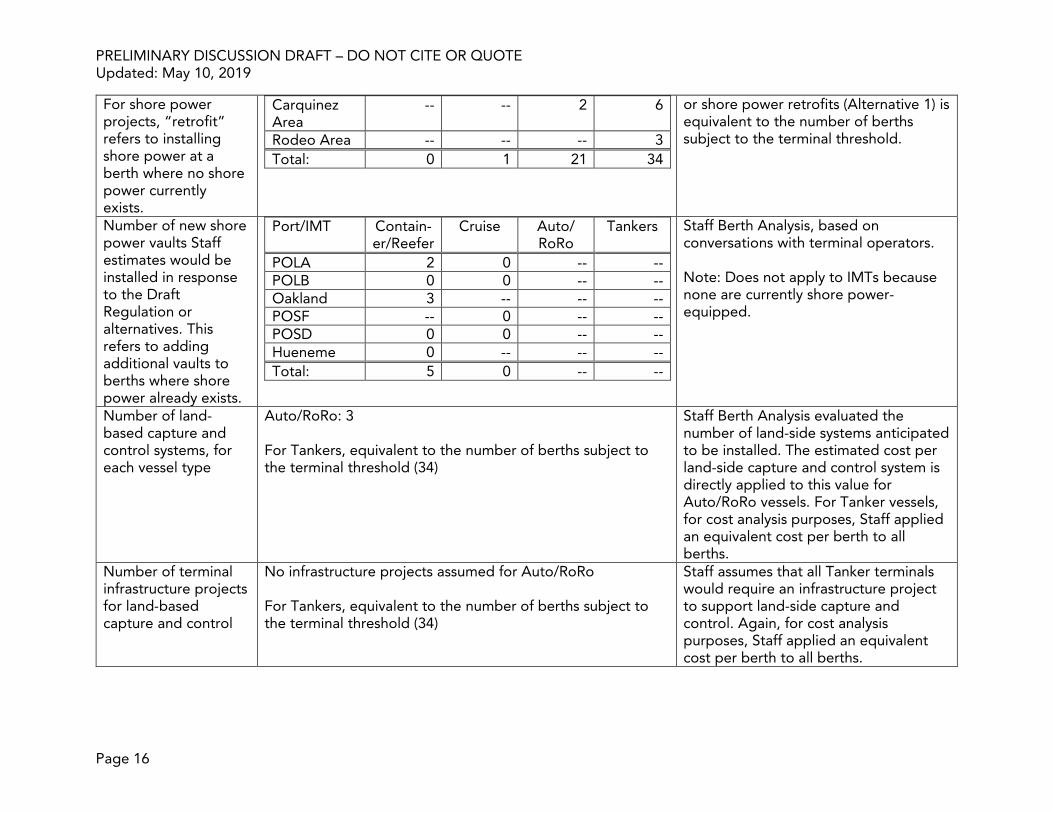
For shore power projects, “retrofit” refers to installing shore power at a berth where no shore power currently exists.
Carquinez Area
-- -- 2 6
Rodeo Area -- -- -- 3 Total: 0 1 21 34
or shore power retrofits (Alternative 1) is equivalent to the number of berths subject to the terminal threshold.
Number of new shore power vaults Staff estimates would be installed in response to the Draft Regulation or alternatives. This refers to adding additional vaults to berths where shore power already exists.
Port/IMT Contain-er/Reefer
Cruise Auto/ RoRo
Tankers
POLA 2 0 -- -- POLB 0 0 -- -- Oakland 3 -- -- -- POSF -- 0 -- -- POSD 0 0 -- -- Hueneme 0 -- -- -- Total: 5 0 -- --
Staff Berth Analysis, based on conversations with terminal operators. Note: Does not apply to IMTs because none are currently shore power-equipped.
Number of land-based capture and control systems, for each vessel type
Auto/RoRo: 3 For Tankers, equivalent to the number of berths subject to the terminal threshold (34)
Staff Berth Analysis evaluated the number of land-side systems anticipated to be installed. The estimated cost per land-side capture and control system is directly applied to this value for Auto/RoRo vessels. For Tanker vessels, for cost analysis purposes, Staff applied an equivalent cost per berth to all berths.
Number of terminal infrastructure projects for land-based capture and control
No infrastructure projects assumed for Auto/RoRo For Tankers, equivalent to the number of berths subject to the terminal threshold (34)
Staff assumes that all Tanker terminals would require an infrastructure project to support land-side capture and control. Again, for cost analysis purposes, Staff applied an equivalent cost per berth to all berths.
PRELIMINARY DISCUSSION DRAFT – DO NOT CITE OR QUOTE Updated: May 10, 2019
Page 17
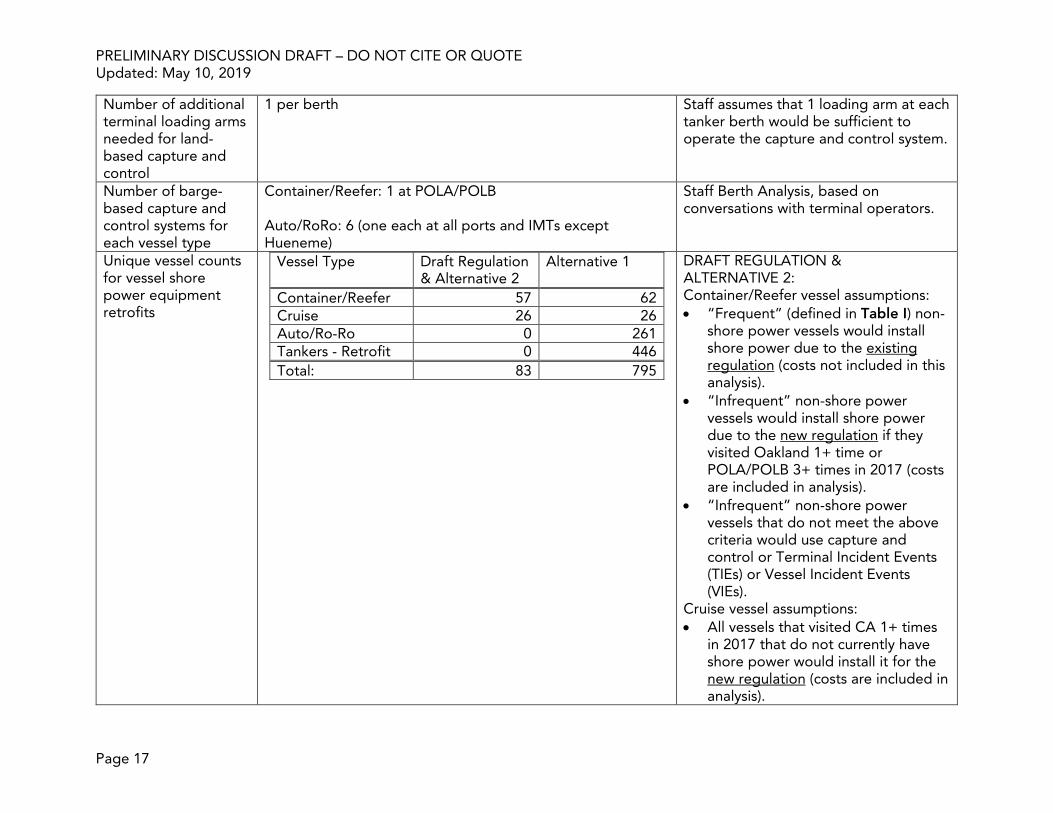
Number of additional terminal loading arms needed for land-based capture and control
1 per berth Staff assumes that 1 loading arm at each tanker berth would be sufficient to operate the capture and control system.
Number of barge-based capture and control systems for each vessel type
Container/Reefer: 1 at POLA/POLB Auto/RoRo: 6 (one each at all ports and IMTs except Hueneme)
Staff Berth Analysis, based on conversations with terminal operators.
Unique vessel counts for vessel shore power equipment retrofits
Vessel Type Draft Regulation & Alternative 2
Alternative 1
Container/Reefer 57 62 Cruise 26 26 Auto/Ro-Ro 0 261 Tankers - Retrofit 0 446 Total: 83 795
DRAFT REGULATION & ALTERNATIVE 2: Container/Reefer vessel assumptions: • “Frequent” (defined in Table I) non-
shore power vessels would install shore power due to the existing regulation (costs not included in this analysis).
• “Infrequent” non-shore power vessels would install shore power due to the new regulation if they visited Oakland 1+ time or POLA/POLB 3+ times in 2017 (costs are included in analysis).
• “Infrequent” non-shore power vessels that do not meet the above criteria would use capture and control or Terminal Incident Events (TIEs) or Vessel Incident Events (VIEs).
Cruise vessel assumptions: • All vessels that visited CA 1+ times
in 2017 that do not currently have shore power would install it for the new regulation (costs are included in analysis).
PRELIMINARY DISCUSSION DRAFT – DO NOT CITE OR QUOTE Updated: May 10, 2019
Page 18
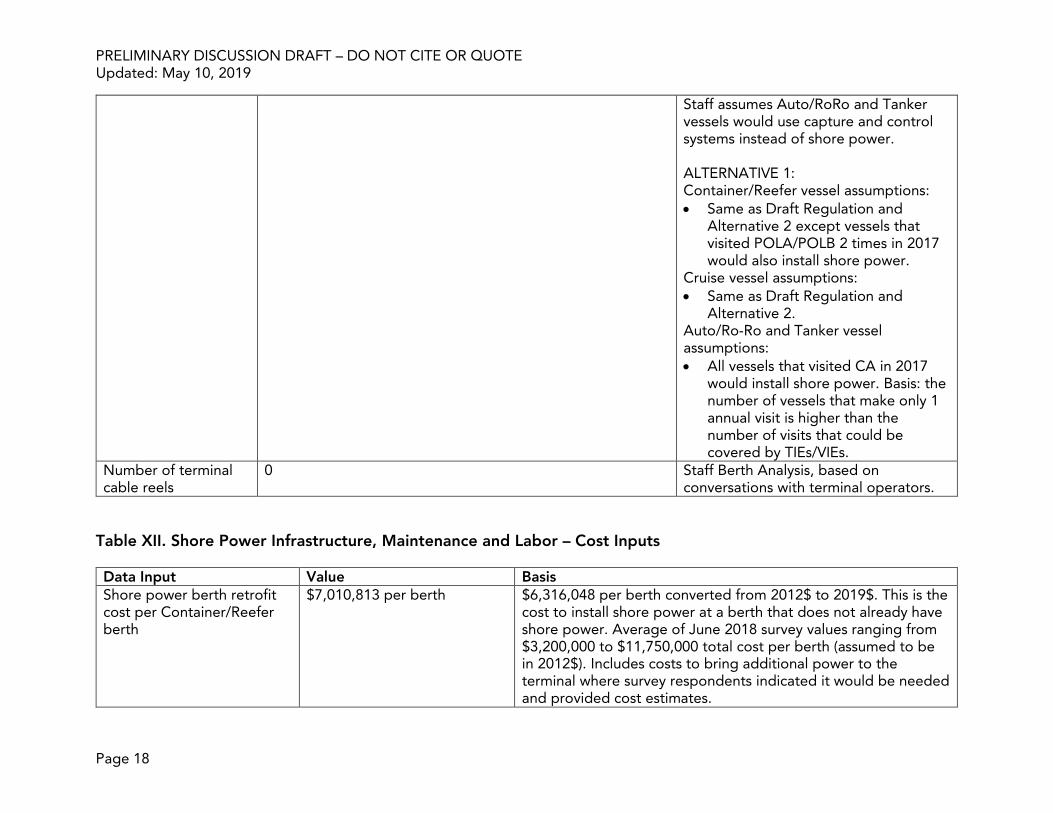
Staff assumes Auto/RoRo and Tanker vessels would use capture and control systems instead of shore power. ALTERNATIVE 1: Container/Reefer vessel assumptions: • Same as Draft Regulation and
Alternative 2 except vessels that visited POLA/POLB 2 times in 2017 would also install shore power.
Cruise vessel assumptions: • Same as Draft Regulation and
Alternative 2. Auto/Ro-Ro and Tanker vessel assumptions: • All vessels that visited CA in 2017
would install shore power. Basis: the number of vessels that make only 1 annual visit is higher than the number of visits that could be covered by TIEs/VIEs.
Number of terminal cable reels
0 Staff Berth Analysis, based on conversations with terminal operators.
Table XII. Shore Power Infrastructure, Maintenance and Labor – Cost Inputs Data Input Value Basis Shore power berth retrofit cost per Container/Reefer berth
$7,010,813 per berth $6,316,048 per berth converted from 2012$ to 2019$. This is the cost to install shore power at a berth that does not already have shore power. Average of June 2018 survey values ranging from $3,200,000 to $11,750,000 total cost per berth (assumed to be in 2012$). Includes costs to bring additional power to the terminal where survey respondents indicated it would be needed and provided cost estimates.
PRELIMINARY DISCUSSION DRAFT – DO NOT CITE OR QUOTE Updated: May 10, 2019
Page 19
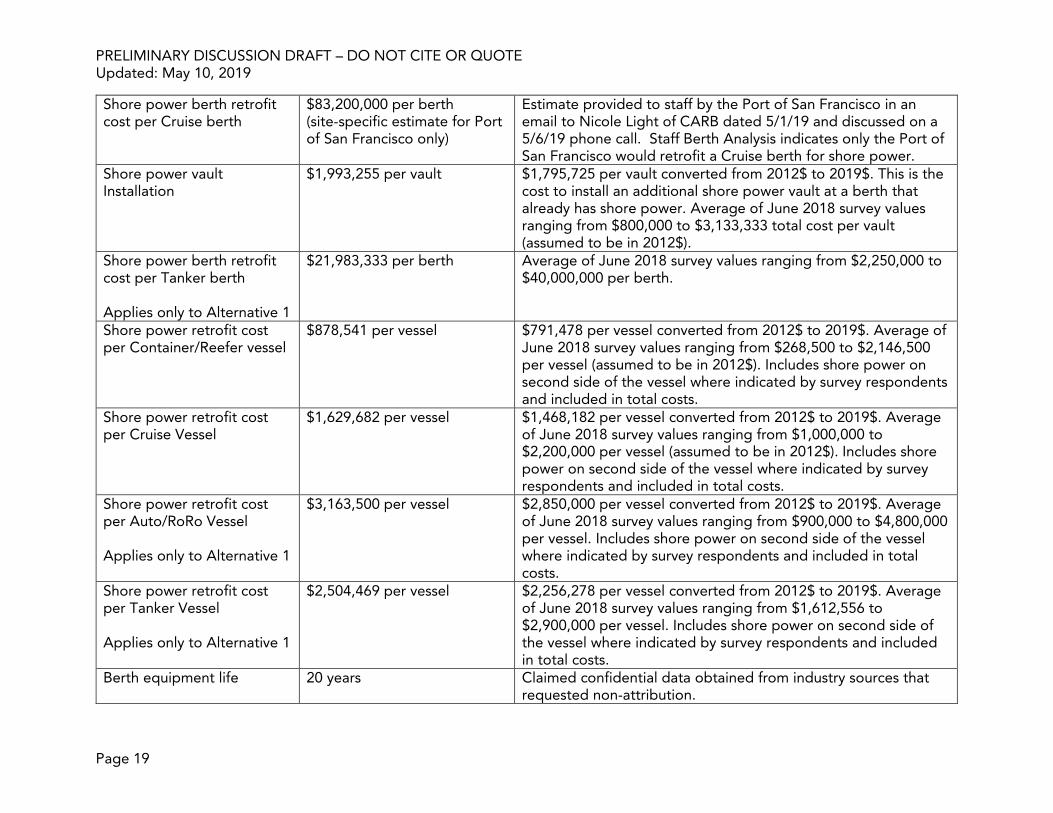
Shore power berth retrofit cost per Cruise berth
$83,200,000 per berth (site-specific estimate for Port of San Francisco only)
Estimate provided to staff by the Port of San Francisco in an email to Nicole Light of CARB dated 5/1/19 and discussed on a 5/6/19 phone call. Staff Berth Analysis indicates only the Port of San Francisco would retrofit a Cruise berth for shore power.
Shore power vault Installation
$1,993,255 per vault $1,795,725 per vault converted from 2012$ to 2019$. This is the cost to install an additional shore power vault at a berth that already has shore power. Average of June 2018 survey values ranging from $800,000 to $3,133,333 total cost per vault (assumed to be in 2012$).
Shore power berth retrofit cost per Tanker berth Applies only to Alternative 1
$21,983,333 per berth Average of June 2018 survey values ranging from $2,250,000 to $40,000,000 per berth.
Shore power retrofit cost per Container/Reefer vessel
$878,541 per vessel $791,478 per vessel converted from 2012$ to 2019$. Average of June 2018 survey values ranging from $268,500 to $2,146,500 per vessel (assumed to be in 2012$). Includes shore power on second side of the vessel where indicated by survey respondents and included in total costs.
Shore power retrofit cost per Cruise Vessel
$1,629,682 per vessel $1,468,182 per vessel converted from 2012$ to 2019$. Average of June 2018 survey values ranging from $1,000,000 to $2,200,000 per vessel (assumed to be in 2012$). Includes shore power on second side of the vessel where indicated by survey respondents and included in total costs.
Shore power retrofit cost per Auto/RoRo Vessel Applies only to Alternative 1
$3,163,500 per vessel $2,850,000 per vessel converted from 2012$ to 2019$. Average of June 2018 survey values ranging from $900,000 to $4,800,000 per vessel. Includes shore power on second side of the vessel where indicated by survey respondents and included in total costs.
Shore power retrofit cost per Tanker Vessel Applies only to Alternative 1
$2,504,469 per vessel $2,256,278 per vessel converted from 2012$ to 2019$. Average of June 2018 survey values ranging from $1,612,556 to $2,900,000 per vessel. Includes shore power on second side of the vessel where indicated by survey respondents and included in total costs.
Berth equipment life 20 years Claimed confidential data obtained from industry sources that requested non-attribution.
PRELIMINARY DISCUSSION DRAFT – DO NOT CITE OR QUOTE Updated: May 10, 2019
Page 20
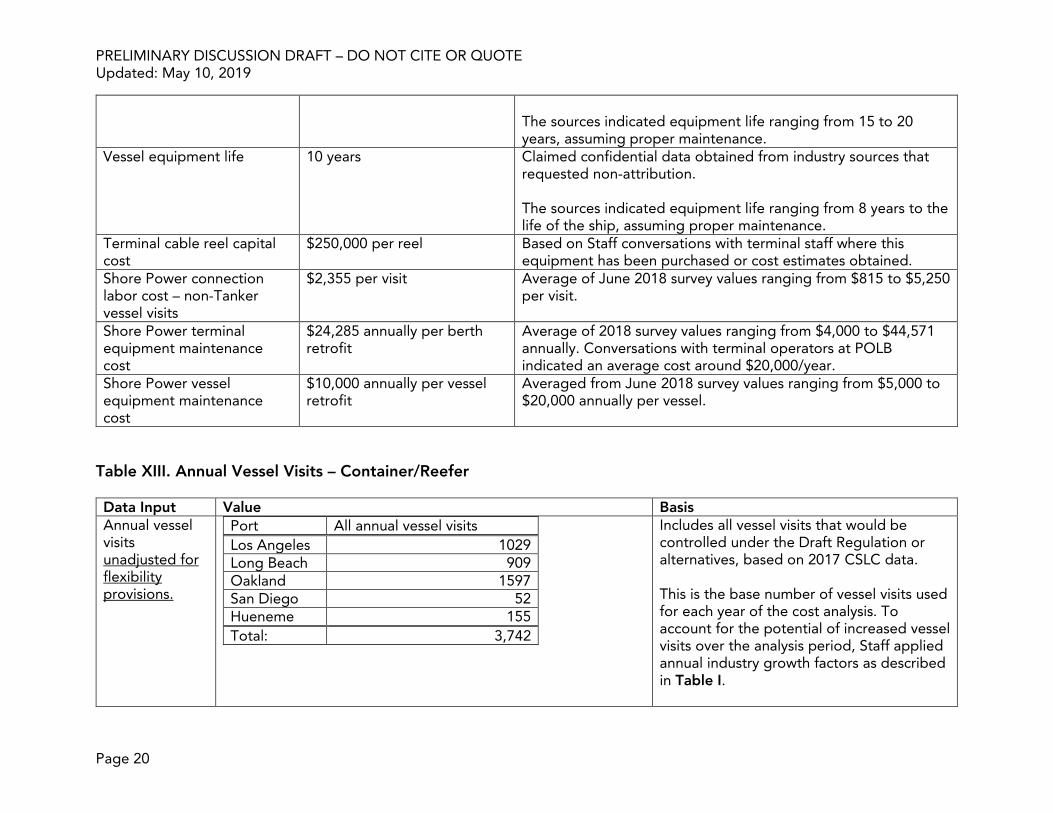
The sources indicated equipment life ranging from 15 to 20 years, assuming proper maintenance.
Vessel equipment life 10 years Claimed confidential data obtained from industry sources that requested non-attribution. The sources indicated equipment life ranging from 8 years to the life of the ship, assuming proper maintenance.
Terminal cable reel capital cost
$250,000 per reel Based on Staff conversations with terminal staff where this equipment has been purchased or cost estimates obtained.
Shore Power connection labor cost – non-Tanker vessel visits
$2,355 per visit Average of June 2018 survey values ranging from $815 to $5,250 per visit.
Shore Power terminal equipment maintenance cost
$24,285 annually per berth retrofit
Average of 2018 survey values ranging from $4,000 to $44,571 annually. Conversations with terminal operators at POLB indicated an average cost around $20,000/year.
Shore Power vessel equipment maintenance cost
$10,000 annually per vessel retrofit
Averaged from June 2018 survey values ranging from $5,000 to $20,000 annually per vessel.
Table XIII. Annual Vessel Visits – Container/Reefer Data Input Value Basis Annual vessel visits unadjusted for flexibility provisions.
Port All annual vessel visits Los Angeles 1029 Long Beach 909 Oakland 1597 San Diego 52 Hueneme 155 Total: 3,742
Includes all vessel visits that would be controlled under the Draft Regulation or alternatives, based on 2017 CSLC data. This is the base number of vessel visits used for each year of the cost analysis. To account for the potential of increased vessel visits over the analysis period, Staff applied annual industry growth factors as described in Table I.
PRELIMINARY DISCUSSION DRAFT – DO NOT CITE OR QUOTE Updated: May 10, 2019
Page 21
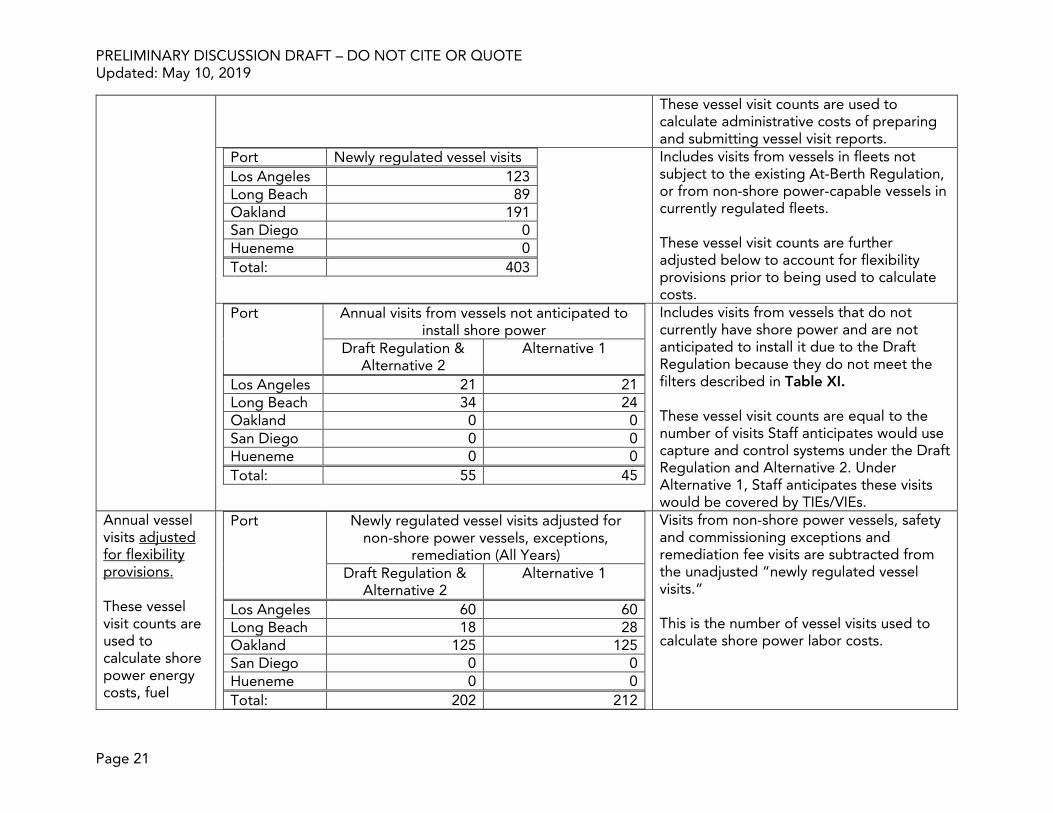
These vessel visit counts are used to calculate administrative costs of preparing and submitting vessel visit reports.
Port Newly regulated vessel visits Los Angeles 123 Long Beach 89 Oakland 191 San Diego 0 Hueneme 0 Total: 403
Includes visits from vessels in fleets not subject to the existing At-Berth Regulation, or from non-shore power-capable vessels in currently regulated fleets. These vessel visit counts are further adjusted below to account for flexibility provisions prior to being used to calculate costs.
Port Annual visits from vessels not anticipated to install shore power
Draft Regulation & Alternative 2
Alternative 1
Los Angeles 21 21 Long Beach 34 24 Oakland 0 0 San Diego 0 0 Hueneme 0 0 Total: 55 45
Includes visits from vessels that do not currently have shore power and are not anticipated to install it due to the Draft Regulation because they do not meet the filters described in Table XI. These vessel visit counts are equal to the number of visits Staff anticipates would use capture and control systems under the Draft Regulation and Alternative 2. Under Alternative 1, Staff anticipates these visits would be covered by TIEs/VIEs.
Annual vessel visits adjusted for flexibility provisions. These vessel visit counts are used to calculate shore power energy costs, fuel
Port
Newly regulated vessel visits adjusted for non-shore power vessels, exceptions,
remediation (All Years) Draft Regulation &
Alternative 2 Alternative 1
Los Angeles 60 60 Long Beach 18 28 Oakland 125 125 San Diego 0 0 Hueneme 0 0 Total: 202 212
Visits from non-shore power vessels, safety and commissioning exceptions and remediation fee visits are subtracted from the unadjusted “newly regulated vessel visits.” This is the number of vessel visits used to calculate shore power labor costs.
PRELIMINARY DISCUSSION DRAFT – DO NOT CITE OR QUOTE Updated: May 10, 2019
Page 22
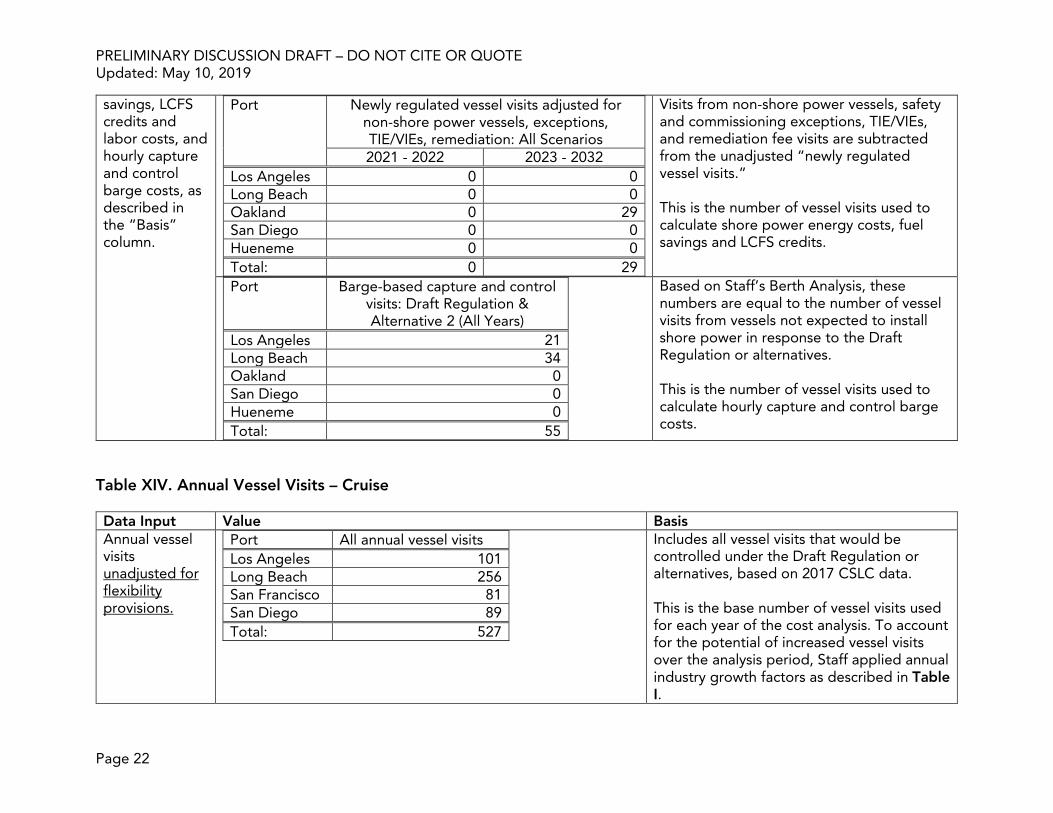
savings, LCFS credits and labor costs, and hourly capture and control barge costs, as described in the “Basis” column.
Port
Newly regulated vessel visits adjusted for non-shore power vessels, exceptions, TIE/VIEs, remediation: All Scenarios 2021 - 2022 2023 - 2032
Los Angeles 0 0 Long Beach 0 0 Oakland 0 29 San Diego 0 0 Hueneme 0 0 Total: 0 29
Visits from non-shore power vessels, safety and commissioning exceptions, TIE/VIEs, and remediation fee visits are subtracted from the unadjusted “newly regulated vessel visits.” This is the number of vessel visits used to calculate shore power energy costs, fuel savings and LCFS credits.
Port
Barge-based capture and control visits: Draft Regulation & Alternative 2 (All Years)
Los Angeles 21 Long Beach 34 Oakland 0 San Diego 0 Hueneme 0 Total: 55
Based on Staff’s Berth Analysis, these numbers are equal to the number of vessel visits from vessels not expected to install shore power in response to the Draft Regulation or alternatives. This is the number of vessel visits used to calculate hourly capture and control barge costs.
Table XIV. Annual Vessel Visits – Cruise Data Input Value Basis Annual vessel visits unadjusted for flexibility provisions.
Port All annual vessel visits Los Angeles 101 Long Beach 256 San Francisco 81 San Diego 89 Total: 527
Includes all vessel visits that would be controlled under the Draft Regulation or alternatives, based on 2017 CSLC data. This is the base number of vessel visits used for each year of the cost analysis. To account for the potential of increased vessel visits over the analysis period, Staff applied annual industry growth factors as described in Table I.
PRELIMINARY DISCUSSION DRAFT – DO NOT CITE OR QUOTE Updated: May 10, 2019
Page 23
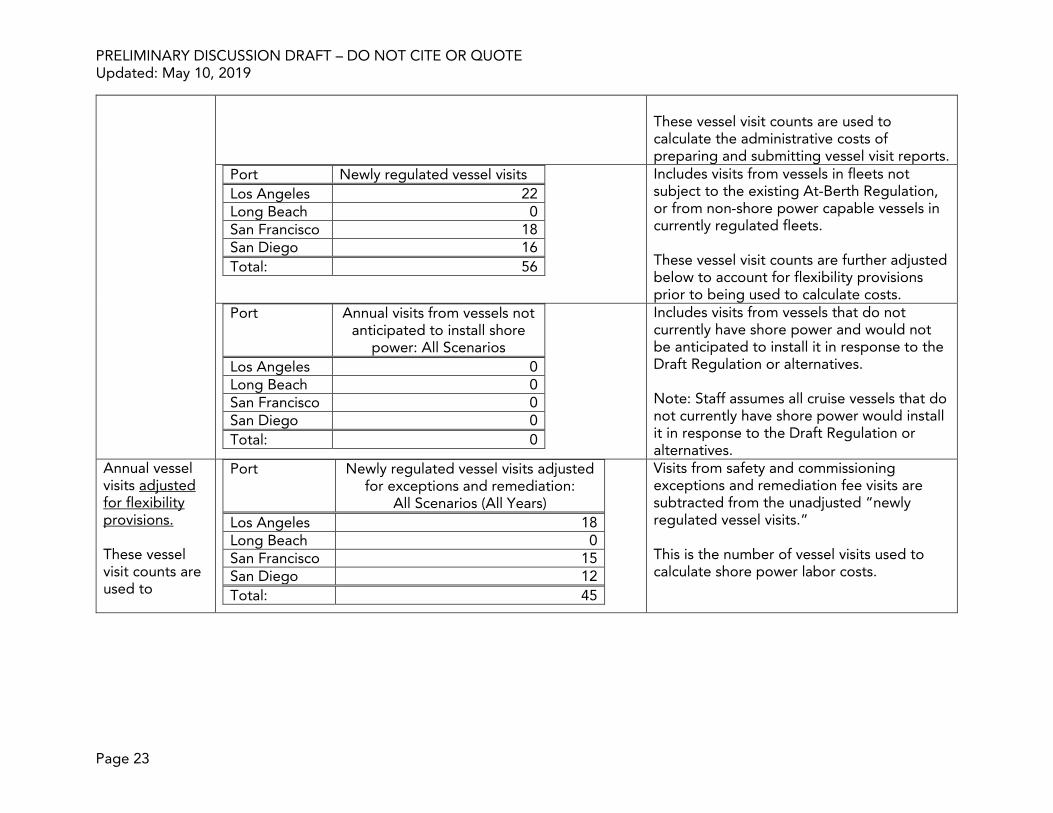
These vessel visit counts are used to calculate the administrative costs of preparing and submitting vessel visit reports.
Port Newly regulated vessel visits Los Angeles 22 Long Beach 0 San Francisco 18 San Diego 16 Total: 56
Includes visits from vessels in fleets not subject to the existing At-Berth Regulation, or from non-shore power capable vessels in currently regulated fleets. These vessel visit counts are further adjusted below to account for flexibility provisions prior to being used to calculate costs.
Port Annual visits from vessels not anticipated to install shore
power: All Scenarios Los Angeles 0 Long Beach 0 San Francisco 0 San Diego 0 Total: 0
Includes visits from vessels that do not currently have shore power and would not be anticipated to install it in response to the Draft Regulation or alternatives. Note: Staff assumes all cruise vessels that do not currently have shore power would install it in response to the Draft Regulation or alternatives.
Annual vessel visits adjusted for flexibility provisions. These vessel visit counts are used to
Port
Newly regulated vessel visits adjusted for exceptions and remediation:
All Scenarios (All Years) Los Angeles 18 Long Beach 0 San Francisco 15 San Diego 12 Total: 45
Visits from safety and commissioning exceptions and remediation fee visits are subtracted from the unadjusted “newly regulated vessel visits.” This is the number of vessel visits used to calculate shore power labor costs.
PRELIMINARY DISCUSSION DRAFT – DO NOT CITE OR QUOTE Updated: May 10, 2019
Page 24
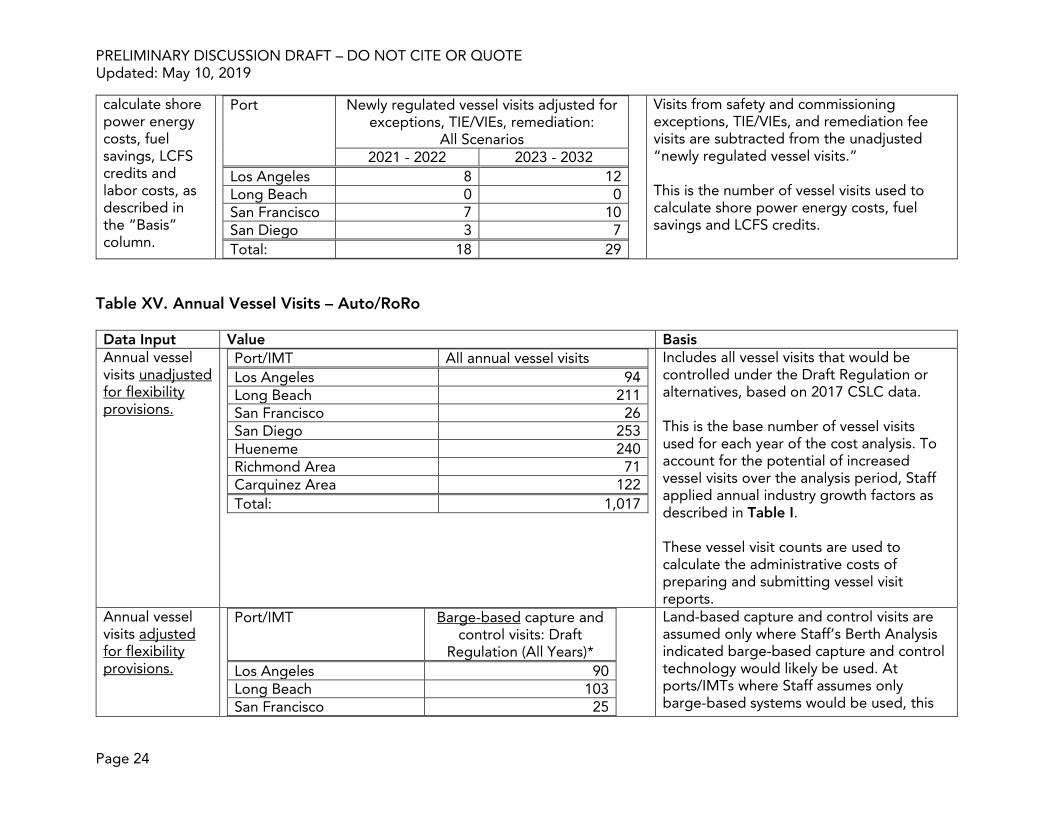
calculate shore power energy costs, fuel savings, LCFS credits and labor costs, as described in the “Basis” column.
Port
Newly regulated vessel visits adjusted for exceptions, TIE/VIEs, remediation:
All Scenarios 2021 - 2022 2023 - 2032
Los Angeles 8 12 Long Beach 0 0 San Francisco 7 10 San Diego 3 7 Total: 18 29
Visits from safety and commissioning exceptions, TIE/VIEs, and remediation fee visits are subtracted from the unadjusted “newly regulated vessel visits.” This is the number of vessel visits used to calculate shore power energy costs, fuel savings and LCFS credits.
Table XV. Annual Vessel Visits – Auto/RoRo Data Input Value Basis Annual vessel visits unadjusted for flexibility provisions.
Port/IMT All annual vessel visits Los Angeles 94 Long Beach 211 San Francisco 26 San Diego 253 Hueneme 240 Richmond Area 71 Carquinez Area 122 Total: 1,017
Includes all vessel visits that would be controlled under the Draft Regulation or alternatives, based on 2017 CSLC data. This is the base number of vessel visits used for each year of the cost analysis. To account for the potential of increased vessel visits over the analysis period, Staff applied annual industry growth factors as described in Table I. These vessel visit counts are used to calculate the administrative costs of preparing and submitting vessel visit reports.
Annual vessel visits adjusted for flexibility provisions.
Port/IMT
Barge-based capture and control visits: Draft
Regulation (All Years)* Los Angeles 90 Long Beach 103 San Francisco 25
Land-based capture and control visits are assumed only where Staff’s Berth Analysis indicated barge-based capture and control technology would likely be used. At ports/IMTs where Staff assumes only barge-based systems would be used, this
PRELIMINARY DISCUSSION DRAFT – DO NOT CITE OR QUOTE Updated: May 10, 2019
Page 25
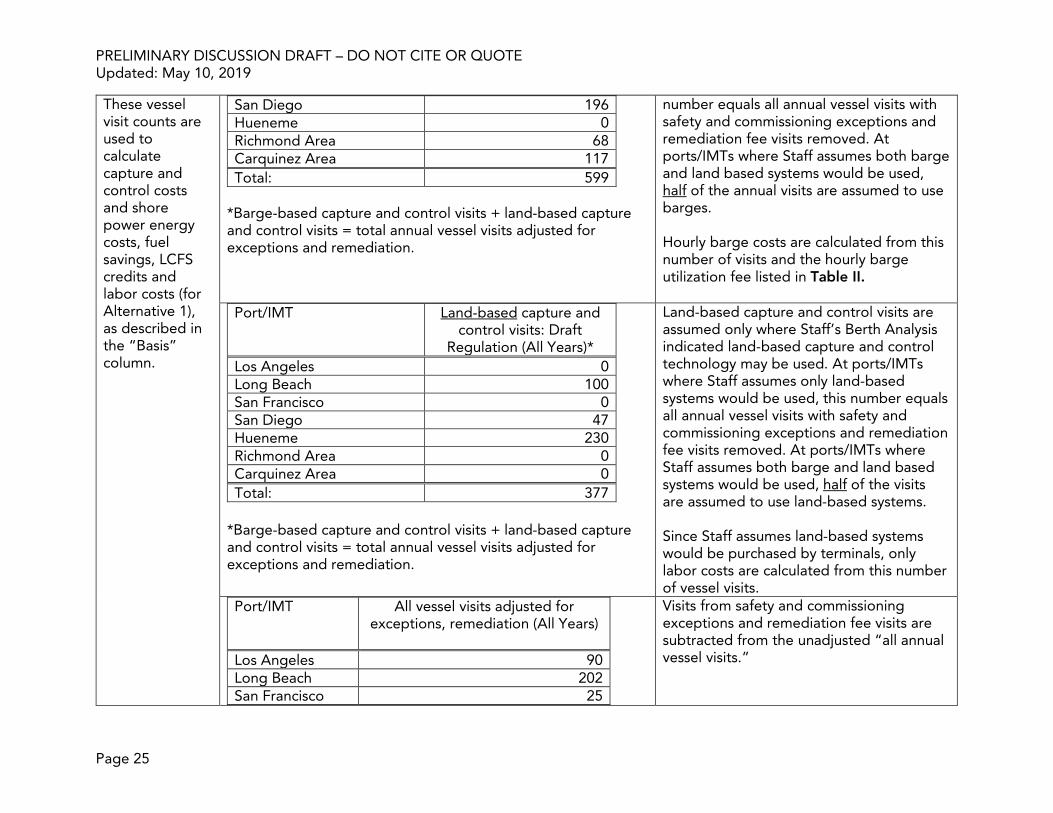
These vessel visit counts are used to calculate capture and control costs and shore power energy costs, fuel savings, LCFS credits and labor costs (for Alternative 1), as described in the “Basis” column.
San Diego 196 Hueneme 0 Richmond Area 68 Carquinez Area 117 Total: 599
*Barge-based capture and control visits + land-based capture and control visits = total annual vessel visits adjusted for exceptions and remediation.
number equals all annual vessel visits with safety and commissioning exceptions and remediation fee visits removed. At ports/IMTs where Staff assumes both barge and land based systems would be used, half of the annual visits are assumed to use barges. Hourly barge costs are calculated from this number of visits and the hourly barge utilization fee listed in Table II.
Port/IMT
Land-based capture and control visits: Draft
Regulation (All Years)* Los Angeles 0 Long Beach 100 San Francisco 0 San Diego 47 Hueneme 230 Richmond Area 0 Carquinez Area 0 Total: 377
*Barge-based capture and control visits + land-based capture and control visits = total annual vessel visits adjusted for exceptions and remediation.
Land-based capture and control visits are assumed only where Staff’s Berth Analysis indicated land-based capture and control technology may be used. At ports/IMTs where Staff assumes only land-based systems would be used, this number equals all annual vessel visits with safety and commissioning exceptions and remediation fee visits removed. At ports/IMTs where Staff assumes both barge and land based systems would be used, half of the visits are assumed to use land-based systems. Since Staff assumes land-based systems would be purchased by terminals, only labor costs are calculated from this number of vessel visits.
Port/IMT
All vessel visits adjusted for exceptions, remediation (All Years)
Los Angeles 90 Long Beach 202 San Francisco 25
Visits from safety and commissioning exceptions and remediation fee visits are subtracted from the unadjusted “all annual vessel visits.”
PRELIMINARY DISCUSSION DRAFT – DO NOT CITE OR QUOTE Updated: May 10, 2019
Page 26
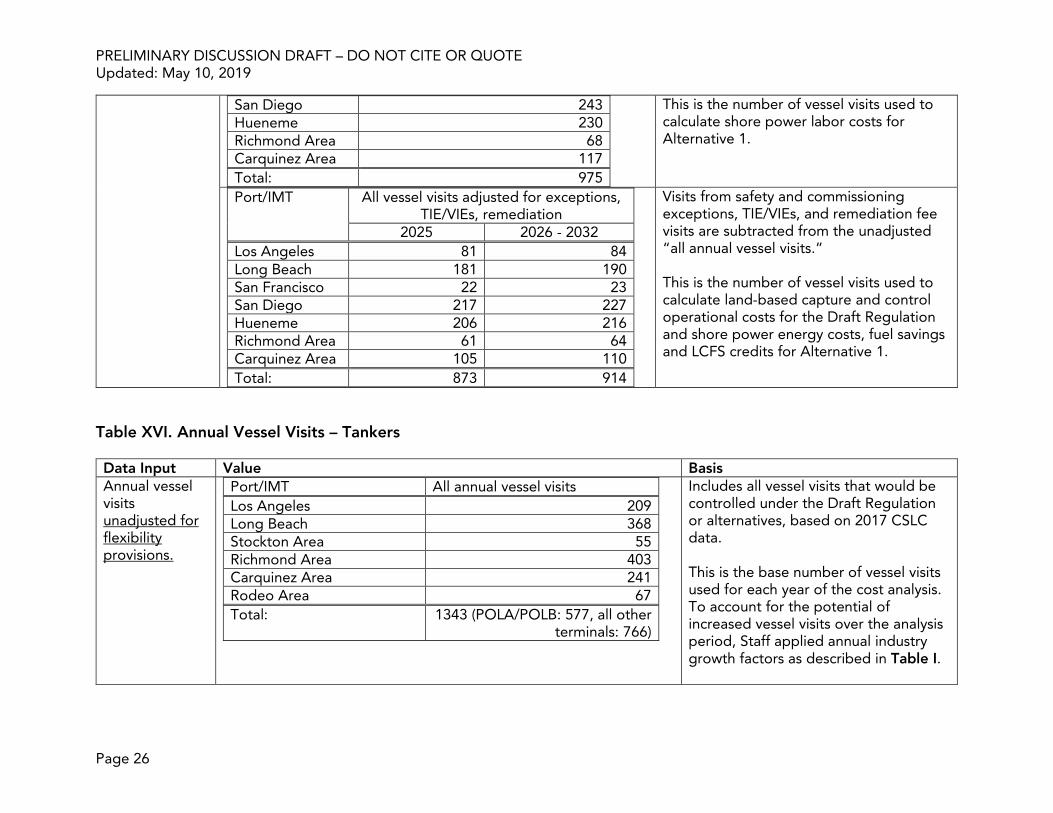
San Diego 243 Hueneme 230 Richmond Area 68 Carquinez Area 117 Total: 975
This is the number of vessel visits used to calculate shore power labor costs for Alternative 1.
Port/IMT
All vessel visits adjusted for exceptions, TIE/VIEs, remediation
2025 2026 - 2032 Los Angeles 81 84 Long Beach 181 190 San Francisco 22 23 San Diego 217 227 Hueneme 206 216 Richmond Area 61 64 Carquinez Area 105 110 Total: 873 914
Visits from safety and commissioning exceptions, TIE/VIEs, and remediation fee visits are subtracted from the unadjusted “all annual vessel visits.” This is the number of vessel visits used to calculate land-based capture and control operational costs for the Draft Regulation and shore power energy costs, fuel savings and LCFS credits for Alternative 1.
Table XVI. Annual Vessel Visits – Tankers Data Input Value Basis Annual vessel visits unadjusted for flexibility provisions.
Port/IMT All annual vessel visits Los Angeles 209 Long Beach 368 Stockton Area 55 Richmond Area 403 Carquinez Area 241 Rodeo Area 67 Total: 1343 (POLA/POLB: 577, all other
terminals: 766)
Includes all vessel visits that would be controlled under the Draft Regulation or alternatives, based on 2017 CSLC data. This is the base number of vessel visits used for each year of the cost analysis. To account for the potential of increased vessel visits over the analysis period, Staff applied annual industry growth factors as described in Table I.
PRELIMINARY DISCUSSION DRAFT – DO NOT CITE OR QUOTE Updated: May 10, 2019
Page 27
These vessel visit counts are used to calculate the administrative costs of preparing and submitting vessel visit reports.
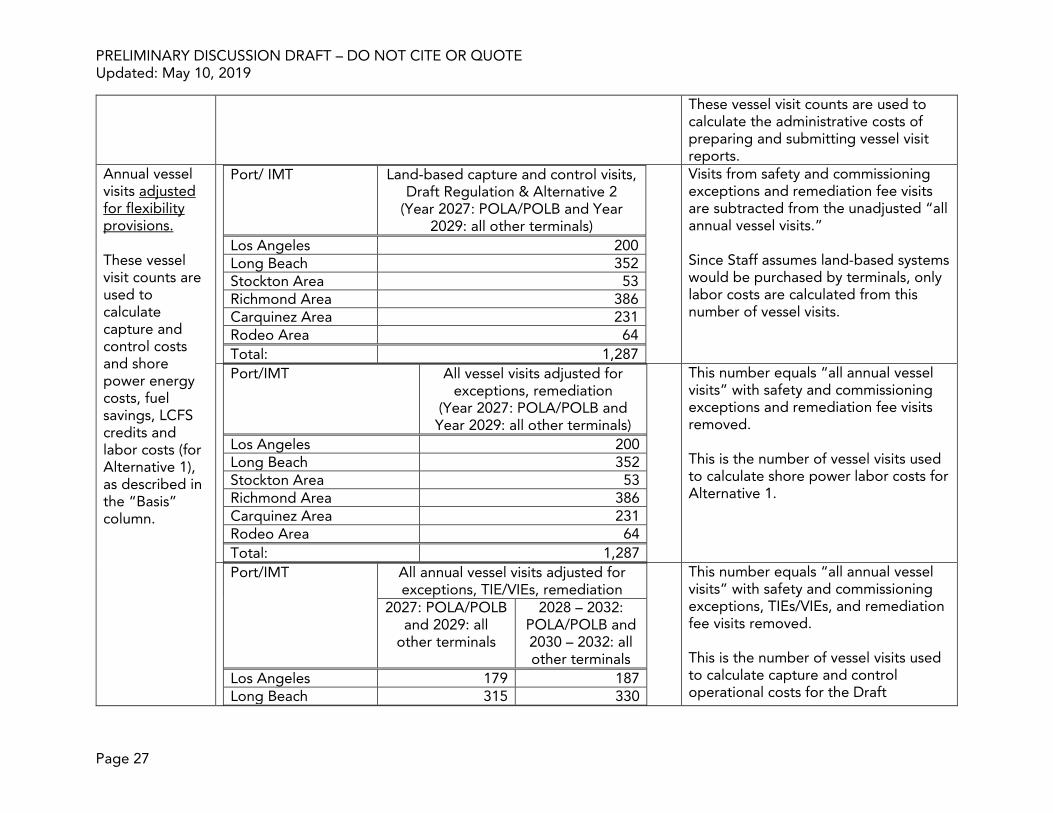
Annual vessel visits adjusted for flexibility provisions. These vessel visit counts are used to calculate capture and control costs and shore power energy costs, fuel savings, LCFS credits and labor costs (for Alternative 1), as described in the “Basis” column.
Port/ IMT
Land-based capture and control visits, Draft Regulation & Alternative 2
(Year 2027: POLA/POLB and Year 2029: all other terminals)
Los Angeles 200 Long Beach 352 Stockton Area 53 Richmond Area 386 Carquinez Area 231 Rodeo Area 64 Total: 1,287
Visits from safety and commissioning exceptions and remediation fee visits are subtracted from the unadjusted “all annual vessel visits.” Since Staff assumes land-based systems would be purchased by terminals, only labor costs are calculated from this number of vessel visits.
Port/IMT
All vessel visits adjusted for exceptions, remediation
(Year 2027: POLA/POLB and Year 2029: all other terminals)
Los Angeles 200 Long Beach 352 Stockton Area 53 Richmond Area 386 Carquinez Area 231 Rodeo Area 64 Total: 1,287
This number equals “all annual vessel visits” with safety and commissioning exceptions and remediation fee visits removed. This is the number of vessel visits used to calculate shore power labor costs for Alternative 1.
Port/IMT
All annual vessel visits adjusted for exceptions, TIE/VIEs, remediation
2027: POLA/POLB and 2029: all
other terminals
2028 – 2032: POLA/POLB and 2030 – 2032: all other terminals
Los Angeles 179 187 Long Beach 315 330
This number equals “all annual vessel visits” with safety and commissioning exceptions, TIEs/VIEs, and remediation fee visits removed. This is the number of vessel visits used to calculate capture and control operational costs for the Draft
PRELIMINARY DISCUSSION DRAFT – DO NOT CITE OR QUOTE Updated: May 10, 2019
Page 28
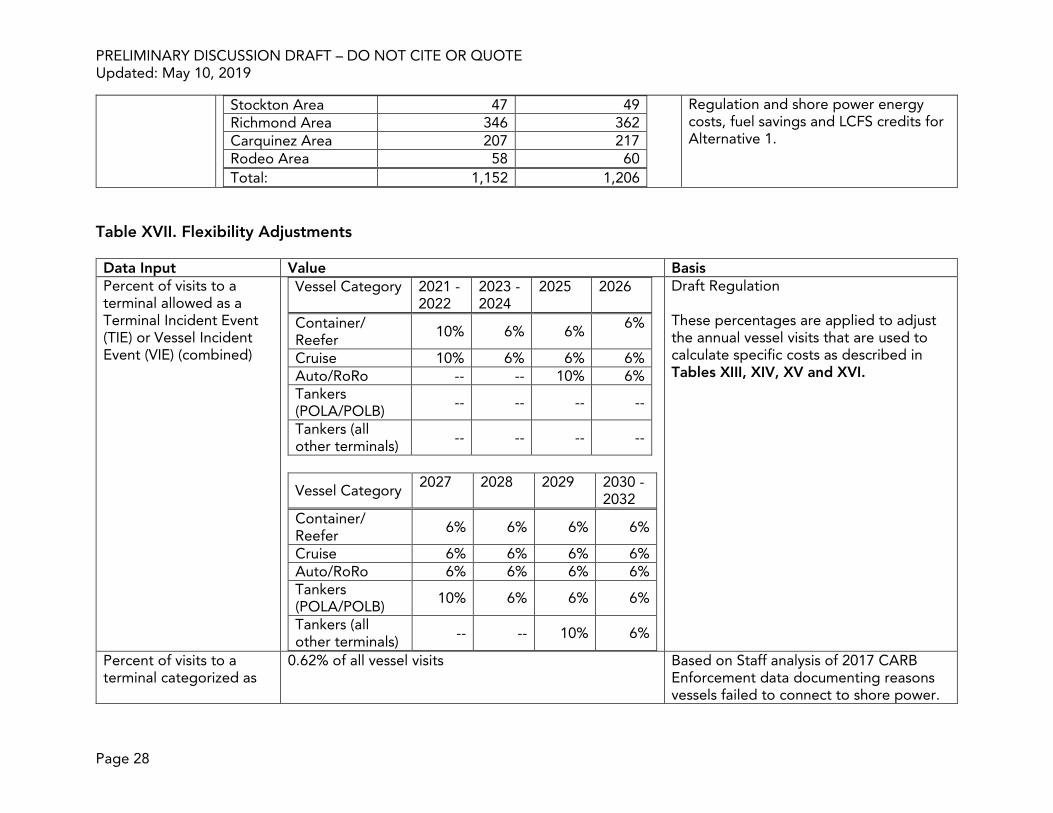
Stockton Area 47 49 Richmond Area 346 362 Carquinez Area 207 217 Rodeo Area 58 60 Total: 1,152 1,206
Regulation and shore power energy costs, fuel savings and LCFS credits for Alternative 1.
Table XVII. Flexibility Adjustments Data Input Value Basis Percent of visits to a terminal allowed as a Terminal Incident Event (TIE) or Vessel Incident Event (VIE) (combined)
Vessel Category 2021 - 2022
2023 - 2024
2025 2026
Container/ Reefer 10% 6% 6% 6%
Cruise 10% 6% 6% 6% Auto/RoRo -- -- 10% 6% Tankers (POLA/POLB) -- -- -- --
Tankers (all other terminals) -- -- -- --
Vessel Category 2027 2028 2029 2030 - 2032
Container/ Reefer 6% 6% 6% 6%
Cruise 6% 6% 6% 6% Auto/RoRo 6% 6% 6% 6% Tankers (POLA/POLB) 10% 6% 6% 6%
Tankers (all other terminals) -- -- 10% 6%
Draft Regulation These percentages are applied to adjust the annual vessel visits that are used to calculate specific costs as described in Tables XIII, XIV, XV and XVI.
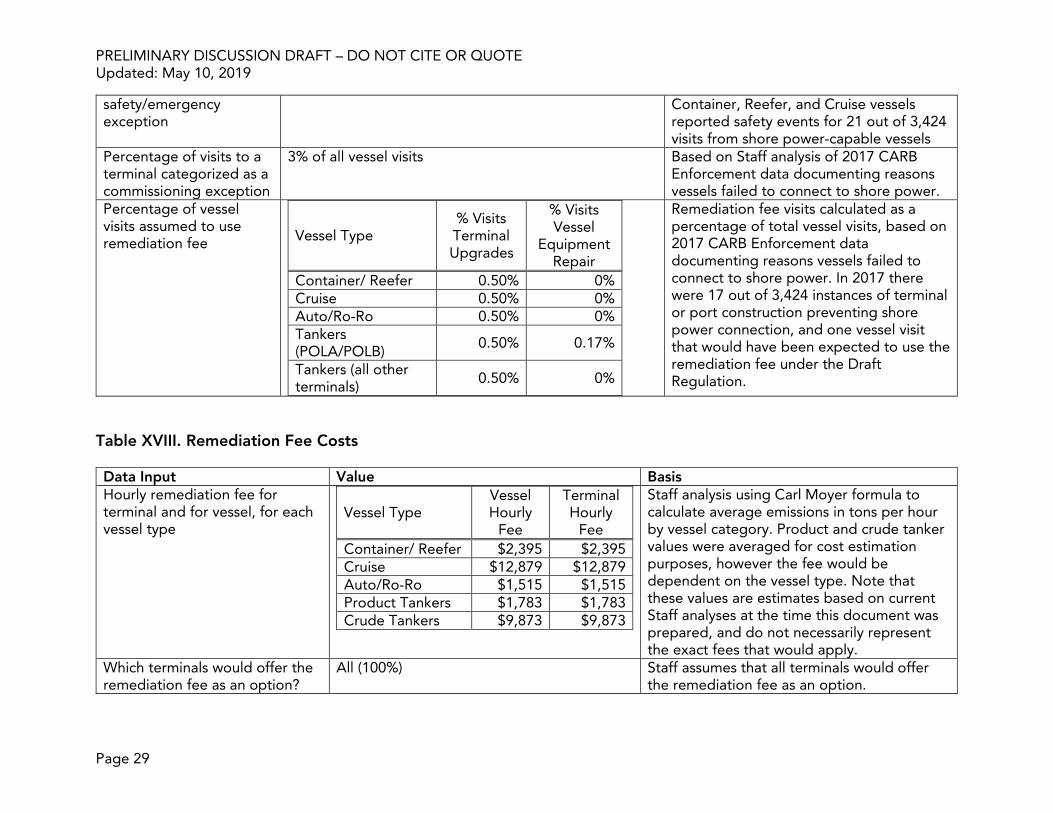
Percent of visits to a terminal categorized as
0.62% of all vessel visits Based on Staff analysis of 2017 CARB Enforcement data documenting reasons vessels failed to connect to shore power.
PRELIMINARY DISCUSSION DRAFT – DO NOT CITE OR QUOTE Updated: May 10, 2019
Page 29
safety/emergency exception
Container, Reefer, and Cruise vessels reported safety events for 21 out of 3,424 visits from shore power-capable vessels
Percentage of visits to a terminal categorized as a commissioning exception
3% of all vessel visits Based on Staff analysis of 2017 CARB Enforcement data documenting reasons vessels failed to connect to shore power.
Percentage of vessel visits assumed to use remediation fee Vessel Type
% Visits Terminal Upgrades
% Visits Vessel
Equipment Repair
Container/ Reefer 0.50% 0% Cruise 0.50% 0% Auto/Ro-Ro 0.50% 0% Tankers (POLA/POLB) 0.50% 0.17%
Tankers (all other terminals) 0.50% 0%
Remediation fee visits calculated as a percentage of total vessel visits, based on 2017 CARB Enforcement data documenting reasons vessels failed to connect to shore power. In 2017 there were 17 out of 3,424 instances of terminal or port construction preventing shore power connection, and one vessel visit that would have been expected to use the remediation fee under the Draft Regulation.
Table XVIII. Remediation Fee Costs Data Input Value Basis Hourly remediation fee for terminal and for vessel, for each vessel type
Vessel Type Vessel Hourly
Fee
Terminal Hourly
Fee Container/ Reefer $2,395 $2,395 Cruise $12,879 $12,879 Auto/Ro-Ro $1,515 $1,515 Product Tankers $1,783 $1,783 Crude Tankers $9,873 $9,873
Staff analysis using Carl Moyer formula to calculate average emissions in tons per hour by vessel category. Product and crude tanker values were averaged for cost estimation purposes, however the fee would be dependent on the vessel type. Note that these values are estimates based on current Staff analyses at the time this document was prepared, and do not necessarily represent the exact fees that would apply.
Which terminals would offer the remediation fee as an option?
All (100%) Staff assumes that all terminals would offer the remediation fee as an option.