The contribution of synchronicity towards personal leadership

RESEARCH ARTICLE
Contribution towards a Metabolite Profile of
the Detoxification of Benzoic Acid through
Glycine Conjugation: An Intervention Study
Cindy Irwin1☯, Mari van Reenen1,2☯, Shayne Mason1, Lodewyk J. Mienie1, Johan
A. Westerhuis2,3, Carolus J. Reinecke1*
1 Centre for Human Metabolomics, Faculty of Natural Sciences, North-West University (Potchefstroom
Campus), Potchefstroom, South Africa, 2 Department of Statistics, Faculty of Natural Sciences, North-West
University (Potchefstroom Campus), Potchefstroom, South Africa, 3 Biosystems Data Analysis,
Swammerdam Institute for Life Sciences, University of Amsterdam, Amsterdam, The Netherlands
☯ These authors contributed equally to this work.
Abstract
Benzoic acid is widely used as a preservative in food products and is detoxified in humans
through glycine conjugation. Different viewpoints prevail on the physiological significance of
the glycine conjugation reaction and concerns have been raised on potential public health
consequences following uncontrolled benzoic acid ingestion. We performed a metabolomics
study which used commercial benzoic acid containing flavored water as vehicle for designed
interventions, and report here on the controlled consumption of the benzoic acid by 21
cases across 6 time points for a total of 126 time points. Metabolomics data from urinary
samples analyzed by nuclear magnetic resonance spectroscopy were generated in a time-
dependent cross-over study. We used ANOVA-simultaneous component analysis (ASCA),
repeated measures analysis of variance (RM-ANOVA) and unfolded principal component
analysis (unfolded PCA) to supplement conventional statistical methods to uncover fully the
metabolic perturbations due to the xenobiotic intervention, encapsulated in the metabolo-
mics tensor (three-dimensional matrices having cases, spectral areas and time as axes).
Identification of the biologically important metabolites by the novel combination of statistical
methods proved the power of this approach for metabolomics studies having complex data
structures in general. The study disclosed a high degree of inter-individual variation in detox-
ification of the xenobiotic and revealed metabolic information, indicating that detoxification
of benzoic acid through glycine conjugation to hippuric acid does not indicate glycine deple-
tion, but is supplemented by ample glycine regeneration. The observations lend support to
the view of maintenance of glycine homeostasis during detoxification. The study indicates
also that time-dependent metabolomics investigations, using designed interventions, pro-
vide a way of interpreting the variation induced by the different factors of a designed experi-
ment–an approach with potential to advance significantly our understanding of normal and
pathophysiological perturbations of endogenous or exogenous origin.
PLOS ONE | DOI:10.1371/journal.pone.0167309 December 1, 2016 1 / 20
a11111
OPENACCESS
Citation: Irwin C, van Reenen M, Mason S, Mienie
LJ, Westerhuis JA, Reinecke CJ (2016)
Contribution towards a Metabolite Profile of the
Detoxification of Benzoic Acid through Glycine
Conjugation: An Intervention Study. PLoS ONE 11
(12): e0167309. doi:10.1371/journal.
pone.0167309
Editor: Viswanathan V Krishnan, California State
University Fresno, UNITED STATES
Received: June 14, 2016
Accepted: November 13, 2016
Published: December 1, 2016
Copyright: © 2016 Irwin et al. This is an open
access article distributed under the terms of the
Creative Commons Attribution License, which
permits unrestricted use, distribution, and
reproduction in any medium, provided the original
author and source are credited.
Data Availability Statement: All relevant data are
provided within the manuscript and the Supporting
Information file S2 File (CI_unscaled raw vehicle
data.xlsx).
Funding: Research funding for the analytical and
computational aspects of the project was provided
by the Technological Innovation Agency (TIA) of
the Department of Science and Technology of
South Africa. CI received a post-graduate bursary
from the National Research Foundation (NRF) of
South Africa. The views and findings of this

Introduction
Applications of metabolomics to intervention or challenge studies greatly enhance the holistic
understanding of the effects of consumed substances on metabolic pathways [1, 2]. Data sets
from intervention studies are, however, complex, as these investigations aspire to measure
multiple metabolites in a biofluid, obtained from several experimental subjects, collected at dif-
ferent points in time and subjected to interventions from different consumed substances. In
addition, these studies call for methods of data analysis specifically designed for longitudinal
(time-dependent), multi-subject (data from several experimental participants), multi-group
(intervention studies) and multivariate data [3, 4]. In this paper, we present the experimental
design for an intervention study which includes the complex aspects mentioned above. The
interventions were consumption of alcohol in the presence or absence of NAD, using flavored
water as a vehicle. We generated matched-sample series through a cross-over study of partici-
pating subjects, collecting samples over a distinct time frame. The biochemical responses to
the interventions were distinctly different: responses to alcohol and NAD intake resided in the
intermediary metabolism, whereas those to exogenous substances in the vehicle involved
detoxification through biotransformation mechanisms. Here, we present the full experimental
design of the intervention study, but focus on the contribution from the biotransformation
response by presenting the outcomes of vehicle consumption only. The results on the alcohol
and NAD interventions will be published in a separate paper.
Benzoic acid was an important constituent in the vehicle used in the present study. Benzoic
acid and its derivatives are routinely used as preservatives and flavoring agents in food prod-
ucts. Consequently, human exposure to them is quite common, and has raised concerns about
potential public health consequences [5]. Evidence that benzoic acid is excreted as hippuric
acid after enzymatic conjugation to glycine dates back to the 1950s [6], but different view-
points seem to prevail on the physiological significance of the glycine conjugation reaction.
Traditionally, glycine conjugation became part of the paradigm of detoxification, with the crit-
ical role of glycine conjugation for aromatic acids [7]. More recently, new views were pro-
posed, shifting the focus to glycine homeostasis to assist in the regulation of body stores of
glycine and other amino acids which are key neurotransmitters in the central nervous system
(CNS) [8] or to serve as a molecular escort in the glycine deportation system to excrete excess
glycine into urine as hippuric acid [9].
Detoxification pathways–the traditional viewpoint–can directly affect the integrity of multi-
ple organs and hence can be widely involved in a variety of human conditions, such as health
[10], co-metabolism in humans with the gut microbiome [11], disease therapy [12] and aging
[13]. Lipophilic endogenous or exogenous xenobiotics are first metabolized by the phase 1
detoxification system, which converts the compounds into substances having a hydrophilic
functional group for increased solubility. The phase 2 detoxification system involves conjuga-
tion reactions [14]. The phase 2 system comprises several enzymes, with glycine-N-acyltrans-
ferase (GLYAT) being the key enzyme in glycine conjugation.
Invoking the roles of aromatic acids and gut metabolites to regulate blood levels of glycine–
the new viewpoint–relates to that of glycine as neurotransmitter in the CNS. A putative role
for it as a neurotransmitter dates back to the observation that the concentration of glycine in
spinal cord tissue is far higher than elsewhere in the brain [15]. The intracellular concentration
of glycine is regulated mainly by a glycine transporter, acting in synergy with glutamic acid
decarboxylase [16]. The proposed glycine deportation system, moreover, functions as a
homeostatic regulator of the GLY central pool and, by definition, also the GLY tissue pool [9].
GLYAT (reviewed by Badenhorst et al. [17]) is located in the mitochondria of mammalian
liver and kidney and is a member of the superfamily of N-acyl-transferases. It has been
An Intervention Study on Benzoic Acid Detoxification
PLOS ONE | DOI:10.1371/journal.pone.0167309 December 1, 2016 2 / 20
investigation are those of the authors and do not
reflect or represent any policies of the NRF or TIA
funders. The funders had no role in study design,
data collection and analysis, decision to publish, or
preparation of the manuscript.
Competing Interests: The authors have declared
that no competing interests exist.

demonstrated that several GLYAT species [glycine N-acyltransferase (EC 2.3.1.13), glutamine
N-acyltransferase (EC 2.3.1.68) and glycine N-benzoyltransferase (EC 2.3.1.71)] are closely
related but distinct mitochondrial enzymes [18], although originally regarded as being a single
enzyme [19]. Benzoyl-CoA, salicyl-CoA, and certain short-, straight- and branched-chain fatty
acyl-CoA esters are substrates for the former enzyme, and glycine is the acyl acceptor for all
these enzymes. As glycine and glutamic acid are known to cross the blood–brain barrier freely,
it is assumed that removal of GLY from the GLY central pool will lower levels of GLY in the
CNS [9].
Commercial flavored water, containing benzoic acid (the preservative and co-substrate in
glycine conjugation), was used as vehicle for the present intervention study, which opened the
opportunity for a metabolomics investigation on controlled benzoic acid consumption. The
intervention study consisted of 24 experimental cases (healthy males between 20 and 24 years
of age), and used a metabolomics approach for the experimental design and data analysis. The
study included four treatments and six urine samples per experimental case were collected
over a period of five hours and used as biofluid for the metabolomics measurements. We
selected proton nuclear magnetic resonance (1H-NMR) spectroscopy as the technology for the
generation of the metabolomics data as it is the recognized method of choice for an untargeted
coverage of the metabolome. The outcomes offered several intriguing views on the metabolites
formed in each of these interventions. The results using the vehicle as control provided novel
insights into the metabolite profile following benzoic acid consumption.
Time-dependent intervention studies require more technical statistical methods for data
analysis, forming another central aspect of this paper. Metabolomics data are mostly repre-
sented as a matrix of controls and cases (rows) measured over the metabolites that reflect the
perturbation under investigation (columns). Such data are traditionally processed through
multivariate statistical methods, using mostly unsupervised principal component analysis
(PCA) and a supervised method such as partial least-squares discriminant analysis (PLS-DA),
to identify metabolites that differ significantly between the test groups studied [20]. In human
intervention studies, individual variation tends to dominate the often less pronounced meta-
bolic perturbations due to the intervention. A reasonably large number of cases is mostly
required as well as a sufficient number of time points to cover the effect of the intervention.
We used a cross-over experimental design, which generated several hundred samples which
requires a different approach from the traditional multivariate methods for processing the data
and a more extensive validation of the results than for standard metabolomics studies.
For optimal insight into the intervention involving vehicle consumption, we followed a
novel approach of complementary statistical methods: (1) the traditional multivariate and
univariate methods of analysis were included as the first approximation of the biological pro-
file following the intervention; (2) ASCA (ANOVA-simultaneous component analysis), devel-
oped for analyzing designed metabolomics data [4], was used next as a method that deals
with multivariate data sets based on a defined experimental design, including time-dependent
data; (3) RM ANOVA (repeated measures analysis of variance), which is similar to ASCA as it
accounts for the experimental design of the data (although RM ANOVA was used to assess
each metabolite individually to find those metabolites that changed significantly with time);
finally, (4) unfolded PCA [21] was applied to gain insight into the global (i.e. multivariate)
effect of the vehicle over time. The combination of these complementary statistical methods
and transdisciplinary approach of metabolomics to the research lead to a more holistic view of
the data. This proved essential in elucidating the effect of the intervention and provided novel
insights into benzoic acid biotransformation, not observed by more reductionist methods of
analysis.
An Intervention Study on Benzoic Acid Detoxification
PLOS ONE | DOI:10.1371/journal.pone.0167309 December 1, 2016 3 / 20

Materials and Methods
Chemicals and reagents
The substances used for the intervention reported here were flavored water (aQuelle lemon-
flavored sparkling water: fructose and citric acid flavoring; sodium benzoate preservative;
sodium cyclamate, aspartame, acesulfame K sweeteners; vitamin C– www.aquelle.co.za, prod-
uct of South Africa), commercial water (Valpre still spring water, inorganic contents speci-
fied–product of South Africa). The internal standard for the 1H-NMR analysis was trimethyl-
2,2,3,3-tetradeuteropropionic acid (TSP, sodium salt; Sigma Aldrich).
Experimental design
The intervention study was based on an observation in a preliminary metabolomics investiga-
tion on the effect of acute alcohol consumption in healthy cases [22] that indicated some NAD
depletion. The experimental group consisted of 24 medically confirmed healthy males, between
20 and 24 years of age, residing in the same student hostel of North-West University (South
Africa). They were neither alcohol addicts nor total abstainers, but confirmed their use of alco-
hol on a moderate social level. No cases took any medication, all were asked to refrain from vita-
mins, minerals, and other supplementation, and were requested to follow a similar dietary and
lifestyle pattern for the duration of the study. The protocol was approved by the Health Sciences
Ethical Committee of North-West University (Ethical approval number: NWU-00045-12-S1),
conducted in accordance with guidelines for good clinical practice and performed at the Health
Clinic of the university. A medical doctor and nurse were present during the entire period of
intervention and all cases could leave the premises only after approval by the doctor.
The experiments were conducted on Saturday mornings between 08:00 and 12:00. All sub-
jects had to abstain from breakfast and had to provide an early morning urine sample, col-
lected one hour before the start of the experiment (time –1). The treatments consisted of a
measurement of the baseline effect of imbibing the vehicle (500 mL flavored water) that was
also used in the remaining three interventions. All the cases were randomly assigned to a treat-
ment/intervention group until all 24 participated in all four interventions. All cases were pro-
vided with 1.5 L pure spring water, which was the only substance that could be taken over the
period of the experiment. High diurnal variation in urine is well established, and a validated
dietary exposure biomarker discovery protocol demonstrated that top-ranked signals discrimi-
nating between fasting and 2–4 hour postprandial urine samples could be linked to metabolites
abundant between components of a standardized dietary intervention [23]. Thus, urine sam-
ples were collected at time zero, just prior to consumption, followed by four further samples at
1, 2, 3 and 4 hours after imbibing the vehicle, providing six samples in total for each case.
Owing to commitments of some participants, the experiments were performed over a period
of 7 consecutive Saturdays, and all samples were treated and stored as described below.
Measurement design
Because of the large number of samples produced by this study, their analysis spanned a long
time, which necessitated splitting samples across multiple analysis blocks or batches. Analytical
assessment of metabolomics data generation proved the highly repeatable nature of NMR
data measurements [24]. Although repeatability and reproducibility are not concerns in NMR
analyses, the measurement design included the use of pooled quality control (QC) samples to
estimate any batch effect or other interfering analytical aspect. Each batch contained the 24
samples (corresponding to 4 treatments across 6 time points) of a single case and three QC
samples.
An Intervention Study on Benzoic Acid Detoxification
PLOS ONE | DOI:10.1371/journal.pone.0167309 December 1, 2016 4 / 20

The 27 samples from each batch were analyzed in the following order:
QC1 [S–1S0S1S2S3S4]Vehicle [S–1S0S1S2S3S4]Alcohol QC2 [S–1S0S1S2S3S4]NAD [S–1S0S1S2S3
S4]NAD+Alcohol QC3
where S–1 represents the sample collected at time –1, S0 represents the sample collected at
time 0, and so on.
Sample collection, characterization and storage. Six samples per intervention were col-
lected from each student. This gave a total of 24 urine samples from each case over the course
of the study. One 5 mL and two 1 mL vials were used to provide aliquots of each of the urine
samples; these aliquots, together with the remainder of the bulk urine samples, were stored at
–80˚C. Once all the urine samples were collected, one 1 mL aliquot of each was thawed and
combined to prepare a QC sample for the experiment as a whole. This QC sample was then
divided into 15 mL aliquots and once again stored at –80˚C.
Sample preparation and 1H-NMR analysis. Spectral analyses were conducted at the
NMR facility of the Centre for Human Metabolomics at North-West University. Prior to anal-
ysis, an aqueous 1.5 M KH2PO4 deuterated buffer solution at pH 7.4 was prepared [25]. This
solution served to lock the signal during analysis, maintained a stable pH in the sample and
contained TSP as the internal standard to provide a chemical shift reference of δ = 0.00. The
urine samples, stored at –80˚C, were thawed at room temperature for analysis. A 600 μL vol-
ume of each sample was centrifuged at 12 000 × g for 5 min to remove any sediments or debris.
A 60 μL volume of buffer solution was added to 540 μL of the supernatant, vortexed and trans-
ferred to a 5-mm NMR tube.
Each sample so prepared was analyzed on a Bruker Avance III HD 500 MHz NMR spectrom-
eter equipped with a triple-resonance inverse (TXI) 1H{15N, 13C} probe head and x, y, z gradient
coils. 1H spectra were acquired as 128 transients in 32K data points with a spectral width of 6002
Hz. The sample temperature was maintained at 300 K and the H2O resonance was pre-saturated
by single-frequency irradiation during a relaxation delay of 4 s, with a 90˚ excitation pulse fixed
at 8 μs. Shimming of the sample was performed automatically on the deuterium signal. The reso-
nance line widths for TSP and metabolites were<1 Hz (measurements at half the height of the
peak). Fourier transformation and phase and baseline correction were done automatically. The
software used was Bruker Topspin (V3.2) and Bruker AMIX (V3.9.9) [26].
All urine samples were normalized with reference to the creatinine CH2 peak at 4.05 ppm.
We employed two methods of spectral analysis: (1) the first method consisted of equidistant
binning, using a bin width of 0.02 ppm applied to the spectral region of 0.5–10 ppm ((344
bins). This gave a total of 467 integrated units per NMR spectrum, excluding the water region,
for each sample for multivariate analysis (S2 File). Based on previous empirical experience
with NMR spectral analysis, we defined a threshold value of 2 x 10⁶, being approximately the
limit of detection of metabolomic substances presumed to be present in a spectral bin. All val-
ues below this threshold were set to zero.
The methodology of processing NMR spectra is well known. Powers [27] describes two
schools of thought in this method: peak alignment and binning, the latter of which we used in
this study. The equal-binning procedure masks subtle chemical shift differences and hides poten-
tially significant changes of low-intensity peaks, but incurs the risk of splitting peaks or spectral
features between bins. The second method used quantified metabolites, derived from variably-
sized binning of the original spectral peaks above the noise level. This alternative method pre-
vents peak division between multiple bins, avoiding the problems incurred in the first method.
This second approach was specifically applied for the accurate identification and quantification
(μmol/mmol creatinine) of discernible metabolites, generating data for univariate analysis.
In addition, we used both the 1D and 2D J-resolved (JRES) approach to further characterize
guanidinoacetic acid observed in some urine samples (Section 4 and Figure J in S1 File).
An Intervention Study on Benzoic Acid Detoxification
PLOS ONE | DOI:10.1371/journal.pone.0167309 December 1, 2016 5 / 20

Data analysis
A tensor (Fig 1) was used for three modes of statistical analyses: (1) cross-sectional analysis of
time points using traditional multivariate (PCA and PLS-DA) as well as univariate analyses–
Wilcoxon signed rank test (WC p-value) and associated fold changes (FC), generated for each
bin; (2) ASCA performed across all times; and (3) univariate RM ANOVA for each bin. Fur-
ther detail on these methods is presented in S1 File.
The original spectral data, derived from the cases following the vehicle intervention, sam-
pling at six time points and including the QCs (Section 1 and Table A in S1 File), yielded a
total of 144 samples, as shown in the flow diagram (Fig 2) and illustrated through a representa-
tive NMR spectrum for one QC sample (Fig 3). However, during the experiment one partici-
pant did not complete all four interventions, thus yielding 138 samples obtained from the
remaining 23 cases, which were used in the data analysis. The original spectral data were pre-
processed by normalization relative to the creatinine content (between 4.05 and 4.07 ppm);
replacing very low values with zero and performing a 50% zero-filter. Case reduction was
based on batch comparisons of the QC samples (detail presented in S1 File)–two batches were
found to be outliers and were removed.
A list of important bins was generated by each of the three modes and combined using a
Venn diagram approach to identify a final shortlist of important spectral bins. This shortlist
contained information on the main metabolites that reflected the intervention.
Results
Cross-sectional analysis
One student did not complete the full intervention program, and was thus removed from the
group. All results were finally based on the 344 1H-NMR profiled bins for 21 cases, following
the elimination of two outlier batches (i.e. data from two cases), across the 6 time points. Gen-
eral time-dependent changes in the spectral data were first evaluated with regard to the base-
line, i.e. time 0. Cross-sectional comparisons of time points –1, 1, 2, 3 and 4 hours vs. time 0
were performed using three multivariate approaches (unsupervised Euclidian and Ward
hierarchical cluster analyses presented as dendrograms, unsupervised PCA and supervised
PLS-DA models) and the combination of two univariate approaches (the p-values from Wil-
coxon signed rank test and fold change (FC) values presented as Volcano plots). The data were
log transformed (shifted natural logarithm with shift parameter set to 1) and centered prior to
performing PCA and PLS-DA. The remaining methods were applied to untransformed data.
The statistical techniques used and the results of all time points for the cluster analyses, Vol-
cano plots, as well as for the PCA and PLS-DA, are discussed in detail in S1 File and Matlab
coding given as supplementary file (S3 File).
Fig 4 indicates the data from time –1 hour, 1 hour and 4 hours relative to time 0 for the clus-
ter analysis and Volcano plots.
Fig 4A shows little separation (time –1 relative to time 0) between the individual cases, indi-
cating a perceived closeness of spectral data encapsulated in the NMR bins for the individual
cases. The metabolite profiles detected in the urine of most samples collected immediately
prior to consumption of the vehicle thus represent the profile following 12 hours fasting. This
conclusion also holds for the case indicated as an outlier bin within the group as a whole (indi-
cated by a red dot in Fig 4D). The distinct group separation after vehicle consumption (Fig 4B
and 4C) clearly indicates a metabolic perturbation. The results for the other two multivariate
methods (PCA: Figure D and PLS-DA: Figure E in S1 File) confirmed the main observations
shown in the dendrograms: no group separation between the data obtained at time zero and
An Intervention Study on Benzoic Acid Detoxification
PLOS ONE | DOI:10.1371/journal.pone.0167309 December 1, 2016 6 / 20
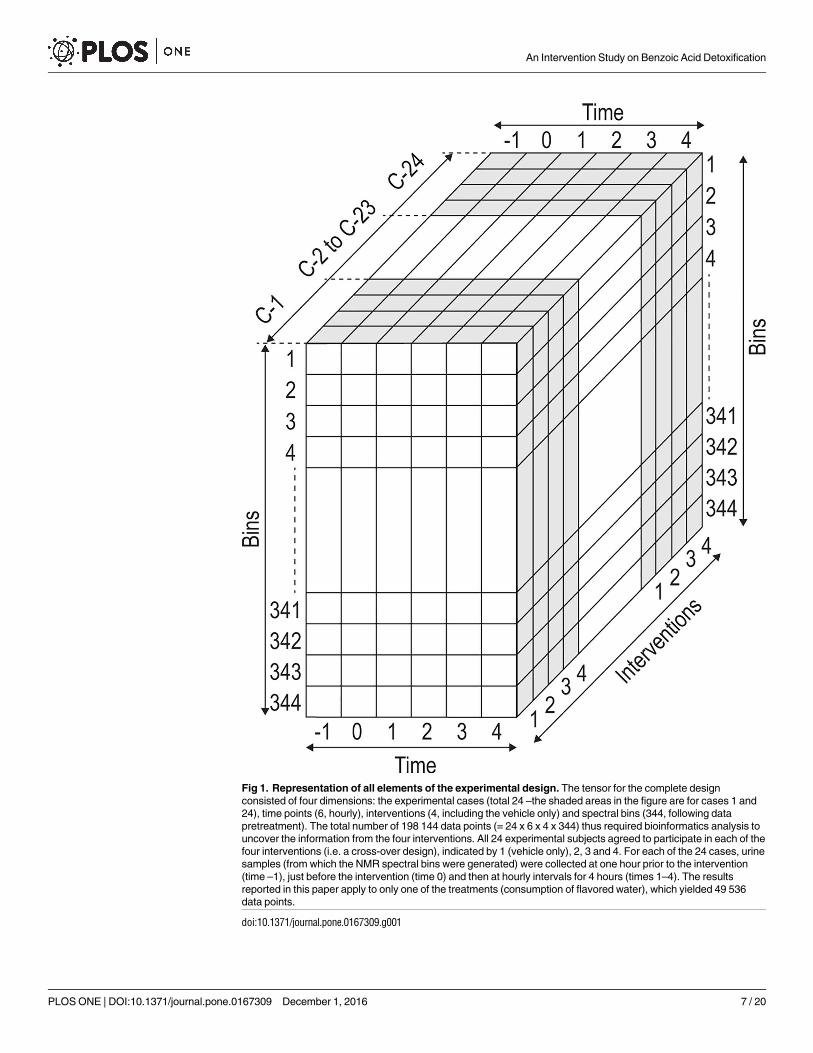
Fig 1. Representation of all elements of the experimental design. The tensor for the complete design
consisted of four dimensions: the experimental cases (total 24 –the shaded areas in the figure are for cases 1 and
24), time points (6, hourly), interventions (4, including the vehicle only) and spectral bins (344, following data
pretreatment). The total number of 198 144 data points (= 24 x 6 x 4 x 344) thus required bioinformatics analysis to
uncover the information from the four interventions. All 24 experimental subjects agreed to participate in each of the
four interventions (i.e. a cross-over design), indicated by 1 (vehicle only), 2, 3 and 4. For each of the 24 cases, urine
samples (from which the NMR spectral bins were generated) were collected at one hour prior to the intervention
(time –1), just before the intervention (time 0) and then at hourly intervals for 4 hours (times 1–4). The results
reported in this paper apply to only one of the treatments (consumption of flavored water), which yielded 49 536
data points.
doi:10.1371/journal.pone.0167309.g001
An Intervention Study on Benzoic Acid Detoxification
PLOS ONE | DOI:10.1371/journal.pone.0167309 December 1, 2016 7 / 20

one hour before the intervention (Figures D(A) and E(A) in S1 File), clear separation one hour
after consumption, i.e. time 0 vs. time 1 (Figures D(B) and E(B) in S1 File). Characteristic of
multivariate methods, the group separations were more evident when applying a supervised
(PLS-DA) as opposed to an unsupervised method (PCA). The Volcano plots revealed that a
single bin indicated a significant (p� 0.05) up-regulated value (FC� 2.0) at time 0 with
respect to time –1 (Fig 4D), which increased to a total of 31 up- and down-regulated values
(Fig 4E) one hour after the intervention (p� 0.05 and |FC|� 2) and becoming abundant after
4 hours (Fig 4F), as compared to the baseline measurement (time 0).
Inter-individual variation following vehicle consumption
Fig 5 represents the scores based on the first two principal components (PC1 and PC2) of the
PCA model for the unfolded data tensor. The data tensor was unfolded in time as described
Fig 2. Flow diagram indicating the main lines of activity following data generation, identification and quantification
of important metabolites on the intervention towards the proposed biological interpretation. VIP refers to variables
important in projection, based on a PLS-DA; SSL refers to the sum of the squared loadings of the ASCA model; p refers to the
RM-ANOVA p-values for the time effect.
doi:10.1371/journal.pone.0167309.g002
An Intervention Study on Benzoic Acid Detoxification
PLOS ONE | DOI:10.1371/journal.pone.0167309 December 1, 2016 8 / 20

and illustrated in S1 File [21]. The unfolding transforms a three-dimensional tensor into a
two-dimensional matrix and thus allows for PCA.
PCA of the unfolded tensor provides insight into the effect of the vehicle in time on the
bins (indicated by the ellipses and centroids in Fig 5) as well as for individual cases, shown by
the dots and trajectories in Fig 5. It is evident from Fig 5 that there is a change in the global
profile (i.e. across all cases) over time. Times –1, 0, 2, 3 and 4 appear to be quite similar, with a
dramatic change visible after 1 hour (time 1). It was evident from the prior analyses (Figs 4
and 5) that the urinary spectral profiles following the consumption of flavored water suggested
notable changes in the metabolite profiles of all individuals in response to the intervention. To
illustrate the inter-individual variation, the centroids of the PCA for the group (all 21 cases)
Fig 3. 500 MHz 1H-NMR spectra of urine. Top spectrum taken from QC sample; numbers indicate the following metabolites: 1: TSP; 2: ethanol; 3: lactic
acid; 4: 2-hydroxyisobutyric acid; 5: alanine; 6: acetic acid; 7: pyruvic acid; 8: succinic acid; 9: citric acid; 10: dimethylamine; 11: creatine; 12: trimethylamine-
N-oxide (TMAO); 13: creatinine; 14: glycine; 15: guanidinoacetic acid (GAA); 16: glycolic acid; 17: hippuric acid; 18: urea; 19: formic acid. The six important
metabolites (high VIP values) are highlighted below to qualitatively show differences over time 0 (black), 1 (blue), 2 (green), 3 (red) and 4 (orange)–scaled
according to creatinine. Apart from citric acid and hippuric acid, the detoxification product of benzoic acid, no other constituents from the vehicle appeared to
be detectable in the NMR analysis.
doi:10.1371/journal.pone.0167309.g003
An Intervention Study on Benzoic Acid Detoxification
PLOS ONE | DOI:10.1371/journal.pone.0167309 December 1, 2016 9 / 20

Fig 4. Group separation among experimental groups through dendrograms and Volcano plots based on equidistant binning spectral
data. (a–c) Dendrograms from cluster analysis of 21 cases are shown. The dendrograms were constructed based on subsets of the data
representing time 0 along with the data obtained one hour before the intervention (time –1); one hour; and four hours following the intervention
(times 1 and 4), respectively. Data for all cases at time 0 are shown as black dots and at the other time slots as red dots. Time points from the same
individuals that clustered close together are indicated by squared brackets, linking them. (d–f) Volcano plots for the same time points as in a–c
An Intervention Study on Benzoic Acid Detoxification
PLOS ONE | DOI:10.1371/journal.pone.0167309 December 1, 2016 10 / 20

and individual cases were tracked and highlighted over the period from time 0 to time 4 hours
(Fig 5). The trajectories drawn in Fig 5 represent only three selected individuals, for clarity. The
selected trajectories (as well as for the group as a whole, Fig 5) indicate clear similarities in the
individual responses to vehicle consumption in time: the profiles of the trajectory from time 0
to 4 hours were comparable in some respects. However, distinct differences were also noted: the
response at time 1 hour following vehicle consumption in case 9 gives the impression of being
an outlier. However, since the QC samples for this individual (linked to a given batch) were not
outliers, we attribute this variation to the unique response of the case to the vehicle. Since we
are interested in these kinds of responses, the observation was retained. Overall, the observa-
tions shown in Fig 5 indicate that the cases themselves are a noteworthy source of variation.
Longitudinal response to vehicle consumption
The results presented thus far suggest that the variation in the total data set was based on the
intervention and superimposed by the normal inter-individual heterogeneity and time effects
indicate the distribution of the individual bins, based on FC and WC p-values. Demarcation of important bins is shown by the horizontal and vertical
dotted lines. The number of influential bins is shown as red dots in the rectangles of the upper left and right segments of each Volcano plot.
doi:10.1371/journal.pone.0167309.g004
Fig 5. Unfolded PCA Scores Plots. PC1 and PC2 for all individual cases (colored dots) and indication of the 95%
confidence ellipsoids for scores of PC1 and PC2 for times –1, 1 and 4 hours. The centroids for these three clusters
are indicated as red squares. The trajectories of the spectral profiles of three individuals are also shown. The
trajectories of three cases (numbers 9, 7 and 19 are shown as purple, blue and green lines, respectively) illustrate
the inter-individual responses to the intervention. The direction of the trajectories is indicated by the short black
arrow, starting from time 0, for clarity.
doi:10.1371/journal.pone.0167309.g005
An Intervention Study on Benzoic Acid Detoxification
PLOS ONE | DOI:10.1371/journal.pone.0167309 December 1, 2016 11 / 20

and by their interactions. For optimal insight into the effect of the intervention, and specifi-
cally to identify the most important metabolites reflecting the metabolic perturbation induced
by the flavored water, we used three complementary approaches. The traditional PLS-DA
(illustrated in Figure E in S1 File) was used to find an approximation of the biological profile
following the intervention. We identified 63 bins as important based on a maximum VIP
over the five comparisons greater than 2. Second, ASCA (Fig 6) was applied as it provided an
approach which was developed to deal with multivariate data sets based on a defined experi-
mental design, including time-dependent data [4]. Again, the data were log transformed and
centered. Similar to the unfolded PCA result, the plot of the sum of the ASCA effects and pro-
jected residuals onto the first two components of the effects subspace [28], shown in Fig 6,
indicate that observations at times –1, 0 are quite similar, indicating a state of homeostasis that
existed after the fasting period. A marked change became visible one hour after the interven-
tion. This was followed by comparable profiles, especially between times 3 and 4, indicating a
return to a state of homeostasis, which was not identical to the state prior to the intervention,
as will be discussed below. The sum of the squared loadings (SSL) of the ASCA model were
ranked in decreasing order and used as a scree plot (Figure G in S1 File) to identify 26 bins
with notably higher SSL values.
Fig 6. Application of ASCA to the 344 NMR spectral bins for 21 individuals over the period of the
intervention. Plots of the sum of the ASCA effects and projected residuals are color coded according to time
following the intervention (–1, 0, 1, 2, 3 and 4 hours shown in red, black, blue, light blue, green and pink,
respectively), with the arrow showing the time-dependent trend, using the same discriminating color sequence.
doi:10.1371/journal.pone.0167309.g006
An Intervention Study on Benzoic Acid Detoxification
PLOS ONE | DOI:10.1371/journal.pone.0167309 December 1, 2016 12 / 20
Third, RM ANOVA was used to assess each bin individually to identify bins that changed
significantly in time, from which we selected the top 50 bins (p-values less than 0.00001) which
appeared to be most informative. Data, generated from complex experimental designs such as
the intervention study presented here, produce information that intersect- in various ways.
Identification of important variables
A Venn diagram (Fig 7) was used to visualize the counts (number of bins) of the lists of impor-
tant bins sharing some properties. Three properties were selected: maximum VIP� 2 from
the PLS-DA, SSL > 0.01 from the ASCA, and p-values from the RM ANOVA as defined
above. A total of 29 bins were shortlisted, derived from being present in at least two of the
three lists and which were unique in the intersection reflected by the shaded areas in Fig 7. It is
interesting to note the power of the ASCA approach as it was able to identify 26 of the 29 bins,
but this does not imply that variables not selected (e.g. the 29 RM ANOVA metabolites) are all
unimportant as each method selects variables in its own way. For our purpose we concen-
trated, however, on the shared metabolites; how this was achieved is described in more detail
in Section 3.6 of S1 File. The list of 29 bins provided the final selection of bins to be identified
as important metabolites and quantified to concentrations. Detailed information on the appli-
cation of ASCA, RM ANOVA and unfolded PCA is presented in Section 3 of S1 File.
Analysis of the spectral characteristics of the 29 bins indicated that 23 bins related to endog-
enous human metabolites. Spectral information from four bins could not be assigned to any
Fig 7. Venn diagram. Bins which are common to any two statistical approaches are indicated by the lightly shaded
areas, and the 18 bins that are common to all three are shown in the central, heavily shaded area.
doi:10.1371/journal.pone.0167309.g007
An Intervention Study on Benzoic Acid Detoxification
PLOS ONE | DOI:10.1371/journal.pone.0167309 December 1, 2016 13 / 20

known chemical substance and two bins indicated exogenous contaminants. Some bins (indi-
cated in brackets) had structural information on the same metabolite, which resulted in a list
of six key metabolites: urea (10 bins), hippuric acid (8 bins) and citric acid (2 bins) as well as
creatine, 3-methylhistidine and guanidinoacetic acid each with one bin. One bin for each of
the six metabolites, as well as for glycine (not identified as a highly perturbed metabolite), were
quantified for all time points, as summarized in Table 1.
Excretion kinetics for all six these metabolites are shown in S1 File (Figures H(A)–H(F)).
The most conspicuous change–indicating the highly efficient detoxification of benzoic acid–
occurred in the more than fourfold (p< 0.0005) increased urinary excretion of hippuric acid
within one hour of consuming the flavored water, and its return to the same level as before the
intervention (Table 1 and Figure H(A) in S1 File). As indicated by the unfolded PCA scores
(Fig 5), the trajectories of individual cases (illustrated for cases 7, 9 and 19) tended to return to
positions close, but not identical, to the pre-intervention positions. The excretion kinetics of
the six metabolites (Figure H in S1 File) and the Wilcoxon signed rank p-values (Table 1) gave
strong numerical indications for this observation: (1) Hippuric acid dominated the profiles, and
returned to practically the same state as prior to the intervention (p = 0.689, Time 0 vs Time 4).
(2) The levels of guanidinoacetic acid (p = 0.028) and creatine (0.003) were significantly lower
than prior to the intervention (Time 0 vs Time 4). (3) The excretion of citric acid (p = 0.002)
and urea (p<0.0005) were still after four hours significantly higher than prior to the interven-
tion (Time 0 vs Time 4). Moreover, the excretion profiles of some unknown and unimportant
metabolites, gave further support for the observed trajectory profiles (Figure I in S1 File).
The interpretation of changes in the excretion of these remaining metabolites paved the
way for the construction of a metabolic profile, reflecting the consequences of detoxification of
a single xenobiotic–benzoic acid as used here–as discussed below.
Discussion
Using the combination of important metabolites identified employing the three statistical
methods (Fig 7), the quantified information (Table 1) and biochemical interpretation of the
Table 1. Quantified data on metabolically important metabolites. All quantified values included are from NMR-determined urine analyses; the references
are all from the Human Metabolome Database, and are expressed as μmoles metabolite/mmole creatinine. WC p-values are based on the comparison of the
respective metabolite concentrations from time = 1 hour to 4 hours, relative to time zero.
Information on important metabolites Time-dependent characteristics of important metabolites following flavored
water consumption
Metabolite Normal values Mean Mean WC Mean WC Mean WC Mean WC
(δ [ppm], multiplicity and chemical group) Mean [Range] [SD] [SD] p-value [SD] p-value [SD] p-value [SD] p-value
[Reference] Time:0 Time:1 Time:2 Time:3 Time: 4
Citric acid 203[49–600] 213 264 <0.0005 322 <0.0005 320 0.001 306 0.002
(2.59 AB—[(CH2)2]) [35] [115] [137] [139] [126] [117]
Hippuric acid 217[28–610] 210 884 <0.0005 449 <0.0005 285 0.021 228 0.689
(3.97d - [CH2]) [35] [100] [268] [170] [154] [142]
Glycine 106[44–300] 94 114 0.001 117 0.005 115 0.014 108 0.122
(3.57 s—[CH2]) [35] [63] [58] [37] [34] [32]
Guanidinoacetic acid 89[11–124] 97 77 0.173 0 0.028 0 0.028 0 0.028
(3.78 s—[CH2]) [36] [193] [200] 0 0 0
Urea 12285[174–49097] 479 751 <0.0005 1004 <0.0005 937 <0.0005 914 <0.0005
(5.78 broad—[(NH2)2]) [35] [230] [322] [303] [311] [291]
Creatine 46[3–448] 44 57 0.015 37 0.079 35 0.011 33 0.003
(3.04 s—[CH3]) [35] [20] [27] [14] [9] [7]
doi:10.1371/journal.pone.0167309.t001
An Intervention Study on Benzoic Acid Detoxification
PLOS ONE | DOI:10.1371/journal.pone.0167309 December 1, 2016 14 / 20

metabolomics data, we constructed a metabolite profile reflecting the primary GLYAT-cata-
lyzed biotransformation of benzoic acid and the metabolic consequences of benzoic acid
ingested via flavored water (Fig 8).
Humans conjugate a variety of aliphatic and aromatic monocarboxylic acids with several
amino acids; the resulting peptides are excreted in the urine and bile. In characterizing two
Fig 8. Metabolite profile of benzoic acid biotransformation with hippuric acid as outcome. The metabolites of the primary biotransformation reactions
are shown in red. Metabolites of metabolic reactions proposed as being associated with the biotransformation reactions are shown in black. [Metabolites
shown in green are presumed to decrease due to increased glycine demand and synthesis of glycine through the reversed glycine cleavage system.] Enzyme
nomenclature (names accepted by the IUBMB): EC 1.4.1.2: glutamate dehydrogenase; EC 2.1.1.2: guanidinoacetate N-methyltransferase; EC 2.1.2.1:
glycine hydroxymethyltransferase (alt.: serine hydroxymethyltransferase); EC 2.1.2.10: aminomethyltransferase (a glycine synthetase); EC 2.1.3.3: ornithine
carbamoyltransferase; EC 2.1.4.1: glycine amidinotransferase; EC 2.3.1.1: amino-acid N-acetyltransferase; EC 2.3.1.71: glycine N-benzoyltransferase (a
GLYAT); EC 2.7.3.2: creatine kinase; EC 3.5.3.1: arginase; EC 4.3.2.1: argininosuccinate lyase; EC 6.2.1.2: butyrate-CoA ligase (a medium-chain acyl-CoA
ligase); EC 6.3.4.5: argininosuccinate synthase; EC 6.3.5.5: carbamoyl-phosphate synthase (glutamine-hydrolyzing)
doi:10.1371/journal.pone.0167309.g008
An Intervention Study on Benzoic Acid Detoxification
PLOS ONE | DOI:10.1371/journal.pone.0167309 December 1, 2016 15 / 20
closely related GLYATs, Nandi et al. [18] indicated through kinetic studies that benzoyl-CoA is
the main substrate for a benzoyltransferase, with salicyl-CoA and certain aliphatic acyl-CoAs
being lesser substrates for it as well. The closely related phenylacetyltransferase utilize phenylace-
tyl- and indoleacetyl-CoA as substrates. Acyl-CoA substrates of one transferase did not serve as
substrate for the other, but act as competitive inhibitors. Glycine is the preferred acyl acceptor for
both enzymes, with KmApp for benzoyltransferase being less (3 mM glycine) than for the phenyla-
cetyltransferase (20 mM glycine). Due to the high activity of glutamine N-phenylacetyltransferase,
phenylacetylglycine is almost never detected in human urine. Almost all the phenylacetic acid is
excreted as N-phenylacetylglutamine. It thus may be anticipated that formation of hippuric acid
in this intervention study mainly reflects the GLYAT activity of the benzoyl variant (EC 2.3.1.71).
Early studies showed that rat liver mitochondria synthesize hippuric acid at a rate of up to 4
nmol/min per mg of protein [29] and comparative kinetic analysis suggested that the forma-
tion of the benzoyl-CoA substrate is the rate-limiting factor. More recently, two distinct forms
of xenobiotic/medium-chain fatty acid:CoA ligase (XM-ligase) were isolated from human liver
mitochondria, referred to as HXM-A and HXM-B [30]. Both forms had medium-chain fatty
acid:CoA ligase activity but HMX-A showed 60–80% activity towards 15 different carboxylic
acids relative to benzoic acid, its best xenobiotic substrate (100% activity and the highest Vmax/
Km). Hexanoic acid was the best substrate for HXM-B, although it was also active towards
xenobiotic carboxylic acids. In accordance with these findings we propose that medium-chain
acyl-CoA ligase (EC 6.2.1.2) is a major catalyst for production of the CoA-substrate required
for hippuric acid formation in the present study.
Acyl-CoA ligases/synthetases belong to a superfamily of adenylate-forming enzymes, and
catalyze the two-step activation of fatty acids or carboxylate-containing xenobiotics [31], with
xenobiotic-CoA formation in parallel to endogenous fatty acid activation through the role of
the ATP-dependent acid:CoA ligases [32]. We visualize the activation of benzoyl-CoA through
a Bi Uni Uni Bi Ping-Pong molecular mechanism proposed for CoA-substrate formation by a
long-chain fatty acyl-CoA synthetase [33]: The benzoyl carboxylate substrate (BA) first reacts
with enzyme-bound ATP to form an acyl-adenylate intermediate (Ec:B~AMP), which then
reacts with CoA to produce the activated benzoyl-CoA ester (B~CoA), having pyrophosphate
(PPi) and AMP as byproducts.
Formation of hippuric acid, following GLYAT-catalyzed conjugation between benzoyl-
CoA and glycine, peaks within one hour (p< 0.0001) following the consumption of flavored
water (Table 1). The p-values of the Wilcoxon signed rank test (Table 1) for the time-depen-
dent urinary excretion of glycine complements that of hippuric acid, and likewise peaks at one
hour (p = 0.001) following the intervention. However, the excretion kinetics profile of glycine
clearly suggests abundance of glycine during the main detoxification period (two hours after
the intervention), rather than glycine depletion. Two main pathways exist for increased glycine
biosynthesis (Fig 8) under physiological conditions of glycine demand: (1) L-serine can be
converted to glycine by serine hydroxymethyltransferase (EC 2.1.2.1) in the reversible glycine
biosynthesis pathway, having tetrahydrofolate as acceptor for the CH2OH group from serine,
yielding 5,10-methylene-tetrahydrofolate and water. (2) The de novo synthesis of glycine can
occur from CO2 and NH3, catalyzed by glycine synthase (EC 2.1.2.10) using 5,10-methylene-
tetrahydrofolate as the source of the second carbon and yielding tetrahydrofolate–likewise in a
reversible reaction. The CO2 and NH3 substrates for the de novo synthesis of glycine are gener-
ated by mitochondrial glutamate dehydrogenase (EC 1.4.1.2) that converts glutamic acid to
2-ketoglutaric acid, with NH3 usually as a substrate in the urea cycle. Glycine is also a substrate
for glycine transamidinase (EC 2.1.4.1)-catalyzed synthesis of guanidinoacetic acid. Urinary
guanidinoacetic acid concentrations, notably, decreased (Table 1; p = 0.173) within the first
hour following consumption of flavored water, towards values below the detection limit (Table 1;
An Intervention Study on Benzoic Acid Detoxification
PLOS ONE | DOI:10.1371/journal.pone.0167309 December 1, 2016 16 / 20

p = 0.028) two hours later. We speculate that decreased guanidinoacetic acid is caused by the
preferential utilization of glycine for benzoic acid detoxification as well as lower urea cycle activ-
ity due to decreased N-acetylglutamic acid, a modulator for the up-regulation of the urea cycle.
Against this background it seems that the traditional paradigm of GLYAT-catalyzed benzoic acid
detoxification, supported by increased de novo glycine biosynthesis (Fig 8), prevails under the
conditions of the present intervention experiment, even though up-regulation of glycine-amidi-
notransferase (EC 2.1.4.1) through decreased creatine [34] cannot be excluded.
Finally, we observed an increase in urinary creatine within the first hour following the
intervention. The creatine/phosphocreatine system plays an important role in energy storage
and energy provision, with creatine synthesis being central in cellular energy metabolism. Two
main enzymes are the basis of the creatine biosynthesis pathway, namely, arginine:glycine ami-
dinotransferase (EC 2.1.4.1) and S-adenosyl-L-methionine:N-guanidinoacetate methyltrans-
ferase (EC 2.1.1.2), as shown in Fig 8. Given the decrease of guanidinoacetic acid to below the
detection limit (Table 1), it seems unlikely that the urinary creatine originates from, and excess
creatine is produced by, the creatine biosynthesis pathway. Our proposal is that phosphocrea-
tine (EC 2.7.3.2) degrades in favor of creatine and supplements the ATP reserves, required for
the burst of ATP required following benzoic acid detoxification.
In summary, we have described the metabolite profile following benzoic acid intake as part
of a designed intervention study. The time-dependent glycine profile supported the view of
abundant glycine availability during the main detoxification period rather than that of glycine
depletion. It should be noted, however, that the perturbation caused by benzoic acid consump-
tion may be more complex than discussed above. We observed small, but significant time-
dependent changes in the NMR spectra (Figure I in S1 File) for methylguanidine and three
unknown substances that are not accounted for in the metabolic model shown in Fig 8.
The complex NMR spectral data, generated from cases participating in a time-dependent
cross-over study, could be resolved sufficiently through the application of traditional univari-
ate and multivariate analyses combined with an ANOVA-simultaneous component analysis
(ASCA), repeated measures analysis of variance (RM ANOVA) and unfolded principal com-
ponent analysis (unfolded PCA)–an approach that opens a novel way for analyses and under-
standing of complex metabolomics data that reflect perturbations from normal or
pathophysiological endogenous or exogenous origin. Furthermore the combination of the
complementary statistical methods together with the transdisciplinary approach followed in
metabolomics research provided a more holistic view of the data. This proved useful in eluci-
dating the effect of the intervention and provided novel insights information into benzoic acid
biotransformation, which is not typically observed by more reductionist methods of analysis.
Supporting Information
S1 File.
(DOCX)
S2 File.
(XLSX)
S3 File.
(M)
Acknowledgments
Research funding for the analytical and computational aspects of the project was provided by
the Technological Innovation Agency (TIA) of the Department of Science and Technology of
An Intervention Study on Benzoic Acid Detoxification
PLOS ONE | DOI:10.1371/journal.pone.0167309 December 1, 2016 17 / 20

South Africa. CI received a post-graduate bursary from the National Research Foundation
(NRF) of South Africa. The views and findings of this investigation are those of the authors
and do not reflect or represent any policies of the NRF or TIA funders. The funders had no
role in study design, data collection and analysis, decision to publish, or preparation of the
manuscript.
Author Contributions
Conceptualization: CJR JAW.
Data curation: CI SM MvR JAW.
Formal analysis: CI SM.
Funding acquisition: CJR.
Investigation: CI SM.
Methodology: CJR JAW.
Project administration: CJR JAW.
Software: JAW MvR.
Supervision: CJR JAW.
Writing – original draft: CI MvR SM LJM JAW CJR.
Writing – review & editing: CI MvR SM LJM JAW CJR.
References1. Gibney MJ, Walsh M, Brennan L, Roche HM, German B, Van Ommen B. Metabolomics in human nutri-
tion: opportunities and challenges. Am J Clin Nutr. 2005; 82:497–503. PMID: 16155259
2. Wishart DS. Metabolomics: applications to food science and nutrition research. Trends Food Sci Tech.
2008; 19:482–493.
3. Antti H, Bollard ME, Ebbels T, Keun H, Lindon JC, Nicholson JK, et al. Batch statistical processing of1NMR-derived urinary spectral data. J Chemometrics. 2002; 16:461–468.
4. Smilde AK, Jansen JJ, Hoefsloot HCJ, Lamers R-JAN., Van der Greef J, Timmerman ME. ANOVA-
simultaneous component analysis (ASCA): a new tool for analyzing designed metabolomics data. Bioin-
formatics. 2005; 21:3043–3048. doi: 10.1093/bioinformatics/bti476 PMID: 15890747
5. Park H-W, Park EH, Yun H-M, Rhim H. Sodium benzoate mediated cytotoxicity in mammalian cells. J
Food Biochem. 2011; 35:1034–1046.
6. Schachter D, Taggart JV. Benzoyl-coenzyme A and hippurate synthesis. J Biol Chem. 1953; 203:925–
934. PMID: 13084662
7. Conti A, Bickel MH. History of drug metabolism: discoveries of the major pathways in the 19th century.
Drug Metab Rev. 1977; 6:1–50.
8. Beyoğlu D, Smith RL, Idle JR. Dog bites man or man bites dog? The enigma of the amino acid conjuga-
tions. Biochem Pharmacol. 2011; 83:1331–1339. doi: 10.1016/j.bcp.2011.12.031 PMID: 22227274
9. Beyoğlu D, Idle JR. The glycine deportation system and its pharmacological consequences. Pharmacol
Therapeut. 2012; 135:151–167.
10. Wen H, Yang H-J, An YJ, Kim JM, Lee DH, Jin X, Park S-W, Min K-J, Park S. Enhanced phase II detoxi-
fication contributes to beneficial effects of dietary restriction as revealed by multi-platform metabolomics
studies. Mol Cell Proteomics. 2013; 12:575–586. doi: 10.1074/mcp.M112.021352 PMID: 23230277
11. Nicholson JK, Holmes E, Wilson ID. Gut microorganisms, mammalian metabolism and personalized
health care. Nat Rev Microbiol. 2005; 3:431–438. doi: 10.1038/nrmicro1152 PMID: 15821725
12. Jana S, Mandlekar S. Role of phase II drug metabolizing enzymes in cancer chemoprevention. Curr
Drug Metab. 2009; 10:595–616. PMID: 19702535
An Intervention Study on Benzoic Acid Detoxification
PLOS ONE | DOI:10.1371/journal.pone.0167309 December 1, 2016 18 / 20

13. Zimniak P. Detoxification reactions: relevance to aging. Ageing Res Rev. 2008; 7:281–300. doi: 10.
1016/j.arr.2008.04.001 PMID: 18547875
14. Holtzclaw WD, Dinkova-Kostova AT, Talalay P. Protection against electrophile and oxidative stress by
induction of phase 2 genes: the quest for the elusive sensor that responds to inducers. Adv Enzyme
Regul. 2004; 44:335–367. doi: 10.1016/j.advenzreg.2003.11.013 PMID: 15581500
15. Aprison MH, Werman R. The distribution of glycine in cat spinal cord and roots. Life Sci. 1965; 4:2075–
2083. PMID: 5866625
16. Tanaka I, Ezure K. Overall distribution of GLYAT2 mRNA-containing versus GAD67 mRNA-containing
neurons and colocalization of both mRNAs in midbrain, pons, and cerebellum in rats. Neurosci Res.
2004; 49:1874–1882.
17. Badenhorst CPS, Van der Sluis R, Erasmus E, Van Dijk AA. Glycine conjugation: importance in metab-
olism, the role of glycine N-acyltransferase, and factors that influence interindividual variation. Expert
Opin Drug Met. 2013; 9:1139–1153.
18. Nandi DL, Lucas SV, Webster LT Jr. Benzoyl-Coenzyme A:Glycine N-acyl-transferase and Phenylace-
tyl-Coenzyme A:Glycine N-Acyltransferase from Bovine Liver Mitochondria. J Biol Chem. 1979;
254:7230–7237. PMID: 457678
19. Schachter D, Taggart JV. Glycine N-acylase: purification and properties. J Biol Chem. 1954; 208:263–
275. PMID: 13174534
20. Lindon JC, Holmes E, Nicholson JK. Pattern recognition methods and applications in biomedical mag-
netic resonance. Prog Nucl Magn Reson Spectrosc. 2001; 39:1–40.
21. Villez K, Steppe K, De Pauw DJW. Use of unfold PCA for on-line plant stress monitoring and sensor fail-
ure detection. Biosystems Engineering. 2009; 103:23–24.
22. Mason S. The metabolomics of acute alcohol abuse. M.Sc. Thesis, North-West University. 2010. Avail-
able: http://dspace.nwu.ac.za/handle/10394/5034
23. Fave G, Beckmann M, Lloyd AJ, Zhou S, Harold G, Lin W, et al. Development and validation of a stan-
dardized protocol to monitor human dietary exposure by metabolite fingerprinting of urine samples.
Metabolomics. 2011; 7:469–484. doi: 10.1007/s11306-011-0289-0 PMID: 22039364
24. Viant M, Bearden DW, Bundy JG, Burton IW, Colette TW, Ekman DR, et al. International NMR-based
environmental metabolomics intercomparison exercise. Environ Sci Technol. 2009; 43:219–225.
PMID: 19209610
25. Dona AC, Jimenez B, Schaafer H, Humpfer E, Spraul M, Lewis MR, et al. Precision high-throughput
proton NMR spectroscopy of human urine, serum, and plasma for large-scale metabolic phenotyping.
Anal Chem. 2014; 86(19):9887–9894. doi: 10.1021/ac5025039 PMID: 25180432
26. Ellinger JJ, Chylla RA, Ulrich EL, Markley JL. Databases and Software for NMR-based metabolomics.
Curr Metabolomics. 2013; 1:28–40.
27. Powers R. NMR Metabolomics and drug discovery. Magn Reson Chem. 2009; 47, S2–S11. doi: 10.
1002/mrc.2461 PMID: 19504464
28. Zwanenburg G, Hoefsloot HCJ, Westerhuis JA, Jansen JJ, Smilde AK. ANOVA–principal component
analysis and ANOVA–simultaneous component analysis: a comparison. J Chemometrics. 2011;
25:561–567.
29. Gatley SJ, Sherratt HAS. The synthesis of hippurate from benzoate and glycine by rat liver mitochon-
dria. Biochem J. 1977; 166:39–47. PMID: 901416
30. Vessey DA, Kelley M, Warren RS. Characterization of the CoA ligases of human liver mitochondria cat-
alyzing the activation of short and medium-chain fatty acids and xenobiotic carboxylic acids. Biochim
Biophys Acta. 1999; 1428:455–462. PMID: 10434065
31. Kochan G, Pilka ES, von Delft F, Oppermann U, Yue WW. Structural snapshots for the conformation-
dependent catalysis by human medium-chain acyl-coenzyme A synthetase ACSM2A. J Mol Biol. 2009;
388:997–1008. doi: 10.1016/j.jmb.2009.03.064 PMID: 19345228
32. Knights KM, Drogemuller CJ. Xenobiotic-CoA Ligases: Kinetic and Molecular Characterization. Curr
Drug Metab. 2000; 1:49–66. PMID: 11467080
33. Hisanaga Y, Ago H, Nakagawa N, Hamada K, Ida K, Yamamoto M, et al. Structural basis of the sub-
strate-specific two-step catalysis of long chain fatty acyl-CoA synthetase dimer. J Biol Chem. 2004;
279:31717–31726. doi: 10.1074/jbc.M400100200 PMID: 15145952
34. McGuire DM, Gross MD, Van Pilsum JF, Towle HC. Repression of rat kidney L-arginine:glycine amidi-
notransferase synthesis by creatine at a pretranslational level J Biol Chem. 1984; 259:12034–12038.
35. Bouatra S, Aziat F, Mandal R, Guo AC, Wilson MR, Knox C, Bjorndahl TC, Krishnamurthy R, Saleem F,
Liu P, Dame ZT, Poelzer J, Huynh J, Yallou FS, Psychogios N, Dong E, Bogumil R, Roehring C, Wishart
An Intervention Study on Benzoic Acid Detoxification
PLOS ONE | DOI:10.1371/journal.pone.0167309 December 1, 2016 19 / 20
DS. The human urine metabolome. PLOS ONE. 2013; 8(9):e73076. doi: 10.1371/journal.pone.
0073076 PMID: 24023812
36. Fingerhut R. Stable isotope dilution method for the determination of guanidinoacetic acid by gas chro-
matography/mass spectrometry. Rapid Commun Mass Spectrom. 2003; 17(7):717–722 doi: 10.1002/
rcm.966 PMID: 12661026
An Intervention Study on Benzoic Acid Detoxification
PLOS ONE | DOI:10.1371/journal.pone.0167309 December 1, 2016 20 / 20