
Analysis and modelization of local hydrodynamics in bubble ...

CONTRIBUTION TO THE MODELIZATION, ANALYTICAL AND NUMERICAL, OF GENERATION AND PROPAGATION OF VIBRATIONS ORIGINATED BY RAILWAY TRAFFIC. ANALYSIS OF MITIGATION PROPOSALS
Author: Julia Irene Real Herráiz
Director: Dra. Clara Zamorano Martín
Tutor: Dr. Joaquín Catalá Alís
Valencia, January 2015


The present Doctoral Thesis is presented as a compendium of the
following publications:
Analysis of Vibrations in a Modeled Balasted Track Using
Measured Rail Defects. J.I. Real, T. Asensio, L. Montalbán, C.
Zamorano. Journal of Vibroengineering. June 2012. Volume 14. Issue
2. ISSN 1392-8716.
Study of Wave Barriers Design for the Mitigation of Railway
Ground Vibrations. J.I. Real, A. Galisteo, T. Real, C. Zamorano.
Journal of Vibroengineering. March 2012. Volume 14. Issue 1. ISSN
1392-8716.
Study of Railway Ground Vibrations caused by Rail Corrugation
and Wheel Flat. J.I. Real, A. Galisteo, T. Asensio, L. Montalbán,.
Journal of Vibroengineering. December 2012. Volume 14. Issue 4.
ISSN 1392-8716.

Clara Zamorano Martín, as Director of the Doctoral Thesis named “Contribution to the modelization, analytical and numerical, of generation and propagation of vibrations originated by railway traffic. Analysis of mitigation proposals”
AUTHORIZES
The presentation of de mentionated Thesis as Compendium of the following publications:
Analysis of Vibrations in a Modeled Balasted Track Using Measured Rail Defects. J.I. Real, T. Asensio, L. Montalbán, C. Zamorano. Journal of Vibroengineering. June 2012. Volume 14. Issue 2.
Study of Wave Barriers Design for the Mitigation of Railway Ground Vibrations. J.I. Real, A. Galisteo, T. Real, C. Zamorano. Journal of Vibroengineering. March 2012. Volume 14. Issue 1.
Study of Railway Ground Vibrations caused by Rail Corrugation and Wheel Flat. J.I. Real, A. Galisteo, T. Asensio, L. Montalbán,. Journal of Vibroengineering. December 2012. Volume 14. Issue 4.
In Valencia, January 10th 2014,
Clara Zamorano Martín


El Prof. Alfredo García García, como Coordinador del Programa de Doctorado en Ingeniería Civil y Urbanismo de la Universidad Politécnica de Valencia,
CERTIFICA:
Que en la reunión de la Comisión Académica del Programa de Doctorado en Ingeniería Civil y Urbanismo del día dieciocho de noviembre de dos mil trece, se acordó autorizar definitivamente a Dña. Julia I. Real la elaboración y presentación de su tesis doctoral como compendio de las tres publicaciones propuestas finalmente.
En Valencia, a 19 de diciembre de 2013
Prof. Alfredo García


Dedication
To Clara Zamorano and Joaquín Catalá for their support.


Acknowledgments
To God, for helping me to bear bad times.
To my parents, for instilling in me the value of work.
To my husband and daughters, for enduring my absences.
To my friends (Laura and Teresa), for joining me on such an arduous path.
To all the co-workers who have been, are and will be in our working group, for their enthusiasm and effort.
To my tutor, Joaquín, for his confidence.
To my director, Clara, for EVERYTHING.


RESUMEN
La tesis doctoral recoge el análisis del fenómeno de generación de
vibraciones en el contacto rueda-carril, transmisión de las mismas a
través del paquete de vía y propagación en el terreno aledaño. Se ha
prestado especial atención al tratamiento de distintas tipologías de
cargas (carga cuasi-estática y carga debida a imperfecciones),
diferentes configuraciones de vía (vía convencional y vía en placa
tranviaria) y mecanismos de atenuación de la propagación de
vibraciones (zanjas).
La investigación realizada se ha llevado a cabo implementando un
modelo analítico y otro numérico. El primero de ellos se basa en la
teoría de Timoshenko, para la modelización del carril, y en la
ecuación de ondas para la modelización de la transmisión de
vibraciones a través del paquete de vía. El segundo modelo se basa
en el método de elementos finitos y se ha implementado en un
software comercial.
Las modelizaciones realizadas con ambas metodologías han sido
calibradas y validadas con datos reales obtenidos de sendas
campañas experimentales. Este hecho dota de una gran robustez a
los modelos y los configura como herramientas útiles para distinto tipo
de simulaciones adicionales.


RESUM
La tesi doctoral recull l'anàlisi del fenomen de generació de vibracions
en el contacte roda-carril, transmissió de les mateixes a través del
paquet de via i propagació en el terreny limítrof. S'ha prestat especial
atenció al tractament de distintes tipologies de càrregues (càrrega
quasi-estàtica i càrrega deguda a imperfeccions), diferents
configuracions de via (via convencional i via en placa tramviària) i
mecanismes d'atenuació de la propagació de vibracions (rases).
La investigació realitzada s'ha dut a terme implementant un model
analític i un altre numèric. El primer d'ells es basa en la teoria de
Timoshenko, per a la modelització del carril, i en l'equació d'ones per
a la modelització de la transmissió de vibracions a través del paquet
de via. El segon model es basa en el mètode d'elements finits i s'ha
implementat en un software comercial.
Les modelitzacions realitzades amb les dues metodologies han sigut
calibrades i validades amb dades reals obtingudes de sengles
campanyes experimentals. Aquest fet dota d'una gran robustesa als
models i els configura com a ferramentes útils per a distints tipus de
simulacions addicionals.


ABSTRACT
The present PhD Thesis addresses the analysis of the vibration
generation phenomenon in the wheel-rail contact, transmission across
the track elements and propagation through the adjacent ground.
Additionally, particular attention has been paid to the treatment of
different types of loads (quasi-static load and load due to
imperfections), different track configurations (ballasted track and tram
slab track) and mechanisms of attenuation of vibration propagation
(wave barriers) as well.
The research has been developed implementing an analytical model
and a numerical model. The first one is based on the Timoshenko
theory for the rail modeling, and on the wave equation to model the
transmission of vibrations through the track. The second model is
based on finite element method and has been implemented in a
commercial software.
Models performed with both methodologies have been calibrated and
validated with real data obtained from experimental campaigns. This
fact provides great robustness to the models and configures them as
helpful tools for different types of additional simulations.


1
INDEX
INTRODUCTION .................................................................................. 3
OBJECTIVES ..................................................................................... 23
CHAPTER 1 ....................................................................................... 27
CHAPTER 2 ....................................................................................... 61
CHAPTER 3 ....................................................................................... 95
GENERAL DISCUSSION ................................................................ 117
CONCLUSIONS ............................................................................... 165
APPENDIX 1 .................................................................................... 169
APPENDIX 2 .................................................................................... 179
APPENDIX 3 .................................................................................... 189

2

3
INTRODUCTION

4

5
Introduction is structured in two parts: in the first one, the theoretical
framework in which the following chapters are based is established. In
the second one, the state of the art which constitutes the theoretical
base to prepare the publications (included in the chapters 1-3) that
represent the body of the Thesis is summarized.
Regarding the theoretical framework, the concept of rail vibration is
certainly an application of the basic concept of mechanical vibration, in
this case to the railway field. Despite its simplicity, it has been
considered appropriate to outline the basic concepts of vibrations
generation in the wheel-rail contact, transmission of the vibratory wave
across the track (superstructure and infrastructure) and propagation of
the wave through the adjacent ground. Finally, and although it is not
part of the present PhD Thesis, it is worth mentioning the
phenomenon of vibration reception in nearby buildings.
In relation with the state of the art, the most interesting contributions of
scientific literature are collected and then divided in: experimental
contributions and contributions related to the modeling (analytical and
/ or numerical of the phenomenon).
1. Theoretical Foundations of the generation-transmission-
propagation phenomena of railway vibrations.
Traditionally, these three phenomena are studied uncoupled and
subsequently assembled to provide an overview of the physical fact
that happens since a railway vehicle passage generates an overload
over the track until the vibration is perceived in nearby buildings.
1.1 Mechanisms of Generation of Railway Vibrations
Railway vibration is generated at the wheel-rail contact. From the
contact point, the dynamic overloads transmitted by the train to the
track appear in different forms, being the noise and the vibrations the
most important.
Focusing on the vibrations, these are caused by different phenomena,
either physiological or pathological. Moreover, some of them are
connected to the vehicle and other relative to the track. In both cases,
they can be grouped as follows:

6
1.1.1. Physiological causes
These phenomena are related to the train movement. There are two
differentiated subgroups:
a. Causes due to Vehicle:
It is traditionally called "quasi-static load" and it is due to the constant
movement of the train load along the track.
The characteristics of these vibrations are defined by three
parameters: Structure of axles and bogies of the train composition,
train speed and load transmitted per axle.
The first two parameters influence the frequency of vibration
(specifically they correspond with a lower peak, linked to the distance
between bogies; and a higher peak due to the distance between
axles). The third parameter has influence in the amplitude of the
excitation, being possible to assume that the value of this one is
proportional to the value of the load.
b. Causes due to the Track:
In this case, all the "stiffness discontinuities" existing along the trace
are taken into account, such as: separation of sleepers (this fact gives
rise to the secondary bending of the rail), expansion joints, stiffness
transition in infrastructure and / or superstructure and others.
The characteristics of these vibrations are defined by three
parameters: train speed, load transmitted per axle and finally, several
characteristic distances determined from the separation between
sleepers, type and separation of the joints, values of railway stiffness
and the variation of all of them along the trace.
Aspects related to the separation of sleepers, joints, stiffness
variations and others in addition to the speed are responsible of the
vibration frequency. The third, in addition to structural aspects of the
first, is the cause of the excitation amplitude.
7
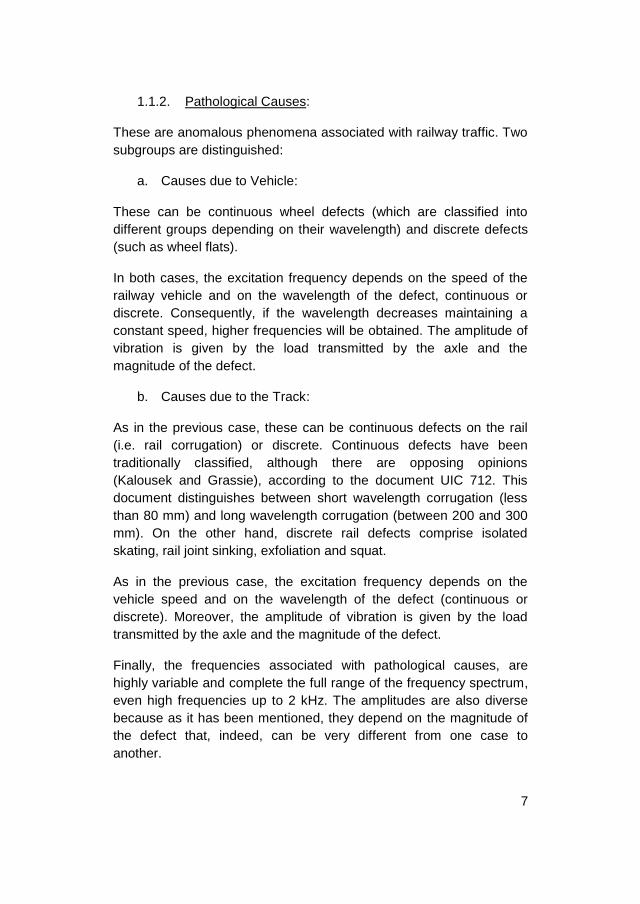
1.1.2. Pathological Causes:
These are anomalous phenomena associated with railway traffic. Two
subgroups are distinguished:
a. Causes due to Vehicle:
These can be continuous wheel defects (which are classified into
different groups depending on their wavelength) and discrete defects
(such as wheel flats).
In both cases, the excitation frequency depends on the speed of the
railway vehicle and on the wavelength of the defect, continuous or
discrete. Consequently, if the wavelength decreases maintaining a
constant speed, higher frequencies will be obtained. The amplitude of
vibration is given by the load transmitted by the axle and the
magnitude of the defect.
b. Causes due to the Track:
As in the previous case, these can be continuous defects on the rail
(i.e. rail corrugation) or discrete. Continuous defects have been
traditionally classified, although there are opposing opinions
(Kalousek and Grassie), according to the document UIC 712. This
document distinguishes between short wavelength corrugation (less
than 80 mm) and long wavelength corrugation (between 200 and 300
mm). On the other hand, discrete rail defects comprise isolated
skating, rail joint sinking, exfoliation and squat.
As in the previous case, the excitation frequency depends on the
vehicle speed and on the wavelength of the defect (continuous or
discrete). Moreover, the amplitude of vibration is given by the load
transmitted by the axle and the magnitude of the defect.
Finally, the frequencies associated with pathological causes, are
highly variable and complete the full range of the frequency spectrum,
even high frequencies up to 2 kHz. The amplitudes are also diverse
because as it has been mentioned, they depend on the magnitude of
the defect that, indeed, can be very different from one case to
another.

8
In addition, according to Jones et al. (1996, 2000) this type of
vibrations can be perceived, not only close to the track, but also at
some distance from the track. This author considers that from 10
meters in advance measured from the rail, in a ground type, only the
vibration generated by this mechanism is able to be perceived.
1.2. Transmission Mechanisms of vibrations across the
track
After the generation of vibrations in the wheel-rail contact, these are
transmitted across the railway superstructure and infrastructure to the
ground.
In the case of a ballasted track, the transmission of the vibrations
follows the following order: rail - elastomer 1 – sleeper -elastomer 2
(optional) - ballast - platform. In the case of a slab track would be: rail
– elastomer 1 - sleeper (optional) - elastomer 2 (optional) - concrete
slab - elastomer 3 (optional) - platform.
The passage through various elements causes that the amplitude of
vibration is steadily attenuated as it moves away from the wheel-rail
contact. This fact occurs in most cases, except in those in which
resonance phenomena occur.
It is worth noting that this decrease of the vibration amplitude is not
homogeneous for all frequencies.
1.3. Propagation of vibrations through the ground
In this point, the necessary assumptions to address the submodel of
vibration propagation through the ground are introduced. Firstly,
Rayleigh waves will be defined and then the phenomena of wave
propagation will be presented.
a. Wave types
Once the disturbance is generated in the wheel-rail contact, this is
transmitted through the track elements and propagated through the
ground in waves form. Due to its similarity to the seismic
phenomenon, the theory of seismic waves is used to adequately
explain the phenomenon.
9
This theory provides two types of waves: the compression waves (P)
and shear waves (S), which can be further divided in horizontal shear
waves (SH) and vertical shear waves (SV). The combination of P and
SV waves on the ground surface originates the known as Rayleigh
Waves that, due to its higher energy and its propagation near the free
surface, have been usually regarded as the most important in the
railway field.
Indeed, as Thompson (2009) demonstrates in Railway Noise and
Vibration. Mechanisms, modeling and means of control, the maximum
vertical displacement caused by the railway vibration is concentrated
at a depth equal to 0.15 times the length of the Rayleigh wave. From
this point, the vertical displacement clearly decreases until the depth
equals the wavelength. This is an important aspect for the analysis of
the applications referred in chapter 2 of the Thesis.
Finally, the propagation velocity of Rayleigh waves depends on soil
mechanical parameters (density, elastic modulus and Poisson's ratio).
This fact will be analyzed in the discussion of the second paper.
b. Propagation phenomena
Previously, it is necessary to define two basic concepts: wavefront and
ray. Wavefront is the geometric locus of all points of the medium with
the same vibration phase. Rays are understood as the lines
perpendicular to the successive wavefronts.
The geometric shape of a wave front depends on the shape of the
emitter focus and on the medium through it propagates. If the focus is
isolated and the medium is isotropic, the successive wave fronts are
concentric spheres whose common center is the source. In the case
of considering a two-dimensional medium, wave fronts are concentric
circles. If the emission focus has a linear shape, it is obtained a
cylindrical wavefront that propagates along the radius of the cylinder
axis. If the wave is examined in very remote points of the source,
spheres wave fronts will have great radius and could be considered as
planes.

10
Throughout the three introduced publications, the conditions of
homogeneous and isotropic media are assumed, as a kind of
simplification of the problem. In this assumption two facts are
accomplished:
The propagation velocity is the same at every point and in all
directions. Hence, the gap between two wave surfaces must
be the same between corresponding points.
The rays are straight lines.
The concept of propagation was analyzed and characterized by
Christian Hüygens in the 17th century, and is basically defined as the
advance of the wavefront in the medium. When the wave arrives at
the surface of separation of two different medium (different
propagation velocities), two important phenomena occur: part of the
energy carried by the wave crosses to the second medium and part of
the energy remains in the same medium. These phenomena are
linked with some changes in the direction of propagation known as
reflection (the wave does not change of medium) and refraction (the
wave changes of medium).
The following diagram shows the parameters involved in the cited
reflection and refraction phenomena.
Fig. 1. Reflection and refraction phenomena.
Source: Thompson.

11
While frequencies remain constant (except specific cases where the
critical angle is exceeded or in multilayered medium) the amplitudes of
the reflected and refracted waves change with respect to the incident
wave. The parameters that relate these amplitudes are respectively
known as coefficient of reflection and coefficient of refraction.
One of the characteristics of Rayleigh waves is that a mode
conversion may happen when waves incide on an interface between
solids (as shown in the figure above). This conversion means that
after the incidence of a P wave, the SV waves may appear reflected or
refracted. In addiction, an SV incident wave may generate P waves
after inciding on the interface. The following figure outlines the
phenomenon.
Figure 2. Conversion phenomenon of a P wave.
Source: Thompson.

12
2. State of Art
When collecting the main researches that have been studied for the
development of this PhD Thesis, the contents will be divided in two
different thematic blocks: experimental studies and mathematical
models (analytical and numerical).
Regarding the experimental results, the main results are shown below
in chronological order.
The first studies date from 1863 and were published by South. These
studies contained the results of a measurement campaign of railway
vibrations in the Watford tunnel (United Kingdom).
In 1901 Mallock carried out a measurements campaign of vibrations in
the Central Station of London, and he analyzed how the vibrations
were propagated until the houses close to the station.
In 1979, Dawn and Stanworth measured the level of vibrations
generated by railway in a structure located about 40 meters away from
the track. The data were analyzed trying to understand the effect that
the speed and type of train have on the final results. Following these
studies, in 1983 Dawn studied the influence of the sleeper separation
on the generation of vibrations and how these, related to a particular
frequency, propagate through the ground.
In 1983, Melke and Kramer measured in both infrastructure and
superstructure the vibrations caused by the passage of a tram.
In 1996, Jones and Block measured the vibrations generated by the
circulation of a freight train circulating at a specific speed in
determinate elements of the superstructure and other points located at
a certain distance from the track.
The development of high-speed trains caused some concern in the
railway administrations responsible for the operation caused by the
phenomenon of generation-transmission-propagation-reception of
vibrations. Thus, in 1998 the Swedish railway administration organized
an intensive measurement campaign of displacements, velocities and
accelerations at different points of the railway superstructure and at

13
the surrounding soil during the passage of a conventional train at
different speeds. It was demonstrated that at speeds below 70 km/h
the response of the ground was similar to the static response, but
when the speed exceeded the 200 km/h the characteristic magnitudes
of vibration (displacement, velocity and acceleration) experienced an
extraordinary increase. The reflections of this work were collected by
Adolfson et al. in 1999.
Also in 1998, the Belgian railway company organized a set of tests to
certify the high-speed line between Brussels and Paris. The
accelerations of vibrations on different elements of the railway
superstructure and different ground points were measured, even it
was possible to collect data at 72 meters from the trace. The
campaign was performed with a Thalys train circulating at speeds
between 160 and 300 km/h. The results of the study showed the main
track excitation frequencies. Also, the study showed that these
frequencies corresponded to different genesis. In this case, as
Degrande and Schillemans published in 2001, the vibrations were
characterized by the circulation frequency of axles, circulation
frequency of bogies and circulation frequency over sleepers.
In 2003 Schillemans studied the influence that the burying of the
railway line of Antwerp would have on the neighboring buildings, given
that in some cases the distance between the foundations of buildings
and the infrastructure was only 4 meters. One of the most interesting
results of this study was the recommendation to build a slab track on
an elastomeric mat.
In 2005 Xia studied the vibrations generated by a train passage
through a viaduct. They recorded data in different points of the ground
and checked how the vibration accelerations level increased with the
train speed and decreased as the measuring point was moved away
from the piles of the infrastructure. Data in two buildings near the track
were also collected, showing how the amplitude of vibrations
increased with the number of floors of the building.
Finally, Auersch (2005) and (2006) participated in an intense vibration
measurement campaign sponsored by the German railway
administration. The accelerations of vibration in vehicle, track and
ground were measured with different railway trains circulating at

14
speeds between 100 and 300 k/h. One of the main conclusions drawn
is that the effect of the quasi-static load was only important in
measurements made on track and in its immediate surroundings.
Regarding the modeling of the phenomenon of generation-
transmission-propagation of railway vibrations, the most interesting
researches are introduced.
The first models date from 1976 and were performed by Gutowski and
Dym. They focused on two specific aspects: to model the train´s load,
either as a punctual load or as loads train, and to study the ground
damping phenomena. They concluded that in the case of modeling
the train as a punctual load, the ground damping is due to its own
internal damping, being possible to neglect the geometric damping.
The main conclusion of Gutowski and Dym was refused in 1979 by
Verhas, who compared the results obtained using both load models.
He concluded that to accurately obtain the vibrations level induced by
the passage of a train, it has to be taken into account the two damping
mechanisms cited.
In 1979, Kurzweil published an analytical expression to obtain the
level of vibration caused by the passage of a train in the vicinity of a
metropolitan tunnel.
Since 1995, concurring with the commissioning of various high-speed
railway lines, different works about analytical, semi-analytical and
numerical modeling of these phenomena began to be published.
One of the most interesting contributions is that from Krylov et al
(2000). They focused their work on the characterization of the
vibration source. They presented an analytical model to represent the
quasi-static part of the force transmitted by the vehicle to the track.
Thus, the contribution of potential irregularities related to track and
vehicle was ignored. The authors worked with a train which moved at
a constant and known speed. In this context, the rail is modeled as an
Euler-Bernoulli beam resting on an elastic halfspace.
Dieterman and Metrikine (1996) and Metrikine and Popp (2000)
modified the model of Krylov et al. They assume that in the
longitudinal direction to the track, the track geometry remains
15
constant. Hence, the Fourier transform can be performed to rise and
solve the problem formulated in frequency domain and wavenumber.
Moreover, they carried out two important simplifications. On the one
hand, a uniform distribution of normal stresses along the section of
track is assumed and, on the other hand, it is only required
compatibility of displacements in the midline of the track. One
limitation of this approach (as revealed later by Steenbergen and
Metrikine, 2007) is that it was only valid for low circulation speeds
(below 70 km/h).
In 1996 Jones et al. developed a model of vibration generation that
allows distinguishing among vibrations generated by the quasi-static
load (similar to the work of Krylov) and vibrations due to the
irregularities of rail and / or wheels.
Regarding the study of dynamic overloads, Valerio and Cuéllar (2009)
analyzed its influence not only in the generation of vibrations but also,
indirectly, in the fatigue of various elements of a high speed railway
line with mixed traffic.
In 2004, Jones and Sheng presented a model which included the load
treatment method developed by Jones in 1996. In this work, the track
was modeled using beam and spring elements coupled to a model
that represents the dynamic behavior of a multilayered ground. These
authors, in several times, carried out a validation of the proposed
model with experimental data thanks to an exhaustive data gathering
campaign. One of the main conclusions deals with the relation
between the train speed and the Rayleigh waves propagation velocity
through the ground: when the train speed is far greater than the
velocity of Rayleigh waves through the ground, the vibrations due to
the irregularities of rail and wheels are similar, in terms of magnitude,
to the vibrations due to the quasi-static load effect. However, when the
train speed is similar to the velocity of Rayleigh waves, the
predominant vibrations trough the ground are those due to the
passage of the quasi-static load.
The study of dynamic overloads generated by pathologies such as rail
corrugation and complicated points (curves, turnouts, etc.) was
analyzed by Egaña et al. (2002), from the point of view of their
influence on the genesis of vibrations.

16
Auersch in 2005 studied the vibratory phenomenon in the Germany
high-speed lines, as well as in an experimental manner with a model
that assumes the interaction vehicle-track-ground. The vehicle is
represented by a multi-body model; the railway superstructure is
modeled using the finite element method and the ground is modeled
using a boundary element model in frequency and wavenumber
domain.
In 2006 Karlström and Boström, presented a numerical model (finite
element method) of generation and propagation of vibrations
generated by a high-speed train using special boundaries to satisfy
the condition of radiation.
Since 2007, Galvín et al. work on the experimental and numerical
studies of vibrations caused by the passage of high-speed trains
through the ground and nearby structures using boundary element
models in time domain. Furthermore, they have also carried out
complete 3D finite element models of vehicle-track-ground interaction
and, in 2014, a 3D model in time domain based on Green's functions
that take into account the ground-structure interaction has been
presented.
Koziol et al. (2008 y 2009) analyzes the generation-transmission-
propagation of railway vibrations with Wavelet techniques for the
analysis of these phenomena, even considering multilayered grounds
with high circulation speeds.
Real et al. (2011) developed an analytical model, which is the
precursor of one of the articles contained in this PhD Thesis, whose
main contribution, in addition to the treatment of loads, is the modeling
of the rail as a Timoshenko beam, instead of employing the Euler-
Bernoulli model.
In view of the above, this document introduces three publications that
present both models, analytical and numerical, and may be useful to
explain the whole phenomenon of generation – transmission -
propagation of the vibration generated in the wheel-rail contact. In
every case, real data have been used, being very useful to calibrate
and validate the presented models.

17
References
Adolfsson, K., Andréasson, B., Bengtson, P. E., Bodare, A., Madshus,
C., Massarch, R., y otros. (1999). High speed lines on soft ground.
Evaluation and analyses of measurements from the West Coast Line.
Banverket, Sweden.
Auersch, L. (2006). Ground vibrations due to railway traffic. The
calculation of the efects of moving static loads and their experimental
verification. Journal of Sound and Vibration, 293 (3), 599-610.
Auersch, L. (2008). The effect of critically moving loads on the
vibrations of soft soils and isolated railway tracks. Journal of Sound
and Vibration, 310 (3), 587-607.
Auersch, L. (2005). The excitation of ground vibration by rail traffic:
theory of vehicle-track-soil interaction and measurements of high-
speed lines. Journal of Sound and Vibration, 284 (1), 103-132.
Auersch, L. (2010). Theoretical and experimental excitation force
spectra for railway induced ground vibration-vehicle-track soil
interaction, irregularities and soil measurements. Vehicle System
Dynamics, 48 (2), 235-261.
Auersch, L. (2012). Train induced ground vibrations: different
amplitude-speed relation for two layered soils. Proceedings of the
Institution of Mechanical Engineers, Part F: Journal of Rail and Rapid
Transit, 226 (5), 469-488.
Auersch, L., & Said, S. (2010). Attenuation of ground vibrations due to
the different technical sources. Earthquake Engineering and
Engineering Vibration, 9 (3), 337-344.
Cámara, J. L., Cuéllar, V., & González, P. (2012). Análisis estadístico
de cargas dinámicas para el estudio de la fatiga de una línea de alta
velocidad con tráfico mixto. Ingeniería Civil, 165, 115-122.
Dawn, T. M. (1983). Ground vibrations from heavy freight trains.
Journal of sound and vibration, 87 (2), 351-356.
Dawn, T. M., & Stanworth, C. G. (1979). Ground vibrations from
passing trains. Journal of sound and vibration, 66 (3), 355-362.

18
Degrande, G., & Schillemans, L. (2001). Free field vibrations during
the passage of a Thalys HST at variable speed. Journal of Sound and
Vibration, 247 (1), 131-144.
Dieterman, H. A., & Metrikine, A. (1996). The equivalent stiffness of a
halfspace interacting with a beam. Critical velocities of a moving load
along the beam. EUROPEAN JOURNAL OF MECHANICS SERIES A
SOLIDS, 15, 67-90.
Egaña, J. I., Viñolas, J., & Gil-Negrete, N. (2002). Modelización y
estudio del desgaste ondulatorio de carril. Anales de la ingeniería
mecánica, 14 (1), 223-227.
Galvín, P., & Romero, A. (2014). A 3D time domain numerical model
based o half-space Green’s function for soil-structure interaction
analysis. Computational Mechanics, 53 (5), 1073-1085.
Galvin, P., François, S., Schevenels, M., Bongini, E., Degrande, G., &
Lombaert, G. (2010). A 2.5D coupled FE-BE model for prediction of
railway induced vibrations. Soil Dynamics and Earthquake
Engineering, 30 (12), 1500-1512.
Galvín, P., Romero, A., & Domínguez, J. (2010). Vibrations induced
by HST passage on ballast and non-ballast tracks. Soil Dynamics and
Earthquake Engineering, 30 (9), 862-873.
Gutowski, T. G., & Dym, C. L. (1976). Propagation of ground vibration:
a review. Journal of Sound and Vibration, 49 (2), 179-193.
Jones, C. J., & Block, J. R. (1996). Prediction of ground vibration from
freight trains. Journal of Sound and Vibration, 193 (1), 205-213.
Jones, C. J., Sheng, X., & Petyt, M. (2000). Simulations of ground
vibration from a moving harmonic load on a railway track. Journal of
Sound and Vibration, 231 (3), 739-751.
Karlström, A., & Boström, A. (2006). An analytical model for train-
induced ground vibrations from railways. Journal of Sound and
Vibration, 292 (1), 221-241.
Koziol, P. (2009). Wavelet analysis of multilayered ground vibrations
as a result of high speed trains. Proceedings of the Twelfth

19
International Conference on Civil, Structural and Environmental
Engineering Computing. Funchal, Madeira.
Koziol, P., Mares, C., & Esat, I. (2008). Wavelet approach to vibratory
analysis of surface due to a load moving in the layer. International
Journal of Solids and Structures, 45 (7), 2140-2159.
Krylov, V. V. (2001). Generation of ground vibration boom by high-
speed trains, in Noise and Vibration from High-Speed Trains. Noise
and vibration from high-speed trains , 251-283.
Krylov, V. V. (1995). Generation of ground vibrations by superfast
trains. Applied Acoustics, 44 (2), 149-164.
Krylov, V. V. (1994). On the theory of railway-induced ground
vibrations. Le Journal de Physique IV, 4 (C5), 769-772.
Krylov, V. V. (1996). Vibrational impact of high-speed trains. Effect of
track dynamics. The Journal of the Acoustical Society of America, 100
(5), 3121-3134.
Krylov, V. V., & Ferguson, C. C. (1995). Recent progress in the theory
of railway-generated ground vibrations. Proceedins of the Institute of
Acoustics .
Krylov, V. V., Dawson, A. R., Heelis, M. E., & Collop, A. C. (2000).
Rail movement and ground waves caused by high-speed trains
approaching track-soil critical velocities. Proceedings of the Institution
of Mechanical Engineers, Part F: Journal of Rail and Rapid Transit,
214 (2), 107-116.
Krylov, V., & Ferguson, C. (1994). Calculation of low-frequency
ground vibrations from railway trains. Applied Acoustics, 42 (3), 199-
213.
Kurzweil, L. G. (1979). Ground-borne noise and vibration from
underground rail systems. Journal of sound and vibration, 66 (3), 363-
370.
Lagos, R. F., Alonso, A., Vinolas, J., & Pérez, X. (2012). Rail vehicle
passing through a turnout: analysis of different turnout designs and
20
wheel profiles. Proceedings of the Institution of Mechanical Engineers,
Part F: Journal of Rail and Rapid Transit .
Lang, J. (1988). Ground-borne vibrations caused by trams, and control
measures. Journal of Sound and Vibration, 120 (2), 407-412.
Lombaert, G., Degrande, G., Kogut, J., & François, S. (2006). The
experimental validation of a numerical model for the prediction of
railway induced vibrations. Journal of Sound and Vibration, 297 (3),
512-535.
Madshus, C., & Kaynia, A. M. (2000). High-Speed Railway Lines On
Soft Ground: Dynamic Behaviour At Critical Train Speed. Journal of
Sound and Vibration, 231 (3), 689-701.
Madshus, C., Bessason, B., & Hårvik, L. (1996). Prediction model for
low frequency vibration from high speed railways on soft ground.
Journal of sound and vibration, 193 (1), 195-203.
Melke, J. (1988). Noise and vibration from underground railway lines:
Proposals for a prediction procedure. Journal of Sound and Vibration,
120 (2), 391-406.
Melke, J., & Kramer, S. (1983). Diagnostic methods in the control of
railway noise and vibration. Journal of Sound and Vibration, 87 (2),
377-386.
Metrikine, A. V., & Popp, K. (2000). Steady-state vibrations of an
elastic beam on a viscoelastic layer under moving load. Archive of
Applied Mechanics, 70 (6), 399-408.
Metrikine, A. V., & Vrouwenvelder, A. C. (2000). Surface ground
vibration due to a moving train in a tunnel: two-dimensional model.
Journal of Sound and vibration, 234 (1), 43-66.
Real, J., Martínez, P., Montalbán, L., & Villanueva, A. (2011).
Modelling vibrations caused by tram movement on slab track line.
Mathematical and Computer Modelling, 54 (1), 280-291.
Romero, A., Galvin, P., & Dominguez, J. (2012). A time domain
analysis of train induced vibration. Earthquake and Structures, 3 (3-4),
297-313.

21
Salvador, P., Real, J., Zamorano, C., & Villanueva, A. (2011). A
procedure for the evaluation of vibrations induced by the passing of a
train and its application to real railway traffic. Mathematical and
Computer Modelling, 53 (1), 42-54.
Schillemans, L. (2003). Impact of sound and vibration of the North-
South high-speed railway connection through the city of Antwerp
Belgium. Journal of sound and vibration, 267 (3), 637-649.
Sheng, X., Jones, C. J., & Petyt, M. (1999). Ground vibration
generated by a harmonic load acting on a railway track. Journal of
Sound and Vibration, 225 (1), 3-28.
Sheng, X., Jones, C. J., & Petyt, M. (1999). Ground vibration
generated by a load moving along a railway track. Journal of sound
and vibration, 228 (1), 129-156.
Sheng, X., Jones, C. J., & Thompson, D. J. (2003). A comparison of a
theoretical model for quasi-statically and dynamically induced
environmental vibration from trains with measurements. Journal of
Sound and Vibration, 267 (3), 621-635.
Sheng, X., Jones, C. J., & Thompson, D. J. (2004). A theoretical study
on the influence of the track on train-induced ground vibration. Journal
of Sound and Vibration, 272 (3), 909-936.
South, J. (1863). Experiments, Made at Watford, on the Vibrations
Occasioned by Railway Trains Passing through a Tunnel.
Proceedings of the Royal Society of London, 13, 65-83.
Steenbergen, M. J., & Metrikine, A. V. (2007). The effect of the
interface conditions on the dynamic response of a beam on a half-
space to a moving load. European Journal of Mechanics-A/Solids, 26
(1), 33-54.
Takemiya, H. (2001). Ground vibrations alongside tracks induced by
high-speed trains: prediction and mitigation, in Noise and Vibration
from High-Speed Trains. Noise and vibration from high-speed trains ,
347.
Thompson, D. (2009). Railway noise and vibration: mechanisms,
modelling and means of control.

22
Udías, V. A. (1999). Principles of Seismology. Cambridge, United
Kingdom: Cambridge University Press.
Valerio, J., & Cuellar, V. (2000). Análisis de las vibraciones
producidas por el tráfico ferroviario en medios urbanos. Ingeniería
Civil, 118.
Verhas, H. P. (1979). Prediction of the propagation of train-induced
ground vibration. Journal of Sound and Vibration, 66 (3), 371-376.
Xia, H., De Roeck, G., Zhang, N., & Maeck, J. (2003). Experimental
analysis of high speed railway bridge under Thalys trains. Journal of
Sound and Vibration, 268 (1), 103-113.
Xia, H., Zhang, N., & Cao, Y. M. (2005). Experimental study of train-
induced vibrations of environments and buildings. Journal of Sound
and Vibration, 280 (3), 1017-1029.
Xia, H., Zhang, N., & Gao, R. (2005). Experimental analysis of railway
bridge under high-speed trains. Journal of Sound and Vibration, 282
(1), 517-528.
Yang, Y. B., & Hung, H. H. (1997). A parametric study of wave
barriers for reduction of train-induced vibrations. International Journal
for Numerical Methods in Engineering, 40 (20), 3729-3747.
Zhai, W. M., Wang, K. Y., & Lin, J. H. (2004). Modelling and
experiment of railway ballast vibrations. Journal of sound and
vibration, 270 (4), 673-683.

23
OBJECTIVES

24

25
General Purpose
To go more deeply into the knowledge of vibrations generation
phenomenon in the wheel-rail contact, its transmission across the
track and its propagation through the adjacent ground to the track. In
this regard, it is important to identify which are the generator causes of
these vibrations, in which operation regimes predominate one or other
vibration frequencies, which are the physical phenomena that justify
the transmission of these vibrations across the track and its
propagation through the adjacent ground and which are the tools
(methods or materials) available to minimize the vibrations generated
in the wheel-rail contact, as in new tracks as in tracks in operation.
Specific Objectives
To develop, calibrate and validate an analytical model capable to
predict the generation and transmission of railway vibrations. The
application of this model to a real case has been essential to evaluate
the validity its accuracy. In this regard, it has been important to discern
in the formulation between the different track typologies (ballasted
track versus concrete slab track), different railway operations and
railway vehicles in operation, level of detail required to the modeling
(regarding the grouping of elements in layers), adjustment of the
boundary conditions and compatibility with the real circumstances of
the studied case.
Formulate, calibrate and validate a numerical model able to predict the
generation, transmission and propagation of railway vibrations. The
application of this model to a real case has been essential to evaluate
its suitability. In this context it will be necessary to establish basic
modeling assumptions leading to find the balance between the
accuracy of the results provided by the model and computation time.
Furthermore, heterogeneity of the different elements that constitute
the track has obliged to find easier geometries capable of simulate
mechanically the behavior of the original element.
To confirm the existing results in the scientific literature about the
effectiveness of the different types of wave barriers in the mitigation of
railway vibrations propagation. Certainly, this is one of the easiest
solutions to implement in a railway infrastructure in operation, but it is
necessary to analyze the relevant factors (depth, width, in-filled

26
material, etc) for its implementation in an urban environment. In this
context, the type of terrain in which this solution is implemented plays
a key role. Hence, the results must be circumscribed to the specific
study case.
To go more deeply into the modeling of certain pathologies inherent to
the railway traffic (specifically, wheel flats and rail corrugation) from
the perspective of its potential for generate vibrations. In this regard, it
has been necessary to quantify the accelerations due to these
phenomena and the frequency ranges in which they occur, all in the
finite element method context.

27
CHAPTER 1
ANALYSIS OF VIBRATIONS IN A MODELED BALASTED TRACK
USING MEASURED RAIL DEFECTS
J. I. Real, T. Asensio, L. Montalbán, C. Zamorano
Vibroengineering. Journal of Vibroengineering, June 2012. Volume14,
Issue 2. ISSN 1292-8716

28

29
Abstract.
Vibrations generated by trains and transmitted to the ground and
nearby structures are a known source of problems associated with
railway transport. Therefore this phenomenon should be studied in
detail to avoid a negative impact on the environment. Within this
framework, the article develops an improved version of a previously
published analytical model capable of predicting ground vibrations
caused by the passing of railway vehicles. The new features include a
new formulation of the models with five layers of material and an
enhanced load input process that takes into account actual rail defects
data as well as the Hertz theory for the rail-wheel contact. The model
is adapted to a conventional ballasted track in Solares (Spain) as well
as calibrated and validated with data collected on site. Hence the
model is proved to be able to properly reproduce vibrations for the
case of varying track typologies, constituting a useful research and
design tool.
Keywords: ground vibrations, ballasted track, rail defects, Hertz
contact.

30
Nomenclature
a Track gauge
A Rail cross-sectional area
Ak Rail shear cross-sectional area
c2 Train primary damping coefficient
cLj Rail pad/sleeper/ballast/ground 1/ground 2 longitudinal wave
velocity (j=1,2,3,4,5)
cTj Rail pad/sleeper/ballast/ground 1/ground 2 shear wave
velocity (j=1,2,3,4,5)
C Equivalent ballast coefficient
E Rail and wheel Young’s modulus
Ej Rail pad/sleeper/ballast/ground 1/ground 2 Young modulus
(j=1, 2, 3,4,5)
E’ Hertz equivalent elastic modulus
G Rail shear modulus
hj Layer thickness (j=1, 2, 3,4,5)
I Rail inertia in y-axis direction
k1 Equivalent track spring constant

31
k2 Train primary spring constant
KH Hertz contact stiffness
m1 Unsprung mass per axle
m2 Sprung mass per axle
Pi Harmonic load magnitude
Q Static load per axle
R0 Hertz effective radius of curvature
RR Rail longitudinal radius of contact
RRT Rain transverse radius of contact
RW Wheel longitudinal radius of contact
RWT Wheel transverse radius of contact
V Train velocity
y1 Unsprung mass vertical displacement
y2 Sprung mass vertical displacement
zr Rail vertical profile
α1 First semi-axis of elliptical contact area
α2 Second semi-axis of elliptical contact area
ε Wheel roughness

32
λj First Lamé parameter (j=1, 2, 3, 4, 5)
λ*j First damping coefficient (j=1, 2, 3, 4, 5)
μj Second Lamé parameter (j=1, 2, 3, 4, 5)
μ*j Second damping coefficient (j=1, 2, 3, 4, 5)
θ Angle between planes containing Rw and RR
ρ Rail mass density
ρj Rail pad/sleeper/ballast/ground1 ground2 mass density (j=1,
2, 3, 4, 5)
Rail and wheel Poisson coefficient ט
j Rail pad/sleeper/ballast/ground 1/ground 2 Poisson coefficientט
(j=1,2,3,4,5)
i Harmonic load frequency
ξ Hertz parameter

33
Introduction
The increasing development of both urban and interurban railway
lines across the world is a consequence of growing mobility needs as
well as rising environmental concerns among the citizenry. Railways
present many advantages such as high capacity and low CO2
emissions compared to other transport means. However, they also
present certain potential problems which should be addressed in order
to make this transport mean a truly beneficial choice.
Within this context, vibrations caused by the passing of trains arise as
one of the main sources of potential disturbance for the environment
near railway lines. The generation and transmission of mechanical
waves through the track and the ground is a phenomenon widely
studied and yet not fully modeled, therefore representing a challenge
for track designers.
In order to better understand this process, Salvador et al. [1] and Real
et al. [2] developed an analytical model of the wave generation and
transmission through the track infrastructure. This model was
calibrated and validated with real data for both a high-speed ballasted
track and a tram slab track, hence proving to be a useful tool for
further research.
The main objective of this paper is to improve certain important
aspects of its formulation and adapt the model to a conventional
ballasted. The most important improvement is the implementation of
the model constituted by five layers of materials. Moreover the load
modeling is further enhanced from previous versions as it now takes
into account the actual rail defects measured on-site.

34
The paper is structured as follows: first of all a brief literature review is
exposed. Then the model development is explained, focusing mainly
on all the modified aspects from previous published versions. A brief
explanation of the data collection is then described, and finally the
model is calibrated and validated with acceleration data measured on
the Santander-Liérganes line operated by FEVE (Ferrocarriles
Españoles de Vía Estrecha) in the north of Spain.
Modeling vibrations associated with railways has been a subject of
study for many years. From a theoretical point of view, it is worth
mentioning the work of Thompson [3], which deals with both vibration
and noise. More practical studies have been carried out by authors
such as [4] and [5], focusing on different aspects of the phenomenon.
In terms of modeling, there are two main approaches: analytical and
numerical. Several works regarding both modeling schemes are
reviewed in [1] and [2] as a background for the model presented in
this paper. Among them the reader may consult [6] and [4] as an
example of numerical formulations [7] and [8] as an example of
analytical approaches.
The way loads are defined as an input for a vibration model has been
widely addressed for numerical models ([9]) but it is still an issue when
choosing an analytical formulation. The model defined in [2] presented
an improvement in this aspect by formulating both harmonic and static
loads and defining a set of loads so as to represent the train axle
configuration. However, that approach showed certain limitations as
there was no actual data available to define wheel and rail defects and
the disused Zimmermann formulation to calculate the static
component of railway vibrations. Moreover, the auxiliary quarter-car
model adopted to calculate input forces relied on a parameter

35
representing the “track stiffness” which was only roughly calibrated
along with the main model damping parameters.
The modeling of the loads induced at the track-wheel contact has
been widely studied for many years. One of the seminal works
regarding this issue is that of Hertz, who defined a general theory of
contact of elastic solids. This theory has been extensively applied to
the wheel-rail contact problem with some variations ([3] and [11]), and
its soundness has been widely assessed [12]. Nowadays, numerical
formulations are used in several investigations ([13] and [14]).
However, the non-linear Hertz theory developed in [3] has been
implemented in this paper due to its better fit to the analytical
formulation presented.
Analytical model
The model presented in this paper follows the same formulation
developed in [1] and [2]. The model considers a two dimensional cut
(length and depth) consisting of the track and the ground underneath.
It provides both vertical and longitudinal displacements and stresses
induced by the applied loads.
The section studied in this paper is a conventional ballasted track with
wooden sleepers, screw spikes and UIC 45 rails. This typology is
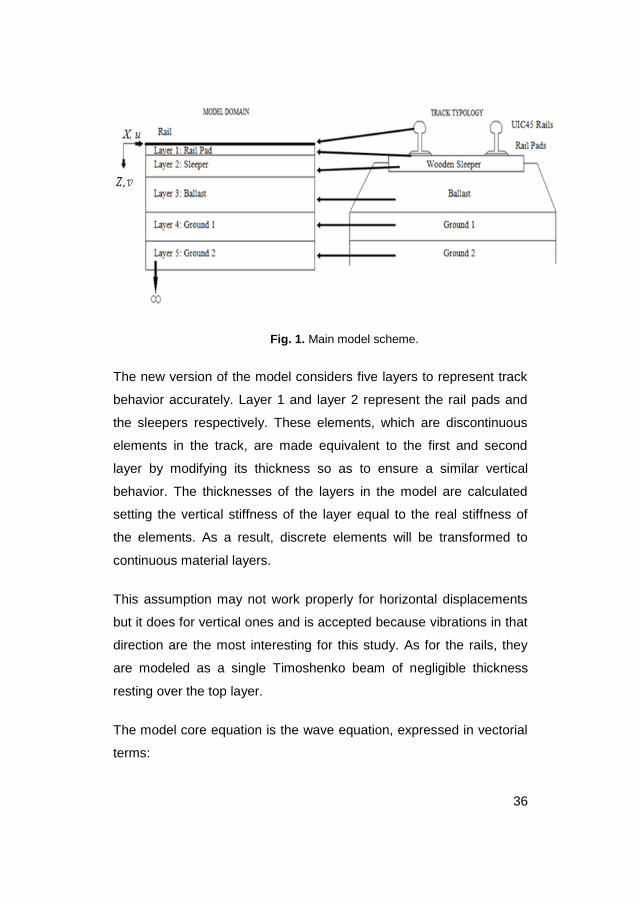
adapted to the model domain as shown in Fig. 1.
36
Fig. 1. Main model scheme.
The new version of the model considers five layers to represent track
behavior accurately. Layer 1 and layer 2 represent the rail pads and
the sleepers respectively. These elements, which are discontinuous
elements in the track, are made equivalent to the first and second
layer by modifying its thickness so as to ensure a similar vertical
behavior. The thicknesses of the layers in the model are calculated
setting the vertical stiffness of the layer equal to the real stiffness of
the elements. As a result, discrete elements will be transformed to
continuous material layers.
This assumption may not work properly for horizontal displacements
but it does for vertical ones and is accepted because vibrations in that
direction are the most interesting for this study. As for the rails, they
are modeled as a single Timoshenko beam of negligible thickness
resting over the top layer.
The model core equation is the wave equation, expressed in vectorial
terms:
37
2
22
,,,ˆ)()ˆˆ(
tzxzxzx
d dd
(1)
Where d is the displacement vector, is the density of the material
and ̂ and ̂ are operators describing the viscoelasticity of the
ground:
tˆ
tˆ
*
*
(2)
Where λ and μ are Lamé parameters and λ* and μ* are damping
coefficients which must be calibrated using experimental data.
Load modeling
The load modeling is provided in order to obtain the forces, which
applied to the model are made of a static component and some
dynamic harmonic components. The objective is to generalize the
inputs in the model. For this reason, both static and dynamic loads are
modeled using harmonic loads with different amplitudes and
frequencies:
)cos()( tPtF iii
(3)
where Pi represents the amplitude and i the harmonic load
frequency of the i-th load Fi. The static load is considered as harmonic
function with ϖ = 0 and P equal to the load applied by a single train
axle, to represent that the static load is a permanent action. Each

38
harmonic which represents dynamic loads is caused by certain rail or
wheel defect such as rail joints, rail corrugations, wear and tear, etc.
In order to obtain the different pairs of amplitude and frequency to
define the dynamic loads, an auxiliary quarter car model is used, as
defined by Melis [15]. The model layout, which represents a single
train axle, is shown in Fig. 2.
Fig. 2. Quarter car model scheme.
The equations that describe the movement of the two masses are as
follows:
0)()( 122
12
2
2
2
2
2
yyk
t
y
t
yc
t
ym (4)
0)( 112122
1
2
2
2
1
1
2
1
rzkykkyk
t
yc
t
yc
t
ym (5)
where zr is the rail vertical profile, y1 and y2 are the vertical
displacements of the unsprung and sprung masses respectively.

39
All the parameters in this quarter car model are known except for the
track equivalent spring constant k1. This parameter is calculated as
the equivalent track stiffness, taking into account the wheel-rail
contact stiffness.
groundballastsleeperrailpadrailH kkkkkkk
1111111
1
(6)
According to [3], the wheel-rail contact stiffness is due to local elastic
deformation of both elements. As the contact area (which is assumed
to be elliptical) depends on the load, this stiffness is not linear. The
contact stiffness, KH, depends on the geometry of the two bodies in
contact, i.e. the rail and wheel. Curvature radios in both the
longitudinal and transverse direction are required, as show in Fig. 3.
Fig. 3. Geometry parameters for the Hertz theory.
These variables are used to define the following effective radius of
curvature.
)1111
(2
11
0 RTRWTW RRRRR
(7)
Stiffness also depends on the material properties. Both wheel and rail
are assumed to be made of the same steel, hence defining the
following strain elastic modulus:

40
)1(
E'E
2 (8)
The angle between the planes containing RW and RR is defined as
follows:
)R
1
R
1
R
1
R
1(
2
Rcos
RTRWTW
0 (9)
Depending on the value of θ, non-dimensional parameter (ξ) is
calculated. Its value was taken from a chart in [3] for the purpose of
this paper. The reader may consult that reference for the precise
mathematical definition of the parameters.
Now it is possible to calculate the Hertzian contact stiffness:
2/30)
2(
3
'2
REK H (10)
The rest of values to calculate k1, are obtained from [16].
Then, we can solve (4) and (5) and obtain the displacements y₁ and y₂
by means of a finite differences algorithm according to [15]. The
expressions of the first and second order derivative in terms of finite
differences are:
t
yy'y t1t
(11)
t
yy2y''y
2
1tt1t
(12)
Introducing (11) and (12) in (4) and (5) and reorganizing:

41
1t1
2
2
t1
2
2
22
1t2
2
22
t2
2
2
222
1t2y
m
tcy
m
tktcy
m
tcmy
m
tktcm2y
(13)
tzm
tky
m
tcy
m
tktc
ym
tcmy
m
tkktcmy
tt
ttt
1
2
1
2
1
2
2
1
2
22
1
1
21
1
1
2
2121
1
1
11
)(2
(14)
This equation system may be solved iteratively using time increments
from initial conditions, which does not affect to the final results due to
the quick disappearance of its influence.
Once y₁ and k ₁ are known, it is possible to calculate the forces at
each point of the rail:
)zy(kFii1i
(15)
The force function defined at Eq. (15) is plotted, yielding the force
profile caused by rail defects. From this profile the main amplitudes
and frequencies are taken, considering the train velocity, and feed the
main model as different harmonic forces according to Eq. (3).
Model solution
Once the model equations and loads are defined, the following
boundary conditions must be set. The horizontal displacement is u , v
is the vertical displacement, xx
is the horizontal stress and xz
is the
vertical stress. Note that these parameters depend on x , z and t and
the sub-index number express the layer where they are defined.
According to [8], initial conditions are not required as only the
stationary solution is to be calculated:

42
0)t,0,x(u1
(16a)
)t,x(w)t,0,x(v1
(16b)
)t,h,x(u)t,h,x(u1211
(16c)
)t,h,x(v)t,h,x(v1211
(16d)
)t,h,x()t,h,x(12ZZ11ZZ
(16e)
)t,h,x()t,h,x(12XZ11XZ
(16f)
)t,hh,x(u)t,hh,x(u213212
(16g)
)t,hh,x(v)t,hh,x(v213212
(16h)
)t,hh,x()t,hh,x(213ZZ212ZZ
(16i)
)t,hh,x()t,hh,x(213XZ212XZ
(16j)
)t,hhh,x(u)t,hhh,x(u32143213
(16k)
)t,hhh,x(v)t,hhh,x(v32143213
(16l)
)t,hhh,x()t,hhh,x(3214ZZ3213ZZ
(16m)
)t,hhh,x()t,hhh,x(3214XZ3213XZ
(16n)
)t,hhhh,x(u)t,hhhh,x(u4321543214
(16o)
)t,hhhh,x(u)t,hhhh,x(u4321543214
(16p)

43
)t,hhhh,x()t,hhhh,x(43215ZZ43214ZZ
(16q)
)t,hhhh,x()t,hhhh,x(43215XZ43214XZ
(16r)
0)t,,x()t,,x()t,,x(v)t,,x(u5XZ5ZZ55
(16s)
Additionally, Eq. (1) is expressed in terms of the Lamé potentials so
that vertical and horizontal displacements and stresses are as follows:
xzv
zxu
(17)
2
2
2
22
XZ
2
2
2
2
2
2
2
ZZ
zxzx2ˆ
zxzˆ2
zxˆ
(18)
Eq.(1) can be transformed in two scalar equations applying the
Fourier Transform, as defined in Eq. (19).
txde)t,z,x(f),z,k(f~~ )kxt( di
(19)
This yields the following system of ordinary differential equations,
which is expressed in the frequency and circular wave number domain
(represented by ):
0~~Rzd
~~d
0~~Rzd
~~d
2
T2
2
2
L2
2
(20)

44
Once solved Eq. (20), the Lamé potentials in frequency-wave number
domain for each j layer can be expressed as:
zTjR
4j
zTjR
3jj
zLjR
2j
zLjR
1jj
e),k(Ae),k(A~~
e),k(Ae),k(A~~
(21)
And the displacements and stresses in terms of ),z,k( are therefore
as follows:
)e),k(Ae),k(A(R)e),k(Ae),k(A(ki),z,k(u~~zjTR
4j
zjTR
3jjT
zjLR
2j
zjLR
1jj
(22a)
)e),k(Ae),k(A(ki)e),k(Ae),k(A(R),z,k(v~~zjTR
4j
zjTR
3j
zjLR
2j
zjLR
1jjLj
(22b)
)e),k(Ae),k(A(C)e),k(Ae),k(A(C),z,k(~~ zjTR
4j
zjTR
3j2j
zjLR
2j
zjLR
1j1jjzz
(22c)
)e),k(Ae),k(A(D)e),k(Ae),k(A(D),z,k(~~ zjTR
4j
zjTR
3j2j
zjLR
2j
zjLR
1j1jjxz
(22d)
Where:
)Rk(~̂D
R~̂ki2D
R~̂ki2C
k~̂
R)~̂2~̂
(C
2
jT
2
j2j
jLj1j
jTj2j
j
2
jLjj1j
(23)
Boundary conditions in Eq. (15) can be also transformed to frequency
and wave number domains using (19). Once converted to ),k(
domain, they are taken into account to obtain an algebraic system

45
whose variables are the different Aj coefficients. After solving,
displacements and stresses for each layer are known in the frequency
domain. The last step is to apply the inverse transform to obtain those
variables in the time domain. This step is performed numerically as
explained in [2]. The resulting vertical displacement is derived twice to
obtain vertical accelerations. The resulting acceleration is shifted
accordingly to the axles’ configuration to obtain the full accelerogram
at a specific point of the model domain caused by the passing of the
whole train.
Both the main model and auxiliary quarter car model were
implemented in Mathematica® 7.0 (Wolfram Research Inc.)
Model calibration
The formulated model is now calibrated with actual data collected from
the railway track located in Solares (Cantabria, Spain). In this way,
damping coefficients for each layer (λj*, μj*) are obtained. Calibration
is carried out by the root mean square difference method between the
actual and modeled accelerations as defined by [17]. The RMSD
between the real accelerogram )(tarz and the modeled accelerogram
)(tamz is obtained as:
2
Trz
T
2
mzrz
))t(a(
))t(a)t(a(RMSD
(24)
The value of RMSD represents the mean error between the actual and
the modeled accelerations. In our calibration, the criterion to accept a
solution is a mean error of 5%.
46
Acceleration data collection
Data gathered for model calibration and validation was measured on-
site in a rather straight track stretch of the Santander-Liérganes line in
Cantabria, Spain. This line is operated by FEVE and consists on a
conventional ballasted track with UIC 45 rails and wooden sleepers.
The track gauge is 1 meter.
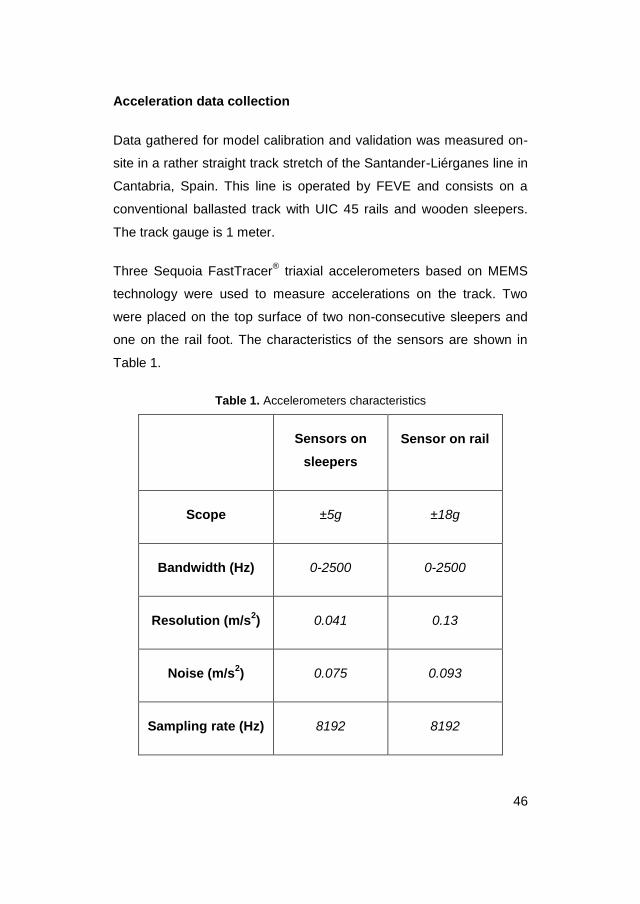
Three Sequoia FastTracer® triaxial accelerometers based on MEMS
technology were used to measure accelerations on the track. Two
were placed on the top surface of two non-consecutive sleepers and
one on the rail foot. The characteristics of the sensors are shown in
Table 1.
Table 1. Accelerometers characteristics
Sensors on
sleepers
Sensor on rail
Scope ±5g ±18g
Bandwidth (Hz) 0-2500 0-2500
Resolution (m/s2) 0.041 0.13
Noise (m/s2) 0.075 0.093
Sampling rate (Hz) 8192 8192

47
Acceleration at those three points was registered for several trains
passing through the studied section within a week. The data obtained
was exported to Mathematica® 7.0 (Wolfram Research Inc.) in order to
process and compare them with the model output for calibration and
validation.
As for the rail profile, it was measured by means of a ballast tamping
and lining machine provided by ACCISA. Measurements were carried
out at night to avoid any interruption of the train regular service. Fig. 4
shows the rail profile along a 60-meter track stretch.
Fig. 4. Measured rail profile.
The line is operated by a single vehicle class: the CAF S/3800
consisting on three carriages and six bogies. Technical data including
masses, damping and geometry was provided by FEVE. Velocity at
the monitored section was recorded by the drivers and provided
afterwards, giving a mean speed of 25 km/h.
Discussion of results
In this section the results given by the model are discussed. First of
all, Fig. 5 shows the comparison between modeled and measured

48
accelerations on the surface (i.e. over the sleeper) after calibration.
Calibrated parameters are shown in Table 2.
Table 2. Model parameters after calibration.
Parameter (Pa) Layer 1 Layer 2 Layer 3
λj* No influence
μj* 450 000 400 000 525 000
From the figure it is clear that the model gives a good approximation
of the measured accelerogram. Consecutive peaks of acceleration
due to the passing of the train axles are reproduced, and the time of
growing and decay of the signal is also similar. Therefore, calibration
criteria are met (values are shown in Table 3) and the model is
successfully calibrated.
Table 3. Calibration criteria.
Criteria Model Data Difference
Maximum peak (m/s2) 75 74 1
Absolute minimum peak (m/s2) 78 63 15

49
Growth (s) 0.5 0.9 0.4
Decay (s) 1.7 1.5 0.2
From Fig. 5 it is clear than the modeled accelerogram is much
‘cleaner’ than the measured one. This is due to the fact that
measurements include vibrations caused by several rail and wheel
defects as well as certain resonance components (e.g. the rail pad or
the fastening screws) that the model does not consider. This is
particularly clear when looking at the growing part of the
accelerogram, as the measured one takes more time of growth and
shows many small, secondary peaks not reproduced by the model.
The main reason for this difference is that only a few harmonics were
obtained from the rail profile shown in Fig. 4 (mainly those due to rail
joints) and fed to the main model, and thus there are many other
defects not considered including those of the wheels. Transient effects
are also not reproduced as the model only yields a stationary solution

50
Fig. 5. Model calibration. Model in dashed black, data in gray.
However, despite this limitation, the model reproduces the main trends
of the measured accelerogram because the response due to the
quasi-static load is dominant compared to dynamic ones for the
velocity considered (i.e. about 25 km/h). A better reproduction of the
dynamic components of the vibration wave (which would be more
important for greater velocities) only requires more comprehensive
data of the wheel and rail defects so as to feed the model with more
harmonic loads.
Another noteworthy issue is the difference of concordance between
model and data for positive and negative peaks. The model as
formulated is fairly symmetrical and yields rather similar maximum and
minimum values. The data, on the other hand, is quite asymmetrical
as there is a difference of about 10 m/s2 between peaks. It is unclear
why the measurements show such trend, and thus the model has
been calibrated to fit higher peaks despite overestimating lower ones
so as to be on the safer side.

51
Regarding the calibrated parameters, damping coefficient λj* was
found to be irrelevant when modeling vertical displacements, a result
which confirms the observation made in [2]. This parameter has
influence on horizontal displacements, but those are not considered
for the purpose of this paper because of the lack of data and the
assumed hypothesis of continuous sleepers previously described.
Damping coefficient μj*, on the other hand, has a great influence in the
model output. As the data for calibration was only measured in the
sleepers, only the first parameter μ1* is fully calibrated. However, the
other two parameters do have an impact in the vibration wave
modeled and thus are also calibrated to certain extent. This difference
from the behavior shown in [2] is due to the different track typology
studied. This ballasted track is far less rigid than the slab track studied
in the previous paper (note the damping coefficients are two orders of
magnitude lower than those obtained in [2]) and the behavior of each
layer affects the others to a greater extent.
The calibrated model was then validated with a different set of data.
The results are shown in Fig. 6 and the validation criteria are exposed
in Table 4.

52
Fig. 6. Model validation. Model in dashed black, data in gray.
Table 4. Validation criteria.
Criteria Model Data Difference
Maximum peak (m/s2) 76 72 4
Absolute minimum
peak (m/s2)
79 63 16
Growth (s) 0.6 1.5 0.9
Decay (s) 1.7 2.2 0.5

53
Once again the model overestimates negative peaks but reproduces
quite well the positive ones. This is an acceptable result as was
explained previously. The wave main traits are correctly predicted and
thus the model is properly validated.
Finally, in order to test the model performance across the entire
domain, Fig. 7a and Fig.7b shows modeled accelerations in the ballast
layer (Fig. 7a) and the ground 1 (Fig. 7b) at 0.2 and 0.5 meters of
depth respectively. When compared with the accelerogram modeled
at the surface (Fig. 5 and Fig. 6), a clear alleviation of the wave with
depth can be pointed out. Peaks of acceleration are reduced from 76
to 30 m/s2 (60%) when the wave moves from the sleeper to the ballast
and drop to 1.5 m/s2 (98%) when it reaches the ground. This behavior
shows that the model is capable of simulate vibration mitigation within
its domain and thus it can be used to study wave propagation through
different track elements.

54
Fig. 7. Modeled accelerations. 7a: at the ballast layer (Depth: 0.2 m).
7b: at the ground layer (depth: 0.5m)
Conclusions
The paper has presented and improved version of the previously
developed and reported analytical model and has applied it to a

55
conventional ballasted track in Solares, Spain. The model has been
calibrated and validated using actual data measured on site.
The five-layer model has been implemented and it has been proven to
more accurately represent the track behavior. The improvements
made regarding load modeling have proved to work properly as the
model reproduces the measured wave fairly accurately. In addition,
the inclusion of the non-linear Hertz theory provides the model a
sounder theoretical base and simplifies the calibration process by
reducing the number of parameters to be adjusted.
The model still has certain limitations that should be taken into
account. The actual phenomenon of vibration transmission through a
track infrastructure is made of several static and dynamic components
and the model is only capable of reproducing a portion of them.
Transient phenomena and resonance of singular elements such as
rail pads or fastening systems are not included in the model
formulation. Heterogeneity of the ground and ballast layer is not
considered, and singular track features cannot be studied. On the
other hand, the improved load modeling allows including virtually
every dynamic load due to wheel and rail defects providing there is
accurate data available.
This may be another limitation as accurate data is not always
available or easy to obtain. However, as the results have proven, for
the velocity considered the main features of the wave are properly
reproduced with only a few components (i.e. pairs of
frequency/amplitude) of measured rail defects. Therefore, the model
can yield a good approximation of the phenomenon even with a
reduced source of data.

56
Considering the results obtained in this paper as well as those shown
in [1] and [2], the model developed represents a useful tool to study
vibration propagation through different track infrastructures, from
conventional and high-speed ballasted tracks to urban slab tracks.
Therefore, it can be use for designers to assess the vibration
performance of new and existing tracks as well as to model the first
stage of vibration transmission within wider research projects related
to the effects of train-induced vibrations in the environment.
Acknowledgements
The authors would like to thank FEVE (Ferrocarriles Españoles de Vía
Estrecha) for their permission to measure in the Santander-Liérganes
Line and for providing their vehicle’s technical data. We wish also to
express our gratitude to ACCISA for their support during the
measurement campaign.
Appendix. Values of the parameters used in the study
Table 5. Values of the parameters used in the study.
Parameter Value
m₁ 3.445 Tn
m₂ 7.305 Tn
k₂ 47.48 kN/mm
c₂ 26000 N/m·s-1

57
railk
7.35·10⁶ kN/m
railpadk 6.56·10⁵ kN/m
sleeperk 6.5·10⁵ kN/m
ballastk 2·10⁵ kN/m
groundk 1·10⁵ kN/m
WR 0.425 m
WTR 0.6 m
RR ∞
RTR 0.305 m

58
References
[1] Salvador P., Real J., Zamorano C. and Villanueva A. A procedure
for the evaluation of vibrations induced by the passing of a train
and its application to real railway traffic. Mathematical and
Computer Modelling, Vol. 53, Issue 1-2, 2010, p. 42-54.
[2] Real J. et al. Modelling vibrations caused by tram movement on
slab track line. Mathematical and Computer Modelling, Vol. 54,
Issue 1-2, 2011, p. 280-291.
[3] Thompson D. J.Railway Noise and Vibration: Mechanisms,
Modelling and Means.Oxford (UK): Elsevier, 2009.
[4] Sheng X. et al. Prediction of ground vibration from trains using the
wavenumber finite and boundary element methods. Journal of
Sound and Vibration, Vol. 293, Issue 3-5, 2006, p. 575–586.
[5] Jones C. J. C. et al. Simulations of ground vibration from a moving
harmonic load on a railway track. Journal of Sound and Vibration,
Vol. 231, Issue 3, 2000,p. 739-751.
[6] Yang Y. B. and Hung HH. Soil vibrations caused by underground
moving trains. Journal of Geotechnical and Geoenvironmental
Engineering, Vol. 135, Issue 3, 2008, p. 455-458.
[7] Koziol P. et al. Wavelet approach to vibratory analysis of surface
due to a load moving in the layer. International Journal of Solids
and Structures, Vol. 45, Issue 7-8, 2008, p. 2140–2159.
[8] Metrikine A.V. and Vrouwenvelder ACWM. Surface ground
vibration due to a moving train in a tunnel: two-dimensional model.
Journal of Sound and Vibration, Vol. 234, Issue 1, 2000,p. 43–66.

59
[9] Auersch L. The excitation of ground vibration by rail traffic: theory
of vehicle–track–soil interaction and measurements on high-speed
lines. Journal of Sound and Vibration, Vol. 284 Issue 1-2, 2005,
p.103–132.
[10] Hertz H. Contact of Elastic Solids. Miscellaneous Papers. London
(UK): Macmillan & Co. Ltd. (1896).
[11] Otero J. Study of rail vehicle dynamics in curved tracks. Part I:
Wheel-rail contact analysis. Revista Colombiana de Tecnologías
de Avanzada, Vol. 14, Issue 2, 2009, p. 48-53.
[12] Yan W. and Fischer F. D. Applicability of the Hertz contact theory
to rail-wheel contact problems. Archive of Applied Mathematics,
Vol 70, Issue 4, 2000, p. 255-268.
[13] Kalker J. J. Three dimensional elastic bodies in rolling contact.
Dordrecht (Netherlands): Kluwer Academic 1990.
[14] Polach O. A fast wheel-rail forces calculation computer code.
Vehicle System Dynamics, Vol. 33(supplement), 1999, p. 728-
739.
[15] Melis M. Introducción a la dinámica vertical de la vía y señales
digitales en ferrocarriles. Madrid (Spain): Escuela de Ingenieros
de Caminos Canales y Puertos, 2008.
[16] López A. Infraestructuras ferroviarias. Barcelona: Cenit, 2006.
[17] Arslan Y. Z. et al. Prediction of externally applied forces to human
hands using frequency content of surface EMG signals. Computer
Methods and Programs in Biomedicine, Vol. 98, Issue 1, 2010,
p.36-44.

60
61
CHAPTER 2
STUDY OF WAVE BARRIERS DESIGN FOR THE
MITIGATION OF RAILWAY GROUND VIBRATIONS
J. I. Real, A. Galisteo, T. Real, C. Zamorano
Vibroengineering. Journal of Vibroengineering, March 2012.
Volume14, Issue 1. ISSN 1392-8716

62

63
Abstract.
Nowadays, the consolidation of the rail in high populated areas has
become a reality. Foundations, buildings, high accurate devices and
people are susceptible to suffer from vibrations induced by running
trains. Therefore, models for predicting ground vibration are required
in order determine new mitigation measures. Rectangular open or in-
filled trenches are a suitable solution to be used near constructed
railway lines. Their installation is fast, easy and economic since no
intrusion in the track is needed. In this work, the influence of the
trench design in its effectiveness is analyzed considering a train
moving with subsonic speed. A finite element model of the track has
been developed and validated with real data registered along the tram
network in Alicante (Spain). The analysis is carried out in the time
domain considering the quasi-static movement of the vehicles. The
results demonstrate that, in ascending order, the most relevant
parameters in a trench are its width, depth and in-filled material or
trench typology. However, it is also concluded that other conditions
such as the stratification of soil are essential in order to determine an
optimal design of a wave barrier.
Keywords: ground vibration; finite element method; isolation;
reflection; wave barrier.
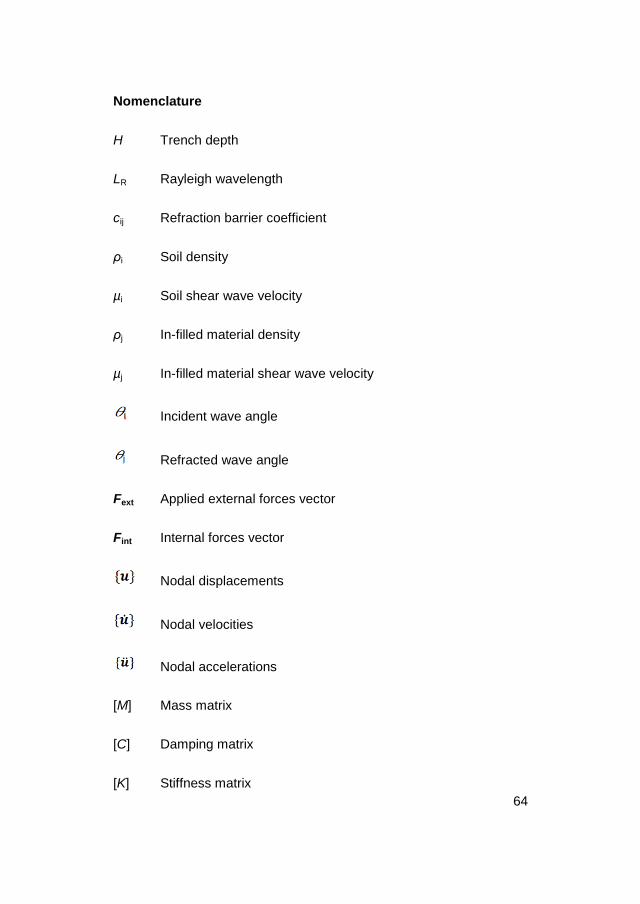
64
Nomenclature
H Trench depth
LR Rayleigh wavelength
cij Refraction barrier coefficient
ρi Soil density
µi Soil shear wave velocity
ρj In-filled material density
µj In-filled material shear wave velocity
Incident wave angle
Refracted wave angle
Fext Applied external forces vector
Fint Internal forces vector
Nodal displacements
Nodal velocities
Nodal accelerations
[M] Mass matrix
[C] Damping matrix
[K] Stiffness matrix
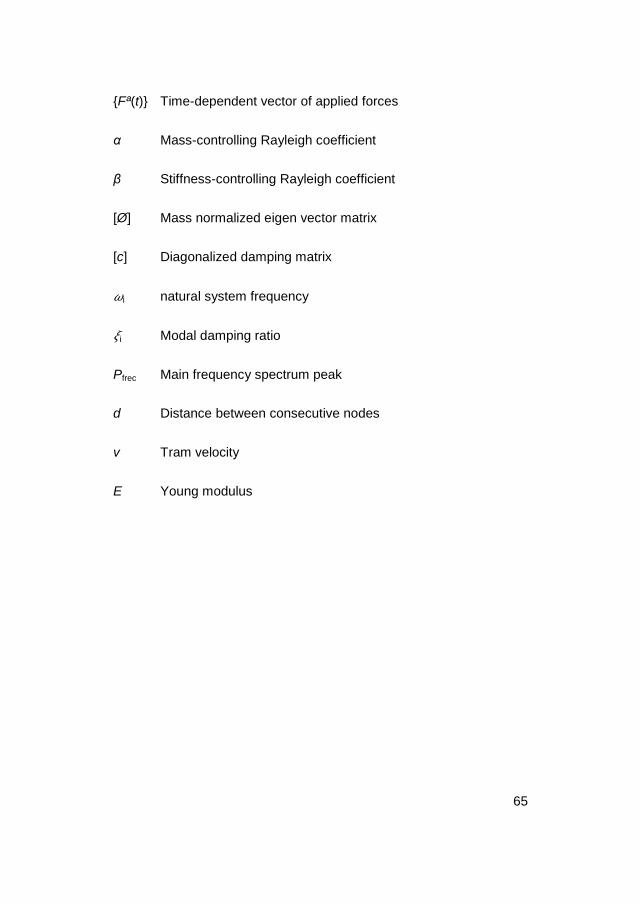
65
{Fª(t)} Time-dependent vector of applied forces
α Mass-controlling Rayleigh coefficient
β Stiffness-controlling Rayleigh coefficient
[Ø] Mass normalized eigen vector matrix
[c] Diagonalized damping matrix
i natural system frequency
i Modal damping ratio
Pfrec Main frequency spectrum peak
d Distance between consecutive nodes
v Tram velocity
E Young modulus
66
1. Introduction
In the last decades of scientific railway research, the necessity of
establishing a methodology to calculate and control traffic-induced
ground vibration has grown up.
On the one hand, the increase in the standard of living in society has
prompted the requirement of high quality transportation services.
Therefore, a more accurate study of railway internalities and
externalities has to be performed.
On the other hand, it is well known that ground vibrations from
railways may produce problems in nearby foundations and as a
consequence, the stability of buildings and people health can be
affected. To prevent these problems, trenches and buried walls, as a
type of mitigation measure, may provide an important reduction of
vibration amplitude after their location. Although this mitigation
measure is still in research process, it is a highly recommended
solution because of its characteristics. Firstly, its construction does not
present any complexity. And secondly, its onsite installation is very
economic because for an existing railway line it is not needed to
modify its structure.
in this paper, two main objectives have been achieved. The first goal
was to create a model based on the finite element methodology for
the prediction of ground vibration propagation. This model has been
calibrated and validated with real measurements taken along the tram
network of Alicante (Spain). The second effort was to apply this
methodology to study the influence of some hypothetical designs of
open and in-filled trenches located in the same soil where the above
measurements were taken.

67
In order to create this model, the most relevant publications on the
subject have been reviewed. The first models to predict the ground
vibration level produced by the railway appeared during the decade of
the 70s. In [1] and [2], the dissipation mechanisms of vibrations that
have to be taken into account to perform an accurate model were
discussed. Some years later, [3] and [4] focused their work on the
urban railways. The first one completed an analytical study of the
vibrations induced by the metropolitan trains in nearby tunnel
structures. Later, [4] presented a methodology to obtain the amplitude
of vibration considering all the subsystems which take part in the
phenomenon: generation-transmission-reception.
Nowadays, in the study of railway induced-ground vibrations two main
tendencies are acknowledged, namely, the analytical and the
numerical one. In contrast to the numerical methodology, the
analytical one provides a continuous solution in all the domains in
which the problem is studied. Some of the analytical researches that
may be cited include works such as [5] and [6]. However, these
analytical studies have an important limitation since their solution is
only possible for simple geometries and idealized conditions. Hence, it
is essential to use numerical models in order to predict the ground
vibration propagation from railways and to investigate new measures
for attenuating the vibration [7]. Therefore, the Finite Element method
(FEM) has been the methodology selected in this paper. Several
authors have also chosen this method in order to study railway
vibrations. [8] studied with the FEM the dynamic response of an
embedded rail track reaching that vibrations increase with the load
speed. In 2009, [9] construted a two-dimensional FE model to study
how the wave propagation was influenced by buried walls. However, a
2D model cannot take into account the wave propagation and
geometrical and material dissipation in the longitudinal direction of the

68
railway. That is why, in this paper, a 3D model has been proposed. In
contrast, FEM presents a basic disadvantage for reproducing the
wave propagation phenomenon. This method pretends to represent a
semi-infinite soil by a finite size model. In consequence, several
authors use non-reflecting boundaries in order to prevent this problem
[10-13]. However, it ends up being a complicated remedy which is
sometimes applicable only when the layered soil is supported on a
rigid bedrock base [14]. In this paper, the radiation condition has been
achieved by dimensioning the model so that the biggest required
Rayleigh wavelength can be developed in all directions (section 2).
Related to the second scope of the paper, the reduction of the ground
vibration amplitude due to the influence of active trenches has been
studied. Specifically, the most important parameters on a trench
design have been taken into account in the analysis, i.e., width, depth
and in-filled material or trench typology.
This kind of vibration dissipation measures have been studied for
more than 40 years. Firstly, [15] and [16] carried out some field works.
They both reached similar conclusions: the reduction of ground
vibration is possible only when the depth of the trench is comparable
to the Rayleigh wavelength. Moreover, [16] revealed that a 75% of
amplitude reduction is possible when the quotient H/LR is higher than
0.6 for active isolation and for a homogeneous soil, where H denotes
the depth and LR the Rayleigh wavelength. In addition, later theoretical
researches such as [14] and [17] agreed with the idea that the most
relevant geometrical parameter on the effectiveness of a trench is its
normalized depth. Consequently, it is well known that for a
homogeneous soil, the isolation of ground vibration by trenches is
effective only for medium and high frequency vibrations, so it can be
thought that for a homogeneous soil and low wavelengths, trenches

69
could not be very effective. However, from that, several authors such
as [14], [16] and [18] suggest that it would be necessary to study the
influence of barriers in a layered ground since it is expected to find a
greater effect than in a homogenous soil. The soil in the study site of
this paper is a layered one. In section 4, the interaction among this
fact and the depth of the trench is analyzed. Moreover, there is not a
great agreement by the main works on the influence of the trench
width. Some authors such as [11] and [19] found this parameter to be
significant on the trench effectiveness while [12], [16] and [20]
reached the opposite conclusion. In order to come to a clear idea, the
trench width is also studied in this paper.
Related to the in-filled trench material, the mitigation phenomenon is
produced by the impedance discontinuity in the propagation medium
since arriving waves are refracted and reflected. In accordance with
[21], the refraction coefficient for a determined in-filled trench is
defined as follows:
(1)
where ρi and µi are, respectively, the density and the velocity of the
elastic shear waves for the soil and ρj and µj are the same parameters
for the in-filled trench material. In addition, i and j are, respectively,
the incident and refracted wave angle. From that, the denser and the
stiffer the in-filled material is, the bigger reflection coefficient the
trench will have, obtaining a better effective isolation. All this is related
to the reflection mechanism, but theoretically, the absorption
mechanism could also make the amplitude of vibration reduce in soil

70
after the trench. In section 4, the influence of the in-filled material
density and stiffness over trench effectiveness will be analyzed by
proposing concrete and polyurethane as in-filled materials. However,
in spite of everything, it is well known that, ideally, an open trench will
always be better than an in-filled trench since no waves are
transmitted at a solid to void interface. This fact has also been studied
in the next analysis as two open trench typologies have been
proposed: an open trench and a sheet piling trench.
2. Development of the 3D FE model
In this section, a description of the methodology followed in the
development of the FE model is presented.
As it will be seen below, a three-dimensional finite element method
has been used for the study of the induced-train ground vibration
waves in the time domain. The geometry and material characteristics
of the track and soil elements have been taken from a specific point of
the tram network of Alicante where the real data were measured.
Consequently, the analysis of barriers presented in section 4 will be
applicable in the future.
With this methodology, both quasi-static and dynamic mechanisms of
train vibration generation can be implemented. However, when
creating the model no dynamic components have been taken into
account until the calibration and validation process.
2.1 Rayleigh damping theory
For the FEM analysis, the software ANSYS LAUNCHER has been
used. In order to resolve the numerical dynamic problem, a global

71
mass matrix [M], damping matrix [C] and stiffness matrix [K] are
generated. Then, the equilibrium is proposed by equation (2):
(2)
where Fext and Fint are, respectively, the applied forces and the
internal forces vector. Therefore, based on the values of the state
fields (displacements , velocities , and accelerations ), internal
forces are calculated resolving numerically the equation of motion (3):
(3)
being {Fª(t)} the external applied forces vector which is time-
dependent.
Although the generation of mass and stiffness matrices is performed
directly from the system properties, Rayleigh damping theory is
considered so as to generate the damping matrix. According to this
theory, [C] can be denoted by (4):
(4)
in which α and β are the so-called Rayleigh coefficients which are
required for the dynamic analysis and have a global influence in the
phenomenon.
By orthogonal transformation, equation (4) is modified as (5):

72
(5)
being [Ø] the normalized eigenvector mass matrix of the system, [c] is
the diagonalized damping matrix and i is the i-natural modal
frequency of the system.
From analogy to single-degree-of-freedom systems, it is known that:
(6)
where i is the modal damping ratio. Then, matching (5) and (6),
equation (7) is obtained:
(7)
and this reduces to (8):
(8)
A hypothetical plot of equation (8), considering typical values of α and
β coefficients is shown in figure 1.

73
Fig. 1. Graphical representation of expression (8).
, i ; , mass component
; , stiffness component
As can be seen, the modal damping ratio is non-linear frequency-
dependent. Moreover, both mass and stiffness components have
been plotted. In this way, it can be observed that the mass
component, dominated by coefficient α, is only notable for a frequency
range from 0 to 6 rad/sec. In contrast, the stiffness component,
dominated by coefficient β, is always notable and proportional to the
natural frequency of the system. In a large number of civil problems,
the natural frequency values of a system are located in the lineal tract
of the expression because of the large structures stiffness, see
equation (8). Therefore, in these cases it can be assumed that the
mass component is not influential in the phenomenon and expression
(8) can be written as (9):
(9)
Clearing the β coefficient from (9), it can be obtained by equation (10):

74
(10)
As an exception, it can be considered the case of a system where a
harmonic force or a set of harmonic forces are applied. For the
determination of damping Rayleigh properties, i is to be supposed as
the most dominant harmonic force frequency since the system is
going to vibrate in accordance with this time-dependent action.
2.2 Modeling the railway cross section
Regarding the railway structure modeling, a simplified reproduction of
the elements has been determined. Considered actions are vertical,
i.e. train weight and hypothetical induced dynamic actions from wheel
and rail defects. Consequently, mechanical properties and geometry
are modified so that inertia and vertical rigidity are equal to the real
ones. A cross section of the studied track is shown in figure 2.
Fig. 2. Cross section of the railway provided by GTP (Management Entity of
Transport Network and Ports of the Generalitat)
As can be observed, the studied structure is a slab track with
embedded Phoenix rails and three different concrete layers, i.e.
reinforced, mass and lean ones. Rails have been modeled as a
rectangle which has the same width as the real foot rail but different
height so that the horizontal axle inertia is the same as the real one.

75
Rail pad thickness has been increased since its actual dimension is
too small compared to the other elements. In consequence, Young’s
modulus has been modified so that the element has the same vertical
rigidity as in reality. The same geometry as shown in figure 2 has
been modeled for the concrete elements. From geotechnical tests it is
known that the soil is formed by a 2 meters thick sand layer supported
on a calcarenite bedrock base. However, the sand elastic parameters
are still unknown. Material characteristics are summarized in table 1.
Table 1. Material properties
Material E (Pa) ρ (kg/m3)
Rail 2.1e11
0.30 7830
Rail pad 2.67e7
0.48 900
Reinforced
concrete 2.72e10
0.25 2400
Mass concrete 2.25e10
0.20 2300
Lean concrete 2.25e10
0.20 2300
Cable ditch 1.13e10 0.20 2300
Sand unknown unknown unknown
Calcarenite 4.6e9
0.26 1830
2.3 Defining the entire FE model

76
In order to perform a thorough analysis, wave propagation criterion
has to be respected. Hence, no artificial boundaries have to interfere
on the vibration transmission by creating wrong reflecting and
refracting effects. It has been decided to study a frequency range from
2 to 50 Hz, which includes large part of the frequency interval relevant
to the whole body perception. Since ground surface vibration is
studied, Rayleigh waves are to be considered in the assumptions.
Consequently, for calculating the transversal and longitudinal
dimension of the model, the largest Rayleigh wavelength at the lower
considered frequency has to fit on the model in all directions.
Considering the elastic vibration theory, this wavelength corresponds
to approximately 50 m. Similarly, the length of the elements is
determined so that 6 nodes are present per wavelength of the
Rayleigh waves at the higher frequency [22]. In this way, the length of
elements is up to 0.5 m.
The vehicle self-weight is applied to the rail as a punctual force.
However, the force magnitude has been modified depending on its
position since the vertical rigidity of the modeled track is lower near
the frontiers. Consequently, track deflections under a unitary force
have been analyzed as can be seen in figure 3. In this way, the train
weight has been pondered so that the vertical deflection keeps
constant along the full movement.

77
Fig. 3 Study of vertical track displacements under a unitary force
Surface soil accelerations are obtained in a track transversal line
located in the half of the model, i.e. as far as possible of the beginning
and ending model boundaries, see figure 4.
Fig. 4. Rail vertical acceleration

78
Attending to figure 4, the three different vehicle bogies can be
distinguished as three maximum accelerations are registered. In
addition, three principal peaks in acceleration spectrums have been
recognized: bogies and wheels quasi-static frequencies, which are not
too dominant, and the main frequency spectrum peak, i.e. Pfrec =
16.67 Hz, which is induced by discretized progress of the load since
the distance between nodes is d=0.5 m and the considered train
velocity is v=30 km/h:
(11)
To conclude the modeling, different comparisons between initial and
simplified model results have been performed and the half part of the
structure has been removed since it does not involve any modification
on results. This fact has provided a relevant structure simplification
since the mesh has become much more economic in terms of
computational time.
2.4 Sensibility analysis
It is necessary to establish which parameters that take part in the
process are influential in the results and which of them are not. This
analysis provides help when carrying out future settings and results
comparisons with collected real data, i.e. calibration and validation
processes. However, there are some known parameters whose
sensibility analysis would not make sense since their magnitude is
already established. Unknown parameters are the global β Rayleigh
coefficient and the elastic sand properties.

79
In figure 5, the influence of Young modulus on accelerations results
for a point located 1.20 m far from the rail is indicated. As can be
observed, this parameter is quite influential since vibration amplitude
decreases for higher values of it. Regarding the β Rayleigh coefficient,
its effect on the dynamic response is provided in figure 6. It is
determined that the higher the β coefficient is, the more attenuated the
soil response is since the acceleration amplitude and the time-
response after peak are lower. This fact can be explained from
equations (9) and (10) as the modal damping ratio is proportional to
the β Raileigh coefficient. Moreover, in order to propose some
appropriate values of coefficient β for the sensibility analysis, equation
(10) has been used. Other sand elastic parameters such as the
Poisson’s ratio and density have been found not to be so much
influential on the results.
Fig. 5. Acceleration response in a point located 1.20 m far from the rail for
different sand Young’s modulus values (E). a, E1=1.7·107
Pa; b, E2=7·107 Pa;
c, E3=12.3·107 Pa; d, E4=17.5·10
7 Pa

80
Fig. 6. Schematic acceleration response in a point located 1,20 m far from the
rail for different β Rayleigh coefficient. , β1=0.0001; , β3=0.001;
, β4=0.01
Thus, the only two parameters which have been chosen to take part in
the calibration and validation processes are the Young’s Modulus and
the β Rayleigh coefficient.
3. Calibration and validation
Once the model has been developed, it has been calibrated and
validated from the measurements registered on Line 4 of the Alicante
tram network. The measurements were taken when the vehicle
passed by using some FiberSensingTM tri-axial accelerometers. The
data was recorded in two points located 0.3 and 1.20 m far from the
rail and only data gathered from trains which speed was
approximately 30 km/h have been considered. Hence, the effect of
velocity has not taken part in the analysis. The average of all
registered accelerations has been obtained and used for doing the

81
comparison since the variability of results has been checked to be
acceptable.
As deduced in section 2, the only two parameters considered in the
calibration and validation process are those which are influential in
results and yet unknown. The rest of the parameters have been
provided by GTP or obtained from simple calculus. Both unknown
parameters have been calibrated by comparing the model results with
data gathered 0.3 m from the rail. The dynamic component has been
taken into account by increasing model accelerations in a 33% [23]
as, since this point, only quasi-static generation mechanism had been
considered.
The calibration process has been rigorously performed by
comparing the following criteria between real data and model results:
Value of the maximum and minimum acceleration peaks.
Time the signal takes to grow to the first peak.
Attenuation time from the last peak.
After that, it has been achieved to validate the model with the suitable
chosen parameters by making another comparison. It has been
checked that model results accurately fit with real data collected 1.20
m from the rail. The resulting parameters from the calibration process
are listed in Table 2.

82
Table 2. Resulting parameter values from calibration process
Parameter Calibrated value
β Rayleigh coefficient 0.001
Sand Young modulus 70 MPa
The validation process allows the model to study the effectiveness of
barriers on wave transmission isolation for the analyzed soil.
4. Study of barriers influence in wave soil propagation
in the present analysis, the main influential parameters in a wave
barrier design are studied. According to the reviewed literature, it is
well known that factors such as the trench geometry, i.e. depth and
width and the in-filled material may have a determined effect on the
trench effectiveness. However, this effect has not been entirely
established for a layered soil yet, but it is thought that trench
effectiveness may be modified. As has been seen, the analyzed
railway track is over a stratified soil so the layering effect has been
analyzed. The characteristics of the soil materials are shown in Table
3.
Table 3. Soil material mechanical characteristics
Material Thickness (m) E (MPa) ρ (kg/m3)
Upper layer Sand 2 70 0.3 1800
Substratum Calcarenite indefinite 4600 0.26 1830

83
A quasi-static load is applied along the rail at a constant velocity of 30
km/h. The acceleration amplitude after different proposed active
trenches is computed. Thus, the influence of trenches characteristics
is studied.
4.1 Influence of trench width
According to [24], the isolation improvement of a wave barrier is only
appreciable for a width below a quarter of the Rayleigh wavelength. In
this model, the main propagation frequency is 16.67 Hz and the
Rayleigh wave velocity for the upper layer is about 106 m/s. From
that, a quarter of the main wavelength is up to 1.6 m which is not a
reasonable dimension for a trench. Hence, widths below this value are
studied.
For the present analysis, the effectiveness of three open trenches has
been compared. The following widths for each one of them have been
considered: 0.45 m, 0.6 m and 0.75 m which are common backhoe
bucket sizes and sensible dimensions to be used in urban areas. The
trenches depth has always been kept constant and equal to 1.5 m so
the calcarenite substratum has not been penetrated. Figure 7 shows
the vertical acceleration response in a node located 1.3 m from the
trench for each considered width.
Since the main wavelength in the model is lower than the quarter
Rayleigh wavelength, the vibration isolation after the open trench
grows as the width is larger, which agrees with [24]. However, this
dynamic reduction is not so relevant considering that the vibration
amplitude for each studied solution has the same order of magnitude.
From that, it can be concluded that the slight alteration produced by
the increase of the studied parameter cannot justify the choice of the
barrier width in the design process. There are some more important

84
design criteria such as the availability of urban space or the
construction budget.
4.2 Influence of trench depth and typology in a layered soil
The previous analysis suggests that a practical solution should be
chosen in order to establish the trench width as no dynamic criteria is
to be considered. Hence, in this section, a width of 0.45 m is selected
for the study. The following trench depths and typologies are
considered:
1 m depth, which is the shorter trench studied.
1.5 m depth, which base is 0.5 m from the calcarenite layer
surface.
2 m depth, which base is in contact with the calcarenite layer
surface.
2.5 m depth, which penetrates the calcarenite layer 0.5 m.
In-filled concrete barrier, see Table 4.
In-filled polyurethane barrier, which is a relatively soft material, see
table 4.
Open trench.
Sheet piling trench.

85
Fig. 7. Schematic acceleration response in a node located 1.3 m far from the
trench.
, 0.45 m width; , 0.6 m width; , 0.75 m width
Table 4. In-filled material characteristics and in-filled trenches refraction
coefficient
E (MPa) ρ (kg/m3) cij
Concrete 30000 0.25
2400 0.08
Polyurethane 20 0.45
500 1.58
The influence of depth in the isolation vibration is computed in terms
of acceleration registered in the soil after the trench. This analysis is
firstly made for each trench typology separately. The results are
computed in figures 8, 9, 10 and 11.
-0.06
-0.04
-0.02
0
0.02
0.04
0.06
0 1 2 3 4 5 6 7 8 9
Acc
eler
ati
on
, m
/s2
Time, s

86
Fig. 8. Schematic acceleration response in a node located 2 m far from an in-
filled concrete trench.
, 0.5 m deep; , 1 m deep; , 1.5 m deep; , 2 m
deep
Generally, with the exception of the polyurethane trench, it can be
said that an increase of the trench depth induces better vibration
isolation only for depths within the sand layer thickness. As can be
seen, both depths 1.5 m and 2 m produce the same effect. So,
according to this model, a penetration in the bedrock base is not
necessary since no remarkable improvements have been registered
and in general, the optimum depth will be considered the sand layer
thickness. In contrast, according to figure 11, the maximum vibration
reduction for a sheet piling trench is given by the 1.5 m depth trench
so this would make possible to save 0.5 meters of sand excavation.
-0.25
-0.2
-0.15
-0.1
-0.05
0
0.05
0.1
0.15
0.2
0.25
0 1 2 3 4 5 6 7 8 9
Acc
eler
ati
on
, m
/s2
Time, s

87
Fig. 9. Schematic acceleration response in a node located 2 m far from an in-
filled polyurethane trench.
, 0.5 m deep; , 1 m deep; , 1.5 m deep; , 2 m
deep
Fig. 10. Schematic acceleration response in a node located 2 m far from an
open trench.
, 0.5 m deep; , 1 m deep; , 1.5 m deep; , 2 m
deep
-0.2
-0.15
-0.1
-0.05
0
0.05
0.1
0.15
0.2
0.25
0 1 2 3 4 5 6 7 8 9
Acc
eler
ati
on
, m
/s2
Time, s
-0.15
-0.1
-0.05
0
0.05
0.1
0.15
0 1 2 3 4 5 6 7 8 9
Acc
eler
ati
on
, m
/s2
Time, s
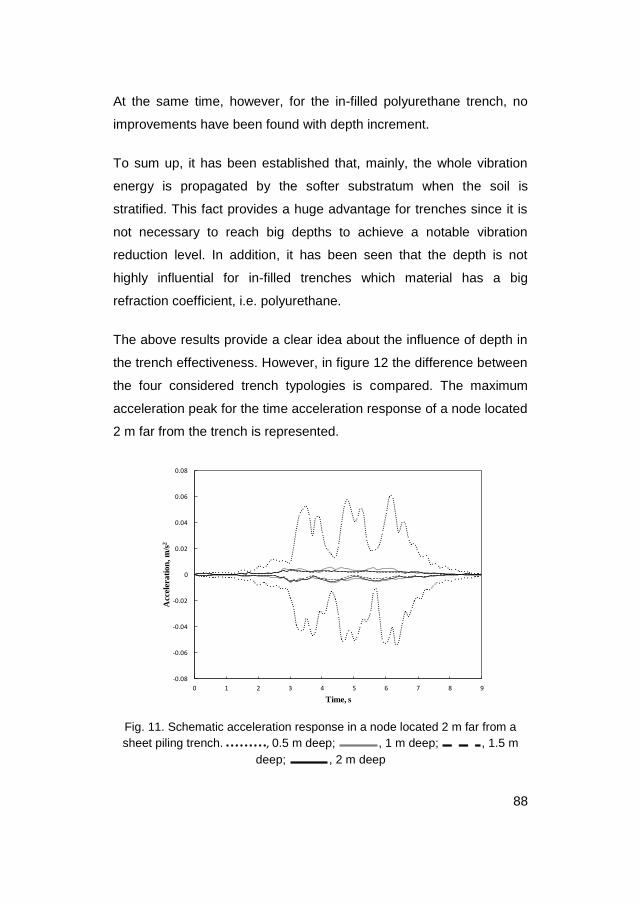
88
At the same time, however, for the in-filled polyurethane trench, no
improvements have been found with depth increment.
To sum up, it has been established that, mainly, the whole vibration
energy is propagated by the softer substratum when the soil is
stratified. This fact provides a huge advantage for trenches since it is
not necessary to reach big depths to achieve a notable vibration
reduction level. In addition, it has been seen that the depth is not
highly influential for in-filled trenches which material has a big
refraction coefficient, i.e. polyurethane.
The above results provide a clear idea about the influence of depth in
the trench effectiveness. However, in figure 12 the difference between
the four considered trench typologies is compared. The maximum
acceleration peak for the time acceleration response of a node located
2 m far from the trench is represented.
Fig. 11. Schematic acceleration response in a node located 2 m far from a
sheet piling trench. , 0.5 m deep; , 1 m deep; , 1.5 m
deep; , 2 m deep
-0.08
-0.06
-0.04
-0.02
0
0.02
0.04
0.06
0.08
0 1 2 3 4 5 6 7 8 9
Acc
eler
ati
on
, m
/s2
Time, s

89
Fig. 12. Maximum acceleration peaks on a node located 2 m far from the
trench.
, no trench located; X, polyurethane in-filled trench; , concrete in-
filled trench; , open trench; , sheet piling trench
Results in figure 12 imply the following:
Generally speaking, all the considered trenches have achieved
some kind of vibration reduction level since all of them provide a
mechanical discontinuity in the soil. Additionally, in every case
vibration reduction keeps constant for depths above the sand
thickness.
Void trenches are the better ones since for every depth their
vibration reduction is higher than for the in-filled barriers.
Between void trenches, the most effective ones are those which
vertical walls are held up by a sheet pile because it is a more
stable structure. However, for a depth equal to the sand layer
thickness the vibration reduction provided by both of them is
0
0.03
0.06
0.09
0.12
0.15
0.18
0.21
0.24
0.27
1 1.5 2 2.5
Ma
xim
um
acc
eler
ati
on
pea
k, m
/s2
Trench depth, m
BEDROCKBASESAND LAYER

90
almost the same. Moreover, as mentioned before, for trench
depths bigger than 1.5 m the isolation level of the sheet piling
trench keeps constant.
Since its refraction coefficient is smaller (see Table 4), a concrete
in-filled trench is much more efficient than a polyurethane one. In
contrast, for low depths, their effectiveness is similar. In fact, the
concrete in-filled trenches isolation level has resulted to be very
sensitive to depth.
From these ideas, two main conclusions have been reached:
It has been clarified that void trenches are more effective than in-
filled ones. It has been seen that for a depth equal to the sand
layer thickness, the reduction level for both of them is similar.
However, the sheet piling trench presents a better structural
stability and a depth of 1.5 meters may be a suitable solution for
the problem.
It has been confirmed that the refraction coefficient is highly
influent in the effectiveness of an in-filled trench. However, from
figure 12 the next situations can be considered:
If cij < 1, i.e. the material trench is stiffer than soil. Vibration
reduction is achieved and a big reduction is provided if the
coefficient is near zero.
If cij > 1, i.e. the material trench is softer than soil. Vibration
reduction is also given but not so much as in the previous
situation since in the present case reflection phenomenon
does not occur.
If cij = 1, no vibration reduction is given since no discontinuity
is located in the soil structure.
From that, it is well known that the best materials to be used for in-
filled trenches are the stiffer ones as concrete is. In contrast, short
91
concrete in-filled trenches have to be disposable. Their reduction
level is similar to the polyurethane one which has the same
magnitude order as the reference situation. With that, a 2 meters
deep concrete in-filled trench may also be a suitable solution for
the analyzed cross section since it provides an adequate vibration
reduction and it has a very stable structure.
5. Conclusions
A finite element model for the prediction of railway ground vibration
has been developed and validated with real data. For the analysis, the
Rayleigh damping approach has been adopted. Wave transmission
condition has been respected and the results are valid for a frequency
range from 2 to 50 Hz. The modeled track has been subjected to
quasi-static load and applied for the analysis of different
configurations of wave soil barriers. From the presented results, the
following conclusions can be drawn:
Regarding the characteristics of a wave barrier and in ascending
order of their influence on its effectiveness, the parameters which
have been studied are: width, depth and barrier typology.
The increase of the barrier width within sensible values for urban
areas does not affect excessively the vibration isolation provided
by a trench. In consequence, non dynamic but practical design
criteria have been proposed to choose the trench width in this
paper.
An increase of the trench depth for a layered soil indicates clear
improvement of the isolation effect of the trench. Moreover, the
optimum depth which provides the maximum isolation is given
when the trench base is in contact with the surface bedrock base.

92
No more depth is needed since the trench effectiveness will not
increase.
Dense and stiff materials are the most suitable ones to be used for
an in-filled trench since their function is based on the reflection of
the surface Rayleigh waves.
Open trenches are more effective than in-filled ones. A sheet piling
trench avoids suffering from instability problems which an open
trench may have. Moreover, it has been found that a sheet piling
trench does not need to reach the bedrock base to achieve the
maximum vibration isolation.
Acknowledgements
The authors would like to thank GTP for their permission to carry out
measurements along the tram network of Alicante (Spain) and for
providing the track cross sections. They would also like to thank the
Spanish Ministry of Science and Innovation for their support given to
the TRAVIESA project.
References
[1] Gutowski T. G., Dym C. L. Propagation of ground vibration: A
review. Journal of Sound and Vibration, Vol. 49, Issue 2, 1967, p.
179-193.
[2] Verhas H. P. Prediction of the propagation of train-induced
ground vibration. Journal of Sound and Vibration, Vol. 66, Issue 3,
1979, p. 371-376.
[3] Kurweil L. Ground-borne noise and vibration from underground
rail systems. Journal of Sound and Vibration, Vol. 66, Issue 3,
1979, p. 363-370.

93
[4] Melke J. Noise and vibration from underground railway lines:
Proposals for a prediction procedure. Journal of Sound and
Vibration, Vol. 120, Issue 2, 1988, p. 391-404.
[5] Metrikine A. V., Vrouwenvelder A. C. W. M. Surface ground
vibration due to a moving train in a tunnel: two-dimensional
model. Journal of Sound and Vibration, Vol. 234, Issue 1, 2000, p.
43-66.
[6] Koziol P., Mares C., Esat I. Wavelet approach to vibratory
analysis of surface due to a load moving in the layer. International
Journal of Solids and Structures, Vol. 45, Issue 7-8, 2008, p.
2140-2159.
[7] Sheng X., Jones C. J. C., Petyt M. Ground vibration generated by
a harmonic load acting on a railway track. Journal of Sound and
Vibration, Vol. 225, Issue 1, 1999, p. 3-28.
[8] Zou J. H., Feng W. X., Jiang H. B. Dynamic response of an
embedded railway track subjected to a moving load. Journal of
Vibroengineering, Vol. 13, Issue 3, 2011, p. 544-551.
[9] Cirianni F., Leonardi G., Scopelliti F. Study of the barriers for the
mitigation of railway vibrations. The Sixteenth International
Congress on Sound and Vibration, Kraków, 5-9 July 2009.
[10] Wass G. Linear two-dimensional analysis of soil dynamic
problems in semi-infinite layered media. Ph. D. Thesis, University
of California, Berkeley, 1972.
[11] Haupt W. A. Behaviour of Surface Waves in In-Homogeneous
Half-Space with Special Consideration of Wave Isolation. Ph. D.
Thesis, University of Karlsruhe, Karlsruhe, 1978.
[12] Segol G., Lee P. C. Y., Abel J. F. Amplitude reduction of surface-
waves by trenches. Journal of the Engineering Mechanics
Division-ASCE, vol. 104, Issue 3, p. 621-641, 1978.

94
[13] May T. W., Bolt B. A. The effectiveness of trenches in reducing
seismic motion. Earthquake Engineering & Structural Dynamics,
Vol. 10, Issue 2, 1982, p. 195-210.
[14] Beskos D. E., Dasgupta B., Vardoulakis I. G. Vibration isolation
using open or filled trenches. Computational mechanics, Vol. 7,
Issue 2, 1989, p. 137-148.
[15] Barkan D. D. Dynamics of Bases and Foundations. New York:
McGraw-Hill, 1962.
[16] Richart F. E., Hall J. R., Woods R. D. Vibration of Soils and
Foundations. Englewood Cliffs: Prentice Hall, 1970.
[17] Ahmad S., Al-Hussaini T. M. Simplified design for vibration
screening by open and in-filled trenches. Journal of Geotechnical
Engineering-ASCE, Vol. 117, Issue 1, 1991, p. 67-88.
[18] Thompson D. Railway Noise and Vibration. Oxford: Elsevier,
2009.
[19] Fuyuki M., Matsumoto Y. Finite difference analysis of Rayleigh
wave scattering at a trench. Bulletin of the Seismological Society
of America, Vol. 70, Issue 6, 1980, p. 2051-2069.
[20] Woods R. D. Screening of Elastic Surface Waves by Trenches.
Ph. D. Thesis, University of Michigan, Michigan, 1967.
[21] Graff K. F. Wave Motion in Elastic Solids. Oxford: Dover, 1991.
[22] Andersen L., Jones C. J. C. Three-dimensional elastodynamic
analysis using multiple boundary element domains. ISVR
Technical Memorandum, University of Southampton, 2001.
[23] Anacleto S. Modelización de la Interacción Vía-Tranvía. M. Sc.
Thesis, Universitat Politècnica de Catalunya, Barcelona, 2009.
[24] Andersen L., Nielsen S. R. K. Reduction of ground vibration by
means of barriers or soil improvement along a railway track. Soil
Dynamics and Earthquake Engineering, Vol. 25, Issue 7-10,
2005, p. 701-716.

95
CHAPTER 3
STUDY OF RAILWAY GROUND VIBRATIONS CAUSED BY
RAIL CORRUGATION AND WHEEL FLAT
J. I. Real, A. Galisteo, T. Asensio, L. Montalbán
Vibroengineering. Journal of Vibroengineering, December 2012.
Volume14, Issue 4. ISSN 1392-8716

96

97
Abstract
Over the last few years, railway has reached high relevance in cities
causing trouble to citizens in form of noise and vibration in the
surrounding buildings. Furthermore, these vibrations reach higher
values when wheel-rail contact defects appear. The influence that two
vibration sources derived from the wheel-rail contact have in their
proximity is analyzed in this paper, particularly the defects of rail
corrugation and wheel flats. Both defects are examined using the 3D
finite element model discussed in a previous paper. The model has
been developed and validated with real data and considers a train
moving at subsonic speed. The analysis is carried out in the time
domain, considering both the quasi-static and dynamic loads and
applying dynamic loads to simulate the aforementioned defects.
Conclusions are drawn based on the geometric characteristics of the
imperfections. Thus, the results of this paper show that, concerning to
the wheel flat, an important increase of acceleration peaks near the
railway track is observed. Regarding corrugation, it is concluded that
the lower corrugation wavelength, the higher vibration amplitude is
reached. This work presents a validated method to relate wheel-rail
defects to railway vibrations. It may be very useful in identifying the
origin of vibrations and to determine which element needs
maintenance works.
Keywords: ground vibration, railway track, corrugation, flat wheel,
wavelength.

98
1. Introduction
Ground vibration from railway traffic is generated either by the static
axle loads moving along the track or by the dynamic forces which
arise in the presence of harmonic or non-harmonic wheel and rail
irregularities. The most important frequency range of ground vibration
considering human exposure is approximately 5-80 Hz. The excitation
by the so called quasi-static axle loads primarily leads to low
frequency vibrations. The frequency content of the dynamic excitation
is determined by the speed of the vehicle and the wavelength content
of the irregularities exciting the wheel-rail contact patch. On a given
location, the vibration amplitudes are strongly influenced by the
properties of the ground and hence the vibration problem must be
seen as an interaction between vehicle, track and ground.
The importance of wheel and rail imperfections is clear when
considering the dynamic excitation of ground-borne vibration. In
presence of wheel and rail imperfections, the nominal contact forces
are disturbed and a dynamic component is introduced into the
excitation. In case the contact surface contains a discontinuity, e.g. a
wheel flat or rail corrugation, the dynamic excitation is an impulse
excitation. The dynamic excitation excites all propagating modes in
the ground within the frequency range of the excitation.
Both wheel flat and rail corrugation defects result in an impact
excitation on the rail which tends to grow with the size and/or depth of
the discontinuity. In references [2-4], measured impact loads excited
by wheel flats and long wavelength defects are presented. The results
show that load increases with the length of the flatness and the depth
of the periodic defect. Furthermore, influence of speed is understood
clearly for periodic defects where higher speeds lead to higher forces.

99
However, regarding wheel flats, the speed dependence seems to be
more complicated and varies for flats of different size. In [5] measured
and simulated contact forces caused by a 100 mm long flatness show
that the speed dependence varies with the axle load and the
maximum contact force is excited in the 25-50 km/h speed range. The
contact force excited by a long (0.5 m) local defect, on the other hand,
shows a simpler speed dependence with a more or less linearly
increasing contact load with increasing speed. The more complicated
behaviour of the contact force generated by a wheel flat is caused by
the potential loss of contact between wheel and rail, which is
governed by the size and depth of the flat, the speed and the axle
load [6, 7].
Previous studies on wheel-rail contact forces and the influence of
wheel and rail defects have primarily focused on damage on rails and
wheels and noise. When estimating the influence on ground vibration,
the frequency content of the excitation needs to be known and
compared with the track and ground response.
2. 3D FE model
A three-dimensional finite element model (FEM) has been developed
for the study of ground vibrations caused by wheel-rail defects. The
resulting model is based on the geometry and material characteristics
of a specific railroad stretch of the tram network in Alicante (Spain),
where real data for calibration and validation were measured and
registered.
The FEM analysis was performed using ANSYS LAUNCHER software
and Rayleigh Damping Theory was considered [1]. Since studied
static loads are originated by trains self-weight and dynamic loads
from wheel-rail defects, only vertical actions were considered.
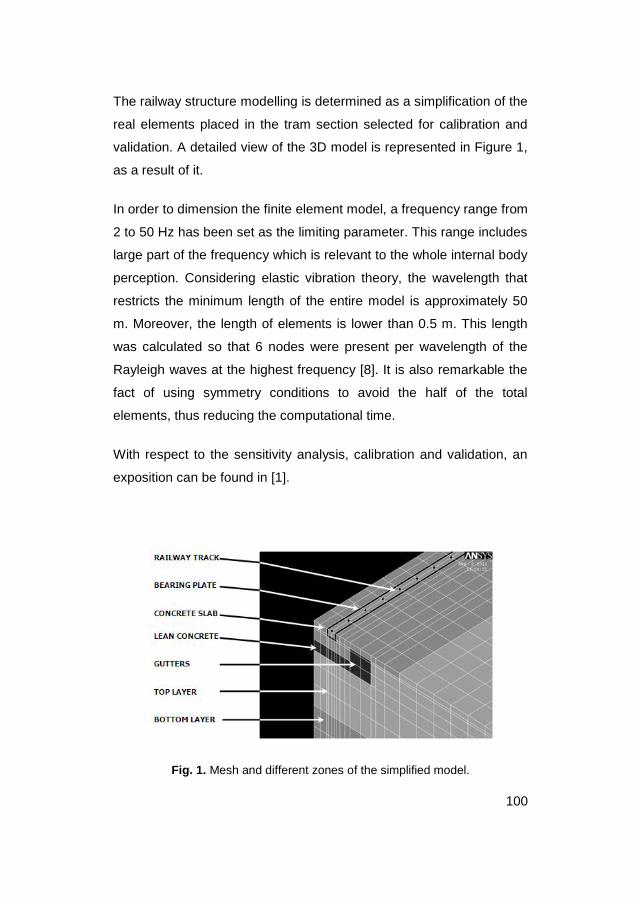
100
The railway structure modelling is determined as a simplification of the
real elements placed in the tram section selected for calibration and
validation. A detailed view of the 3D model is represented in Figure 1,
as a result of it.
In order to dimension the finite element model, a frequency range from
2 to 50 Hz has been set as the limiting parameter. This range includes
large part of the frequency which is relevant to the whole internal body
perception. Considering elastic vibration theory, the wavelength that
restricts the minimum length of the entire model is approximately 50
m. Moreover, the length of elements is lower than 0.5 m. This length
was calculated so that 6 nodes were present per wavelength of the
Rayleigh waves at the highest frequency [8]. It is also remarkable the
fact of using symmetry conditions to avoid the half of the total
elements, thus reducing the computational time.
With respect to the sensitivity analysis, calibration and validation, an
exposition can be found in [1].
Fig. 1. Mesh and different zones of the simplified model.

101
3. Wheel flat modelling
3.1. Theoretical approach
One of the discrete defects which affects to railway wheels is the
presence of wheel flats phenomenon. A wheel flat has its origin in
high loads due to wheel-rail contact. These loads are continuously
varying their module and position through the wheel path in curves,
acceleration and braking zones or local railway track defects. These
circumstances result in a modification of the wheel shape, often
resulting in wheel flats, which cause an important increase over the
static track loads.
As explained in [9], contact loads reach their maximum at speeds
about 20-30 km/h, decreasing at higher speeds up to 100 km/h.
Wheel flats are an important vibration source whose dynamic effects
are transmitted far away from the source, since they are a low
frequency excitation. In their transmission they cause new problems
activating vibration frequencies in the railway track and the soil and
producing resonance effects if the new vibration modes match with
some characteristic vibration mode of the railway system. The wheel
flat frequency depends on the wheel shape and the train speed, as
follows in equation (1):
r
vf
pr
2
(1)
where v is the train speed and r is the wheel radius.

102
The wheel movement is assumed to be as shown in Figure 2. The
wheel initially rolls around the first corner that contacts the rail, and
then the second corner hits the rail, producing overloads.
Fig. 2. Flat wheel movement.
Another significant parameter is the residence time tR, which
represents the time interval between the appearance of the first corner
contact and the wheel flat impact. It is calculated according to
equation (2).
v
dtR (2)
where d is the horizontal wheel flat length.
3.2. Estimation of impact strength
Schramm formulation was used to solve the problem, determining the
extra dynamic load produced by a wheel flat, commonly used in
conventional railway track design. This dynamic overload has the
expression shown in equation (3).

103
W
fQ1.115766 (3)
where Q is the load per wheel in N (Q = 45.000 N), f is the flat wheel
depth in mm (a common value is f = 2 mm), and W is the resisting
moment of the rail in cm3
(W = 438.22 cm3). Applying to equation (2)
the aforementioned parameters, a dynamic overload of
810·956.1 Pa was be obtained.
In order to obtain the transmitted force by the wheel flat, it is
necessary to estimate the wheel-rail contact area. It was achieved
using the Hertzian contact model, which considers the contact region
as a rectangle, calculated as follows.
The transversal size is directly 2b=13 mm.
The longitudinal size is calculated using equation (4):
bE
Qra
252.1·22
(4)
where E is the wheel Young’s modulus, in this case 710·1.2E Pa. It
results in a longitudinal dimension of 310·56.92 a m.
Hence, the contact area is given by equation (5):
243.12·2 baS cm2 (5)
Finally, the total transmitted force per wheel due to the wheel flat is
shown in equation (6):
24309 SF N (6)
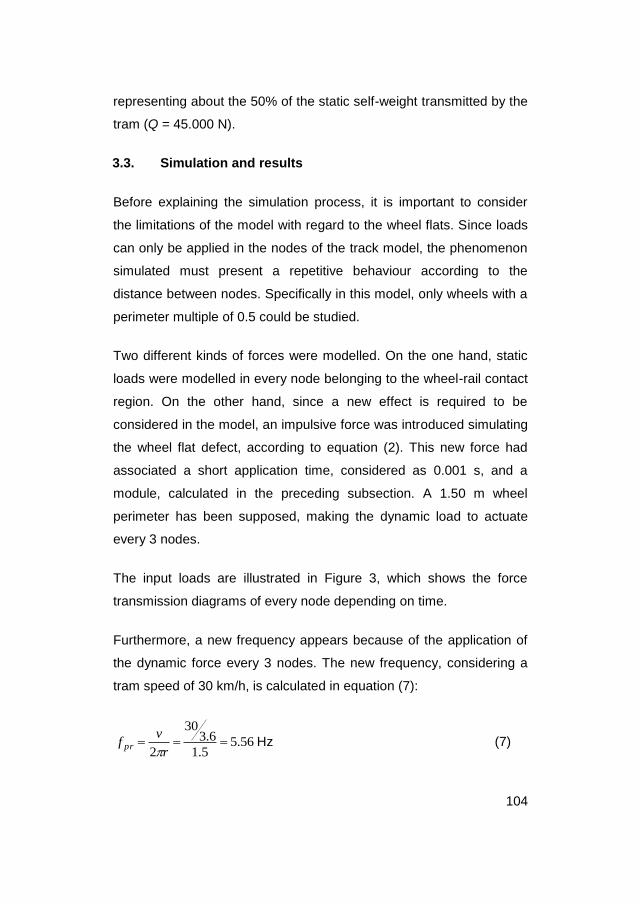
104
representing about the 50% of the static self-weight transmitted by the
tram (Q = 45.000 N).
3.3. Simulation and results
Before explaining the simulation process, it is important to consider
the limitations of the model with regard to the wheel flats. Since loads
can only be applied in the nodes of the track model, the phenomenon
simulated must present a repetitive behaviour according to the
distance between nodes. Specifically in this model, only wheels with a
perimeter multiple of 0.5 could be studied.
Two different kinds of forces were modelled. On the one hand, static
loads were modelled in every node belonging to the wheel-rail contact
region. On the other hand, since a new effect is required to be
considered in the model, an impulsive force was introduced simulating
the wheel flat defect, according to equation (2). This new force had
associated a short application time, considered as 0.001 s, and a
module, calculated in the preceding subsection. A 1.50 m wheel
perimeter has been supposed, making the dynamic load to actuate
every 3 nodes.
The input loads are illustrated in Figure 3, which shows the force
transmission diagrams of every node depending on time.
Furthermore, a new frequency appears because of the application of
the dynamic force every 3 nodes. The new frequency, considering a
tram speed of 30 km/h, is calculated in equation (7):
56.55.1
6.330
2
r
vf pr
Hz (7)
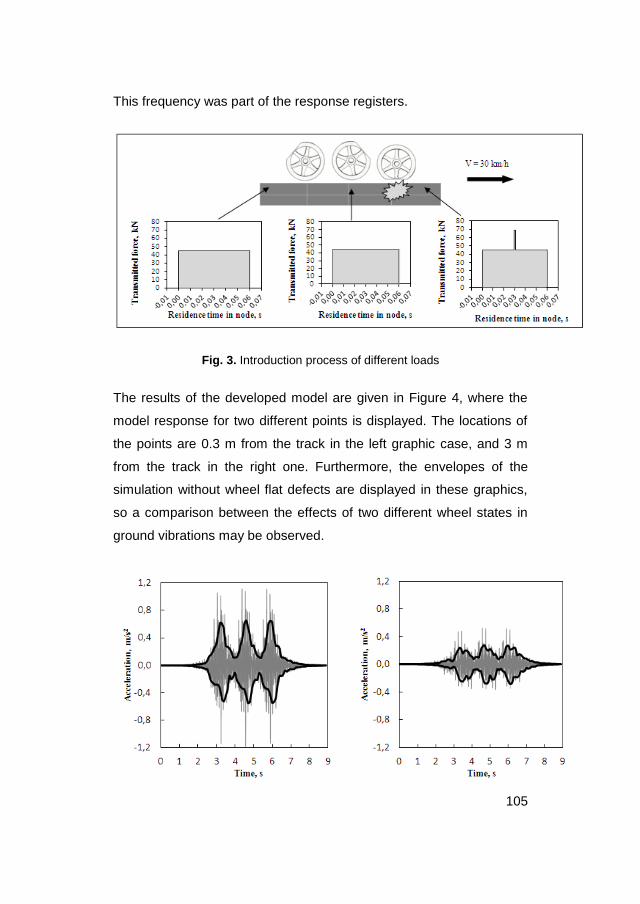
105
This frequency was part of the response registers.
Fig. 3. Introduction process of different loads
The results of the developed model are given in Figure 4, where the
model response for two different points is displayed. The locations of
the points are 0.3 m from the track in the left graphic case, and 3 m
from the track in the right one. Furthermore, the envelopes of the
simulation without wheel flat defects are displayed in these graphics,
so a comparison between the effects of two different wheel states in
ground vibrations may be observed.

106
Fig. 4. Accelerations at 0.30 m (left) and 3m (right) from the railway track for
different wheel states: Wheel flats (gray), wheel without defects (envelope black).
As can be noticed, wheel flats cause an increase in the magnitude
response. Furthermore, the attenuation of the ground vibration as the
distance from the track increases may be observed.
4. Railway corrugation modelling
4.1. Theoretical approach
Corrugation is a pathology which affects the top of the rail. It is visually
identifiable and maintains a relatively constant wave geometry. The
wavelength of rail corrugation varies from 25 mm to 1500 mm, but not
all the wave lengths can be simulated by the proposed model. Since
every wavelength has to be simulated at least by two consecutive
nodes, the minimum wavelength Lm which can be simulated by the
model is:
dLm 2 (8)
where d is the distance between two consecutive rail nodes.
The model was used to calculate two wavelengths: 1 m and 0.5 m,
thus obeying the frequency precision requirement in 2-50 Hz range.
The residence time tR must be also calculated according to equation
(2).
4.2. Dynamic overloads calculation
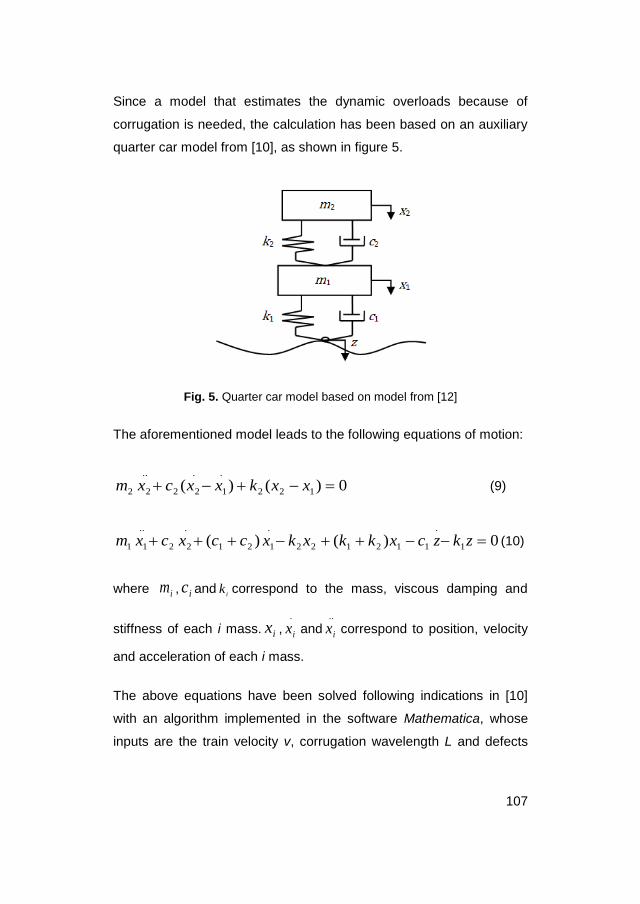
107
Since a model that estimates the dynamic overloads because of
corrugation is needed, the calculation has been based on an auxiliary
quarter car model from [10], as shown in figure 5.
Fig. 5. Quarter car model based on model from [12]
The aforementioned model leads to the following equations of motion:
0)()( 122
.
1
.
22
..
22 xxkxxcxm (9)
0)()( 1
.
112122
.
121
.
22
..
11 zkzcxkkxkxccxcxm (10)
where im , ic andi
k correspond to the mass, viscous damping and
stiffness of each i mass. ix ,.
ix and..
ix correspond to position, velocity
and acceleration of each i mass.
The above equations have been solved following indications in [10]
with an algorithm implemented in the software Mathematica, whose
inputs are the train velocity v, corrugation wavelength L and defects

108
amplitude A. In this way, the railway track is defined as a sinusoidal
function.
The values of the parameters used in the model equations are given
in table 1. They correspond to a tram configuration with a concrete
mounted track.
Table 1. Parameters for characterization of system mass and vehicle damping
m1 (kg) k1 (N/m) c1 (N·s/m)
500 32000000 0
m2 (kg) k2 (N/m) c2 (N·s/m)
4000 501745 875
Depending on its corrugation wavelength, two different cases have
been analyzed. Their input parameters and dynamic responses are
shown in tables 2-3 and figures 6-7.
Case 1: 0.5 m element size L=2·0.5=1 m
Case 2: 0.25 m element size L=2·0.25=0.5 m
Table 2. Input parameters for case 1
solving
Table 3. Input parameters for case 2
solving
v (km/h) L (m) A (m)
30 1 0.0005
v (km/h) L (m) A (m)
30 0.5 0.0005

109
Fig. 6. Transmitted force to the track by a wheel in a track with corrugation
defect of 1 m wavelength and 5·10-4
m amplitude.
Fig. 7. Transmitted force to the track by a wheel in a track with corrugation
defect of 0.5 m wavelength and 5·10-4
m amplitude.
4.3. Simulation and results
In the present simulation two simultaneous loads were considered:
dynamic loads due to imperfections, which are sinusoidal with a
varying wavelength depending on the corrugation and an estimated
magnitude of 16 kN, and static loads due to the tram self-weight,
which are constant and equal to 45 kN. The superposition of both
types of loads is illustrated in figure 8.
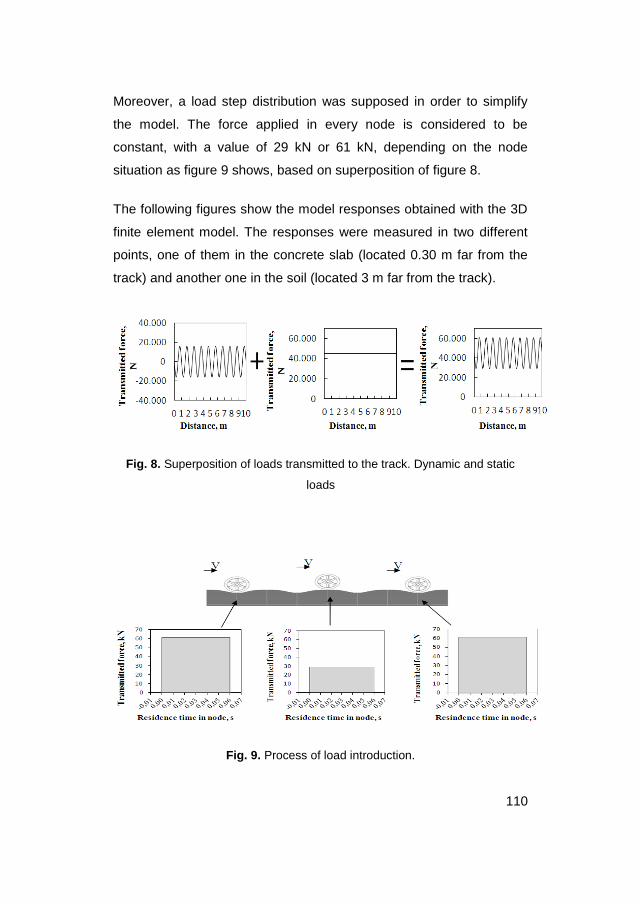
110
Moreover, a load step distribution was supposed in order to simplify
the model. The force applied in every node is considered to be
constant, with a value of 29 kN or 61 kN, depending on the node
situation as figure 9 shows, based on superposition of figure 8.
The following figures show the model responses obtained with the 3D
finite element model. The responses were measured in two different
points, one of them in the concrete slab (located 0.30 m far from the
track) and another one in the soil (located 3 m far from the track).
Fig. 8. Superposition of loads transmitted to the track. Dynamic and static
loads
Fig. 9. Process of load introduction.
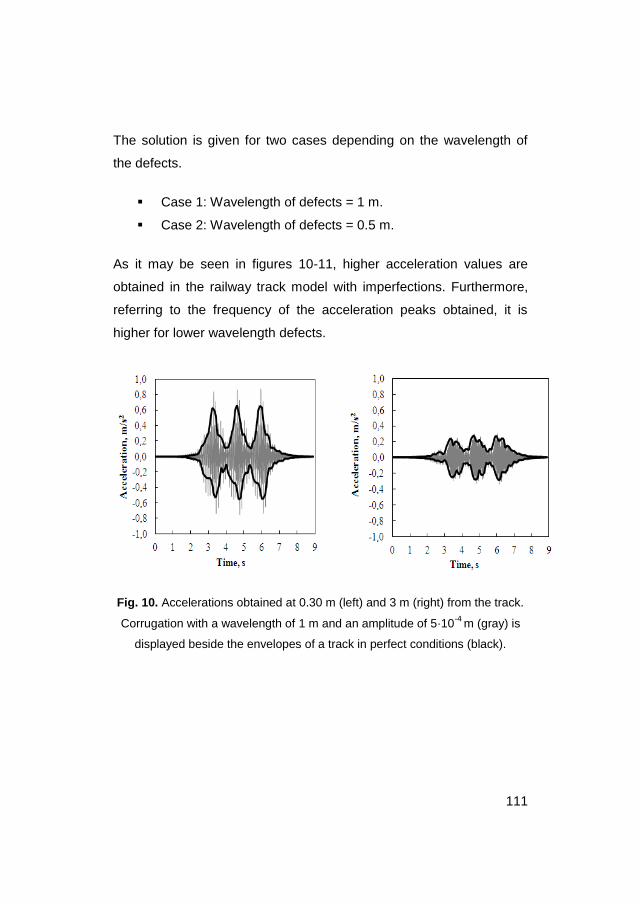
111
The solution is given for two cases depending on the wavelength of
the defects.
Case 1: Wavelength of defects = 1 m.
Case 2: Wavelength of defects = 0.5 m.
As it may be seen in figures 10-11, higher acceleration values are
obtained in the railway track model with imperfections. Furthermore,
referring to the frequency of the acceleration peaks obtained, it is
higher for lower wavelength defects.
Fig. 10. Accelerations obtained at 0.30 m (left) and 3 m (right) from the track.
Corrugation with a wavelength of 1 m and an amplitude of 5·10-4
m (gray) is
displayed beside the envelopes of a track in perfect conditions (black).
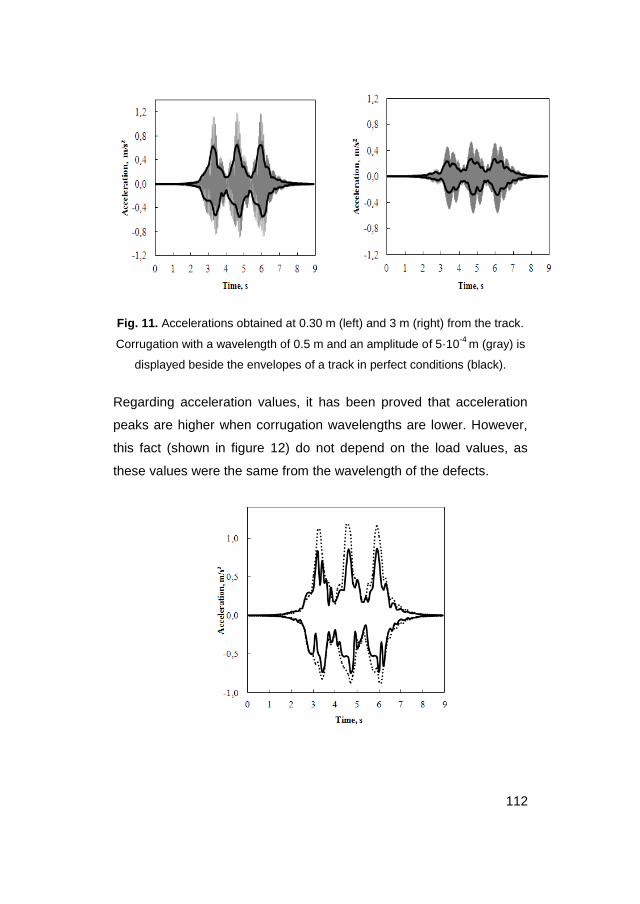
112
Fig. 11. Accelerations obtained at 0.30 m (left) and 3 m (right) from the track.
Corrugation with a wavelength of 0.5 m and an amplitude of 5·10-4
m (gray) is
displayed beside the envelopes of a track in perfect conditions (black).
Regarding acceleration values, it has been proved that acceleration
peaks are higher when corrugation wavelengths are lower. However,
this fact (shown in figure 12) do not depend on the load values, as
these values were the same from the wavelength of the defects.

113
Fig. 12. Acceleration envelopes obtained at 0.3 m from the track for different
wavelengths. Wavelength defect = 1 m (continuous line), wavelength
defect=0.5 m (dashed line).
5. Conclusions
Wheel flats and rail corrugation have been analyzed with the
developed finite element model. The results are valid for a frequency
range from 2 to 50 Hz. The model considers static loads belonging to
the train mass and different dynamics loads produced by both
phenomena. From the analysis of the results, the following
conclusions can be drawn:
1. The effect caused by wheel flats in railway ground vibrations
has been evaluated using Schramm formulation. These
defects produce an important increase in the magnitude
response, producing high acceleration peaks when the flat
wheel impacts on the rail.
2. The effect of rail corrugation in railway vibrations has been
taken into account using a quarter car model. The frequency
of the acceleration peaks becomes higher when the
wavelength of corrugation decreases, since the acceleration
peaks are closer.
3. In terms of magnitude, acceleration peaks in a corrugated
railway are higher when corrugation wavelengths are lower. It
could also be said that the acceleration peak increases with
the track frequency of acceleration peaks.

114
References
[1] J. I. Real, A. Galisteo, T. Real, C. Zamorano. Study of wave barriers
design for the mitigation of railway ground vibrations. Journal of
Vibroengineering, Vol. 14, Issue 1, 2012, p. 408-422.
[2] M. Heckle et al. Structure‐borne Sound and Vibration from Rail
Traffic. Journal of Sound and Vibration, Vol. 193, Issue 1, 1996, p.
175-184.
[3] X. Sheng, C.J.C. Jones, D.J. Thompson. A comparison of a
theoretical model for quasi‐statically and dynamically induced
environmental vibration from trains with measurements. Journal of
Sound and Vibration, Vol. 267, Issue 3, 2003, p. 621-635.
[4] L. Auersch. The excitation of ground vibration by rail traffic: theory of
vehicle‐track‐soil interaction and measurements on high‐speed lines.
Journal of Sound and Vibration, Vol. 284, Issue 1-2, 2005, p. 103‐132.
[5] Johansson. Out‐of‐Round Railway Wheels. Assessment of Wheel
Tread Irregularities in Train Traffic. Journal of Sound and Vibration,
Vol. 293, Issues 3-5, 2006, p.795-806.
[6] J.C.O. Nielsen, A Igeland. Vertical dynamic interaction between train
and track. Influence of wheel and track imperfections. Journal of
Sound and Vibration, Vol.187, Issue 5, 1995, p. 825‐839.
[7] A. Johansson, J.C.O. Nielsen. Out‐of‐round railway wheels –
wheel‐rail contact forces and track response derived from field tests
and numerical simulations. Journal of Rail and Rapid Transit, Vol. 217,
Issue 2, 2003, p. 135-146.
[8] Andersen L., Jones C. J. C. Three-Dimensional Elastodynamic
Analysis Using Multiple Boundary Element Domains. ISVR Technical
Memorandum, University of Southampton, 2001.
[9] Hirano, M. (1972). Theoretical Analysis of Variation of Wheel Load.
Railway Technical Research Institute Quarterly Reports, Vol. 13, Issue
1, 1972, p. 42-44.

115
[10] M. Melis. Introduction to vertical dynamics of railway tracks and to
digital signals in trains. School of Civil Engineering, Madrid, Spain,
2008.

116

117
GENERAL DISCUSSION

118

119
Discussion is divided in three points.
In the first point, devoted to the analytical modeling of the
phenomenon of generation-transmission of vibration (which
corresponds to the discussion in Chapter 1 of this Thesis), aspects
related to the state of the art linked to the definition of the model are
addressed. Additionally, the studied section and its modeling are
presented; the governing equations of the phenomenon (equation of
Timoshenko beam and vector wave equation) are introduced;
boundary conditions are described; load implementation process
developed in this chapter is extended and, finally, the resolution of the
problem and the calibration and validation processes of the results
using real data measured on track are presented.
The second point, devoted to the numerical modeling analysis of the
phenomenon, is structured into two sub-points: the first one discusses
the creation process of the numerical model (which would be
comparable to what has been described in the analytical model, but
deepening in specific aspects of the finite element method). The
second one (with the model already developed, calibrated and
validated), shows the simulations performed. In this regard, both
extraordinary phenomena of vibrations generation caused by specific
pathologies of the wheel or the rail as well as the mitigation effect of
wave barriers in the propagation of railway vibrations are studied. The
discussion included in this second point is applied to the cases
studied in chapters 2 and 3 of the Thesis.
Finally, in a third point, reflections related to the main contributions of
this PhD Thesis are stated. Moreover, the current and future work
lines that are being followed by the workgroup, to which the author of
this Thesis belongs, are presented.
Analytical Modelling of the Phenomenon.
In chapter 1 of the present work, the analytical study of the
phenomenon of vibration generation and its transmission across the
track is addressed.
This publication is the result of a research line whose first result was
the paper “A procedure for the evaluation of vibrations induced by the
passing of a train and its application to real railway traffic” (2010)

120
developed in a track section located in the high-speed line Madrid-
Barcelona (KP 452+062). It is a ballasted track with international track
width and UIC-60 rail mounted on monoblock concrete sleepers AI-99.
The elastomeric railpad stiffness is 100 kN/mm and its thickness is
7mm. The railway superstructure rests on a subballast layer on the top
of the embankment.
In 2011 the published paper “Modelling vibrations caused by tram
movement on slab track line” worked on a track tram section of the
line 1 of the TRAM network of Alicante. In this case, the studied
section configuration was a concrete slab with Phoenix 37N rail
embedded in dropped elastomer Edilon.
Finally, regarding to the work presented in chapter 1 of this Thesis, a
metric track section located in Santander-Liérganes line of the extinct
FEVE (whose infrastructure was integrated into ADIF’s network in
2013) is used. Specifically, the studied section is located in the Orejo-
Liérganes stretch, at the Solares station, 20 Km away from Santander.
It is a metric-width ballasted track, with wooden sleepers and UIC-45
rail. The track has rigid fasteners, metal railpads and approximately
has expansion joints every 36 m. Ballast layer rests directly on the
foundation, without subballast intermediate layer.
Note that this investigation line is developed in very different
scenarios. While the first case introduces a last generation track, in
the second case a tram track is chosen. The tram track is more
difficult to model and has been less studied but it has great
importance given by the impact of the vibration as railway externality
in urban environments. In the third case, an “old scenario” is chosen
with a track in worse conditions (but not less important) because it
represents the actual situation of lots of different tracks in Spain and
all over the world.
When the section of study is chosen, it is necessary to model this
reality to establish the governing equations of the generation and
transmission phenomena of railway vibrations.
In chapter 1 of this Thesis as well as in previous publications, a
bidimensional model is chosen in the vertical plane along the
longitudinal track direction. This 2D domain is in which the different
model equations are implemented. Regarding this simplification, the

121
different elements comprising the track structure have been modelled
with a determined number of horizontal layers. In all models, the
deepest layer is considered of infinite thickness and is modeled as a
Boussinesq half-space. Hence, the bottom constraints have no
influence in the model results. With the adopted coordinate system is
not feasible to establish a 3D model. It would be possible if the
equations in a cylindrical coordinate system were used, and it would
permit the application to other type of infrastructure (e.g. a tunnel of
circular cross section). In this case it could be possible to
simultaneously study the three phenomena involved in the problem:
generation-transmission and propagation of vibrations.
The importance of this publication in the compendium of this PhD
Thesis is to stand out the little achievements that can be obtained with
the analytical modeling. These achievements have been collected in
the three publications listed in the preceding paragraphs and have
justified its publication, following the same methodological approach.
Regarding the number of the layers of the model, the evolution along
time and investigation advances play an important role. The studied
section in the publication “A procedure for the evaluation of vibrations
induced by the passing of a train and its application to real railway
traffic” is modeled using two layers. The first one represents the track
constituted of rail, rail pads, sleepers and ballast layer, with the same
thickness as the ballast layer; while the second one accounts for the
underlying terrain to the previous elements. This model is highly
limited as consequence of the importance of considering all the track
elements as a whole, being impossible to discern the vibration level in
each one of the track elements.
The section studied and published in “Modelling vibrations caused by
tram movement on slab track line” is modeled with three different
layers. In this case, since it is a tram section, special attention has
been paid to the model that represents the embedded rail into the slab
together with the elastomeric material. In this manner, the first layer
corresponds to the concrete slab; the second one is made of the
same concrete as the first one but including the rail and the
elastomeric element and the third one represents a lower strength
concrete which rests on a lean concrete layer.

122
Although this publication provides a higher level of detail which is
reached by incorporating more layers in the domain, there are still
limitations. For example, the rail and elastomer have the same
vibration level, which does not happen in reality.
In the publication of chapter 1 of this Thesis a more exhaustive model
is performed. In figure 2 of this chapter, the layers to which the domain
has been reduced are shown and its typology as well.
Note that in this case it is achieved to divide the domain into 5
different layers. The rail is located on the top of all of them. The first
layer represents the railpads and the second one represents the
wooden sleeper behavior. Now it is important to point out the fact that
both elements are discrete elements and it has been necessary to
transform the thickness of these layers to equate the vertical behavior
of those elements to reality. The third layer corresponds to the ballast
and the fourth one represents the first ground stratus, which is limited
at the bottom by a second stratus of infinite thickness.
As can be easily observed, in chapter 1, the level of detail is higher
than in previous publications. Obviously, this fact involves a major
mathematical complexity but is able to determine the vibration level of
the most important elements in the structure, differentiating between
rail, railpad and sleepers.
Hitherto, the discussion has been focused on how to simplify the
chosen domain. Then, the modeling of the rail is addressed. This point
is especially important because it is on the rail where the vibration
generation takes place.
Both Metrikine (2000) and Koziol (2008) decided to model the rail as
an Euler-Bernouilli beam. One of the variations introduced in chapter 1
of this Thesis and in previous publications is the use of the beam of
Timoshenko to model the rail. The main advantage of Timoshenko is
that considers deformations caused by shear stresses, which can be
important in secondary bending of the rail. However, the fact that the
rail is considered continuously supported does not allow calculating
the secondary bending. This problem has been overcome by
calculating the secondary bending aside from the model and
introducing it as an additional external excitation.

123
At this point it is convenient to reflect on the existence of possible
interesting differences between both types of modeling. In this sense,
Knothe and Grassie (1993) established that shear deformation can be
neglected in analyses performed at frequencies below 500Hz.
Subsequently, Dahlbert (1995) established that for frequencies below
500Hz, the theory of Euler-Bernoulli provides acceptable results,
whereas for frequencies above 1000Hz, the differences between both
theories become 30%.
Thus, in order to avoid the possibility of restricting the utility of the
model to frequencies below 500Hz, it was decided to model the rail
following the Timoshenko’s beam theory. Although the frequencies
studied in this article allow modeling the rail by the theory of Euler-
Bernoulli, this decision was made in order to provide a proper
application to demonstrate the accuracy of the model and to use it for
future research.
Moreover, given the importance of this topic, it has already become a
new investigation line in which many members of the Institute of
Multidisciplinary Mathematics which includes the author of this Thesis
are collaborating at the moment. This new research will focus on
analyzing how affects the theory of beams used in the modeling to the
results that can be obtained from the model.
Regarding the modeling of other layers which constitute the track,
following the example of Metrikine (2000) and Koziol (2008), it is
considered that the rest of the layers of the track have a visco-elastic
behavior. In order to represent this fact, the movement equation used
in every layer is the wave equation explained in chapter 1 of this
Thesis in vector form.
The previous equation stands out that, in addition to the displacement
vector (that in this case will only have two components as a
consequence of the bidimensional domain adopted), the density of the
material and the and factors which describe the visco-elastic
behavior of the material, play an important role in the wave equation.
Both and factors are calculated/estimated using two mathematical
expressions with two terms. The first term, known as the Lamé
parameter, represents the elastic behavior of the material and is

124
calculated using the elasticity modulus and the Poisson ratio of the
material. The second term, known as damping coefficient, simulates
the viscous behavior of the material. In contrast to the first term, in the
second term it does not exist any mathematical formulation to
calculate its value. Those values must be calibrated along the
mathematical process, and consulting experimental works to estimate
an acceptable order of magnitude.
Any mathematical approach involves defining boundary conditions to
satisfy, in addition to the own formulation of the problem. In this case,
the following conditions are assumed:
Compatibility Conditions between layers: in the interfaces between the
different layers which constitute the models, an equality of
displacements and stresses (normal and shear) must exist, both in
vertical and horizontal axis.
No displacements and no stresses (normal and shear) condition at the
bottom boundary of the model. This condition is reached considering
the bottom layer of the model as a Boussinesq semi-space of infinite
thickness.
Once the premises for modeling the rail and track layers have been
explained, it is convenient to point out the following: the rail is not
modeled as an aditional layer, but it is coupled to the modeled layers
compatibilizing its boundary conditions. In this regard, the vertical
stresses and displacements of the rail will be determined by the
corresponding expressions of a Timoshenko beam. Moreover, a zero
longitudinal displacement of the rail is imposed. This last assumption
is in accordance with previous works of Metrikine (2000) and Koziol
(2008) that have been followed in this chapter of the Thesis. The
assumption of zero longitudinal displacement of the rail and the fact of
coupled movements between rail and layers justify the reason why the
longitudinal displacement is zero at z = 0.
At this point, it is important to think about the different track typologies
described along this investigation and the influence of its
characteristics in the model configuration. In chapter 1 it has been
worked with a ballasted track. In these cases, the rail is located at the
top of the model, resting over the first layer. The no-horizontal
displacements condition will be accomplished at the top of the first

125
layer, and vertical displacements obtained will be equal to those
calculated using the Timoshenko beam theory. At the rest of
interfaces between layers, the compatibility conditions of
displacements and stresses previously mentioned will be satisfied.
Different tracks lead to different models, for example in the case of
tram tracks with embedded rail, the element representing the rail and
the elastomer where it is embedded is placed in between the first and
the second layer. In this manner, on the upper limit of the model, the
no-stress condition of normal and shear stresses is accomplished. On
the other hand, at the interface between the first and the second layer
(which is where the element that models the rail will be located), the
no horizontal displacements condition is also accomplished.
Furthermore, vertical displacements are equal and will be determined
by the deflection obtained from the Timoshenko beam equations.
The equations (16) of chapter 1 represent mathematically the
boundary conditions previously described in these paragraphs.
When reflecting about the modelling of the applied loads (or those
which may be applied) over the track, the possibilities are wide, as it is
demonstrated following a “cronological order” of the developed
investigation line. In the first publication about this topic “A procedure
for the evaluation of vibrations induced by the passing of a train and
its application to real railway traffic”, the following types of load (see
the introduction of the Thesis in which the different loading
mechanisms are classified) are taken into account: quasi-static load
(corresponding to the passage of a load at a certain speed with a
certain load axle and a certain constitution of axles and bogies,
generically known as “physiological load due to vehicle”), load due to
the secondary bending of the rail, caused by its discrete support
(corresponding to one of the types of physiological load due to the
track) and load caused by pathologies associated to the rail .
The so-called quasi-static load is introduced to the model using two
mechanisms. On one hand, the static load (which is the axle load of
the vehicle moving at a certain constant speed) is modeled by the
method of Zimmermann and the theory of Pandolfo. On the other
hand, the effect due to the configuration of axis and bogies of railway
composition is represented by harmonic loads. By using this method,
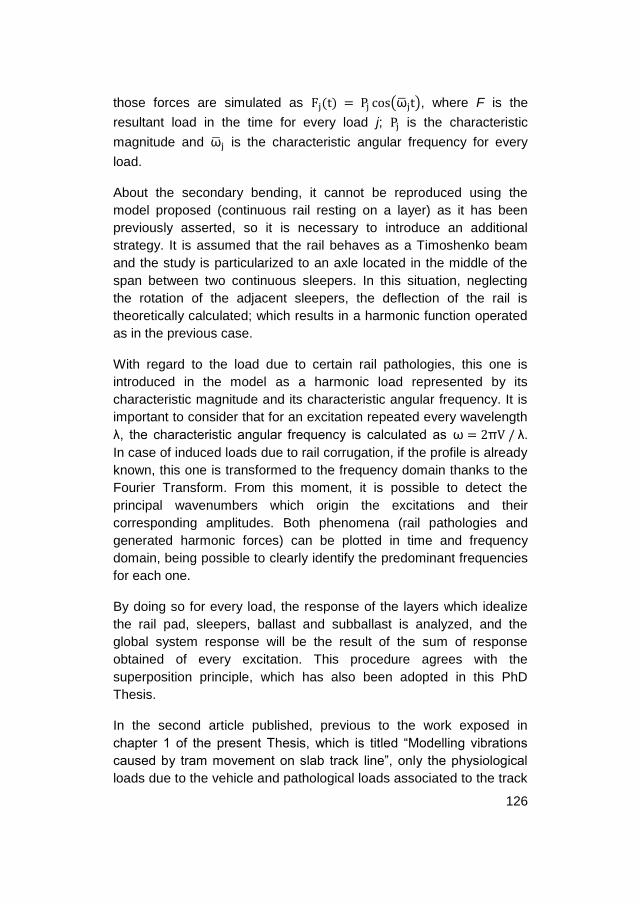
126
those forces are simulated as , where F is the
resultant load in the time for every load j; is the characteristic
magnitude and is the characteristic angular frequency for every
load.
About the secondary bending, it cannot be reproduced using the
model proposed (continuous rail resting on a layer) as it has been
previously asserted, so it is necessary to introduce an additional
strategy. It is assumed that the rail behaves as a Timoshenko beam
and the study is particularized to an axle located in the middle of the
span between two continuous sleepers. In this situation, neglecting
the rotation of the adjacent sleepers, the deflection of the rail is
theoretically calculated; which results in a harmonic function operated
as in the previous case.
With regard to the load due to certain rail pathologies, this one is
introduced in the model as a harmonic load represented by its
characteristic magnitude and its characteristic angular frequency. It is
important to consider that for an excitation repeated every wavelength
λ, the characteristic angular frequency is calculated as λ.
In case of induced loads due to rail corrugation, if the profile is already
known, this one is transformed to the frequency domain thanks to the
Fourier Transform. From this moment, it is possible to detect the
principal wavenumbers which origin the excitations and their
corresponding amplitudes. Both phenomena (rail pathologies and
generated harmonic forces) can be plotted in time and frequency
domain, being possible to clearly identify the predominant frequencies
for each one.
By doing so for every load, the response of the layers which idealize
the rail pad, sleepers, ballast and subballast is analyzed, and the
global system response will be the result of the sum of response
obtained of every excitation. This procedure agrees with the
superposition principle, which has also been adopted in this PhD
Thesis.
In the second article published, previous to the work exposed in
chapter 1 of the present Thesis, which is titled “Modelling vibrations
caused by tram movement on slab track line”, only the physiological
loads due to the vehicle and pathological loads associated to the track

127
have been considered. It is because in concrete slab track (tram in
this case) there is no secondary bending, as it has been previously
explained. The formulation followed to model these loads is similar to
the first publication formulation.
In the studied case of chapter 1 of the present Thesis, the different
loads mentioned in the first publication have been considered again
but an important advance on its processing has been achieved. To
begin inserting the loads, the harmonic method described is used to
introduce the static and dynamic loads in the model. Thus, for the
case of static loads, the Zimmerman and Pandolfo formulations have
been omitted, supposing the quasi-static load as harmonic with the
same amplitude as the axle vehicle load and zero frequency (to the
case of sinus-harmonic). It has been done in order to represent the
invariability of the force amplitude over time, since it is a constant and
permanent load. By proceeding this way, five harmonics have been
obtained, four of them corresponding to dynamic loads with
amplitudes ranging between 4.7 and 13.3 kN and frequencies
between 5.7 and 21 Hz.
After the analysis of the processing of the different loads, the
resolution of the analytical problem outlined is performed. As it has
been exposed in previous paragraphs, the rector equations of the
problem are the Timoshenko’s beam theory to model the rail and the
vector waves equation to represent the other layers behavior.
The analytical solution of the problem is addressed following to Koziol
(2008). To do so, different mathematical operations are implemented
to introduce an algebraic equation system which can be easily solved
using the Kraemer’s theory. This theory allows obtaining the
displacements and stresses for every point of the structure and for
every material layer in the frequency domain and in the wavenumber.
The next step is to apply the inverse Fourier Transform to the obtained
expressions, but the complexity of these equations requires to assume
several simplifier hypothesis that allow obtaining the solution in the
time and space domain. The simplifications adopted are the following:
To fix x=0, in this manner the transient part of the resolution is
neglected and it is assumed that the stationary solution is the one
which defines the problem.

128
The z coordinate is fixed depending on the point desired to obtain the
results. In such problems, the most interesting solution is for the
surface and consequently, for this situation, z=0 is taken.
With these simplifications it is possible to obtain the vertical
displacement of the ground surface. Deriving twice the mathematical
expression of the vertical displacement respect to time, vertical
accelerations are obtained.
After the analytical resolution of the introduced problem, the next step
is to calibrate and validate the model.
The calibration consist of assigning different values to the unknown
parameters, either by nature (for example, the visco-elastic damping
coefficients of the different layers that constitute the model) or simply
because it is not possible to have reliable data.
Nevertheless, prior to the calibration, it is necessary to know which
parameters from the unreliable data are relevant for the model,
namely, which ones have a real influence on the results calculated by
the model. This task of the work is known as "Sensitivity Analysis of
the Model".
In the case studied in chapter 1, it would be necessary to perform a
wide sensitivity analysis. On the one hand, given that the domain has
been divided into five different layers, it would be necessary to
estimate the damping coefficients for each one. This work would
involve ten different sensibility analyses, which is not viable, so the
decision to assign the same damping coefficient to all layers is taken.
It is important to consider that although these values are not specific
to each layer, the assumption of equal values will represent the global
model behavior due to the model will be calibrated and validated
depending on these parameters.
On the other hand, as a consequence of the absence of recent tests
in the track, the values of some mechanical characteristics of
materials are unknown. Additionally, due to the poor conditions of the
track, it is hard to estimate these values properly. To overcome this
problem, the elasticity modulus and the Poisson’s ratio of the ballast
and the two ground layers are incorporated to the process.

129
In short, the sensitivity analysis of eight variables is done, which is
considered as an appropriate approach to the problem, concluding
that the relevant parameters are the damping coefficients (especially
μ, which governs the vertical displacements) and the modulus of
elasticity of the ballast and the upper layer of the ground.
After the sensitivity analysis used to identify the parameters that must
be calibrated, the calibration process begins.
Basically, calibration includes the comparison of the results obtained
by the model, fixing a value of the parameter to be calibrated, with the
values measured by the device at the same point of the domain.
This comparison process has been developed in a qualitative manner.
In chapter 1, the comparison is showed based on the following values:
The maximum and minimum values of the acceleration peaks
must be similar.
The time measured between peaks must be similar
The time between the beginning of the signal and the first
peak must be close enough
The attenuation time of the last peak must be similar in both
cases
The model results are compared with measured vibration values in the
rail, selecting data sets which were not significantly affected by
background noise and those in which the train speed did not differ
significantly from the average speed. Background noise is understood
as all those vibrating components which are recorded during
measurements in absence of railway traffic by the study section. This
background signal can be caused by actions external to the railway
which are close to the track, so that the sensors detect certain levels
of unsuitable vibration. Therefore, the procedure is to measure several
data series without railway traffic to obtain a signal representative of
the background noise, and finally to separate this signal in the
subsequent measurements made with railway traffic.
After this process, the previously unknown values of the four relevant
parameters are set. These are: elasticity modulus of the ballast layer
(calibrated value: 2*107Pa), elasticity modulus of the upper ground
layer (calibrated value: 5*105 Pa), visco-elastic parameter μ

130
(calibrated value: 5*105) and visco-elastic parameter λ (calibrated
value: 4*104).
The next step is to validate the model. Again, the results of the model
(with the values of the four parameters previously determined) are
compared with another data series, different from the previous used to
the calibration process. This can be found in Figure 6 of chapter 1,
where the results obtained by the model are overlapped with the data
measured on the track.
Note how satisfactory the adjustment is. The values of the positive
acceleration peaks are practically the same, while the values of the
negative acceleration peaks are overestimated by the model. The
times of growth and attenuation of accelerations are very similar.
Based on the previous comments, it is concluded that the analytical
model is a suitable tool for predicting vibrations given that, in the worst
case, the model always yields results on the safe side.
At this stage, we can affirm that the defined model is capable to
reproduce the vibrations in the studied track. This is useful for
predicting, for example, the vibrational behavior of the track
considering a replacement of sleepers or railpads. The replacement of
wooden sleepers for concrete sleepers leads to a considerable
increase in vibration amplitudes, probably due to the increment of the
vertical stiffness of the track. Then, the railpads replacement by others
more elastic can be analyzed. This fact involves a very significant
decrease of the amplitudes obtained.
Notice how it is only possible to model changes in the existing
elements/layers. Nevertheless, if it would be necessary to analyze, for
example, the influence of a layer of bituminous subballast in the
vibrations attenuation, a new model should be created due to this
element has not previously been taken into account. This is one of the
most important limitations of this kind of models: only a few types of
simulations are allowed.
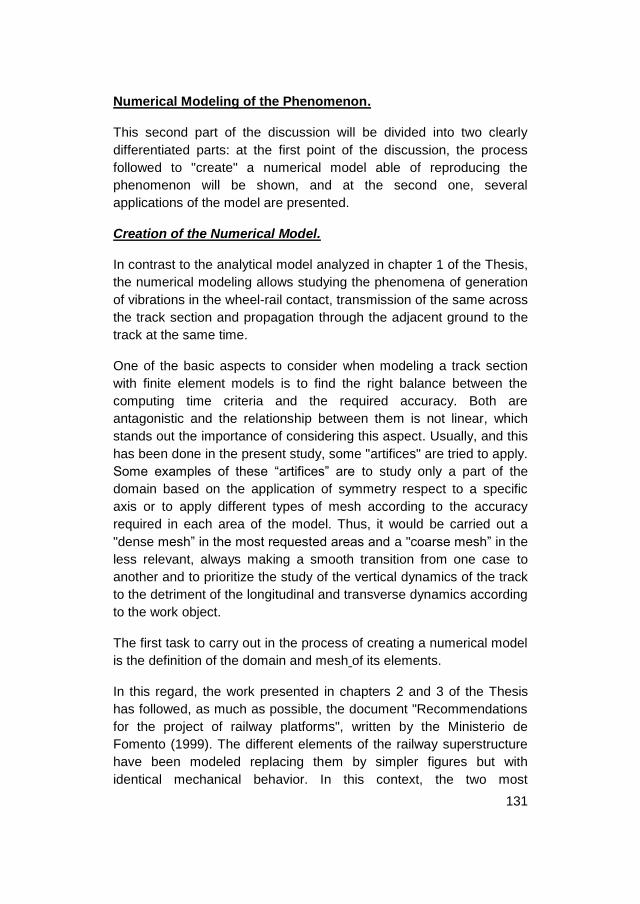
131
Numerical Modeling of the Phenomenon.
This second part of the discussion will be divided into two clearly
differentiated parts: at the first point of the discussion, the process
followed to "create" a numerical model able of reproducing the
phenomenon will be shown, and at the second one, several
applications of the model are presented.
Creation of the Numerical Model.
In contrast to the analytical model analyzed in chapter 1 of the Thesis,
the numerical modeling allows studying the phenomena of generation
of vibrations in the wheel-rail contact, transmission of the same across
the track section and propagation through the adjacent ground to the
track at the same time.
One of the basic aspects to consider when modeling a track section
with finite element models is to find the right balance between the
computing time criteria and the required accuracy. Both are
antagonistic and the relationship between them is not linear, which
stands out the importance of considering this aspect. Usually, and this
has been done in the present study, some "artifices" are tried to apply.
Some examples of these “artifices” are to study only a part of the
domain based on the application of symmetry respect to a specific
axis or to apply different types of mesh according to the accuracy
required in each area of the model. Thus, it would be carried out a
"dense mesh” in the most requested areas and a "coarse mesh” in the
less relevant, always making a smooth transition from one case to
another and to prioritize the study of the vertical dynamics of the track
to the detriment of the longitudinal and transverse dynamics according
to the work object.
The first task to carry out in the process of creating a numerical model
is the definition of the domain and mesh of its elements.
In this regard, the work presented in chapters 2 and 3 of the Thesis
has followed, as much as possible, the document "Recommendations
for the project of railway platforms", written by the Ministerio de
Fomento (1999). The different elements of the railway superstructure
have been modeled replacing them by simpler figures but with
identical mechanical behavior. In this context, the two most

132
complicated elements have been the rail (Phoenix 37N of 65
kilograms per linear meter) and the rail pad (model Edilon of 15mm
thickness).
In the case of the rail, it is important to find a simple shape that
faithfully represents its flexural strength. It is chosen a parallelepiped
whose width matches with the width of the rail foot and whose vertical
dimension is calculated by equating the moment of inertia, about the
horizontal axis, of the original rail with the simplified parallelepiped.
With respect to the railpad (mechanically defined by its Young's
modulus, Poisson's ratio and density), although the geometry is
relatively simple, it has been necessary to modify its size in order to
avoid introducing in the model elements with very different dimensions
(this fact causes problems of numerical convergence). The criterion
used to this substitution is to equal the stiffness values between the
real and the modeled pad. This consideration forces to modify the
elasticity modulus of the modeled pad (the rigidity of an element
depends on its area, elasticity modulus and thickness). In short, a
parallelepiped element of 50 mm thickness and with a fictitious
elasticity modulus is employed.
The modeling of the concrete slab where the rails lies is relatively
simple. It is a reinforced concrete HA-25 slab, with known values of
Young's modulus, Poisson's ratio and density. A similar situation
occurs with the layers of lean concrete and mass concrete located
under the concrete slab.
About the modeling of the existing ground under the track, data
obtained from the relevant geotechnical tests in the trace and
geological map of the area are available. It is concluded that the
ground is composed of an upper stratum of sand, with 2 m thickness,
under which a wide layer of calcarenites is located. Nevertheless, to
begin with the modeling process, a lower limit to the model must be
fixed. Combining again the computing time criteria and accurate
representation of the phenomenon to study, and following the
Recommendations for the project of railway platforms written by the
Ministerio de Fomento, the thicknesses of the lower stratus was set to
3.5 meters.

133
Note how the physical phenomenon of vibration generation and
transmission through track package is, until this moment, the one
which “leads” both the establishment of the vertical domain and the
modeling process of the different elements that constitute the track
section and the ground beneath the track (vertical dynamics of the
track). Then, the propagation of vibrations in the adjacent ground
occurs. In that moment, according to this physical phenomenon, the
size of the domain is fixed in longitudinal and transversal directions
from the track.
At this point, the first thing to consider is the frequency range to be
studied. Since the main goal is to analyze how the railway vibrations
affects people who live/work/transit in the track vicinity, the range from
2 Hz to 80 Hz should be the range chosen. It is documented that, in
this environment, the human health is altered. Authors as Griffin
(1990) make statements about this topic, even affirming that the most
damaging vibrations are those between 2 and 50 Hz, being the
vibrations from 50 to 80 Hz less harmful than the previous.
The lower value of the frequency considered, in this case 2 Hz,
influences the parallel and perpendicular dimensions of the track’s
model, because a full wavelength must be developed in these
directions. As it has already been discussed in the introduction of this
Thesis, the predominant mechanism of transmission of railway
vibrations is the Rayleigh waves, whose speed depends on the
ground characteristics trough which the waves are propagated. In the
present case, the propagation speed is 110 m/s. Knowing that the
maximum wavelength is given by the quotient of the propagation
speed and the minimum frequency to be studied, it is obtained a
maximum value of wavelength of 55 meters.
At this stage, it is convenient to reflect on the dimensions of the
considered domain. Certainly, there is no clear consensus in this
regard. As evidence, there are discrepancies among authors as
Ekevid and Wiberg (2002), Connolly et al. (2013) and Hall (2003).
Nevertheless, in the various publications studied, the location of the
point where the results are obtained is particularly important because
the dimensions of the domain are set depending on this location. It is
done in order to avoid the influence of the domain dimensions on the
results obtained in the point considered.
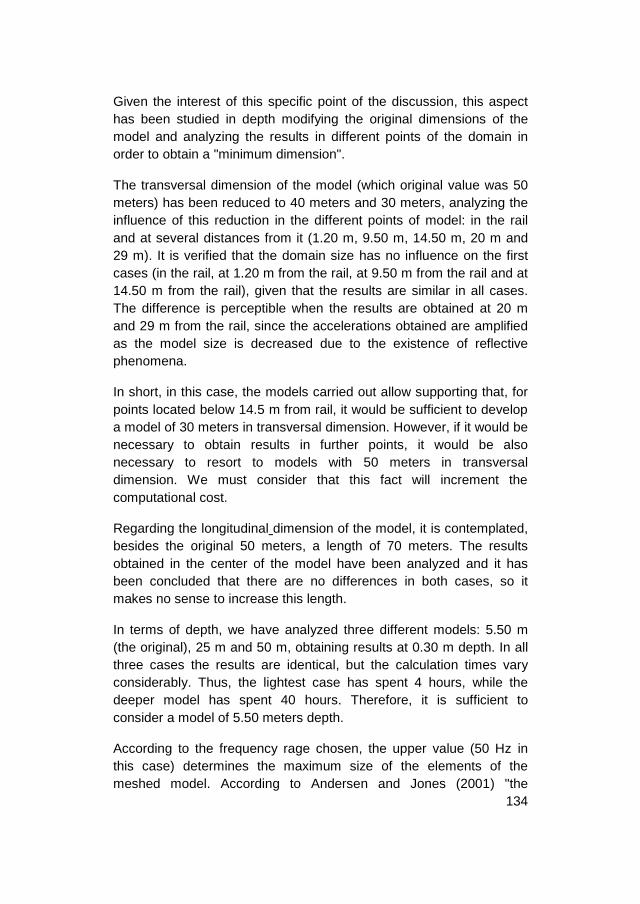
134
Given the interest of this specific point of the discussion, this aspect
has been studied in depth modifying the original dimensions of the
model and analyzing the results in different points of the domain in
order to obtain a "minimum dimension".
The transversal dimension of the model (which original value was 50
meters) has been reduced to 40 meters and 30 meters, analyzing the
influence of this reduction in the different points of model: in the rail
and at several distances from it (1.20 m, 9.50 m, 14.50 m, 20 m and
29 m). It is verified that the domain size has no influence on the first
cases (in the rail, at 1.20 m from the rail, at 9.50 m from the rail and at
14.50 m from the rail), given that the results are similar in all cases.
The difference is perceptible when the results are obtained at 20 m
and 29 m from the rail, since the accelerations obtained are amplified
as the model size is decreased due to the existence of reflective
phenomena.
In short, in this case, the models carried out allow supporting that, for
points located below 14.5 m from rail, it would be sufficient to develop
a model of 30 meters in transversal dimension. However, if it would be
necessary to obtain results in further points, it would be also
necessary to resort to models with 50 meters in transversal
dimension. We must consider that this fact will increment the
computational cost.
Regarding the longitudinal dimension of the model, it is contemplated,
besides the original 50 meters, a length of 70 meters. The results
obtained in the center of the model have been analyzed and it has
been concluded that there are no differences in both cases, so it
makes no sense to increase this length.
In terms of depth, we have analyzed three different models: 5.50 m
(the original), 25 m and 50 m, obtaining results at 0.30 m depth. In all
three cases the results are identical, but the calculation times vary
considerably. Thus, the lightest case has spent 4 hours, while the
deeper model has spent 40 hours. Therefore, it is sufficient to
consider a model of 5.50 meters depth.
According to the frequency rage chosen, the upper value (50 Hz in
this case) determines the maximum size of the elements of the
meshed model. According to Andersen and Jones (2001) "the

135
smallest wavelength which is expected to represent, has to cover at
least 6 nodes of the model". Continuing with the example proposed to
the previous case and assuming a propagation velocity of Rayleigh
waves in the terrain analyzed of 110 m/s, a lower limit of 2.2 meters
length is obtained. Therefore, the size of the elements must be, at
most, 0.5 m.
The rule proposed by Andersen and Jones is generally accepted by
many authors. It is possible to find explicit reflections about it in
Marburg (2002). In this regard, in Real et al. (2014) the possibility of
reducing the mesh size below the values obtained by that rule is
discussed, and it is concluded that there are no significant differences
in the cases studied. Nevertheless, a substantial increase in
computing time occurs.
Regarding the boundary conditions adopted, the document
"Recomendaciones para el proyecto de plataformas ferroviarias"
(Ministerio de Fomento, 1999, in Spanish) has been followed. This
document is signed by several authors and collected in different
publications. As example, the works of Santos Areias et al. (2007) and
Gallego et al. (2012) can be mentioned.
The boundary conditions set in that document are:
In transversal vertical boundaries of the track, it has been
decided to impose its perpendicular movement. (Uz = 0)
In longitudinal vertical boundaries of the track, as in the
previous case, the boundary condition set is to impose the
zero movement on its perpendicular direction (Ux = 0)
In the lower limit of the model, it has been set no vertical
movement (Uy = 0).
With the first two conditions the effect of confined terrain is simulated,
allowing only vertical deformation of the model. The stiffness of the
material located in the lower boundary is supposed to be much higher
than the stiffness of the upper materials. This allows introducing this
type of condition without affecting the results of the points located on
the surface of the model.
Once defined and meshed the domain of work, the next step is to
choose the model element.

136
This is a very important aspect in the process since the possibility of
representing or not certain phenomena depends on the accurate
choice of the computation element (type and sizes).This point can be
verified through this discussion.
As several authors as Prat et al. (1995) reveal in their publications, the
20-node hexahedron is the ideal element for three-dimensional
modeling of structures and ground. Overall, according to these
authors, prismatic elements are the most suitable for this kind of
problems.
In ANSYS v11, the discretization of three-dimensional elements is
carried out with elements type "SOLID". The most used are the
SOLID95 with 20 nodes and the SOLID45 with 8 nodes. In both
cases, each node has three degrees of freedom. In this sense, the
document "Recommendations for the project of railway platforms”
recommends to use SOLID95 in those finite element analyses that are
going to be subjected to bending.
Despite the previous comments, in the modeling carried out in
Chapter 2 of this Thesis, it has been used the SOLID45 element. The
large size of the model and its heterogeneities, involve a very high
computing time if SOLID95 element is chosen. Specifically, for the
SOLID95 element, each one of the conventional models takes 16:30
hours, in contrast to the 1:48 hours used up by the SOLID45 element
for a model of identical complexity. The analysis of the results
obtained for both simulations, concludes that in points close to the
track (accelerations in the rail and at points located at a distance of
1.20 meters) the results are substantially similar. At the same time that
the location of the furthest points of the track are compared, the
modeling with SOLID45 provides positive and negative peaks, slightly
higher to the modeling conducted with SOLID95. Both arguments
(less calculation time and acceptable results) have made the decision
to use the SOLID45 instead of SOLID95.
The next step is to define the constitutive model of the different
materials involved in the problem.
ANSYS, like other commercial finite element programs available in the
market, has implemented all constitutive models, from the simplest
(linear-elastic model) to more complexes (visco-elastoplastic model).
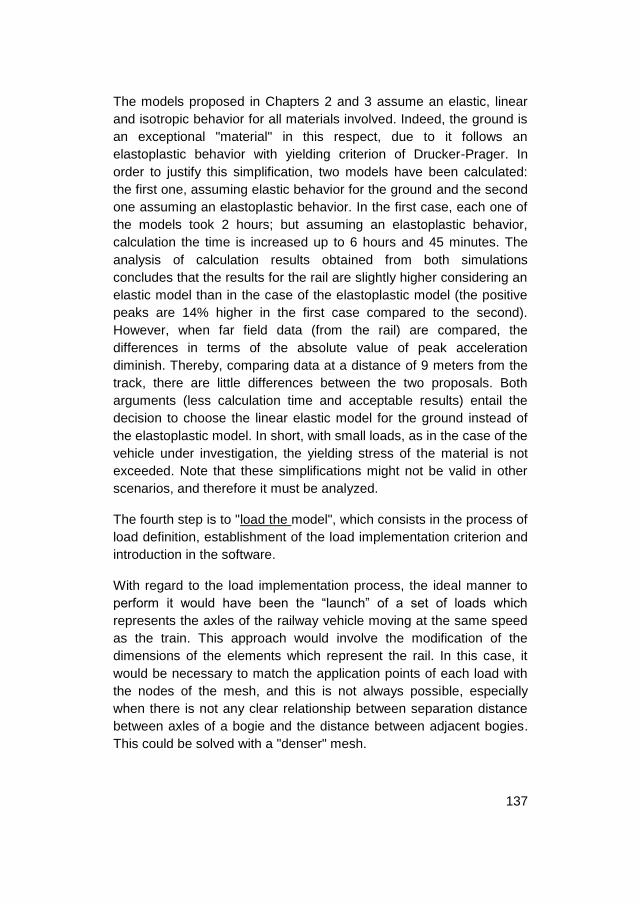
137
The models proposed in Chapters 2 and 3 assume an elastic, linear
and isotropic behavior for all materials involved. Indeed, the ground is
an exceptional "material" in this respect, due to it follows an
elastoplastic behavior with yielding criterion of Drucker-Prager. In
order to justify this simplification, two models have been calculated:
the first one, assuming elastic behavior for the ground and the second
one assuming an elastoplastic behavior. In the first case, each one of
the models took 2 hours; but assuming an elastoplastic behavior,
calculation the time is increased up to 6 hours and 45 minutes. The
analysis of calculation results obtained from both simulations
concludes that the results for the rail are slightly higher considering an
elastic model than in the case of the elastoplastic model (the positive
peaks are 14% higher in the first case compared to the second).
However, when far field data (from the rail) are compared, the
differences in terms of the absolute value of peak acceleration
diminish. Thereby, comparing data at a distance of 9 meters from the
track, there are little differences between the two proposals. Both
arguments (less calculation time and acceptable results) entail the
decision to choose the linear elastic model for the ground instead of
the elastoplastic model. In short, with small loads, as in the case of the
vehicle under investigation, the yielding stress of the material is not
exceeded. Note that these simplifications might not be valid in other
scenarios, and therefore it must be analyzed.
The fourth step is to "load the model", which consists in the process of
load definition, establishment of the load implementation criterion and
introduction in the software.
With regard to the load implementation process, the ideal manner to
perform it would have been the “launch” of a set of loads which
represents the axles of the railway vehicle moving at the same speed
as the train. This approach would involve the modification of the
dimensions of the elements which represent the rail. In this case, it
would be necessary to match the application points of each load with
the nodes of the mesh, and this is not always possible, especially
when there is not any clear relationship between separation distance
between axles of a bogie and the distance between adjacent bogies.
This could be solved with a "denser" mesh.

138
Definitively, it was decided to launch a single load and overlap the
results as many times as axles the vehicle has, taking into account the
time interval between them. This approach is only possible if a linear
behavior of materials has been previously assumed, as is the case of
this Thesis.
At this point it should be stood out the close relationship between size
and type of calculation element (which determines the points of
application of the load); the speed at which the rail vehicle moves; the
time that the maximum load remains on each node; the time periods in
which every load step is divided and the maximum vibration frequency
which is desired to model. The definition of these parameters is not a
trivial topic, and a mistake planning them will lead to a considerable
rise on the calculation time.
The calculation element chosen is a SOLID45 (characterized, among
other things, by having only nodes at the vertices) with an edge length
of 0.5 meters. These considerations imply that loads can be only
applied every 0.5 meters. Moreover, the real operating speed of the
line used in the model is 30 km/h. This fact, combined with the
previous, assumes that the residence time of each load in each node
(which is known as "load step") is 0.06 seconds (the time is obtained
as the quotient of the distance between nodes and speed).
The relationship between the highest frequency vibration to study (in
this case 50 Hz) and the time periods in which each loadstep is
divided is defined by the Nyquist-Shannon Theorem, which says that
“if FMAX is the highest frequency contained in an analog signal X(t), in
order to represent that signal from one of its samples, it is necessary
that the sampling frequency of these exceeds twice the maximum
frequency of the signal”. Therefore, the minimum number of records
that must be obtained is set to 100 per second. Thus, each loadstep,
whose duration is 0.06 seconds, has to provide six records, that is to
say that each load step is divided into six periods of 0.01 second
duration.
Once the loads are applied, the "Time-History Postprocessor" of
ANSYS allows obtaining, for each node, values of displacement,
velocity and acceleration in time domain. These data are transformed
to the frequency domain applying the discrete Fourier transform, with

139
"Wolfram Mathematica" software. At this point, it can be stated that a
numerical model capable of representing the physical phenomenon
described, is already available.
The last step is to perform the calibration and validation of the model.
This process is carried out comparing the model results with real data
from the data gathering campaign.
At this point, it should be noted that the measured data on the track
probably corresponds to a deformed track geometry and/or vehicle.
This aspect was not considered in the modeling. To overcome this
problem, the project entitled "Modelización de la interacción vía-
tranvía" of S. Anacleto (2009) is consulted. According to this project,
in tram way operations, the values of the dynamic overloads account
for 33% of the static load. This assumption is not exempt from
discussion, given the great variability that may occur.
In this context, as it is reflected in the PhD Thesis of P. Teixeira
(2003), the different criteria that exist to increase static loads clearly
depend on the train speed among others. Hence, it is not acceptable
to extrapolate the data proposed by S. Anacleto to other operations.
Previous to the model calibration, it is necessary to identify the
variables of the model that have a clear influence on the results; in the
case of being unknown, there are incorporated to the calibration
process. This mechanism is commonly known as "Sensitivity
Analysis". In the case of this PhD Thesis, there are three unknown
parameters whose influence on the model results is not know a priori,
and they are: Young's modulus of sands, Poisson's ratio of sands and
β coefficient of Rayleigh. Three modeling sets are conducted in order
to analyze the influence of each of the three parameters in the final
results. As can be seen in Figures 5 and 6 of Chapter 2 in this Thesis,
only the Young's modulus of sands and Rayleigh β coefficient have
been demonstrated to be significant. Hence, both parameters will be
introduced in the calibration process in order to estimate their values
in this case.
The calibration is performed by comparing certain measured data at
specific points on the track with the data calculated by the model at
the same points. Specifically, in chapter 2 of this Thesis, the following
values have been compared: average value of positive acceleration

140
peaks, average value of negative acceleration peaks, decay ratio at
the beginning of the accelerogram and decay ratio at the end of the
accelerogram. The results of this calibration process are the values of
Young's modulus of sands (70MPa) and Rayleigh β coefficient
(0.001).
Once the calibration process is finished, the model validation begins
with another data set obtained from the data gathering campaign. In
this case, the same process is carried out. Thus, a qualitative
validation process is performed with identical magnitudes. In this
regard, it is convenient to note that the model results are always
higher than those measured in the data campaign. Regarding the
value of the acceleration positive peaks, the excess add up to 5% of
the value (which is perfectly acceptable), while in the case of negative
peaks the excess is higher (a 9% of the value).
From the previous results, it can be stated that a numerical model
capable of representing the generation of vibrations on the wheel-rail
contact, transmission across the track and propagation throughout the
adjacent ground is now available.
Applications of the numerical model.
Using the model developed in chapter 2 of the Thesis discussed in the
previous epigraph, the influence of certain pathologies of wheel and
rail in the genesis of vibrations as well as the role of certain solutions
in the minimization of the propagation of railway vibrations, specifically
wave barriers, can be analyzed.
This section is divided in two sub-points: the first one corresponds to
the discussion of chapter 3 of the Thesis, and aspects related to the
vibrations generation-transmission-propagation in cases where certain
pathologies exist are considered. The second part is identified with the
discussion of the effectiveness of wave barriers in the propagation of
railway vibrations (chapter 2 of the Thesis).
With regard to the first sub-point, as it was mentioned, in chapter 3 of
the PhD Thesis the modeling of two pathologies that frequently
appear in the railway wheel and on the rail is addressed. These
pathologies are known as "wheel flat "and "rail corrugation ",
respectively.
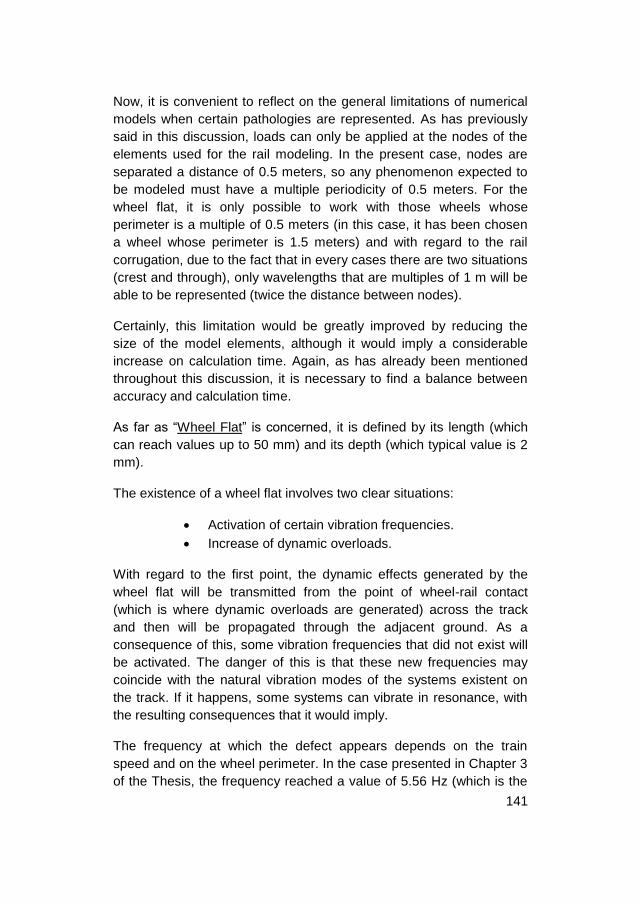
141
Now, it is convenient to reflect on the general limitations of numerical
models when certain pathologies are represented. As has previously
said in this discussion, loads can only be applied at the nodes of the
elements used for the rail modeling. In the present case, nodes are
separated a distance of 0.5 meters, so any phenomenon expected to
be modeled must have a multiple periodicity of 0.5 meters. For the
wheel flat, it is only possible to work with those wheels whose
perimeter is a multiple of 0.5 meters (in this case, it has been chosen
a wheel whose perimeter is 1.5 meters) and with regard to the rail
corrugation, due to the fact that in every cases there are two situations
(crest and through), only wavelengths that are multiples of 1 m will be
able to be represented (twice the distance between nodes).
Certainly, this limitation would be greatly improved by reducing the
size of the model elements, although it would imply a considerable
increase on calculation time. Again, as has already been mentioned
throughout this discussion, it is necessary to find a balance between
accuracy and calculation time.
As far as “Wheel Flat” is concerned, it is defined by its length (which
can reach values up to 50 mm) and its depth (which typical value is 2
mm).
The existence of a wheel flat involves two clear situations:
Activation of certain vibration frequencies.
Increase of dynamic overloads.
With regard to the first point, the dynamic effects generated by the
wheel flat will be transmitted from the point of wheel-rail contact
(which is where dynamic overloads are generated) across the track
and then will be propagated through the adjacent ground. As a
consequence of this, some vibration frequencies that did not exist will
be activated. The danger of this is that these new frequencies may
coincide with the natural vibration modes of the systems existent on
the track. If it happens, some systems can vibrate in resonance, with
the resulting consequences that it would imply.
The frequency at which the defect appears depends on the train
speed and on the wheel perimeter. In the case presented in Chapter 3
of the Thesis, the frequency reached a value of 5.56 Hz (which is the
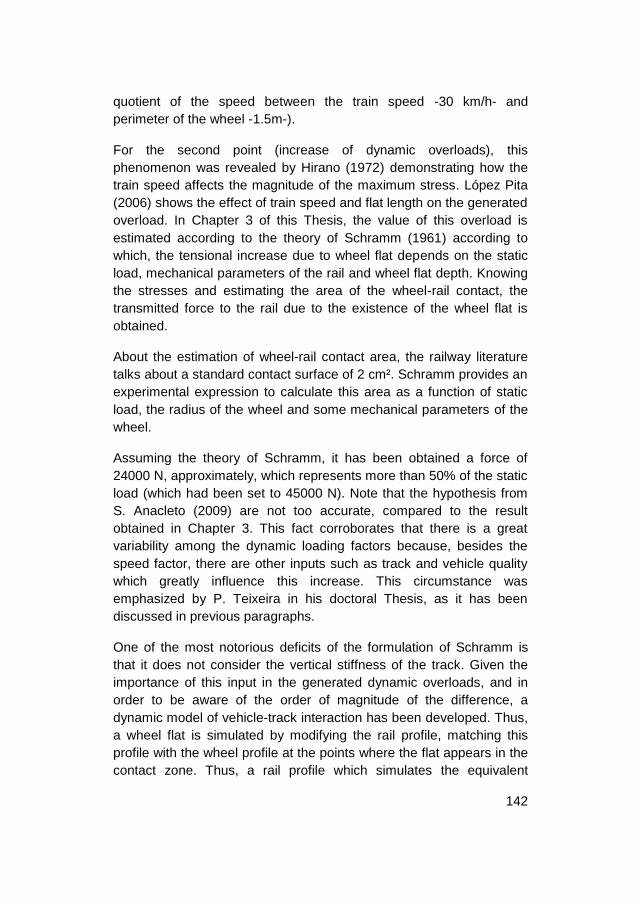
142
quotient of the speed between the train speed -30 km/h- and
perimeter of the wheel -1.5m-).
For the second point (increase of dynamic overloads), this
phenomenon was revealed by Hirano (1972) demonstrating how the
train speed affects the magnitude of the maximum stress. López Pita
(2006) shows the effect of train speed and flat length on the generated
overload. In Chapter 3 of this Thesis, the value of this overload is
estimated according to the theory of Schramm (1961) according to
which, the tensional increase due to wheel flat depends on the static
load, mechanical parameters of the rail and wheel flat depth. Knowing
the stresses and estimating the area of the wheel-rail contact, the
transmitted force to the rail due to the existence of the wheel flat is
obtained.
About the estimation of wheel-rail contact area, the railway literature
talks about a standard contact surface of 2 cm². Schramm provides an
experimental expression to calculate this area as a function of static
load, the radius of the wheel and some mechanical parameters of the
wheel.
Assuming the theory of Schramm, it has been obtained a force of
24000 N, approximately, which represents more than 50% of the static
load (which had been set to 45000 N). Note that the hypothesis from
S. Anacleto (2009) are not too accurate, compared to the result
obtained in Chapter 3. This fact corroborates that there is a great
variability among the dynamic loading factors because, besides the
speed factor, there are other inputs such as track and vehicle quality
which greatly influence this increase. This circumstance was
emphasized by P. Teixeira in his doctoral Thesis, as it has been
discussed in previous paragraphs.
One of the most notorious deficits of the formulation of Schramm is
that it does not consider the vertical stiffness of the track. Given the
importance of this input in the generated dynamic overloads, and in
order to be aware of the order of magnitude of the difference, a
dynamic model of vehicle-track interaction has been developed. Thus,
a wheel flat is simulated by modifying the rail profile, matching this
profile with the wheel profile at the points where the flat appears in the
contact zone. Thus, a rail profile which simulates the equivalent

143
geometry of the wheel-rail contact area is obtained. Using this
methodology, the maximum load value is a 13% higher than the
obtained using the experimental expression of Schramm. Indeed, it
would be possible to think that the difference is not relevant, but the
conceptual error committed by not taking into account factors such as
track stiffness, is remarkable.
Once all the values related to the frequency and overload due to the
wheel flat are estimated/calculated, a procedure to incorporate them
to the model developed in chapter 2 has to be implemented. The way
to do this is represented in figure 3 of chapter 3 of this work.
Before the appearance of the wheel flat, the application of the static
load had a constant value of 45000 N applied during a time (estimated
in 0.06 seconds) in each node of the rail. Nevertheless, when a wheel
flat appears, these load values have to be incremented with an
impulsive force of magnitude equal to the calculated force (24000 N)
acting for a infinitesimal period of time (0.001 seconds in this case;
which mainly depends on the elasticity of the shocking elements) in
some specific nodes (in the case of this Thesis, as a wheel perimeter
of 1.5 meters is assumed, the load is applied to one of every three
nodes).
Once the process of loads application in the numerical model
developed in Chapter 2 has been described, the model is run and
representations of accelerations are obtained as a function of time in
several points more or less separated from the track. The results
obtained are shown in Figure 4 of chapter 3.
The figure clearly shows how the presence of wheel flats causes
significant variations in the response with the growth of positive and
negative acceleration peaks. This response is appreciated with total
clarity, although in a different magnitude, at points located from 0.3 to
3 meters from the rail.
Regarding the “Rail Corrugation”, this is a pathology which affects the
rail and which corresponds to relatively constant wave geometry. It is
represented by its wavelength and amplitude.
The estimation of the dynamic overloads due to the rail corrugation is
performed using the auxiliary model of two masses (M. Melis, 2008).

144
The mathematical formulation of this model allows obtaining the forces
transmitted to the rail depending on the point where the wheel is
located. To do so, the mechanical characteristics of various systems
of the railway vehicle and rail profile must be known.
In chapter 3 of the present work, the approach of the auxiliary model
aforementioned based on the mechanical data of the vehicle (sprung
and unsprung masses, stiffness of the primary and secondary
suspension and damping of the primary and secondary suspension) is
shown. Moreover, a circulation speed of 30 Km/h is set and two
wavelengths defects have been supposed: L1 = 1 m. and L2 = 0.5 m.
In both cases, it has been assumed amplitudes of 0.5 mm for the
defects. These values have been adopted in order to consider the
long wave corrugation rail defects (L = 1 m) and medium wave
corrugation rail defects (L = 0.5 m). The value of 0.5 mm, taken as
amplitude of the defects, represents in both cases a defect in full
development phase, which therefore would require maintenance
tasks. These considerations about wheel corrugation can be
consulted and expanded in the dissertation of S. Anacleto (2009).
At this point it is necessary to reflect on the influence of the
wavelength and amplitude of rail corrugation as well as the train
speed on the numerical value and frequency of the dynamic overloads
obtained.
Thus, for fixed amplitude and constant speed, the decreasing of the
wavelength involves a considerable increase in the value of the
dynamic overload and an increase of the excitation frequency (which
is in accordance with the wavelength of the defect and the train
speed).
Given a particular rail corrugation (defined by its wavelength and
amplitude), as the train speed grows, the frequency and the numerical
value of the dynamic overload are also increased.
Finally, if the amplitude of the rail corrugation is modified, keeping
constant the wavelength and speed, a variation of the same
magnitude in the value of the dynamic overload takes place. However,
the frequency of dynamic overload is not affected by changes in the
amplitude of the defect.
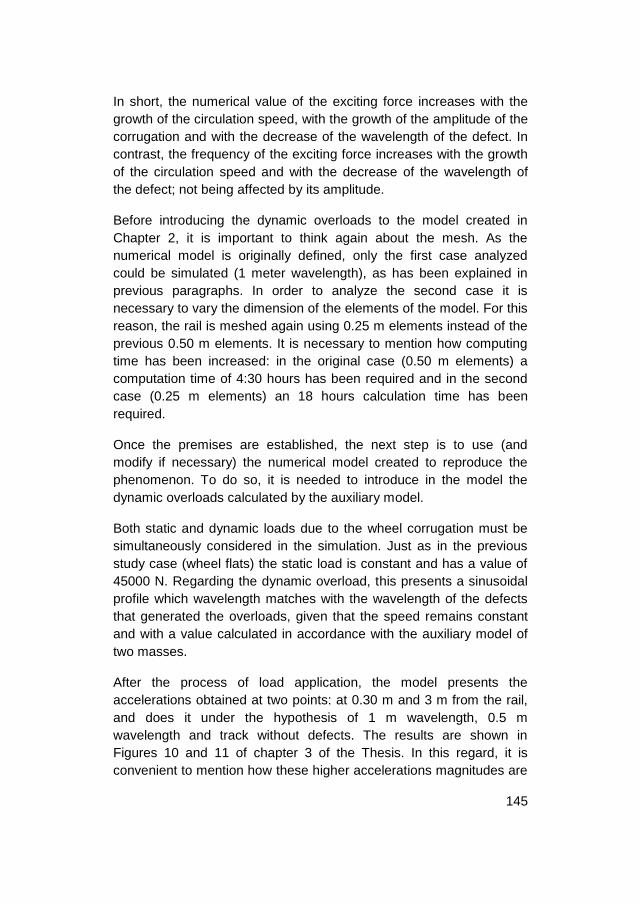
145
In short, the numerical value of the exciting force increases with the
growth of the circulation speed, with the growth of the amplitude of the
corrugation and with the decrease of the wavelength of the defect. In
contrast, the frequency of the exciting force increases with the growth
of the circulation speed and with the decrease of the wavelength of
the defect; not being affected by its amplitude.
Before introducing the dynamic overloads to the model created in
Chapter 2, it is important to think again about the mesh. As the
numerical model is originally defined, only the first case analyzed
could be simulated (1 meter wavelength), as has been explained in
previous paragraphs. In order to analyze the second case it is
necessary to vary the dimension of the elements of the model. For this
reason, the rail is meshed again using 0.25 m elements instead of the
previous 0.50 m elements. It is necessary to mention how computing
time has been increased: in the original case (0.50 m elements) a
computation time of 4:30 hours has been required and in the second
case (0.25 m elements) an 18 hours calculation time has been
required.
Once the premises are established, the next step is to use (and
modify if necessary) the numerical model created to reproduce the
phenomenon. To do so, it is needed to introduce in the model the
dynamic overloads calculated by the auxiliary model.
Both static and dynamic loads due to the wheel corrugation must be
simultaneously considered in the simulation. Just as in the previous
study case (wheel flats) the static load is constant and has a value of
45000 N. Regarding the dynamic overload, this presents a sinusoidal
profile which wavelength matches with the wavelength of the defects
that generated the overloads, given that the speed remains constant
and with a value calculated in accordance with the auxiliary model of
two masses.
After the process of load application, the model presents the
accelerations obtained at two points: at 0.30 m and 3 m from the rail,
and does it under the hypothesis of 1 m wavelength, 0.5 m
wavelength and track without defects. The results are shown in
Figures 10 and 11 of chapter 3 of the Thesis. In this regard, it is
convenient to mention how these higher accelerations magnitudes are

146
obtained (both positive and negative) in those cases in which rail
corrugation was considered. Moreover, this fact takes place in the
vicinity of the track (namely to 0.30 meters from it) as well as at a
certain distance from there (3 meters). Moreover, an interesting
finding is that as the wavelength analyzed decreases, the magnitude
of the acceleration significantly increases, both close to the rail as at a
certain distance from this.
In the second part of this section, the work included in chapter 2 of the
Thesis (effectiveness of different types of wave barriers in the
propagation of railway vibrations) is discussed.
Certainly, the wave barriers parallel to the track have emerged as an
effective way to minimize the propagation of vibrations from the track
to the adjacent buildings. It is a solution of special interest to be
implemented on active railway lines, since it does not involve any work
in the track.
The operating mechanism of wave barriers is based on the theory of
refraction of the incident energy, which is mainly transported as
Rayleigh waves. Thus, the presence of an in-filled trench in the
propagation path of waves implies some discontinuity in the medium
motivated by an impedance variation, fact that causes reflections and
refractions of the incident wave.
In order to evaluate the capacity of the filling of a trench to mitigate
waves, it is convenient to arrange trenches with low waves refraction
coefficient. This fact ensures to the amplitude of the refracted wave to
be lower than the amplitude of the incident wave. In the studied case,
two simplifications that provide higher values of the refracted wave
amplitudes are taken into account. In any case, they are on the safe
side:
• It is considered that the incident wave is perpendicular to the
interface of the two media.
• The mode conversion between P and SV waves (constituents of
Rayleigh waves, as stated in the introduction of this PhD Thesis) is not
considered.

147
In case of an open trench, in addition to the effect described for in-
filled trenches, it is achieved to place an obstacle against the wave
progression. This is the reason why it is traditionally assumed that
open trenches are more efficient than in-filled trenches to minimize the
propagation of vibrations. However, it is important to consider that only
a few terrains are capable to support vertical slopes. In addition,
certain authors have demonstrated that the vertical slopes of open
trenches present instability phenomena against low frequency waves.
Regarding the optimal location of trenches, most authors advocate to
place them "as close as possible to track trace" (F. E. Richardt, 1970).
Indeed, the closer they are to the trace of the track, the greater the
energy to which they are exposed. Nevertheless, this fact will involve
that its design will be more demanding, but also its efficiency will be
superior.
Another aspect traditionally studied has been the analysis of the
effectiveness of trenches in homogeneous terrains vs. multi-layered
terrains. In case of homogeneous areas, wave barriers only work
properly when the depth of the trench is greater than the wavelength
of the incident vibration (F. E. Richardt, 1970). Furthermore this
"suitable operation", which is equivalent to decreasing the incident
wave amplitude of 50%, only remains in a certain distance behind the
trench known as a "shadow zone". This is caused by the diffraction
suffered by the waves at the base of the trench. However, in a multi-
layered terrain, the effectiveness of the wave barrier is greater
because the energy is transmitted through surface waves moving
through this layer. In these cases, the optimum depth of a trench is
that which corresponds to the depth of the upper layer.
Following these assumptions, the application concerning to the study
of the effectiveness of trenches in minimizing the propagation of
railway vibrations, analyzed in chapter 2 of this Thesis, is discussed
below.
The analysis is focused, as it has been done in the model
development, in the studied section of the line 4 of the tram in
Alicante. The section is formed of a multi-layered soil formed by a 2
meters thick sand layer supported on a bedrock base.
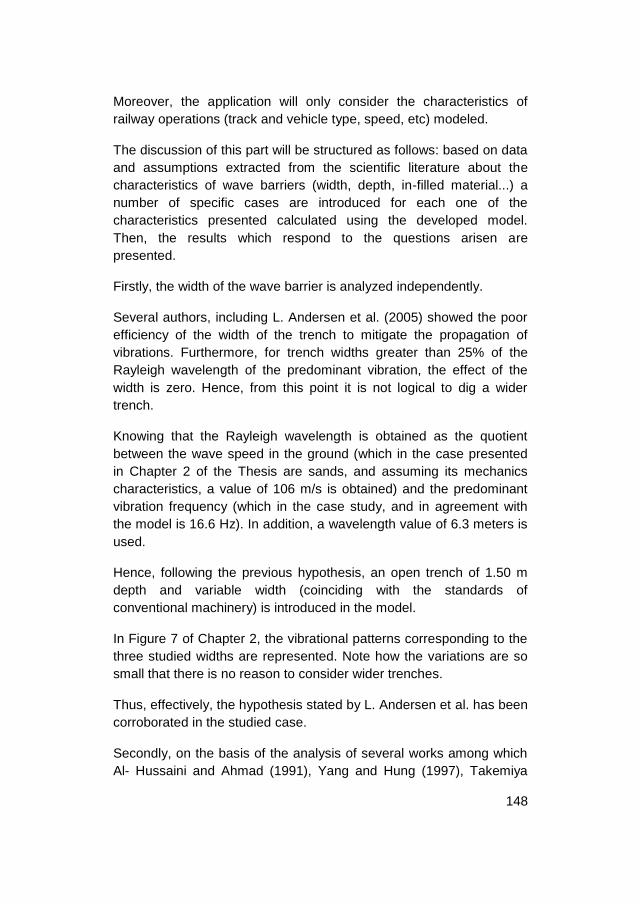
148
Moreover, the application will only consider the characteristics of
railway operations (track and vehicle type, speed, etc) modeled.
The discussion of this part will be structured as follows: based on data
and assumptions extracted from the scientific literature about the
characteristics of wave barriers (width, depth, in-filled material...) a
number of specific cases are introduced for each one of the
characteristics presented calculated using the developed model.
Then, the results which respond to the questions arisen are
presented.
Firstly, the width of the wave barrier is analyzed independently.
Several authors, including L. Andersen et al. (2005) showed the poor
efficiency of the width of the trench to mitigate the propagation of
vibrations. Furthermore, for trench widths greater than 25% of the
Rayleigh wavelength of the predominant vibration, the effect of the
width is zero. Hence, from this point it is not logical to dig a wider
trench.
Knowing that the Rayleigh wavelength is obtained as the quotient
between the wave speed in the ground (which in the case presented
in Chapter 2 of the Thesis are sands, and assuming its mechanics
characteristics, a value of 106 m/s is obtained) and the predominant
vibration frequency (which in the case study, and in agreement with
the model is 16.6 Hz). In addition, a wavelength value of 6.3 meters is
used.
Hence, following the previous hypothesis, an open trench of 1.50 m
depth and variable width (coinciding with the standards of
conventional machinery) is introduced in the model.
In Figure 7 of Chapter 2, the vibrational patterns corresponding to the
three studied widths are represented. Note how the variations are so
small that there is no reason to consider wider trenches.
Thus, effectively, the hypothesis stated by L. Andersen et al. has been
corroborated in the studied case.
Secondly, on the basis of the analysis of several works among which
Al- Hussaini and Ahmad (1991), Yang and Hung (1997), Takemiya

149
(2001), Hung et al. (2004) and the aforementioned study by Andersen
et al. (2005) stand out, the following variables can be outlined:
• Depth of the trench in a multi-layered terrain
• Mechanical properties of the in-filled materials
• Wave barrier typology: Open trench versus in-filled trench.
Then, in order to analyze the influence of the variables outlined, 16
cases of a wide casuistry are studied: four depths (from 1 meter to 2.5
meters) and four types of trenches (filled with concrete, filled with
polyurethane, open trench and open trench with sheet piling).
Furthermore a 0.45 meters width is set for all the cases studied.
With this approach, in order to cover all the cases studied and analyze
the results obtained from the model, the features of the trench are
modified. However, in the case of the sheet piling open trench, it is
necessary to modify the boundary conditions in the model to
incorporate the mechanical role of the sheet piles.
After calculating all the cases, it is concluded that the optimal depth of
trench coincides with the depth of the upper layer, as the scientific
literature evidenced (F. E. Richardt, 1970).
Regarding mechanical and physical properties of the constituent
materials of the trench, the influence of the elastic modulus, Poisson's
ratio and the density of different fillers have been analyzed. It is
demonstrated that the density and Poisson's ratio are not significant,
as Adam et al. (2005) showed. However it is significant the influence
of the modulus of elasticity of the filler, but it is not in a single direction.
Thus, if the difference between the modulus of elasticity of the soil and
the modulus of elasticity of the filler increases, the effectiveness of the
wave barrier in attenuating vibrations also increases. This conclusion
is obtained from the modeling of the four types of filler materials:
concrete-1 (30000 MPa), concrete-2 (40000MPa), polyurethane-1 (20
MPa) and polyurethane-2 (2 MPa). Certainly in the study case, the
attenuation due to the concrete-1 is higher than that the attenuation
due to the polyurethane-1 (which are the data shown in the paper),
but also notes that the attenuation due to concrete-2 is greater than

150
the attenuation due to the concrete-1 (identical situation occurs
between the polyurethane-2 and polyurethane-1).
Finally, the assertion about the greater efficiency of open trenches
against trenches in-filled with concrete-1 has been evidenced
obtaining accelerations at different points located between the rail and
the trench and behind the trench. It is possible to state that, according
to the results obtained, the open trenches attenuate better than the
trenches in-filled with concrete-1 (due to the accelerations calculated
behind the trench are lower). On the contrary, the acceleration value
between the rail and the trench is significantly higher in the case of
open trenches than in the case of trenches in-filled with concrete-1.
Main contributions and research lines
The main contributions of this Thesis are identified with the small
advances that each one of the publications supposes with regard to
the previous state of the art. Furthermore, the study of these
contributions allows to outline future investigation lines about this
topic.
Related to the analytical modeling of generation-transmission
phenomenon of vibrations through the track, contained in chapter 1 of
the this PhD Thesis, the following contributions are discussed:
The first of them, already present in the previous papers of this
chapter, is related to the modeling of the rail as a Timoshenko beam.
Usually the rail was modeled as an Euler-Bernoulli beam, however,
this modeling made impossible to consider the deformations caused
by shear stresses, which can be important in secondary bending rail
phenomena.
Regarding the treatment of secondary bending of the rail, the study
has been particularized for the case of an axle located in the middle of
the span between two adjacent sleepers. The deflection of the rail,
theoretically calculated and appropriately treated, is introduced as "an
extra load to the model". Hence, in those track typologies where the
rail rests on discrete sleepers, an additional load is introduced to the
151
model, which is precisely the load caused by the secondary bending
of the rail.
A useful contribution for future works deals with the homogeneous
treatment of the different loads that can appear in a railway operation.
Usually it is talk about the quasi-static load, a load due to the dynamic
overload and loads due to the secondary bending of the rail.
Traditionally, the static load was modeled by the Zimmermann’s
method and the theory of Pandolfo. In Chapter 1 of this Thesis, this
load is treated as another harmonic whose amplitude matches with to
the axle load of the vehicle with zero frequency.
Finally, the publication included in Chapter 1 shows, in contrast to
previous publications, a modeling of the domain into five layers.
Certainly, this fact does not involve a substantial advance in the field,
but allows obtaining independent results in each layer (although it
involves more complex calculations).
Regarding to the investigation lines that are considered of interest,
linked to the work presented in Chapter 1 of the Thesis and previous
publications, it should be noted the approach of an analytical three-
dimensional model of generation-transmission-propagation of
vibrations in tunnels of circular section, using in this case a cylindrical
coordinates system. Additionally, the analysis of the validity of the
analytical model to certain frequency ranges, depending on the
modeling of the rail (according to Timoshenko or assuming the theory
of Euler-Bernoulli) is, without a doubt, very interesting.
In the numerical modeling of the phenomenon of generation-
transmission-propagation of railway vibrations contained in Chapter 2
of this PhD Thesis, it is emphasized the search of a balance between
computation time and accuracy of results. In this context, the main
methodological contributions are the following:
In the context of the use of a commercial software for the modeling of
the considered phenomenon, one of the treated problems is the
definition of the limits of the model. As chapter 2 and previous
paragraphs of this discussion demonstrate, these limits depend largely
on the frequency range to be analyzed. An interesting methodological
contribution in this field is to analyze how the boundary limits of the

152
model influence on the phenomenon to analyze and how, if any,
certain aspects have to be varied to avoid these influences. As
reflected in figure 3 of chapter 2, the vertical stiffness of the model
decreases in the boundaries vicinities. According to this circumstance,
in order to prevent the influence of this on the final results, it is
proposed to modify the value of the applied loads.
A verification which can be interesting for future works is to analyze
the possibility of replace some elements of meshing and calculation to
simpler ones. In the discussion of the Thesis, it has been outlined the
results and calculation time of the model by using the SOLID45
element in front of SOLID95. It demonstrates that, despite the
scientific literature encourages the use of SOLID95, the use of
SOLID45 produces satisfactory results with much less computation
time.
In this context, different points in which is needed to delve into are
emphasized in order to solve those facts that have not been
considered, at least with the desirable extension, in this Thesis.
One of these reflections refers to the influence of the constitutive
model of materials in the model results; particularly in the case of the
ground. This has to be modeled with an elastoplastic behavior with
Drucker -Prager yielding criterion. However, the numerical model
presented in chapter 2 assumes that the terrain behavior is linear
elastic due to the fact that in the case of small loads transmitted, as is
the case of a tram line, the elastic limit of the material is not exceeded.
The suitability of this simplification has been demonstrated in previous
paragraphs of this discussion. At this point, it is proposed to perform
the analysis of different railway systems in which the axle load, speed
or other aspects determine the accuracy of this simplification.
Another methodological aspect which should be more deeply
investigated is in the procedure of the load application in an
undeformed track. In this work, this process has been carried out
similar to the most consulted publications: passing a load and adding
together the results as many times as axles the vehicle has. However,
in order to check the validity of the simplification that has been
assumed, a test with the following features has been made: a section
of ballasted track is modeled by applying symmetry. The dimensions

153
of the model are: 46 meters length, 20 meters width and 4.5 meters
depth. The mesh size, in longitudinally direction, is 20 cm and an
element known as SOLID45 has been set. A load of 49 kN is applied
to each wheel, circulating at 28 Km/h speed. The results obtained by
passing a single load and applying superimposed loads and passing
the whole train simultaneously, are compared. Acceleration values on
sleepers are obtained, and the differences of magnitude and form of
the acceleration graphics hardly differ from each other. However the
computational time varies (in case of a single load step applying
superposition takes 2 hours and 10 minutes and in the case of full
load step, 5 hours and 45 minutes are consumed). The computer used
has a 4-core processor to 3.6 GHz and 32 GB RAM memory.
The numerical modeling presented in Chapter 2 of this Thesis has
been developed in a very basic design: a straight line without ramps or
gradients. Several authors have evidenced the considerable
differences in other types of designs. In this context, it is considered
very interesting to obtain a robust and simple model of the
phenomenon of generation-transmission-propagation in these
scenarios, in order to deepen in the analysis of the influence of the
design in the genesis of railway vibrations.
In chapter 2 of this PhD Thesis, the study of the effectiveness of
wave barriers in the attenuation of railway vibrations propagation
using the model created, is also collected. In this regard, the main
contribution of this analysis lies in demonstrating the utility of the
model in the simulation of the phenomena of refraction and reflection
experienced by the waves in their propagation through a certain type
of terrain. This has allowed comparing the effectiveness of different
types of trenches (width, depth, in-fill materials...) in a multi-layered
ground, showing the accuracy of the assumptions contained in the
scientific literature.
In this context it should be mentioned, as a methodological
contribution, the modeling of sheet piles in an open trench supported
by this mechanism. Indeed, as evidenced in Chapter 2, the open
trenches are more effective than any other trench, but have the
disadvantage of its low mechanical stability in granular soils, hence
the analysis of this type of trenches but stabilized with sheet piles.
154
Related to this fact, given the effectiveness and simplicity of the
"trench" as attenuator element of the propagation of vibrations in
consolidated railway environments, it has been decided to go further
in this investigation line, as in multi-layered terrains (chapter 2 of this
Thesis) as in non-layered terrains, in which the casuistry to consider is
much larger than in the first case.
As well as trenches, there are "less invasive" alternatives beginning to
be implemented as satisfactory attenuation elements of vibration
propagation. These are usually known as "vibration glasses", in
analogy with the sound glasses. The study of the type of materials,
arrangement of cylinders and location relative to the track is one of the
most interesting investigation lines outlined in this point.
In Chapter 3 of this PhD Thesis, using the model developed,
calibrated and validated in the previous chapter, two classic
pathologies of railway transport are simulated: wheel flat and rail
corrugation.
The main contribution of this chapter deals with the easiness of
implementation of these phenomena in the proposed model. After
calculating the excitation frequencies and dynamic overloads, two
different procedures have been designed to incorporate these
dynamic overloads to the model created in Chapter 2. The obtained
results show the accuracy of the method.
According to the results obtained in this chapter, the intention is to go
more deeply into already existing investigation lines from other
authors, such as:
Reflect on the effects of short-wave rail corrugation. Certainly, this
condition gives rise, keeping constant the other factors, to a higher
acceleration values and longer duration of the transient effects of the
response. These facts justify its importance. However, as it has been
stated in the discussion of this phenomenon, the smaller the
wavelength of the rail corrugation is, the smaller the mesh and
calculation element of the rail must be. This circumstance requires
searching again the balance between size/type of element and
coherent results.

155
To go more deeply into the existing methods in scientific literature
(experimental, analytical, numerical...) focused on
calculating/estimating/approximating the value of the dynamic
overload due to different vehicle and track pathologies. It is also
considered if there are important differences between them and how
these, if any, would affect the final results of the model globally
considered. This approach should be applied to different types of
railway operations.
Finally, and considering the subject of this Thesis from a global point
of view, the author has been working on it over the last two years (the
last paper that contains the Thesis was accepted on 4th December
2012), publishing four additional papers:
The first one is an experimental study that allows comparing the
damping capability of different tramway superstructures. Note how this
work can be a useful contribution to the design of new railway
superstructures, considering the vibratory phenomenon. Nevertheless,
it is not valid for analyzing the vibration damping in operating tracks
(aspect in which solutions such as trenches and/or vibration glasses
are useful). This paper is “Study of the mitigation of tram-induced
vibrations on different track typologies”, Journal of Vibroengineering
(ISSN 1392-8716). Volume 15. Pages: 2057 - 2075. 2013. Index JCR
2013. (Impact factor 0.660). Q3.
The second one contains interesting reflections when both
formulations are compared. The comparison considers aspects such
work domain, 2D versus 3D modeling, calculation of the solution in the
whole domain or only in some specific nodes, load application
formulation and frequency range under study. This work is “Railway
traffic induced vibrations: comparison of analytical and finite element
models”. Journal of Vibroengineering (ISSN 1392-8716). Volume 15.
Pages: 1701-1710. 2013. Index JCR 2013. (Impact factor 0.660). Q3.
The third contains the methodological concerns that have arisen
during the numerical modeling of the phenomenon globally
considered, such as influence of the mesh size in the accuracy of the
results and computation time, validity of the load step method (isolated
load superimposed against the passage of the whole train), influence
of the type of mesh element and considerations of constitutive model

156
of materials. It is tittled as "Computational considerations of 3-D finite
element method models of vibration prediction in ballasted railway
tracks", and is publised in Journal of Vibroengineering (ISSN 1392-
8716). Volume 16. Pages: 1709-1722. 2014. Index JCR 2013. (Impact
Factor 0.660). Q3.
The latest work shows the influence of the type of sleeper in the
generation and transmission of vibrations of a ballasted track in an
curved track area, and it is titled as "Comparison of the effect of
different typologies and sleeper railway track layout on vibrations"
having been published in Latin American Journal of Solids and
Structures (ISSN 1679-7817). Volume 11. Issue 12. Pages: 2241-
2254. 2014. Index JCR 2013. (Impact Factor 1.254). Q2
Parallel to the study of vibrations as a railway externality and given the
importance of knowing the deformed geometry of the track (as for the
analysis of vibrations as for the establishment of maintenance
procedures, among others) some years ago, it was decided to begin a
new investigation line in order to obtain the deformed track profile. It
was achieved by placing triaxial accelerometers on the unsprung
masses of commercial railway vehicles. The results of this research
are found in the following publications:
"Determination of Rail Vertical profile through inertial methods" (2011),
"Development of a system to obtain vertical track geometry measuring
axle-box accelerations from in-service trains" (2012) and “Design and
validation of a railway inspection system to detect lateral track
geometry defects based on axle-box accelerations registered from in-
service trains” (2014)

157
References
Ahmad, S., & Al-Hussaini, T. M. (1991). Simplified design for vibration
screening by open and in-filled trenches. Journal of Geotechnical
Engineering , 117 (1), 67-88.
Anacleto, S. (2009). Modelización de la interacción vía-tranvía. PhD
Thesis. Universitat Politècnica de Catalunya. Escola Tècnica Superior
d'Enginyers de Camins, Canals i Ports de Barcelona. Departamento
de Infraestructura del Transporte y del Territorio.
Andersen, L., & Jones, C. J. (2001). Three-Dimensional
Elastodynamic Analysis Using Multiple Boundary Element Domains.
ISVR Technical Memorandum.
Andersen, L., & Nielsen, S. R. (2005). Reduction of ground vibration
by means of barriers or soil improvement along a railway track. Soil
Dynamics and Earthquake Engineering , 25 (7), 701-716.
Areias, A. S. (2007). Design of high-speed track bed with granular and
bituminous layers using elastoplastic finite elements models.
Arslan, Y. Z., Adli, M. A., Akan, A., & Baslo, M. B. (2010). Prediction of
externally applied forces to human hands using frequency content of
surface EMG signals. Computer methods and programs in
biomedicine , 98 (1), 36-44.
Auersch, L. (2005). The excitation of ground vibration by rail traffic:
theory of vehicle track soil interaction and measurements on high
speed lines. Journal of Sound and Vibration , 284 (1), 103-132.
Barkan, D. D. (1962). Dynamics of Bases and Foundations. New York:
McGraw-Hill.
Beskos, D. E., Dasgupta, B., & Vardoulakis, I. G. (1986). Vibration
isolation using open or filled trenches. Computational Mechanics , 1
(1), 43-63.
Çelebi, E., Fırat, S., Beyhan, G., Çankaya, I., Vural, I., & Kırtel, O.
(2009). Field experiments on wave propagation and vibration isolation

158
by using wave barriers. Soil Dynamics and Earthquake Engineering ,
29 (5), 824-833.
Cirianni, F., Leonardi, G., Scopelliti, F., & Buonsanti, M. (2009). Study
of the barriers for the mitigation of railway vibrations. The Sixteenth
International Congress on Sound and Vibration, (págs. 5-9). Kraków.
Connolly, D., Giannopoulos, A., & Forde, M. C. (2013). Numerical
modelling of ground borne vibrations from high speed rail lines on
embankments. Soil Dynamics and Earthquake Engineering , 46, 13-
19.
Dahlberg, T. (1995). Vertical dynamic train/track interaction-verifying a
theoretical model by full-scale experiments. Vehicle System Dynamics
, 24 (sup1), 45-57.
Ekevid, T., & Wiberg, N. E. (2002). Wave propagation related to high-
speed train: a scaled boundary FE-approach for unbounded domains.
Computer Methods in Applied Mechanics and Engineering , 191 (36),
3947-3964.
Fomento, M. d. (1999). Recomendaciones para el proyecto de
plataformas ferroviarias. Madrid: Servicio de publicaciones del
Ministerio de Fomento.
Fonseca Teixeira, P. (2003). Contribución a la reducción de los costes
de mantenimiento de vías de alta velocidad mediante la optimización
de su rigidez vertical. PhD Thesis. Universitat Politècnica de
Catalunya. Escola Tècnica d’Enginyers de Camins, Canals y Ports de
Barcelona.
Fuyuki, M., & Matsumoto, Y. (1980). Finite difference analysis of
Rayleigh wave scattering at a trench. Bulletin of the Seismological
Society of America , 70 (6), 2051-2069.
Gallego, I., Sánchez-Cambronero, S., & Rivas, A. (2012). Criteria for
Improving the Embankment-Structure Transition Design in Railway
Lines. InTech.
Graff, K. F. (1975). Wave Motion in Elastic Solids. Oxford: Courier
Dover Publications.

159
Griffin, M. J. (1990). Handbook of Human Vibration. San Diego:
Academic Press INC.
Gutowski, T. G., & Dym, C. L. Propagation of ground vibration: A
review. Journal of Sound and Vibration , 49 (2), 179-193.
Hall, L. (2003). Simulations and analyses of train-induced ground
vibrations in finite element models. Soil Dynamics and Earthquake
Engineering , 23 (5), 403-413.
Heckl, M., Hauck, G., & Wettschureck, R. (1996). Structure borne
sound and vibration from rail traffic. Journal of sound and vibration ,
193 (1), 175-184.
Hertz, H. (1896). On the contact of elastic solids. Hertz’s
Miscellaneous Papers.
Hirano, M. (1972). Theoretical analysis of variation of wheel load.
Railway Technical Research Institute, Quarterly Reports , 13 (1), 42-
44.
Hung, H. H., Yang, Y. B., & Chang, D. W. (2004). Wave barriers for
reduction of train induced vibrations in soils. Journal of geotechnical
and geoenvironmental engineering , 130 (12), 1283-1291.
Johansson, A. (2006). Out-of-round railway wheels - assessment of
wheel tread irregularities in train traffic. Journal of Sound and Vibration
, 293 (3-5), 795-806.
Johansson, A., & Nielsen, J. C. (2003). Out-of-round railway wheels -
wheel-rail contact forces and track response numerical simulations.
Journal of Rail and Rapid Transit , 217 (2), 135-146.
Jones, C. J., Sheng, X., & Petyt, M. (2000). Simulations of ground
vibration from a moving harmonic load on a railway track. Journal of
Sound and Vibration , 231 (3), 739-751.
Ju, S. H. (2004). Three-Dimensional Analyses of Wave Barriers for
Reduction of Train-Induced Vibrations. Journal of geotechnical and
geoenvironmental engineering , 130 (7), 740-748.

160
Kalker, J. J. (1990). Three Dimensional Elastic Bodies in Rolling
Contact. Dordrecht: Kluwer Academic Publishers.
Knothe, K. L., & Grassie, S. L. (1993). Modelling of railway track and
vehicle-track interaction at high frequencies. Vehicle system dynamics
, 22 (3-4), 209-262.
Koziol, P., Mares, C., & Esat, I. (2008). Wavelet approach to vibratory
analysis of surface due to a load moving in the layer. International
Journal of Solids and Structures , 45 (7), 2140-2159.
Kurzweil, L. G. (1979). Ground-borne noise and vibration from
underground rail systems. Journal of sound and vibration , 66 (3), 363-
370.
López Pita, A. (2006). Infraestructuras Ferroviarias. Ediciones UPC.
Marburg, S. (2002). Six boundary elements per wavelength: is that
enough? Journal of Computational Acoustics , 10 (01), 25-51.
May, T. W., & Bolt, B. A. (1982). The effectiveness of trenches in
reducing seismic motion. Earthquake Engineering & Structural
Dynamics , 10 (2), 195-210.
Melis, M. (2008). Introduction to vertical dynamics of railway tracks
and to digital signals in trains. Madrid: Universidad Politécnica de
Madrid.
Melke, J. (1988). Noise and vibration from underground railway lines:
Proposals for a prediction procedure. Journal of Sound and Vibration ,
120 (2), 391-406.
Metrikine, A. V., & Vrouwenvelder, A. C. (2000). Surface ground
vibration due to a moving train in a tunnel: two-dimensional model.
Journal of Sound and vibration , 234 (1), 43-66.
Murillo, C., Thorel, L., & Caicedo, B. (2009). Ground vibration isolation
with geofoam barriers: Centrifuge modeling. Geotextiles and
Geomembranes , 27 (6), 423-434.

161
Nielsen, J. C., & Igeland, A. (1995). Vertical dynamic interaction
between train and track influence of wheel and track imperfections.
Journal of Sound and Vibration , 187 (5), 825-839.
Otero, J. (2009). Study of rail vehicle dynamics in curved tracks. Part
I: Wheel-rail contact analysis. Revista Colombiana de Tecnolgías de
Avanzada , 2 (14), 48-53.
Polach, O. (2000). A fast wheel-rail forces calculation computer code.
Vehicle System Dynamics , 33, 728-739.
Real, J. I., Zamorano, C., Hernández, C., Comendador, R., & Real, T.
(2014). Computational considerations of 3-D finite element method
models of railway vibration prediction in ballasted tracks. Journal of
Vibroengineering , 16, 1709-1722.
Real, J., Martínez, P., Montalbán, L., & Villanueva, A. (2011).
Modeling vibrations caused by tram movement on slab track line.
Mathematical and Computer Modelling , 54 (1), 280-291.
Richart, F. E., Hall, J. R., & Woods, R. D. (1970). Vibration of Soils
and Foundations. Berkshire: Prentice-hall.
Salvador, P., Real, J., Zamorano, C., & Villanueva, A. (2011). A
procedure for the evaluation of vibrations induced by the passing of a
train and its application to real railway traffic. Mathematical and
Computer Modelling , 53 (1), 42-54.
Schramm, G. (1961). Permanent way technique and permanent way
engineering. Darmstadt, Germany: Otto Elsner Verlag.
Segol, G., Abel, J. F., & Lee, P. C. (1978). Amplitude reduction of
surface-waves by trenches. Journal of the Engineering Mechanics
Division , 104 (3), 621-641.
Sheng, X., Jones, C. J., & Petyt, M. (1999). Ground vibration
generated by a harmonic load acting on a railway track. Journal of
Sound and Vibration , 225 (1), 3-28.
Sheng, X., Jones, C. J., & Thompson, D. J. (2003). A comparison of a
theoretical model for quasi-statically and dynamically induced

162
environmental vibration from trains with measurements. Journal of
Sound and Vibration , 267 (3), 621-635.
Sheng, X., Jones, C. J., & Thompson, D. J. (2006). Prediction of
ground vibration from trains using the wavenumber finite and
boundary element methods. Journal of Sound and Vibration , 293 (3),
575-586.
Takemiya, H. (2001). Ground vibrations alongside tracks induced by
high-speed trains: prediction and mitigation, in Noise and Vibration
from High-Speed Trains. Noise and vibration from high-speed trains ,
347.
Thompson, D. (2009). Railway noise and vibration: mechanisms,
modelling and means of control.
Timoshenko, S. P. (1981). Teoría de las Estructuras. Madrid: Urmo
Ediciones.
Verhas, H. P. (1979). Prediction of the propagation of train-induced
ground vibration. Journal of Sound and Vibration , 66 (3), 371-376.
Wass, G. (1972). Linear Two-Dimensional Analysis of Soil Dynamic
Problems in Semi-Infinite Layered Media. University of California,
Berkeley.
Woods, R. D. (1967). Screening of Elastic Surface Waves by
Trenches. Journal of Soil Mechanics Division , 951-979.
Yan, W., & Fischer, F. D. (2000). Applicability of the Hertz contact
theory to rail-wheel contact problems. Archive of applied mechanics ,
255-268.
Yang, J., Wang, K., & Chen, H. (2012). Characteristics of wheel-rail
vibration of the vertical section in high-speed railways. Journal of
Modern Transportation , 20 (1), 10-15.
Yang, Y. B., & Hung, H. H. (1997). A parametric study of wave
barriers for reduction of train-induced vibrations. International Journal
for Numerical Methods in Engineering , 40 (20), 3729-3747.

163
Yang, Y. B., & Hung, H. H. (2008). Soil vibrations caused by
underground moving trains. Journal of geotechnical and
geoenvironmental engineering , 134 (11), 1633-1644.
Zou, J. H., Feng, W. X., & Jiang, H. B. (2011). Dynamic response of
an embedded railway track subjected to a moving load. Journal of
Vibroengineering , 13 (3), 544-551.

164

165
CONCLUSIONS

166

167
Next, the most relevant conclusions of this PhD Thesis are introduced,
which deal with the behavior of the different modeling of the physical
phenomenon under study.
The uniform treatment of different types of loads presented in chapter
1 of this Thesis provides a great versatility to the analytical models
concerned, due to almost all types of loads can be expressed as a
harmonic function defined by a characteristic magnitude and a
particular angular frequency.
The implementation of the analytical and numerical models throughout
this Thesis, allows emphasizing the strengths and weaknesses of
each one. Thus, the study of wave barriers introduced is only possible
with a numerical model that considers the phenomenon of vibrations
propagation through the ground. Instead, the study of rail corrugation
and wheel flats can be carried out as with a numerical model (this has
been presented in Chapter 3 of the Thesis) as with an analytical
model, using the uniform treatment of loads exposed in the first
conclusion.
The frequency range to study is a very limiting aspect if a numerical
model is considered, due to it affects to the longitudinal dimension of
the model and to the elements size. Thus, a wide range would imply a
considerable longitudinal dimension of the model and a minimum
dimension of the elements, which would suppose a high computation
time. In the studied case proposed in this Thesis, a frequency range
from 2 Hz to 50 Hz has been set, knowing that the real range of
human disease includes a range from 0.5 Hz to 80 Hz. This limitation
does not exist in the analytical models.
The consideration of the train speed involves different complexity
depending on the model type. Thus, in case of analytical models, the
speed is an input and its consideration is immediate. Nevertheless, in
the case of numerical models, due to each one is configured for a
specific circulation speed, the models must be readjusted as during
the meshing process as during the loads implementation process. In
this Thesis, the circulation speed adopted in chapter 2 is 30 km/h.
Hence, if it was necessary to study a higher speed, the residence time
of each force on each node (loadstep) would have to be decreased.

168
Furthermore, it would be also necessary to modify the number of
substeps for each load step.

169
APPENDIX 1

170

171
This appendix contains three aspects related to the analytical
modeling of the physical phenomenon of generation and transmission
of vibrations, contained in chapter 1 of the Doctoral Thesis.
Firstly, the Inverse Fourier Transform development referenced in
chapter 1 of the Thesis is outlined; then, several parameters that have
been used in the modeling and partially shown at the end of chapter 1
of the Doctoral Thesis are collected, and finally, two spectra obtained
as intermediate or final results of the mathematical process are
shown.

172
1. Inverse Fourier Transform
Given the complexity of solving the problem in space and time
domain, it is transformed to the wavenumber and frequency domain
by the Fourier Transform:
(1)
Once the problem has been solved and displacements have been
obtained in each one of the layers of the domain, these are returned
to the space and time domain by the Inverse Fourier Transform:
(2)
Moreover, expressing the Inverse Fourier Transform based on cosines
and performing some calculations (see Koziol (2008)) the double
integral can be transformed as follows:
(3)
Where is the frequency considered for each of the harmonics in
which the dynamic forces have been decomposed and is the train
speed.
Discretizing the variable , the above integral can be converted into a
sum as follows:

173
(4)
The discretization of requires enough resolution to avoid the loss of
relevant information of the Fourier spectrum. The values of should
be ranged between and 300 because of small values can
generate singularities in the problem when it is calculated with
commercial software, whereas if the values of the wave number are
too large, the solution can present convergence problems.
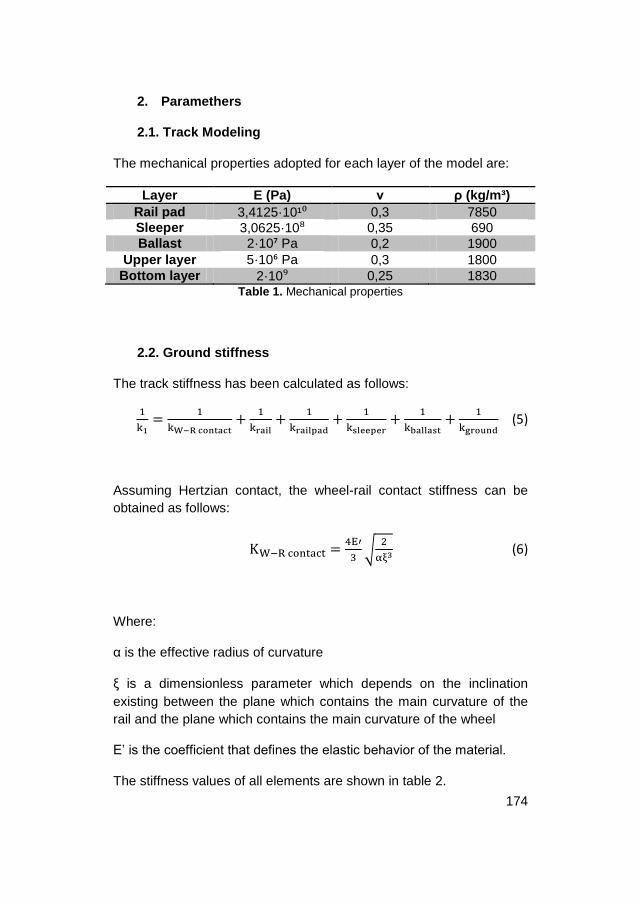
174
2. Paramethers
2.1. Track Modeling
The mechanical properties adopted for each layer of the model are:
Layer E (Pa) ν ρ (kg/m³)
Rail pad 3,4125·10¹⁰ 0,3 7850 Sleeper 3,0625·10⁸ 0,35 690
Ballast 2·10⁷ Pa 0,2 1900
Upper layer 5·10⁶ Pa 0,3 1800
Bottom layer 2·10⁹ 0,25 1830 Table 1. Mechanical properties
2.2. Ground stiffness
The track stiffness has been calculated as follows:
(5)
Assuming Hertzian contact, the wheel-rail contact stiffness can be
obtained as follows:
(6)
Where:
is the effective radius of curvature
is a dimensionless parameter which depends on the inclination
existing between the plane which contains the main curvature of the
rail and the plane which contains the main curvature of the wheel
E’ is the coefficient that defines the elastic behavior of the material.
The stiffness values of all elements are shown in table 2.
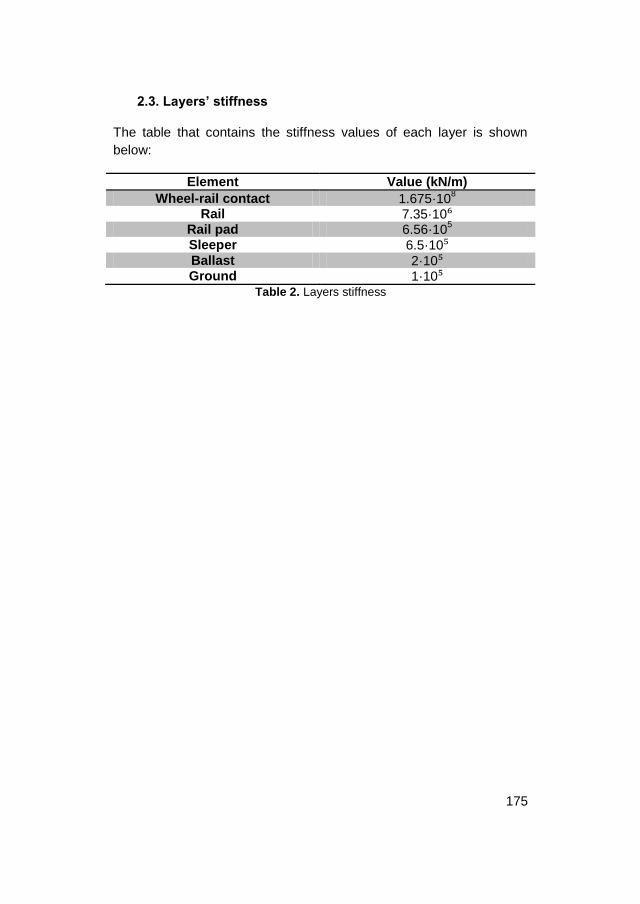
175
2.3. Layers’ stiffness
The table that contains the stiffness values of each layer is shown
below:
Element Value (kN/m)
Wheel-rail contact 1.675·108
Rail 7.35·10⁶ Rail pad 6.56·10
5
Sleeper 6.5·10⁵ Ballast 2·10⁵ Ground 1·10⁵
Table 2. Layers stiffness

176
3. Time history and spectrum of irregularities and forces
3.1. Time history (or rail profile) and spectrum (in third
octave) of the irregularities.
Below, in Figure 1 (left), the rail profile and its irregularities are shown.
Moreover, in Figure 1 (right), the spectrum of the mentioned
irregularities in third octave is shown. The model heeds the effect of
these irregularities by the introduction of dynamic overloads.
Fig. 1. Profile (left) and spectrum (right) of irregularities
3.2. Time history and spectrum (in third octave) of the forces.
The forces that excite the model in time domain (left) and its spectrum
in third octave (right) are shown below in figure 2.
perfil
-8.5
-8.0
-7.5
-7.0
-6.5
-6.0
-5.5
-5.0
-4.5
-4.0
-3.5
-3.0
-2.5
-2.0
-1.5
-1.0
-0.5
0.0
0.5
mm
0 10 20 30 40 50 60
m
TercioOctavaPerfil
20
40
60
80
100
120
140
160
180
200
220
240
260
280
300
320
340
360
380
400
420
µm
63 125 250 500 1 2 4 8 16 31.5 63 125
mHz Hz

177
Fig. 2. Excitation forces (left) and its spectrum (right)
ftotal
-40
-30
-20
-10
0
10
20
30
40
50
60
70
80
90
kN
0 1 2 3 4 5 6 7 8 9
s
TercioOctavaFtotal
0.0
0.5
1.0
1.5
2.0
2.5
3.0
3.5
4.0
4.5
5.0
5.5
6.0
6.5
7.0
kN
63 125 250 500 1 2 4 8 16 31.5 63 125
mHz Hz

178

179
APPENDIX 2

180

181
This appendix contains three aspects related to the modeling of
different types of trenches, which are considered as attenuator
elements of the propagation of railway vibrations.
Thus, the first reflection alludes to the sheet pile figure. Then, two
vibration accelerations spectra with and without trenches are
presented and, finally, the attenuation of vibration amplitude versus
distance is represented.

182
1. Acceleration spectra with and without different wave
barriers
The accelerograms obtained from the numerical models have been
shown in time domain until this moment. These accelerograms can be
represented in frequency domain by the Fourier Transform (FFT)
using the commercial software Mathematica, which allows observing
the dominant frequencies.
The spectra of the data calculated in 2 points with the model of an
open trench of 2 meters depth are shown below. The first one is
located at 0.3 meters from the rail (before the trench) and the other
one is located at 2.5 meters from the rail, once the wave has traversed
the trench.
Fig. 1. Acceleration spectrum at 0.3 meters from the rail

183
Fig. 2. Acceleration spectrum at 2.5 meters from the rail
Note that the maximum frequency is set around 16 Hz, which is due to
the discrete load advance throughout the rail. This value depends on
the distance between two consecutive nodes and on the load speed,
and is determined by the following expression:
(1)
Where is the frequency induced by the discrete load step. This
frequency is fictitious and intrinsic to the resolution method employed.
Therefore, its presence is inevitable and its value will be higher or
lower depending on the parameters mentioned above.

184
2. Amplitudes attenuation versus distance
The following figures show an example of the maximum peaks
attenuation versus the distance to the external side of the elastomer.
These charts are calculated for two different types of trenches, an in-
filled trench and an open trench. Specifically, it is represented the
open trench fixed with sheet piles and the concrete in-filled trench. In
both cases, the depth is set to two meters.
It is observed higher values for the case of an open trench with sheet
piling in the stretch between rail and trench. Zero slope is observed,
even a slight increase as we approach to the trench, due to the
rebound of waves on the walls of the trench. But once the trench is
traversed, the vibrations are close to zero. In contrast, for the trench
filled with concrete, the values near the rail are much lower than in the
previous case, even more than 50%, with a progressive attenuation.
However, once the trench is exceeded, the values, although being
small, are greater than in the case of an open trench.
Fig. 3. Attenuation with a sheet piling trench
-1,0
-0,5
0,0
0,5
1,0
0 1 2 3 4 5 6 a (m
/s2
)
Distance to the rail (m)

185
Fig. 4. Attenuation with a trench filled with concrete
-0,6
-0,4
-0,2
0,0
0,2
0,4
0,6
0 1 2 3 4 5 6 a (m
/s2
)
Distance to the rail(m)

186
3. The figure of a sheet pile
3.1 Definition
Sheet piles are thin structures that, affixed to its bottom, provide the
necessary support to the natural ground when its natural mechanical
properties cannot ensure the structural stability.
These elements are made of different materials, among which steel,
wood and concrete stand out. The choice of the material and
construction method varies depending on the necessities in each
case.
3.2 Relation with the Thesis
The main problem existing during the construction of an open trench is
the structural stability of the excavation walls. The possible existence
of low cohesive materials, coupled with the necessity to provide a
durable structure in time, makes absolutely necessary the use of a
structure that provides support.
This paper applies the theoretical development of finite element model
to a real case such as the attenuation of railway vibrations by wave
barriers. For this reason, not only a theoretical solution is performed,
but also, from knowledge of the art, a feasible solution that allows
implementing an open trench in both model and reality is provided.
3.3 Justification
The influence of the sheet piles material on the vibrations propagation
has not been considered. Its low thickness and its contiguity to the
free surface make irrelevant the internal damping (which is determined
by its mechanical properties) that may provide compared to the rest of
the parameters studied (depth and width of trench).

187
To take into account the effect that the sheet pile has on the
propagation of vibrations, it has been restricted the horizontal
movement of all nodes located on the walls of the open trench in the
finite element model. Thus, the boundary conditions provided by the
sheet piles are simulated, no being necessary to include this element
in the model.

188

189
APPENDIX 3

190

191
This appendix contains three aspects related to the chapter 3 of this
Doctoral Thesis. The first one is aimed to explain the concept of
"residence time" used in the modeling of wheel flat phenomenon; the
second shows some spectra obtained in the mathematical
development of the problem and, finally, the third point shows a
correction of the modeling of the dynamic forces generated by both
rail corrugations shown in the cited chapter.
192
1. Residence time
It is considered that a wheel flat has two corners. When the first corner
contacts the rail, the contact area is reduced because of it is a corner.
By reducing the contact area, the force transmitted to the rail
increases and appears a first peak in a graph of transmitted force vs.
time. From this point, the wheel begins to swing on the first corner.
When the second corner of the wheel flat contacts the rail, a second
peak in the graph force transmitted vs. time appears. The magnitude
of this peak will be greater because of it is an impact.
Due to the wheel flat, a new frequency generated by the repetitive
impact will appear. This frequency is calculated as the inverse of the
time interval between impacts, which matches with the quotient of the
train speed and the wheel perimeter. In addition, another frequency
associated with phenomenon due to the time elapsed between the
first and second peak appears, which is the inverse of the so called
"residence time".
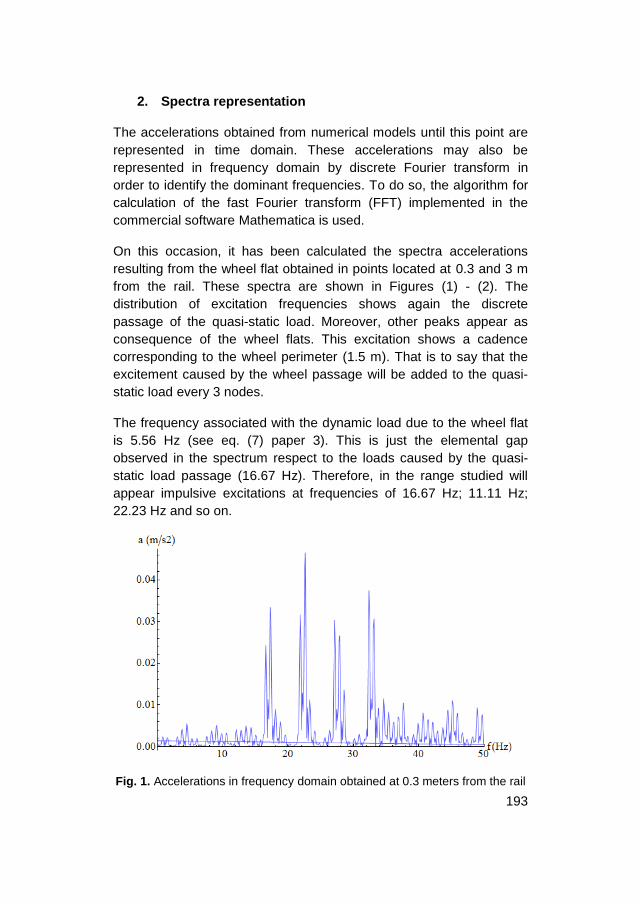
193
2. Spectra representation
The accelerations obtained from numerical models until this point are
represented in time domain. These accelerations may also be
represented in frequency domain by discrete Fourier transform in
order to identify the dominant frequencies. To do so, the algorithm for
calculation of the fast Fourier transform (FFT) implemented in the
commercial software Mathematica is used.
On this occasion, it has been calculated the spectra accelerations
resulting from the wheel flat obtained in points located at 0.3 and 3 m
from the rail. These spectra are shown in Figures (1) - (2). The
distribution of excitation frequencies shows again the discrete
passage of the quasi-static load. Moreover, other peaks appear as
consequence of the wheel flats. This excitation shows a cadence
corresponding to the wheel perimeter (1.5 m). That is to say that the
excitement caused by the wheel passage will be added to the quasi-
static load every 3 nodes.
The frequency associated with the dynamic load due to the wheel flat
is 5.56 Hz (see eq. (7) paper 3). This is just the elemental gap
observed in the spectrum respect to the loads caused by the quasi-
static load passage (16.67 Hz). Therefore, in the range studied will
appear impulsive excitations at frequencies of 16.67 Hz; 11.11 Hz;
22.23 Hz and so on.
Fig. 1. Accelerations in frequency domain obtained at 0.3 meters from the rail
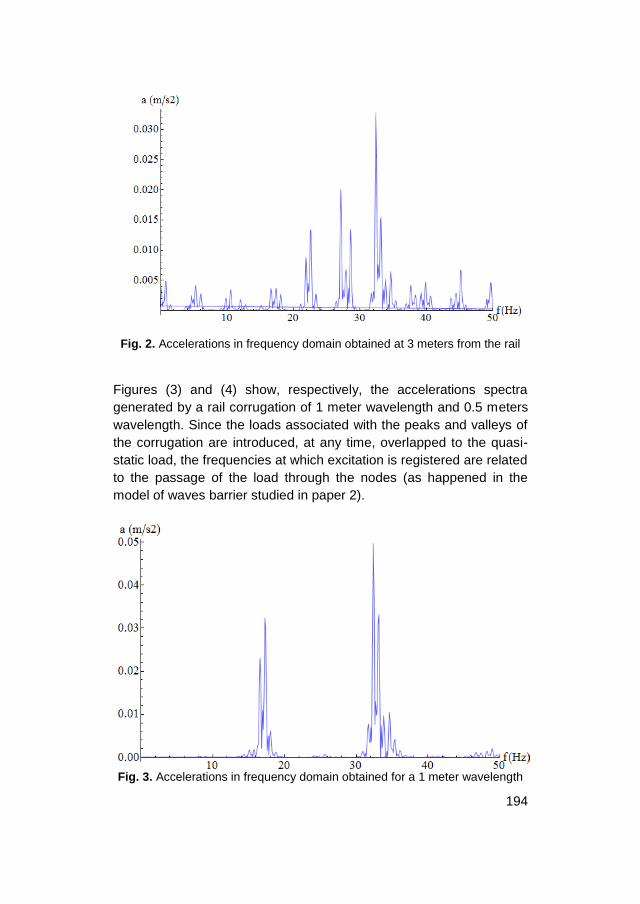
194
Fig. 2. Accelerations in frequency domain obtained at 3 meters from the rail
Figures (3) and (4) show, respectively, the accelerations spectra
generated by a rail corrugation of 1 meter wavelength and 0.5 meters
wavelength. Since the loads associated with the peaks and valleys of
the corrugation are introduced, at any time, overlapped to the quasi-
static load, the frequencies at which excitation is registered are related
to the passage of the load through the nodes (as happened in the
model of waves barrier studied in paper 2).
Fig. 3. Accelerations in frequency domain obtained for a 1 meter wavelength

195
Fig. 4. Accelerations in frequency domain obtained for a 0.5 meters
wavelength

196
3. Dynamic forces due to rail corrugation
In chapter 3 of the Thesis, two cases of rail corrugation are shown.
Both are characterized by an amplitude of 0.0005 meters and in both
cases it is assumed that the railway vehicle is circulating at a speed of
30 km / h. The difference between them lies in the value of the
wavelength: a wavelength of 1 meter is set in the first case and 0.5
meters is set in the second case.
Any track or vehicle defect generates a dynamic overload (defined by
its magnitude and frequency) that must be taken into account during
the loads application to the model. The calculation of this overload has
been conducted with the model of quarter car (shown in figure 5 of
chapter 3 of the Thesis).
The figure 6 of chapter 3 of the Thesis aims to represent the dynamic
overload in the first case studied (corrugation wavelength of 1 meter,
amplitude of 0.0005 meters and 30 km/h speed). The figure must be
replaced by the following graphic:
Fig. 5. Dynamic forces on the rail due to a rail corrugation of λ=1m
Analogously, figure 7 of chapter 3 of the Thesis aims to represent the
dynamic overload in the second case studied (corrugation wavelength

197
of 0.5 meters, amplitude of 0.0005 meters and 30 km/h speed). The
figure must be replaced by the following graphic:
Fig. 6. Dynamic forces on the rail due to a rail corrugation of λ=0.5m.
At this point it is necessary to reflect on the influence of the
wavelength and amplitude of rail corrugation as well as the train
speed on the numerical value and frequency of the dynamic overloads
obtained.
Thus, for fixed amplitude and constant speed, the decreasing of the
wavelength involves a considerable increase in the value of the
dynamic overload and an increase of the excitation frequency (which
is in accordance with the wavelength of the defect and the train
speed).
Given a particular rail corrugation (defined by its wavelength and
amplitude), as the train speed grows, the frequency and the numerical
value of the dynamic overload are also increased.
Finally, if the amplitude of the rail corrugation is modified, keeping
constant the wavelength and speed, a variation of the same
magnitude in the value of the dynamic overload takes place. However,

198
the frequency of dynamic overload is not affected by changes in the
amplitude of the defect.
In short, the numerical value of the exciting force increases with the
growth of the circulation speed, with the growth of the amplitude of the
corrugation and with the decrease of the wavelength of the defect. In
contrast, the frequency of the exciting force increases with the growth
of the circulation speed and with the decrease of the wavelength of
the defect; not being affected by its amplitude.
Since the dynamic overloads generated by the rail corrugations
studied have been modified, each of the new situations must be
simulated again. The final load that must be applied to the model is
the composition of the static load and the dynamic overload due to
each case. The accelerograms calculated by the model, for both
studied cases and at different distances from the rail, are:
Fig. 7. Accelerogram calculated in a track with no defects (black) and in a
track with rail corrugation of λ=1m (blue) at 0.3 meters from the external side
of the rail.

199
Fig. 8. Accelerogram calculated in a track with no defects (black) and in a
track with rail corrugation of λ=1m (blue) at 3 meters from the external side of
the rail.
The two figures above have to replace the figure 10 of chapter 3 of the
Thesis.
Proceeding similarly with the second case study, the following results
are obtained.
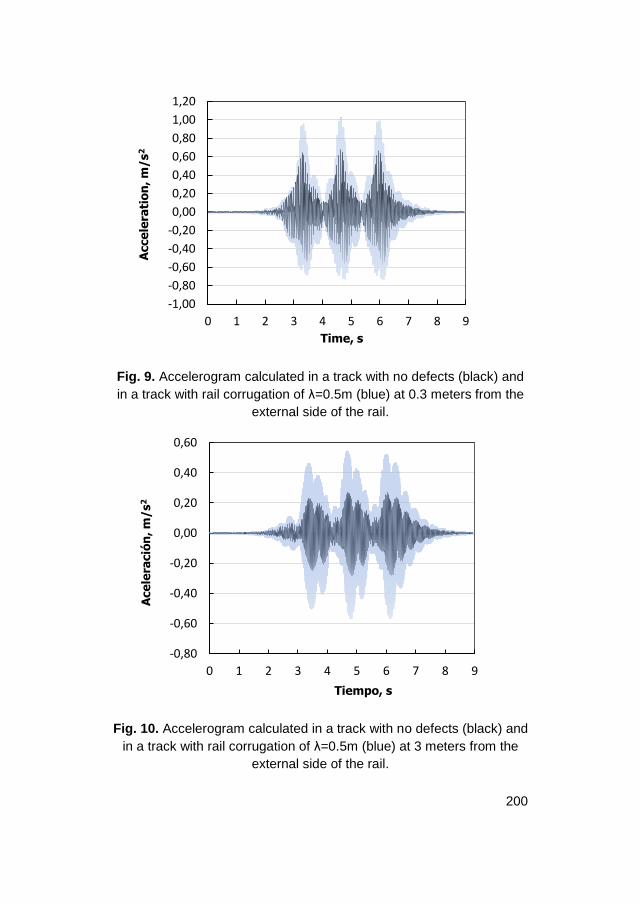
200
Fig. 9. Accelerogram calculated in a track with no defects (black) and
in a track with rail corrugation of λ=0.5m (blue) at 0.3 meters from the
external side of the rail.
Fig. 10. Accelerogram calculated in a track with no defects (black) and
in a track with rail corrugation of λ=0.5m (blue) at 3 meters from the
external side of the rail.
-1,00
-0,80
-0,60
-0,40
-0,20
0,00
0,20
0,40
0,60
0,80
1,00
1,20
0 1 2 3 4 5 6 7 8 9
Acce
lera
tio
n, m
/s
2
Time, s
-0,80
-0,60
-0,40
-0,20
0,00
0,20
0,40
0,60
0 1 2 3 4 5 6 7 8 9
Ace
lera
ció
n, m
/s
2
Tiempo, s

201
Analogously, the two figures above have to replace the figure 11 of
chapter 3 of the Thesis.
Note that if the wavelength is 0.5 meters, the accelerations calculated
at 0.3 meters from the rail (maximum peak = 1 m/s2) are higher than
those obtained for a wavelength of 1 meter (maximum peak = 0.7
m/s2). In both cases, obviously, the maximum peak accelerations
calculated at 3 meters from the rail are lower due to the attenuation
capability of ground existing in the vicinities of the track.


![of use of the elements plates, shells, [] This · planes (modelization plates) or curve (modelization shells). The modelizations of grids intervene for the numerical modelization](https://static.fdocuments.in/doc/165x107/5c12dc2e09d3f2557b8c083e/of-use-of-the-elements-plates-shells-planes-modelization-plates-or-curve.jpg)
