Contrasting responses of terrestrial ecosystem production ... · Contrasting responses of...
8
Biogeosciences, 12, 549–556, 2015 www.biogeosciences.net/12/549/2015/ doi:10.5194/bg-12-549-2015 © Author(s) 2015. CC Attribution 3.0 License. Contrasting responses of terrestrial ecosystem production to hot temperature extreme regimes between grassland and forest Y. Zhang 1 , M. Voigt 1 , and H. Liu 2 1 Institute for Space Sciences, Freie Universität Berlin, 12165 Berlin, Germany 2 Changjiang River Scientific Research institute, Changjiang Water Resources Commission, 430010 Wuhan, China Correspondence to: Y. Zhang ([email protected]) Received: 7 March 2014 – Published in Biogeosciences Discuss.: 28 April 2014 Revised: 12 November 2014 – Accepted: 2 December 2014 – Published: 29 January 2015 Abstract. During the past several decades, observational data have shown a faster increase in hot temperature ex- tremes than the change in mean temperature. Increasingly high extreme temperatures are expected to affect terrestrial ecosystem function. The ecological impact of hot extremes on vegetation production, however, remains uncertain across biomes in natural climatic conditions. In this study, we in- vestigated the effects of hot temperature extremes on vege- tation production by combining the MODIS enhanced vege- tation index (EVI) data set and in situ climatic records dur- ing the period 2000 to 2009 from 12 long-term experimen- tal sites across biomes and climate. Our results show that higher mean annual maximum temperatures (T max ) greatly reduced grassland production, and yet enhanced forest pro- duction after removing the effect of precipitation. The rel- ative decrease in vegetation production was 16 % for arid grassland and 7 % for mesic grassland, and the increase was 5 % for forest. We also observed a significantly positive rela- tionship between interannual aboveground net primary pro- duction (ANPP) and T max for the forest biome (R 2 = 0.79, P< 0.001). This line of evidence suggests that hot tem- perature extremes lead to contrasting ecosystem-level re- sponses of vegetation production between grassland and for- est biomes. Given that many terrestrial ecosystem models use average daily temperature as input, predictions of ecosystem production should consider such contrasting responses to in- creasingly hot temperature extreme regimes associated with climate change. 1 Introduction The observed global temperature showed a warming of 0.85 ◦ C (0.65 to 1.06 ◦ C) over the period of 1880 to 2012, and the number of warm days and nights has increased at the global scale (IPCC, 2013). Future temperature is expected to continue to warm more rapidly over land than ocean, and there will be more frequent hot and fewer cold temper- ature extremes over most land area (IPCC, 2013). Terres- trial ecosystems are strongly impacted by climate and cli- mate change (Nemani et al., 2003), and hence this trend to- wards hot temperature extremes would have important con- sequences on terrestrial ecosystems (IPCC, 2012). Numerous modeling and observational climate warming studies have shown the general enhancement of vegetation growth or in- creases in vegetation greenness in northern terrestrial ecosys- tems (e.g., Keeling, et al., 1996; Myneni, et al., 1997; Zhou et al., 2001; Neigh et al, 2008; Wu et al., 2011). However, knowing the general response of ecosystems tells us little about how the ecosystem in a particular location will respond or how different ecosystem responds to hot temperature ex- tremes. For example, Peng et al. (2013) recently reported that the growing-season greenness was positively correlated with the maximum daily temperature (T max ) in northwest- ern North America and Siberia but negatively correlated in drier temperate regions such as western China, central Eura- sia, and central and southwestern North America. Usually, field manipulated experiments have been con- ducted to investigate the effects of climatic warming on ecosystem (Alward et al., 1999; Shaver et al., 2000; Wu et al., 2011). Such experimental manipulations are important to un- derstand and quantify the individual contribution of climatic Published by Copernicus Publications on behalf of the European Geosciences Union.
Transcript of Contrasting responses of terrestrial ecosystem production ... · Contrasting responses of...

Biogeosciences, 12, 549–556, 2015
www.biogeosciences.net/12/549/2015/
doi:10.5194/bg-12-549-2015
© Author(s) 2015. CC Attribution 3.0 License.
Contrasting responses of terrestrial ecosystem production to hot
temperature extreme regimes between grassland and forest
Y. Zhang1, M. Voigt1, and H. Liu2
1Institute for Space Sciences, Freie Universität Berlin, 12165 Berlin, Germany2Changjiang River Scientific Research institute, Changjiang Water Resources Commission, 430010 Wuhan, China
Correspondence to: Y. Zhang ([email protected])
Received: 7 March 2014 – Published in Biogeosciences Discuss.: 28 April 2014
Revised: 12 November 2014 – Accepted: 2 December 2014 – Published: 29 January 2015
Abstract. During the past several decades, observational
data have shown a faster increase in hot temperature ex-
tremes than the change in mean temperature. Increasingly
high extreme temperatures are expected to affect terrestrial
ecosystem function. The ecological impact of hot extremes
on vegetation production, however, remains uncertain across
biomes in natural climatic conditions. In this study, we in-
vestigated the effects of hot temperature extremes on vege-
tation production by combining the MODIS enhanced vege-
tation index (EVI) data set and in situ climatic records dur-
ing the period 2000 to 2009 from 12 long-term experimen-
tal sites across biomes and climate. Our results show that
higher mean annual maximum temperatures (Tmax) greatly
reduced grassland production, and yet enhanced forest pro-
duction after removing the effect of precipitation. The rel-
ative decrease in vegetation production was 16 % for arid
grassland and 7 % for mesic grassland, and the increase was
5 % for forest. We also observed a significantly positive rela-
tionship between interannual aboveground net primary pro-
duction (ANPP) and Tmax for the forest biome (R2= 0.79,
P < 0.001). This line of evidence suggests that hot tem-
perature extremes lead to contrasting ecosystem-level re-
sponses of vegetation production between grassland and for-
est biomes. Given that many terrestrial ecosystem models use
average daily temperature as input, predictions of ecosystem
production should consider such contrasting responses to in-
creasingly hot temperature extreme regimes associated with
climate change.
1 Introduction
The observed global temperature showed a warming of
0.85◦C (0.65 to 1.06◦C) over the period of 1880 to 2012,
and the number of warm days and nights has increased at the
global scale (IPCC, 2013). Future temperature is expected
to continue to warm more rapidly over land than ocean,
and there will be more frequent hot and fewer cold temper-
ature extremes over most land area (IPCC, 2013). Terres-
trial ecosystems are strongly impacted by climate and cli-
mate change (Nemani et al., 2003), and hence this trend to-
wards hot temperature extremes would have important con-
sequences on terrestrial ecosystems (IPCC, 2012). Numerous
modeling and observational climate warming studies have
shown the general enhancement of vegetation growth or in-
creases in vegetation greenness in northern terrestrial ecosys-
tems (e.g., Keeling, et al., 1996; Myneni, et al., 1997; Zhou
et al., 2001; Neigh et al, 2008; Wu et al., 2011). However,
knowing the general response of ecosystems tells us little
about how the ecosystem in a particular location will respond
or how different ecosystem responds to hot temperature ex-
tremes. For example, Peng et al. (2013) recently reported
that the growing-season greenness was positively correlated
with the maximum daily temperature (Tmax) in northwest-
ern North America and Siberia but negatively correlated in
drier temperate regions such as western China, central Eura-
sia, and central and southwestern North America.
Usually, field manipulated experiments have been con-
ducted to investigate the effects of climatic warming on
ecosystem (Alward et al., 1999; Shaver et al., 2000; Wu et al.,
2011). Such experimental manipulations are important to un-
derstand and quantify the individual contribution of climatic
Published by Copernicus Publications on behalf of the European Geosciences Union.

550 Y. Zhang et al.: Response of ecosystem production to hot extremes
Table 1. Descriptions of the sites in this studya.
Site and location Latitude Longitude Land cover MAP Max. temp- Code
(degree) (degree) (mm)b erature (◦C)
Desert Exp. Range, UT 38.547 −113.712 Arid grassland 216 (65) 19 (1.1) DE
Jornada Exp. Range, NM 32.589 −106.844 Arid grassland 242 (78) 25 (0.7) JE
Walnut Gulch Exp. Watershed, AZ 31.736 −109.938 Arid grassland 311 (85) 25 (1.0) WG
Santa Rita Exp. Range, AZ 31.846 −110.839 Arid grassland 447 (129) 29 (0.7) SR
Central Plains Exp. Range, CO 40.819 −104.748 Arid grassland 381 (91) 16 (1.4) CP
Southern Plains Exp. Range, OK 36.614 −99.576 Mesic grassland 586 (153) 22 (0.9) SP
Little Washita Creek, OK 34.918 −97.956 Mesic grassland 796 (195) 24 (1.2) LW
Little River Watershed, GA 31.537 −83.626 Temperate conifer forest 1148 (257) 25 (0.6) LR
Mahatango Creek, PA 40.731 −76.592 Temperate broadleaf forest 1058 (179) 16 (0.9) MC
Cutfoot Experimental Forest, MN 47.4264 −94.0141 Temperate broadleaf forest 665 (101) 11 (1.1) CF
Bent Creek Exp. Forest, NC 35.500 −82.624 Temperate mixed forest 1227 (239) 19 (0.6) BC
Caspar Creek, CA 39.337 −123.748 Mediterranean forest 1054 (301) 16 (0.7) CC
aPrecipitation and temperature for the 40-year period 1970–2009 were available for all sites except JE, for which data were available for a 32-year period 1978–2009.bAverage annual sum of precipitation (MAP) and average annual mean max temperature with standard deviation in parentheses.
warming on vegetation growth by controlling other global
change factors. However, these studies have usually been
conducted either on an individual ecosystem or over short-
term periods, which render the comparisons across biomes
that may differ between regions and ecosystem difficult. A
main problem with these experiments is that they do not in-
corporate the entire micro- and macro-environmental aspects
of variable weather. In addition, the long-term responses of
ecosystem function are difficult to capture in warming ex-
periments most of which were short term (< 5 years) (Wu et
al., 2011). In other words, manipulated experiments are spa-
tially and temporally restricted. The results from these ma-
nipulated studies are needed to understand in the context of
long-term experiments in the natural field settings. An alter-
native to manipulated experiments is to analyze these effects
on ecosystem processes in natural field settings with long-
term measurements across biomes (Huxman et al., 2004).
Although individual grassland or forest sites have been
conducted for their response to climatic warming or extremes
(Wu et al., 2011; Smith, 2011), there is still no consensus on
how ecosystem production will respond to temperature ex-
tremes across biomes from arid grassland to forest. Further-
more,many comparison studies used ecosystem production
from a compilation of in situ measurements from long-term
experimental sites (Huxman et al., 2004). However, the mea-
suring procedures of vegetation production are not consistent
across sites, and in some cases, not consistent over time at a
given site (Sala et al., 1988), and this will result in some un-
certainties. As a result, we are lacking generalizations about
the regional behavior of terrestrial ecosystem with more hot
temperature extreme regimes.
The last decade has witnessed dramatic global warming: 9
of the 10 warmest years on record have occurred during the
21st century (NOAA, 2013). These conditions are similar to
those expected due to climate change (IPCC, 2013). In par-
ticular, the United States has warmed faster than the global
rate since the late 1970s, and heat waves in 2005, 2006, and
2007 broke all-time records for high maximum and minimum
temperatures (NOAA, 2013). Therefore, this recent climatic
condition provides an opportunity to study the functional re-
sponse of biomes to hot temperature extremes with respect
to future climate change.
In this study, we used a 10-year data set of MODerate res-
olution Imaging Spectroradiometer (MODIS) enhanced veg-
etation index (EVI) (Huete et al., 2002) as an indicator of
aboveground net primary production (ANPP), in combina-
tion with field observations from 12 long-term experimen-
tal sites in the conterminous United States. The primary ob-
jective of this study was to examine the response of vegeta-
tion production to hot temperature extremes, with particular
focus on quantifying the direction and magnitude of ANPP
long-term response across biomes from semi-arid grassland
to temperate forest. We first assessed the changes in annual
ANPP due to higher temperature extremes across biomes.
Then, we examined the link between temperature extremes
and annual ANPP after controlling the effects of precipita-
tion and low temperature.
2 Materials and methods
2.1 Study sites and meteorological data
Twelve USDA experimental sites across the conterminous
United States were used. These sites included different pre-
cipitation regimes and biomes representative of ecosystems
ranging from arid grassland to temperate forest. They rep-
resent a broad range of production, climatic and soil condi-
tions, and life history characteristics of the dominant species.
At each site, a location was selected in an undisturbed veg-
etated area of at least 2.25 km× 2.25 km in size (Table 1).
Biogeosciences, 12, 549–556, 2015 www.biogeosciences.net/12/549/2015/
Y. Zhang et al.: Response of ecosystem production to hot extremes 551
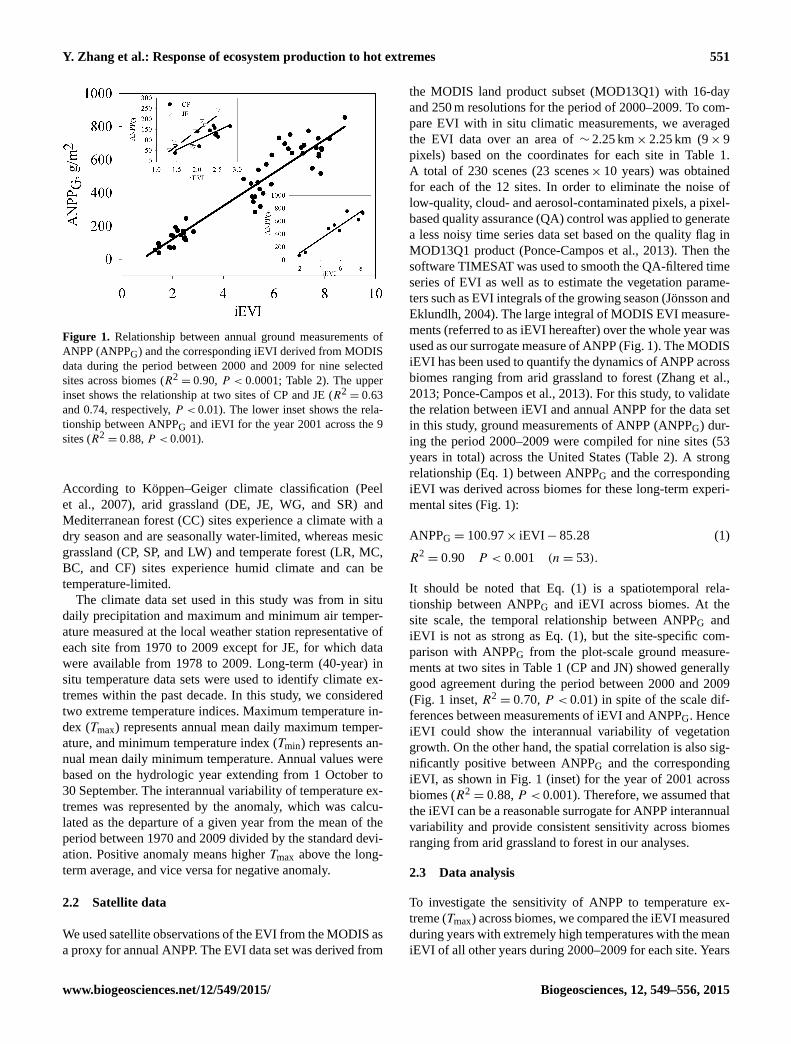
Figure 1. Relationship between annual ground measurements of
ANPP (ANPPG) and the corresponding iEVI derived from MODIS
data during the period between 2000 and 2009 for nine selected
sites across biomes (R2= 0.90, P < 0.0001; Table 2). The upper
inset shows the relationship at two sites of CP and JE (R2= 0.63
and 0.74, respectively, P < 0.01). The lower inset shows the rela-
tionship between ANPPG and iEVI for the year 2001 across the 9
sites (R2= 0.88, P < 0.001).
According to Köppen–Geiger climate classification (Peel
et al., 2007), arid grassland (DE, JE, WG, and SR) and
Mediterranean forest (CC) sites experience a climate with a
dry season and are seasonally water-limited, whereas mesic
grassland (CP, SP, and LW) and temperate forest (LR, MC,
BC, and CF) sites experience humid climate and can be
temperature-limited.
The climate data set used in this study was from in situ
daily precipitation and maximum and minimum air temper-
ature measured at the local weather station representative of
each site from 1970 to 2009 except for JE, for which data
were available from 1978 to 2009. Long-term (40-year) in
situ temperature data sets were used to identify climate ex-
tremes within the past decade. In this study, we considered
two extreme temperature indices. Maximum temperature in-
dex (Tmax) represents annual mean daily maximum temper-
ature, and minimum temperature index (Tmin) represents an-
nual mean daily minimum temperature. Annual values were
based on the hydrologic year extending from 1 October to
30 September. The interannual variability of temperature ex-
tremes was represented by the anomaly, which was calcu-
lated as the departure of a given year from the mean of the
period between 1970 and 2009 divided by the standard devi-
ation. Positive anomaly means higher Tmax above the long-
term average, and vice versa for negative anomaly.
2.2 Satellite data
We used satellite observations of the EVI from the MODIS as
a proxy for annual ANPP. The EVI data set was derived from
the MODIS land product subset (MOD13Q1) with 16-day
and 250 m resolutions for the period of 2000–2009. To com-
pare EVI with in situ climatic measurements, we averaged
the EVI data over an area of ∼ 2.25 km× 2.25 km (9× 9
pixels) based on the coordinates for each site in Table 1.
A total of 230 scenes (23 scenes× 10 years) was obtained
for each of the 12 sites. In order to eliminate the noise of
low-quality, cloud- and aerosol-contaminated pixels, a pixel-
based quality assurance (QA) control was applied to generate
a less noisy time series data set based on the quality flag in
MOD13Q1 product (Ponce-Campos et al., 2013). Then the
software TIMESAT was used to smooth the QA-filtered time
series of EVI as well as to estimate the vegetation parame-
ters such as EVI integrals of the growing season (Jönsson and
Eklundlh, 2004). The large integral of MODIS EVI measure-
ments (referred to as iEVI hereafter) over the whole year was
used as our surrogate measure of ANPP (Fig. 1). The MODIS
iEVI has been used to quantify the dynamics of ANPP across
biomes ranging from arid grassland to forest (Zhang et al.,
2013; Ponce-Campos et al., 2013). For this study, to validate
the relation between iEVI and annual ANPP for the data set
in this study, ground measurements of ANPP (ANPPG) dur-
ing the period 2000–2009 were compiled for nine sites (53
years in total) across the United States (Table 2). A strong
relationship (Eq. 1) between ANPPG and the corresponding
iEVI was derived across biomes for these long-term experi-
mental sites (Fig. 1):
ANPPG = 100.97× iEVI− 85.28 (1)
R2= 0.90 P < 0.001 (n= 53).
It should be noted that Eq. (1) is a spatiotemporal rela-
tionship between ANPPG and iEVI across biomes. At the
site scale, the temporal relationship between ANPPG and
iEVI is not as strong as Eq. (1), but the site-specific com-
parison with ANPPG from the plot-scale ground measure-
ments at two sites in Table 1 (CP and JN) showed generally
good agreement during the period between 2000 and 2009
(Fig. 1 inset, R2= 0.70, P < 0.01) in spite of the scale dif-
ferences between measurements of iEVI and ANPPG. Hence
iEVI could show the interannual variability of vegetation
growth. On the other hand, the spatial correlation is also sig-
nificantly positive between ANPPG and the corresponding
iEVI, as shown in Fig. 1 (inset) for the year of 2001 across
biomes (R2= 0.88, P < 0.001). Therefore, we assumed that
the iEVI can be a reasonable surrogate for ANPP interannual
variability and provide consistent sensitivity across biomes
ranging from arid grassland to forest in our analyses.
2.3 Data analysis
To investigate the sensitivity of ANPP to temperature ex-
treme (Tmax) across biomes, we compared the iEVI measured
during years with extremely high temperatures with the mean
iEVI of all other years during 2000–2009 for each site. Years
www.biogeosciences.net/12/549/2015/ Biogeosciences, 12, 549–556, 2015

552 Y. Zhang et al.: Response of ecosystem production to hot extremes
Table 2. Sites with “in-situ” ANPP measurements within the period of 2000–2009 for validation with iEVI.
Site Biome and Location Period Source
Jornada LTER Arid grassland, New Mexico 2000–2009 http://www.lternet.edu/sites/
Sevilleta LTER Arid grassland, New Mexico 2002–2003 http://www.lternet.edu/sites/
Shortgrass Steppe LTER Grassland, Colorado 2000–2009 http://www.lternet.edu/sites/
Cedar Creek LTER Grassland, Minnesota 2000–2007 http://www.lternet.edu/sites/
Konza Prairie LTER Grassland, Kansas 2000–2002 http://www.lternet.edu/sites/
Harvard Forest Mixed forest, Massachusetts 2000–2006 http://www.lternet.edu/sites/
Metolius Intermediate Pine Evergreen needleleaf forest, Oregon 2001 http://public.ornl.gov/ameriflux/
Park Falls Deciduous broadleaf forest, Wisconsin 2000, 2004 http://public.ornl.gov/ameriflux/
Ohio Hills FFs Mixed forest, Ohio 2001–2002 Chiang et al. (2008)
University of Michigan Biological Station Deciduous broadleaf forest, Michigan 2000–2006 Gough et al. (2008)
Figure 2. Long-term trends of the anomaly of Tmax during 1970–
2009 for different biome types. DG, arid grassland sites (DE, JE,
WG, SR, and CP in Table 1); MG, mesic grassland sites (SP and
LW in Table 1); TF, temperate forested sites (LR, MC, BC, and CF
in Table 1); MF, Mediterranean forested site (CC). The dotted line
shows the year of 2000 for the starting year of the MODIS EVI data
set.
with extremely high temperatures were defined as those for
which the Tmax anomaly was ≥ 1 or the maximum anomaly
year when there is no anomaly > 1 during 2000–2009. Since
both precipitation and temperature (Tmax and Tmin) have limi-
tations on vegetation production (iEVI) and they covary with
one another, we also used partial correlation analysis to as-
sess the relationship between iEVI and Tmax by removing the
effects of precipitation and Tmin. Partial correlation analysis
is widely used to isolate the relationship between two vari-
ables by removing the effects of many correlated variables.
A Duncan multiple range test was used to determine signifi-
cant differences in temperature and iEVI among groups.
3 Results and discussion
3.1 Long-term trends of the anomaly of Tmax
Figure 2 shows the long-term trends of Tmax for the four
biome types (Table 1). For desert grassland, annual mean
maximum temperature increased by 1.66 ◦C (P < 0.0001)
during the 40-year period from 1970 and 2009 (Fig. 2).
For mesic grassland, Tmax increased by 1.21◦C (P < 0.0001)
during 1970–2009 (Fig. 2). There was no significant trend
for Tmax for temperate forest sites. In contrast, Tmax de-
creased slightly for Mediterranean forest even though not
statistically significant for the whole 40-year period (Fig. 2,
P > 0.1). However, Fig. 2 shows that there were two dif-
ferent periods for Tmax at the Mediterranean forest site (CC
in Table 1). Tmax increased by 1.86 ◦C (P < 0.0001) before
the earlier 1990s but then dropped dramatically by −3.46 ◦C
(P < 0.0001) after 1992 (Fig. 2). The temperature rises ob-
served in desert and mesic grassland are consistent with the
observation in the southwestern US and the Great Plains (US-
GCRP, 2009; MacDonald, 2010). However, the unchanged
annual mean Tmax in the temperate forest sites is not con-
sistent with the regional temperature rise in the eastern US
(USGCRP, 2009).
3.2 Contrasting responses to Tmax between grassland
and forest biomes
Figure 3 shows that annual iEVI was significantly corre-
lated with Tmax (R2= 0.79, P < 0.001) across the temper-
ature gradient of forested sites, and a stronger relation was
identified between the decadal maximum Tmax and corre-
sponding iEVI (R2= 0.95, P < 0.005; Fig. 3). Because the
slopes of these two relations are not significantly different (F
test, P > 0.05; Fig. 3), this confirms that forest production
increases with elevated temperature across the temperature
gradient (Magnani et al., 2001; Wullschleger et al., 2003;
Huxman et al., 2004). This also suggests that the decadal
maximum Tmax may not affect the overall sensitivity of in-
terannual ANPP to mean annual temperature. Figure 3 also
Biogeosciences, 12, 549–556, 2015 www.biogeosciences.net/12/549/2015/

Y. Zhang et al.: Response of ecosystem production to hot extremes 553
Figure 3. Relationship between iEVI and Tmax and their maximum-
year Tmax–iEVI relationship for five forested sites. The dotted line
shows the linear relationship between maximum-year Tmax and the
relevant iEVI for all the sites.
suggests that maximum temperature can explain 80 % of the
variability of vegetation production across these forest sites.
For the grassland sites, however, there is no significant cor-
relation between mean annual iEVI and Tmax (R2= 0.05,
P = 0.64). This is consistent with the fact that vegetation
production is more controlled by water availability for grass-
lands in arid and semi-arid regions and interannual ANPP
being related to soil moisture variability (Knapp and Smith,
2001; Knapp et al., 2002; Cherwin and Knapp, 2012). On
the other hand, the forest biome is more temperature-limited
with regard to productivity, particularly in regions that are
not constrained by water, and climatic warming can stimulate
vegetation growth through enhancing summer photosynthe-
sis (Churkina and Running, 1998; Nemani et al., 2003; Piao
et al., 2007).
Within sites, however, the interannual iEVI was not corre-
lated with interannual variations in Tmax at any forest site
(P > 0.05). The differences between spatial and temporal
patterns of forest ANPP responses to Tmax reflect different
underlying mechanisms at regional and local scale. The re-
gional pattern of forest ANPP is determined primarily by
temperature, while the temporal pattern for a given ecosys-
tem is most likely affected by interactions between tempera-
ture and nutrient availability. Several studies have found lim-
ited forest production response to warming alone but signif-
icant response to warming with fertilization (Parsons et al.,
1994; Press et al., 1998; Rustad et al. 2001; Strömgren and
Linder 2002; Xu et al. 2011).
Among biomes, higher Tmax with an anomaly > 1 had a
direct negative effect on vegetation production in grassland
ecosystems, especially for arid grassland, but a positive effect
on forest ecosystems (Fig. 4, P < 0.05). On average, the de-
Figure 4. Comparison of iEVI differences between the extreme
years and average of all other years of Tmax across sites. Extreme
years mean that the years of Tmax anomaly are ≥ 1. The inset de-
notes the average differences by biome type. DG, arid grassland
sites (DE, JE, WG, and SR in Table 1); MG, mesic grassland sites
(CP, SP, and LW in Table 1); TF, temperate forested sites (LR, MC,
BC, and CF in Table 1); MF, Mediterranean forested site (CC). Dif-
ferent letters indicate significant differences at P < 0.05.
creases in iEVI were up to 7 % for mesic grassland, and 16 %
for arid grassland (Fig. 4, inset). This may be attributed to the
negative effects of warming temperatures on water availabil-
ity through enhanced evapotranspiration (Seager and Vecchi,
2010). In contrast, higher Tmax enhanced mean annual iEVI
by 5 % for both temperate and Mediterranean forest sites
(Fig. 4). There were larger, positive responses of ANPP to
higher temperatures for forested sites in colder environments,
which are the sites of BC and MC (Fig. 4).
The results stated above demonstrate the effects of hot
temperature extreme on vegetation production without con-
sidering the confounding effects of other variables such as
precipitation and Tmin. There is a highly positive correla-
tion between Tmax and Tmin. To isolate the role of Tmax
from precipitation and Tmin, we alternately investigated the
apparent responses of iEVI to Tmax with partial correlation
analyses to remove the confounding effects. Figure 5 shows
how interannual iEVIs respond to variations in interannual
Tmax across sites. After removing the effects of Tmin and
precipitation in the partial correlation analyses, the individ-
ual Tmax interannual changes again show the contrasting ef-
fects on the interannual iEVI between grassland and forest
sites (Fig. 5). For desert grassland sites, interannual iEVI is
negatively correlated with interannual Tmax with statistical
significance at the 0.05 level (R = 0.35). There is no sig-
nificantly partial correlation between Tmax and annual iEVI
for mesic grassland sites (Fig. 5), implying little or no re-
sponse of ecosystem production to Tmax after removing the
effects of Tmin and precipitation. In contrast, interannual
www.biogeosciences.net/12/549/2015/ Biogeosciences, 12, 549–556, 2015

554 Y. Zhang et al.: Response of ecosystem production to hot extremes
Figure 5. Partial correlations between iEVI and Tmax after control-
ling the effects of Tmin and precipitation across sites. (1) Statisti-
cally significant at the 95 % (P < 0.05) level; (2) statistically sig-
nificant at the 99.9 % (P < 0.001) level.
Tmax variations exhibit significantly positive partial correla-
tions with interannual iEVI changes for temperate forest sites
(R = 0.57; P < 0.001). For the Mediterranean forest site of
Caspar Creek, it also shows positive partial correlations be-
tween interannual Tmax and iEVI but without statistical sig-
nificance (R = 0.49; P = 0.22) due to fewer data sets from
only site. This opposite response of interannual iEVI to Tmax
between wet and dry temperate regions of the North America
agrees well with a recent global study by Peng et al., 2013,
in which remarkable spatial patterns of the partial correla-
tions between growing-season greenness and Tmax over the
Northern Hemisphere were shown.
In all, the two approaches in the present study suggest
that hot temperature extremes imposed a negative effect on
vegetation production for grassland, especially desert grass-
land in the southwestern US, while it has a positive effect on
forest (Figs. 4 and 5). This difference in response between
grassland versus forest may be related to the adaptations
of dominant species in terms of their response to warming
temperature. Higher Tmax and warming climate would im-
ply drier soils through increased evaporative demand (Man-
abe and Wetherald, 1986) and decreased production due to
decreases in stomatal conductivity, down-regulation of the
photosynthetic processes, and increased allocation to roots in
arid and semi-arid regions (Chaves et al., 2002). Our results
agree well with the results of previous studies (Braswell et
al., 1997; Piao et al., 2006; Munson et al., 2012) that higher
temperatures may have directly negative effects on vegeta-
tion growth in arid and semi-arid grassland. With more at-
mospheric carbon dioxide in the future, however, such warm-
ing desiccation effects would be likely modified at least for
arid grasslands as shown by Morgan et al. (2011). For forest,
the positive effect is consistent with the results reported by
Rustad et al. (2001) and McMahon et al. (2010) for ANPP
in ecosystem warming experiments that higher Tmax would
have a positive impact on forest production (Boisvenue and
Running, 2006). Previous studies have also shown that higher
temperatures favor tree growth by enhancing photosynthesis
(Lukac et al., 2010) and nutrient uptake (Weih and Karlsson,
2002), especially in sites where trees were not typically con-
strained by moisture stress. Thus, these contrasting responses
to Tmax in different ecosystems could have different effects
on regional vegetation carbon uptake (Braswell et al., 1997).
However, it should be noted that, due to data limitations, only
12 sites were used in this study. We need more data from all
terrestrial ecosystems to test whether the contrasting effect
of temperature extremes is a general behavior in forest and
grassland ecosystems. Furthermore, the results reported here
may be temporal, and the long-term impact of temperature
extremes on ecosystem functional integrity across biomes is
yet unknown. The ongoing field measurements of carbon flux
and meteorological data from eddy covariance flux method
for different ecosystem may provide an opportunity to vali-
date the assumption in this study.
4 Conclusions
Understanding how vegetation production responds to ex-
treme warm temperature regimes is crucial for assessing the
impacts of climate change on terrestrial ecosystem. Recent
record-breaking high temperatures in the contiguous US pro-
vide the opportunity to study such effects. Our study offers
a generalization of the functional response of ecosystem to
hot extreme conditions predicted with climate change across
biomes in the natural climatic conditions. By using satellite
and in situ meteorological data, we found a contrasting re-
sponse of terrestrial ecosystem to extreme warm temperature
anomalies between grassland and forest biomes in natural
settings. The opposite direction and magnitude of response
indicates different sensitivities across ecosystems to hot tem-
perature extremes. A recent study has shown that there is a
continuous increase in hot extremes over land, despite the
slowed rate of increase in annual global mean temperature
(Seneviratne et al., 2014). Hence, the sensitivity of ecosys-
tem production in response to hot extremes across biomes
found here has important implications. Current terrestrial
ecosystem models usually utilize daily mean or monthly tem-
perature data as input, and hence they may neglect the re-
sponse of vegetation to extreme warm temperature (Tmax).
To some extent, the effects of hot extremes are more rele-
vant for climate change impacts than global mean temper-
ature on ecosystems (IPCC, 2012, 2013). Hence, this work
further strengthens our understandings of the ecosystem-
level response to extreme warm temperatures across biomes.
This study also clarifies the value of long-term experimen-
tal sites together with continuing satellite-based observations
such as EVI in future studies. This compelling result in a
Biogeosciences, 12, 549–556, 2015 www.biogeosciences.net/12/549/2015/

Y. Zhang et al.: Response of ecosystem production to hot extremes 555
natural setting at the ecosystem level should play a role in
future climate change impact studies.
Acknowledgements. The work by Y. Zhang and M. Voigt
was funded by the Emmy Noether Programme (GlobFluo
project) of the German Research Foundation. Thanks to M. Su-
san Moran, Anthony R. Buda, David D. Bosch, Stacey A. Gunter,
Stanley G. Kitchen, W. Henry McNab, Jack A. Morgan,
Mitchel P. McClaran, Diane S. Montoya, Debra P. C. Peters,
and Patrick J. Starks for providing the climatic data. We are also
grateful for access to multi-site, long-term data provided through
the EcoTrends Project (www.ecotrends.info). This work used
biological data acquired by the LTER network. We acknowledge
the Oak Ridge National Laboratory (ORNL) Distributed Active
Archive Center (DAAC) for making these data available. We thank
Bai Yang, Jyh-Min Chiang, Beverly Law, and Arlyn Andrews
for providing suggestions about the ANPP data. We also thank
the principal investigators, information managers, scientists, and
technicians responsible for measuring ANPP at the LTER sites.
The authors also gratefully acknowledge the valuable suggestions
made by Christopher Kyba at the Freie Universität Berlin. The
authors are also are grateful to the three anonymous reviewers for
their valuable comments.
Edited by: E. Pendall
References
Alward, R. D., Detling, J. K., and Milchunas, D. G.: Grassland
vegetation changes and nocturnal global warming, Science, 283,
229–231, 1999.
Braswell, B. H., Schimel, D. S., Linder, E., Moore, B.: The response
of global terrestrial ecosystems to interannual temperature vari-
ability, Science, 238, 870–872, 1997.
Boisvennue, C. and Running, S. W.: Impacts of climate change on
natural forest production- evidence since the middle of the 20th
century, Glob. Change Biol., 12, 862–882, 2006.
Chaves, M. M., Pereira, J. S., Maroco, J. P.: How plants cope with
water stress in the field: photosynthesis and growth, Ann. Bot.,
89, 907–916, 2002.
Cherwin, K. and Knapp, A. K.: Unexpected patterns of sensitivity to
drought in three semi-arid grasslands, Oecologia, 169, 845–852,
2012.
Chiang, J. M., McEwan, R. W., Yaussy, D. A., and Brown, K. J.:
The effects of prescribed fire and silvicultural thinning on the
aboveground carbon stocks and net preimary production of over-
story trees in an oak-hickory ecosystem in southern Ohio, Forest.
Ecol. Manage., 255, 1584–1594, 2008.
Churkina, G. and Running, S. W.: Contrasting climate controls on
the estimated production of global terrestrial biomes. Ecosys-
tems, 1 pp., 206–215, 1998.
Gough, C. M., Vogel, C. S., Schmid, H. P., Su, H. B., and Curtis,
P. S.: Multi-year convergence of biometric and meteorological
estimates of forest carbon storage, Agr. Forest. Meteorol., 148,
158–170, 2008.
Huete, A. R., Didan, K., Miura, T., Rodriguez, E. P., Gao, X., and
Ferreira, L. G.: Overview of the radiometric and biophysical per-
formance of the MODIS vegetation indices, Remote Sens. Envi-
ron., 83, 195–213, 2002.
Huxman, T. E., Smith, M. D., Fay, P. A., Knapp, A. K., Shaw, M.
R., Loik, M. E., Smith, S. D., Tissue, D. T., Zak, J. C., Weltzin, J.
F., Pockman, W. T., Sala, O. E., Haddad, B. M., Harte, J., Koch,
G. W., Schwinning, S., Small, E. E., and Williams D. G.: Con-
vergence across biomes to a common rain-use efficiency, Nature,
429, 651–654, 2004.
IPCC: Managing the Risks of Extreme Events and Disasters to Ad-
vance Climate Change Adaptation, in: A Special Report of Work-
ing Groups I and II of the Intergovernmental Panel on Climate
Change, edited by: Field, C. et al., Cambridge University Press,
Cambridge, UK, and New York, NY, USA, 582 pp., 2012.
IPCC: Climate Change 2013: The Physical Science Basis, in: Con-
tribution of Working Group I to the Fifth Assessment Report
of the Intergovernmental Panel on Climate Change, edited by:
Stocker, et al., Cambridge University Press, Cambridge, United
Kingdom and New York, NY, USA, 1535 pp., 2013.
Jonsson, P. and Eklundh, L.: TIMESAT–a program for analyzing
time-series of satellite sensor data, Comput. Geosci., 30, 833–
845, 2004.
Knapp, A. K. and Smith, M. D.: Variation among biomes in tempo-
ral dynamics of aboveground primary production, Science, 291,
481–484, 2001.
Knapp A. K., Fay, P. A., Blair, J. M., Collins, S. L., Smith, M. D.,
Carlisle, J. D., Harper, C. W., Danner, B. T., Lett, M. S., and
McCarron, J. K.: Rainfall variability, carbon cycling, and plant
species diversity in a mesic grassland, Science, 298, 2202–2205,
2002.
Keeling, R. F., Piper, S. C., and Heimann, M.: Global and hemi-
spheric CO2 sinks deduced from changes in atmospheric O2 con-
centration., Nature, 381, 218–221, 1996.
Lukac, M., Calfapietra, C., Lagomarsino, A., and Loreto, F.: Global
climate change and tree nutrition: effects of elevated CO2 and
temperature, Tree Physiology, 30, 1209–1220, 2010.
MacDonald, G. M.: Water, climate change, and sustainability in the
southwest, Proc. Natl. Acad,Sci. USA, 107, 21256–21262, 2010.
Manabe, S. and Wetherald, R. T.: Reduction in summer soil wetness
induced by an increase in atmospheric carbon dioxide, Science,
232, 626–628,1986.
McMahon, S. M., Parker, G. G., and Miller, D. R.: Evidence for
a recent increase in forest growth, Proc. Natl. Acad. Sci. USA,
107, 3611–3615, 2010.
Myneni, R. B., Keeling, C. D., Tucker, C. J., Asrar, G., and Nemani,
R. R.: Increased plant growth in the northern high latitudes from
1981 to 1991, Nature, 386, 698–702, 1997.
Myneni, R. B., Dong, J., Tucker, C. J., Kaufmann, R. K., Kauppi, P.
E., Lisk, J., Zhou, L., Alexeyev, V., and Hughes, M. K.: A large
carbon sink in the woody biomass of northern forests, Proc. Natl.
Acad. Sci. USA, 98, 14784–14789, 2001.
Nemani, R. R., Keeling, C. D., Hashimoto, H., Jolly, W. M., Piper,
S. C., Tucker, C. J., Myneni, R. B., and Running, S. W.: Climate-
driven increases in global terrestrial net primary production from
1982 to 1999, Science, 300, 1560–1563, 2003.
NOAA National Climatic Data Center, State of the Climate: Global
Analysis for Annual 2013, published online December 2013, re-
trieved on February 21, 2014 from http://www.ncdc.noaa.gov/
sotc/global/2013/13, 2014.
www.biogeosciences.net/12/549/2015/ Biogeosciences, 12, 549–556, 2015

556 Y. Zhang et al.: Response of ecosystem production to hot extremes
Parsons, A. N., Welker, J. M., Wookey, P. A., Press, M. C.,
Callaghan, T. V., and Lee, J. A.: Growth responses of four dwarf
shrubs to simulated climate change, J. Ecol., 82, 307–318, 1994.
Peel, M. C., Finlayson, B. L., and McMahonl, T. A.: Updated world
map of the Köppen-Geiger climate classification, Hydrol. Earth
Syst. Sci., 11, 1633–1644, 2007.
Peng, S., Piao, S. L., Ciais, P., Myneni, R., Chen, A., Chevallier,
F., Dolman, A. J., Janssens, I.A., Peñuelas, J., Zhang, G., Vicca,
S., Wan, S., Wang, S., and Zeng, H.: Asymmetric effects of day-
time and night-time warming on Northern Hemisphere vegeta-
tion, Nature, 501, 88–92, 2013.
Piao, S. L., Mohammat, A., Fang, J. Y., Cai, Q., and Feng, J. M.:
NDVI-based increase in growth of temperate grasslands and its
responses to climate change in China, Glob. Environ. Change,
16, 340–348, 2006.
Piao, S. L., Friedlingstein, P., Ciais, P., Viovy, N., and Demarty,
J.: Growing season extension and its effects on terrestrial car-
bon flux over the last two decades, Global Biogeochem. Cy. ,21,
GB3018, doi:10.1029/2006GB00288, 2007.
Ponce-Campos, C. G. E., Moran, M. S., Huete, A., Zhang, Y.,
Bresloff, C., Huxman, T., Bosch, D., McClaran, M. P., Kitchen,
S .G., Buda, A., Gunter, S., McNab, H., Peters, D., Starks, P.,
Montoya, D. S., Heartsill, T., McVicar, T., Eamus, D., and Dono-
hue, R.: Ecosystem resilience despite large-scale altered hydro-
climatic conditions, Nature, 494, 349–352, 2013.
Press, M. C., Potter, J. A., Burke, M. J. W., Callaghan, T. V., and
Lee, J. A.: Responses of a sub-arctic dwarf shrub community to
simulated environmental change, J. Ecol., 86, 315–327, 1998.
Rustad, L. E., Campbell, J. L., Marion, G. M., et al.: A meta-
analysis of the response of soil respiration, net nitrogen miner-
alization, and aboveground plant growth to experimental ecosys-
tem warming, Oecologia, 126, 543–562, 2001.
Sala, O. E., Parton, W. J., Joyce, L. A., and Lauenroth, W. K.: Pri-
mary production of the central grassland region of the United
States: spatial pattern and major controls, Ecology, 69, 40–45,
1988.
Seager, R., and Vecchi, G. A.: Greenhouse warming and the 21st
century hydroclimate of southwestern North America, Proc.
Natl. Acad. Sci. USA, 107, 21277–21282, 2010.
Seneviratne, S. I., Donat, M. G., Mueller, B., and Alexander, L. V.:
No pause in the increase of hot temperature extremes, Nat. Clim.
Change, 4, 161–163, 2014.
Shaver, G. R., Canadell, J., Chapin III, F. S., et al.: Global warming
and terrestrial ecosystems: a conceptual framework for analysis,
Bioscience, 50, 871–882, 2000.
Smith, M. D.: The ecological role of climate extremes: current un-
derstanding and future prospects, J. Ecol., 99, 651–655, 2011.
Strömgren, M. and Linder, S.: Effects of nutrition and soil warming
on stemwood production in a boreal Norway spruce stand, Glob.
Change Biol., 8, 1195–1204, 2002.
USGCRP: Global Climate Change Impacts in the United States,
edited by: Karl, T. R., Melillo, J. M., and Peterson, T. C., United
States Global Change Research Program. Cambridge University
Press, New York, NY, USA, 2009.
Weih, M. and Karlsson, P. S.: Low winter soil temperature affects
summertime nutrient uptake capacity and growth rate of moun-
tain birch seedlings in the subarctic, Swedish lapland,Arctic,
Antarctic, and Alpine Res., 34, 434–439, 2002.
Wu, Z., Dijkstra, P., Koch, G. W., Peñuelas, J., and Hungate, B. A.:
Responses of terrestrial ecosystems to temperature and precipita-
tion change: a meta-analysis of experimental manipulation, Glob.
Change Biol., doi:10.1111/j.1365-2486.2010.02302.x, 2010.
Wullschleger, S. D., Hanson, P. J., and Todd, D. E.: Forest water
use and the Influence of precipitation change, in: North Ameri-
can temperate deciduous forest responses to changing precipita-
tion regimes, edited by: Hanson, P. J. and Wullschleger, S. D.,
Springer, New York, USA, 2003.
Xu, C. G., Liang, C., Wullschleger, S., Wilson, C., and McDow-
ell, N.: Importance of feedback loops between soil inorganic
N and microbial communities in the heterotrophic soil respira-
tion response to global warming, Nat. Rev. Microbiol., 9, 222,
doi:10.1038/nrmicro2439-c1, 2011.
Zhang, Y., Moran, M. S., Nearing, M. A., Ponce, C. G. E., et al.: Ex-
treme precipitation patterns and reductions of terrestrial ecosys-
tem production across biomes, J. Geophys. Res.-Biogeosci., 118,
1–10, 2013.
Zhou, L. M., Tucker, C. J., Kaufmann, R. K., Slayback, D., Sha-
banov, N. V., and Myneni, R. B.: Variations in northern vegeta-
tion activity inferred from satellite data of vegetation indexduring
1981 to 1999, J. Geophys. Res., 106, 20069–20083, 2001.
Biogeosciences, 12, 549–556, 2015 www.biogeosciences.net/12/549/2015/