Contrasting patterns of elevational zonation for …...forest is signalled by an abrupt increase in...
15
Journal of Biogeography (1 998) 25, 593-607 Contrasting patterns of elevational zonation for birds and mammals in the Andes of southeastern Peru BRUCE D. PATTERSON*, DOUGLAS F. STOTZ, SERGIO SOLARI~, JOHN W. FITZPATRICK~ and VICTOR P ACHECO~~ Center for Evolutionary and Environmental Biology, The Field Museum, Chicago IL 60605-2496, U.S.A. and ?-Departamentode Mastozoologia, Museo de Historia Natural, Universidad Nacional Mayor de San Marcos, Apartado Postal 14-0434, Limu 14, Peru Abstract. To determine the generality of avian diversity patterns, we investigated patterns of elevational zonation shown by birds and mammals along the eastern slope of the Andes Mountains in southeastern Peru. The strong environmental gradient sampled, entirely within Peru's Manu National Park and Biosphere Reserve, supports highly diverse faunas. Elevational distributions of 901 bird species, 129 bat species, and twenty-eight species of native mice exhibit contrasting patterns in species richness, species composition, and species turnover. Birds and bats showed smooth declines of species richness with elevation, whereas the richness of mouse assemblages was unrelated to elevation. For all three groups, the greatest differences were between lowland and highland faunas, although cutoff points for this contrast varied among groups (zz 500 m for birds, 750 m for bats, and 1000m for mice). Differences in composition also separated bird and bat faunas on either side of c. 1400m (the boundary between montane forest and cloud forest); for mice, this faunal transition may take place nearer to 2000m. Bird and bat faunas lacked the more discrete zonations suggested for mouse assemblages, as indicated by elevational range profiles and nested subset analyses. Distinct highland assemblages are apparent in two-dimensional histograms of range limits of birds and mice, but not for bats. Highland bat species occupy broader elevational ranges than lowland bat species, but for both birds and mice, species at intermediate elevations had the broadest amplitudes. Finally, clumping of range maxima and minima along the gradient identified zones of pronounced species turnover in each group, but these were generally not strongly associated with the locations of ecotones. Differences in zonation of these groups appear to reflect their different biological attributes and phylogenetic histories. Such differences obviously complicate discussions of 'general' diversity patterns, and limit the usefulness of birds to forecast or predict diversity patterns in other more poorly known groups-other groups may show elevated diversity and endemism in areas where avian diversity patterns appear unremarkable. The pronounced contrasts between bats and mice, and the generally intermediate character of avian patterns, suggest that future analyses might profitably partition birds into finer, more homogeneous groups of historically andlor ecologically similar species. Group differences in zonation may ultimately prove explicable with information on both species-abundance patterns and resource distributions. Key words. Diversity, elevational gradient, species richness, faunal similarity, survey and inventory, taxonomic patterns. Studies conducted in north temperate biomes have contributed greatly to understanding of the patterns and processes associated with species diversity (Brown, 1995; Rosenzweig, 1995). Relatively large numbers of scientists close to their field sites, strong systematic foundations, and detailed knowledge of species' ecologies all contribute to the impact of temperate zone studies. Eventually, however, hypotheses about species diversity ought to be tested against species-rich tropical communities. Not only do these *Correspondence to: Dr B.D. Patterson, Division of amm ma is, Field Museum of Natural History, Chicago IL 60605-2496 U.S.A. E-mail:: [email protected]. Present addresses: t, Laboratory of Ornithology, 159 Sapsucker Woods Rd, Ithaca NY 14850, U.S.A. §Department of Mammalogy, American Museum of Natural History, New York NY 1002&5192, U.S.A. communities typically contain many more species than temperate zone analogues, but also they exhibit myriad and closely integrated interconnections among species. Such interactions, both direct and indirect, are prominent features of modern community ecology (Wooten, 1994; Tilman et al., 1996). Tropical communities offer particularly interesting and refined tests of ecological and evolutionary hypotheses (e.g. Stacy et al., 1996). However, even the best-studied tropical ecosystems are not thoroughly understood (Gentry, 1990: McDade et al., 1994). In most cases, biologists working in hyper-diverse habitats can only sample a fraction of the diversity. Using such incomplete and sometimes biased samples as a basis for interpreting nature introduces distortions of unknown magnitude. The well recognized problems of spatial and temporal scale-of taking ecological observations over an 0 1998 Blackwell Science Ltd 593
Transcript of Contrasting patterns of elevational zonation for …...forest is signalled by an abrupt increase in...

Journal of Biogeography ( 1 998) 25, 593-607
Contrasting patterns of elevational zonation for birds and mammals in the Andes of southeastern Peru
BRUCE D. PATTERSON*, DOUGLAS F. STOTZ, SERGIO S O L A R I ~ , JOHN W. F I T Z P A T R I C K ~ and VICTOR P A C H E C O ~ ~ Center for Evolutionary and Environmental Biology, The Field Museum, Chicago IL 60605-2496, U.S.A. and ?-Departamento de Mastozoologia, Museo de Historia Natural, Universidad Nacional Mayor de San Marcos, Apartado Postal 14-0434, Limu 14, Peru
Abstract. To determine the generality of avian diversity patterns, we investigated patterns of elevational zonation shown by birds and mammals along the eastern slope of the Andes Mountains in southeastern Peru. The strong environmental gradient sampled, entirely within Peru's Manu National Park and Biosphere Reserve, supports highly diverse faunas. Elevational distributions of 901 bird species, 129 bat species, and twenty-eight species of native mice exhibit contrasting patterns in species richness, species composition, and species turnover. Birds and bats showed smooth declines of species richness with elevation, whereas the richness of mouse assemblages was unrelated to elevation. For all three groups, the greatest differences were between lowland and highland faunas, although cutoff points for this contrast varied among groups (zz 500 m for birds, 750 m for bats, and 1000 m for mice). Differences in composition also separated bird and bat faunas on either side of c. 1400m (the boundary between montane forest and cloud forest); for mice, this faunal transition may take place nearer to 2000m. Bird and bat faunas lacked the more discrete zonations suggested for mouse assemblages, as indicated by elevational range profiles and nested subset analyses. Distinct highland assemblages are apparent in two-dimensional histograms of range limits of birds and mice, but not for bats. Highland bat species occupy broader
elevational ranges than lowland bat species, but for both birds and mice, species at intermediate elevations had the broadest amplitudes. Finally, clumping of range maxima and minima along the gradient identified zones of pronounced species turnover in each group, but these were generally not strongly associated with the locations of ecotones.
Differences in zonation of these groups appear to reflect their different biological attributes and phylogenetic histories. Such differences obviously complicate discussions of 'general' diversity patterns, and limit the usefulness of birds to forecast or predict diversity patterns in other more poorly known groups-other groups may show elevated diversity and endemism in areas where avian diversity patterns appear unremarkable. The pronounced contrasts between bats and mice, and the generally intermediate character of avian patterns, suggest that future analyses might profitably partition birds into finer, more homogeneous groups of historically andlor ecologically similar species. Group differences in zonation may ultimately prove explicable with information on both species-abundance patterns and resource distributions.
Key words. Diversity, elevational gradient, species richness, faunal similarity, survey and inventory, taxonomic patterns.
Studies conducted in north temperate biomes have contributed greatly to understanding of the patterns and processes associated with species diversity (Brown, 1995; Rosenzweig, 1995). Relatively large numbers of scientists close to their field sites, strong systematic foundations, and detailed knowledge of species' ecologies all contribute to the impact of temperate zone studies. Eventually, however, hypotheses about species diversity ought to be tested against species-rich tropical communities. Not only do these
*Correspondence to: Dr B.D. Patterson, Division of amm ma is, Field Museum of Natural History, Chicago IL 60605-2496 U.S.A. E-mail:: [email protected].
Present addresses: t, Laboratory of Ornithology, 159 Sapsucker Woods Rd, Ithaca NY 14850, U.S.A. §Department of Mammalogy, American Museum of Natural History, New York NY 1002&5192, U.S.A.
communities typically contain many more species than temperate zone analogues, but also they exhibit myriad and closely integrated interconnections among species. Such interactions, both direct and indirect, are prominent features of modern community ecology (Wooten, 1994; Tilman et al., 1996). Tropical communities offer particularly interesting and refined tests of ecological and evolutionary hypotheses (e.g. Stacy et al., 1996).
However, even the best-studied tropical ecosystems are not thoroughly understood (Gentry, 1990: McDade et al., 1994). In most cases, biologists working in hyper-diverse habitats can only sample a fraction of the diversity. Using such incomplete and sometimes biased samples as a basis for interpreting nature introduces distortions of unknown magnitude. The well recognized problems of spatial and temporal scale-of taking ecological observations over an
0 1998 Blackwell Science Ltd 593
594 Bruce D. Patterson et al.
adequately long period (e.g. Meserve et al., 1995) and a sufficiently varied area (e.g. Patterson et al., 1990) that they are sufficiently representative of the species and communities involved-make this task even more difficult. Levin (1992) and Rosenzweig (1992) offered extended discussions of the importance of scale to defining and understanding ecological patterns.
Despite these limitations, the need is urgent to draw conclusions from tropical field studies. Quantifying patterns shown by tropical systems and determining the processes which give rise to them permits some knowledge of their vulnerabilities and management needs (Hubbell & Foster, 1992). Wholesale habitat conversion and deterioration daily increase this urgency. Because ecologists and conservation biologists cannot study all of the diversity in tropical habitats, they must continually confront a thorny question: to what extent can studies of selected taxa at a given point in space and time uncover patterns of general significance? Are there general patterns in nature, or are patterns exhibited by particular groups the unique consecluences of their idiosyncratic histories and ecologies?
Studies of birds have served to establish and refine many of the patterns used to typify tropical diversity (Stotz et al., 1996). This is undoubtedly related to the facts that bird species are mostly diurnal, comparatively conspicuous, and often easily distinguished by external characters of plumage and song. Patterns established for birds that serve as paradigms for other groups include variation of species richness with elevation (Terborgh, 1971, 1977; Diamond, 1973; Stotz et al., 1996), with habitat type (Stotz et al., 1996), and by region within lowland forest (Haffer, 1990). Tropical birds are study subjects for patterns of endemism (Haffer, 1974; Cracraft, 1985; ICBP, 1992; Stotz et al., 1996), geographical range size (Terborgh & Winter, 1983), and elevational replacement of species (Diamond, 1972; Weske, 1972; Terborgh & Weske, 1975). Avian patterns have contributed importantly to the development of theories on how diversity is generated and maintained, particularly with respect to niche theory (Grinnell, 1917; Diamond, 1970; Lack, 1954, 1971; MacArthur, 1958, 1972), Pleistocene vicariance and 'refuge theory' (Haffer, 1974), and the development of conservation priorities (Diamond, 1976; ICBP, 1992; Stotz et al., 1996). However, to serve as general models, avian patterns need to be corroborated by studies on other taxa (see also Rahbek, 1995).
Here, we compare and contrast diversity patterns shown by birds and mammals along an Andean elevational gradient in southeastern Peru. The region's extensive topographic relief provides an extreme environmental gradient against which to examine diversity patterns. Patterns shown by birds are compared and contrasted with those shown by volant and nonvolant mammals, permitting us to address the existence of general diversity patterns and various factors that may influence or regulate them.
STUDY AREA
Manu National Park and Biosphere Reserve is situated in Peru's southeastern departments of Madre de Dios and Cuzco. The reserve nearly straddles the Eastern Versant, a
ribbon-like biotic zone and region of endemism stretching along the eastern slopes of the Andean Cordillera from southern Colombia to northern Bolivia (Graves, 1988). Manu ranges from 340 m elevation at the mouth of the Rio Manu, to 3450m at Puesto de Vigilancia Acjanaco-and covers an area of 18,812 km2 (approximately the size of Massachusetts). The biological diversity of its numerous habitats is impressive: even a preliminary report on Manu's flora included nearly 3000 species in more than 1000 genera (Foster, 1990). At the nearby Tambopata Reserve, Erwin (1988) encountered 1093 species of beetles in a sample of 3099 individuals from the canopy of a single type of terra j r m e forest.
Terborgh (1971, 1977) distinguished four structurally distinct forest types along an elevational gradient in the Cordillera Vilcabamba in northern Cuzco. These same four forest types also replace one another elevationally at Manu. Lowland rainforest occurs below 450-500m, where it is replaced by montane ruinforest as the slopes of the Andes rise abruptly from the basin floor. This vegetational replacement is marked by the loss of the emergent layer of trees, so that the upper canopy of montane rainforest is much more uniform. Floodplain forest and other vegetation types associated with rivers and oxbow lakes also disappear at this topographic transition. Montane rainforest is replaced by cloudforest beginning near 1400 m, where clouds form nearly every day on the slopes. The transition to cloud forest is signalled by an abrupt increase in the amount of epiphytic growth on tree limbs and thick jackets of mosses and bryophytes on limbs (Terborgh, 1971). Above about 2800 m, cloud forest is replaced by elfin forest, characterized by much lower canopies and microphyllous foliage. Forests on ridge tops as low as 1400m can bear structural resemblance to elfin forest, although floristically they are more similar to neighbouring montane rainforests. Forest gives way to open grasslands (puna) with scattered patches of elfin forest at about 3200m. Depending on slope, exposure, and soils, the transition between these vegetation types varies up to 400 m on different ridges within the park.
A map of the Manu Reserve, showing the elevational transect and enumerating most of the vertebrate sampling stations, appears in Pacheco et al. (1993; see their Fig. 1).
TAXONOMIC DATASETS
Scientists at several institutions are responsible for accumulated information on Manu's vertebrates in studies that span more than two decades. Although no major taxon has been completely inventoried, records from these continuing efforts enable comparative analyses of bird and mammal faunas. However, the differential strengths and weaknesses of assembled records governed our choice of study taxa, our treatment of individual datasets, and the scale at which we could analyse them.
Birds. Records of Manu's avifauna have been assembled by Fitzpatrick, Stotz, D.E. Willard, and their co-workers, who made numerous field expeditions to sites between Boca Manu and Pillahuata. Many of their camps were documented in Stephens & Traylor (1983). Although a detailed report on the reserve's avifauna has yet to be
O Blackwell Science Ltd 1998. journol of Biogeography, 25. 593407
Vertebrate zonation at Manu 595
0 500 1000 1500 2000 2500 3000 3500 Elevation (m)
0 500 1000 1500 2000 2500 3000 3500 Elevation (m)
I 0 500 1000 1500 2000 2500 3000 3500
Elevation (m)
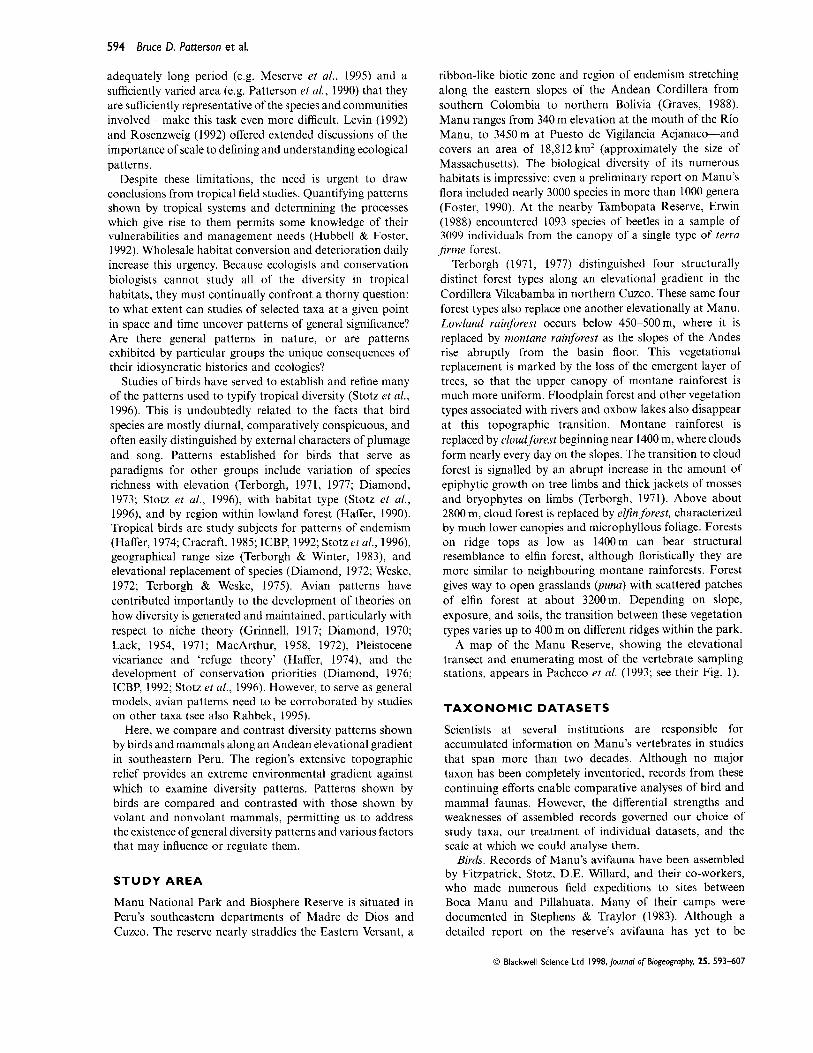
FIG. 1. Species richness of three vertebrate groups plotted against elevational midpoint (in metres). (a) for birds, S= 746.5062-0.51443E+ 0.000096 EZ (adjusted ~?=0.950); (b) for bats, S = 138.7005-0.07835E+0.000011 E' (adj. R2=0.988); (c) for mice, neither linear nor polynomial regressions of any power were significant (all P> 0.05). Mean species richness (S = 8.14; solid line) and a best-fit but nonsignificant quadratic equation (dotted line) are depicted alongside mouse richness values.
published, partial listings appeared in Terborgh et al. (1984) and Munn & Wust (1992). Here, we summarize elevational records for 901 bird species thus far documented by specimens and/or field notes at the Field Museum of Natural History (Chicago) or the Museo de Historia Natural, Universidad Nacional Mayor de San Marcos (Lima).
Distributional data for birds exhibit no major sampling . .
biases when records are pooled into 250-m elevational bands. In fact, knowledge of elevational distributions of birds would permit a finer-grained analysis than was practical for other groups (Stotz, in press). Nevertheless, the full elevational ranges of birds at Manu, particularly at mid-elevations (1600-2500 m), have not been thoroughly documented. Incomplete sampling at these elevations has
probably not caused many species to be omitted from the gradient fauna, but the richness of samples from these elevations is somewhat less than estimates for these zones based on regional elevational ranges of species (Stotz et al., 1996). Regional distribution and abundance of avian communities has been documented by numerous studies, particularly those of Terborgh and his associates (Terborgh & Weske, 1975; Terborgh, 1977, 1985, 1990).
Mammals. The distributions of 193 mammal species across thirty-two sites at Manu were listed by Pacheco et al. (1993) and Patterson et al. (1996). Diverse sampling arrays are needed to document tropical mammal faunas (e.g. Voss & Emmons, 1996), and only the most commonly used techniques have been applied to most of the Manu transect. Still, mist-netting and trapping on or near the ground has produced useful records of two diverse groups-bats and mice-across the gradient. These groups offer useful comparisons with birds in body size, range size and vagility.
Bats (Order Chiroptera) comprise the largest group of mammal species at Manu, 42% of those documented in the reserve (Pacheco et al., 1993). In addition, bats fly and have similar foraging and dispersal capabilities as birds. Bats and passerine birds arose and diversified ecologically and taxonomicallv over the same Cenozoic time scale. These similarities suggest the two should respond similarly to changes in resources with elevation.
Although Manu's bats are well sampled relative to most taxonomic groups, spatial and ecological biases exist. As in birds, unequal sampling efforts along the gradient would lead us to underestimate the richness of mid-elevation samples. Our bat records also reflect ecological biases that affect bat capture rates using mist-nets (see Handley et al., 1991). Although samples of bats in Manu's lowlands adequately document most frugivorous bat species, they seriously underestimate the diversity and elevational ranges of insectivorous bats, particularly high-flying ones (Patterson et al., 1996). To make this dataset comparable to that for birds required inferences about bat distributions and ranges outside the park. Patterson et al. (1996) documented local and regional ranges of eighty-two bat species thus far recorded at Manu; they also presented regional elevational ranges of thirty-two other species known from nearby localities, ten species presumed present in the reserve on the basis of sparse geographical records where they have been recorded, and five other species that plausibly occur at Manu. Documented, nearby, presumed, and possible species represent graded degrees of confidence in precision. Here, we analysed the regional elevational ranges of all 129 species documented and hypothesized to occur there. These inferential estimators of species richness are compared to actual point samples in Patterson et al. (1996). Information on regional bat faunas in Peru is given by Tuttle (1970), Koopman (1978), Graham (1983, 1990), Ascorra et al. (1991), Woodman et al. (1991), Hutterer et al. (1995), and Patterson et al. (1996).
Native mice (Rodentia: Muridae) are also diverse and reasonably well sampled at Manu. Pacheco et al. (1993) reported elevational ranges for twenty-eight species of sigmodontine mice. This group of mice had a more recent origin than either birds or bats, often taken to be Pliocene
O Blackwell Science Ltd 1998. Journal of Biogeography, 25, 593-607

596 Bruce D. Patterson et al.
in age (Reig, 1987; but see Hershkovitz, 1966). Mice also tend to have smaller geographical and home ranges than most other New World mammals, including the similar- sized bats (Rapoport, 1982). Comparisons of mice with birds and bats offer excellent contrasts of vagility involving natural groups.
However, mice are known from many fewer collections than either birds or bats, and reliable information on the regional ranges of most species is non-existent. To compensate for spotty sampling (again mainly at intermediate elevations) and relying wholly on records from Manu, we adjusted the grain of our analyses on murids from 250-m to 500-m intervals in order to reduce the influence of sampling irregularities. Scale differences alone are sometimes sufficient to produce different patterns (e.g. Anderson & Marcus, 1993), raising a caveat for results using mice. An added limitation of the mouse dataset is caused by imprecise species limits for several widespread, speciose genera, such as Phyllotis, Oryzomys, and Akodon (cf. Patton & Smith, 1992). Ignorance of species boundaries does not strongly affect the richness of species occurring at any point along the gradient, but rather their scientific names and the exact locations of species replacements. Use of a coarser scale for analysis should help to mitigate the impact of this bias.
In the Discussion, we compare elevational patterns of murids to those of thirty-eight other rodents and marsupials documented in Manu by Pacheco et al. (1993). Besides the limitations acknowledged for the mouse dataset, additional caveats are in order for these distributions. Some of these species are arboreal and most exceed the body size (and hence presumably the home range and geographical range size) of modal birds, bats, and mice. The majority are also poorly sampled by trap lines laid on or near the ground. Records from this heterogeneous collection of taxa (representing three orders and ten families) are considered to offer useful perspectives on murid patterns but are inadequate to support extensive analyses.
ANALYTICAL PROCEDURES
Many types of elevational patterns can be explained with reference to underlying species abundance patterns. Unfortunately, information is currently unavailable on the relative abundances of all three groups of vertebrates along the Manu gradient. Consequently, all of our analyses focused on presence-absence matrices, assembled from captures or confirmed observations of species over 250-m (for birds and bats) or 500-m (mice) intervals.
To compensate for unequal sampling at individual elevations, we assumed that the elevational ranges of species were continuous; that is, each species occurred at all elevations between its elevational maximum and minimum. The impact of this assumption can be examined for bats in plots of observed and inferred species richness (Patterson et al., 1996; Fig. 5). Faunas of each elevational zone included species with ranges extending into that zone. It is noteworthy that, outside Manu, the ranges of many species extend below the lowest sampled elevations (340m) or above the highest elevations (3500 m) considered in this study.
Most statistical analyses were performed using STATISTICA for Windows (ver. 4.51984-94). Cluster analyses were based on unweighted pair-group average (UPGMA) algorithms constructed from matrices of percentage dissimilarity. This distance measure is computed as distance (x,y) = (number of x, # y,)lnumber of I, which is designed for use with categorical variables such as presence- absence data. For screening patterns, elevational ranges of species were ranked by elevational midpoints, minima, and maxima, then plotted as bar graphs, producing elevational 'range profiles' (Patterson et al., 1996). This graphical treatment reveals the tendency for faunas at different elevations to comprise the same or different sets of species, and hence the discreteness of different elevational zones. Range profiles also highlight the extent to which species occurring at different zones have ranges of different amplitudes. We used the rankings of species along the abscissa of range profiles to divide the species into five equal groups of progressively higher elevation species.
Our analysis of elevational variation in range amplitude did not employ the procedures used by Stevens (1992), in which individual species can be tallied in summary statistics of two or more faunas. Rather, we divided the species pools into fifths, using the ranks of species along the abscissa of range profiles (i.e. the first pentile represents that 20'%, of species with the lowest range midpoints, and so on). We then characterized range width for each group, looking for trends across classes. Although this analysis yields only ordinal comparisons between range location and range width, it avoids potentially severe problems associated with lack of independence among observations.
Nested subset analyses, suggested initially by the range profile of bat species, made use of 'The Nestedness Calculator' (Atmar & Patterson, 1995). This approach compares the actual species composition pattern to an idealized nested subset pattern, in which smaller faunas are comprised of a proper subset of the species in larger ones. Degrees of nestedness are expressed as 'temperatures', where 0" represents perfect nestedness (pure signal) and 100" represents a distributional checkerboard (pure noise from this perspective; Atmar & Patterson, 1993). Temperatures obtained in 1000 Monte Carlo simulations were used to test whether the observed nestedness value departs from random expectation. Unlike the RANDOM0 and RANDOM 1 null hypotheses commonly used to study nestedness (e.g. Worthern, 1996), the Nestedness Calculator uses a simulation procedure that populates matrices without row or column constraints, subject only to the condition that the number of species-presences ('fill') equals that number actually observed (cf. criticisms of Simberloff & Martin, 1991).
Clumping of range boundaries along the gradient was determined relative to the species richness of each zone. If faunal turnover occurs in a certain elevation, it should be marked by a surfeit of coincident range limits, either maxima or minima, relative to the number of species occurring there. On the other hand, zones marked by fewer-than-expected maxima and minima denote faunal homogeneity in this part of the gradient. To generate expected values, species richness values of individual zones (S,) were expressed as a fraction
0 Blackwell Science Ltd 1998, Journal of B~ogeography, 25, 593407

Vertebrate zonation at Manu 597
of summed species richness values across the entire transect, becoming the proportion of range maxima and minima 'expected' in a given zone: Expected number of range boundaries at level I=S,ICS,. Observed numbers of range maxima and minima were plotted as percentage deviations from this expectation, according to the expression, (observed-expected)/expected x 100. Surplus minima in the lowest elevational class, and surplus maxima at the highest elevation zone, are trivial, because any species in these zones reaches its limits there.
RESULTS
Species richness
Birds and bats show similar patterns of elevational variation in species richness (Fig. 1). For both groups, species richness (S) varies as a quadratic function of elevational midpoint (E, in m); cubic and high-order terms were not significant in trials with other polynomial models. For birds, the relationship was
(P< 0.0001 for all coefficients; adjusted R2 =0.950). For bats, richness declined with elevation according to the relationship
(P< 0.0001 for all terms; adj. R2=0.988). However, for mice, neither linear nor polynomial regressions of species richness on elevation was significant. Species richness of mice is high both in the lowlands and in the highlands, and is apparently lowest at intermediate elevations. A quadratic model of mouse richness values produced the trough-shaped curve in Fig. l(c).
Faunal similarity
Overall similarity of faunas at different elevations was assessed by unweighted pair-group (UPGMA) dendrograms constructed from matrices of percentage dissimilarity (PD). All three groups exhibit pronounced distinctiveness of low- elevation faunas from higher-elevation ones (Fig. 2). For birds, avifaunas in the lowest elevational zone (250-500 m) are the last to join the remaining avifaunas, and do so at P D 10.6; higher elevation faunas join at linkage distances of less than 0.45. For bats, faunas below 750m cluster together at PD=0.2, and all highland bat faunas join together to the exclusion of these at PD < 0.4. Analysed with a coarser scale, mouse faunas below l000m join to the exclusion of higher elevation faunas.
All three cluster analyses also identify a lesser distinction between faunas of upper and lower montane habitats. For birds, faunas between 500 and 1500m cluster tightly, whereas for bats, only faunas at 750-1500m are joined at a linkage distance of < 0.2. For both, highland faunas (1500-3500m) cluster tightly (<0.2) and coherently. In
O Blackwell Science Ltd 1998,]ournol of Biogeography, 25, 593-607
0.0 0.1 0.2 0.3 0.4 0.5 0.6 0.7 Linkage Distance
3250 3500
0.0 0.1 0.2 0.3 0.4 0.5 0.6 0.7
b. Linkage Distance
0.0 0.1 0.2 0.3 0.4 0.5 0.6 0.7
Linkage Distance
< 500 750
FIG. 2. Cluster analyses of elevational zones for Manu vertebrates: (a) birds, (b) bats, and (c) mice. All analyses are based on percentage disagreement [i.e. distance (x,y) = (count of x, #y,)li] and their hierarchical relationships were reconstructed using the unweighted pair-group method (UPGMA).
-7
contrast, mice at intermediate elevations are strongly differentiated from highland assemblages as well as from lowland faunas, and the linkage distances exceed 0.4 for the 1000-2000 m and 2000-3500 m groups.
Elevational range profiles
Profiles of elevational ranges for birds, bats, and mice at Manu are presented in Fig. 3. The profile of bird ranges is dominated by the large number of species occurring in lowland habitats. However, a number of species are found on the lower montane slopes (< 1600m) that do not also occur in the lowlands. Very few bird species extend over most of the transect, and a sizeable number of species (E 100) are endemic to the highlands. Roughly a third of the avifauna does not occur in the lowlands (< 500 m).

598 Bruce D. Patterson e t al.
0 100 200 300 400 500 600 700 800 900
Elevational ranks of 901 species
0 15 30 45 60 75 90 105 120
Elevational ranks of 129 species
0 5 10 15 20 25
Elevational ranks of 28 species
FIG. 3. Elevational range profiles for three vertebrate groups: (a) birds, (b) bats, and (c) mice. Bars indicate the maximum and minimum elevational limits of each species' range, and species are ordered along the abscissa by ranked elevational midpoints. Discrete elevational faunas have no members in common and abutting range limits, whereas gradual change is reflected by individualistic responses of species.
The profile for bats resembles but differs significantly from this pattern. Most bat species occur in the lowlands (83% below 500m), most occur only in the lowlands, and those found at higher elevations also commonly occur below. Many bat species have broad elevational ranges, but there is little evidence of discrete elevational zonations or of highland endemism. Only a handful of species are endemic to the highlands, and only an eighth of the species is restricted to elevations above 500 m.
Differences between bat and bird profiles are minor compared with the distinctive profile of mice. For mice, the number of highland endemics approximately equals the number of lowland endemics. Several murid species occur only at middle elevations, and no species extends over the entire elevational range. Three or four relatively discrete
assemblages of mice replace one another along the elevational gradient.
Elevational range limits
The continuous variation shown by elevational range profiles can be made discrete by using two-dimensional histograms for range maxima and minima. Fig. 4 contains 2- D histograms for each vertebrate group over 500-m intervals ending at 3500 m. Among birds, most lowland species reach their range maxima below 1500m, and very few surpass this elevation. One or more bird species exhibits each combination of range maxima and minima. The relatively large number of species exclusive to the highlands (the cell farthest to the right) and diminishing numbers of species that extend from this zone to lower elevational zones are clear traces of a distinctive highland avifauna.
The histogram for bats clearly depicts most species as occurring at the lowest elevations. There is a sharp decline in the number of ranges extending above 1000m, but a greater proportion of lowland species reach high elevations than in birds. Very few species have their lower limits above 1000 m, and only one is limited to elevations above 2000 m. This accounts for the virtual absence of a highland fauna in the rightmost cells of the figure.
As before, mice present the most distinctive patterns. No lowland species of mouse extends more than half-way up the transect, nor does any of the numerous highland species extend to the transect's foot. An appreciable number (17% of the species) of mice occurs neither above nor below but is restricted to intermediate elevations (cells in centre- foreground of each histogram). This group corresponds to Eastern Versant endemics that are virtually absent in the bat fauna. The histogram for birds also reveals numerous Eastern Versant endemics, but they are not as obvious alongside the numerous lowland species disappearing at middle elevations.
Elevational range amplitude
Range amplitudes for the three vertebrate groups were evaluated, comparing species classed on the basis of their elevational ranks (Fig. 5; the range of elevations for each class can be determined by inspection of Fig. 3). Both birds and mice exhibit small average range amplitudes, and for birds, standard errors are minute. Avian range amplitude tends to increase across elevational classes, but a regression of mean values is not significant (P> 0.08). From the median class, where range amplitude averages 807 m, range breadth actually declines to 762 m and to 710m in the two classes of species found at highest elevations.
The range amplitudes of bats obviously increase with elevation. For bats, a linear regression of mean amplitude among the five classes is both highly significant (P< 0.003) and descriptive (adj. R2 = 0.95). Despite the expanding error bars on mean estimates, estimated amplitudes of each elevational class are practically nonoverlapping. The elevational ranges of bats populating the highest elevations are enormous, averaging 2196 m (SD = 1079), two-thirds of the length of the entire gradient.
0 Blackwell Science Ltd 1998.]ournal of Biogeography. 25. 593-607
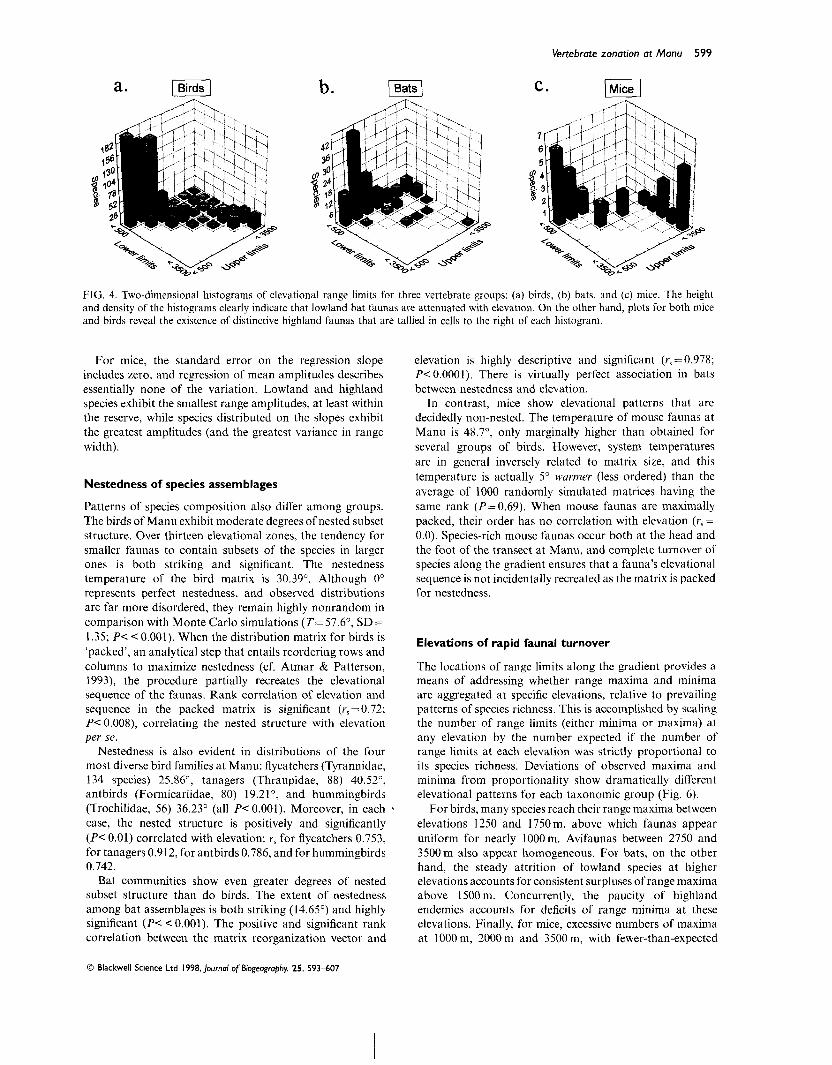
Vertebrate zonation at Manu 599
1 Mice I
FIG. 4. Two-dimensional histograms of elevational range limits for three vertebrate groups: (a) birds, (b) bats, and (c) mice. The height and density of the histograms clearly indicate that lowland bat faunas are attenuated with elevation. On the other hand, plots for both mice and birds reveal the existence of distinctive highland faunas that are tallied in cells to the right of each histogram.
For mice, the standard error on the regression slope includes zero, and regression of mean amplitudes describes essentially none of the variation. Lowland and highland species exhibit the smallest range amplitudes, a t least within the reserve, while species distributed on the slopes exhibit the greatest amplitudes (and the greatest variance in range width).
Nestedness of species assemblages
Patterns of species composition also differ among groups. The birds of Manu exhibit moderate degrees of nested subset structure. Over thirteen elevational zones, the tendency for smaller faunas to contain subsets of the species in larger ones is both striking and significant. The nestedness temperature of the bird matrix is 30.39". Although 0" represents perfect nestedness, and observed distributions are far more disordered, they remain highly nonrandom in comparison with Monte Carlo simulations (T= 57.6", SD =
elevation is highly descriptive and significant (r,=0.978; P < 0.0001). There is virtually perfect association in bats between nestedness and elevation.
In contrast, mice show elevational patterns that are decidedly non-nested. The temperature of mouse faunas at Manu is 48.7', only marginally higher than obtained for several groups of birds. However, system temperatures are in general inversely related to matrix size, and this temperature is actually 5" warmer (less ordered) than the average of 1000 randomly simulated matrices having the same rank (P=0.69). When mouse faunas are maximally packed, their order has no correlation with elevation (r,= 0.0). Species-rich mouse faunas occur both at the head and the foot of the transect a t Manu, and complete turnover of species along the gradient ensures that a fauna's elevational sequence is not incidentally recreated as the matrix is packed for nestedness.
1.35; P i < 0.001). When the distribution matrix for birds is Elevations of rapid faunal turnover 'packed', an analytical step that entails reordering rows and columns to maximize nestedness (cf. Atmar & Patterson, 1993), the procedure partially recreates the elevational sequence of the faunas. Rank correlation of elevation and sequence in the packed matrix is significant (r,=0.72; P < 0.008), correlating the nested structure with elevation per se.
Nestedness is also evident in distributions of the four most diverse bird families at Manu: flycatchers (Tyrannidae, 134 species) 25.86", tanagers (Thraupidae, 88) 40.52", antbirds (Formicariidae, 80) 19.21°, and hummingbirds (Trochilidae, 56) 36.23" (all P < 0.001). Moreover, in each case, the nested structure is positively and significantly (P< 0.01) correlated with elevation: r , for flycatchers 0.753, for tanagers 0.912, for antbirds 0.786, and for hummingbirds 0.742.
Bat communities show even greater degrees of nested subset structure than do birds. The extent of nestedness among bat assemblages is both striking (14.65') and highly significant ( P i < 0.001). The positive and significant rank correlation between the matrix reorganization vector and
The locations of range limits along the gradient provides a means of addressing whether range maxima and minima are aggregated at specific elevations, relative to prevailing patterns of species richness. This is accomplished by scaling the number of range limits (either minima or maxima) at any elevation by the number expected if the number of range limits a t each elevation was strictly proportional to its species richness. Deviations of observed maxima and minima from proportionality show dramatically different elevational patterns for each taxonomic group (Fig. 6).
For birds, many species reach their range maxima between elevations 1250 and 1750m, above which faunas appear uniform for nearly 1000m. Avifaunas between 2750 and 3500m also appear homogeneous. For bats, on the other hand, the steady attrition of lowland species at higher elevations accounts for consistent surpluses of range maxima above 1500m. Concurrently, the paucity of highland endemics accounts for deficits of range minima at these elevations. Finally, for mice, excessive numbers of maxima at 1000 m, 2000 m and 3500 m, with fewer-than-expected
O Blackwell Science Ltd 1998,Journal of Biogeography, 25, 593-607

600 Bruce D. Patterson et al.
z o o Birds 1
lowest class 2 3 4 highest class Elevational rank
400
0
t
=,=
FIG. 5. Range amplitude as a function of elevation of three vertebrate groups: (a) birds, (b) bats, and (c) mice. Classes on abscissa correspond to pentiles of species ranked by elevational midpoint, minima, and maxima, and thus to segments of the abscissa in the range profiles (Fig. 3). Depicted values are mean range amplitude SE mean for each class. Stevens' Rule predicts that range amplitude should be greater at higher elevations.
lowest class 2 3 4 highest class Elevational rank
g 2000 - 3 1600 -g 1200
800
400
0
range boundaries at intervening elevations, suggest the existence of three zones of relative faunal homogeneity.
l:
D I S C U S S I O N
lowst class 2 3 4 highest class Elevational rank
Our analyses corroborate and quantify general impressions of faunas along the Eastern Versant. The region's great biological diversity is clearly rooted in the apposition of three distinctive endemic regions: the lowland Amazonian fauna, the highland Altiplano fauna, and the ribbon-like strip of the Eastern Versant itself. To a large degree, the zonation patterns we have documented reflect the diversity, endemism, and species similarity of the focal groups in these different biotic regions.
I I 0 500 1000 1500 2000 2500 3000 3500
Elevation (m)
b. +goo% Range maxima T
+120%
B +eo%
exp.
40%
-200% 1 0 500 1000 1500 2000 2500 3000 3500
Elevation (m)
c. +I2016 +80X
A
A
A
0 500 1000 1500 2000 2500 3000 3500 Elevation (m)
FIG. 6. Aggregation of range limits for three vertebrate groups: (a) birds, (b) bats, and (c) mice. Symbols depict deviations of range minima (closed circles) and range maxima (closed triangles), relative to the number expected for that interval on the basis of its species richness. Random expectation for each plot is identified as y = (O- E)IE=O (the horizontal line marked 'exp'. The broken line at 3500m in (b) signifies a range maximum not plotted to scale. Elevations with especially high species turnover have positive deviations for range minima, range maxima, or both. Excess minima at the lowest elevation and maxima at the highest represent definitional artefacts, because any species present must reach its boundaries in these intervals. See text for discussion.
Bird species diversity along the Eastern Versant of the Andes is only slightly lower than in Amazonia, but endemism is much higher on the slopes (Stotz et ul., 1996). There are two major parts of this montane element-a set of open-habitat species related to those of the temperate grasslands and deserts of Patagonia in southern South America (Vuilleumier, 1980), and a larger set of forest species with affinities to other montane regions and to the lowland forest avifauna (Bates & Zink, 1994). Along a gradient, the magnitude of the lowland element is obvious; nearly 213 of the bird species in Manu are found in the
0 Blackwell Science Ltd 1998,lournal of Biogeography, 25, 593-607

Vertebrate zonation at Manu 60 1
lowlands. The diversity of birds along the elevational gradient is dominated by the lowland diversity that attenuates upslope, leading to a decline in diversity upslope (Fig. la). Most of the lowland diversity has fallen out by 1500m (Fig. 4a). Above this elevation, the avifauna is composed almost entirely of montane elements. Even on the lower Andean slopes above 500 m, despite the presence of significant number of lowland birds, the montane element is large enough that the entire slope clusters together to the exclusion of the lowland elevations (Fig. 2a). The montane slopes above 1500 m, with little lowland contribution, cluster tightly (Fig. 2a). Range amplitude peaks at intermediate elevations (Fig. 5a), contrary to Stevens' Rule, despite the declining diversity with elevation. Increased turnover in the form of an excess of range maxima at intervals along the slope (Fig. 6a) indicate elevational zonation, despite a number of species exhibiting wide elevational ranges (Fig. 3a).
Bats are highly diverse but weakly endemic in the Amazon Basin. There, two or three genera are endemic (Scleronycteris, Neoplatymops, and Artibeus [Koopmania]) and most species are wide ranging (Koopman, 1982). Endemism of bats is weak to non-existent in the Eastern Versant and Altiplano, where endemic genera are lacking and richness is much lower. Only three of the eight families of bats recorded in Manu extend above 2000 m. The extensive elevational gradient of the Andes acts to limit differentially the ranges of lowland species, and the faunas found at successively higher elevations are mainly impoverished and attenuated lowland faunas. These facts account for the monotonic decline in species richness at higher elevations (Fig. 1 b), for the low linkage distances among high-elevation sites (Fig. 2b), and the distinctive fan-shaped elevational range profile (Fig. 3b). They are also evident in the paucity of occupied cells to the right and forefront of the 2-D histograms (Fig. 4b), expanding range amplitudes at higher elevations (Fig. 5b), pronounced nestedness correlated with elevation, and consistent excess of range maxima (Fig. 6b).
The mice of Manu are part of an extensive Neotropical radiation that began in the Miocene or Pliocene and still continues (Reig, 1981; Smith & Patton, 1993). Each of the biotic regions included within the reserve supports diverse
- -
mouse faunas, but regional endemism is not equivalent. The Amazonian lowlands support mainly wide-ranging species belonging to the oryzomyine and thomasomyine tribes; only a single endemic genus (Scolomys) is known. In contrast, the Altiplano fauna, which is dominated by phyllotine and akodontine species, includes numerous endemic genera (i.e. Chinchillula, Auliscomys, Andinomys, Galenomys, Punomys, Neotomys, and Chroeomys). Between these faunal centres are the Andean slopes, which also support several mouse genera. However, most (including the genera Aepeomys, Anotomys, Chibchanomys, and Chilomys) are found in more northern latitudes; only Neusticomys and Lenoxus occur in southeastern Peru.
A necessary corollary of generic endemism is local adaptation, often over extended periods of time. In the case of mice, the powerful environmental gradient at Manu does not winnow species from a coherent lowland fauna, as is the case for bats (Fig. 3c). Rather, mouse faunas are endemic
to narrower elevational zones (Figs 5c and 6c), and succeeding zones support replacement faunas that are presumably adapted to local conditions (Figs 2c and 4c). Thus, the environmental transition from lowland forest to the stark Altiplano does not cause steady declines in species richness (Fig. Ic); instead, it initiates wholesale faunal replacements at species, genus, and even tribal levels.
A caveat
As noted at the onset, the taxa we analysed and the scale at which we analysed them were designed to reduce sampling biases. Before weighing our results against several ecological and biogeographic patterns, we need to acknowledge a complication introduced by our methods: differences between groups in taxonomic and ecological diversity. The Manu reserve houses at least ten orders, thirty-four families, and 193 species of mammals (Pacheco et a/., 1993; Patterson et al., 1996), and eighteen orders, seventy-two families, and 901 species of birds (Fitzpatrick et a/., in prep). To compensate for group differences in sampling efficacy, we compared patterns based on all birds with those from eight families, fifty-four genera, and 129 species of bats and from a single family, thirteen genera, and twenty-eight species of mice. For all the ecological variety of the latter, they exploit only a tiny fraction of the niche space occupied by birds. The taxonomic and ecological breadth of groups must be considered in relating group patterns to theoretical predictions or the 'general pattern.'
Nor is this bias limited to pattern definition. Ecological mechanisms underlying the distinctive faunal zonations that we described may prove explicable with reference to relative abundance patterns. Because only a portion of tropical biotas are accessible to any given sampling technique, abundance analyses are most feasible for a methodologically (rather than conceptually) defined subset of natural biotas. For example, mist-netting of bats yields repeatable, predictable captures of stenodermatine frugivores, whereas that technique yields only accidental captures of many insectivorous groups (cf. Handley et al., 1991). The bias in abundance estimators can be reduced by focusing on sets of species that are more homogenous ecologically. However, this only increases the taxonomic biases of the study.
Are elevational zonations distinct and associated with ecotones?
Our analyses document faunal patterns consistent with elevational zonation, but not all analyses were equally useful in this regard. Cluster analyses grouped elevational zones with similar species compositions, but fail to distinguish differentiation caused by species dropping out or newly appearing in a given zone. Two-dimensional representations of this kind also invariably distort the pair-wise matrices on which they are based. Nested subset analyses measure the degree to which different faunas are graded subsets of one another, and hence offer inverse assessments of faunal distinctions. However, the clearest evidence for the magnitude and boundaries of faunal zonations comes from aggregation of range limits (Fig. 6). Unlike other analyses,
0 Blackwell Science Ltd 1998, journal of Biogeography, 25. 593407
602 Bruce D. Patterson et al.
aggregation analyses independently evaluate both the appearance and disappearance of species along the gradient and offer assessments of nonrandomness that are specific to each zone.
In his study of birds in the Cordillera Vilcabamba, Terborgh (1971; see also 1985) concluded that the ecotones between forest types along the elevational gradient were not associated with exceptionally high levels of species turnover. Our results broadly agree-levated rates of species turnover (Figs 4 and 6) are not closely associated with transitions between vegetation types (c. 500m, 1400m, 2800m, and 3200m). This incongruence seems remarkable because clusters of both birds and bats appear to be associated with each of the vegetational types (lowland rainforest, montane rainforest, cloud forest, elfin forest, and puna; Fig. 2), and each group exhibits turnover throughout the gradient. Evidence for faunal correspondence with vegetational zones is weakest for mice, but imprecise species limits among murids may blur what might otherwise be clearer correspondence. Among mice, three distinct elevational zones are apparent, roughly corresponding to lowland plus montane rainforests, cloud forest, and elfin forest pluspuna.
Association between faunal limits and vegetational ecotones is strongest for birds, where the five distinct clusters in Fig. 2(b) correspond closely to the five distinct vegetation types recognized (see also Terborgh, 1971). Among bats, agreement is good, but lowland rainforest faunas (below 500 m) are not clearly separable from those on lower montane slopes.
This is partly a consequence of the small montane component to bat diversity (Figs 3 and 4), making lower- slope bat faunas simply attenuated versions of the lowland fauna. For birds, there is a much larger purely montane element which first appears on the lower slopes. For example, representatives of the widespread, diverse, strictly montane genera Heliodoxa, Grallaria, Phylloscartes, and Myioborus each reach their lower limits at or below 600 m. Additionally, more of the lowland bat fauna extends onto the slopes than do birds.
Nevertheless, montane rainforest avifaunas exhibit a composite character. Most of the lowland bird species lacking from the slopes are species associated with lacustrine or riverine habitats. Virtually all terra jirme forest bird species also occur on the slopes, but most drop out before the transition to cloud forest is reached. As a result, while separable from lowland rainforest and cloud forest faunas, bird assemblages in montane rainforest are an admixture of the lower portion of the montane avifauna and most of the terrafirme species of the lowlands.
The transition from elfin forest topuna grassland at about 3200 m is the most obvious in terms of vegetation structure, but it is only weakly marked in analyses of both birds and mammals (Fig. 2). The puna fauna is strongly distinguished from the fauna of the forested slopes, both historically and ecologically (Reig, 1981; Cracraft, 1985). In terms of habitat use, there is almost no overlap among the species that use the grasslands and those using high elevation forest habitats. The failure of our analyses to clearly separate the puna element probably reflects the interdigitation of forest and
grassland habitats across several hundred metres within the reserve.
Is range amplitude a function of elevation?
On a geographical scale, species ranges often appear to follow 'Rapoport's Rule': species at high latitudes have greater environmental tolerances and occupy broader latitudinal ranges than low-latitude species (Rapoport, 1982; Lyons & Willig, 1997). Stevens (1992) reformulated this rule and applied it to elevational ranges of species, so that 'Stevens' Rule' applies to elevations and elevational amplitude. He produced support for the hypothesis from the elevational ranges of trees, insects, and various vertebrate groups. Lack of appropriate datasets led Stevens to base some of his analyses on regional compilations of species ranges. Range data presented in Fig. 3, especially for birds and mice, are highly appropriate for such analyses because they represent point samples (see also Roy et al., 1994).
Evidence for Stevens' Rule from Manu's vertebrates is mixed. Bats present the clearest embodiment of this pattern: virtually all bat species occurring at high elevations also occur at lower ones, and the progressive nature of this pattern makes for climbing range amplitudes in Fig. 5. On the other hand, birds and mice show little evidence for greater range amplitude at higher elevations-in both, elevational range is largest for species at median elevations. Contrasting patterns in these vertebrates seems explicable with reference to their patterns of endemism. Bats lack a centre of endemism on the Altiplano, and highland species do not replace lowland forms along the slope. The strong gradient in species richness (Fig. la) and lack of replacement along the slopes practically guarantees agreement with Stevens' Rule. In contrast, both birds and mice exhibit pronounced endemism on the Altiplano, and many species are highly specialized to these habitats, with appropriately narrow distributional ranges. For both groups, species at the highest elevations exhibit lower range amplitudes than species at median elevations (Fig. 5). Considering only their ranges in the Manu reserve, Altiplano mice have range amplitudes that average about 10% those of class 3 species (80 vs. 785 m). However, our transect barely extends into puna habitats, and most Altiplano species reach much higher elevations outside the reserve.
Is there a 'general pattern' of species diversity with elevation?
Rahbek (1995) sought to answer this question with a survey of literature on tropical plants and animals. He generally detected patterns of species decline with elevation, but only eighteen of sixty-nine datasets revealed monotonic declines; in fifteen others, richness remained horizontal until reaching a threshold for decline, and in thirty-six additional datasets, a hump-shaped pattern was obtained. The prevalence of hump-shaped diversity curves in other systems has attracted much recent attention. Some have argued that diversity peaks at intermediate levels of disturbance (Petraitis et al., 1989) and have applied this argument to tropical forest diversity (e.g. Salo et al., 1986). Rosenzweig (1992) argued
O Blackwell Science Ltd 1998,]ournal of Biogeography, 25, 593-507
Vertebrate zonation at Manu 603
that hump-shaped diversity curves were produced by peaks of diversity at intermediate productivities.
At present, we can only speculate how disturbance and primary productivity vary along this 3-km elevational gradient. In general, productivity should be correlated with temperature, precipitation, and evaporation regimens. Terborgh (1971) presented variation in morning temperatures in the Cordillera Vilcabamba which dropped at the regular rate of 5.6 OC/lOOO m during the dry season. However, precipitation varies greatly and irregularly along the transect. The Cocha Cashu Biological Station (380 m) receives an average of about 2000mm per year, but five times that precipitation falls annually at nearby Quince Mil (at 650 m, in an adjacent valley; Terborgh, 1990), while little precipitation surpasses the Eastern Versant to water the highland puna (Pearson & Ralph, 1978). In the humid tropics, evaporation rates usually decline with elevation but, in some areas (probably including SE Peru), increase again slightly at the highest elevations (Nullet & Juvik, 1994). In concert, these abiotic factors indicate that, whatever its precise variation with elevation, productivity (and hence species diversity) should peak somewhere along the gradient, most probably in its lower reaches.
Instead, Manu's vertebrates show smooth declines of richness with elevation (bats and birds) or lack of appreciable variation (mice; Fig. I). In New Guinea (from Flannery, 1990; analysis by Rahbek, 1995) and the Philippines (Heaney et al., 1989), bats also exhibit monotonic declines i?l richness with elevation, whereas mice and rats show humpshaped diverstty patterns. In Manu, the mouse pkttern sharply contrasts in being more trough- shaped. In all three areas, the exceptional character of murid patterns is likely a consequence' of the group" limited ecological range and unique history. The pattbrns themselves are defined by dozens, rather than hundreds, of species. Other taxomomically and ecologically resbricted groups also exhibit aberrant elevational patterns: the richest salamander faunas of southern Mexico and Guatemala are found in cloud forest, not lowland forest (Wake @t al., 1992).
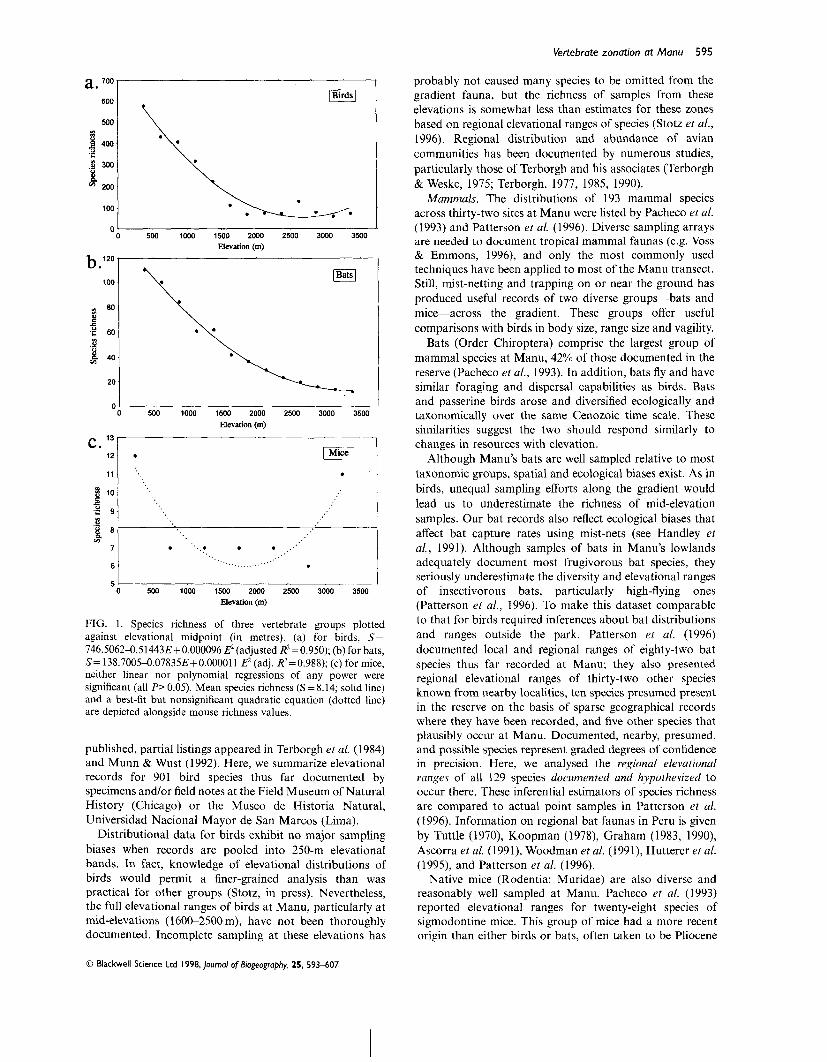
Besides mice, Manu supports many other families of rodents and rodent-like mammals: five species of squirrels, one porcupine, one guinea pig, one pacaram, one capybara, two pacas, two agoutis, seven spiny rats, seventeen opossums, and one shrew opossum CPacheco et al., 1993). Many of these families lack close analogues among small mammals elsewhere; Mares & Ojeda (1982) likened them to hyraxes, duikers, jackrabbits, hippos, Iliarmots, and chevrotains. If one adds, these rodents and marsupials to the mouse faunas of the foregoing analyses, the distinctiveness of rodent patterns vanishes. In fact, high diversity in the lowlands causes speoies richness patterns to closely resemble those for bats and birds (Fig. 7)-in all, species richness shows sharp monotonic declines with elevation throughout the forest zones. The promounced curvilinearity in Fig. 7, relative to that in Fig. l(a), is likely an artefact of inadequate sampling at intermediate elevations, coupled with the comparative richness of the distinctive puna rodent fauna.
Row can this general pattern-monotonic declines in diversity with elevation $or three different groups~bq
reconciled with different diversity patterns reported by others (e.g. Rosenzweig, 1992; Olson, 1994; Rahbek, 1995)? One answer might be that 'peak' richness at Manu occurs below the foot of our transect (< 350m), but this is an unsatisfying and improbable explanation. We believe a better one lies in properly assessing both the units and the scale at which such patterns are, measured. For example, our samples at each elevation included the full range of sampled habitats, as well as any temporal variation expressed at repeatedly sampled sites; our diversity estimates consequently include 'between-sample' or 'beta' variation. Such estimates are typically larger than their point-sample analogues and more fully reflect .the spatial heterogeneity and temporal variability of the environment. In discussing the mid-elevation bulge in both diversity and abundance of various tropical invertebrate assemblages, Olson (1994) called specific attention to the greater spatial and temporal patchiness in tropical lowlands. If the sampling scheme chosen integrates over such patchiness, or is proportional to rates of species accumulation, then cumulative species totals will exceed those of more homogeneous point samples.
Unfortunately, this kind of sampling variation clouds attempts to understand the ecological mechanisms which underlie diversity patterns. However, it lays bare the biogeographic and evolutionary context of the diversity under study. The monotonic declines of diversity at Manu are ultimately governed by the overwhelming diversity found in Manu's lowlands. This diversity is unsurprising in view of the vast extent of the Amazonian lowlands and, thence, by the lower extinction rates and higher speciation rates characteristic of larger areas (cf. Terborgh, 1973; Rosenzweig, 1992). Lowland diversity is abetted by heightened habitat diversity in the lowlands, itself a coevolved response of organisms to their environments. Differential diversity of habitats is particularly apparent among aquatic organisms; whole guilds of skimming and wading birds are restricted in Manu to elevations below 500 m.
Ignoring species typical of habitats found only in the lowlands and focusing solely on 'forest' species, does diversity still show steady de~lines across the gradient? Preliminary analyses (Stotz et al. unpublished) indicate that forest birds may in fact depict a hump-shaped curve in Manu, peaking on slopes near 1000m. But is this an ecologically mediated response to disturbance or productivity patterns or rather is it a by-product of the ecotone between lowland torest and lower montane farest biotas (and therefore a product of history and environment, as well as ecology)? More detailed estimates of diversity and abundance variation along the transect will be required to assess whether the number of species documented varies as a function of thenuinber of individuals sampled (Rahbek, 1995), a necessary tehet of the productivity hypothesis.
The foregoing discussion has repeatedly ~alled attention to limited sampling at intermediate elevations of the transect. This is mainly a consequence of the very steep slopes (and hence difficult and uncomfortable oamps) that prevail in this region. The principal eefsct of this liniitation is not to exclude species from faunal lists, although this is possible for all three groups. Rather, incomplete $ampling reduces
Q Blackwell Sclence Ltd 1998, Journal of Biogeography, 25, 593-607

604 Bruce D. Patterson et al.
0 40
A other rodent families 0 marsupials
10
A 0
Elevation (m)
FIG. 7. Species richness patterns of three small mammal groups in Manu (data from Pacheco et al., 1993). Although a regression fitted to species richness of mice has no slope, one fitted to all rodents and marsupials is highly significant: S=59.428-0.0409 E+0.000001 @ (all coefficients with P< 0.0001; adj. R2=0.989). The curve has the same quadratic form as shown by bats and birds over the gradient, although the pronounced bowing may be partly artefactual. See text for discussion.
the species richness of mid-elevation assemblages by failing to include the full elevational ranges of sampled species. This may make plots of species richness with elevation appear more curvilinear; least-squares regression showed this relationship to be quadratic (bow-shaped) for both birds and bats, and a strongly curvilinear relationship well fits the mouse data (Fig. 1). Exhaustive sampling is needed to eliminate the possibility that this curvilinearity is artefactual.
Conservation implications
Because the distribution, species richness, and endemism patterns of birds are so well known, many have suggested that birds can be used as proxies for understanding the enormous diversity of other poorly known groups in the tropics (e.g. Diamond, 1985; Fjeldsk 1991; ICBP, 1992; Stotz et al., 1996). This view assumes that the diversity and endemism of birds mirrors that in other groups-by identifying and preserving areas of importance to birds, conservationists can coincidentally target areas important to remaining biodiversity.
Much evidence supports the idea that, at a regional level, the endemism and diversity df birds and ot4er groups are correlated (LCBP, 1992; Biodiversity Suppont Pcogram et al., 1995). However, thio study suggests that, at more loeal scales, elevational patterns of diaereafi groups may be so distinctive that a conservation plan tailored for,one of these groups might be inappropriate for the remainder, Because these difierences exist among homeothermic veflebraites, we expect that patterns of diversity and endemism b r plants and invertebrate groups might reveal even greater contrasts. On general grounds, we expect that patterns of endemism should show greater similarities among groups because of the importance of history-which is shared-in generating them. In contrast, diversity patterns appear more responsive to particular fm$ures of group ecology, so that diversity patterns should present stronger contrasts.
In many cases, the elevational patterns exhibited by birds proved to be intermediate to the highly distinctive patterns of bats and mice. In species richness, faunal similarity, discreteness of zonations, and range amplitude, avian patterns included elements exhibiting the same patterns shown by bats and other elements bearing greater resemblance to mice. We take this evidence of heterogeneity in pattern as a consequence of the biological diversity of birds: Future studies of birds might profitably focus on biologically defined subdivisions of this diversity: we would expeot~difltinctly different elevational patterns for migratory birds, forest understory birds, and soaring birds.
Even where diversity patterns of different taxa are similar or identical, conservation strategies may be equivocal. Areas of high richness and pronounced endemism are not always congruent-at Manu, richness and endemism are inversely correlated (see also Petenson et al., 1993). Rich but widespread faunas and floras characterize many lowland forest regions, while poorer yet unique biotas are limited to the mountains. If conservation efforts focus on areas supporting the greatest numbers of species, then the chief beneficiaries are widespread species with lower vulnerability to habitat perturbation. Conversely, if efforts target only zones of high endemi~m, suoh as the slope communities, only a handful of taxa may be protected. Preserving the full speotrw of habitats along the Eastern Versant is the only way to protect both the richest and the most unique communities. Moreover, because we know little about population structure of species along the gradiemt or the ~oles that daily and seasonal movements play in resource exploitation pqtterns, broad-spectrum strategies also guard agaiipst the unwitting omission of essential demographic or resovrGe components from the conservation plan.
ACKNOWLEDGMENTS
This work was possible only through the concerted efforts of numerous people and insti%utions, especially during the
O Blaekwell Science Ltd 1998, Joumal'of Biogeography, 25, 593-607

Vertebrate zonation at Manu 605
last 15 years. A key participant in the initial surveys was D.E. Willard; other members of these trips included R.J. Izor, B.L. Clauson, D.H. Clayton, L. Kinkel, and W.E. Southern. Field Museum collecting trips were supported by the H.B. Conover and Ellen Thorne Smith funds at Field Museum, as well as NSF award BRR-8508361 (to JWF). Pacheco's fieldwork was supported by BIOLAT, the Pew Charitable Fund, and the MacArthur Foundation (to K. Young and B. Le6n). Solari's fieldwork has been supported by a grant from SEACON through the Chicago Zoological Society and by the Marshall Field I11 Fund of Field Museum. Parts of the analysis were supported by the Street Mammal Expeditionary Fund of Field Museum and benefitted from the expert assistance of J.D. Phelps and M. Eigi. Ohr sincere thanks to W. Atmar, J.M. Bates, J.W. Brown, J. Fooden, D.K. Moskovits, M.R. Willig, and an anonymous reviewer for numerous helpful comments on several drafts of the pager that have contributed greatly to clarifying our presentation.
REFERENCES
Anderson, $, & Marcus, L.F. (1993) Effect of quadrat size on measurements of species density. J. Biogeogr. 20, 421-428.
Ascorra, C.P., Wilson, D.E. & Romo, M. (1991) Lista anotada de 10s quir6pteros del Parque Nacional Manu. Peru. Publ. Mus. Hist. Nut,, University Nac. May Sun Marcos, Ser. A, Zool. 42, 1-14.
Atmar, W. & Patterson, B.D. (1993) The measure of order and disorder in the distribution of species in fragmented habitat. Oecologia, 96, 373-382.
Atmar, J.W. & Patterson, B.D. (1995) The nestedness temperature calculator: a Visual Basic program, including294presence-absence matrices. AICS Research, hc., University Park, NM and The Field Museum, Chicago, (htt~:llaics-research.com/nestednessl tempcalc.htm1).
Bates, J.M. & Zink, R.M. (1994) Evolution into the Andes: Molecular evidence for species relationships in the genus Leptopogon. Auk, 111, 507-515.
Biodiversity Support Group, Conservation International, The Nature Conservancy, Wildlife ~onserbat'ation Society, World ResoWces' Institute, and World Wildlife FMd (1995) A'reglbnal analysis of geographic priorities for biodiversity conser~&tibh irt Latih Ainericlrn and the Caribbean. Biodiversity Support Program, Washington, DC.
Brown, JIPI. (1995) Macroecology. University of Chicago Press, Chicago.
Cracraft, J. (1985) Fbstorical biogeography and patterns of differentiation within the South American avifauna: areas of endemism. Neotrbpical orbithhlogy (ed. by P.A. Buckley, M.S. Foster, E.S. Morton, R.S! Ridgely & F.G. Bbaldey), pp: 49-84. Ornithological Monographs 36, American Ornithologists Union, Washington DC.
Diamond, J.M. (1910) Ecoldgical oonsequences of island colonization by South~est Pacific birds. I. Types of niche shifts. Pkoc. Nut. Acad. Scl. (USA), 67, 529-537.
Diamond, J.M. (1972) Avifauna of the eastern highlands of New Guinea. Pub1 Nutcall Ornithol. Club 11, Cambridge, Mass.
Diamond, J.M, (1973) Distributional ecology of New Guinea birds. Science 179, 759-769.
Diamond, J.M. (1976) Relaxation and differential extinction on land-bridge islands: applications to natural preserves. Proc. 16th Znt. Ornith. Congr, Canberra, Australia, 616-628.
Diamond, J.M. (1985) The design of a nature reserve system for Indonesian New Guinea. Conservation biology: the science of scarcity and diversity (ed. by M.E. Soulk), pp. 485-503. Sinauer, Sunderland, Mass.
Erwin, T.L. (1988) The tropical forest canopy: the heart of biotic diversity. Biodiversity (ed. by E.O. Wilson), pp. 123-129. National Academy Press, Washington, DC.
Fjeldsi, J. (1991) The conservation of biological diversity: using birds to set priorities. Environmental concernsdn inter- disciplinary exercise (ed. by J.A. Hansen), pp. 157-175. Elsevier, London.
Flannery, T. (1990) Mammals of New Guinea. Australian Museum and Robert Brown, Sydney.
Foster, R.B. (1990) Floristic composition of the Rio Manu floodplain forest. Four neotropical forests (ed. by A.H. Gentry), pp. 99-111. Yale University Press, New Haven.
Gentry, A.H. (ed.) (1990) Four neotropical forests. Yale University Press, New Haven.
Graham, G.L. (1983) Changes in bat species diversity along an elevational gradient up the Peruvian Andes. J. Mamm. 64, 559-571.
Graham, G.L. (1990) Bats versus birds: comparisons among Peruvian vertebrate faunas along an elevational gradient. J. Blozeo~r. 17. 657-668. - -
Graves, G.R. (1988) Linearity of geographic range and its possible effect on the population structure of Andean birds. Auk, 105, 47-52.
Grinnell, J. (1917) The niche-relationships of the California thrasher. Auk, 34,427-433.
Haffer, J. (1974) Avian speciation in tropical Soith America. Publ. Nuttall Ornithol. Club 14, Cambridge, Mass.
Haffer, J. (1990) Avian species richness in tropical South America. Stud. Neotrop. Fauna Envir. 25, 157-183.
Handley, C.O. Jr, Wilson, D.E. & Garnder, A.L. (eds) (1991) bemography and natural history of the common fruit bat, Artibeus jamaicensis, on Barro Colorado Islands, Panam&. Smithson. Contrib. Zool. 511, 1-173.
Heaney, L.R., Heideman, P.D., Rickart, E.A., Utzurrum, R.B. & Klompen, J.S.H. (1989) Elevational zonation of mammals in the central Philippines. J. trop. Ecol. 5, 259-280.
Hershkovitz, P. (1966). Mice, land bridges and Latin American faunal interchange. Ectoparasites of Panamq (ed. by R.L. Wetzel and V.J. Tipton), pp, 725-751. ield hlus. Nat. Hist, Chicago. 4' Hpb$ell, S.P, & Foster, P.B, ,(I 92J, Short-term ,dynamics pf a neotropical forest; why ecological research mattys to tropical copservatiqn and mana$qmevt, Oikos, 663,48-61.
~ i t t e re r , R., Verhaayh, &f., Qilbr, J, C Pocl)oucky, R. (1995) k n inventory of mammals observed at Panguana Biological Station, Amazonian Peru, Eco~tropic~, 1, 3-20.
ICBP (1992) Puttiag &odiversity on a map: priority areas for global conservation. International Council for Bird Preservation, Cambridge, ,
Koopman, K.E (1978) Zoogeography of Rruvian bats with special emphqsir, on the role of the Andes. Am. Mus. Novit. Z651, 1-33.
Koapmpn, K,F.,(1982) Biogeog~apby sf the bats of South America' Mammalian biology in South America (ed. by M.A. Mares and H.H, Genoways), pp, 273-302, special Publication, Pymatunigg Laboratory of Ecology, 6. Linegvillp, PA.
Lack, D. (1854) The natural regulation of apirqal numbms. Clarendon Press, Oxford.
Lack, D. (1971) Ecological isolation in blvdsdr Blackwell Scientific hblications, Oxford.
Levin, S.A. (1992) The plroblem of pattern and scale in ecology. Ecology, 73, 1943-1967.
Lyons, S.K. & Willig, M.W. (1997) Latitudinal patterns of range
O Blackwell Science Lrd 1998, Journal of B~ogeogrophy, 21, 593-607
606 Bruce D. Patters& et al.
size: methodological concerns and empirical evaluations for New World bats and marsupials. OikoS. 79, 568-580.
MacArthur, R.H. (1958) Population ecology of some warblers of northeastern coniferous forests. Ecology, 39, 599-619.
MacArthur, R.H. (1972) Geographical ecology: patterns in the distribution of species. Harper & Row, New York.
Mares, M.A. & Ojeda, R.A. (1982) Patterns of diversity and adaptation in South American hystricognath rodents. Mammalian biology in South America (ed. by M.A. Mares and H,H. Genoways), pp. 393-432. Special Publications, Pymatuning Laboratory of Ecology 6, Linesville PA.
McDade, L.A., Bawa, K.S., Hespenheide, H.A. & Hartshorn, G.S. (eds) (1994) La Selva: ecology and natural history of a neotropical rain forest. University of Chicago Press, Chicago.
Meserve, P.L., Yunger, Y.A., Gutierrez, J.R., Contreras, L.C., Milstead, W.B., Lang, B,K., Cramer, K.L., Herrera, S., Lagos,
Silva, S.I., Tabilo, E.L., Torreable, M.-A. & Jaksic, EM. (1995) Heterogeneous responses of small mammals to an El Niiio Southern Oscillation Event in northcentral semiarid Chile and the importance of ecological scale. J. Mamm. 76, 580-595.
Munn, C.A. & Wust, W. (1992) Aves que con mayor freciencia se observan o escuchan, o de especial importancia en la Reserva de la Biosfera del Manu. El Paraiso Amazdnico del Peri: Parque Nacional y Reserva de la Biosfera Manu (ed, by K. MacQuarrie), pp. 183-184. Francis 0. Patthey y hijos, Barcelona.
Nullet, D. & Juvik, J.O. (1994) Generalised mountain evaporation profiles for tropical and subtropical latitudes. Singapore J. Dop. Geogr 15, 17-24.
Olson, D.M. (1994) The distribution of leaf litter invertebrates along a Neotropical altitudinal gradient. J. trop. Ecol. 10, 129-150.
Pacheco, V., Patterson, B.D., Patton, J.L., Emmons, L.H., Solari, S. & Ascorra, C.E (1993) List of mammal species known to occur in Manu Biospheqe Reserve, Peru. Publ. Mus. Hist. Nat., Univ. Nac. May. Sun Marcos (Lima), Ser A, Zool. 44, 1-12.
Patterson, B.D., Meserve, P.L. & Lang, B.K. (1990) Quantitative habitat associations of small mammals along an elevational transect in temperate rainforest$ of Chile. J. Mamm. 71,620-633.
Patterson, B.D., Pacheco, V. $ Solari, S. (1996) Distributions of bats along an elevational gradient in the Andes of south-eastern Peru. J. 2001. 240,637-658.
Patton, J.L. & Smith, M.E (1992) Evolution and systematics of akodontine rodents (Muridae: Sigmodontinae) of Peru, with emphasis on the genus Akodon. Biogeografla, 6cologla y conservacidn del bosque montai?~ en el Peri (ed. by K.R. Young and N. Valencia), pp. 83-103. Mem. Mus. Hist. Nut, University of Nac. May. Sun Marcos no, 21, Lima, Per6.
Pearson, O.P. & kdph, C.P. (1978) The diversity and abundance of vertebrates do&$ an altitudinal gradient in Peru. Mem Mus. Hist. Nat. 'Javier Pradb', 18, 1-97.
Peterson, A.T., Flores-Villela, O.A., Letn-Paniagua, L.S., Llbrente- Bousquets, J.E., Luis-Martinez, M.A., Navarro-Sigtienza, A.G., Torres-ChavBz, M.G. & Vargai-Fernandez, I. (1993) Conservation priorities in Mexico: moving up in the world. Biodiv. Letts, 1, 33-38.
Petraitis, P.S., Latham, R.E. L Niesedbauin, R.A. (1989) The maintenance of species diversity by disturbance. Quart. Rev. Biol. 64, 393-418.
Rahbek, C. (1995) The elevational gradient of species richness: a uniform pattern? Ecography, 18, 200-205.
Rapoport, E.H. (1982) Areography: geographic strategies of species. Pergamon Press, Oxford.
Reig, O.A. (1981) Teoria del origen y desarrollo de la fauna de mamiferos de America del Sur. Monogr. Naturae, Publ. Mw. Munlc. Cienc. Nat. Lorenzo Scaglia' 1, 1-162.
Reig, O.A. (1987) An assessment of the systematics and evolution of the Akodontini, with the description of new fossil species
of Akodon (Cricetidae: Sigmodontinae). Studies in Neotropical mammalogy: essays in honor of Philip Hershkovitz (ed. by B.D. Patterson and R.M. Timm), pp. 347-399. Fieldiana: Zool. new set no. 39, Chicago.
Rosenmeig, M.L. (1992) Species diversity gradients: we know more and less than we thought. J. Mamm. 73, 715-730.
Rosennveig, M.L. (1995) Species diversity in space and time. Cambridge University of Press, Cambridge.
Roy, K., Jablonski, D. & Valentine, J.W. (1994) Eastern Pacific molluscan provinces and latitudinal diversity gradient: No evidence for 'Rapoportk Rule'. Proc. Natl. Acad. Sci. (USA), 91, 8871-8874.
Salo, J., Kalliola, R,, Hlkkinen, I., MBkinen, Y., Niemall, P., Puhakka, M. & Coley, P.D. (1986) River dynamics and the diversity of Amazon lowland forest. Nature, 322, 254-258.
Simberloff, D. & Martin, J.-L. (1991) Nestedness of insular avifaunas: simple summary statistics masking complex species patterns. Ornis Fenn. 68, 178-191.
Smith, M.E & Patton, J.L. (1993) The diversification of South American murid rodents: evidence from mitochondria1 DNA sequence data for the akodontine tribe. Biol. J. Linn. Soc. 50, 149-177.
Stacy, E.A., Hamrick, J.L., Nason, J.D., Hubbell, S.P., Foster, R.B. & Condit, R. (1996) Pollen dispersal in low-density populations of three Neotropical tree species. Am. Nat. 148, 275-298.
Stephens, L. & ?'raylor, M.A. Jr (1983) Ornithological gazetteer of Peru. Bird Department, Museum of Comparative Zoology, Harvard University, Cambridge, Massachusetts.
Stevens, G.C. (1992) The elevational gradient in altitudinal range: an extension of Rapoport's latitudinal rule to altitude. Am. Nat. 140, 893-91 1.
Stotz, D.E (in press) Endemism and species turnover with elevation in montane avifaunas in the Neotropics: implications for conservation. Symp. 2001. Soc. London.
Stotz, D.E, Fitzpatrick, J.W., Parker, T.A. I11 &. Moskovits, D.K. (1996) Neotropical birds: ecology and conservation. University of Chicago Press, Chicago.
Terborgh, J. (1971) Distribution on elevational gradients: theory and a preliminary interpretation of distributional patterns in the avifauua of the Cordillera Vilcabamba, Peru. Ecology, 52, 23-40.
Terborgh, J. (1973) On the notion of favorableness in plant ecology. Am. Nut. 107,481-501.
Terborgh, J. (1977) Bird species diversity on an Andean elevational gradient. Ecology, 58, 1007-1019.
Terborgh, J. (1985) The role of ecotones in the distributions of Andean birds. Ecology, 66, 1237-1246.
Terborgh, J. (1990) An overview of research at Cocha Cashu Biological Station. Four Neotropical forests (ed. by A.H. Gentry), pp, 48-59. Yale University Press, New Haven.
Terborgh, J.W., Fitzpatrick, J.W, & Emmons, L.H. (1984) Annotated checklist of the bird and mammal species of Cocha Cashu $liologiGal Station, Manu National Park, Peru. Fieldiana: Zool. 21, 1-29.
Terborgh, J. & Weske, J.S. (1975) The role of competition in the distribution of Andean birds. Ecology, 56, 562-576.
Terborgb, J.W. & Winter, B. (1983) A meth~d for siting p@& and reserves with special reference to Colombia and Ecuador. Biol. Conserv. 27,45-58.
Tilman, D., Wedin, D. & Knops, J. (1996) Productivity and sustainability influenced by biodiversity in grassland ecosystems. Nature, 379, 718-720.
Tuttle, M.D. (1970). Distribution and zbogeography of Peruviaa bats, with comments on natural history, Univ. Kansas Sci. B&ll. 49945-86.
O Blackwell Science Ltd 1998,)ourfiol af'Biogeography, 25,598407
- Voss, R.S. & Emmons, L.H. (1996) Mammalian diversity in
Neotropical lowland rainforests: A preliminary assessment. Bull. Am. Mus. Nut. Hist. 230, 1-1 15.
Vuilleumier, F. (1980) Speciation in birds of the high Andes. Proc. 17th Int. Omithol. Congr., Berlin, 1256-1261.
Wake, D.B., Papenfuss, T.J. & Lynch, J.F. (1992) Distribution of salamanders along elevational transects in Mexico and Guatemala. Tulane Stud. Zool. Bot. (Suppl.)Publ. 1, 303- 319.
Weske, J. (1972) The distribution of the avifauna in the Apurimac Valley of Peru with respect to environmental gradients, habitats and related species. Unpublished Ph.D dissertation, University of Oklahoma, Norman, Oklahoma.
Woodman, N., Timm, R.M., Arana, C.R., Pacheco, V., Schmidt, C.A., Hooper, E.D., Pacheco-A. & C. (1991). Annotated checklist of the mammals of Cuzco Amaz6nic0, Peru. Occ. Pap., Mus. Nut. Hist., University Kansas 145, 1-1 2.
Wooten, J.T. (1994) The nature and consequences of indirect effects in ecological communities. Ann. Rev. Ecol. Syst. 25, 443466.
Worthern, W. (1996) Community composition and nested-subset analyses: basic descriptors for community ecology. Oikos, 76, 41 7-426.
Vertebrate zonation at Manu 607
Bruce Patterson is MacArthur Curator of Mammals in the Department of Zoology. He is currently President of the Society for the Study of Mammalian Evolution and a Director of the American Society of Mammalogists. His co-authors all were students and/or colleagues in Field Museum's Ellen Thorne Smith Bird and Mammal Study Center during the expeditions that fuelled this analysis. Doug Stotz is now Conservation Ecologist for The Field Museum's Environmental and Conservation Programs. Sergio Solari is currently a Research Associate and Victor Pacheco an Associate Professor and Curator of Mammals, respectively, at the Museum of Natural History, San Marcos University. John Fitzpatrick, formerly Field Museum's Curator of Birds, is now Director of the Laboratory of Ornithology. All five have extensive experience in Neotropical forests and broad interests in biogeography. BDP, DFS, and SS recently began a three-year field program, expanding Manu surveys to include information on parasites and relative abundance.
O Blackwell Science Ltd 1998, Journal of Biogeography, 25, 593-607