Contrasting microclimates among clearcut, edge,...
19
k Agricultural and Forest Meteorology, 63 (1993) 219-237 219 Elsevier Science Publishers B.V., Amsterdam Vzd Contrasting microclimates among clearcut, edge, and interior of old-growth Douglas-fir forest Jiquan Chen', Jerry F. Franklin' and Thomas A. Spies' 'College of Forest Resources, University of Washington, Seattle, WA 98195, USA 'Forest Science Laboratory, USDA Forest Service, Pacific Northwest Research Station, Corvallis, OR 97331, USA (Received 1 April 1992; revision accepted 18 September 1992) ABSTRACT Chen, J., Franklin, J.F. and Spies, T.A., 1993. Contrasting microclimates among clearcut, edge, and interior of old-growth Douglas-fir forest. Agric. For. Meteorol., 63: 219-237. Clearcut, remnant old-growth forest patch, and edge are the three primary landscape elements in northwestern North America. Microclimatic information on this forest landscape is needed for both research and resources management purposes. In this paper, seasonal summaries and diurnal changes in air temperature and moisture, soil temperature and moisture, short-wave radiation, and wind velocity are quantified for recent clearcut (10-15 years old), edge, and adjacent interior old-growth Douglas-fir forest environments in southern Washington state, USA, over two growing seasons. Influences of local weather condition and edge orientation (relationship of edge to the azimuth) are also assessed. Over the growing season, daily averages of air and soil temperatures, wind velocity, and short-wave radiation are consistently lower, and soil and air moisture are higher, inside the forest than in the clearcut or at the edge. Daily differences (i.e. maximums minus minimums) of all variables are consistently lower in the forest. The microclimates at the edge and the clearcut show a variable relationship with regard to averages and differences. Between the edge and the forest, greater differences occur under clear sky conditions for air temperature, but under partial cloudy conditions for relative humidity and soil temperature. Edge orienta- tion is critical in assessing solar radiation, soil moisture, and relative humidity. The highest variability in microclimate exists at the edge, rather than in either clearcut or interior forest, primarily because of the influences related to edge orientation. The supposition that edge microclimates are intermediate between clearcut and interior forest is consistently true only for wind velocity and solar radiation, not for tem- perature and moisture. INTRODUCTION The extensive contiguous old-growth coniferous forests that once dominated the landscape of the Pacific Northwest have been transformed into a mosaic of remnant forest patches surrounded by clearcuts (Harris, 1984; Franklin Correspondence to: J. Chen, College of Forest Resources, University of Washington, Seattle, WA 98195, USA. 0168-1923/93/$06.00 © 1993 Elsevier Science Publishers B.V. All rights reserved.
Transcript of Contrasting microclimates among clearcut, edge,...

k
Agricultural and Forest Meteorology, 63 (1993) 219-237 219Elsevier Science Publishers B.V., Amsterdam
Vzd
Contrasting microclimates among clearcut, edge,and interior of old-growth Douglas-fir forest
Jiquan Chen', Jerry F. Franklin' and Thomas A. Spies''College of Forest Resources, University of Washington, Seattle, WA 98195, USA
'Forest Science Laboratory, USDA Forest Service, Pacific Northwest Research Station,Corvallis, OR 97331, USA
(Received 1 April 1992; revision accepted 18 September 1992)
ABSTRACT
Chen, J., Franklin, J.F. and Spies, T.A., 1993. Contrasting microclimates among clearcut, edge, andinterior of old-growth Douglas-fir forest. Agric. For. Meteorol., 63: 219-237.
Clearcut, remnant old-growth forest patch, and edge are the three primary landscape elements innorthwestern North America. Microclimatic information on this forest landscape is needed for bothresearch and resources management purposes. In this paper, seasonal summaries and diurnal changes inair temperature and moisture, soil temperature and moisture, short-wave radiation, and wind velocity arequantified for recent clearcut (10-15 years old), edge, and adjacent interior old-growth Douglas-fir forestenvironments in southern Washington state, USA, over two growing seasons. Influences of local weathercondition and edge orientation (relationship of edge to the azimuth) are also assessed. Over the growingseason, daily averages of air and soil temperatures, wind velocity, and short-wave radiation are consistentlylower, and soil and air moisture are higher, inside the forest than in the clearcut or at the edge. Dailydifferences (i.e. maximums minus minimums) of all variables are consistently lower in the forest. Themicroclimates at the edge and the clearcut show a variable relationship with regard to averages anddifferences. Between the edge and the forest, greater differences occur under clear sky conditions for airtemperature, but under partial cloudy conditions for relative humidity and soil temperature. Edge orienta-tion is critical in assessing solar radiation, soil moisture, and relative humidity. The highest variability inmicroclimate exists at the edge, rather than in either clearcut or interior forest, primarily because of theinfluences related to edge orientation. The supposition that edge microclimates are intermediate betweenclearcut and interior forest is consistently true only for wind velocity and solar radiation, not for tem-perature and moisture.
INTRODUCTION
The extensive contiguous old-growth coniferous forests that once dominatedthe landscape of the Pacific Northwest have been transformed into a mosaicof remnant forest patches surrounded by clearcuts (Harris, 1984; Franklin
Correspondence to: J. Chen, College of Forest Resources, University of Washington, Seattle,WA 98195, USA.
0168-1923/93/$06.00 © 1993 Elsevier Science Publishers B.V. All rights reserved.
220
J. CHEN ET AL.
and Forman, 1987; Lehmkuhl and Ruggiero, 1991; Morrison et al., 1991).Only about 10% of the original forest remains.
Large amounts of area subject to edge influences have been created duringthis process of regional forest fragmentation. Edges and adjacent areasprovide ecological conditions that contrast markedly with general conditionswithin the central portions of clearcut or forest patches. For example, edgesimpact ecosystem structure and productivity (Chen et al., 1992), understoryspecies (Frost, 1992), wildlife habitat, composition and distribution (Thomaset al., 1979; Hansen and Horvah, 1990), and microclimatic conditions (Frit-schen et al., 1970; Chen, 1991).
In effect, in many forested regions, including the Pacific Northwest, forestfragmentation has produced a landscape in which edges are a dominantfeature and most forested tracts are subject to extensive edge influences (Chen,1991). Indeed, theoretical models of dispersed forest clearcutting (Franklinand Forman, 1987) indicate that all interior forest habitat (areas free of edgeinfluences) may be lost with as much as 50% of the original forest remaining.It is increasingly clear that a better understanding of edge effects is essentialfor both research on and management of forest resources (Franklin andForman, 1987; Morrison, 1990; Ripple et al., 1991).
High-contrast edges between forest and cutover greatly influence physicalconditions and biological processes. Both the composition of organisms andecosystem processes are dramatically altered. For example, many wildlifespecies respond positively to edges while many others, which require protectedforest conditions, are negatively impacted (Thomas et al., 1979; Yahner, 1988;Hunter, 1990; Hansen and Horvah, 1990). These responses relate to a varietyof factors including microclimate, predation, and food resources. Regenera-tion and growth of plants is also affected (Frost, 1992; Chen et al., 1992) asis tree mortality (Ruth and Yoder, 1953; Gratkowski, 1956). Ecosystemprocesses, such as productivity and decomposition, are profoundly influencedby edges.
Microclimatic conditions in edge environments are critical to understand-ing and predicting biological responses. Microclimatic parameters, such asmoisture, temperature, and • solar radiation, drive biological processes andcontrol the distribution of organisms (Geiger, 1965; Whittaker, 1975; Zobelet al., 1976; Waring and Schlesinger, 1985; Szujecki, 1987; Chapin et al.,1987). Soil moisture and temperature largely control decomposition rates(Edmonds, 1980; Edmonds and Bigger, 1984; Moore, 1986). Solar radiationdirectly controls rates of photosynthesis and, indirectly, development ofunderstory vegetation.
Unfortunately, despite their importance, microclimatic conditions andtheir temporal dynamics at forest edges have been the subject of very fewstudies. Except for some European studies early in the 20th century (Ranney,1977) no systematic studies of microclimates at and near forest cutover edges

MICROCLIMATES AMONG CLEARCUT, EDGE, AND FOREST
221
have been undertaken. Fragmentary data do exist in a variety of sources,however (Kittredge, 1948; Geiger, 1965; Wales, 1967; Raynor, 1971; Lee,1978; Ghuman and Lal, 1987; Hugerford and Babbitt, 1987; Williams-Linera,1990). Recent concerns about edges and their effect on ecosystem and land-scape functions (Forman and Godron, 1986; Gosz, 1992)—including impactson forest productivity, wildlife, and biological diversity—make microclimaticquantification of edges and adjacent clearcut and forest ecosystems increa-singly important.
In this paper we report on the growing season microclimates of recentclearcut, edge, and interior old-growth Douglas-fir (Pseudotsuga menziesii(Mirb.) Franco) forest in the Pacific Northwest. Specifically, we investigated
_ the relationships of daily averages and differences of air and soil temperature,relative humidity, vapor pressure deficit, soil moisture, wind velocity, andshort-wave radiation in the clearcut, edge, and interior forest based on fieldmeasurements during the growing season; we explored and discussed theirdiurnal patterns among these three locations; and we studied the influences ofedge orientation on the diurnal changes in solar radiation and relativehumidity as well as soil moisture. The ultimate goal was to provide generalinformation on microclimates among the clearcut, edge, and interior forest inorder to assist in interpretation and prediction of biological phenomenaassociated with old-growth forest edges and improve current managementpractices in these forest landscapes.
METHODS
The study was conducted in the Trout Creek Hill area of the Wind RiverExperimental Forest (45°48' N and 121°55' W) on the Gifford PinchotNational Forest in southern Washington. Elevation of the study area rangesfrom 400 to 750 m, and topography is gentle ( < 10°). Vegetation is inter-mediate between the Tsuga heterophylla and lower Abies amabilis zones(Franklin and Dymess, 1973). Portions of the forest, 450 year-old-growthDouglas-fir western hemlock (Tsuga heterophylla (Raf.) Sarg.), were clearcut10-15 years ago. The clearcuts were subsequently replanted with severalconifer species. Conditions within old-growth forests are described by DeBelland Franklin (1987); dominant trees within forest patches are typically 55-65m tall. Thirteen study sites including clearcuts, edge, and interior forestenvironments were used in this study. Some edges utilized a common clearcut.
Weather stations were independently installed at three locations on eachsite: the center of the clearcut, at the forest edge, and in the interior of theforest patch (i.e. at least 250 m from any edge), on the assumption that thisis a sufficient distance to provide interior forest conditions (Chen, 1991). Ateach location, air temperature, relative humidity, wind velocity, and short-wave radiation sensors were mounted 2 m above the ground, and soil tern-

222 J. CHEN ET AL.
perature at 10 cm in the soil. Measurements for each variable were recordedevery 15 s and averaged for 30-min intervals. Vapor pressure deficit wascomputed from relative humidity and corresponding air temperature(Campbell, 1986) using the empirical parameters estimated by Lowe (1977).Precipitation was not recorded because the measurements were taken duringthe dry season when rain events are very rare (Phillips, 1964; Bierlmaier andMcKee, 1989). Stations remained at each site for 2-3 days and were thenmoved to another site to allow for more sampling of edges with differentorientations (relationship of edge to the azimuth). Field data collection wasconducted over the two growing seasons (late June-September) of 1989 and1990 for a total of 35 completed sample days.
Soil moisture data was collected during a 3-day period (18-20 September1990) of stable weather via Time Domain Reflectometry (TDR) at ten of 13 studysites. TDR was used because it measures water content of a volume of soilrather than a single point, as is the case with other soil moisture sensors. Theelectrode pairs were built using 3.18 mm in diameter and 30 cm long stainlesssteel rods. These rods were individually driven into the soil at a 30° angle todetermine the soilwater content of the top 15 cm through a woody guide thatinsured the rods were parallel to each other and had 5 cm separation. Fieldmeasurements were repeated at five random places in each of the threelocations (i.e. clearcut, edge, and forest). The daily weather conditions wererecorded as clear, partly cloudy, or cloudy (and/or rainy).
Instruments used were: automatic recording datalogger (Model 21x andCR21 Micrologger, Campbell Scientific (CSI), Logan, UT), temperaturesensors (Model 101 and 107 Temperature Probes, CSI), relative humiditysensor (Model 207 Phys-Chem Temperature and RH Probe, CSI), pyrano-meters (Model Li-200S Silicon Pyranometer, LI-COR, Lincoln, NE); cupanemometer (Model 12102 Gill 3 Cup Anemometer, R.M. Youngs Company,MI); and TDR (TEKTRONIX, Inc., Chicago, IL). The thermocouples(chromel-constantan and copper constantan) used for repeated measurementsof air and soil temperatures were custom-built in the laboratory.
All sensors, except for thermocouples, were calibrated before and after eachfield measurement. Temperature sensors (thermistors) were calibrated in aconstant temperature chamber with a copper-constantan thermocouple as thestandard. Relative humidity sensors were calibrated with a recycling systemusing saturated salts (Fritschen and Gay, 1979). Anemometers were calibratedagainst a reliable photochopper anemometer (Fritschen, 1967) in a windtunnel. Pyranometers were calibrated by the manufacturer immediatelybefore the field season. The TDR calibration was developed using the samesoil cored in polyvinyl chloride pipes (Gray and Spies, 1992). Linear regressiontechniques were used to develop all calibration equations.
The daily average, maximum, minimum, and difference (i.e. maximum-minimum, a measure of variability) of air and soil temperature, relative

MICROCLIMATES AMONG CLEARCUT, EDGE, AND FOREST 223
TABLE I
Means (and standard errors) of daily average and differences (maximum minus minimum, A) for airtemperature (T,), soil temperature (Ts ) relative humidity (h), and vapor pressure deficit (D) in clearcut,edge, and old-growth Douglas-fir forest over the 35-day measurement period (June—September 1989 and1990)
AT. T, AT, h Ah D AD
Clearcut 16.33 14.75 18.34 10.36 70.90 41.30 0.669 1.504(0.42) (1.06) (0.46) (0.64) (3.41) (2.86) (0.075) (0.145)
Edge 16.67 14.17 17.08 11.08 75.99 44.57 0.617 1.538(0.40) (1.01) (0.43) (0.86) (2.88) (3.02) (0.073) (0.156)
Forest 15.72 10.05 13.93 2.44 79.38 31.71 0.425 0.934(0.40) (0.67) (0.23) (0.26) (2.63) (2.31) (0.060) (0.087)
humidity, vapor pressure deficit, and wind velocity were computed. Based onthis daily information, means and standard errors over 35 measurement dayswere further calculated. By visually investigating the relationships of dailyaverages and differences among the three locations for all 35 days, we iden-tified different relationships among locations (named pattern) and categorizedeach day into an appropriate pattern. Mean and standard error for eachpattern were then computed. To stress the microclimate at the edge underdifferent weather conditions, we compared the basic statistics of the differ-ences in air temperature, relative humidity, and soil temperature of the edgerelative to the forest during the day and at night. The comparison was notmade for short-wave radiation and wind velocity because of the stronginfluence of edge orientation.
The diurnal changes in soil and air temperature, relative humidity, vaporpressure deficit, wind velocity, and solar radiation were explored choosing oneof the standard days after visual examinations on all 35 days. The influencesof local weather condition were also considered, based on 35 diurnal changesand associated local weather conditions. Comparisons of the diurnal patternamong three locations were made by selecting a typical clear day of the PacificNorthwest. The influences of edge orientation on the diurnal changes wereexamined for short-wave radiation, relative humidity, and soil moisture.
RESULTS
General pattern
Mean daily average air temperatures (Ta) among the clearcut, edge, andforest varied slightly and standard errors around these means were about thesame (Table 1). Three major patterns emerged relating T., to location (Fig.1(a)). Most commonly (for 18 of 35 days, Pattern 1), Ta was highest at the edge

pattern 1 pattern 2
^ Clearcut 0 Edge IN ForestN = 7
18.5-
17.5- N=18
16.5-
15.5-
14.5
••
(a)
224 J. CHEN ET AL.
Fig. 1. Means and standard errors of (a) daily average air temperatures and (b) daily air temperaturedifferences in the clearcut, edge, and old-growth Douglas-fir forest. N, indicates the number of days thatfollow the associated pattern over the 35-day measurement period (June-September 1989 and 1990).
and lowest in the interior forest. For 10 of 35 days (Pattern 2), Ta declinedfrom the clearcut into the forest. For 7 of 35 days (Pattern 3), air temperaturewas lowest in the clearcut and highest at the edge. No clear relationship hasbeen found between these patterns and local weather conditions in the dataanalysis.
Mean daily air temperature differences (Ara ) were higher in the clearcutand at the edge than in the forest as were the associated standard errors (Table1). Under unstable weather conditions (e.g. during the change from hot, sunnyto windy, cloudy weather), A Ta was as high as 25-28°C in the clearcut and atthe edge, but considerably smaller (15-17°C) inside the forest. Two patternsemerged relative to location: A Ta of the clearcut was either higher than thatof the edge or vice versa and, in any case, was lowest in the forest (Fig. 1(b)).Patterns of Ta and A Ta were not clearly related (Figs. 1(a) and 1(b)).
Mean daily average soil temperatures (Ts) were the highest in the clearcut,moderate at the edge, and the lowest in the forest, as were the associatedstandard errors (Table 1). Two patterns emerged relating Ts to locations,although T, was always lowest in the forest (Fig. 2(a)). For 21 of 35 days(Pattern 1), Ts was higher in the clearcut than at the edge, but for the rest ofthe days (Pattern 2), this relationship was reversed. Over the same period, Ts

T
U Clearcut ^ Edge ■ ForestN-21 N=1 4
T
T N=18N =T1 7
T
MICROCLIMATES AMONG CLEARCUT. EDGE, AND FOREST
225
13.0
15.0
U 10.00
5.0
0.0
pattern 1 pattern 2
21.0
19.0
V 17.0
15.0
pattern 1 pattern 2
Fig. 2. Means and standard errors of (a) daily average soil temperatures and (b) daily soil temperaturedifferences in the clearcut, edge, and old-growth Douglas-fir forest. N, indicates the number of days thatfollow the associated pattern over the 35-day measurement period (June—September 1989 and 1990).
in the clearcut and at the edge was consistently higher than Ta but alwayslower inside the forest; hence, the difference in air temperature between forestand clearcut was less than that in soil temperature.
Mean daily soil temperature differences (A Ts ) and the associated standarderrors were much higher in the clearcut and at the edge than in the forest(Table 1) where soil temperature varied diurnally in the narrow range of1-4°C. Under extreme weather conditions (e.g. a very hot, sunny day), A T,was as great as 20-24°C in the clearcut and at the edge, but much smaller( < 8°C) inside the forest. As for A Ta , two patterns emerged relating tolocations: A T, of the clearcut was either higher than that of the edge or viceversa and, in any case, was lowest in the forest (Fig. 2(b)).
Mean daily average relative humidity (h) increased from the clearcut intothe forest, but the standard errors decreased (Table 1); i.e. daily growing-season changes in h were smaller inside the forest than in the clearcut and atthe edge. Two patterns emerged relating h to locations (Fig. 3(a)). For 25 of35 days (Pattern 1), h was higher at the edge than in the clearcut whileremaining lowest in the forest. This was the pattern under more humid

30 -
20pattern 1 pattern 2
226 J. CHEN ET AL.
60 -
50 -
N = 10e 40
(a) Clearcut 0 Edge ■ ForestN = 25
T
to00
pattern 1 pattern 2
pattern 1 pattern 2
Fig. 3. Means and standard errors of (a) daily average relative humidity (h), (b) vapor pressure deficit (D)and (c) its daily difference (AD) in the clearcut, edge, and old-growth Douglas-fir forest. Nm indicates thenumber of days that follow the associated pattern over the 35-day measurement period (June—September1989 and 1990).
MICROCLIMATES AMONG CLEARCUT, EDGE, AND FOREST 227
weather conditions. For 10 of 35 days (i.e. drier weather condition, or Pattern2), h decreased from the clearcut into the forest. Differences in daily relativehumidity (Oh): expressed by the daily minimum because the maximum, whichoccurs before sunrise, is usually close to the saturation point; were consistentlygreatest at the edge and least in the forest (Table 1).
Similar results for absolute air moisture were found by examining vaporpressure deficit (D) among three locations. The decreasing trend in D from theclearcut into the forest—lowest air moisture in the clearcut, moderate at theedge, and the highest in the forest (Table 1)—was most common (22 of 35days, Pattern 1). For the rest of the sampling days (Pattern 2), the edges hadthe least air moisture (Pattern 2, Fig. 3(b), drier weather conditions). Thisrelationship to the local weather condition was not found for the diurnaldifference (AD) and associated variation (Table 1). For 17 of 35 days(Pattern 1), AD decreased from the clearcut into the forest; for the other days(Pattern 2), it was higher at the edge than in the clearcut while the forestremained the lowest (Fig. 3(c)).
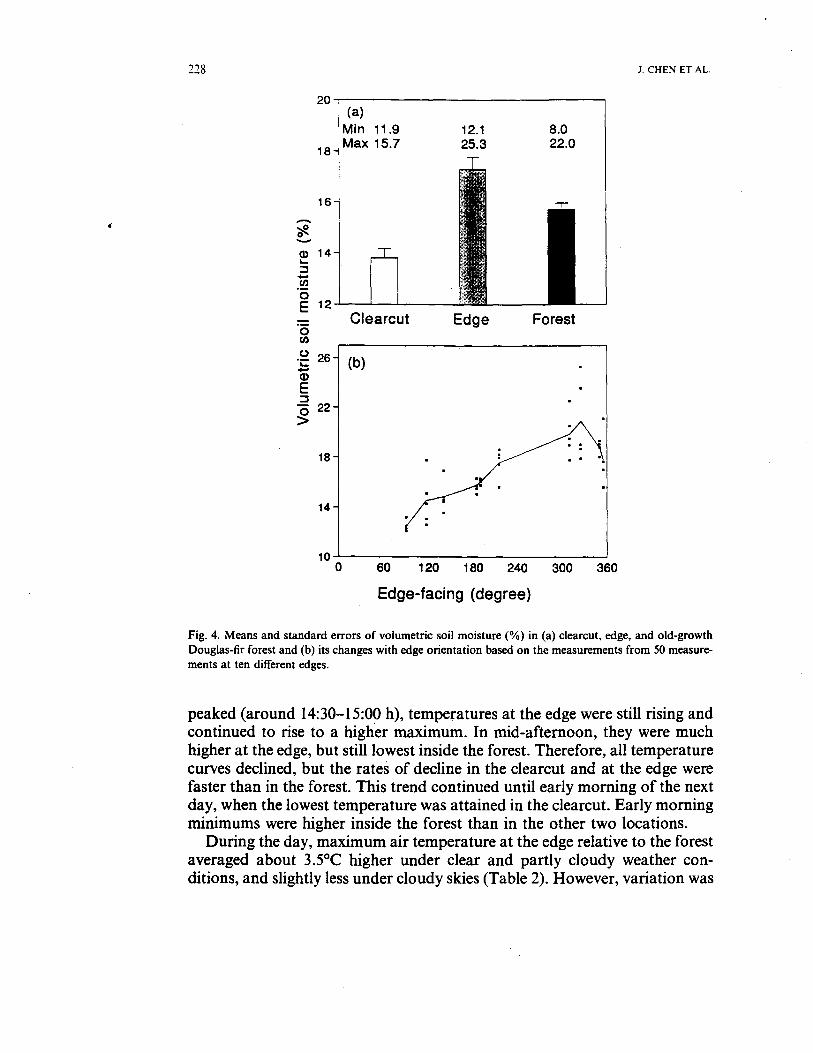
Mean volumetric soil moisture and variability (SE) from 45 repeatedmeasurements in each environment was highest at the edge (17.3%, SE =0.490), intermediate in the forest (15.7%, SE = 0.256), and lowest in theclearcut (13.8%, SE = 0.357) (Fig. 4(a)). However, the driest (i.e. mostextreme) individual measurement was taken in the forest (8.0%) and thewettest at the edge (25.3.0%). This greater variability in soil moisture at theedge was primarily caused by edge orientation (Fig. 4(b)). Soil moisture wasthe lowest at south- and east-facing edges and the highest at northwest-facingedges. At the east- and south-facing edges, soil moisture was even lower thanin the clearcut, while it was higher than in the forest at northwest-facing edges.
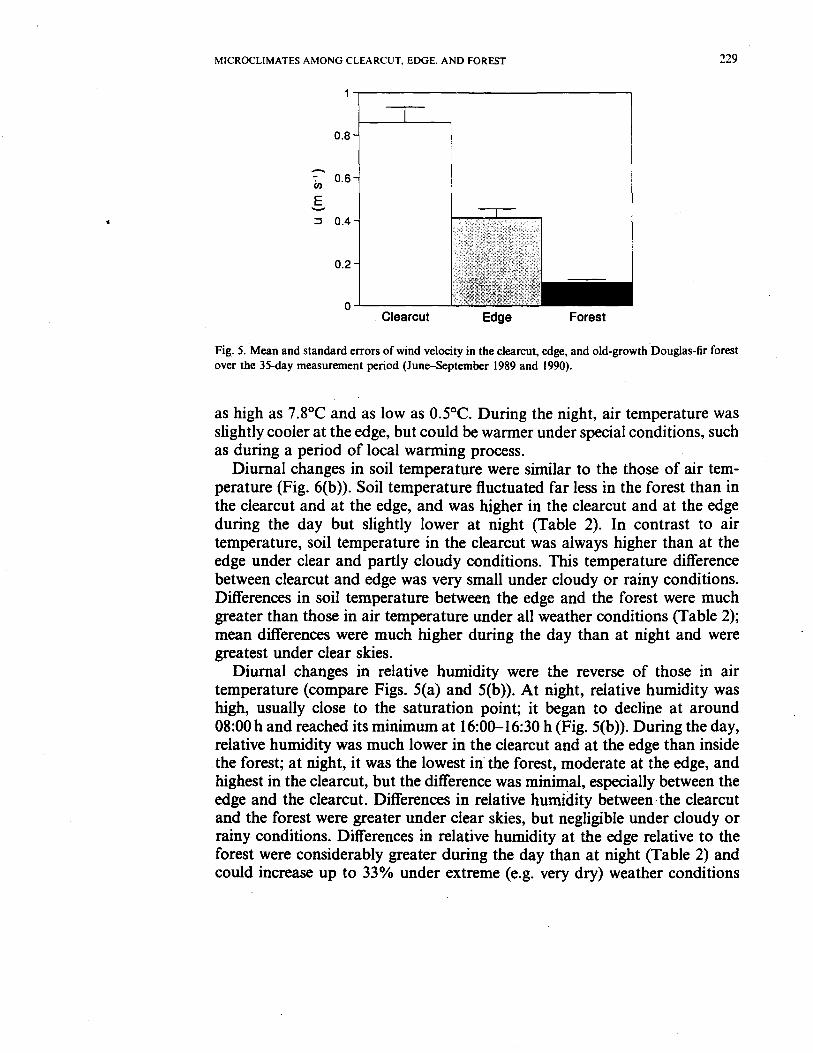
Means and associated standard errors for daily average wind speed wereconsistently highest in the clearcut, intermediate at the edge, and lowest withinthe forest (Fig. 5). The relative decline in wind velocity was greater betweenclearcut and edge than between edge and forest.
Diurnal changes
Diurnal changes in air temperature among the three locations had astrongly sinusoidal pattern (Fig. 6(a)), with the minimum temperature occur-ring at around 06:00 h and the maximum at around 15:00 h. Ratios of airtemperature over time among the locations differed considerably for clear andpartly cloudy conditions, but little for cloudy conditions. By examiningdiurnal changes during all 35 days, we found temperatures peaked higher atthe south- and west-facing edges than in the clearcut. At other edges, the dailymaximum was found at the clearcut.
Air temperature in the clearcut and at the edge rose faster following theearly morning low than in the forest. By the time temperatures in the clearcut
60 120 180 240 300 360
18
14
100
6— 2 -
E.5 22 -
228 J. CHEN ET AL.
20
(a)Min 11.9
12.1 8.0Max 15.7
25.3 22.018-
16
_E 12
0U)
Clearcut Edge Forest
Edge-facing (degree)
Fig. 4. Means and standard errors of volumetric soil moisture (%) in (a) clearcut, edge, and old-growthDouglas-fir forest and (b) its changes with edge orientation based on the measurements from 50 measure-ments at ten different edges.
peaked (around 14:30-15:00 h), temperatures at the edge were still rising andcontinued to rise to a higher maximum. In mid-afternoon, they were muchhigher at the edge, but still lowest inside the forest. Therefore, all temperaturecurves declined, but the rates of decline in the clearcut and at the edge werefaster than in the forest. This trend continued until early morning of the nextday, when the lowest temperature was attained in the clearcut. Early morningminimums were higher inside the forest than in the other two locations.
During the day, maximum air temperature at the edge relative to the forestaveraged about 3.5°C higher under clear and partly cloudy weather con-ditions, and slightly less under cloudy skies (Table 2). However, variation was
MICROCLIMATES AMONG CLEARCUT, EDGE. AND FOREST 229
0.8 -
in 0.6 -
E0.4 -
0.2 -
Clearcut Edge Forest
Fig. 5. Mean and standard errors of wind velocity in the clearcut, edge, and old-growth Douglas-fir forestover the 35-day measurement period (June-September 1989 and 1990).
as high as 7.8°C and as low as 0.5°C. During the night, air temperature wasslightly cooler at the edge, but could be warmer under special conditions, suchas during a period of local warming process.
Diurnal changes in soil temperature were similar to the those of air tem-perature (Fig. 6(b)). Soil temperature fluctuated far less in the forest than inthe clearcut and at the edge, and was higher in the clearcut and at the edgeduring the day but slightly lower at night (Table 2). In contrast to airtemperature, soil temperature in the clearcut was always higher than at theedge under clear and partly cloudy conditions. This temperature differencebetween clearcut and edge was very small under cloudy or rainy conditions.Differences in soil temperature between the edge and the forest were muchgreater than those in air temperature under all weather conditions (Table 2);mean differences were much higher during the day than at night and weregreatest under clear skies.
Diurnal changes in relative humidity were the reverse of those in airtemperature (compare Figs. 5(a) and 5(b)). At night, relative humidity washigh, usually close to the saturation point; it began to decline at around08:00 h and reached its minimum at 16:00-16:30 h (Fig. 5(b)). During the day,relative humidity was much lower in the clearcut and at the edge than insidethe forest; at night, it was the lowest in the forest, moderate at the edge, andhighest in the clearcut, but the difference was minimal, especially between theedge and the clearcut. Differences in relative humidity between the clearcutand the forest were greater under clear skies, but negligible under cloudy orrainy conditions. Differences in relative humidity at the edge relative to theforest were considerably greater during the day than at night (Table 2) andcould increase up to 33% under extreme (e.g. very dry) weather conditions

230 J. CHEN ET AL.
13.0
12.0 111.1,1111111111111111111111111111111111111111
16.0—CIearcut — Edge — Forest
27.0
15.0
(a)
12 18 24 0 6ll I lll III I
12 180 24
F
22.0
as 17.0
12.0
7.0 III/1111111 iiiiiii 1111111111111Ill llllll 1111111
Local time (hour)
Fig. 6. Diurnal changes in (a) air temperature; (b), soil temperature; (c) relative humidity; (d) vapor pressurein the clearcut, edge (south-facing) and old-growth Douglas-fir forest.
during the day. Vapor pressure had the same pattern (Fig. 6(d)), indicating aminor influence of air temperature on the air moisture when comparing thedifferences among three locations. Both relative humidity and vapor pressureat the edge decreased later in the morning than at the clearcut, primarilybecause measurements were at a south-facing edge.
Diurnal changes in wind velocity were similar for a strong and a weak wind:lower at night and higher during the day. Generally, velocity decreased in theafternoon and was lowest at night (usually calm) and in the early morning; itwas consistently highest and most erratic in the clearcut, moderate at the edge,and calmest and least variable in the forest (Fig. 7(a)). The wind velocity asa percentage of that in the clearcut was about 15-20% in the forest and60-70% at the edge.
Diurnal changes in short-wave solar radiation were considerably greater inthe clearcut than at the edge and inside the forest regardless of sky conditions(Fig. 7(b)). On a clear day, the radiation curve was bell-shaped in the clearcut,

MICROCLIMATES AMONG CLEARCUT, EDGE. AND FOREST 231
TABLE 2
Temperature and humidity differences at the edge relative to the interior forest under three local weatherconditions (clear, partly cloudy, and cloudy/rainy) during the 1989 and 1990 growing seasons
Variable weather Condition No. Mean Standard Max. Min.by time measured difference error
Air temperature (°C)Day Clear 24 3.62 0.34 7.04 0.95
P/Cloudy 17 3.53 0.44 7.80 1.29Cloudy 13 2.67 0.38 4.89 0.54
Night Clear 26 -1.51 0.26 -0.15 -5.83P/Cloudy 18 -1.47 0.40 0.25 -5.52Cloudy 14 -1.29 0.46 0.28 -6.69
Relative humidity (%)Day Clear 23 15.00 1.50 28.49 4.24
P/Cloudy 17 15.39 1.93 32.77 6.95Cloudy 14 13.06 1.99 28.68 2.98
Night Clear 24 6.05 1.61 35.97 -1.63P/Cloudy 16 6.65 2.27 26.93 -2.05Cloudy 14 5.75 1.98 25.87 -1.61
Soil temperature (°C)Day Clear 36 8.09 0.58 15.52 1.66
P/Cloudy 21 9.14 0.75 14.73 2.41Cloudy 18 7.17 0.85 14.90 2.68
Night Clear 39 0.72 0.21 3.55 -2.55P/Cloudy 21 1.10 0.33 4.34 -1.51Cloudy 19 0.62 0.33 2.64 -1.91
but erratic at the edge, where sunlight is partially blocked by the forestcanopy. With increasing cloud cover, however, the forest floor receives onlya small amount of light, and the influence of sky condition was minimal. Thelocal fluctuation (i.e. white noise between 30-min time periods) in radiationpatterns owing to the sky condition was greater in the clearcut and at the edgethan in the forest.
These relationships in short-wave radiation were strongly influenced byedge orientation (Fig. 8(a)). At a south-facing edge, total radiation flux for aclear day produced a bell-shaped curve similar to that at the clearcut (compareFigs. 7(b) and 8(a)). However, at east- and west-facing edges, the bell curvewas essentially halved. At an east-facing edge, radiation flux increased earlierin the day and at a faster rate than it did at a south-facing edge; at around09:30 h, there was almost the same amount of radiation at both sites. Then,the rate of increase at the east-facing edge began to decline, dropping precipi-tously around noon. Within 1-2 h, the light condition approximated that at

weak wind
(b) Clear
—Clearcut — Edge — Forest
E 0.8
0.4 -
0.0 -0.8
12 0 12 0Local time (hour)
(a)1.6 -
1.2 -strong wind
232 J. CHEN ET AL.
Fig. 7. Diurnal changes in wind velocity with (a) strong and weak wind; (b) short-wave radiation underclear and partly cloudy skies in the clearcut, edge and old-growth Douglas-fir forest (the edge faces west).
a north-facing edge (diffuse and reflective light only). Radiation flux at awest-facing edge virtually mirrored that at an east-facing edge (Fig. 8(a)). Ata north-facing edge, radiation levels remained relatively low throughout theday, but were highest in late afternoon, when it was similar to that at awest-facing edge during the long days of the growing season.
Diurnal changes in relative humidity were also influenced by edge orienta-tion, and these influences were seen more strongly during the day and weaklyat night (Fig. 8(b)). During the day, relative humidity at the north and eastedges decreased more gradually from early morning on, and was considerably

20 111111111111 III 1111 II II11111111111111111111111
100
80 -
•-• 60
40 -
MICROCLIMATES AMONG CLEARCUT. EDGE. AND FOREST 233
0 6 12 18 24
Local time (hour)
Fig. 8. Diurnal changes (a) in short-wave radiation; (b) relative humidity at four contrasting edges that faceeast, north, west, and south under clear sky conditions.
higher in the afternoon than at south and west edges. At night, the influencesof orientation weakened and few differences existed among the four edges.
DISCUSSION
Clearcutting and associated forest practices significantly alter the surfacethermal properties (e.g. albedo) and energy and material balances (e.g. solarradiation and precipitation) near the ground owing to the removal of forestcanopy and ground materials (understory shrubs, coarse woody debris, etc.).Generally, a clearcut receives more direct solar radiation and precipitation,loses more outgoing long-wave radiation, and shows higher rates of evapo-
234 J. CHEN ET AL.
transpiration than an adjacent forested area. Hence, there is typically asunnier, wanner, windier, and drier environment outside the forest than in theforest during summer days (Geiger, 1965; Wales, 1967; Lee, 1978; Ghumanand Lal, 1987) and a cooler, wetter environment at night (Chen, 1991). Thedata from both the 1989 and 1990 growing seasons in this study illustratedthese patterns for clearcut, edge, and forest environments associated withold-growth Douglas-fir forests in the Cascades of southern Washington(Table 1). However, the influences of local weather conditions were such that,on cloudy or rainy days, microclimates among the three locations differedlittle and relationships among them varied.
Additional evidence that local weather conditions affect microclimate wasfound in the diurnal changes of temperature and relative humidity for theclearcut and adjacent forest. Generally, the daily maximums, minimums, andvariations were greater during clear than cloudy weather conditions (Raynor,1971; Ranney, 1977; Lee, 1978; Chen, 1991). However, in our study, theseparameters also were more variable under partly cloudy skies (Fig. 6, Table2) because the dynamics of such weather conditions creates an unstablemicroclimate near the ground. Our weather records for the 1989 and 1990growing seasons showed that roughly 51.4% of this period was clear, 28.0%was partly cloudy, and 20.6% was cloudy or rainy, indicating then the relativeimportance during the study period.
Although microclimates outside and inside the forest have been comparedpreviously (Geiger, 1965; Lee, 1978), it is important to consider the edge asboth a separate microclimate and a climatic mediator between clearcut andforest. However, studies of the microclimate at edges have been rare. Becausethe edge is physically located between clearcut and forest, it might logically beassumed that its microclimate would be intermediate between the clearcut andforest (e.g. Geiger, 1965; Wales, 1967; Ranney, 1977). We found this to be thecase for wind velocity and solar radiation, which were always highest in theclearcut and lowest in the forest, but not for temperature and moisturevariables. The most extreme day time air temperatures and relative humiditiesoccurred at the edge rather than in the clearcut (Figs., 1(a), 2, 5(a), 5(b)). Bothmeans and standard errors for soil moisture also were highest at the edge.
Wind influences temperature and moisture regimes at the edge. In theclearcut, winds are stronger; this helps mix air, which carries heat energy andmoisture to the surrounding areas and thereby reduces variation in air tem-perature and relative humidity. Near the edge winds are weaker; this producesrelative stable air which, in turn, allows more extreme air temperatures andhumidity. Although they were not studied, soil surface cover (e.g. litter,vegetation), which influences soil thermal properties, and precipitationprobably have major influences on soil moisture patterns at the edge becausethere tends to be more surface cover and precipitation (i.e. condensation) at

MICROCLIMATES AMONG CLEARCUT, EDGE, AND FOREST 235
forest edges than inside the forest and on the clearcut (Waring and Schlesin-ger, 1985; Weathers et al., 1990).
We found microclimate to be strongly related to edge orientation, as haveothers (Wales, 1967; Ranney, 1977). Since solar radiation is the only heatsource, changes in radiation flux associated with edge orientation will alter thediurnal patterns of other microclimatic variables such as air temperature, soiltemperature, and relative humidity. The contrasting patterns of diurnalchanges in relative humidity as influenced by edge orientation (Fig. 8(b)), forexample, can be explained by the corresponding patterns of solar radiationand air temperature.
Many biological features near the forest edge seem related to these uniquemicroclimatic conditions well. Fastest decomposition rates of litter near theedge are probably owing to high available soil moisture and higher tem-peratures, which speed up the activity of fungi and other decomposerorganisms (Edmonds and Bigger, 1984). Abundance regeneration and highergrowth rates of western hemlock and Douglas-fir are likely caused by greaterlight and higher air temperatures (Chen et al., 1992). Other apparent relation-ships include greater wind damage (Ruth and Yoder, 1953; Chen et al., 1992),unique understory species composition (Frost, 1992), and use of edges asinsect pathways (Wood and Samways, 1991), etc.
Precise microclimatic data have been difficult to collect because of the highcost of instrumentation (Pinker, 1980; Ghuman and Lal, 1987). Indeed,traditionally, microclimatic information used in studying, e.g. species distri-bution or ecological processes, was either measured once a day or averagedover a period, inadvertently biasing the data base because important valuesmight have been hidden or lost. We believe that our continuous-monitoringapproach, with many replications among sites, environment, and weatherconditions, has provided reliable data on microclimate. Moreover, althoughChen (1991) originally hypothesized that the most variable microclimaticconditions would occur in the clearcut, our measurements of temperature andmoisture data indicate that such conditions are actually found at the edge.This phenomenon might be explained by the complex interactions amongmicroclimatic variables and forest structure. However, such an explanationneeds to be verified in other forest types from further, detailed study of energybudgets.
ACKNOWLEDGMENTS
This study was supported by a collaborative research program with Wil-lamette National Forest, the Bloedel Professorship at the University ofWashington, and the Olympic Natural Resources Center of the University ofWashington, with funding from USDA Forest Service New Perspectives

236 J. CHEN ET AL.
Program Grant No. PNW 90-342, Amendment No. 1. We thank Carol Perryand Stephanie Martin for reviews of the draft of this manuscript.
REFERENCES
Bierlmaier, F.A. and McKee, A., 1989. Climatic summaries and documentation for the primarymeteorological station, H.J. Andrews Experimental Forest, 1972-1984. USDA For. Serv. Gen.Tech. Rep., PNW-GTR-242.
Campbell, G.S., 1986. An Introduction to Environmental Biophysics. Springer, New York, USA, 159 pp.Chapin. III, F.S., Bloom, A.J., Field, C.B. and Waring, R.H., 1987. Plant responses to multiple
environmental factors. BioScience, 37(1): 49-57.Chen. J., 1991. Edge Effects: Microclimatic Pattern and Biological Responses in Old-growth Douglas-
fir Forests. PhD Thesis, University of Washington, Seattle; WA.Chen, J., Franklin, J.F. and Spies, T.A., 1992. Vegetation responses to edge environments in
old-growth Douglas-fir forests. Ecol. Appl., 2(4): 387-396.DeBell, S.D. and Franklin, J.F., 1987. Old growth Douglas-fir and western hemlock: a 36-year record
of growth and mortality. West. J. Appl. For., 2(4): 111-114.Edmonds, R.L., 1980. Litter decomposition and nutrient release in Douglas-fir, redceder, western
hemlock, and Pacific silver fir ecosystems in western Washington. Can. J. For. Res., 10(3): 327-337.Edmonds, R.L. and Bigger, C.M., 1984. Decomposition and nitrogen mineralization rates in Douglas-
fir needles in relation to whole tree harvesting practices. In: Proceedings of the 1983 Society ofAmerican Foresters National Convention, Portland, OR.
Forman, R.T.T. and Godron, M., 1986. Landscape Ecology. John Wiley, New York.Franklin, J.F. and Dyrness, C.T., 1973. Natural Vegetation of Oregon and Washington. USDA For.
Serv. Tech. Rep., PNW-8.Franklin, J.F. and Forman, R.T.T., 1987. Creating landscape patterns by forest cutting: ecological
consequences and principles. Land. Ecol., 1: 5-18.Fritschen, L.J., 1967. A sensitive cup-type anemometer. J. Appl. Meteorol., 6: 695-698.Fritschen, L.J., Driver, C., Avery, C., Buffo, J., Edmonds, R., Kinerson, R. and Schiess, P., 1970.
Dispersion of air tracers into and within a forested area: No. 3. ECOM-68-G8-3, USAECOM,Atmospheric Science Laboratory, Fort Huachuca, AZ.
Fritschen, L.J: and Gay, L.W., 1979. Environmental instrumentation. Springer, New York, 216 pp.Frost, E.J., 1992. The Effects of Forest-Clearcut Edges on the Structure and Composition of Old
Growth Mixed Conifer Stands in the Western Klamath Mountains. Masters Thesis, HumboldtState University, Arcata, CA.
Geiger, R., 1965. The climate near the ground. Harvard University Press, Cambridge, MA.Ghuman, B.S. and Lal, R., 1987. Effects of partial clearing on microclimate in a humid tropical
forest. Agric. For. Meteorol., 40: 17-29.Gosz, J.R., 1992. Ecological functions in a biome transition zone: translating local responses to
broad-scale dynamics. In: A.J. Hansen and F. di Castri, F. (Eds), Landscape Boundaries:Consequences for Biotic Diversity and Ecological Flows. Springer, New York, 462 pp.
Gratkowski, H.J., 1956. Wind throw around staggered settings in old-growth Douglas-fir. For. Sci.,2: 60-74.
Gray, A.N. and Spies, T.A., 1992. Use of Time Domain Reflectometry (TDR) to determine watercontent of mineral and organic substrates in conifer canopy gaps. Bull. Ecol. Soc Am., 73(2):191-192.
Hansen, A. and E. Horvah., 1990. Wildlife abundance and biodiversity in managed upland forestlandscapes. Adaptive COPE Annual Report, Oregon State University.
Harris; L.D., 1984. The Fragmented Forest: Island Biogeography Theory and the Preservation ofBiotic Diversity. University of Chicago Press, Chicago, IL, 211 pp.

MICROCLIMATES AMONG CLEARCUT, EDGE, AND FOREST 237
Hungerford, R.D. and Babbitt, R.E., 1987. Overstory removal and residue treatments affect soilsurface, air, and soil temperature: implications for seedling survival. USDA For. Serv. Res. Pap.,INT-377.
Hunter, M.L., 1990. Wildlife, Forest, and Forestry-Principles of Managing Forest for BiologicalDiversity. Prentice-Hall, Englewood Cliffs, NJ, 370 pp.
Kitredgem, J., 1948. Forest Influences. McGraw-Hill.Lee, R., 1978. Forest Microclimatology. Columbia University Press. New York, 276 pp.Lehmkuhl, J.F. and Ruggiero, L.F., 1991. Forest fragmentation in the Pacific Northwest and its
potential effects on wildlife. In: Ruggiero, L.F., Carey, K.B. and Huff, M.H. (technical coordina-tors), Wildlife and Vegetation of Unmanaged Douglas Fir Forests. USDA For. Serv. Gen. Tech.Rep., PNW-GTR-285, pp. 35-46.
Lowe, P.R., 1977. An approximating polynomial for the computation of saturation vapor pressure.J. Appl. Meteorol., 16: 100-103.
Moore, A.M., 1986. Temperature and moisture dependence of decomposition rates of hardwood andconiferous leaf litter. Biol. Biochem., 18(4): 427-435.
Morrison, P.H., 1990. Ancient Forests on the Olympic National Forest: Analysis from a Historicaland Landscape Perspective. The Wilderness Society, Washington, DC.
Morrison, P.H., Kloepfer, D., Leversee, D.A., Milner-Socha, C. and Ferber, D.L., 1991. AncientForests in the Pacific Northwest: Analysis and Maps of Twelve National Forests. The WildernessSociety, Washington, DC, 13 pp.
Phillips, E.L., 1964. Washington climate. Agricultural Extension Service, Washington State Uni-versity, Pullman, WA, 42 pp.
Pinker, R., 1980. The microclimate of a dry tropical forest. Agric. Meteorol., 22: 249-265.Ranney, J.W., 1977. Forest island edges - their structure, development, and importance to regional
forest ecosystem dynamics. Environmental Sciences Division Publication No. 1069, Oak RidgeNational Laboratory, Oak Ridge, TN, 34 pp.
Raynor, G.S., 1971. Wind and temperature structure in a coniferous forest and a contiguous field.For. Sci., 17(3): 351-363.
Ripple, W.J., Bradshaw, G.A. and Spies, T.A., 1991. Measuring forest landscape patterns in theCascade Range of Oregon, USA. Bio. Conserv., 57: 73-88.
Ruth, R.H. and Yoder, R.A., 1953. Reducing wind damage in the forests of the Oregon coast range.USDA For. Serv. Res. Pap., PNW-7.
Szujecki, A., 1987. Ecology of Forest Insects. PWN-Polish Scientific, Warsaw, Poland.Thomas, J.W., Maser, C. and Rodiek, J.E., 1979. Edges. In: J.W. Thomas (Ed), Wildlife Habitats
in Managed Forest: the Blue Mountains of Oregon and Washington. USDA For. Serv. Agricul-tural Handbook Number 553.
Wales, B.A., 1967. Climate, microclimate and vegetation relationships on north and south forestboundaries in New Jersey. William L. Hutcheson Mem. For. Bull., 2(3): 1-60.
Waring, R.H. and Schlesinger, W.H., 1985. Forest Ecosystems: Concepts and Management.Academic Press, Orlando, FL, 340 pp.
Weathers, K.C., Lovett, G.M. and Likens, G.E., 1990. Cloud deposition to a forest edge. Bull. Ecol.Soc. Am., Supplement, 71(2): 363.
Williams-Linera, G., 1990. Vegetation structure and environmental conditions of forest edges inPanama. J. Ecol., 78(4): 356-373.
Wittaker, R.H., 1975. Communities and Ecosystems. 2nd edn. Macmillan, NewYork.Wood, P.A. and Samways, M.J., 1991. Landscape element pattern and continuity of butterfly flight
paths in an ecologically landscaped botanic garden, Natal, South Africa. Biol. Conserv., 58: 149-166.Yahner, R.H., 1988. Changes in wildlife communities near edges. Conserv.Bio., 2: 333-339.Zobel, D.B., Mckee, A., Hawk, G.M. and Dyrness, C.T., 1976. Relationships of environment to
composition, structure, and diversity of forest communities of the central western Cascades ofOregon. Ecol. Monogr., 46(2): 135-156.