Contrast Enhancement of Brightness-Distorted Images … Enhancement of Brightness-Distorted Images...
20
1 Contrast Enhancement of Brightness-Distorted Images by Improved Adaptive Gamma Correction Gang Cao 1* , Lihui Huang 1 , Huawei Tian 2 , Xianglin Huang 3 , Yongbin Wang 1 , Ruicong Zhi 4 1 School of Computer Science, Communication University of China, Beijing 100024, China 2 College of Criminal Investigation and Counter Terrorism, People’s Public Security University of China, Beijing 100038, China 3 Faculty of Science and Technology, Communication University of China, Beijing 100024, China 4 School of Computer and Communication Engineering, Beijing University of Science and Technology, Beijing 100083, China * Correspondence author: [email protected] Abstract. As an efficient image contrast enhancement (CE) tool, adaptive gamma correction (AGC) was previously proposed by relating gamma parameter with cumulative distribution function (CDF) of the pixel gray levels within an image. ACG deals well with most dimmed images, but fails for globally bright images and the dimmed images with local bright regions. Such two categories of brightness-distorted images are universal in real scenarios, such as improper exposure and white object regions. In order to attenuate such deficiencies, here we propose an improved AGC algorithm. The novel strategy of negative images is used to realize CE of the bright images, and the gamma correction modulated by truncated CDF is employed to enhance the dimmed ones. As such, local over-enhancement and structure distortion can be alleviated. Both qualitative and quantitative experimental results show that our proposed method yields consistently good CE results. Keywords: image enhancement, contrast enhancement, adaptive gamma correction, negative image, CDF truncation, dimmed image, bright image. 1. Introduction Contrast enhancement (CE) refers to the image enhancement on contrast by adjusting the dynamic range of pixel intensity distribution [1]. CE plays an important role in the improvement of visual quality for computer vision, pattern recognition and digital image processing. In real applications, we usually encounter digital images with poor contrast or abnormal brightness, which may result from different factors, such as the inexperience of taking photographs and the inherent deficiency of imaging devices. The capturing scenes with low or high illuminance intensity may also lead to reduced contrast quality. Despite of visual quality degradation, low contrast might hinder the further applications of a digital image, including image analysis and understanding, object recognition and digital printing, etc. As such, it is essential to enhance the contrast of such distorted images before further applications. Existing CE techniques can be categorized into pixel-domain [2-12] and transform-domain ones [13-17] according to the data domain they are applied to [6]. The former relies on pixel intensity operation, while the latter implements CE in the transformation domain of an image, such as discrete cosine transform (DCT) [13-15], Wavelet [16] and Curvelet [17]. Generally, the pixel-domain CE techniques might be used more widely in real applications due to low requirements on computational cost and parameter setting.
Transcript of Contrast Enhancement of Brightness-Distorted Images … Enhancement of Brightness-Distorted Images...

1
Contrast Enhancement of Brightness-Distorted Images by Improved Adaptive Gamma Correction
Gang Cao1*, Lihui Huang1, Huawei Tian2, Xianglin Huang3, Yongbin Wang1, Ruicong Zhi4 1School of Computer Science, Communication University of China, Beijing 100024, China 2College of Criminal Investigation and Counter Terrorism, People’s Public Security University of China, Beijing 100038, China 3Faculty of Science and Technology, Communication University of China, Beijing 100024, China 4School of Computer and Communication Engineering, Beijing University of Science and Technology, Beijing 100083, China *Correspondence author: [email protected]
Abstract. As an efficient image contrast enhancement (CE) tool, adaptive gamma correction (AGC) was previously proposed by relating gamma parameter with cumulative distribution function (CDF) of the pixel gray levels within an image. ACG deals well with most dimmed images, but fails for globally bright images and the dimmed images with local bright regions. Such two categories of brightness-distorted images are universal in real scenarios, such as improper exposure and white object regions. In order to attenuate such deficiencies, here we propose an improved AGC algorithm. The novel strategy of negative images is used to realize CE of the bright images, and the gamma correction modulated by truncated CDF is employed to enhance the dimmed ones. As such, local over-enhancement and structure distortion can be alleviated. Both qualitative and quantitative experimental results show that our proposed method yields consistently good CE results. Keywords: image enhancement, contrast enhancement, adaptive gamma correction, negative image, CDF truncation, dimmed image, bright image.
1. Introduction
Contrast enhancement (CE) refers to the image enhancement on contrast by adjusting the dynamic
range of pixel intensity distribution [1]. CE plays an important role in the improvement of visual quality
for computer vision, pattern recognition and digital image processing. In real applications, we usually
encounter digital images with poor contrast or abnormal brightness, which may result from different
factors, such as the inexperience of taking photographs and the inherent deficiency of imaging devices.
The capturing scenes with low or high illuminance intensity may also lead to reduced contrast quality.
Despite of visual quality degradation, low contrast might hinder the further applications of a digital image,
including image analysis and understanding, object recognition and digital printing, etc. As such, it is
essential to enhance the contrast of such distorted images before further applications.
Existing CE techniques can be categorized into pixel-domain [2-12] and transform-domain ones [13-17]
according to the data domain they are applied to [6]. The former relies on pixel intensity operation, while
the latter implements CE in the transformation domain of an image, such as discrete cosine transform
(DCT) [13-15], Wavelet [16] and Curvelet [17]. Generally, the pixel-domain CE techniques might be used
more widely in real applications due to low requirements on computational cost and parameter setting.

2
There exist a large category of pixel-domain CE techniques based on the redistribution of gray levels,
such as histogram equalization (HE) and its related methods [1-3]. HE implements pixel intensity mapping
by directly equalizing the cumulative distribution function (CDF) of the input image's gray level histogram,
which becomes as uniform as possible after CE. Despite the merit of high computational efficiency, HE
owns the limitation to incur over-enhancement if high peaks exist in the input histogram [4]. In order to
attenuate such deficiency, the improved local HE [2] and brightness preserving bi-HE [3] are developed.
As another influential work, Arici et al. propose a general histogram modification (HM) framework for CE,
which is considered as an optimization problem [4]. It minimizes a cost function which includes the
penalty of histogram deviation from primary to uniform histograms, histogram smoothness and black &
white stretching. Although HM successfully avoids the unnatural look caused by excessive enhancement,
its enhancement results are rather sensitive to parameter setting. Gaussian mixture model is also proposed
to model the image intensity distribution which is partitioned into several intervals [5]. Pixel gray levels in
each interval are mapped to the appropriate output interval according to dominant Gaussian component
and interval-wise CDF. Although good visual effects are gained, such a method has a high computational
cost.
Recently, the spatial entropy-based contrast enhancement (SECE) is proposed to incorporate the spatial
distribution of pixel intensities into the design of mapping function [6]. After dividing an input image into
non-overlapped blocks, the distribution of spatial entropy is first calculated from blockwise 2D spatial
histograms, and then equalized for implementing CE. SECE can consistently yield visually improved and
pleasing outputs without attractive distortions, regardless of the available contrast on input images.
However, as pointed out in the later improvement works [7, 8], SECE is found to enjoy the insufficient
enhancement strength limit. In [9], noisy low-light images are enhanced by recurring to structure-texture-
noise decomposition model of images. Besides, human visual perception [18, 19] and advanced machine
learning techniques, such as deep learning [20], are also used to design efficient CE algorithms.
Gamma correction is also a popular pixel-domain CE method, which is cost-effective and good at
dealing with bright and dimmed images [1, 11, 12, 21]. However, the manual selection of appropriate
gamma values is often time-consuming. As for adaptive gamma correction (AGC), the gamma parameter
is modulated by the statistics extracted from images, and therefore set automatically. Huang et al.
proposed the AGC with weighting distribution (AGCWD) by setting gamma as a function of CDF [11].
AGCWD behaves well in enhancing dimmed images which own low average brightness and seem black,
as shown in Fig. 1(a).
3
In this paper, we focus on the CE of brightness-distorted images which own a relatively high or low
global intensity. The existing AGC techniques are revisited and improved formally. We find that such
methods are incapable to be directly used to enhance globally bright images, and the image structure in
local bright regions may be lost in enhancing dimmed images. In order to attenuate such deficiencies, we
propose an improved AGC method by integrating the strategies of negative images and CDF truncation.
Substantial test results verify the effectiveness and efficacy of our proposed method in enhancing both
dimmed and bright types of contrast-distorted images.
The rest of this paper is organized as follows. AGC is revisited and analyzed detailedly in Section 2,
followed by the improved AGC scheme proposed in Section 3. Section 4 shows experimental results. The
conclusion is drawn in Section 5.
0 50 100 150 200 250
0
0.2
0.4
0.6
0.8
1
c l
1l c l
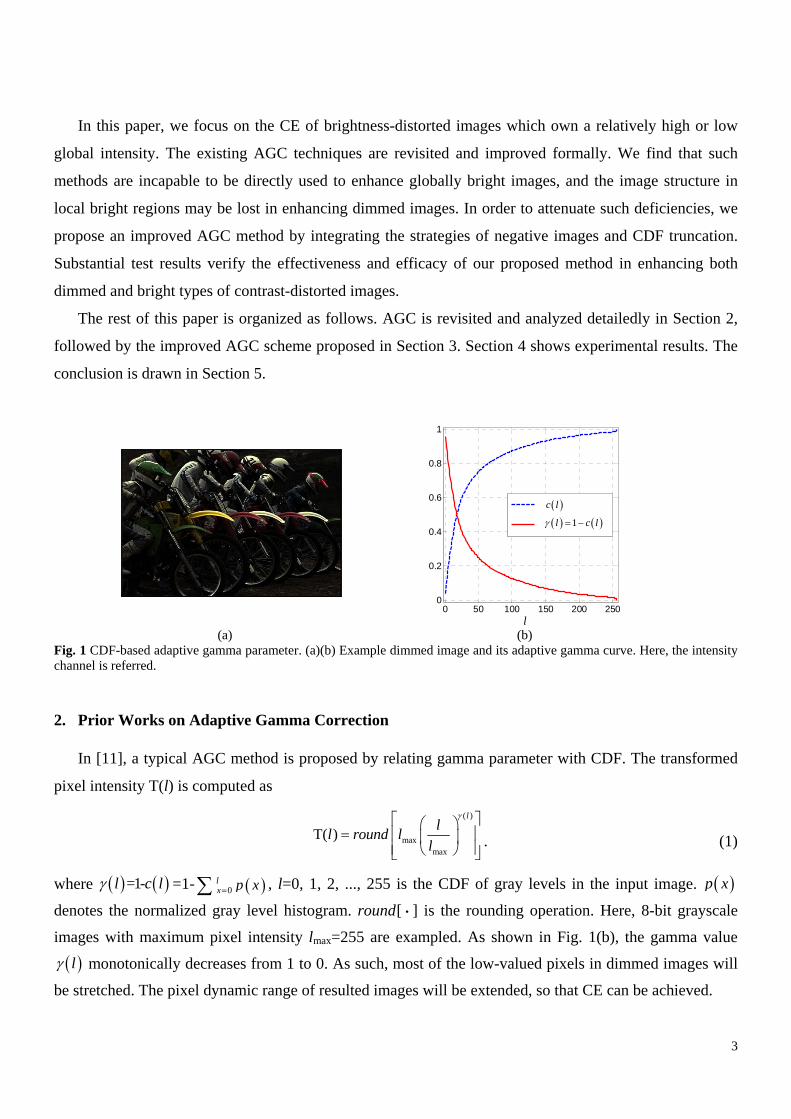
l (a) (b) Fig. 1 CDF-based adaptive gamma parameter. (a)(b) Example dimmed image and its adaptive gamma curve. Here, the intensity channel is referred.
2. Prior Works on Adaptive Gamma Correction In [11], a typical AGC method is proposed by relating gamma parameter with CDF. The transformed
pixel intensity T(l) is computed as
( )
maxmax
T( )l
ll round l
l
. (1)
where =1-l c l =1- 0lx p x , l=0, 1, 2, ..., 255 is the CDF of gray levels in the input image. p x
denotes the normalized gray level histogram. round [·] is the rounding operation. Here, 8-bit grayscale
images with maximum pixel intensity lmax=255 are exampled. As shown in Fig. 1(b), the gamma value
l monotonically decreases from 1 to 0. As such, most of the low-valued pixels in dimmed images will
be stretched. The pixel dynamic range of resulted images will be extended, so that CE can be achieved.

4
Furthermore, a weighting distribution function is used to smooth the primary histogram [11]. That is,
minmax
max min
( )( )w
p l pp l p
p p
(2)
where is the adjusted parameter, max minmax , minll
p p l p p l . Then wp l is normalized for yielding
'wp l . As shown in Fig. 2(a), the histogram weighted by 1 becomes relatively flat and smooth at low
intensities, so that the adverse effects are lessened [11].
0 50 100 150 200 2500
0.05
0.1
0.15
0.2
0 10 20 300
0.04
0.08
0.12
0.5 1
1.5
l
'wp l
0 50 100 150 200 250
0
0.2
0.4
0.6
0.8
1
0.5 1
1.5
l
wc l
(a) (b)
(c) (d) (e) Fig. 2 AGCWD method. (a) The weighted pixel intensity histogram of the image in Fig 1(a); (b) its corresponding CDF curve;
(c)(d)(e) enhanced images with the weighting factor = 1, 0.5, 1.5, respectively.
In the formal AGCWD algorithm [11], Eq. (1) is updated by replacing l with the w l derived
from 'wp l . As shown in Fig. 2(b), the corresponding CDF wc l from '
wp l can be adjusted via . Figs.
2(c)(d)(e) show the corresponding enhancement results of AGCWD.
Although such prior AGC methods are effective in enhancing the contrast of most dimmed images, the
image distortion may be incurred in bright regions due to the improper setting of rather low gamma values
for large pixel intensities. Moreover, such AGC methods fail to enhance the contrast of globally bright
images, which own distinctly different distribution of pixel intensities.
5
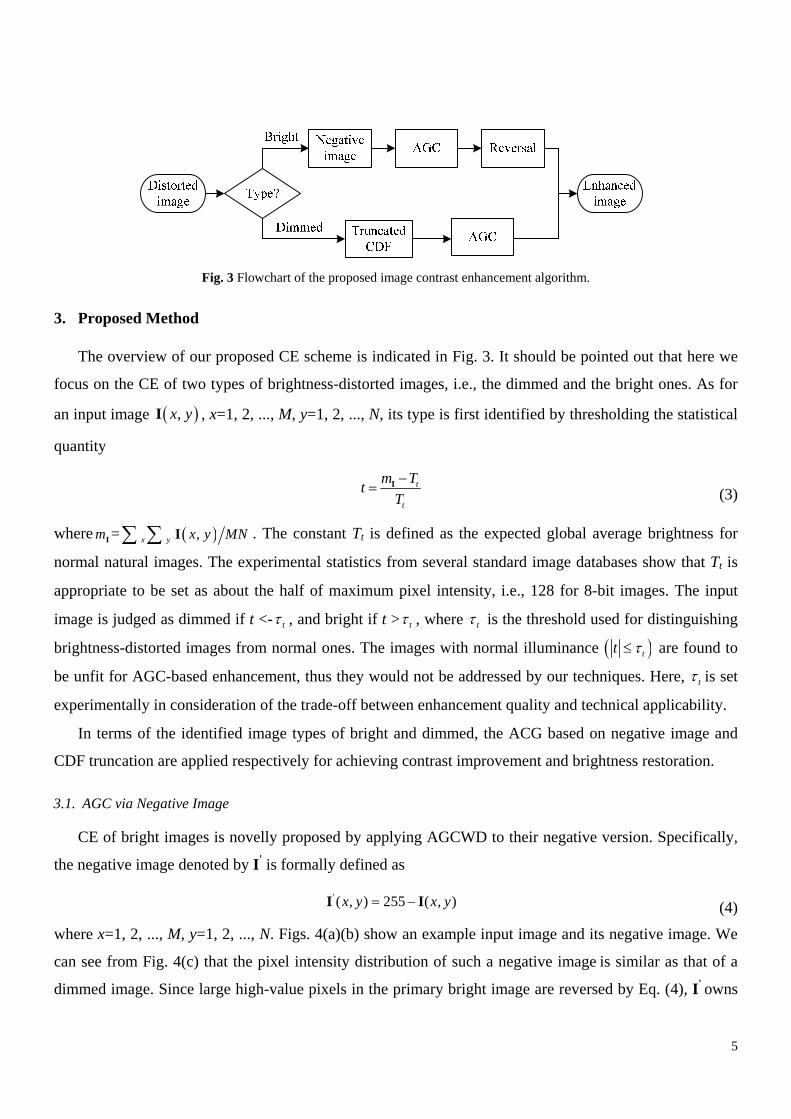
Fig. 3 Flowchart of the proposed image contrast enhancement algorithm.
3. Proposed Method
The overview of our proposed CE scheme is indicated in Fig. 3. It should be pointed out that here we
focus on the CE of two types of brightness-distorted images, i.e., the dimmed and the bright ones. As for
an input image ,x yI , x=1, 2, ..., M, y=1, 2, ..., N, its type is first identified by thresholding the statistical
quantity
t
t
m Tt
T
I
(3)
where ,= x ym x y MN I I . The constant Tt is defined as the expected global average brightness for
normal natural images. The experimental statistics from several standard image databases show that Tt is
appropriate to be set as about the half of maximum pixel intensity, i.e., 128 for 8-bit images. The input
image is judged as dimmed if t <- t , and bright if t > t , where t is the threshold used for distinguishing
brightness-distorted images from normal ones. The images with normal illuminance tt are found to
be unfit for AGC-based enhancement, thus they would not be addressed by our techniques. Here, t is set
experimentally in consideration of the trade-off between enhancement quality and technical applicability.
In terms of the identified image types of bright and dimmed, the ACG based on negative image and
CDF truncation are applied respectively for achieving contrast improvement and brightness restoration.
3.1. AGC via Negative Image
CE of bright images is novelly proposed by applying AGCWD to their negative version. Specifically,
the negative image denoted by I' is formally defined as
' ( , ) 255 ( , )x y x y I I
(4)
where x=1, 2, ..., M, y=1, 2, ..., N. Figs. 4(a)(b) show an example input image and its negative image. We
can see from Fig. 4(c) that the pixel intensity distribution of such a negative image is similar as that of a
dimmed image. Since large high-value pixels in the primary bright image are reversed by Eq. (4), I' owns

6
massive low intensity pixels and can be considered as a dimmed image. As a result, the AGCWD can be
subsequently applied to I', which yields an immediate enhanced image Ie'. Lastly, Ie
' is reverted back to
positive image space for yielding the final enhanced image Ie shown in Fig. 4(f).
l
'wp l
0 50 100 150 200 2500
0.002
0.004
0.006
0.008
Example bright image
Negative image
(a) (b) (c)
0 50 100 150 200 2500
0.2
0.4
0.6
0.8
1
Example bright image
Negative image
l
w l
(d) (e) (f)
Fig. 4 Negative-image-based AGC. (a)(b) Example bright image and its negative version; (c) pixel intensity histograms; (d)
adaptive gamma curves; (e)(f) enhancement results of ACGWD and negative-image-based AGC, respectively. Here, = 0.25.
We can see that such negative image-based AGC method relies on the successfulness of AGCWD in
enhancing the dimmed negative image. In Fig. 4(d), an early and rapid decrease occurs in the adaptive
gamma mapping curve generated from the negative image. Consequently, both the brightness and contrast
can be enhanced reasonably. However, if AGCWD is directly applied to the bright image, a worse result
shown in Fig. 4(e) would be gained due to the used improper mapping function.
Specifically, our proposed negative-image-based AGC algorithm is described briefly in Algorithm-1.
It should be mentioned that the weighting factor used here needs to be addressed elaboratively, since
the statistical histogram of natural images may be asymmetric. As such, the setting of for enhancing
bright images is different from that for dimmed images.

7
Algorithm-1: Negative-image-based AGC Algorithm
Step-1. Obtain the negative image I' of the input image according to Eq. (4).
Step-2. Obtain the gray level histogram p(l ) of I', and compute pw(l ) via Eq. (2).
Step-3. Compute ( )w l =1-cw(l ), where cw(l ) is the CDF derived from normalized pw(l ).
Step-4. Apply pixel value transformation to I' according to Eq. (1) and yield Ie'.
Step-5. Output the enhanced image Ie= round [255- Ie'], where round[·] is rounding operation.
3.2. AGC via Truncated CDF
As shown in Fig. 1(b), the input pixels with different intensities are corrected with different gamma
values in AGCWD. For example, there are more than 70% pixels within [0, 50] for the primary dimmed
image shown in Fig. 1(a). Their corresponding applied gamma decreases rapidly from 1 to around 0.25. As
such, the dimmed pixels can be brightened evidently due to the use of relatively small gamma values. That
can be seen from the enhanced results shown in Figs. 2(c)(d)(e), which look globally brighter than the
original image and the details in dimmed regions become visible. This is the reason why AGCWD works.
However, there exists a serious problem in AGCWD. As shown in Figs. 2(c)(d)(e) (locally magnified
versions in Fig. 10), the edges in bright regions, i.e., the white lid of wheels and white shirts, disappear or
weaken after CE. Such detail loss phenomenon is typically incurred by AGCWD in enhancing the images
with bright regions, which are universal in real applications. This deficiency should attribute to the used
overly low gamma values in transforming the median and high intensity pixels. Fig. 5 indicates that w l
continues to monotonously decrease from 0.25 towards 0 in processing the remaining pixels with gray
0 50 100 150 200 2500
0.2
0.4
0.6
0.8
1
1w wl c l
' max 1 ,w wl c l
l
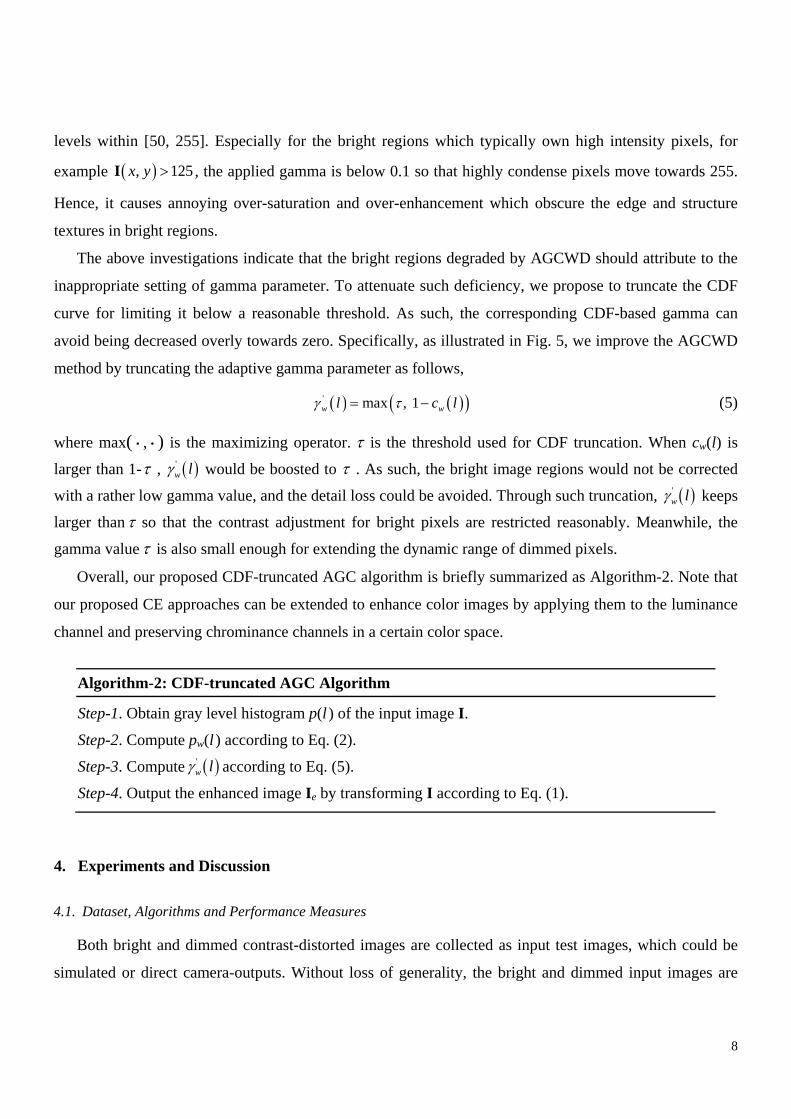
Fig. 5 Adaptive gamma curves of AGCWD ( w l ) and CDF-truncated AGC ( 'w l ) for enhancing the image in Fig. 1(a).
8
levels within [50, 255]. Especially for the bright regions which typically own high intensity pixels, for
example , 125x y I , the applied gamma is below 0.1 so that highly condense pixels move towards 255.
Hence, it causes annoying over-saturation and over-enhancement which obscure the edge and structure
textures in bright regions.
The above investigations indicate that the bright regions degraded by AGCWD should attribute to the
inappropriate setting of gamma parameter. To attenuate such deficiency, we propose to truncate the CDF
curve for limiting it below a reasonable threshold. As such, the corresponding CDF-based gamma can
avoid being decreased overly towards zero. Specifically, as illustrated in Fig. 5, we improve the AGCWD
method by truncating the adaptive gamma parameter as follows,
' max , 1w wl c l (5)
where max(·,·) is the maximizing operator. is the threshold used for CDF truncation. When cw(l) is
larger than 1- , 'w l would be boosted to . As such, the bright image regions would not be corrected
with a rather low gamma value, and the detail loss could be avoided. Through such truncation, 'w l
keeps
larger than so that the contrast adjustment for bright pixels are restricted reasonably. Meanwhile, the
gamma value is also small enough for extending the dynamic range of dimmed pixels.
Overall, our proposed CDF-truncated AGC algorithm is briefly summarized as Algorithm-2. Note that
our proposed CE approaches can be extended to enhance color images by applying them to the luminance
channel and preserving chrominance channels in a certain color space.
Algorithm-2: CDF-truncated AGC Algorithm
Step-1. Obtain gray level histogram p(l ) of the input image I.
Step-2. Compute pw(l ) according to Eq. (2).
Step-3. Compute 'w l
according to Eq. (5).
Step-4. Output the enhanced image Ie by transforming I according to Eq. (1).
4. Experiments and Discussion
4.1. Dataset, Algorithms and Performance Measures
Both bright and dimmed contrast-distorted images are collected as input test images, which could be
simulated or direct camera-outputs. Without loss of generality, the bright and dimmed input images are

9
simulated by respectively applying the gamma corrections with 0.3 and 2 to the images from Kodak
[22], BSD500 [23] and UCID [24] standard databases.
Performance comparison tests are also conducted. The compared CE algorithms include HE [1], HM
[4], AGCWD [11], IMADJ (Matlab function 'imadjust') [10] and SECE [6]. HSV color space is selected
and the V channel image is enhanced in all referred tests.
Currently, the performance assessment of CE algorithms is still a challenge task [25-27]. In order to
keep consistency with prior works and apply the latest research achievements, the metrics EMEG
(Expected Measurement of Enhancement by Gradient) [6], GMSD (Gradient Magnitude Similarity
Deviation) [28] and PCQI (Patch-based Contrast Quality Index) [25] are simultaneously used as objective
assessment of CE algorithms. EMEG is defined as
1 2
, ,, ,
, ,1 11 2 , ,
1 1EMEG max ,
255 1 1
dx h dy hk ki j i j
dx l dy li j i j i jk k
I I
II I
(6)
where the input image I is divided into k1k2 overlapping sub-blocks Ii, j of size 8×8 pixels. ,,
dx hi j
I , ,,
dx li j
I are
respectively the highest and lowest values of absolute row-based block derivative, while ,,
dy hi j
I , ,,
dy li j
I are the
column-based ones. The blocks with high contrast own high EMEG values, where the maximum value is 1.
Contrarily, EMEG of smooth blocks is relatively low and reaches as low as 0. That is, EMEG(I) [0,1] .
Although EMEG is sensitive to noise, it is still expected that EMEG(Ie) > EMEG(I) [6].
GMSD is a full-reference image quality assessment for measuring the perceptual similarity between
two images via gradient comparison [28]. Here, GMSD(Ie, Ir) denotes the similarity between the enhanced
image Ie and the reference image Ir. The GMSD value is lower if the difference is less, and becomes 0 if
corresponding gradient images are the same. However, we discover that GMSD may fail to reflect the
discrepancy of mean intensities between two images, which determine the global perceptual brightness.
PCQI provides an accurate prediction on the human perception of contrast variations between the
enhanced and reference images [25]. The PCQI is defined as
PCQI ,e r c s iP P P I I (7)
where Pc[0, 2] measures the contrast change of Ie comparing with Ir. Contrast increases if Pc >1, and the
higher Pc value implies more improvement. Ps[0, 1] and Pi[0, 1] respectively measure the distortions
of image structure and mean intensity between Ie and Ir. The higher Ps, Pi values mean less distortions. The
PCQI (P) value provides the overall evaluation metric.

10
Based on plentiful experimental observations and quantitative verifications, the involved parameters in
our proposed algorithm are experimentally set as 112, 0.3, 0.5t tT , 0.25 for enhancing bright
images and 0.75 for dimmed ones. Such setting could be easily adjusted within a limited range without
apparently affecting the enhancement results.
4.2. Qualitative Assessments on Bright Images
Qualitative assessment results on the simulated bright type of low-contrast images are shown in Figs.
6~9 and Tables 1, 2.
(a) (b) (c) (d)
(e) (f) (g) (h) Fig. 6 Results for bright image Hats. (a) Input bright image; Enhanced images obtained by (b) HE, (c) HM, (d) AGCWD, (e) IMADJ, (f) SECE, (g) Our proposed algorithms; (h) Original version in Kodak dataset.
(a) (b) (c) (d)
(e) (f) (g) (h) Fig. 7 Results for bright image Moto. (a) Input bright image; Enhanced images obtained by (b) HE, (c) HM, (d) AGCWD, (e) IMADJ, (f) SECE, (g) Our proposed algorithms; (h) Original version in Kodak dataset.

11
(a) (b) (c) (d)
(e) (f) (g) (h) Fig. 8 Results for bright image Island. (a) Input bright image; Enhanced images obtained by (b) HE, (c) HM, (d) AGCWD, (e) IMADJ, (f) SECE, (g) Our proposed algorithms; (h) Original version in Kodak dataset.
(a) (b) (c) (d)
(e) (f) (g) (h) Fig. 9 Results for bright image Tower. (a) Input bright image; Enhanced images obtained by (b) HE, (c) HM, (d) AGCWD, (e) IMADJ, (f) SECE, (g) Our proposed algorithms; (h) Original version in Kodak dataset.

12
Table 1 EMEG (E) and GMSD (G) values (×10-3) of the bright sample images (Figs. 6~9) enhanced by different algorithms.
Algo. Input HE HM AGCWD IMADJ SECE Prop.
Metric E G E G E G E G E G E G E G Hats 43 84 133 99 54 76 52 150 89 31 88 23 99 43
Moto 152 87 378 92 309 83 199 182 262 51 262 39 301 44
Island 70 81 192 98 101 79 93 146 157 70 155 62 164 62
Tower 75 98 224 119 120 73 89 200 158 30 147 28 169 39
Table 2 PCQI (P) values (×10-3) of the bright sample images (Figs. 6~9) enhanced by different algorithms.
Algo. Input HE HM AGCWD IMADJ SECE Prop.
Metric Pc Ps Pi P Pc Ps Pi P Pc Ps Pi P Pc Ps Pi P Pc Ps Pi P Pc Ps Pi P Pc Ps Pi P
Hats 752 992 732 538 1210 974 885 1048 841 988 750 617 800 975 674 515 1080 986 952 1015 1076 988 927 987 1124 986 915 1017
Moto 750 992 709 520 1259 979 876 1089 1159 983 806 923 846 961 642 517 1084 992 880 948 1090 993 868 941 1171 993 899 1048
Island 754 993 721 534 1245 982 888 1093 909 989 732 653 848 980 659 539 1165 988 932 1078 1148 990 903 1033 1184 990 910 1073
Tower 687 993 744 500 1226 972 904 1083 917 987 791 709 754 970 691 491 1056 990 933 977 1025 991 890 904 1110 990 912 1004
Fig. 6 shows the results on the image Hats, where (a) indicates the bright image to be enhanced, and
(b)~(g) indicate the enhanced results generated by different CE algorithms. As shown in Fig. 6(b),
although HE achieves high contrast, it incurs over-enhancement in shadow regions which look much black.
Figs. 6(c)(d) show that the contrast improvements yielded by HM and AGCWD are rather weak and even
void. IMADJ, SECE and our proposed CE algorithm have successfully boost the contrast of distorted
images without incurring annoying artifacts, and the enhanced results are visually consistent with the
unaltered standard image shown in Fig. 6(h).
Such visual results are consistently validated by corresponding objective performance measurements
given in Tables 1, 2. Comparing with AGCWD and HM, our method attains higher EMEG, Pc values,
lower GMSD and higher Ps, Pi values. Such digitals reveal that more contrast improvement and less
structure/intensity distortions are achieved by our method. Although HE gains high EMEG, Pc values, it
has high GMSD and low Ps, Pi values which imply large distortions. In terms of performance tradeoff,
ours is comparative with IMADJ and SECE, since approximate measurements have been obtained by such
methods. Note that slightly higher contrast improvement may be at the cost of a little more distortions, i.e.,
either the structure or the mean intensity distortion.
Similar results are also obtained on the other example images Moto, Island and Tower, as shown in
Figs. 7, 8 and 9, respectively. We can see that quality of the images enhanced by our method always keeps
comparative with the state of the art, i.e., SECE, and the classical IMADJ method. HE and HM could

13
(a) (b) (c) (d) (e) (f) (g)
Fig. 10 Results for dimmed images Hats, Moto, Island and Tower. (a) Input dimmed image; Enhanced images obtained by (b) HE, (c) HM, (d) AGCWD, (e) IMADJ, (f) SECE, (g) Our proposed algorithms. The corresponding locally magnified versions are shown in even rows.

14
Table 3 EMEG (E) and GMSD (G) values (×10-3) of the dimmed sample images (Fig. 10) enhanced by different algorithms.
Algo. Input HE HM AGCWD IMADJ SECE Prop.
Metric E G E G E G E G E G E G E G Hats 80 55 130 97 95 56 129 101 82 64 96 45 101 50
Moto 208 86 375 91 354 69 393 104 209 87 252 43 294 53
Island 89 63 189 97 123 50 184 108 102 67 127 43 147 59
Tower 146 56 220 117 186 59 215 92 149 62 161 31 183 71
Table 4 PCQI (P) values (×10-3) of the dimmed sample images (Fig. 10) enhanced by different algorithms.
Algo. Input HE HM AGCWD IMADJ SECE Prop.
Metric Pc Ps Pi P Pc Ps Pi P Pc Ps Pi P Pc Ps Pi P Pc Ps Pi P Pc Ps Pi P Pc Ps Pi P
Hats 966 995 804 774 1208 979 887 1054 1061 992 828 875 1190 985 893 1053 976 993 790 767 1074 992 859 919 1110 989 939 1030
Moto 814 987 824 659 1253 978 876 1083 1222 982 932 1124 1232 974 915 1106 814 987 821 658 983 989 880 857 1121 984 947 1045
Island 882 995 808 708 1242 989 890 1100 1058 994 872 919 1201 987 893 1067 947 992 813 765 1073 994 893 955 1103 992 943 1031
Tower 962 995 810 778 1224 978 905 1090 1189 991 933 1099 1213 982 909 1090 969 994 801 775 1083 995 878 948 1160 988 941 1078
not work well on all sample images, while AGCWD behaves the most badly due to the least contrast
increase. Such consistent conclusions could also be verified by the corresponding results shown in Tables
1, 2.
4.3. Qualitative Assessments on Dimmed Images
In this subsection, the corresponding qualitative assessment results on dimmed low-contrast images are
illustrated in Fig. 10 and Tables 3, 4.
We can see from the locally magnified regions that both HE and AGCWD methods typically incur
over-enhancement on bright regions, such as top of the hats, edges within the white circle lid and shirts,
contours of the clouds and textures of the chimney. Details in such image regions are lost to some extent
after CE. The corresponding distortion measurements Ps, Pi are relatively low. For example on the image
Island, Ps=0.989, Pi=0.890 for HE and Ps=0.987, Pi=0.893 for AGCWD. On the contrary, our proposed
CE method avoids such over-enhancement and has Ps=0.992, Pi=0.943, which are more close to 1 and
signify less distortions. Although such better visual quality is achieved, the given overall metric P for our
method is instead lower than those of HE and AGCWD due to the affection of Pc. As a result, we believe
that the PCQI sub-metrics are more reasonable to be treated separately.

15
A good CE method should achieve a balance between contrast improvement and image distortion. Less
distortion should be incurred while more contrast improvement is gained. In terms of such viewpoint, our
proposed method could achieve the comparative results with SECE and HM. Note that HM causes slightly
apparent global intensity distortion on Hats and Island, which are validated by the low Pi values, 0.828
and 0.872, respectively. Although IMADJ could boost image contrast adequately, it causes more obvious
global intensity distortion and the enhanced images are still rather black.
Table 5 Average EMEG (E) and GMSD (G) values (×10-3) of the test images from BSD500 enhanced by different algorithms.
Algo. Input HE HM AGCWD IMADJ SECE Prop.
Metric E G E G E G E G E G E G E G Bright 113 53 265 114 170 49 135 127 188 44 187 30 205 42
Dimmed 162 107 270 123 211 100 270 111 193 108 202 77 208 83
Table 6 Average PCQI (P) values (×10-3) of the test images from BSD500 enhanced by different algorithms.
Algo. Input HE HM AGCWD IMADJ SECE Prop.
Metric Pc Ps Pi P Pc Ps Pi P Pc Ps Pi P Pc Ps Pi P Pc Ps Pi P Pc Ps Pi P Pc Ps Pi P
Bright 825 995 835 689 1232 965 892 1063 1014 989 866 871 868 976 763 643 1094 993 918 997 1096 994 932 1015 1126 992 923 1033
Dimmed 863 984 815 696 1227 957 880 1040 1065 977 872 919 1183 972 891 1034 965 982 834 800 1042 984 878 908 1087 978 902 964
4.4. Quantitative Assessments
In order to quantitatively evaluate the algorithm performance, bright and dimmed contrast-distorted
test images are prepared by respectively applying gamma correction with 0.3 and 2 to the 500 images
from BSD500 dataset. Tables 5, 6 show the average metrics for evaluating the quality of images enhanced
by different CE methods. Through observing average EMEG and Pc, we can see that all CE methods could
improve the contrast of input images, and our method is even better than SECE and IMADJ. Nevertheless,
the average GMSD and Ps of our method are slightly worse than those of SECE and IMADJ. That is to say,
our method could boost the contrast more remarkably at the cost of weakly intenser image distortion.
Besides, we could note that Pi of our method on dimmed images (0.902) is higher than those of SECE
(0.878) and IMADJ (0.834). Overall, such results demonstrate that the performance of our proposed CE
method is comparative with the state-of-the-art CE methods.
Simultaneously, remarkable improvement between AGCWD and our method could be seen from such
statistical results. As for bright images, the Pc value increases from 0.868 (AGCWD) to 1.126 (Prop.), and

16
Ps, Pi increase from 0.976, 0.763 to 0.992, 0.923, respectively. As for the dimmed images, although
AGCWD gets higher Pc, it also incurs more serious distortions which can be seen from the relatively small
Ps, Pi values. EMEG and GMSD metrics shown in Table 5 also consistently validate such conclusions.
The same quantitative tests are also conducted on Kodak and UCID datasets, and consistent results
have been obtained. Our method is also testified to be effective.
4.5. Computation Time
A good CE algorithm also requires low computational complexity. We also evaluate the algorithm
complexity of our proposed method. All algorithms are run on a computer with Intel Core i5-5200U CPU
@2.2 GHz and 8G RAM. The applied software platform is MATLAB R2013a. The average computation
time used for enhancing a test image created from BSD500 is computed.
As displayed in Table 7, the resulting average computation time per image of our proposed method is
28.6 ms, which is comparative with that of AGCWD. The additional operations in our proposed method,
i.e., negative image transformation and CDF truncation, do not incur rapid increasement of computational
complexity. SECE has a higher time complexity (38.6 ms) than ours. The histogram based approaches
including HE and HM are testified to own the merit of low complexity. Note that IMADJ is the most fast
with 1.8 ms per image, which is far below other methods. Such a result attributes to the simplicity of the
involved data operations, which just comprise simple statistic and stretching of pixel intensities. Moreover,
the prior results show that impressive visual enhancement effects can be achieved by IMADJ. Generally,
all CE techniques pursue the same goal of achieving more contrast increasement with less image distortion
at the cost of less computational resources.
Table 7 Average computation times (ms) of different CE algorithms per test image created from BSD500.
Algo. HE HM AGCWD IMADJ SECE Prop. Time 12.4 11.8 26.4 1.8 38.6 28.6
4.6. CE on Real Distorted Images
We also tested the CE performance on real contrast-distorted images, which are selected from UCID
dataset in terms of the abnormal brightness. Fig. 11 illustrates the results on the bright type of distorted
images. The high global brightness of such input images is expected to be decreased by CE operations.
The results demonstrate the effectiveness of our proposed method, which outperforms AGCWD and HE
distinctly, and resembles the other approaches. Specifically, we could pay attention to the white regions

17
within five example images, i.e., papers with characters, the skirt of a bear doll, cloth in background, text
on book sides and flowers on the ground, respectively. For example, the wrinkle textures in the skirt and
cloth regions are eliminated to some extent by AGCWD, but yet preserved well by our method.
The enhanced results on real dimmed images are shown in Fig. 12. We can see that HE often incurs
globally over-enhancement and some annoying artifacts in local regions, such as the sky area. As the prior
tests on simulated images, AGCWD still behaves badly on white and bright regions, for an instance, the
tower in the first example image and the billboard with characters 'mm' in the second one. Comparing with
the results of ours, more textured structure details of tower tops are lost, and the characters are more blurry.
Note that IMADJ and SECE are both inclined to bring under-enhancement, which could not heighten the
global brightness properly and the enhanced images are still rather dimmed. Nevertheless, our method and
HM could efficiently avoid such defects, and in general, superior enhancement effects are achieved.
(a) (b) (c) (d) (e) (f) (g)
Fig. 11 Results for real bright images. (a) Input bright image; Enhanced images obtained by (b) HE, (c) HM, (d) AGCWD, (e) IMADJ, (f) SECE, (g) Our proposed algorithms.

18
(a) (b) (c) (d) (e) (f) (g) Fig. 12 Results for real dimmed images. (a) Input dimmed image; Enhanced images obtained by (b) HE, (c) HM, (d) AGCWD, (e) IMADJ, (f) SECE, (g) Our proposed algorithms.
5. Conclusion
A new effective and efficient image contrast enhancement method is proposed based on an improved
adaptive gamma correction. The methodology of negative images is used to enhance the contrast of bright
images. CDF truncation is proposed to reconstruct the intensity-sensitive adaptive gamma for improving
the enhancement effects on dimmed images. Extensive qualitative and quantitative experiments show that
our proposed scheme achieves better or comparative enhancement effects than previous techniques. The
contrast of both bright and dimmed input images is enhanced effectively and efficiently without incurring
annoying artifacts. In the future work, we would try to improve the capability of our proposed method in
enhancing more types of images, instead of limiting to dimmed and bright ones.
6. References
[1] R. C. Gonzalez, R. E. Woods, Digital Image Processing, 3rd ed. Upper Saddle River, NJ, USA: Prentice-Hall
(2006).

19
[2] T. K. Kim, J. K. Paik, and B. S. Kang, “Contrast enhancement system using spatially adaptive histogram
equalization with temporal filtering,” IEEE Trans. Consum. Electron., 44(1), 82-87 (1998).
[3] Yeong-Taeg Kim, “Contrast Enhancement Using Brightness Preserving Bi-Histogram Equalization,” IEEE
Trans Consumer Electronics, 43(1), 1-8, (1997).
[4] T. Arici, S. Dikbas, and Y. Altunbasak, “A histogram modification framework and its application for image
contrast enhancement,” IEEE Trans. Image Process., 18(9), 1921-1935 (2009).
[5] T. Celik, T. Tjahjadi, “Automatic image equalization and contrast enhancement using Gaussian mixture
modeling,” IEEE Trans. Image Process., 21(1), 145-156 (2012).
[6] T. Celik, “Spatial entropy-based global and local image contrast enhancement,” IEEE Trans. Image Process.,
23(12), 5298-5308 (2014).
[7] T. Celik, H.-C. Li, “Residual spatial entropy-based contrast enhancement and gradient-based contrast measures,”
Journal of Modern Optics, 63(16), 1600–1617 (2016).
[8] T. Celik, “Spatial mutual information and pagerank-based contrast enhancement and quality-aware relative
contrast measure,” IEEE Trans. on Image Process., 25(10), 4719-4728 (2016).
[9] J. Lim, M. Heo, C. Lee, and C. S. Kim, “Contrast enhancement of noisy low-light images based on structure-
texture-noise decomposition,” Journal of Visual Commun. and Image Representation, 45(5), 107-121 (2017).
[10] Guide, MATLAB User’S. “The mathworks,” Inc., Natick, MA, 8(R2013a) (1998).
[11] S.-C. Huang, F.-C. Cheng, and Y.-S. Chiu, “Efficient contrast enhancement with adaptive gamma correction,”
IEEE Trans. Image Process., 22(3), 1032-1041 (2013).
[12] L. Huang, G. Cao, and L. Yu, “Efficient contrast enhancement with truncated adaptive gamma correction,”
Proc. of IEEE Intl. Congress on Image and Signal Process., BioMedical Engineering and Informatics, pp. 189-
194, Taiyuan (2016).
[13] S. Agaian, B. Silver, and K. Panetta, “Transform coefficient histogram based image enhancement algorithms
using contrast entropy,” IEEE Trans. Image Process., 16(3), 741-758 (2007).
[14] J. Mukherjee, S. K. Mitra, “Enhancement of color images by scaling the DCT coefficients,” IEEE Trans. Image
Process., 17(10), 1783-1794 (2008).
[15] J. Tang, E. Peli, and S. Acton, “Image enhancement using a contrast measure in the compressed domain,” IEEE
Signal Process. Lett., 10(10), 289-292 (2003).
[16] R. Fattal, “Edge-avoiding wavelets and their applications,” ACM Trans. Graphics, 28(3), 1-10 (2009).
[17] J.-L. Starck, F. Murtagh, E. J. Candès, and D. L. Donoho, “Gray and color image contrast enhancement by the
Curvelet transform,” IEEE Trans. Image Process., 12(6), 706-717 (2003).
[18] Z. Rahman, D. J. Jobson, and G. A. Woodell, “Retinex processing for automatic image enhancement,” Journal
of Electronic Imaging, 13(1), 100-110 (2004).
[19] A. Majumder, S. Irani, “Perception-based contrast enhancement of images,” ACM Trans. Applied Perception,
4(3), article no. 17 (2007).
[20] Z. Yan, H. Zhang, B. Wang, S. Paris, and Y. Yu, “Automatic photo adjustment using deep neural networks,”
ACM Trans. Graphics, 35(2), article no. 11 (2016).
[21] G. Cao, Y. Zhao, R. Ni, and X. Li, “Contrast enhancement-based forensics in digital images,” IEEE Trans. Info.
Forensics and Security, 9(3), 515-525 (2014).

20
[22] Kodak Lossless True Color Image Suite: http://r0k.us/graphics/ kodak/
[23] P. Arbelaez, M. Maire, C. Fowlkes, and J. Malik, “Contour detection and hierarchical image segmentation,”
IEEE Trans. Pattern Anal. Mach. Intell., 3(5), 898-916 (2011).
[24] G. Schaefer and M. Stich, “UCID - An uncompressed colour image database,” in Proc. SPIE, Storage and
Retrieval Methods and Applications for Multimedia, pp. 472-480, San Jose (2004).
[25] S. Wang, K. Ma, H. Yeganeh, Z. Wang, and W. Lin, “A patch-structure representation method for quality
assessment of contrast changed images,” IEEE Signal Process. Lett., 22(12), 2387-2390 (2015).
[26] Z. Chen, T. Jiang, and Y. Tian, “Quality assessment for comparing image enhancement algorithms,” IEEE Conf.
on Computer Vision and Pattern Recognition, pp. 3003-3010, Columbus, OH (2014).
[27] G. Cao, L. Yu, H. Tian, X. Huang, and Y. Wang, “Fast mutual-information-based contrast enhancement,” in
Proc. SPIE 10420, Ninth Intl. Conf. on Digital Image Process., pp. 104202L(1-5), HongKong (2017).
[28] W. Xue, L. Zhang, X. Mou, and A. C. Bovik, “Gradient magnitude similarity deviation: a highly efficient
perceptual image quality index,” IEEE Trans. Image Process., 23(2), 684-695 (2014).