Contractionary Currency Crashes In Developing Countries
61
Contractionary Currency Crashes In Developing Countries Citation Frankel, Jeffrey. “Contractionary Currency Crashes in Developing Countries.” CID Working Paper Series 2005.117, Harvard University, Cambridge, MA, February 2005. Published Version https://www.hks.harvard.edu/centers/cid/publications Permanent link http://nrs.harvard.edu/urn-3:HUL.InstRepos:42482320 Terms of Use This article was downloaded from Harvard University’s DASH repository, and is made available under the terms and conditions applicable to Other Posted Material, as set forth at http:// nrs.harvard.edu/urn-3:HUL.InstRepos:dash.current.terms-of-use#LAA Share Your Story The Harvard community has made this article openly available. Please share how this access benefits you. Submit a story . Accessibility
Transcript of Contractionary Currency Crashes In Developing Countries
Contractionary Currency Crashes In Developing Countries
CitationFrankel, Jeffrey. “Contractionary Currency Crashes in Developing Countries.” CID Working Paper Series 2005.117, Harvard University, Cambridge, MA, February 2005.
Published Versionhttps://www.hks.harvard.edu/centers/cid/publications
Permanent linkhttp://nrs.harvard.edu/urn-3:HUL.InstRepos:42482320
Terms of UseThis article was downloaded from Harvard University’s DASH repository, and is made available under the terms and conditions applicable to Other Posted Material, as set forth at http://nrs.harvard.edu/urn-3:HUL.InstRepos:dash.current.terms-of-use#LAA
Share Your StoryThe Harvard community has made this article openly available.Please share how this access benefits you. Submit a story .
Accessibility
Contractionary Currency Crashes In Developing Countries
Jeffrey Frankel
CID Working Paper No. 117
February 2005
Copyright 2005 Jeffrey Frankel
and the President and Fellows of Harvard College
at Harvard UniversityCenter for International DevelopmentWorking Papers

revised Jan 28, 2005
Contractionary Currency Crashes
In Developing Countries
The 5th Mundell-Fleming Lecture IMF Annual Research Conference
Jeffrey A. Frankel Harpel Professor, KSG, Harvard University
Abstract
To update a famous old statistic: a political leader in a developing country is twice
as likely to lose office in the 6 months following a currency crash as otherwise. This difference, which is highly significant statistically, holds regardless whether the devaluation takes place in the context of an IMF program. Why are devaluations so costly? Many of the currency crises of the last ten years have been associated with output loss. Is this, as alleged, because of excessive reliance on raising the interest rate as a policy response? More likely it is because of contractionary effects of devaluation. There are various possible contractionary effects of devaluation, but it is appropriate that the balance sheet effect receives the most emphasis. Passthrough from exchange rate changes to import prices in developing countries is not the problem: this coefficient fell in the 1990s, as a look at some narrowly defined products shows. Rather, balance sheets are the problem. How can countries mitigate the fall in output resulting from the balance sheet effect in crises? In the shorter term, adjusting promptly after inflows cease is better than procrastinating by shifting to short-term dollar debt, which raises the costliness of the devaluation when it finally comes. In the longer term, greater openness to trade reduces vulnerability to both sudden stops and currency crashes.
Forthcoming, IMF Staff Papers, 2005. The author would like to thank Maral Shamloo, Yun Jung Kim, and Rodrigo Urcuyo for capable research assistance; the Kuwait Fund and the Ash Institute for Democratic Governance and Innovation, both of Harvard’s Kennedy School, for support;, and participants at the ARC, and especially Robert Flood, for useful suggestions. Some results draw on joint work with Eduardo Cavallo, David Parsley and Shang-Jin Wei.
1
Contractionary Currency Crashes In Developing Countries
The Mundell-Fleming Lecture IMF Annual Research Conference
Jeffrey A. Frankel
It is a great honor to give this fifth annual Mundell-Fleming lecture.
December 2004 is the tenth anniversary of the Mexican peso crisis of 1994. In
retrospect, this crisis ushered in an eight-year series of highly visible devaluations in
emerging markets, most of which proved highly costly to the countries involved. These
currency crashes are the theme of my lecture.
Accordingly, I will begin by invoking, neither Mundell nor Fleming, but another
article from three decades ago: Richard Cooper’s “Currency Devaluation in Developing
Countries.” This was one of the few major papers from that period to deal explicitly
with the macroeconomics of developing countries. The weight of our attention has over
the last decade or two shifted more and more away from rich countries and toward
developing countries, whether judged by the caseload of the staff at the International
Monetary Fund or by working papers turned out by scholars in the field of International
Finance and Macroeconomics. In part this reflects the extent to which lower- and
middle-income countries have become increasingly integrated into world financial
markets. Twenty years ago, for example, one would not have wanted to apply the
Mundell-Fleming model’s insights regarding international capital mobility to developing
countries, because they didn’t have much (capital mobility). Indeed I don’t think the
phrase emerging markets even existed then. But after the liberalizations and capital
inflows of the early 1990s -- and the crises of the late 1990s -- we are applying to
2
developing countries a wide variety of models and tools that were originally created with
rich countries in mind. And we have as well created some new models and tools to try to
capture what is different about developing countries.
1. Political Costs of Devaluation
I wish to take as our starting point a widely cited statistic from Cooper (1971, p.
28) that, in the aftermath of devaluations, nearly 30 per cent of governments fell within
12 months, as opposed to 14 per cent in a contemporaneous control group. This is an
impressive fact, as demonstrated by the frequency with which other authors still cite it 33
years later. I did a citation count: Cooper’s article has received 84 citations, with no
downward trend over time -- not as high as the two seminal papers that constituted the
Mundell-Fleming model and thus gave this lecture its name, but still very healthy for a
paper written so long ago.1 So I expect to garner a lot of citations myself by updating
Cooper’s calculation !
1.1 Updating a statistic on leaders’ loss of office
Cooper took anything over 10% to be a devaluation episode. But the world
changed in the 1970s and 1980s, and depreciations of that magnitude have become
commonplace. For a high inflation country, one would not want to say that a new
currency crisis occurs every month. So I use the following definition:2
• the devaluation must be at least 25% (on a cumulative 12-month basis)
1 Mundell (1963) and Fleming (1962) received 319 and 257 citations respectively over the same period, 1972-2003. This probably understates the contribution of the Mundell-Fleming model: many discussions of the model cite other works, or none at all.
3

• the devaluation must represent an acceleration of at least 10 percentage points,
relative to the rate of depreciation in the 12 months before that.
• it must have been at least three years since the last currency crisis.
By this criterion, looking at a sample of 103 developing countries over the period
1971-2003, we found 188 currency crashes. Of these the identity of the country’s chief
executive changed within 12 months of the devaluation 29% of the time. The standard of
comparison that we use normally is all other 12-month periods: the leader changed
20.2% of the time normally. Thus devaluation increases by an estimated 45% the
probability of the executive losing his or her job. The difference is only statistically
significant at the 12% level.3 However, it may be that countries that tend generally to
instability are over-represented in the crisis group, so that political turnover is more
common in this group even if not resulting from currency crises. If we narrow the
standard of non-devaluation comparison periods to the set of countries that have
experienced a currency crash at some point during the sample period, on the grounds that
these are more comparable to the crisis episodes, we find that the increase in job loss
among devaluers now becomes statistically significant at the 1% level.4
We then narrowed the window to a half-year. Now the chief executive lost
office 22.8 % of the time, as opposed to 11.6 % of the time otherwise. In other words,
the currency crash doubles the probability of a change in the top leadership within the
following 6 months. This time the difference is statistically significant not only at the
2 The same as that in Frankel and Rose (1996). 3 Appendix 1 A. The source for the identity of the President, Prime Minister, Premier, or other Chief Executive, is http://rulers.org.
4

10% or 1% levels, but at the 0.5% level as well, regardless whether the entire set of
countries is used as the standard of comparison.
We also looked at whether the Finance Minister or Central Bank Governor –
whoever held the office of the country’s Governor of the IMF -- lost his or her job. Here,
even using the longer 12-month window (and even with only five years of data: 1995-99),
the effect is statistically significant. In the year following a currency crash, the occupant
of this position changed 58.3 per cent of the time. In other years during this period the
rate of turnover was 35.8%. So by this measure the finance minister or CB governor
was 63% more likely to lose office. The difference is highly significant statistically (at
the .001 level).5
When we segregate countries according to three income levels, we find that the
phenomenon chiefly comes from middle income countries. Within the class of poor
countries, the increase in turnover of the leader is not statistically significant; and among
rich countries there were no cases of a leader losing office within a year of a devaluation.
We also tried segregating countries according to three kinds of political structure:
presidential democracy, parliamentary democracy, and non-democracy. Our
expectation was that we would find that the effect of devaluation on leadership turnover
would be greater among parliamentary democracies than among presidential democracies
because in any given year. The logic was that the latter might not have a scheduled
election, or if they did, it might be an election in which the incumbent was prohibited
from running for re-election by a term limitation. We found, instead that the job loss
4 Appendix 1 B. 5 Appendix 1, Part C.
5

rate was much higher and more significant in the case of devaluations occurring in
presidential democracies.6
We checked whether an equally large loss of reserves results in job loss as often
as a devaluation. Such episodes also tend to be unpleasant (often implying monetary
contraction and recession, e.g., Argentina in 1995, 1999), but apparently they do not
carry the same political costs: There was effect on leaders’ job loss was not significant.
What is it about devaluation that carries such big political costs? How is it that a
strong ruler like Indonesia’s Suharto can easily weather 32 years of political, military,
ethnic, and environmental challenges, only to succumb to a currency crisis?
1.2. Possible sources of political costs of devaluation
Often these currency crises have been accompanied by sharp recessions. Thus an
obvious interpretation, which we will consider further, is that leaders are punished by
their constituents when the performance of the economy is poor. But before proceeding
on the assumption that the loss of ministerial jobs is a reflection of unemployment and
depressed activity throughout the economy, let us consider the possibility that the costs of
a devaluation may be more political than economic. First, there is the possibility that
elections cause currency crashes rather than the other way around. Second, it could be
that IMF programs or other austerity programs are unpopular in general, and that the
devaluations are an incidental aspect of this. Third, it could be that the leaders in
question have made public promises in advance not to devalue, and that they are
punished for breaking these promises regardless of subsequent economic performance.
6 The breakdown by income and democratic structure is given in Parts D, E, and F of
6

What do I mean by the first possibility, that elections cause devaluations rather
than the other way around? It is striking, in how many of the major crises of the 1990s,
even though trouble began during the run-up to a major regularly scheduled national
election, the worst speculative attack and currency crash came soon after the election.
This describes Mexico 1994, Korea 1997, and Brazil 1998-99. In an earlier era, one
would have guessed that election-motivated macroeconomic expansion -- the famous
political business cycle -- explains the need for a subsequent devaluation. But that
explanation does not fit the experience of the 1990s as well (first-generation models of
speculative attacks, if you will7). Macroeconomic expansion in these election campaigns
was limited.8
A better explanation is that devaluation is politically costly to leaders, and so in
an election year they try to postpone it -- whether to get re-elected,9 or so that the crash
comes on their successors’ watch rather than theirs, or out of the hope that something will
turn up to improve the balance of payments. A related hypothesis is that, because a
devaluation uses up scarce political capital, it is more likely to be undertaken by a new
leader with a strong mandate, especially in a visible crisis, and especially if he can blame
it on his predecessor. Edwards (1994, Table 5) reports that devaluations occur
disproportionately often during the first two years after a transfer of government: 77.3%
Appendix 1. 7 Flood and Marion (1999) survey the literature on generations of models of speculative attack. 8 The political business cycle literature observes that politicians are sometimes able to fool voters by aggressive macroeconomic expansion preceding the election, with costs borne later. But Brender and Drazen (2004) argue that is a primarily a phenomenon of countries that have only recently made the transition to democracy. Voters eventually learn.
7
of devaluations among presidential democracies (i.e., those with pre-scheduled elections),
and 70.0 % among parliamentary democracies. This is a topic well worth exploring, but
not here: my calculations about the frequency with which ministers lose their jobs in the
year after a devaluation were careful to start the clock the day after the devaluation, so
that cases where the devaluation comes soon after an electoral change are not included in
the statistics.
The second possibility I mentioned is that devaluations are acting as a proxy for
unpopular IMF austerity programs or other broad reform packages. IMF-associated
austerity programs have often resulted in popular unrest. For example, riots following
food-subsidy cutbacks contributed to the overthrow of President Nimeiri of Sudan in
1985.10
One can test the proposition that devaluations are acting as a proxy for unpopular
IMF austerity programs by conditioning our previous calculation on the adoption of IMF
programs. We created a dummy variable to represent cases where an IMF program was
initiated within 3 months on either side of the devaluation.11 The IMF program variable
does not seem to raise the frequency of leader job loss, relative to devaluations that did
not involve an IMF program. Thus it is not surprising that conditioning on the IMF
9 On governments’ incentive to postpone devaluations until after elections, see Stein and Streb (1998, 1999). 10 Edwards and Santaella (1993) report nine cases of post-devaluation coup attempts, in a study that looks at the role of IMF presence along with various measures of political instability in determining whether devaluations during the period 1950-1971 were economically successful. Lora and Olivera (2004) find that voters punish presidents for pro-market policies and for increases in the rate of inflation, but not for exchange rate policies per se. For an earlier summary of the political consequences of IMF-type austerity programs, see Bienen and Gersovitz (1985). 11 Whether Standby Agreement, or other. See Appendix 2 for list with dates. Part G of Appendix 1 reports the results.
8

dummy variable has no discernible effect on the frequency of leader turnover: 21.05% of
the time for the cases with an IMF program, or 21.92% of the time for the ones without.
In both cases, it is similar to the overall rate of job loss following devaluations (22.8%) in
the complete sample, and is still almost double the 11.6% rate in normal times.
That leaves the third non-economic explanation, that the ministers in question
have made public promises in advance not to devalue, and that they feel it necessary to
resign or are punished for breaking these promises, regardless of subsequent economic
performance. In many cases the commitment to the peg is explicitly reaffirmed by top
policy-makers and political leaders in the months immediately prior to the devaluation.
Perhaps such ill-fated promises are originally made because the minister is duplicitous, or
at least is ignorant of the speculative pressures he or she is up against. More likely they
are too attached to the peg psychologically to let go; many of the currency crashes of the
1990s occurred in countries where governments had a lot invested in the peg, because
exchange-rate-based stabilizations earlier had been the successful and popular means of
ending a 1980s cycle of high inflation, even hyperinflation.
But I think that a still better way to view the public commitments may be as
sincere expressions of a strong desire to maintain the peg. The ministers may realize that
events could force the abandonment of the exchange rate policy, if speculative pressures
accelerate and it develops that reserves are about to run out, leaving little other option.
And they may realize that making an explicit statement beforehand increases the chances
that they will have to resign if and when the peg is abandoned. But making the promise
is a way of buying a bit of credibility, and buying some time. Specifically it is a device
9
for signaling that their determination to hold the line on the currency is so strong that they
are willing to risk sacrificing their jobs.
We selected a sub-sample of 24 cases out of our total set of currency crashes.
We chose roughly equal numbers of cases with subsequent premier changes and those
without.12 We searched local newspapers for the 30 days preceding the devaluation for
statements by government officials that could be construed as commitments not to
devalue. We included assurances even if the language did not read as explicit or
ironclad, because these are so often interpreted as promises.13
The sample size is small. But we found that when some member of the
government (chief executive, finance minister, or central bank governor) had given
assurances that there would be no devaluation, and a devaluation did subsequently occur,
the probability that the chief executive would lose his or her job within 12 months was
2/3. Where no such assurances were reported, the frequency of job loss was only 7/18,
despite the devaluation. In other words, whatever the credibility benefits of the promise
ex ante, it almost doubles the likelihood that the leader loses office ex post. If we use
the 6-month horizon, then the relative effect is even stronger: the leader is more than
twice as likely to be out on the street if the government had made a previous commitment
as if it had remained quiet (.50 vs. .22). If we consider only those cases where the chief
executive himself is the one to have given the assurances, then the job loss rate becomes
100%. But there were only two such cases, out of 24. Usually this dangerous task is
12 The other major criterion was that the country in question be represented by comprehensive microfiche files in Harvard’s Widener Library of past newspapers, and that the languages of those newspapers be either English, Spanish, Korean, or Arabic, the languages spoken by the research assistants working on this project. Appendices 3 and 4 offer details of these cases.
10
delegated to a cabinet member. (Details are reported in Appendix 3 for the 12-month
horizon, and Appendix 4 for the 6-month horizon.)
Despite this suggestive outcome, to the effect that the “broken promise” effect
does indeed matter, it seems unlikely that this is the sole reason for devaluations to result
in turnover at the top. After all, even among those cases where our newspaper search
turned up no record of assurances in the month preceding the devaluation -- either from
the leader, finance minister, or central bank governor – 20% of the leaders lost office
within 6 months of the devaluation anyway, and 33% within 12 months. This is well
above the 11.6% or 20.2% rates, respectively, of job loss in normal times. Evidently the
economic effects of devaluation also play an important role.
2. Does Devaluation Necessarily Mean Loss of Output?
As already noted, the most obvious interpretation of why devaluations are so
often associated with high political costs is that they are accompanied by painful
recessions.14 But why? After all, devaluations are supposed to increase competitiveness,
increase production and exports of tradable goods, reduce imports, and thereby boost the
trade balance, GDP, and employment. Hence the story of the British Chancellor of the
Exchequer “singing in the bath” after the 1992 devaluation of the pound. Apparently
13 In at least one case, Syria, the newspapers appear to have been so lacking in candor regarding the relevant exchange rate that they did not even bring up the subject. 14 Another possibility is that, even if there is no negative effect on GDP in the aggregate, the redistributional effects could be politically costly to the leaders. For example, a devaluation in an African country may benefit small rural coffee and cocoa farmers because the price of their product is determined on world markets, but they tend to have less political power than urban residents, who may be hurt by the devaluation. The problem with this theory is that there are so many examples that go the other way, where the producers of the tradable products (agricultural, mineral, or manufactured) tend to have more political power than the producers of nontraded goods.
11

developing countries are different, or at least emerging market countries are. Figuring
out why may amount to figuring out what is the aspect of these countries that most
requires us to modify the macroeconomic models standardly applied to advanced
economies.
One can argue that simultaneous monetary and fiscal austerity are the true causes
of these declines in economic activity. Or banking failures, or the sudden stop in foreign
lending itself. But this misses what, to me, is a key point. According to the standard
textbook theories, when a country faces a sudden stop in capital flows, there exists some
optimal combination of expenditure-reducing policies (monetary or fiscal contraction)
and expenditure switching policies (devaluation) that should accomplish adjustment to
external balance (the new balance of payments constraint), without necessarily sacrificing
internal balance (i.e., without a recession). Why did all the countries in the East Asia
crisis of 1997-98 suffer a sharp loss in output growth regardless of their mix of
devaluation and expenditure-reduction? The expansionary effect of the devaluation is
supposed to be able to make up for whatever contraction comes from other sources.
Consider a graphical representation with the interest rate and exchange rate (price
of foreign currency) on the axes, as illustrated in Figure 1a. To satisfy external balance,
there is an inverse tradeoff between the two instruments. A devaluation and an increase
in the interest rate are each ways of improving the trade balance -- the latter by reducing
expenditure -- and so the more you have of one the less you need of the other. (If
external balance is defined as equilibrium in the overall balance of payments, including
the capital account along with the trade balance, the relationship is still downward-
12

sloping, since a devaluation and an increase in the interest rate are both ways of making
domestic assets more attractive to global investors.)
To satisfy internal balance, the tradeoff is traditionally considered to be upward-
sloping. An increase in the interest rate reduces the domestic demand for domestic goods,
while a devaluation increases the net foreign demand for domestic goods; if you have
more of one, you also need more of the other, to prevent excess supply or excess demand.
The existence of two independent instruments implies the possibility of attaining
both targets simultaneously, at the intersection of the internal and external balance
schedule. In the aftermath of an adverse shock in the foreign sector, for example, the
right combination of devaluation and monetary contraction will restore balance of
payments equilibrium while maintaining real economic growth.
This is not always the way things actually work.15 By now we have had enough
experience with crises in emerging markets that the traditional framework needs to be
modified. The simple generalization seems to be that most developing countries that are
hit by financial crises go into recession. The reduction in income is the only way of
quickly generating the improvement in the trade balance that is the necessary counterpart
to the increased reluctance of international investors to lend. External balance is a
jealous mistress that can only be satisfied if internal balance is left to go wanting.
Critics of the IMF say that the recessions are the result of Fund policies,
specifically the insistence on austerity in country rescue programs. 16 Some can be
interpreted as arguing that there should have been more expenditure switching, and less
15 Paul Krugman, “Latin America’s Swan Song,” formerly at http://web.mit.edu/krugman/www/swansong.html.
13

expenditure reduction; that the mix of a lower interest rate combined with a devaluation
would successfully maintain internal balance. But many of the devaluations in East Asia
and elsewhere were very large as it was. The critics often make the point that high
interest rates are not in practice as attractive to foreign investors as the Mundell-Fleming
model, for example, would suggest, because they carry increased probability of default.
This is true. But in my view it is not the most important correction in the traditional
framework. Even if interest rates do not have as big a positive effect on the capital
account as our earlier models of high financial integration suggested, so that the graphical
relationship may be flatter, I believe that the sign of the effect is still the same. Even if
higher interest rates have no effect at all on capital inflows, their effect on the balance of
payments still goes the same way, due to the effect on spending. One cannot normally
attract many investors by lowering interest rates. Therefore the external balance line still
slopes downward. Claims that high rates are damaging to the real economy willfully
ignore the lack of an alternative, if the external balance constraint is to be met.
Where the traditional framework needs most to be modified is the relationship
giving internal balance, not that giving external balance. By now the evidence seems
strong that devaluation is contractionary, at least in the first year, and perhaps in the
second as well. We have long been aware of various potential contractionary effects of
devaluation in developing countries. The same 1971 Cooper article that tallied job
losses among ministers also listed six ways in which devaluation could be contractionary.
By 1990, a total of ten such effects had been identified in textbooks.17
16 E.g., Radelet and Sachs (1998); and Furman and Stiglitz (1998). 17 E.g., the 5th through 9th editions of Ronald Caves, Jeffrey Frankel, and Ronald Jones, World Trade and Payments, 2002.
14

Until the currency crashes of the 1990s, a mainstream view had been that any
negative effects from a devaluation were before long offset by the positive effect of
stimulus to net exports, so that by the second year, when the latter had gathered strength,
the overall effect on output had turned positive.18 Now however, one must judge the
negative effects stronger than we thought, and the positive effects weaker. Calvo and
Reinhart (2001), for example, calculate that exports do not increase at all after a
devaluation, but rather are down for the first 8 months. The export side, at least, was
supposed to be unambiguously positive. Apparently production is sometimes derailed by
corporate financial distress, absence of trade credit, and increased costs of imported
inputs, even when the production is for the purpose of export. Imports fall sharply;
indeed crisis-impacted countries have for this reason experienced sharp increases in their
trade balances beginning as soon as two or three months after the crisis. But this is
clearly a response to the unavailability of finance and collapse of income and spending,
not to relative prices. In other words, it is expenditure-reduction, not expenditure
switching.
If devaluation is contractionary, then the internal balance line slopes down, not up
(as illustrated in Figure 1b). Moreover the slope may be disturbingly similar to the slope
of the external balance line. It is hard to see where the two intersect, if they intersect at
all. This means that it is hard to see what combination of policy instruments, if any, can
simultaneously satisfy both internal and external balance, after an adverse shock has
shifted the latter outward. The depressing conclusion is that there is no escape from
recession. All policy instruments work via reduction in income in the short run --
18 Edwards (1986) and Kamin (1988).
15

devaluation, fiscal contraction, and monetary contraction. Even structural policy reform,
such as insisting that bad banks go under, may have a negative effect on economic
activity in the short run.
Is the targets-and-instruments framework then no longer useful? I think that the
framework is still relevant during the period after a terms-of-trade shock or reversal in
capital flows (as reflected in a peaking of reserves), but before the speculative attack hits
(as reflected in a very sharp devaluation, loss in reserves, or increase in interest rates). It
can be hard to identify such an interval, especially at the time. But I have in mind the
interval of a year or so preceding December 2001 in Argentina, July 1997 in East Asia,
December 1994 in Mexico. I call this the period of procrastination, for reasons that will
become clear below.
3. Why is Devaluation Often Contractionary?
Of the many possible contractionary effects of devaluation that have been
theorized, which are in fact responsible for the recessionary currency crashes of the 1990s?
Several of the most important contractionary effects of an increase in the exchange are
hypothesized to work through a corresponding increase in the domestic price of imports,
or of some larger set of goods. Indeed, rapid passthrough of exchange rate changes to
the prices of traded goods is the defining assumption of the “small open economy
model,” which has always been thought to apply fairly well to emerging market countries.
The contractionary effect would then follow, in any of several ways: the higher prices of
16

traded goods would, for example, reduce real money balances or real wages of workers19,
or increase costs to producers in the non-traded goods sector.20
These mechanisms were not much in evidence in the currency crashes of the
1990s. The reason is that the devaluations were not passed through to prices for higher
imports, for domestic competing goods, or to the CPI in the way that the small open
economy model had led us to believe. The failure of high inflation to materialize in
East Asia after the 1997-98 devaluations, or even in Argentina after the 2001 devaluation,
was good news -- a surprise that perhaps to some extent compensated for the
unexpectedly sharp recessions. But it calls for some investigation.
3.1 The decline in exchange rate passthrough in developing countries
Conventional wisdom has long been that passthrough is slower or less complete in
large industrialized countries than in small developing countries. A number of authors
have pointed out a further decline during the 1990s in the passthrough coefficient among
industrialized countries. But most of the many econometric studies of passthrough, even
those that examine a recent decline in the passthrough coefficient, have focused on prices
of imports into industrialized countries, rather than into developing countries. Taylor
(2001) proposed that a decline in passthrough of exchange rate changes into the CPI in
the 1990s was due to a lower inflationary environment, and looked at US data. Gagnon
and Ihrig (2004) extended this claim to a sample of 11 industrialized countries. Otani,
19 Diaz-Alejandro (1963) pointed to a transfer of income from (low-saving) urban workers who consume traded goods, to (high-saving) rich owners of agricultural land 20 Increased costs to producers of non-traded goods could come from either higher costs of imported inputs like oil, or higher labor costs if wages are indexed to the cost of living (e.g., Corbo, 1985, in the context of Chile in 1981).
17

Shiratsuka, and Shirota (2003) found a similar decline in passthrough for imports into
Japan. Campa and Goldberg (2001) again found a decline in the coefficient in the 1990s,
but attributed it to changing commodity composition more than to a less inflationary
environment.21 Their data set again consists solely of industrialized countries.
Only a few studies include lower-income countries. Choudhri and Hakura (2001)
extend to a sample of 71, including developing countries, the finding that a low-inflation
environment reduced passthrough to the CPI in the 1990s. Borensztein and De Gregorio
(1999) and Goldfajn and Werlang (2000), study the low passthrough of recent large
devaluations in developing countries.22 But these are all studies of influences on
aggregate price measures, the CPI in particular, not on import prices. Few studies
concentrate on imports of specific goods into developing countries. The difference is
important because effects on price indices vs. prices of specific imports are really two
distinct conceptions of the word “passthrough.” It is even more important because, as in
the rich country context, some authors have claimed that what appears to be slow or
incomplete passthrough in developing countries can really be attributed to changes in
composition with regard to product varieties. 23
Table 1, taken from Frankel, Parsley and Wei (2004), reports estimates for
passthrough to prices of narrowly defined retail imports into 76 countries. Notice, first,
21 It has been pointed out at least since Knetter (1993) that differences in passthrough coefficients could be attributable to differences in the composition of the price index, rather than to differences in passthrough that would show up for narrowly-defined commodities. 22 References to some further studies are given in Frankel, Parsley and Wei (2004). 23 Burstein, Eichenbaum and Rebelo (2002) attribute the low observed passthrough in general price indices to the disappearance from consumption of newly expensive import goods, and their replacement in the indices by inferior local substitutes. No doubt this is indeed a relevant effect.
18
confirmation of the conventional wisdom that passthrough has historically been higher in
developing countries than in rich countries. As of the beginning of our sample period,
1990, the coefficient was .3 for rich countries and .8 for developing countries, with the
difference highly significant statistically. (Figure 3 illustrates the numbers on average
during our sample period.) That these numbers fall below 1.0 cannot be attributed to
compositional effects, as the 8 goods are defined very narrowly: a roll of color film, a
carton of Marlboro cigarettes, an issue of Time magazine, a bottle of Cointreau, etc.
Theories of slow or incomplete passthrough can be divided according to what sort
of arbitrage barrier they posit as blocking the enforcement of the law of one price:
barriers to international trade such as tariffs and transportation costs, or local costs of
distribution and retail. The results in Frankel, Parsley and Wei (2004) furnish support
for both sorts of theories. Bilateral distance is a statistically significant determinant of
the ECM term; that is, higher transport costs lead to slower passthrough to import prices.
At the same time, a higher wage – the largest component of local distribution and retail
costs – also shows up as a significant negative determinant of the passthrough
coefficient.24 Both determinants apply to rich and poor countries alike. Size does not
appear as a determinant in most of our results: small countries do not experience more
24 Table 1 applies only to prices of retail imports. But results for prices at other stages, reported in Frankel, Parsley and Wei (2004), supply further evidence that both kinds of arbitrage barriers are operative. On the one hand, passthrough is incomplete even for the prices of these imported commodities at dockside, which suggests that local distribution costs cannot be the only barrier to arbitrage – transport costs, tariffs, and other trade barriers must matter as well. In support of this conclusion, distance has an important effect, either reducing or slowing passthrough, at all four stages -- dockside imports, retail, competitors’ prices, and the CPI. On the other hand, passthrough behavior for retail imports is more like behavior for local substitutes than it is like imports at the dock, which suggests that tariffs and transportation costs cannot be the only barrier to arbitrage
19

passthrough than large, a very surprising finding in light of “pricing to market” theories
(i.e., price discrimination by sellers).
For present purposes, the important point is that the passthrough coefficient fell
significantly in the course of the 1990s, and that the speed of decline was twice as fast
among developing countries as among rich (.051 per year as compared to .025).25 The
speed of passthrough, which is estimated in the form of an ECM term, also shows a
significant downward trend for developing countries (not for rich).
One might wonder if this estimated decline in the passthrough coefficient during
the 1990s is an indirect reflection of an asymmetry whereby passthrough of depreciation
is greater than passthrough of appreciation, or a threshold effect whereby large
devaluations result in proportionately less passthrough. We have found in extensions
that the answer is “no;” the trend remains even after controlling for the big
devaluations.26
One would expect passthrough to prices of domestically produced goods or the
general CPI to be (even) lower than to prices of imports. Our paper also reports results
– local distribution matters too. In support of this conclusion, higher wages have a strong negative effect on passthrough to the local competitors’ prices and the CPI. 25 Taken literally, the estimated trend is strong enough to bring the passthrough coefficient to zero by 2006. This conclusion may to some extent be an artifact of the assumption of a linear trend that should not be extrapolated. But when we try a different functional form that allows the effect of time to asymptote to zero (the reciprocal of time), we get a similar result: the passthrough coefficient falls most of the way to zero during the sample period. 26 The threshold effect, while significant, goes the wrong way: changes in the exchange rate above 25% are found to have proportionately larger passthrough effects, not smaller. We did find strong evidence of asymmetry. In fact we cannot reject the hypothesis that appreciation is not passed through at all, suggesting downward price rigidity. This is an
20

for other local price measures, and this is indeed the pattern they show. (See Figure 2).
Tariffs and distance both contribute significantly to low passthrough to the CPI. But
passthrough to prices of local substitutes and to the CPI both show the same downward
trends over the sample period as passthrough to import prices. The difference in
coefficient trends between poor and rich countries is even greater for passthrough to the
CPI than it is for import prices. This is important, in the present context, because most
of the potential contractionary effects of devaluation require that passthrough extend
beyond just import prices, to include also passthrough to locally produced goods or the
CPI.
What can we say about the reasons for the decline in passthrough? As noted, one
hypothesis proposed by others is declining long-run inflation rates. This factor turns out
to be particularly relevant in the case of explaining the downward trend in passthrough to
developing country CPIs.
Another possible explanation for the trend is rising labor costs in retail and
distribution. We find that wages are a significant determinant of passthrough. The
wage hypothesis turns out to be particularly relevant in the case of explaining the
downward trends in passthrough either to the prices of local substitutes or to the CPI
(reported in Frankel, Parsley and Wei, 2004). Controlling for wages reverses an
estimated tendency for passthrough to the CPI to decline as country income per capita
grows. A possible interpretation is that the role of distribution and retail costs in pricing
to market becomes increasingly important as countries achieve higher incomes, due to the
Balassa-Samuelson-Baumol effect.
interesting finding. But the significant downward trend in the passthrough coefficient
21
In any case, most of the decline in passthrough remains unexplained, despite the
many contributing factors we estimated.27 The strongest conclusion is simply that
incomplete passthrough is another respect in which developing countries have become a
bit more like rich countries, for whatever reason.
3.2 The balance sheet effect
If the contractionary effects that rely on passthrough to higher goods prices are
not the explanation for the recessions that followed many of the 1990s devaluations, then
what is? On the list of contractionary channels, the balance sheet effect is the one that
has dominated in terms of attention from researchers, and I think appropriately so.
Domestic banks and firms had large debts denominated in foreign currencies, particularly
in dollars, which they might have been able to service at the previous exchange rate, but
which they had trouble servicing after the price of foreign exchange had gone up sharply.
The results were lay-offs and bankruptcies.28
remains. 27 Another variable we looked at is long-run exchange rate variability. Here the influence could go either way. On the one hand, if exchange rate variability is another sign of monetary instability, like the inflation rate, it might be thought to contribute to faster passthrough; there is some support for this effect in the case of import prices in developing countries. On the other hand Froot and Kemperer (1989), Krugman (1989) and Taylor (2000) have suggested that when exchange rate fluctuations are largely transitory, passthrough is lower, an effect that is supported in the case of passthrough to the CPI in developing countries. Indeed, an increase in exchange rate variability in the late 1990s can apparently explain fully the significant downward trend in the speed of adjustment of the CPI. 28 The analytical literature on balance sheet effects and output contraction includes, but is not limited to: Aghion, Banerjee and Bacchetta (2000), Cespedes, Chang and Velasco (2003, 2004), Chang and Velasco (1999), Caballero and Krishnamurty (2002), Christiano, Gust and Roldos (2002), Dornbusch (2001), Jeanne and Zettelmeyer (2005), Kiyotaki and Moore (1997), Krugman (1999), Mendoza (2002), and Schneider and Aaron Tornell (2001).
22

There is plenty of evidence of the output cost associated with the balance sheet
effect. Looking at the experience of the 1990s, Cavallo, Kisselev, Perri and Roubini
(2002) show that countries entering a crisis with high levels of foreign debt tend to
experience large real exchange rate overshooting (devaluation in addition to the long run
equilibrium level) and large output contractions. Similarly, Guidotti, Sturzenneger and
Villar (2003) find evidence that liability dollarization worsens output recovery after a
sudden stop in capital inflows. Céspedes (2004) finds that the interaction of real devaluation
and external debt has a significant negative effect on output.
It is easier to point out the problem of “mismatch” -- between the currency of
denomination of a country’s debts and the currency that its firms earn -- than it is to
identify a remedy or even a cause. It is not enough to instruct firms to avoid dollar debts
or to hedge them, because international investors are not very interested in lending to
these countries in their own currencies. The result of following a rule to avoid
borrowing in foreign currency would thus be to borrow less in total (which admittedly
might not be such a bad outcome). Eichengreen and Hausmann (1999) have made the
inability to borrow in local currencies famous under the name “original sin.” The phrase
is meant to imply that the problem is not the fault of the countries themselves, or at least
not the fault of recent governments. But we need not accept that it is completely pre-
determined.29
29 One school of thought is that the choice of an adjustable peg regime, or other intermediate exchange rate regime, leads to dangerously high unhedged foreign-currency borrowing. It is argued that a floating regime would force borrowers to confront the existence of exchange rate risk, and thereby reduce unhedged foreign-currency borrowing (e.g., Eichengreen, 1999, p. 105). This sounds like an argument that governments should introduce gratuitous volatility, because private financial agents underestimate risk. But the models of Chamon and Hausmann (2005), Chang and Velasco (2004), Jeanne (2005), and Pathak and Tirole (2004) do it with only fundamentals-generated uncertainty
23

4. How Might Debtors Mitigate Contractionary Currency Crashes?
One need not dismiss the charge that international financial markets discriminate
against developing countries in a number of ways in order to discuss respects in which
debtors have some responsibility for their own fate. Let us consider two. One respect is
short-run, and one is long-run.
4.1 Shifts on balance sheet during the “procrastination phase”
The short-run question over which countries have some control arises during the
interval that I have called the period of procrastination. When foreign investors lose
their previous enthusiasm for financing a country’s current account deficit, the national
policy makers must decide whether to adjust, or to wait. Typically they wait. Countries
that had previously managed to keep dollar-denominated debt relatively low, tend to
switch the composition of their debt in that direction during the year or so preceding the
ultimate currency crash, in order to entice skeptical foreign investors to stay in.
A prime example is Mexico during the course of 1994. International enthusiasm
for investing in Mexico began to decline after the beginning of the year. The authorities
clung to the exchange rate target and delayed adjustment, in the hopes circumstances
would turn around. Most obviously, during much of the year they ran down reserves, as
shown in Figure 4. But an important second mechanism of delay was to placate nervous
investors by offering them tesobonos (short-term dollar linked bonds) in place of the peso
and rational expectations. Hausmann and Panizza (2003) find empirical support only for an effect of country size on original sin, not for an effect of income level or exchange rate
24

bonds (Cetes) that they had previously held. Figure 5 shows the dramatic increase in
dollar-linked debt during the year leading up to the peso crisis of December 1994. It
seems likely that the magnitude of the Mexican recession in 1995 stemmed, not just from
the adverse balance sheet effects that have been so frequently noted, but particularly from
the adverse shift in balance sheets that took place during the course of 1994. A third
mechanism of delay was a shift toward shorter maturities, illustrated in Figure 6.30 And
the fourth has already been noted, an explicit commitment to defend the peg.
These mechanisms are part of a strategy that is sometimes called “gambling for
resurrection.” What they have in common, beyond achieving the desired delay, is
helping to make the crisis worse when it does come, if it comes.31 It is harder to restore
confidence after a devaluation if reserves are near zero and the ministers have lost
personal credibility. Further, if the composition of the debt has shifted toward the short
term, in maturity, and toward the dollar, in denomination, then restoring external balance
is likely to wreak havoc with private balance sheets regardless the combination of
increases in interest rate versus increases in exchange rate.
The lesson? Adjust sooner rather than later (which is admittedly easier said than
done).
regime. Goldstein and Turner (2004) point out things countries can do to reduce currency mismatch. 30 E.g., Broner, Lorenzoni, and Schmukler (2004). 31 This helps explain why the ratio of short-term foreign debt to reserves appears most so often and so robustly in the literature on early warning indicators for currency crashes. Examples include Berg, Borensztein, Milesi-Ferreti, and Pattillo (1999), Frankel and Rose (1996), Frankel and Wei (2004, Table 2), Goldstein, Kaminsky and Reinhart (2000), Mulder, Perrelli and Rocha (2002), Rodrik and Velasco (2000), and many other references given in those papers.
25

4.2 Openness to trade reduces vulnerability to currency crises
One final question concerns an aspect of the structure of the economy that can be
influenced by policy but only in the long-run: the degree of integration with respect to
international trade. Broadly speaking, there are two opposing views on the relationship
between a country’s openness and whether it is prone to sudden stops or currency crashes.
The first view is that openness makes a country more vulnerable to sudden stops. A
country highly integrated into world markets is more exposed to shocks coming from
abroad. The second view is that countries that are open to international trade are less
vulnerable to sudden stops. If the ratio of trade to GDP is structurally high, it is easier to
adjust to a cut-off in international financing of a given magnitude. I will describe a new
test of the relationship between trade openness and vulnerability to sudden stops to help
choose between the two hypotheses. Such tests have been done before, but usually
without taking into account the possible endogeneity of trade. The incremental
contribution here is to use the gravity instrument for trade openness -- which aggregates
geographically-determined bilateral trade across a country’s partners -- to correct for the
possible endogeneity of trade.
The view that trade openness makes countries more vulnerable to crises comes in
a number of forms. One variant is that a weakening in a country’s export markets is
sometimes the trigger for a sudden stop in capital flows, so that a high-trade country is
more vulnerable. Another variant notes that sudden stops in finance often extend to a loss
in trade credit -- especially for imports, but sometimes also even for exports -- and that
the resulting shrinkage in trade is more painful if trade was a larger share of the economy
to begin with. A third variant says that financial openness raises vulnerability to sudden
26

stops, and openness to trade in practice goes hand in hand with openness to financial
flows.32 In the limiting case, a country that is in autarky with respect to trade must have a
net capital account of zero due to the balance of payments adding up constraint.
Regardless the specific reasoning, the notion that globalization leads to crises is a
generalization that appeals to many.
The view that openness to trade makes countries less vulnerable also comes with
a number of different specific mechanisms that have been proposed. Eaton and
Gersovitz (1981) and Rose (2002) argue that the threatened penalty of lost trade is
precisely the answer to the riddle “why do countries so seldom default on their
international debts?” Strong trade links are statistically correlated with low default
probabilities. International investors will be less likely to pull out of a country with a high
trade/GDP ratio, because they know the country is less likely to default. A higher ratio of
trade is a form of “giving hostages” that makes a cut off of lending less likely.
Another variant of the argument that openness reduces vulnerability takes as the
relevant penalty in a crisis the domestic cost of adjustment, i.e., the difficulty of
eliminating a newly-unfinanceable trade deficit. The argument goes back at least to Sachs
(1985, p.548). He suggested that Asian countries had been less vulnerable to dislocations
than Latin American countries in the international debt crisis of the 1980s -- despite
similar debt/GDP ratios -- because they had higher export/GDP ratios. The relatively
worse performance observed in Latin America was due to the lower availability of export
revenue to service debt. More recently, Guidotti et. al. (2004) make a similar point by
32 For example because much trade needs multinational corporations, who in turn need to be able to move money across national borders; or because it is harder to enforce capital controls if trade is free. Aizenman (2003), and Aizenman and Noy (2004).
27

providing evidence that economies that trade more recover fairly quickly from the output
contraction that usually comes with the sudden stop, while countries that are more closed
suffer sharper output contraction and a slower recovery.
Consider first a country that faces a given cut-off in financing, and must adjust
without nominal or real exchange rate flexibility. The adjustment must then come
through a reduction in spending. To achieve a $1 billion improvement in the trade
balance, the contraction has to be $ (1/m) billion, where m is defined as the marginal
propensity to import (in a Keynesian model) or the share of spending that falls on
tradable goods (in a tradable/nontradable model). The lower is m, the more painful the
adjustment. Whether output itself falls depends, of course, primarily on whether wages
and prices are flexible. But even in a full-employment world, sharp reductions in
consumption are not enjoyable.
Consider, second, a country that does have the option of nominal and real
exchange rate flexibility. In traditional textbook models, if the adjustment is achieved in
part through nominal and real depreciation, rather than exclusively through expenditure-
reduction, the country can accommodate the tougher new financing constraint without
necessarily suffering a recession. This is true even if a relatively large devaluation is
required to generate the necessary improvement in the trade balance. But since the
emerging market crises of 1994-1998, as we have already noted, economists have
increasingly emphasized the contractionary balance sheet effect: if the country’s debts are
denominated in foreign currency, the balance sheets of the indebted banks and
corporations are hit in proportion to the devaluation. If the economy is starting from a
high ratio of trade to GDP the necessary devaluation need not be large, and therefore the
28

adverse balance sheet effect need not be large. But if the economy is not very open to
trade to begin with, the necessary devaluation, and the resulting balance sheet impact and
recession, will all be large. Again we arrive at the result that whether the necessary
adjustment will be large and painful depends inversely on openness.
The balance sheet version of the openness story is modeled formally by Calvo,
Izquierdo, and Talvi (2003) and Cavallo (2004). Both have in mind the example of
Argentina, which has traditionally had a low ratio of trade to GDP, and has suffered some
of the worst sudden stops.33 But the hypothesis that openness to trade reduces a country’s
vulnerability to sudden stops transcends any one formal model, causal link, or country
example. The same is true of the opposing hypothesis, that openness raises a country’s
vulnerability. It would be useful to be able to choose empirically between the two
competing hypotheses.
I will report new results -- from Cavallo and Frankel (2004) -- for two questions.
(1) What is the effect of openness on vulnerability to “sudden stops” implemented by a
probit model measuring the probability of a sudden reduction in the magnitude of net
capital inflows, following closely the definition of Calvo, Izquierdo and Mejia (2003). (2)
What is the effect of openness on vulnerability to “currency crises,” implemented by a
probit model representing the probability of a sudden increase in exchange market
pressure, which is in turn defined as the percentage depreciation plus percentage loss in
foreign exchange reserves. In addition to analyzing the probit model of this exchange
33 Others who have argued that Argentina’s low trade/GDP ratio helps explain why it was such a victim of the global sudden stop after 1999 include Calvo, Izquierdo, and Mejia (2003), Calvo and Talvi (2004), Desai and Mitra (2004) and Treasury Secretary Paul O’Neill, who once reportedly said it was unsurprising the Argentines had lost the confidence of investors because they don’t export anything.
29

market pressure definition of a currency crisis, as in Frankel and Wei (2004) we also
looked at the output loss subsequent to a crisis.
There is no reason, a priori, why something (openness) that makes the
consequences of sudden stops better (less contractionary devaluations) should also
necessarily make them less frequent. Or that something that makes the consequences
worse should also make them more frequent. Indeed some theories are based on the
notion that the worse the consequences, the less often it will happen. But in our results
the effects turn out to go the same way, regardless which concept of performance is used.
Calvo, Izquierdo and Mejia (2003) and Edwards (2004a, b) are among the
empirical papers that find that openness to trade is associated with fewer sudden stops.
On the other hand, Milesi-Ferretti and Razin (1998, 2000) find that openness helps
trigger crises and/or sharp reversals of the current account. Most of these papers use the
trade/GDP ratio as the measure for openness to trade.
A critic might argue that the trade/GDP ratio is endogenous. One way in which
trade openness could be endogenous is via income: countries tend to liberalize trade
barriers as they grow richer -- in part because their mode of public finance gradually
shifts from tariff revenue to income or VAT taxes. A second way is that trade
liberalization could be part of a more general reform strategy driven by pro-globalization
philosophy or “Washington Consensus” forces. Other aspects of such a reform program,
such as privatization, financial liberalization, or macroeconomic stabilization might affect
the probability of crises, and yet an OLS regression analysis might inappropriately
attribute the effect to trade. A third way that trade openness could be endogenous is that
experience with crises -- the dependent variable -- may itself cause liberalization, via an
30

IMF program. Or it might have the opposite effect, if a country’s response to a crash is
disenchantment with globalization and the Washington Consensus. A fourth way in
which trade openness could be endogenous is through the feedbacks between trade and
financial openness.
How can the endogeneity of trade be addressed? We use gravity estimates to
construct an instrumental variable for trade openness, the methodology developed by
Frankel and Romer (1999), in the context of the effect of trade on growth, and updated in
the Frankel and Rose (2002) dataset.
The results reported in Table 2 show that openness reduces vulnerability to
sudden stops rather than increasing it.34 Not only does this relationship hold up when we
move from OLS to instrumental variables, but it appears stronger. The degree of trade
openness is a powerful predictor of these capital account shocks: moving from
Argentina’s current trade share (approximately .20 of GDP) to Australia’s average trade
share (approximately .30 of GDP), reduces the probability of a sudden stop by 32%. The
results for openness are the same when we seek to explain currency crashes. Trade
protectionism does not “shield” countries from the volatility of world markets as
proponents might hope. On the contrary, less trade openness leads to greater vulnerability
to sudden stops and currency crashes. In fact out of the set of controls we tried, openness
is the only variable that is virtually always statistically significant.35
34 A more complete set of results is reported in Cavallo and Frankel (2004). 35 The current account deficit as a share of GDP is always highly significant in the probit regressions to determine sudden stops, and liability dollarization is sometimes; but not in the currency crash equation. The reserve/import ratio is always highly significant in the currency crash regression, and sometimes foreign debt/GDP and nominal exchange rate rigidity, but not so in the first equation.
31
4.3 Conclusion
Thus there are at last two ways of seeking to minimize vulnerability to sudden
stops, devaluations, and associated economic contractions: keeping balance sheets strong
by avoiding a shift to short-term dollar debt as a means of procrastination, and keeping
the economy open to trade. We began this lecture by noting the frequency with which
political leaders and ministers lose office after a devaluation. But seeking to hold on to
political viability is presumably the precise reason why governments often procrastinate,
why they feel they have to postpone adjustment to balance of payments deficits, and
instead run down reserves, shorten the maturity of the debt, and borrow in dollars. So
the openness strategy may be the most robust option, politically as well as economically.
32

Figure 1a
33 33

Figure 1b
34 34
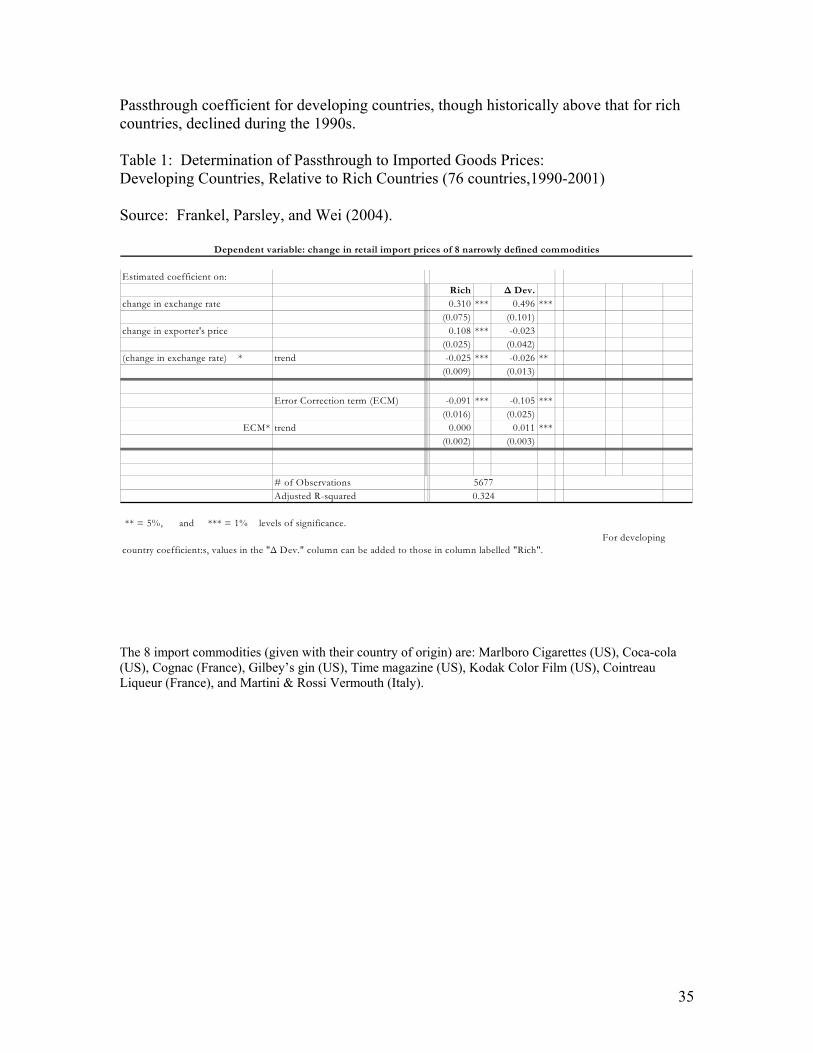
Passthrough coefficient for developing countries, though historically above that for rich countries, declined during the 1990s. Table 1: Determination of Passthrough to Imported Goods Prices: Developing Countries, Relative to Rich Countries (76 countries,1990-2001) Source: Frankel, Parsley, and Wei (2004).
Estimated coefficient on:Rich ∆ Dev.
change in exchange rate 0.310 *** 0.496 ***(0.075) (0.101)
change in exporter's price 0.108 *** -0.023 (0.025) (0.042)
(change in exchange rate) * trend -0.025 *** -0.026 **(0.009) (0.013)
Error Correction term (ECM) -0.091 *** -0.105 ***(0.016) (0.025)
ECM* trend 0.000 0.011 ***(0.002) (0.003)
# of ObservationsAdjusted R-squared
** = 5%, and *** = 1% levels of significance.
5677
Dependent variable: change in retail import prices of 8 narrowly defined commodities
0.324
For developing country coefficient:s, values in the "∆ Dev." column can be added to those in column labelled "Rich".
The 8 import commodities (given with their country of origin) are: Marlboro Cigarettes (US), Coca-cola (US), Cognac (France), Gilbey’s gin (US), Time magazine (US), Kodak Color Film (US), Cointreau Liqueur (France), and Martini & Rossi Vermouth (Italy).
35

Figure 2: Passthrough is greatest for prices of imports at dock, but less for retail and CPI
Source: Frankel, Parsley & Wei (2004) – effect within one year
Exchange Rate Passthrough to Domestic Prices
0.2
0.4
0.6
at the dock imported goodprices
localcompetitor
prices
consumer priceindex
pass
thro
ugh
coef
ficie
nt
36

Figure 3 Passthrough for less developed countries > for rich, historically.
Source: Frankel, Parsley & Wei (2004) – effect within one year
Passthrough and Income (Average 1990-2001)
(Country Grouping Based on World Bank Classification)
12 countries36 countries
28 countries
00.10.20.30.40.50.60.7
Low Income Middle Income High Income
pass
thro
ugh
coef
ficie
nt
37

Figure 4: Evolution of Mexico’s Reserves, from Sudden Stop to 1994 Currency Crash
0.00
5000.00
10000.00
15000.00
20000.00
25000.00
30000.00
35000.00
1992
M12
1993
M1
1993
M2
1993
M3
1993
M4
1993
M5
1993
M6
1993
M7
1993
M8
1993
M9
1993
M10
1993
M11
1993
M12
1994
M1
1994
M2
1994
M3
1994
M4
1994
M5
1994
M6
1994
M7
1994
M8
1994
M9
1994
M10
1994
M11
1994
M12
1995
M1
1995
M2
1995
M3
1995
M4
Level 3m Moving Avg
CR
ISIS
IMF
PRO
GR
AM
38

Figure 5: Evolution of Mexican Debt According to Currency Denomination: 1992-95
0%
10%
20%
30%
40%
50%
60%
70%
80%
Jan-
92
Mar
-92
May
-92
Jul-9
2
Sep
-92
Nov
-92
Jan-
93
Mar
-93
May
-93
Jul-9
3
Sep
-93
Nov
-93
Jan-
94
Mar
-94
May
-94
Jul-9
4
Sep
-94
Nov
-94
Jan-
95
Mar
-95
May
-95
Jul-9
5
Sep
-95
Nov
-95
tesobonos/(tesobonos+cetes) tesobonos/total domestic debt
Data source: Mexican Ministry of Finance and Public Credit. Figure 6. Evolution of Mexican Debt According to Maturity: 1992-95
90%
92%
94%
96%
98%
100%
Jan-
92
Mar
-92
May
-92
Jul-9
2
Sep-
92
Nov
-92
Jan-
93
Mar
-93
May
-93
Jul-9
3
Sep-
93
Nov
-93
Jan-
94
Mar
-94
May
-94
Jul-9
4
Sep-
94
Nov
-94
Jan-
95
Mar
-95
May
-95
Jul-9
5
Sep-
95
Nov
-95
0
100
200
300
400
500
% long term/(long term+short term) - left axis average maturity in days - right axis
Data source: Mexican Ministry of Finance and Public Credit.
39

Table 2: Effect of openness (trade/GDP) on vulnerability to sudden stops and currency crashes Source: Cavallo and Frankel (2004)
To predict sudden stops (Calvo et al definition)
To predict currency crashes (Frankel & Wei, 2004 definition)
Ordinary probit IV Ordinary probit IV
Trade openness t
-0.53 (0.259)**
-2.45 (0.813)**
-0.57 (0.269)**
-1.73 (0.918)*
Foreign Debt/GDP t-1 -0.080 (0.217)
0.196 (0.275)
0.23 (0.231)
0.59 (0.373)
Liability Dollarizationt-1
0.316 (0.195)
0.591 (0.256)**
0.027 (0.249)
0.18 (0.234)
Exchange rate rigidity 0.13 (0.094)
0.22 (0.113)*
CA/GDP t-1 -4.068
(1.297)** -7.386
(2.06)*** -0.272 (1.392)
0.66 (1.455)
ln Reserves in Months of Imports t-1
-0.26 (0.082)***
-0.37 (0.099)***
Constant -2.544 (0.63)***
-1.73 (0.723)**
-0.99 (0.749)
0.304 (0.786)
Obs. 778 1062 557 841
Robust standard errors reported in parenthesis. *** Statistically Significant at 1% ** Statistically Significant at 5% * Statistically Significant at 10% Estimation performed with regional dummies and year fixed effects. IV is the gravity-based instrumental variable for trade openness from Frankel-Romer (1999) and Frankel-Rose (2002).
40

References
Aghion, P., P. Bacchetta, and A. Banerjee, 2000, “A Simple Model of Monetary Policy and Currency Crises”, European Economic Review, 44 (4-6): 728-738. Aizenman, Joshua, 2003, “On the Hidden Links Between Financial and Trade Opening”, NBER Working Paper No. w9906. Aizenman, Joshua, and I. Noy, 2004, “On the Two Way Feedback between Financial and Trade Openness”, NBER Working Paper No. 10496. Alesina, Alberto and Wagner, 2003, “Choosing (and reneging on) exchange rate regimes,” NBER working Paper 9809, June. Berg, Andrew, Eduardo Borensztein, Gian Maria Milesi-Ferreti, and Catherine Pattillo. 1999. “Anticipating Balance of Payments Crises: The Role of Early Warning Systems.” Occasional Paper 186. International Monetary Fund, Washington, D.C. Bienen, Henry, and Mark Gersovitz, 1985, “Economic Stabilization, Conditionality, and Political Stability,” International Organization, 39, no. 4, Autumn. Borensztein, Eduardo, and Jose De Gregorio, 1999, “Devaluation and Inflation after Currency Crises,” International Monetary Fund. Brender, Adi, and Alan Drazen, 2004, “Political Budget Cycles in New Versus Established Democracies,” NBER WP No. 10539, June 2004. Broner, Fernando, Guido Lorenzoni, Sergio Schmukler, 2004, “Why Do Emerging Economies Borrow Short Term?” Fifth Annual Research Conference, International Monetary Fund, November. Caballero, R., and A. Krishnamurthy, 2003, “Excessive Dollar Debt: Financial Development and Underinsurance”, Journal of Finance, Vol. LVIII, No. 2: 867-893 Calvo, Guillermo, Alejandro Izquierdo, and Ernesto Talvi, 2003, “Sudden Stops, The Real Exchange Rate, and Fiscal Sustainability: Argentina’s Lessons.” NBER Working Paper 9828. National Bureau of Economic Research, Cambridge, Mass. Calvo Guillermo A., Alejandro Izquierdo and Luis Fernando Mejia, 2003, “On the Empirics of Sudden Stops”. Inter-American Development Bank Working Paper. Calvo, Guillermo, and Ernesto Talvi, 2004, “Sudden Stop, Financial Factors and Economic Collapse: A View from the Latin American Frontlines,” in From the Washington Consensus Towards a New Global Governance, Barcelona, Sept. 24-26. Calvo, Guillermo A., 1998, “Capital Flows and Capital-Market Crises: The Simple Economics of Sudden Stops”, Journal of Applied Economics (CEMA), 1(1):35-54.
41

Calvo, Guillermo, and Carmen Reinhart, 2001, “When Capital Inflows Come to a Sudden Stop: Consequences and Policy Options,” in Key Issues in Reform of the International Monetary System, International Monetary Fund, edited by Peter Kenen and Alexander Swoboda. Campa, Jose, and Linda Goldberg, 2002, “Exchange Rate Pass-Through into Import Prices, A Macro or Micro Phenomenon?” NBER WP no. 8934. Cavallo, Eduardo A., 2004, “Trade, Gravity and Sudden Stops: On How Commercial Trade can increase the stability of capital flows”, mimeograph, Harvard University. Cavallo, Eduardo, and Jeffrey Frankel, 2004, “Does Openness to Trade Make Countries More Vulnerable to Sudden Stops, or Less? Using Gravity to Establish Causality,” KSG Working Paper Number RWP04-038, Harvard University. NBER Working Paper No. 10957, December. Cavallo, Michelle, Kate Kisselev, Fabrizio Perri and Nouriel Roubini, 2002, “Exchange Rate Overshooting and the Costs of Floating”, mimeograph, New York University. Céspedes, Luis Felipe, 2004, “Financial Frictions and Real Devaluations,” Central Bank of Chile, October. Céspedes, L.F., R. Chang and A. Velasco, 2003, “IS-LM-BP in the Pampas”, IMF Staff Papers, Vol. 50, (special issue): 143-156. Céspedes, L.F., R. Chang and A. Velasco, "Balance Sheets and Exchange Rate Policy" The American Economic Review, Vol. 94, No. 4, September 2004, 1183-1193. Chamon, Marcos, and Ricardo Hausmann, 2005, “Why Do Countries Borrow the Way they Borrow?,” Kennedy School of Government. Forthcoming in Barry Eichengreen and Ricardo Hausmann, editors, Other People's Money: Debt Denomination and Financial Instability in Emerging Market Economies (University of Chicago Press: Chicago). Choudhri, Ehsan, and Dalia Hakura, 2001, “Exchange Rate Pass-Through to Domestic Prices: Does the Inflationary Environment Matter?” IMF Working Paper WP/01/194. Christiano, L.J., C. Gust and J. Roldos, 2002, “Monetary Policy in a Financial Crisis”, Journal of Economic Theory, forthcoming. Cooper, Richard, 1971, “Currency Devaluation in Developing Countries,” Essays in International Finance no. 86, June, Princeton University. Corbo, Vittorio, 1985, “Reforms and Macroeconomic Adjustments in Chile during 1974-1984,” World Development 13, 8, August, pp. 893-916. Desai, Padma, and Pritha Mitra, 2004, “Why Do Some Countries Recover More Readily from Financial Crises,” Columbia University, July. Diaz-Alejandro, Carlos, 1963, “A Note on the Impact of Devaluation and the Redistribution Effect,” Journal of Political Economy, December, 577-580.
42

Dornbusch, Rudiger, 2001, “A Primer on Emerging Market Crises,” NBER Working Paper No. 8326. Published in Managing Currency Crises in Emerging Markets, S. Edwards and J. Frankel, eds., Chicago: University of Chicago Press, 2002. Edwards, Sebastian, 1986, “Are Devaluations Contractionary?” Review of Economics and Statistics 68, 3, August, 501-508. Edwards, Sebastian, 1994, "The Political Economy of Inflation and Stabilization in Developing Countries," NBER WP 4319; in Economic Development and Cultural Change, University of Chicago Press, vol. 42(2), pages 235-66, January. Edwards, Sebastian, 2004a, “Financial Openness, Sudden Stops and Current Account Reversals”, NBER Working Paper No. 10277. Edwards, Sebastian, 2004b, “Thirty Years of Current Account Imbalances, Current Account Reversals and Sudden Stops,” NBER WP no. 10276, January. In IMF Staff Papers. Edwards, Sebastian, and Julio Santaella, 1993, “Devaluation Controversies in the Developing Countries: Lessons from the Bretton Woods Era,” NBER WP no. 4047. In Retrospetcive on the Bretton Woods System, edited by Michael Bordo and Barry Eichengreen , University of Chicago Press: Chicago, 1993. Eichengreen, Barry. 1999. Toward a New Financial Architecture: A Practical Post-Asia Agenda, Washington, DC: Institute for International Economics. Eichengreen, Barry, and Ricardo Hausmann, 1999, “Exchange Rates and Financial Fragility,” in New Challenges for Monetary Policy, Kansas City: Federal Reserve Bank of Kansas City, 329-368. Eichengreen, Barry, and Andrew Rose "Staying Afloat When the Wind Shifts: External Factors and Emerging-Market Banking Crises," NBER Working Paper 6370; in Money, Factor Mobility and Trade: Essays in Honor of Robert Mundell, edited by Guillermo Calvo, Rudiger Dornbusch and Maurice Obstfeld. Fleming, J. M., 1962, “Domestic financial policies under fixed and under floating exchange rates,” IMF Staff Papers 9, 3: 369-79. Flood, Robert, and Nancy Marion, 1999, “Perspectives on the Recent Currency Crisis Literature.” IMF Working Paper 98/130. In International Journal of Finance and Economics 4 (1) :1-26. Also in Guillermo Calvo, Rudiger Dornbusch, and Maurice Obstfeld, eds., 2001, Money, Capital Mobility, and Trade: Essays in Honor of Robert Mundell. Cambridge, Mass.: MIT Press. Frankel, Jeffrey, David Parsley and Shang-Jin Wei, 2004, “Slow Passthrough Around the World: A New Import for Developing Countries?” Harvard University, July 8. Frankel, Jeffrey, and David Romer, 1999, “Does Trade Cause Growth?”, American Economic Review, Vol. 89, No. 3: 379-399. Frankel, Jeffrey, and Andrew Rose, 1996, “Currency Crashes in Emerging Markets: An Empirical Treatment,” Journal of International Economics 41: 351-368.
43
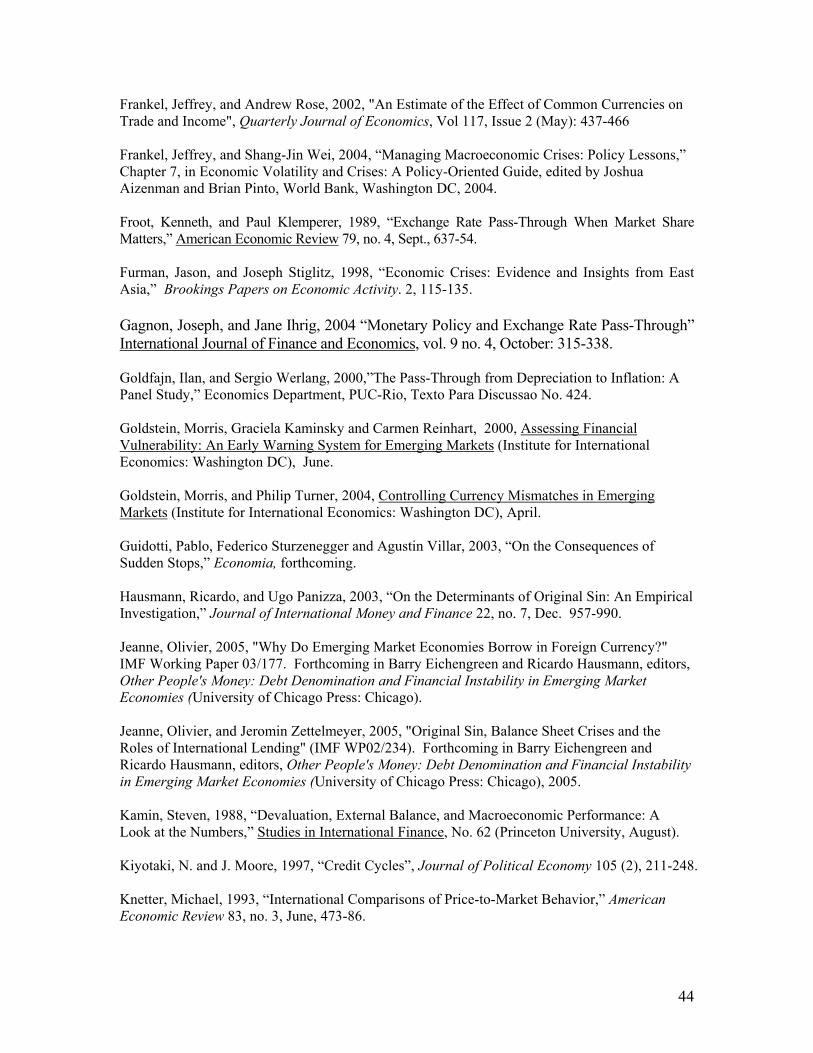
Frankel, Jeffrey, and Andrew Rose, 2002, "An Estimate of the Effect of Common Currencies on Trade and Income", Quarterly Journal of Economics, Vol 117, Issue 2 (May): 437-466 Frankel, Jeffrey, and Shang-Jin Wei, 2004, “Managing Macroeconomic Crises: Policy Lessons,” Chapter 7, in Economic Volatility and Crises: A Policy-Oriented Guide, edited by Joshua Aizenman and Brian Pinto, World Bank, Washington DC, 2004. Froot, Kenneth, and Paul Klemperer, 1989, “Exchange Rate Pass-Through When Market Share Matters,” American Economic Review 79, no. 4, Sept., 637-54. Furman, Jason, and Joseph Stiglitz, 1998, “Economic Crises: Evidence and Insights from East Asia,” Brookings Papers on Economic Activity. 2, 115-135. Gagnon, Joseph, and Jane Ihrig, 2004 “Monetary Policy and Exchange Rate Pass-Through” International Journal of Finance and Economics, vol. 9 no. 4, October: 315-338. Goldfajn, Ilan, and Sergio Werlang, 2000,”The Pass-Through from Depreciation to Inflation: A Panel Study,” Economics Department, PUC-Rio, Texto Para Discussao No. 424. Goldstein, Morris, Graciela Kaminsky and Carmen Reinhart, 2000, Assessing Financial Vulnerability: An Early Warning System for Emerging Markets (Institute for International Economics: Washington DC), June. Goldstein, Morris, and Philip Turner, 2004, Controlling Currency Mismatches in Emerging Markets (Institute for International Economics: Washington DC), April. Guidotti, Pablo, Federico Sturzenegger and Agustin Villar, 2003, “On the Consequences of Sudden Stops,” Economia, forthcoming. Hausmann, Ricardo, and Ugo Panizza, 2003, “On the Determinants of Original Sin: An Empirical Investigation,” Journal of International Money and Finance 22, no. 7, Dec. 957-990. Jeanne, Olivier, 2005, "Why Do Emerging Market Economies Borrow in Foreign Currency?" IMF Working Paper 03/177. Forthcoming in Barry Eichengreen and Ricardo Hausmann, editors, Other People's Money: Debt Denomination and Financial Instability in Emerging Market Economies (University of Chicago Press: Chicago). Jeanne, Olivier, and Jeromin Zettelmeyer, 2005, "Original Sin, Balance Sheet Crises and the Roles of International Lending" (IMF WP02/234). Forthcoming in Barry Eichengreen and Ricardo Hausmann, editors, Other People's Money: Debt Denomination and Financial Instability in Emerging Market Economies (University of Chicago Press: Chicago), 2005. Kamin, Steven, 1988, “Devaluation, External Balance, and Macroeconomic Performance: A Look at the Numbers,” Studies in International Finance, No. 62 (Princeton University, August). Kiyotaki, N. and J. Moore, 1997, “Credit Cycles”, Journal of Political Economy 105 (2), 211-248. Knetter, Michael, 1993, “International Comparisons of Price-to-Market Behavior,” American Economic Review 83, no. 3, June, 473-86.
44

Krugman, Paul, 1987, “Pricing to Market When the Exchange Rate Changes,” in Sven Arndt and J. David Richardson, eds., Real-Financial Linkages Among Open Economies, (MIT Press: Cambridge), 49-70. Krugman Paul, 1999, “Balance Sheets Effects, the Transfer Problem and Financial Crises,” in International Finance and Financial Crises: Essays in Honour of Robert P. Flood, Jr., Isard P., A. Razin and A.K. Rose (eds.), Kluwer Academic Publishers, pp. 31-44. Lora, Eduardo, and Mauricio Olivera, 2004, “The Electoral Consequences of the Washington Consensus,” Inter-American Development Bank, May 4. Milesi-Ferretti, Gian Maria, and Assaf Razin, 1998, “Sharp Reductions in Current Account Deficits: An Empirical Analysis.” NBER Working Paper 6310. European Economic Review 42 (3--5), May: 897--908. ---------. 2000. “Current Account Reversals and Currency Crises: Empirical Regularities.” NBER Working Paper 6620. . In Paul Krugman, ed., Currency Crises. Chicago: University of Chicago Press. Mulder, Christian, Roberto Perrelli, and Manuel Rocha, 2002, “The Role of Corporate, Legal and Macroeconomic Balance Sheet Indicators in Crisis Detection and Prevention,” IMF Working Paper 02/59, March. Mundell, Robert, 1963, "Capital Mobility and Stabilization Policy under Fixed and Flexible Exchange Rates," Canadian J. Econ. and Poli. Sci., Nov.. Or as adapted in his International Economics, 18, pp. 250-262. Otani, Akira, Shigenori Shiratsuka, and Toyoichiro Shirota, 2003, “The Decline in the Exchange Rate Pass-Through: Evidence from Japanese Import Prices,” Monetary and Economic Studies, Bank of Japan, vol. 21, no. 3, October; p.53-81. Pathak, Parag, and Jean Tirole, 2004, “Pegs, Risk Management, and Financial Crises,” Annual Research Conference, International Monetary Fund, Nov. 4-5. Radelet, Steven, and Jeffrey Sachs, 1998, "The East Asian Financial Crisis: Diagnosis, Remedies, Prospects," Brookings Papers on Economic Activity, 1. 1-74 & 88-90. Rodrik, Dani, and Andres Velasco. 2000. “Short-Term Capital Flows.” In Annual World Bank Conference on Development Economics 1999. Washington, D.C: World Bank. Rose, Andrew, 2002, “A Reason Why Countries Pay their Debts: Renegotiation and International Trade”, NBER Working Paper #8853 Sachs, Jeffrey D, 1985, "External Debt and Macroeconomic Performance in Latin America and East Asia," Brookings Papers on Economic Activity, 1985:2. Schneider, Martin, and Aaron Tornell, 2001, “Boom Bust Cycles and the Balance Sheet Effect,” NBER Working Paper No. 8060. Stein, Ernesto and Jorge Streb, 1998, "Political Stabilization Cycles in High Inflation Economies," Journal of Development Economics, 56, 159-180, June.
45

Stein, Ernesto and Jorge Streb, 1999, "Elections and the Timing of Devaluations," working paper, InterAmerican Development Bank. Taylor, John, 2000, “Low Inflation, Pass-Through and the Pricing Power of Firms,” European Economic Review, 44, no. 7, June, 1389-1408.
46

Appendix 1: Currency Crashes and Frequency of Changes of Policy-makers in Developing Countries (sample =103 countries)
A. Change in Premier or Chief Executive: 1- Year Horizon (1970-2003)
12- months period following a devaluation
All other 12-month periods
Change observed
51 (27.1 %)
679 (20.5%)
No change observed
137 (72.9%)
2635 (79.51%)
Total 188 3314
P-value for the difference is 0.126.
Graph of number of episodes of devaluations and number of premier changes over time
Number of currency crash episodes and premier changes across the world (1970-2003)
0
5
10
15
20
25
30
35
40
45
19701972
19741976
19781980
19821984
19861988
19901992
19941996
19982000
2002
Premier ChangeDevaluation Episode
B. Change in Premier or Chief Executive: 1-Year Horizon (1970-2003)
(“Own turnover” – The reference set is only those developing countries which have experienced currency crash at some point)
12- months period following a devaluation
All other 12-month periods
Change observed
41 (29.1%)
459 (21.4%)
No change observed
100 (70.9%)
1683 (78.6%)
Total 141 2142
P-value for the difference is 0.0133.
47
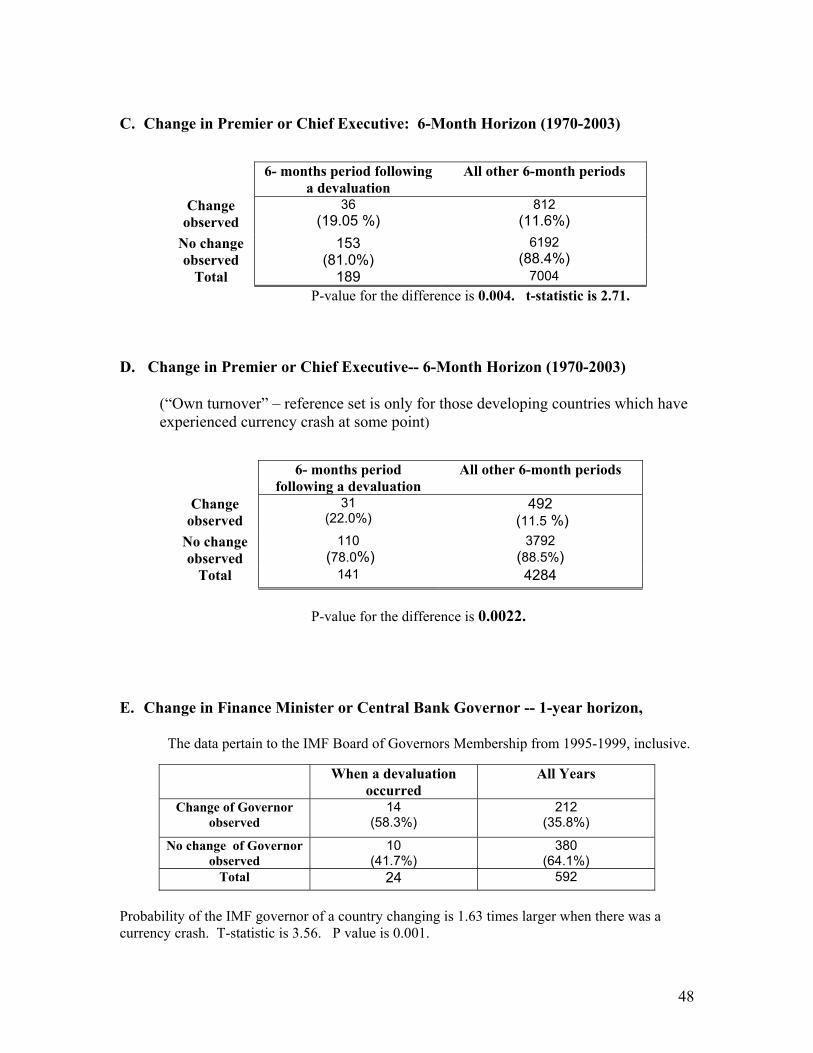
C. Change in Premier or Chief Executive: 6-Month Horizon (1970-2003)
P-value for the difference is 0.004. t-statistic is 2.71.
6- months period following a devaluation
All other 6-month periods
Change observed
36 (19.05 %)
812 (11.6%)
No change observed
153 (81.0%)
6192 (88.4%)
Total 189 7004
D. Change in Premier or Chief Executive-- 6-Month Horizon (1970-2003)
(“Own turnover” – reference set is only for those developing countries which have experienced currency crash at some point)
6- months period following a devaluation
All other 6-month periods
Change observed
31 (22.0%)
492 (11.5 %)
No change observed
110 (78.0%)
3792 (88.5%)
Total 141 4284
P-value for the difference is 0.0022. E. Change in Finance Minister or Central Bank Governor -- 1-year horizon,
The data pertain to the IMF Board of Governors Membership from 1995-1999, inclusive.
When a devaluation occurred
All Years
Change of Governor observed
14 (58.3%)
212 (35.8%)
No change of Governor observed
10 (41.7%)
380 (64.1%)
Total 24 592
Probability of the IMF governor of a country changing is 1.63 times larger when there was a currency crash. T-statistic is 3.56. P value is 0.001.
48

F. 1- Year Horizon, Change in Premier or Chief Executive by Income Level 1) Rich Countries
1-year period following a devaluation
All other 1-year periods
Change observed 0 (-)
212 (28.3%)
No change observed 0 (-)
536 (71.7%)
Total 0 748
2) Middle Income Countries
P-value for the difference is 0.3419.
1-year period following a devaluation
All other 1-year periods
Change observed 29 (29.3%)
508 (20.2%)
No change observed 70 (70.7%)
2012 (79.8%)
Total 99 2520
3) Poor Countries
P-value for the difference is 0.2041.
1-year period following a devaluation
All other 1-year periods
Change observed 22 (24.4%)
171 (16.8%)
No change observed 68 (75.6%)
845 (83.2%)
Total 90 1016
G. 6- Month Horizon, Change in Premier or Chief Executive by Income Level
1) Rich Countries
6-month period following a devaluation
All other 6-month periods
Change observed 0 (-)
235 (15.7%)
No change observed 0 (-)
1261 (84.3%)
Total 0 1496
49
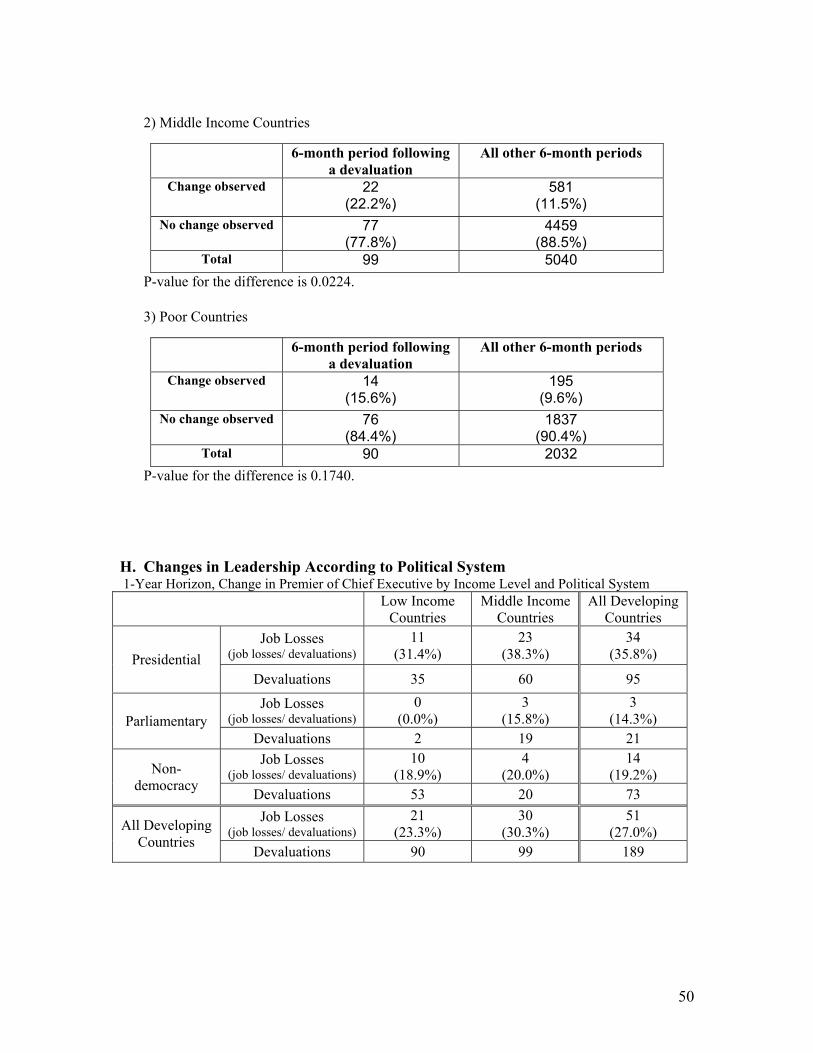
2) Middle Income Countries
P-value for the difference is 0.0224.
6-month period following a devaluation
All other 6-month periods
Change observed 22 (22.2%)
581 (11.5%)
No change observed 77 (77.8%)
4459 (88.5%)
Total 99 5040
3) Poor Countries
P-value for the difference is 0.1740.
6-month period following a devaluation
All other 6-month periods
Change observed 14 (15.6%)
195 (9.6%)
No change observed 76 (84.4%)
1837 (90.4%)
Total 90 2032
H. Changes in Leadership According to Political System 1-Year Horizon, Change in Premier of Chief Executive by Income Level and Political System
Low Income Countries
Middle Income Countries
All Developing Countries
Job Losses (job losses/ devaluations)
11 (31.4%)
23 (38.3%)
34 (35.8%) Presidential
Devaluations 35 60 95
Job Losses (job losses/ devaluations)
0 (0.0%)
3 (15.8%)
3 (14.3%) Parliamentary
Devaluations 2 19 21 Job Losses
(job losses/ devaluations) 10
(18.9%) 4
(20.0%) 14
(19.2%) Non-democracy Devaluations 53 20 73
Job Losses (job losses/ devaluations)
21 (23.3%)
30 (30.3%)
51 (27.0%) All Developing
Countries Devaluations 90 99 189
50
. 6-Month Horizon, Change in Premier of Chief Executive by Income Level and Political System
Low Income Countries
Middle Income Countries
All Developing Countries
Job Losses (job losses/ devaluations)
7 (20.0%)
18 (30.0%)
25 (26.3%) Presidential
Devaluations 35 60 95
Job Losses (job losses/ devaluations)
0 (0.0%)
1 (5.3%)
1 (4.8%) Parliamentary
Devaluations 2 19 21 Job Losses
(job losses/ devaluations) 7
(13.2%) 3
(15.0%) 10
(13.7%) Non-democracy Devaluations 53 20 73
Job Losses (job losses/ devaluations)
14 (15.6%)
22 (22.2%)
36 (19.0%) All Developing
Countries Devaluations 90 99 189
I. Change in Premier, controlling for start of an IMF program (within 3 months on
either side of currency crash)
The table summarizes the statistics of devaluations, job loss and IMF programs in the 1990s and 2000’s:
Premier change occurred within 6 mo.
Premier change did not occur within 6 mo.
Total
Cases with an IMF program
4 (21.05%) (20.00%)
15 (78.95%) (20.83%)
19
Cases without an IMF program
16 (21.92%) (80.00%)
57 (78.08%) (79.17%)
73
Total
20
72
92
The t-test below compares the probability that devaluation leads to a premier change within 6 months when there is an IMF program (21%) with the probability of a premier change occurring within 6 months (in general). The P-value is much larger, at 20%.
Ho: mean(normal) - mean(devalIMF) = diff = 0 Ha: diff < 0 Ha: diff != 0 Ha: diff > 0 t = -0.8781 t = -0.8781 t = -0.8781 P < t = 0.196 P > |t| = 0.391 P > t = 0.804
51

Comparing IMF and non-IMF devaluation cases, and the probability with which each leads to a change of leader within 6 months, shows that there is no significant difference between the two groups.
Two-sample t test with unequal variances Ho: mean(devalnoIMF) - mean(devalIMF) = diff = 0 Ha: diff < 0 Ha: diff != 0 Ha: diff > 0 t = 0.0803 t = 0.0803 t = 0.0803 P < t = 0.5317 P > |t| = 0.9366 P > t = 0.4683
When comparing the probability that devaluation without an IMF program leads to a change of leader within 6 months with the probability of premier change occurring within 6 months under normal circumstances, we find the former is significantly higher than the latter.
Two-sample t test with unequal variances Ho: mean(normal) - mean(devalnoIMF) = diff = 0 Ha: diff < 0 Ha: diff != 0 Ha: diff > 0 t = -1.901 P < t = 0.031 P > |t| = 0.061 P > t = 0.969
t = -1.901 t = -1.901
/ /
52

Appendix 2 : IMF country programs, with dates of approval
country begin appryr comamt drawnamt Comments
ALBANIA Stand-By 8/26/1992 20 13.12 Cancelled prior to expiration date 8/25/93. Replaced by ESAF on 7/14/1993.
ALGERIA Stand-By 6/3/1991 300 225 ALGERIA Stand-By 5/27/1994 457.2 385.2 Cancelled. ALGERIA EFF 5/22/1995 1169.28 1169.28 ARGENTINA Stand-By 7/29/1991 780 292.5 Cancelled prior to expiration date of 6/30/92.
ARGENTINA EFF 3/31/1992 4020.25 4020.25 Extended from 3/30/95 to 4/30/95 and then to 3/30/96. Approved amount increased.
ARGENTINA Stand-By 4/12/1996 720 613
ARGENTINA EFF 2/4/1998 2080 0 At time of approval, purchase schedule decided through 11/98.
ARGENTINA Stand-By 3/10/2000 10585.5 3834.3 ARMENIA Stand-By 6/28/1995 43.88 13.5 Cancelled prior to expiration of 6/27/96. AZERBAIJAN Stand-By 11/17/1995 58.5 58.5 AZERBAIJAN EFF 12/20/1996 58.5 53.24 Extended from 12/19/99 to 3/19/2000. BELARUS Stand-By 9/12/1995 196.28 50 BRAZIL Stand-By 1/29/1992 1500 127.5 BRAZIL Stand-By 12/2/1998 10419.84 7869.15 Amounts exclude SRF drawing of SDR 2.6 b. BRAZIL Stand-By 9/14/2001 2193 0 BULGARIA Stand-By 3/15/1991 279 279 Followed by another stand-by on 4/17/1992. BULGARIA Stand-By 4/17/1992 155 124 Approved after expiration of 3/15/91 stand-by. BULGARIA Stand-By 4/11/1994 139.48 116.24 Approved amount increased in 9/94.
BULGARIA Stand-By 7/19/1996 400 80 Cancelled prior to expiration date of 3/18/98. Replaced by another stand-by on 4/11/97.
BULGARIA Stand-By 4/11/1997 371.9 371.9 Replaced the 6/19/96 stand-by. BULGARIA EFF 9/25/1998 627.62 523 CAMEROON Stand-By 12/20/1991 28 8 CAMEROON Stand-By 3/14/1994 81.06 21.91 Followed by another stand-by on 9/27/95. CAMEROON Stand-By 9/27/1995 67.6 28.2 Approved after expiration of 3/14/94 stand-by. CENTRAL AFRICAN REPUBLIC Stand-By 3/28/1994 16.48 10.71 CHAD Stand-By 3/23/1994 16.52 10.32 COLOMBIA EFF 12/20/1999 1957 0 CONGO, REP OF Stand-By 8/27/1990 27.98 4 CONGO, REP OF Stand-By 5/27/1994 23.16 12.5 COSTA RICA Stand-By 4/8/1991 33.64 25.64 Extended from 4/7/92. COSTA RICA Stand-By 4/19/1993 21.04 0 COSTA RICA Stand-By 11/29/1995 52 0 COTE D'IVOIRE Stand-By 9/20/1991 82.75 33.1 CROATIA Stand-By 10/14/1994 65.4 13.08 CROATIA EFF 3/12/1997 353.16 28.78 CROATIA Stand-By 3/19/2001 200 0 Precautionary arrangement. CZECH REPUBLIC Stand-By 3/17/1993 177 70
CZECHOSLOVAKIA Stand-By 1/7/1991 619.5 619.5 Extended from 3/6/92. Followed by another stand-by 4/3/92.
CZECHOSLOVAKIA Stand-By 4/3/1992 236 36 Cancelled prior to expiration date 4/2/93 (Czechoslovakia ceased to exist on 1/1/93).
DOMINICAN REPUBLIC Stand-By 8/28/1991 39.24 39.24 Followed by another stand-by on 7/9/1993. DOMINICAN REPUBLIC Stand-By 7/9/1993 31.8 16.8 ECUADOR Stand-By 12/11/1991 75 18.56
ECUADOR Stand-By 5/11/1994 173.9 98.9 Approved amount increased in 11/94. Cancelled prior to expiration date 3/31/96.
ECUADOR Stand-By 4/19/2000 226.73 113.35 EGYPT Stand-By 5/17/1991 234.4 147.2 Extended from 11/30/92 . EGYPT EFF 9/20/1993 400 0 EGYPT Stand-By 10/11/1996 271.4 0 Precautionary arrangement.
53

EL SALVADOR Stand-By 8/27/1990 35.6 0 EL SALVADOR Stand-By 1/6/1992 41.5 0 Followed by another stand-by 5/10/93.
EL SALVADOR Stand-By 5/10/1993 47.11 0 Approved after expiration of 1/6/92 stand-by. Extended from 3/9/94. Amount increased 11/94.
EL SALVADOR Stand-By 7/21/1995 37.68 0 EL SALVADOR Stand-By 2/28/1997 37.68 0 Extended from 4/27/98. EL SALVADOR Stand-By 9/23/1998 37.68 0 ESTONIA Stand-By 9/16/1992 27.9 27.9 Followed by another stand-by 10/27/93.
ESTONIA Stand-By 10/27/1993 11.63 11.63 Approved after expiration of 9/16/92 stand-by. Followed by another stand-by on 4/11/95.
ESTONIA Stand-By 4/11/1995 13.95 0 Approved after expiration of 10/27/93 stand-by. Followed by another stand-by on 7/29/1996.
ESTONIA Stand-By 7/29/1996 13.95 0 Approved after expiration of 4/11/95 stand-by. ESTONIA Stand-By 12/17/1997 16.1 0 Precautionary arrangement. ESTONIA Stand-By 3/1/2000 29.34 0 Precautionary arrangement. GABON Stand-By 9/30/1991 28 4 GABON Stand-By 3/30/1994 38.6 38.6 GABON EFF 11/8/1995 110.3 60.67 Extended from 11/7/98 to 3/7/99. GABON Stand-By 10/23/2000 92.58 13.22 GEORGIA Stand-By 6/28/1995 72.15 22.2 Cancelled prior to expiration date 6/27/96. GUATEMALA Stand-By 12/18/1992 54 0 HAITI Stand-By 3/8/1995 20 16.4 HONDURAS Stand-By 7/27/1990 30.5 30.5 Extended from 7/26/91. HUNGARY Stand-By 3/14/1990 159.21 127.37 Cancelled prior to expiration date 3/13/1991 HUNGARY EFF 2/20/1991 1114 557.23 Cancelled prior to expiration date 2/19/94. HUNGARY Stand-By 9/15/1993 340 56.7 HUNGARY Stand-By 3/15/1996 264.18 0 INDIA Stand-By 1/18/1991 551.93 551.93 INDIA Stand-By 10/31/1991 1656 1656
INDONESIA Stand-By 11/5/1997 8338.24 3669.12
Approved under Fund's emergency procedures. Access increased 7/15/98. Cancelled prior to expiration date 11/4/2000.
INDONESIA EFF 8/25/1998 5383.1 3797.7
Prior SBA cancelled, replaced by EFF. EFF to cover remaining period of SBA Cancelled before expiration date 11/5/00, replaced by EFF on 2/4/00.
INDONESIA EFF 2/4/2000 3638 851.15 JAMAICA Stand-By 3/23/1990 82 82 Followed by another stand-by on 6/28/91. JAMAICA Stand-By 6/28/1991 43.65 43.65 Extended from 6/30/92. JAMAICA EFF 12/11/1992 109.13 86.75 Extended from 12/10/95 to 2/24/96 and 3/16/96. JORDAN Stand-By 2/26/1992 44.4 44.4 Extended from 8/25/93.
JORDAN EFF 5/25/1994 189.3 130.32
Approved amount increased in 9/94 and 2/95. Cancelled prior to expiration date 5/24/1997. Replaced by another EFF 2/9/96.
JORDAN EFF 2/9/1996 238.04 202.52 Approved amount increased from 200.8 in 2/97. JORDAN EFF 4/15/1999 127.88 36.54
KAZAKHSTAN Stand-By 1/26/1994 123.75 74.25 Extended from 1/25/95. Followed by another stand-by 6/5/95.
KAZAKHSTAN Stand-By 6/5/1995 185.6 185.6 Approved after expiration of 1/26/94 stand-by. KAZAKHSTAN EFF 7/17/1996 309.4 154.7 KAZAKHSTAN EFF 12/13/1999 329.1 0 KOREA Stand-By 12/4/1997 15500 14412.5 Approved under Fund's emergency procedures. KYRGYZ REPUBLIC Stand-By 5/12/1993 27.09 11.61 LATVIA Stand-By 9/14/1992 54.9 54.9 Followed by another stand-by on 12/15/93.
LATVIA Stand-By 12/15/1993 22.88 9.15 Approved after expiration of 9/14/92 stand-by. Followed by another stand-by on 4/21/1995.
LATVIA Stand-By 4/21/1995 27.45 0 Approved after expiration of 12/15/93 stand-by. Followed by another stand-by on 5/24/96.
LATVIA Stand-By 5/24/1996 30 0 Approved after expiration of 4/21/95. Followed by another stand-by on 10/10/1997.
LATVIA Stand-By 10/10/1997 33 0 Approved after expiration of 5/24/96 stand-by. Precautionary arrangement.
54
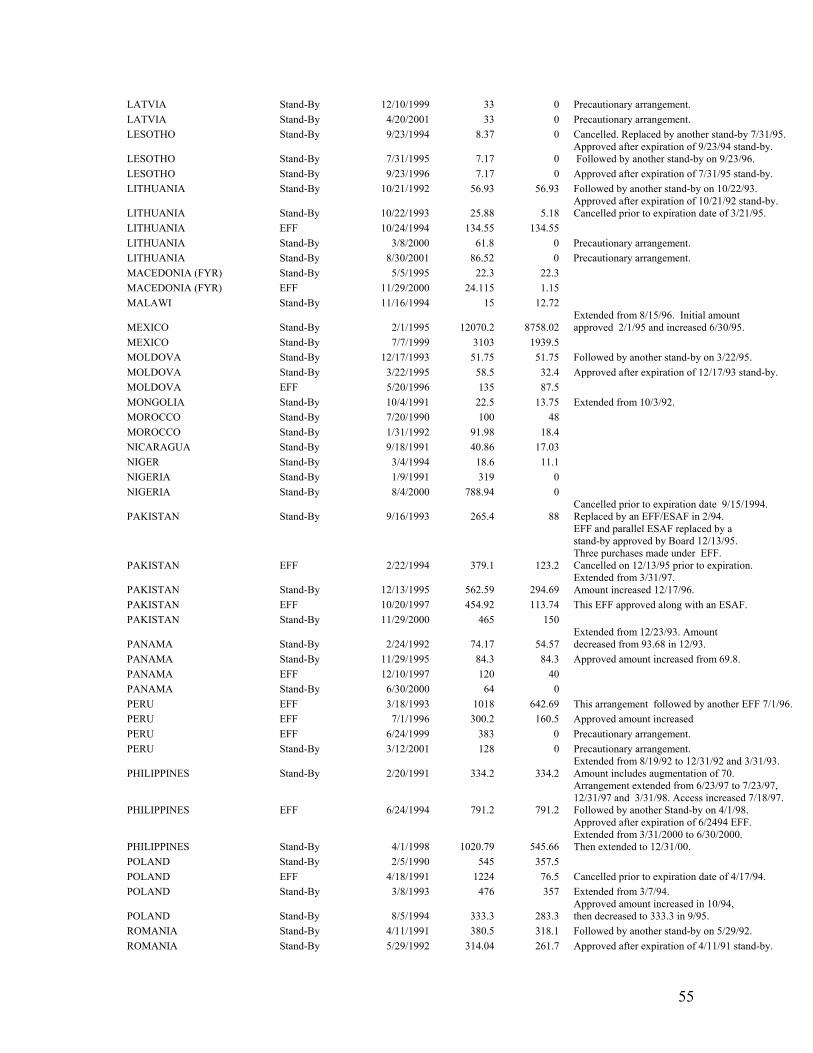
LATVIA Stand-By 12/10/1999 33 0 Precautionary arrangement. LATVIA Stand-By 4/20/2001 33 0 Precautionary arrangement. LESOTHO Stand-By 9/23/1994 8.37 0 Cancelled. Replaced by another stand-by 7/31/95.
LESOTHO Stand-By 7/31/1995 7.17 0 Approved after expiration of 9/23/94 stand-by. Followed by another stand-by on 9/23/96.
LESOTHO Stand-By 9/23/1996 7.17 0 Approved after expiration of 7/31/95 stand-by. LITHUANIA Stand-By 10/21/1992 56.93 56.93 Followed by another stand-by on 10/22/93.
LITHUANIA Stand-By 10/22/1993 25.88 5.18 Approved after expiration of 10/21/92 stand-by. Cancelled prior to expiration date of 3/21/95.
LITHUANIA EFF 10/24/1994 134.55 134.55 LITHUANIA Stand-By 3/8/2000 61.8 0 Precautionary arrangement. LITHUANIA Stand-By 8/30/2001 86.52 0 Precautionary arrangement. MACEDONIA (FYR) Stand-By 5/5/1995 22.3 22.3 MACEDONIA (FYR) EFF 11/29/2000 24.115 1.15 MALAWI Stand-By 11/16/1994 15 12.72
MEXICO Stand-By 2/1/1995 12070.2 8758.02 Extended from 8/15/96. Initial amount approved 2/1/95 and increased 6/30/95.
MEXICO Stand-By 7/7/1999 3103 1939.5 MOLDOVA Stand-By 12/17/1993 51.75 51.75 Followed by another stand-by on 3/22/95. MOLDOVA Stand-By 3/22/1995 58.5 32.4 Approved after expiration of 12/17/93 stand-by. MOLDOVA EFF 5/20/1996 135 87.5 MONGOLIA Stand-By 10/4/1991 22.5 13.75 Extended from 10/3/92. MOROCCO Stand-By 7/20/1990 100 48 MOROCCO Stand-By 1/31/1992 91.98 18.4 NICARAGUA Stand-By 9/18/1991 40.86 17.03 NIGER Stand-By 3/4/1994 18.6 11.1 NIGERIA Stand-By 1/9/1991 319 0 NIGERIA Stand-By 8/4/2000 788.94 0
PAKISTAN Stand-By 9/16/1993 265.4 88 Cancelled prior to expiration date 9/15/1994. Replaced by an EFF/ESAF in 2/94.
PAKISTAN EFF 2/22/1994 379.1 123.2
EFF and parallel ESAF replaced by a stand-by approved by Board 12/13/95. Three purchases made under EFF. Cancelled on 12/13/95 prior to expiration.
PAKISTAN Stand-By 12/13/1995 562.59 294.69 Extended from 3/31/97. Amount increased 12/17/96.
PAKISTAN EFF 10/20/1997 454.92 113.74 This EFF approved along with an ESAF. PAKISTAN Stand-By 11/29/2000 465 150
PANAMA Stand-By 2/24/1992 74.17 54.57 Extended from 12/23/93. Amount decreased from 93.68 in 12/93.
PANAMA Stand-By 11/29/1995 84.3 84.3 Approved amount increased from 69.8. PANAMA EFF 12/10/1997 120 40 PANAMA Stand-By 6/30/2000 64 0 PERU EFF 3/18/1993 1018 642.69 This arrangement followed by another EFF 7/1/96. PERU EFF 7/1/1996 300.2 160.5 Approved amount increased PERU EFF 6/24/1999 383 0 Precautionary arrangement. PERU Stand-By 3/12/2001 128 0 Precautionary arrangement.
PHILIPPINES Stand-By 2/20/1991 334.2 334.2 Extended from 8/19/92 to 12/31/92 and 3/31/93. Amount includes augmentation of 70.
PHILIPPINES EFF 6/24/1994 791.2 791.2
Arrangement extended from 6/23/97 to 7/23/97, 12/31/97 and 3/31/98. Access increased 7/18/97. Followed by another Stand-by on 4/1/98.
PHILIPPINES Stand-By 4/1/1998 1020.79 545.66
Approved after expiration of 6/2494 EFF. Extended from 3/31/2000 to 6/30/2000. Then extended to 12/31/00.
POLAND Stand-By 2/5/1990 545 357.5 POLAND EFF 4/18/1991 1224 76.5 Cancelled prior to expiration date of 4/17/94. POLAND Stand-By 3/8/1993 476 357 Extended from 3/7/94.
POLAND Stand-By 8/5/1994 333.3 283.3 Approved amount increased in 10/94, then decreased to 333.3 in 9/95.
ROMANIA Stand-By 4/11/1991 380.5 318.1 Followed by another stand-by on 5/29/92. ROMANIA Stand-By 5/29/1992 314.04 261.7 Approved after expiration of 4/11/91 stand-by.
55
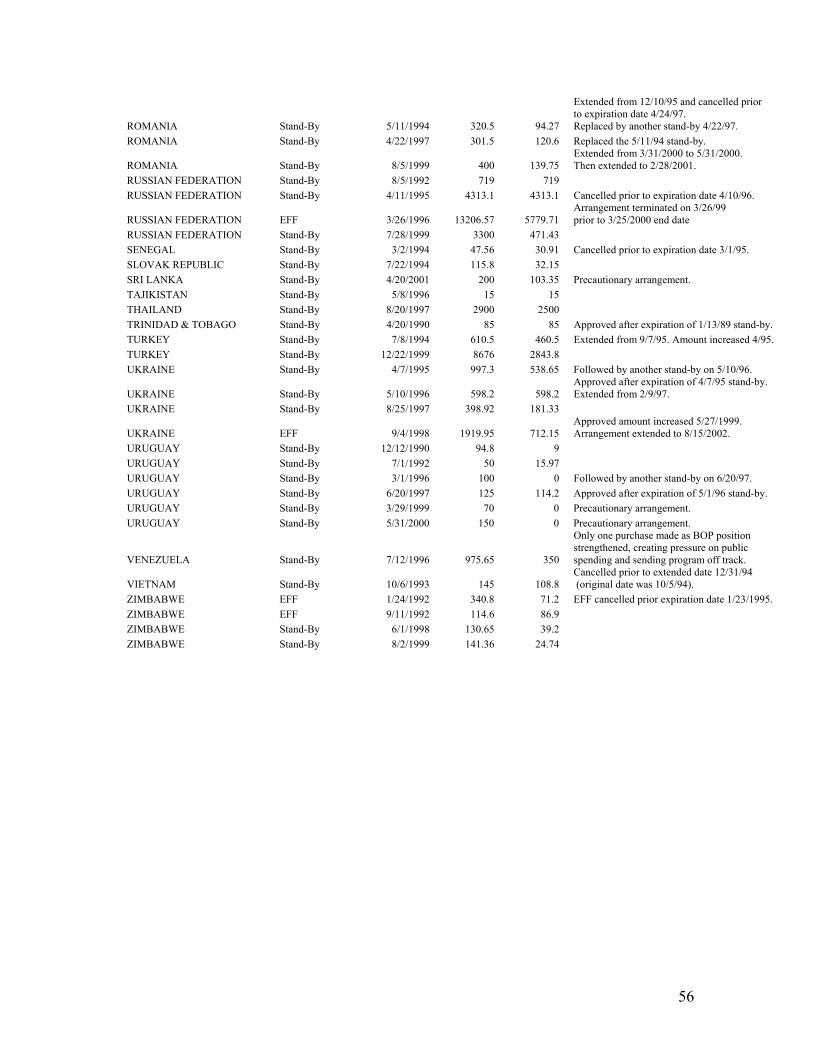
ROMANIA Stand-By 5/11/1994 320.5 94.27
Extended from 12/10/95 and cancelled prior to expiration date 4/24/97. Replaced by another stand-by 4/22/97.
ROMANIA Stand-By 4/22/1997 301.5 120.6 Replaced the 5/11/94 stand-by.
ROMANIA Stand-By 8/5/1999 400 139.75 Extended from 3/31/2000 to 5/31/2000. Then extended to 2/28/2001.
RUSSIAN FEDERATION Stand-By 8/5/1992 719 719 RUSSIAN FEDERATION Stand-By 4/11/1995 4313.1 4313.1 Cancelled prior to expiration date 4/10/96.
RUSSIAN FEDERATION EFF 3/26/1996 13206.57 5779.71 Arrangement terminated on 3/26/99 prior to 3/25/2000 end date
RUSSIAN FEDERATION Stand-By 7/28/1999 3300 471.43 SENEGAL Stand-By 3/2/1994 47.56 30.91 Cancelled prior to expiration date 3/1/95. SLOVAK REPUBLIC Stand-By 7/22/1994 115.8 32.15 SRI LANKA Stand-By 4/20/2001 200 103.35 Precautionary arrangement. TAJIKISTAN Stand-By 5/8/1996 15 15 THAILAND Stand-By 8/20/1997 2900 2500 TRINIDAD & TOBAGO Stand-By 4/20/1990 85 85 Approved after expiration of 1/13/89 stand-by. TURKEY Stand-By 7/8/1994 610.5 460.5 Extended from 9/7/95. Amount increased 4/95. TURKEY Stand-By 12/22/1999 8676 2843.8 UKRAINE Stand-By 4/7/1995 997.3 538.65 Followed by another stand-by on 5/10/96.
UKRAINE Stand-By 5/10/1996 598.2 598.2 Approved after expiration of 4/7/95 stand-by. Extended from 2/9/97.
UKRAINE Stand-By 8/25/1997 398.92 181.33
UKRAINE EFF 9/4/1998 1919.95 712.15 Approved amount increased 5/27/1999. Arrangement extended to 8/15/2002.
URUGUAY Stand-By 12/12/1990 94.8 9 URUGUAY Stand-By 7/1/1992 50 15.97 URUGUAY Stand-By 3/1/1996 100 0 Followed by another stand-by on 6/20/97. URUGUAY Stand-By 6/20/1997 125 114.2 Approved after expiration of 5/1/96 stand-by. URUGUAY Stand-By 3/29/1999 70 0 Precautionary arrangement. URUGUAY Stand-By 5/31/2000 150 0 Precautionary arrangement.
VENEZUELA Stand-By 7/12/1996 975.65 350
Only one purchase made as BOP position strengthened, creating pressure on public spending and sending program off track.
VIETNAM Stand-By 10/6/1993 145 108.8 Cancelled prior to extended date 12/31/94 (original date was 10/5/94).
ZIMBABWE EFF 1/24/1992 340.8 71.2 EFF cancelled prior expiration date 1/23/1995. ZIMBABWE EFF 9/11/1992 114.6 86.9 ZIMBABWE Stand-By 6/1/1998 130.65 39.2 ZIMBABWE Stand-By 8/2/1999 141.36 24.74
56

/ / Appendix 3 (1-year horizon): In a sample of currency crashes, chief executives were 1.7 times as likely to lose their jobs over the subsequent 12 months if their government had said it would not devalue (2/3) as if it had not said so (7/18).
A. Promises by Premiers, Finance Ministers, Central Bank Governors
1) Summary Table
Changes in Premier
No Changes in Premier
Frequency of Change in Premier
Total Case Studies
Promise 4 2 2/3 6 No Promise 7 11 7/18 18
Total 11 13 24
2) Background Table 1 (Changes in Premier)
Country Month of Devaluation
Date of Premier Change
Presence of Promise (by whom)
Newspaper (Date of Report)
Argentina 03/75 03/24/75 No La Prensa Argentina 04/81 12/11/81 No La Prensa Argentina 04/89 07/08/89 Yes (CB Governor) La Prensa (03/31/89) 1) Argentina 01/02 01/02/02 Yes (Premier) La Prensa (12/27/01) 2) Korea 12/97 02/25/98 No Maeil Business Daily Mexico 09/76 12/01/76 No El Excelsior Mexico 02/82 12/01/82 Yes (Premier & CB governor) El Universal (02/06/82) 3) Lebanon 08/90 12/24/90 No Al Hayat
Sierra Leone 08/97 03/10/98 No Sierra Leone News
Venezuela 02/02 04/13/02 Yes (CB governor) El Diario (02/08/02) 4) Syria 01/88 11/01/ 88 No Al Ba’ath
1) Central Bank Governor Jose Machinea denied yesterday that modifications to the exchange rate markets
are under study and announced a monetary policy tightening through a strong increase in the interest rates in order to stop the increase of the dollar.
2) We don’t want to be slaves, said the president (Alberto Rodriguez Saa) during an effusive speech at the CGT. There he made transcendental announcements that there will be neither devaluation nor dollarization; and that there will be a new third currency, the “argentinian,” backed by the governmental real estate.
3) In a vibrant announcement the president(Jose Lopez Portillo) pointed out the most important aspects of the strategy to follow…The peso will keep floating and to compensate for its floating path it has been set compensatory tariff and license system. Romero Kolbeck (Banco de Mexico director) denied the rumor of a devaluation, the peso will keep floating… “There is no chance for a devaluation for our currency and therefore the floating scheme will keep going, said Gustavo Romero Kolbeck. If these rumors were true, that a devaluation is being structured then I wouldn’t be here right now” said a smiling Romero
57

Kolbeck. The famous quotation that Lopez Portillo would “defend the peso like a dog” was not contemporaneously reported in the newspaper; it may have been made more than a month earlier.
4) Castellanos (president Central Bank of Venezuela) claimed that the decision of the government to address the fiscal problem of the country and develop other public initiatives will allow the exchange rate policy to keep defending the Bolivar.
3) Background Table 2 (No Changes in Premier)
Country Month of Devaluation
Date of Premier Change
Presence of Promise (by whom)
Newspaper (Date of Report)
Chile 07/71 09/11/73 No El Mercurio Chile 03/75 03/11/90 No El Mercurio Chile 07/85 03/11/90 No El Mercurio Kenya 04/93 12/30/02 Yes (Finance Minister) Daily Nation (03/23/93) 1) Lebanon 01/85 06/01/87 No Al Anwar Nigeria 10/86 08/26/93 No Daily Times Nigeria 03/92 08/26/93 No Daily Times Peru 06/76 07/28/80 No El Comercio Peru 12/87 07/28/90 Yes (Finance Minister) El Comercio (11/27/87) 2) Uganda 06/81 07/27/85 No Uganda Times Uruguay 03/72 07/13/76 No El Dia Uruguay 11/82 02/12/85 No El Dia Zambia 10/85 11/02/91 No Zambia Daily Mail
1) The Kenyan government went back to forex control. It rejected all IMF rules; Finance Minister Musalia
Mudavadi said that Kenyan economy could no longer absorb further devaluation of the shilling. (Nonetheless, devaluation occurred on April 21st ).
2) Saberbein (Minister of the economy and finance) said that the devaluation would be progressive next year. The exchange rate or the price of dollar would move along with wholesale prices during the next year as a clear export-supporting policy, for the aim is keep growing fostering external sector. (Despite Saberbein’s statement the devaluation actually took place December 15 ). th
B. Promises by Premiers
Summary Table
Changes in Premier
No Changes in Premier
Frequency of Change in Premier
Total Case Studies
Promise 2 0 2/2 2 No
Promise 9 13 9/22 22
Total 11 13 24
58

/ /
Appendix 4 (half-year horizon): In a sample of currency crashes, chief executives were more than twice as likely to lose their jobs over the subsequent 6 months if their government had said it would not devalue (1/2) as if it had not said so (2/9).
A. Promises by Premiers, Finance Ministers, Central Bank Governors
Summary Table
Changes in Premier
No Changes in Premier
Frequency of Change in Premier
Total Case Studies
Promise 3 3 1/2 6 No Promise 4 14 2/9 18
Total 7 17 24
B. Promises by Premiers
Summary Table
Changes in Premier
No Changes in Premier
Frequency of Change in Premier
Total Case Studies
Promise 1 1 1/2 2 No
Promise 6 16 6/22 22
Total 7 17 24
59