Contract No. SPO700-00-D-3180 REPORT
33
UNCLASSIFIED Contract No. SPO700-00-D-3180 CBIAC Task No. 201, Delivery Order No. 174 UNCLASSIFIED REPORT Assessment of Protocols Involving Unknown Samples January 2004 To Division of Laboratory Sciences National Center for Environmental Health Centers for Disease Control and Prevention 4770 Buford Highway Atlanta, GA 30341 By Gerald R. Ducatte, Ph.D. Jessica E. Smith Chemical and Environment Technologies Battelle 505 King Avenue Columbus, OH 43201-2693
Transcript of Contract No. SPO700-00-D-3180 REPORT

UNCLASSIFIED Contract No. SPO700-00-D-3180
CBIAC Task No. 201, Delivery Order No. 174
UNCLASSIFIED
REPORT Assessment of Protocols
Involving Unknown Samples
January 2004
To
Division of Laboratory Sciences National Center for Environmental Health Centers for Disease Control and Prevention 4770 Buford Highway Atlanta, GA 30341
By
Gerald R. Ducatte, Ph.D. Jessica E. Smith Chemical and Environment Technologies Battelle 505 King Avenue Columbus, OH 43201-2693

The Chemical Warfare/Chemical and Biological Defense Information Analysis Center is a Department of Defense Information Analysis Center operated by Battelle Memorial Institute and administered by Defense Information Systems Agency, Defense Technical Information Center (DTIC-AI), Fort Belvoir, VA 22060-6218.
This report is a work prepared for the United States Government by Battelle. In no event shall either the United States Government or Battelle have any responsibility or liability for any consequences of any use, misuse, inability to use, or reliance upon the information contained herein, nor does either warrant or otherwise represent in any way the accuracy, adequacy, efficacy, or applicability of the contents hereof.
EXECUTIVE SUMMARY
Although most public health laboratories in the laboratory response network have extensive experience in the characterization of infectious organisms such as anthrax, capability in the analysis of chemical terrorism related samples is lacking. Personnel, equipment, and techniques already used in chemical analyses by the laboratories may be applicable to the analysis of unknown samples, but guidance in this area is needed. In response to this deficiency, the Centers for Disease Control and Prevention (CDC) tasked Battelle with developing a standardized protocol for the analysis of unknown samples, which are samples that have no detectable levels of Chemical Weapons Convention (CWC) Schedule 1 compounds but still require identification. The task included a survey of existing unknown sample chemical analysis procedures, recommendations and development of protocols for analysis based on these procedures, and a description of the limitations and implementation requirements of the proposed protocols. Information for construction of the analysis protocols was obtained via survey of selected analytical laboratories with existing capability to perform unknown sample chemical analysis. Laboratories contacted included those of the Environmental Protection Agency (EPA), the Food and Drug Administration (FDA), the Federal Bureau of Investigation (FBI), the New Jersey State Forensic Department, the Virginia State Health Department, Battelle, and the 4th Civil Support Team (CST, Georgia). At each of the laboratories, site visits were conducted to discuss the respective analysis methods and procedures. From five of the laboratories, the EPA, FDA, FBI, Battelle, and the 4th CST, existing protocols for analysis of unknown samples were obtained and utilized in this effort. In conjunction with these sources, a literature search of scientific journals, texts, and other sources was conducted, including relevant information from the open literature on development of standardized analysis strategies. Based on the collected information from the above sources, separate standardized flowcharts detailing analysis methods and decision trees were constructed for three types of unknown samples, solids, liquids, and gases. Each flowchart was designed so that variable levels of characterization can be performed, from bulk properties to molecular structure, depending on the discretion of the analyst, and with optional methods, so that laboratories without the particular instrument cited in the flowchart could still used the protocol with one of the alternate instrumental methods. For increased sample throughput, the protocols allow for any sample intelligence to assist in determining the proper analysis path, and have an innate screening capability with the tiered analysis to limit the need for unnecessary complex analyses. Methods included in the flowcharts were based on commercially available instrumentation, and selected by their ability to facilitate flowchart decisions, compatibility with expected samples, and survey input. In order to maintain simplicity, the scope of the flowcharts was limited to general methodologies, and did not include detailed analytical methods, sample handling protocols, or sample specific procedures. The flowchart effectiveness was demonstrated using a series of diverse mock samples, as shown in the appendix.

ii
Table of Contents
EXECUTIVE SUMMARY ............................................................................................................ ii 1.0 INTRODUCTION .................................................................................................................1
1.1 Scope of Work .............................................................................................................1
2.0 APPROACH ..........................................................................................................................2 2.1 Information Gathering ..................................................................................................2 2.2 Flowchart Construction – Key Elements ......................................................................3 2.3 Flowchart Construction – Scope Limitations................................................................6 2.4 Flowcharts Construction – Selection of the Most Appropriate Methodologies............7 2.5 Throughput and Capacity..............................................................................................7 2.6 Staffing..........................................................................................................................8
3.0 CONCLUSIONS....................................................................................................................8 4.0 RECOMMENDATIONS.....................................................................................................19 5.0 REFERENCES ....................................................................................................................20 APPENDIX A Samples of Flowchart Utilization APPENDIX B List of Acronyms
List of Tables Table 1 Flowchart Guide for Liquids..................................................................................10 Table 2 Flowchart Guide for Solids....................................................................................14 Table 3 Flowchart Guide for Gas........................................................................................18
List of Figures Figure 1 Unknown Liquid Analysis Procedure......................................................................9 Figure 2 Unknown Solid Analysis Procedure ......................................................................13 Figure 3 Unknown Gas Analysis Procedure ........................................................................17 Figure 4 Superscript Key for All Flowcharts .......................................................................19

1
1.0 INTRODUCTION
In 1998, the Centers for Disease Control and Prevention (CDC), the Federal Bureau of Investigation (FBI), and the Association of Public Health Laboratories (APHL) set up a laboratory response network (LRN) to react to bioterrorism. The network consists of four tiers of labs performing progressively sophisticated tests for infectious organisms. The LRN was tested during the anthrax outbreak in 2001 and was found to be a valid response structure. However, the CDC recognized the lack of preparedness by public health laboratories to respond to chemical terrorism events. While a good number of state public health laboratories have adequate capability to perform biological analyses on terrorist-related samples, most of these laboratories do not have adequate experience or instrument capability to analyze samples for their chemical content. In recognition of this deficiency, the CDC has tasked Battelle to develop a standardized protocol for the chemical analysis of unknown samples.
For clarity, the term “unknown sample” used throughout this document refers to a laboratory sample that has been analyzed and shown not to contain detectable levels of Chemical Weapons Convention (CWC) Schedule 1 compounds. 1.1 Scope of Work
The purpose of this task is to identify and evaluate current scientific understanding and approaches concerning the chemical analysis of unknown samples. Battelle researched existing protocols through information gathering and constructed flowcharts for the standardized assessment of unknown liquid, solid, and gas samples to cover all likely or potential chemical hazards. The protocol is applicable to a wide range of laboratories from routine to forensic laboratories that can apply optional methodologies depending on their capabilities. Recommendations are made regarding the necessary and optional equipment and required staffing. Rough estimates of likely capacity and throughput were attempted. While identification of unknowns in varied matrices is a difficult task, Battelle has attempted to present a systematic approach to detecting a wide range of toxic substances at levels that are protective of human health.
The Division of Laboratory Sciences (DLS) specifically instructed the work to include the following:
• Summary of current practices related to evaluation of unknown chemical samples • Specific recommendations including flow diagrams, necessary equipment and required
staffing to accomplish chemical screening of unknown samples • Description of likely throughput and capacity given the specific recommendations • Limitations of the suggested approach

2
2.0 APPROACH
This development effort consisted of two major tasks: 1) information collection, and 2) analysis flowchart construction. Information gathering involved visiting sites and obtaining existing analysis protocols and pertinent information in the open literature. Flowchart construction involved identifying key flowchart elements, scope limitations, and pertinent methodologies, then designing a decision-tree flowchart using Visio software. Flowchart guides were generated as supplements to the flowcharts in order to reveal the utility and limitations of the selected methodologies, and the logic used in designing the general layout of the flowcharts. Each of the development activities is discussed in more detail in subsequent text.
2.1 Information Gathering
A number of analytical laboratories throughout the world have the capability and expertise to perform effective chemical analysis of unknown samples. While most of these laboratories could have served as an effective resource for this effort, time and funding did not allow site visits or extensive communications with more than a handful of laboratories. This development effort focused on the analytical practices of the Environmental Protection Agency (EPA), the Food and Drug Administration (FDA), the FBI, the New Jersey State Forensic Department, the Virginia State Health Department, Battelle, and the 4th Civil Support Team (CST). It was believed that the information collected from select laboratories within each of these Federal, State, and private organizations would adequately represent the variety of practices of the larger analytical community.
2.1.1 Site Visits
Site visits were carried out with each of the selected organizations. Discussions with subject matter experts (SMEs) included the types of samples typically analyzed by each laboratory, the utility of specific methodologies and/or instrumentation, typical analysis goals, sample receipt scenarios, and reporting deliverables. Information on each of these topics was collected and considered in designing the analysis flowcharts.
2.1.2 Existing Protocols
Existing protocols for the analysis of unknown samples were provided by the EPA, the FDA, the FBI, Battelle, and the 4th CST. An extensive evaluation of each of the protocols was performed. While each laboratory displayed its own specific capabilities, expertise, professional bias, and analytical function, some elements of which were not directly aligned with the scope of this development effort, the practices most prudent to this effort were extracted and utilized in the flowchart construction.

3
2.1.3 Literature Search
Literature was obtained from a variety of sources, including reputable internet sites, refereed scientific journals, and texts. Pertinent information was collected regarding the utilization of specific analytical techniques for the range of sample compositions and analyses expected within the scope of this effort. Information was also obtained in the open literature regarding the development (by organizations not directly targeted in this effort) of standardized strategies for the analysis of unknown samples. The technical knowledge gained from each of these references was used to assist in the final selection of methods for the flowcharts. 2.2 Flowchart Construction - Key Elements
In order to generate analysis flowcharts that would effectively serve the intended purpose of the development effort, it was necessary to clearly identify the desired flowchart elements. These elements include segregation by sample type, optional levels of characterization, optional methodologies, screening and confirmation-type tests, and the use of site/intelligence information to steer the analysis path. Each of these key elements was incorporated in the flowcharts, as is described in subsequent paragraphs.
2.2.1 Sample Types
The specific types of samples considered in this effort include solids, liquids, and gases. The solid category includes powder or crystalline substances as well as semi-solids such as pastes and gels. The liquid samples include aqueous and organic single-phase systems as well as multiple-phased systems such as emulsions. The gas category includes both organic and inorganic gases, and the solid or liquid media on which the gas samples may be collected. Separate flowcharts were generated for each of these three main categories (solid, liquid, gas).
2.2.2 Different Levels of Chemical Characterization
A given terrorist-related sample analysis scenario could potentially involve any of a number of levels of characterization. The flowcharts developed in this effort attempt to accommodate three basic levels of characterization: 1) bulk properties, and/or 2) chemical class and/or 3) exact molecular structure of one or more chemical components in the unknown sample. The level of characterization ultimately applied to a given sample will depend largely on the type of chemical information desired.
The liquid analysis flowchart (Figure 1) can be used to demonstrate the utility of having optional levels of characterization. Starting from the top center of the flowchart and working down, it is evident that, at a minimum, an unknown liquid will be examined for multiple layers and particulate material, then tested for pH (if aqueous) and corrosivity (if high or low pH). This bulk property information may exclude the need to process the sample further. If additional characterization is deemed necessary, Fourier Transform infrared spectroscopy (FTIR) can be performed to reveal the functional groups (indicative of compound class) that may be present in the sample. The presence or absence of any specific organic functional groups (by FTIR) may end the characterization. The detection of multiple organic species (and complex FTIR spectra) may lead to the analysis of the sample by gas chromatography – mass spectrometry (GC-MS), where the exact molecular structure of one or more chemicals may be revealed.

4
A number of methodologies included in the flowchart, but not mentioned in the above
example, can be used to obtain bulk, class-specific, or structural chemical information about a particular sample. The flowchart guides, located after each of the flowcharts (Figures 1, 2, and 3) in this document, describe the utility of each of the methods (Tables 1, 2, and 3).
2.2.3 Optional Methodologies
The specific capabilities, experience, expertise, and scientific bias associated with any analysis laboratory will undoubtedly play a large role in the selection of the specific analysis strategy for a given analysis scenario. While common capabilities may exist between participating laboratories, it is likely that each laboratory will also have a distinct selection of analytical capabilities and a bias toward particular analytical techniques. In order to provide the greatest potential for each laboratory to successfully carry out the desired chemical characterization, a list of optional methods (noted with a superscript) was incorporated into the flowcharts (see Figure 4 for a key).
The number “1” superscripted above inductively coupled plasma – mass spectrometry (ICP-MS) in the liquid (Figure 1) and solid (Figure 2) analysis flowcharts refers to any of a number of alternative methods, including inductively coupled plasma – atomic emission spectroscopy (ICP-AES), graphite furnace atomic absorption (GFAA), or flame atomic absorption (AA). While each of the alternative methods has limitations in sensitivity or the number of elements that can be observed simultaneously, these methods can serve as legitimate alternatives to ICP-MS for elemental analysis of liquid/dissolved solid samples.
The superscript “2” above the GC-MS technique in all three flowcharts (Figures 1–3) refers to GC-based methods employing a detection system other than MS. One alternative technique is gas chromatography-nitrogen phosphorous detector (GC-NPD), which can be used to selectively detect compounds containing nitrogen and/or phosphorus. A second alternative is gas chromatography-electron capture detector GC-ECD. With this detector, compounds possessing one or more electron withdrawing groups (halogens, nitro) can be selectively detected. The third alternative to GC-MS referenced in the flowcharts is gas chromatography-flame photometric detector (GC-FPD) (or pulsed FPD [PFPD]). This detector is capable of selectively monitoring compounds that contain sulfur and/or phosphorus. While none of the alternative techniques can provide the detailed chemical structure information that MS detection can, these techniques may provide greater sensitivity and/or selectivity (versus MS) for specific types of molecules. Depending upon the analysis goals, an alternative technique may be the most appropriate analysis methodology.
Superscript “3” above the ion chromatography (IC) method in the liquid and solid flowcharts (Figures 1 & 2) refers to capillary electrophoresis (CE) as the alternative liquid-based separation technique. Utilizing the appropriate buffer/background electrolyte system, a commercial CE-UV system can be used to monitor (by indirect UV) a variety of inorganic ions in solution. CE-UV provides a fast, but often less sensitive, alternative to IC.
5
The subscript “4” over liquid chromatography – mass spectrometry (LC-MS[-MS]) (electrospray interface [ESI]) in the liquid and solid flowcharts refers to the option of using liquid chromatography – ultraviolet detection (LC-UV) to simply determine if the sample contains a chromophore (light-absorbing group). Alternatively, LC-MS can be carried out with a particle beam interface. Although this technology has not received much attention over the last 10 years, it does present the laboratory with the electron impact ionization spectra required to perform a library search of LC-MS peaks.
The number “5” superscripted above FTIR in the liquid and solid flowcharts (Figures 1 and 2) denotes the potential to use FT-Raman spectroscopy as an alternative technique to FTIR. FT-Raman also provides information about chemical functional groups present in the samples, and in many cases provides complimentary information to FTIR spectra. While some laboratories are fortunate enough to possess FTIR and FT-Raman instruments, more commonly, a laboratory will have one or the other.
2.2.4 Screening and Confirmation Analyses
Some unknown sample analysis scenarios may involve screening of a relatively large number of samples in order to determine the presence (or absence) of a particular chemical or suite of chemicals. Since time and resource limitations may present major constraints under this type of analysis request, the utilization of rapid and/or inexpensive screening methodologies may be the most feasible first-phase analysis strategy. Consequently, the identification of samples of interest from the screening phase may require the use of a secondary analysis strategy to confirm the (possibly less specific or less sensitive) screening results. The flowcharts presented in this report attempt to accommodate both screening and confirmation needs.
The liquid and solid analysis flowcharts (Figures 1 and 2) contain classical screening methods to detect heavy metals, common anions, and CN, most adequately in aqueous systems. In cases where the sample screening results are negative, the characterization may be complete. In cases where one or more of the screening tests yield positive results, it may be necessary to determine the exact ion by the use of a confirmation technique such as ICP-MS or IC.
2.2.5 Intelligence Information
During a terrorist event, any combination of local, state, or federal organizations can
potentially serve as first or second responders. Ideally, critical information (symptoms of victims, odors, etc.) is collected from these early responders and may assist in identifying the best strategy for sample analysis. The current version of the flowcharts does not include a list of symptoms or physical observations that may be collected during or after a terrorist event. The flowchart simply prompts the analysis laboratory to apply the information learned from the early responders in deciding the most appropriate options for analyses. In cases where no helpful site information is collected from a terrorist event, and sample quantity allows a shotgun approach (many analytical techniques) can be applied to the sample to determine its identity.

6
2.3 Flowchart Construction – Scope Limitations
Given the complexity of this development task and the tendency for scope boundaries to be inadvertently crossed, it was necessary to clarify the scope limitations of the effort. The main elements used to define the scope relate to 1) the specific parts of a sample to be characterized, 2) sample handling (particularly mixed-threat samples), and 3) level of methodology detail. Each of these topics is discussed in subsequent paragraphs. It is important for the reader to clearly understand the scope limitations, as the flowcharts provided in this document stay strictly within the defined scope.
2.3.1 Characterization of Particular Sample Components
A wide variety of potential sample configurations may be encountered in a terrorist-related event. Solid and/or liquid chemicals may be present on otherwise innocuous substrates such as paper, glass, or plastic. While some rare instances may require the analysis of the substrate or container on/in which the active chemicals are present/contained, the scope of this effort does not extend to the analysis of such substrates. This effort focuses solely on the chemical substances that may be in contact with a given substrate.
A relatively realistic example of a sample with two physical components, only one of which is typically of interest to the investigators, would be a liquid contained in a glass vial. Since the liquid is assumed to be the potential health threat (chemical agent) in this scenario, all analyses will be focused on determining the identity of the liquid. While the particular type of glass used to contain the sample may be analytically useful information, these flowcharts do not provide guidance on the analysis of the vial.
2.3.2 Sample Handling (Mixed-Threat Samples)
In any chemical, biological, or radiological sample analysis scenario the risk of exposure
to dangerous levels of reactive material exists. Laboratories that are qualified to receive such samples have protocols in place to provide maximum safety to staff when handling, preparing, and analyzing the samples. The analysis protocol developed in this effort is designed to deal with samples that have already been processed and analyzed specifically for CWC Schedule 1 compounds. As such, the sample(s) that ultimately get submitted for analysis by the protocol generated in this effort would have already been determined to be absent of harmful levels of these compounds.
2.3.3 Methodology Detail
Given the wide variety of instruments and laboratory equipment that could potentially be
utilized in the analysis of unknown samples, and given the unlimited number of potential interferences present in the samples that may affect the analytical result, it becomes a significant task to identify method specifications that could be applied to any particular analysis. Realizing the level of effort required to provide detailed analytical protocol, the scope of this effort was intentionally limited to providing a set of general methodologies for laboratories to utilize during the chemical analysis of unknown samples.

7
2.4 Flowchart Construction – Selection of Most Appropriate Methodologies
A wide number of analytical technologies that are commercially available are routinely utilized by the larger scientific community to gather chemical information about samples. It was not the intent of this effort to present an exhaustive list of these technologies. The analytical methodologies included in the analysis flowcharts were selected based upon their ability to provide the basic chemical information required to meet the overall analysis objectives or to appropriately steer the direction of additional chemical analyses. Input from SMEs, commercial availability of required equipment, documented successes, and anticipated sample types all factored into the selection process. Additionally, a variety of mock samples were conceptually run through the flowcharts to demonstrate the effectiveness of the selected methods. Appendix A provides examples of select mock analysis scenarios.
The flowcharts do not include new technologies or hyphenated techniques whose utility has not been proven or generally accepted in the larger scientific community. While some of the methodologies may be regarded as either dated or advanced (by different laboratories), it is believed that the methods selected for these flowcharts provide reasonable options for determining the chemical identity of a variety of samples resulting from a terrorist event.
It is realized that a number of analytical tests will have already been carried out in the initial threat assessment of a given sample prior to its classification as an unknown sample. However, a prediction of the specific analytical activities that may be performed by a given stationary or mobile laboratory in response to a terrorist event is beyond the scope of this effort. In the event that a sample has undergone a fairly extensive chemical evaluation prior to being considered an unknown, the flowcharts can effectively be used to highlight any gaps in the original analyses and provide chemical information that is complimentary to the original results. 2.5 Throughput and Capacity
The throughput and capacity of a laboratory capable of analyzing unknown samples is highly variable depending on the staff and instrumentation available. For the well-equipped lab with a highly capable staff, the identification of a single unknown in a single sample matrix can require one to two weeks. If confirmation by more than one spectroscopic method with an authentic standard is necessary, more time may be necessary. However, if the concentration level of the contaminant is high and the analysis of the unknown is amenable to a definitive technique, identification may be determined quickly, in 2 to 3 hours. Also, once an unknown is identified in one sample, screening other samples for its presence can be accomplished in large batches as a routine procedure. Simple screening techniques produce the largest throughput. Over 100 samples can be screened by a single technician, but they require a definitive method for confirmation. Of the definitive methods, ICP-AES and ICP-MS are potentially the most productive methods. With run times of 3 to 5 minutes, an ICP in a high production laboratory can analyze over 200 samples in a 12-hour period. For some GC-MS methods, preparation and analysis of 20 or fewer samples may require 24 hours. Therefore, the prediction of throughput and capacity for the analysis of unknowns is almost impossible.
8
2.6 Staffing
Due to the nature of the analysis of unknowns, all staff from technicians and analysts to technical manager must be highly experienced in the art of chemical identification. Since each method, from screening techniques to nuclear magnetic resonance (NMR), yields a variety of pieces to a complex puzzle, all participating individuals must be observant, analytical, and communicative. They also must be willing to work as a team, and all staff must have good writing and communication skills. An unknown identification team should consist of two to three sample preparation technicians, two to three junior analysts, two to three senior analysts and one technical manager. A minimum education level of a bachelor’s degree, preferably in chemistry, is recommended for all staff, including technicians. Junior analysts should have 2 to 10 years of instrumental analysis experience. Senior analysts should have 10 or more years of experience in one or more definitive instruments. Ideally, all analysts should be cross-trained in as many instruments as possible. Doctoral or master’s level analytical chemists are recommended for spectral interpretation roles. The technical director should have a broad background in all aspects of analytical chemistry, both organic and inorganic, and should be knowledgeable in the interpretations of all forms of spectrometric analysis. It is important for the technical director and all staff to be able to pull together data from a variety of sources and unify the salient features to present a consistent, confirmed identification. 3.0 CONCLUSIONS
A series of flowcharts has been developed for the analysis of unknown samples. The
flowcharts contain the identified key elements and stay within the specified scope of the effort. The current version of the flowcharts contains the appropriate level of detail to give the participating laboratories an idea of the variety of analytical tools and expertise required to carry out chemical analysis of terrorist samples. The flowcharts highlight the types of chemical information that can be obtained through each of the analyses, but they do not attempt to accommodate every possible analysis scenario that may result from a terrorist event. The combination of flowcharts and the flowchart guide provide a sound reference that can be used to assist state health laboratories in extracting chemical information from a variety of sample types.
Figure 1 is a flowchart designed to accommodate the analysis of unknown liquid samples that may be composed of high or trace levels of one or more of the following non-volatile, semi-volatile, or volatile substances: organic solvent, water, dissolved inorganic material, dissolved organic material, inorganic acids, and inorganic bases.

9
Identify which analyticaltargets are most likely,
based upon first responderobservations, analytical
results, and /or intelligenceinformation
No
Yes
Metals
Inorganicions/CN
Non-volatileorganics
Is liquid singlephase?
Does liquid containparticulate material?
No
Yes
Supernate
Yes
Yes
Yes
No
No
No
No
Examine liquid undermagnification optics
Perform FTIR5
Performmiscibility test
Separate phases
Place 1 drop on M8paper
Centrifuge or filtersample
Does liquid bead onpaper?
Place 1 drop onpH paper
Is pH <2 or >10?
Is FTIR spectraconclusive?
Need to confirm with secondarymethod or identify trace
chemicals?
Yes
Report library matchresults or functional
groups identified
Yes
Yes
No
No
Perform metaland/or dermalcorrosivity test
Is liquid corrosive?
Is furthercharacterization
necessary?
Classify sample ascorrosive acid or base
Perform common Anionand/or CN spot test
Need secondaryconfirmation?
Perform IC3
Perform Reinsch test(heavy metals)
Need secondaryconfirmation?
Perform ICP-MS1
Perform LC-MS(-MS)4
Volatile orsemi-volatiles
Perform GC-MS2
Solids to unknownsolids protocol
Or
Or
And/or
And/or
And/or
No FTIR?
Perform NMR
Single component
Figure 1. Unknown Liquid Analysis Procedure

10
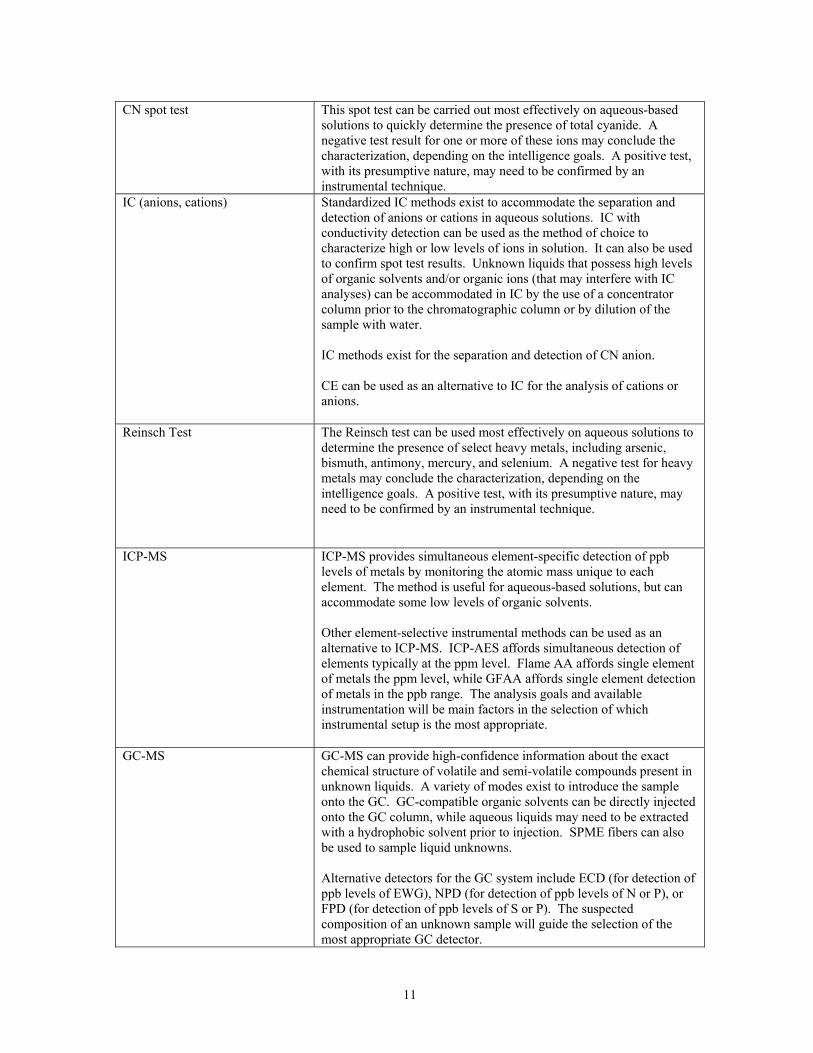
Table 1. Flowchart Guide for Liquids Activity/Analysis Logic/supporting comments
Magnification optics (magnifying glass or microscope)
Minimization of sample handling can promote the attainment of chemical information. Examination of the liquid with magnification optics will assist in determining the need to centrifuge or filter the sample if particulate material is present.
M8 paper Bulk characterization of the liquid material as organic or aqueous will assist greatly in the selection of additional analyses. Although this paper was designed to detect chemical agent, it is not used in this capacity in the liquid flowchart.
pH test (paper) Bulk characterization of the liquid material as basic, acidic, or neutral will assist in the selection of additional analyses. Since the presence of significant amounts of organic materials makes the pH value meaningless, the pH test is limited to samples that are composed of mostly water. The actual pH value obtained may reveal the need to terminate characterization, as a suspect target compound may not be stable under acidic or basic conditions.
Corrosivity test Liquids that possess a pH greater than 10 or less than 2 may have corrosive properties. The classification of a substance as corrosive, either by a metal or dermal test, may result in termination of the characterization, as very few organic (potential target) materials are stable under extreme pH conditions. The corrosivity test results will also assist in handling of the samples and the selection of compatible analyses.
Miscibility test A number of solvents can be used in an attempt to dissolve the unknown organic liquid. The successful solvation of the liquid in a polar or nonpolar solvent provides an indication of the polarity of the liquid. Water-soluble organics will have different analysis requirements/compatibilities relative to hydrophobic organics. The polarity is an important aspect in selecting feasible additional analyses.
FTIR The placement of a single drop of liquid on an FTIR ATR crystal can reveal the bulk composition of a liquid by the functional groups of the liquid molecules and, potentially, the presence of other inorganic or organic materials at wt% or higher levels. Library match capabilities add additional value to this type of characterization. Evaporation of the liquid portion of the sample can reveal the presence of any dissolved chemical solids, which can then be examined by FTIR.
NMR The most effective utility of NMR is with samples that are simple chemically. NMR can be used in conjunction with FTIR to confirm the identity of a liquid whose purity is relatively high, or with a limited number of high-level components.
Anion spot tests Spot tests can be carried out most effectively on aqueous-based solutions to quickly determine the presence of common inorganic anions such as nitrate, chlorate, bromate, chloride, and sulfate. A negative test result for one or more of these ions may conclude the characterization, depending on the intelligence goals. A positive test, with its presumptive nature, may need to be confirmed by an instrumental technique.
11
CN spot test This spot test can be carried out most effectively on aqueous-based
solutions to quickly determine the presence of total cyanide. A negative test result for one or more of these ions may conclude the characterization, depending on the intelligence goals. A positive test, with its presumptive nature, may need to be confirmed by an instrumental technique.
IC (anions, cations) Standardized IC methods exist to accommodate the separation and detection of anions or cations in aqueous solutions. IC with conductivity detection can be used as the method of choice to characterize high or low levels of ions in solution. It can also be used to confirm spot test results. Unknown liquids that possess high levels of organic solvents and/or organic ions (that may interfere with IC analyses) can be accommodated in IC by the use of a concentrator column prior to the chromatographic column or by dilution of the sample with water. IC methods exist for the separation and detection of CN anion. CE can be used as an alternative to IC for the analysis of cations or anions.
Reinsch Test The Reinsch test can be used most effectively on aqueous solutions to determine the presence of select heavy metals, including arsenic, bismuth, antimony, mercury, and selenium. A negative test for heavy metals may conclude the characterization, depending on the intelligence goals. A positive test, with its presumptive nature, may need to be confirmed by an instrumental technique.
ICP-MS ICP-MS provides simultaneous element-specific detection of ppb levels of metals by monitoring the atomic mass unique to each element. The method is useful for aqueous-based solutions, but can accommodate some low levels of organic solvents. Other element-selective instrumental methods can be used as an alternative to ICP-MS. ICP-AES affords simultaneous detection of elements typically at the ppm level. Flame AA affords single element of metals the ppm level, while GFAA affords single element detection of metals in the ppb range. The analysis goals and available instrumentation will be main factors in the selection of which instrumental setup is the most appropriate.
GC-MS GC-MS can provide high-confidence information about the exact chemical structure of volatile and semi-volatile compounds present in unknown liquids. A variety of modes exist to introduce the sample onto the GC. GC-compatible organic solvents can be directly injected onto the GC column, while aqueous liquids may need to be extracted with a hydrophobic solvent prior to injection. SPME fibers can also be used to sample liquid unknowns. Alternative detectors for the GC system include ECD (for detection of ppb levels of EWG), NPD (for detection of ppb levels of N or P), or FPD (for detection of ppb levels of S or P). The suspected composition of an unknown sample will guide the selection of the most appropriate GC detector.

12
LC-ESI-MS (-MS) LC-ESI-MS can be used to detect nonvolatile species present in an
unknown liquid. While no mass spectral libraries exist based upon electrospray ionization, this technique can be used to determine the molecular weight of sample components. LC-ESI-MS-MS provides a means of fragmenting select molecules in a sample in order to assist in the manual determination of exact chemical structure. If the analysis goals simply involve the determination of the presence of chromophores in and unknown liquid, LC-UV provides detection typically of ppm levels of compounds containing one or more chromophores. The absence of chromophores in a sample may terminate characterization, while the presence of a chromophore may require analysis of the sample by LC-MS (-MS).

13
Figure 2 is a flowchart designed to accommodate the analysis of unknown solid samples that may be composed of high or trace levels of volatile, semi-volatile, or non-volatile organic and/or inorganic materials.
Identify which analyticaltargets are most likely,
based upon first responderobservations and/or
intelligence information
No
Metals
Inorganicions/CN
Non-volatileorganics
Perform common Anionand/or CN spot test
Need secondaryconfirmation?
Perform IC3
Perform Reinsch test(heavy metals)
Need secondaryconfirmation?
Perform ICP-MS1
Perform LC-MS(-MS)4
Volatile orsemi-volatiles
Perform GC-MS2
No
Perform chemicaltests to determinecompound class
Adequate results?
Yes
Report Chemicalclass of
compound
No
No
Is sample visiblyhomogeneous?
Examine solid undermagnification optics
Perform FTIR5
Yes
Perform solubilitytests
And
Is solid watersoluble?
Measure pH
Save solutionfor additional
analyses
Save organicsolution foradditionalanalyses
No
Yes
Yes
No
Is FTIR spectraconclusive?
Need to confirm with secondarymethod or identify trace
chemicals?
Yes
Report library matchresults or functional
groups identified
Perfrom one or more of the followingnon-chromatographic techniques based
upon laboratory capabilities, samplecharacteristics, and suspected sample
identity
Or
XRD(crystalline solid)
SEM/EDS(crystalline or powder)
NMR(soluble material)
TGA/DSC(Polymer or other)
Further characterizationnecessary? Yes
No FTIR
Or
Or
And/or
And/or
And/or
Or
Figure 2. Unknown Solid Analysis Procedure
14
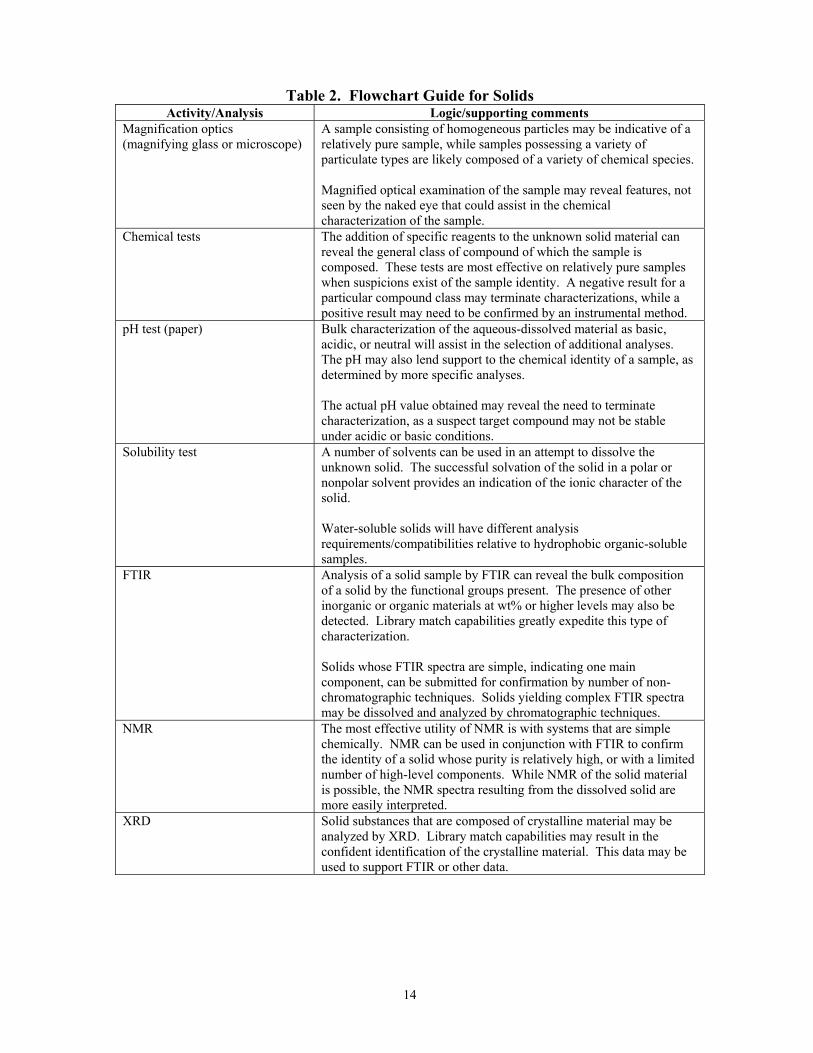
Table 2. Flowchart Guide for Solids Activity/Analysis Logic/supporting comments
Magnification optics (magnifying glass or microscope)
A sample consisting of homogeneous particles may be indicative of a relatively pure sample, while samples possessing a variety of particulate types are likely composed of a variety of chemical species. Magnified optical examination of the sample may reveal features, not seen by the naked eye that could assist in the chemical characterization of the sample.
Chemical tests The addition of specific reagents to the unknown solid material can reveal the general class of compound of which the sample is composed. These tests are most effective on relatively pure samples when suspicions exist of the sample identity. A negative result for a particular compound class may terminate characterizations, while a positive result may need to be confirmed by an instrumental method.
pH test (paper) Bulk characterization of the aqueous-dissolved material as basic, acidic, or neutral will assist in the selection of additional analyses. The pH may also lend support to the chemical identity of a sample, as determined by more specific analyses. The actual pH value obtained may reveal the need to terminate characterization, as a suspect target compound may not be stable under acidic or basic conditions.
Solubility test A number of solvents can be used in an attempt to dissolve the unknown solid. The successful solvation of the solid in a polar or nonpolar solvent provides an indication of the ionic character of the solid. Water-soluble solids will have different analysis requirements/compatibilities relative to hydrophobic organic-soluble samples.
FTIR Analysis of a solid sample by FTIR can reveal the bulk composition of a solid by the functional groups present. The presence of other inorganic or organic materials at wt% or higher levels may also be detected. Library match capabilities greatly expedite this type of characterization. Solids whose FTIR spectra are simple, indicating one main component, can be submitted for confirmation by number of non-chromatographic techniques. Solids yielding complex FTIR spectra may be dissolved and analyzed by chromatographic techniques.
NMR The most effective utility of NMR is with systems that are simple chemically. NMR can be used in conjunction with FTIR to confirm the identity of a solid whose purity is relatively high, or with a limited number of high-level components. While NMR of the solid material is possible, the NMR spectra resulting from the dissolved solid are more easily interpreted.
XRD Solid substances that are composed of crystalline material may be analyzed by XRD. Library match capabilities may result in the confident identification of the crystalline material. This data may be used to support FTIR or other data.

15
SEM/EDS The elemental composition of the solid can be determined by
SEM/EDS. The functional group and/or molecular structure information determined by other techniques can be compared with the elemental composition determined with SEM/EDS This information can be used to support the identity of a substance.
TGA/DSC The controlled application of heat to an unknown solid can reveal a variety of physical, thermodynamic, and kinetic information about the solid. TGA and/or DSC can be used to assist in the characterization of organic and/or inorganic materials, as data from each of these methods is typically not stand-alone.
Anion spot tests Spot tests can be carried out most effectively on aqueous-based solutions to quickly determine the presence of common inorganic anions such as nitrate, chlorate, bromate, chloride, and sulfate. A negative test result for one or more of these ions may conclude the characterization, depending on the intelligence goals. A positive test, with its presumptive nature, may need to be confirmed by an instrumental technique.
CN spot test This spot test can be carried out most effectively on aqueous-based solutions to quickly determine the presence of total cyanide. A negative test result for one or more of these ions may conclude the characterization, depending on the intelligence goals. A positive test, with its presumptive nature, may need to be confirmed by an instrumental technique.
IC (anions, cations) Standardized IC methods exist to accommodate the separation and detection of anions or cations in aqueous solutions. IC with conductivity detection can be used as the method of choice to characterize high or low levels of ions in solution. It can also be used to confirm spot test results. Unknown solids that are soluble in organic solvents can be accommodated in IC by the use of a concentrator column prior to the chromatographic column. IC methods exist for the separation and detection of CN anion. CE can be used as an alternative to IC for the analysis of cations or anions.
Reinsch Test The Reinsch test can be used most effectively on aqueous solutions to determine the presence of select heavy metals, including arsenic, bismuth, antimony, mercury, and selenium. A negative test for heavy metals may conclude the characterization, depending on the intelligence goals. A positive test, with its presumptive nature, may need to be confirmed by an instrumental technique.
ICP-MS ICP-MS provides simultaneous element-specific detection of ppb levels of metals by detecting the atomic mass unique to each element. The method is useful for aqueous-based solutions but can accommodate low levels of some organic solvents. Other element-selective instrumental methods can be used as an alternative to ICP-MS. ICP-AES affords simultaneous detection of elements typically at the ppm level. Flame AA affords single element detection of metals at the ppm level, while GFAA affords single element detection of metals in the ppb range. The analysis goals and available instrumentation will be main factors in the selection of which instrumental setup is the most appropriate.

16
GC-MS GC-MS can provide high-confidence information about the exact
chemical structure of volatile and semi-volatile compounds present in unknown solids. A variety of modes exist to introduce the sample onto the GC. Solids that are soluble in select organic solvents can be directly injected onto the GC column. Alternatively, the solid material can be heated and the headspace analyzed by GC. Alternative detectors for the GC system include ECD (for detection of ppb levels of EWG), NPD (for detection of ppb levels of N or P), or FPD (for detection of ppb levels of S or P). The suspected composition of an unknown sample will guide the selection of the most appropriate GC detector.
LC-ESI-MS (-MS) LC-ESI-MS can be used to detect nonvolatile species present in an unknown solid. While no mass spectral libraries exist based upon electrospray ionization, this technique can be used to determine the molecular weight of sample components. LC-ESI-MS-MS provides a means of fragmenting select molecules in a sample in order to allow the manual determination of exact chemical structure. If the analysis goals simply involve the determination of the presence of chromophores in and unknown solid, LC-UV provides detection typically of ppm levels of compounds containing one or more chromophores. The absence of chromophores in a sample may terminate characterization, while the presence of a chromophore may require analysis of the sample by LC-MS (-MS).

17
Figure 3 is a flowchart designed to accommodate the analysis of unknown gas samples that may have been collected as a volume of gas, onto a sorbent material (Tenax, Carboxen etc.) or trapped into a liquid via that use of an impinger tube.
Identify physicalform of sample
Containedgas?
Yes
Perform FTIRbubble through
water andmeasure pH
Resultsconclusive?
Report library matchresults or functional
groups identified
Perform GC-MS2
Yes
No
NoSorbent
material?Impinger
apparatus?
No FTIR
Sorbent tubeOthe
r sorb
ent
Perform headspace -GC-MS2
Or
Perform TD-GC-MS2
Organic extractionGC-MS2
Or
Yes
No
SPME or headspaceGC-MS2
Direct inject GC-MS2
And/or
Yes
Figure 3. Unknown Gas Analysis Procedure
18
Table 3. Flowchart Guide for Gas Activity/Analysis Logic/Supporting Comments
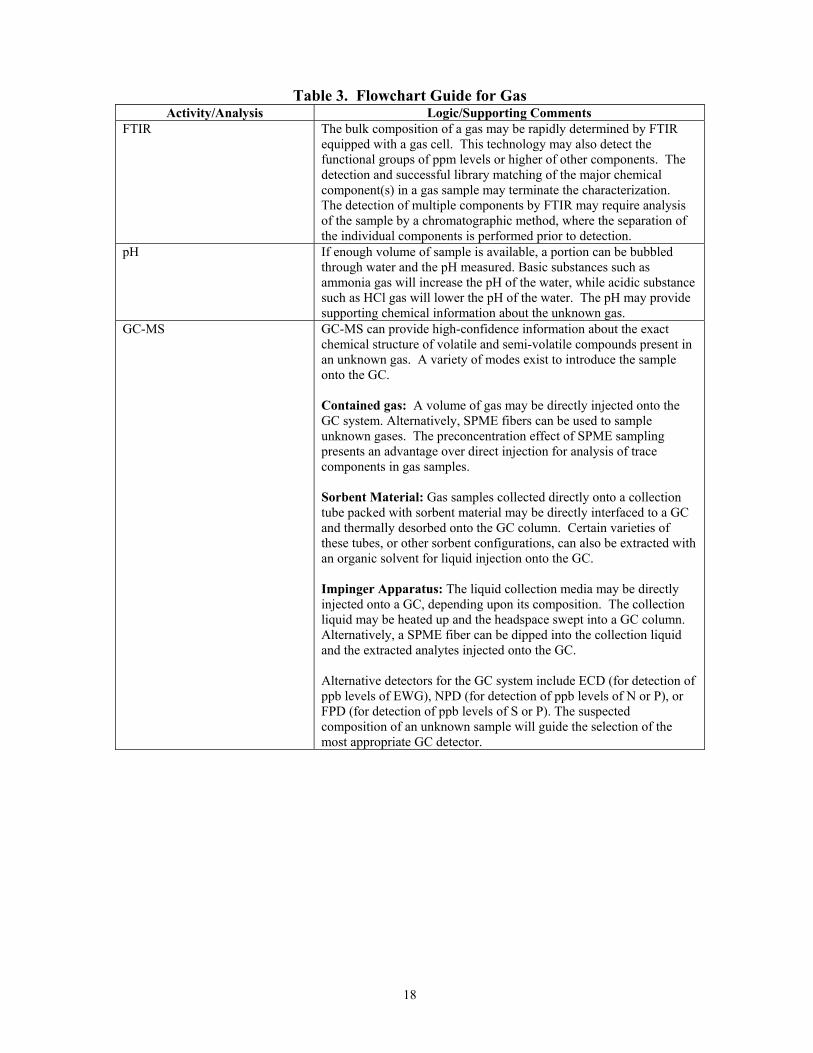
FTIR The bulk composition of a gas may be rapidly determined by FTIR equipped with a gas cell. This technology may also detect the functional groups of ppm levels or higher of other components. The detection and successful library matching of the major chemical component(s) in a gas sample may terminate the characterization. The detection of multiple components by FTIR may require analysis of the sample by a chromatographic method, where the separation of the individual components is performed prior to detection.
pH If enough volume of sample is available, a portion can be bubbled through water and the pH measured. Basic substances such as ammonia gas will increase the pH of the water, while acidic substance such as HCl gas will lower the pH of the water. The pH may provide supporting chemical information about the unknown gas.
GC-MS GC-MS can provide high-confidence information about the exact chemical structure of volatile and semi-volatile compounds present in an unknown gas. A variety of modes exist to introduce the sample onto the GC. Contained gas: A volume of gas may be directly injected onto the GC system. Alternatively, SPME fibers can be used to sample unknown gases. The preconcentration effect of SPME sampling presents an advantage over direct injection for analysis of trace components in gas samples. Sorbent Material: Gas samples collected directly onto a collection tube packed with sorbent material may be directly interfaced to a GC and thermally desorbed onto the GC column. Certain varieties of these tubes, or other sorbent configurations, can also be extracted with an organic solvent for liquid injection onto the GC. Impinger Apparatus: The liquid collection media may be directly injected onto a GC, depending upon its composition. The collection liquid may be heated up and the headspace swept into a GC column. Alternatively, a SPME fiber can be dipped into the collection liquid and the extracted analytes injected onto the GC. Alternative detectors for the GC system include ECD (for detection of ppb levels of EWG), NPD (for detection of ppb levels of N or P), or FPD (for detection of ppb levels of S or P). The suspected composition of an unknown sample will guide the selection of the most appropriate GC detector.

19
Alternative techniques
GC-ECD ppb levels of EWG (halogens, etc)GC-NPD ppb levels of N or P compoundsGC-FPD ppb levels of S or P compounds
ICP-AES (ppm, multielement)Flame (ppm single) or Graphite Furnace AA (ppb single)
CE-indirect UV
1
2
3LC-UV (chromaphores, ppm), LC-particle beam MS (library search, ppm)
FT-Raman (functional groups complimentary to FTIR)
4
5
Figure 4. Superscript Key for All Flowcharts 4.0 RECOMMENDATIONS
Review of the flowcharts and associated text by the NCEH and/or other scientific representatives likely will lead to a number of questions, issues, discussions, and suggestions regarding the utility of the flowcharts for the analysis of unknown samples. It is recommended that these communications be channeled through a focus group and evaluated so that appropriate changes can be made to the flowcharts.
Consideration should be given to including an additional level of detail to the flowcharts with respect to such details as sample preparation, method specifications, dealing with limited sample quantity, and the use of standard reference materials, specific instrumentation/accessories, and early responder information. Depending upon the level of expertise and analytical capability of the participating laboratories, this level of detail may be critical to the successful analysis of unknown samples.
Consideration should also be given to the development of analysis flowcharts that accommodate the processing and analysis of potentially complex matrices such as soil, vegetation, and food products, all of which represent legitimate sample types resulting from a terrorist event.

20
5.0 REFERENCES 1. Environmental Protection Agency, National ERT, Edison, NJ.
a. Main contact: Raj Singhvi b. Shared documents: NA
2. Environmental Protection Agency, National Enforcement Investigations Center, Denver,
CO. a. Main contact: NA b. Shared documents: Analytical Strategy for the Analysis of High Hazard Samples
3. Food and Drug Administration, Forensic Sciences Center, Cincinnati, OH
a. Main contact: Karen Wolnik, Dwane Satzger b. Shared documents:
1) General Analysis of Tampered and/or Adulterated Samples Utilizing the TravelIR FT-IR Spectrometer System 2) Guidance for Evaluation of Food, Drug and Cosmetic Products in Cases of Suspected Chemical Tampering 3) Initial Examination of Samples Related to Consumer Complaints and/or Product Tampering
4. Federal Bureau of Investigation, Chemistry Unit, Quantico, VA
a. Main contact: Marc Lebeau b. Shared documents: Identification of General Unknowns
5. NJ State Police, Forensic Sciences Bureau, Trenton, NJ
a. Main contact: Thomas Brettel b. Shared documents: NA
6. Department of General Services Division of Consolidated Laboratory Services, Richmond
VA. a. Main contact: Jim Pearson b. Shared documents: NA
7. NJ Department of Health Senior Services, Trenton, NJ.
a. Main contact: Stephen Jenniss b. Shared documents: NA
8. 4th Civil Support Team (Weapons of Mass Destruction) Dobbins Air Reserve Base, GA.
a. Main contact: CPT Robert J. Stuart b. Shared documents:
1) Mobile Analytical Laboratory System SOP 2) Analytical Laboratory System (ALS) System Enhancement Program (SEP)
Operating Guide

21
9. Seton Hall University, Department of Chemistry and Biochemistry, South Orange, NJ a. Main contact: Nicholas Snow b. Shared documents: NA
10. Battelle Memorial Institute, Headquarters, Columbus, OH
a. Main contact: Various b. Shared documents: Unknown analysis flowcharts designed for classified client
11. Center for Disease Control and Prevention, National Center for Environmental Health
Division of Laboratory Sciences, Atlanta, GA a. Main contact: Virlyn Burse (Battelle Employee) b. Shared documents: NA

Appendix A Samples of Flowchart Utilization
A-1
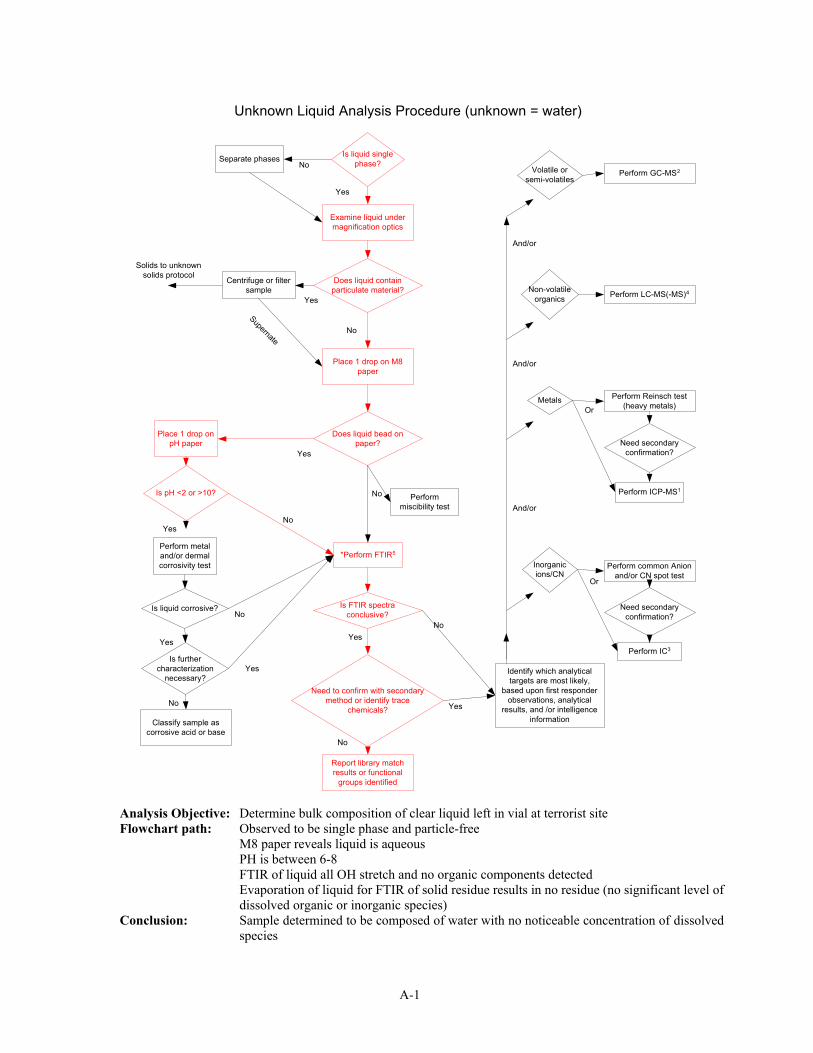
Unknown Liquid Analysis Procedure (unknown = water)
Identify which analyticaltargets are most likely,
based upon first responderobservations, analytical
results, and /or intelligenceinformation
No
Yes
Metals
Inorganicions/CN
Non-volatileorganics
Is liquid singlephase?
Does liquid containparticulate material?
No
Yes
Supernate
Yes
Yes
Yes
No
No
No
No
Examine liquid undermagnification optics
*Perform FTIR5
Performmiscibility test
Separate phases
Place 1 drop on M8paper
Centrifuge or filtersample
Does liquid bead onpaper?
Place 1 drop onpH paper
Is pH <2 or >10?
Is FTIR spectraconclusive?
Need to confirm with secondarymethod or identify trace
chemicals?
Yes
Report library matchresults or functional
groups identified
Yes
Yes
No
No
Perform metaland/or dermalcorrosivity test
Is liquid corrosive?
Is furthercharacterization
necessary?
Classify sample ascorrosive acid or base
Perform common Anionand/or CN spot test
Need secondaryconfirmation?
Perform IC3
Perform Reinsch test(heavy metals)
Need secondaryconfirmation?
Perform ICP-MS1
Perform LC-MS(-MS)4
Volatile orsemi-volatiles
Perform GC-MS2
Solids to unknownsolids protocol
Or
Or
And/or
And/or
And/or
Analysis Objective: Determine bulk composition of clear liquid left in vial at terrorist site Flowchart path: Observed to be single phase and particle-free M8 paper reveals liquid is aqueous PH is between 6-8 FTIR of liquid all OH stretch and no organic components detected
Evaporation of liquid for FTIR of solid residue results in no residue (no significant level of dissolved organic or inorganic species)
Conclusion: Sample determined to be composed of water with no noticeable concentration of dissolved species

A-2
Unknown Liquid Analysis Procedure (unknown is 6M HNO3)
Identify which analyticaltargets are most likely,
based upon first responderobservations, analytical
results, and /or intelligenceinformation
No
Yes
Metals
Inorganicions/CN
Non-volatileorganics
Is liquid singlephase?
Does liquid containparticulate material?
No
Yes
Supernate
Yes
Yes
Yes
No
No
No
No
Examine liquid undermagnification optics
*Perform FTIR5
Performmiscibility test
Separate phases
Place 1 drop on M8paper
Centrifuge or filtersample
Does liquid bead onpaper?
Place 1 drop onpH paper
Is pH <2 or >10?
Is FTIR spectraconclusive?
Need to confirm with secondarymethod or identify trace
chemicals?
Yes
Report library matchresults or functional
groups identified
Yes
Yes
No
No
Perform metaland/or dermalcorrosivity test
Is liquid corrosive?
Is furthercharacterization
necessary?
Classify sample ascorrosive acid or base
Perform common Anionand/or CN spot test
Need secondaryconfirmation?
Perform IC3
Perform Reinsch test(heavy metals)
Need secondaryconfirmation?
Perform ICP-MS1
Perform LC-MS(-MS)4
Volatile orsemi-volatiles
Perform GC-MS2
Solids to unknownsolids protocol
Or
Or
And/or
And/or
And/or
Analysis Objective: Determine bulk composition of clear liquid left in vial at terrorist site Flowchart path: Observed to be single phase and particle-free M8 paper reveals liquid is aqueous PH is < 2 Determined to be corrosive with metal test
FTIR reveals NO, NO3 absorption, and library match to HNO3 The presence of NO3 anion confirmed by IC
Conclusion: Sample determined to be an aqueous dilution of nitric acid

A-3
Unknown Liquid Analysis Procedure (Unknown is pesticide mix dissolved in acetone)
Identify which analyticaltargets are most likely,
based upon first responderobservations, analytical
results, and /or intelligenceinformation
No
Yes
Metals
Inorganicions/CN
Non-volatileorganics
Is liquid singlephase?
Does liquid containparticulate material?
No
Yes
Supernate
Yes
Yes
Yes
No
No
No
No
Examine liquid undermagnification optics
*Perform FTIR5
Performmiscibility test
Separate phases
Place 1 drop on M8paper
Centrifuge or filtersample
Does liquid bead onpaper?
Place 1 drop onpH paper
Is pH <2 or >10?
Is FTIR spectraconclusive?
Need to confirm with secondarymethod or identify trace
chemicals?
Yes
Report library matchresults or functional
groups identified
Yes
Yes
No
No
Perform metaland/or dermalcorrosivity test
Is liquid corrosive?
Is furthercharacterization
necessary?
Classify sample ascorrosive acid or base
Perform common Anionand/or CN spot test
Need secondaryconfirmation?
Perform IC3
Perform Reinsch test(heavy metals)
Need secondaryconfirmation?
Perform ICP-MS1
Perform LC-MS(-MS)4
Volatile orsemi-volatiles
Perform GC-MS2
Solids to unknownsolids protocol
Or
Or
And/or
And/or
And/or
Analysis Objective: Determine major chemical components of the liquid Flowchart path: Observed to be single phase and particle-free
M8 paper reveals liquid is organic FTIR reveals large carbonyl stretch (from acetone) and extra moderate level peaks GC-MS reveals three organic components all having good mass spectral matches to specific organophosphorous pesticides
Conclusion: Sample determined to be three different organophosphorous pesticides in acetone

A-4
Unknown Solid Analysis Procedure (unknown is Adamsite)
Identify which analyticaltargets are most likely,
based upon first responderobservations and /or
intelligence information
No
Metals
Inorganicions/CN
Non-volatileorganics
Perform common Anionand/or CN spot test
Need secondaryconfirmation?
Perform IC3
Perform Reinsch test(heavy metals)
Need secondaryconfirmation?
Perform ICP-MS1
Perform LC-MS(-MS)4
Volatile orsemi-volatiles
Perform GC-MS2
No
Perform chemicaltests to determinecompound class
Adequate results?
Yes
Report Chemicalclass of
compound
No
No
Is sample visiblyhomogeneous?
Examine solid undermagnification optics
*Perform FTIR5
Yes
Perform solubilitytests
And
Is solid watersoluble?
Measure pH
Save solutionfor additional
analyses
Save organicsolution foradditionalanalyses
No
Yes
Yes
No
Is FTIR spectraconclusive?
Need to confirm with secondarymethod or identify trace
chemicals?
Yes
Report library matchresults or functional
groups identified
Perfrom one or more of the followingnon-chromatographic techniques based
upon laboratory capabilities, samplecharacteristics, and suspected sample
identity
Or
XRD(crystalline solid)
SEM/EDS(crystalline or powder)
NMR(soluble material)
TGA/DSC(Polymer or other)
Further characterizationnecessary? Yes
No FTIR
Or
Or
And/or
And/or
And/or
Analysis Objective: Determine composition of yellow-green crystalline residue on nozzle of pressurized canister Flowchart path: Observed to be homogeneous particles readily soluble in acetone FTIR performed on solid, a number of functional groups identified, but no library match XRD reveals a library match with Adamsite
NMR of solid dissolved in deuterated acetone is consistent with Adamsite Conclusion: Sample determined to be Adamsite Comments: The analysis of this sample by GC-MS (common default method) would be useless if no
information was available to suggest that the sample might be Adamsite, and the need to derivatize before analyzing. Alternatively, attempts to analyze by LC would be cumbersome without an indication of the sample identity.

A-5
Unknown Solid Analysis Procedure (unknown is sodium cyanide)
Identify which analyticaltargets are most likely,
based upon first responderobservations and /or
intelligence information
No
Metals
Inorganicions/CN
Non-volatileorganics
Perform common Anionand/or CN spot test
Need secondaryconfirmation?
Perform IC3
Perform Reinsch test(heavy metals)
Need secondaryconfirmation?
Perform ICP-MS1
Perform LC-MS(-MS)4
Volatile orsemi-volatiles
Perform GC-MS2
No
Perform chemicaltests to determinecompound class
Adequate results?
Yes
Report Chemicalclass of
compound
No
No
Is sample visiblyhomogeneous?
Examine solid undermagnification optics
*Perform FTIR5
Yes
Perform solubilitytests
And
Is solid watersoluble?
Measure pH
Save solutionfor additional
analyses
Save organicsolution foradditionalanalyses
No
Yes
Yes
No
Is FTIR spectraconclusive?
Need to confirm with secondarymethod or identify trace
chemicals?
Yes
Report library matchresults or functional
groups identified
Perfrom one or more of the followingnon-chromatographic techniques based
upon laboratory capabilities, samplecharacteristics, and suspected sample
identity
Or
XRD(crystalline solid)
SEM/EDS(crystalline or powder)
NMR(soluble material)
TGA/DSC(Polymer or other)
Further characterizationnecessary? Yes
No FTIR
Or
Or
And/or
And/or
And/or
Analysis Objective: Determine composition of a powder found near a food preparation area (at terrorist site) Flowchart path: Observed to be homogeneous particles readily soluble in water and methanol
Analysis of the aqueous solution for common anions and CN using spot tests reveals the presence of CN and carbonate (clue that the powder might be a cyanide salt) IC confirms the detection of Na and CN by retention time matching with standard materials
Conclusion: Sample determined to be sodium cyanide Comments: The inability to perform a quick FTIR scan leads the laboratory to potentially carry out a
number of methods that would not yield any key chemical information about the sample: LC-MS-MS, metals testing, and GC-MS. The spot tests and IC are the only chemically informative techniques in this scenario.

Appendix B List of Acronyms
B-1
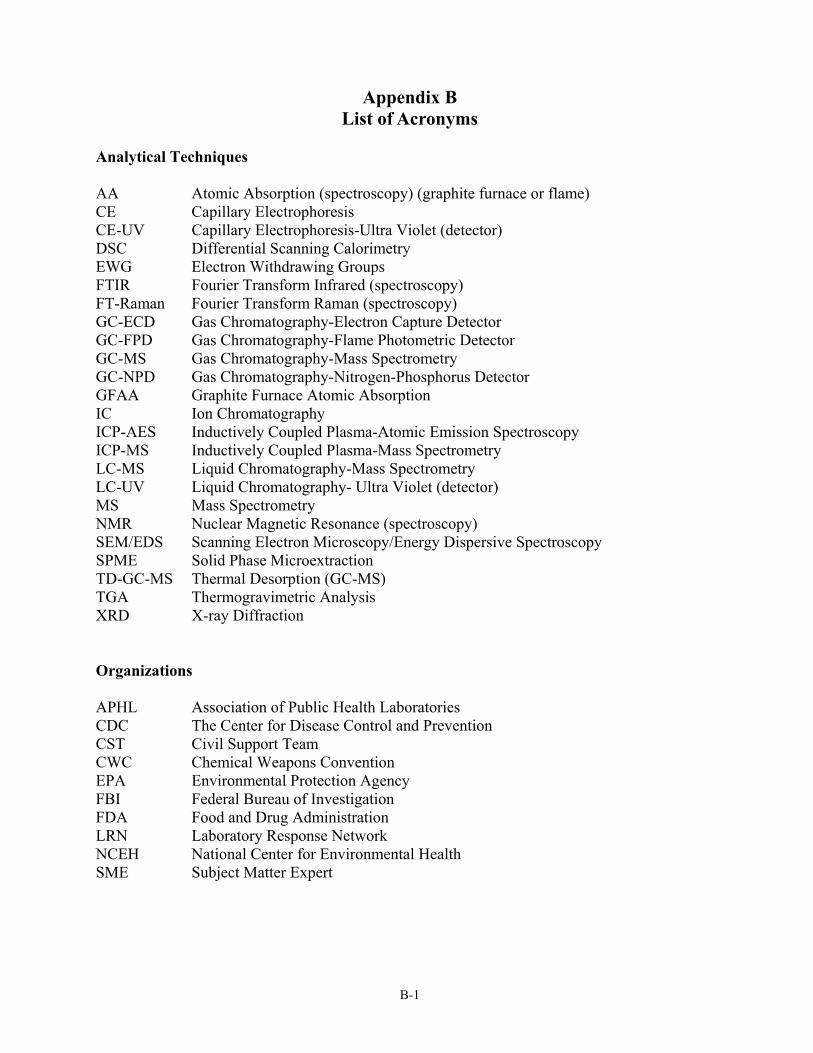
Appendix B List of Acronyms
Analytical Techniques AA Atomic Absorption (spectroscopy) (graphite furnace or flame) CE Capillary Electrophoresis CE-UV Capillary Electrophoresis-Ultra Violet (detector) DSC Differential Scanning Calorimetry EWG Electron Withdrawing Groups FTIR Fourier Transform Infrared (spectroscopy) FT-Raman Fourier Transform Raman (spectroscopy) GC-ECD Gas Chromatography-Electron Capture Detector GC-FPD Gas Chromatography-Flame Photometric Detector GC-MS Gas Chromatography-Mass Spectrometry GC-NPD Gas Chromatography-Nitrogen-Phosphorus Detector GFAA Graphite Furnace Atomic Absorption IC Ion Chromatography ICP-AES Inductively Coupled Plasma-Atomic Emission Spectroscopy ICP-MS Inductively Coupled Plasma-Mass Spectrometry LC-MS Liquid Chromatography-Mass Spectrometry LC-UV Liquid Chromatography- Ultra Violet (detector) MS Mass Spectrometry NMR Nuclear Magnetic Resonance (spectroscopy) SEM/EDS Scanning Electron Microscopy/Energy Dispersive Spectroscopy SPME Solid Phase Microextraction TD-GC-MS Thermal Desorption (GC-MS) TGA Thermogravimetric Analysis XRD X-ray Diffraction Organizations APHL Association of Public Health Laboratories CDC The Center for Disease Control and Prevention CST Civil Support Team CWC Chemical Weapons Convention EPA Environmental Protection Agency FBI Federal Bureau of Investigation FDA Food and Drug Administration LRN Laboratory Response Network NCEH National Center for Environmental Health SME Subject Matter Expert