Contouring pdf
68
Er Er Er Er. . . . Pramesh Pramesh Pramesh Pramesh Hada Hada Hada Hada B B BE E E C C Ci i iv v vi i il l l, , , M M MS S SC C C U U Ur r rb b ba a an n n p p pl l la a an n nn n ni i in n ng g g Assistant Professor Nepal Engineering College, Changunarayan,Bhaktapur By:- CHAPTER 7 Er. Pramesh Hada, Assistant Professor, nec 1
-
Upload
gokul-saud -
Category
Documents
-
view
7.221 -
download
16
Transcript of Contouring pdf

ErErErEr. . . . PrameshPrameshPrameshPramesh HadaHadaHadaHadaBBBBEEEE CCCCiiiivvvviiiillll,,,, MMMMSSSSCCCC UUUUrrrrbbbbaaaannnn ppppllllaaaannnnnnnniiiinnnnggggAssistant ProfessorNepal Engineering College,Changunarayan,Bhaktapur
By:-
CHAPTER 7
Er. Pramesh Hada, Assistant Professor, nec
1

Chapter 7. Contouring (4 hour)
• 7.1 Basic Definitions in Contouring –pu 2010
• 7.2 Contour Interval – pu 09,10,14
• 7.3 Characteristics of Contours – pu 08,09,10,11,13,14)
• 7.4 Methods of Contouring – pu 09,10,11,13,14
Er. Pramesh Hada, Assistant Professor, nec
• 7.5 Interpolation of Contours
• 7.6 Uses of Contour Maps – pu 09,11,13
• 7.7 Instruction on field Works
2

•Contour An imaginary line on the ground surface joining
the points of equal elevation is known as contour.
•It facilitates depiction of the relief of terrain in a twodimensional plan or map.
•In other words, contour is a line in which the ground
7.1 Basic Definitions in Contouring –pu 2010
•In other words, contour is a line in which the ground
surface is intersected by a level surface obtained by joining
points of equal elevation. This line on the map represents a
contour and is called contour line.
•Contouring is the science of representing the vertical dimension of the terrain on a two dimensional map.
2CONTOURINGCONTOURING 2Er. Pramesh Hada, Assistant
Professor, nec3

Contours
Er. Pramesh Hada, Assistant Professor, nec
4Contour interval = 30 m

Er. Pramesh Hada, Assistant Professor, nec
Different contour maps
5
Different contour maps

Er. Pramesh Hada, Assistant Professor, nec
6

Relief or shape of the land is shown by
Contours• Contours are those light
brown or orange lines that can see on maps.
• A contour line is an imaginary line that joins points of equal height above sea level.
• The lines are numbered giving • The lines are numbered giving the height above sea level in metres.
• On 1:50000 map the contours will be drawn for every 10 metre rise. Although on this map they are every 3m so always remember to check.
Er. Pramesh Hada, Assistant Professor, nec
7

• It is important to remember that the closer
together the contour lines the steeper the slope.
Steep slopes
Er. Pramesh Hada, Assistant Professor, nec
8
Area that is flatter with only a gentle slope
XXXX

• Contour Map : A map showing contour lines is
known as Contour map.
• A contour map gives an idea of the altitudes of
the surface features as well as their relative
positions in plan serves the purpose of both, a plan
and a section.and a section.
• Contouring : The process of tracing contour lines
on the surface of the earth is called Contouring.
Er. Pramesh Hada, Assistant Professor, nec
9

� Contour Line : A Contour line is an imaginary outline of the terrain obtained by joining its points of equal elevation.
Pu 09,10,14
� Contour Interval (CI) – It is the vertical distance between any two consecutive contours.
Suppose a map includes contour lines of 100m, 98m ,96 m and so on .The contour interval here is 2 m.
This interval depends upon
(i) the nature of the ground (i.e. whether flat or sleep).
Er. Pramesh Hada, Assistant Professor, nec
(i) the nature of the ground (i.e. whether flat or sleep).
(ii) the scale of the map
(iii) the purpose of the survey.
Contour intervals for flat country are generally small, e g. 0.25 m, 0.5 m, 0.75m. etc. Contour interval for a steep slope in a hilly area is generally greater. e.g. 5m. 10 m, 15 m etc.
It should be remembered that the contour interval for a particular map is Constant.
10

Er. Pramesh Hada, Assistant Professor, nec
11

• Horizontal Equivalent (HE)
Horizontal equivalent is the horizontal distance
between two consecutive contour lines measured to
the scale of the map.
– It is not constant. It varies according to the steepness of
the ground.
– For steep slopes, the contour lines run close together, and
for flatter slopes they are widely spaced.
Er. Pramesh Hada, Assistant Professor, nec
12

CHARACTERISTICS OF CONTOURS
i) All points in a contour line have the same elevation.
ii) Flat ground is indicated where the contours are widely
separated and steep-slope where they run close together.
iii) A uniform slope is indicated when the contour lines are iii) A uniform slope is indicated when the contour lines are
uniformly spaced.
iv) A plane surface when they are straight, parallel and
equally spaced.
CONTOURINGCONTOURING 13Er. Pramesh Hada, Assistant
Professor, nec13

examples
Er. Pramesh Hada, Assistant Professor, nec
14

Er. Pramesh Hada, Assistant Professor, nec
15

CHARACTERISTICS OF CONTOURS(Pu 08,09,10,11,13,14)
v) A series of closed
contour lines on the
map represent a hill
, if the higher values
are inside 65
70
75
80
HILLare inside
A HILL
60
65
60
65
707580
HILL
CONTOURINGCONTOURING 14
Er. Pramesh Hada, Assistant Professor, nec
16

CHARACTERISTICS OF CONTOURS
vi) A series of
closed contour
lines on the map
indicate a
depression if the
DEPRESSION
60
65
70
75
80
depression if the
higher values are
outside
A DEPRESSION
70
60
6570
75
80
60
15CONTOURINGCONTOURINGEr. Pramesh Hada, Assistant
Professor, nec17

CHARACTERISTICS OF CONTOURS
vii) Contour line cross ridge or valley line at
right angles. If the higher values
are inside the bend or
loop in the contour, it
indicates a Ridge.
100
90
80
RIDGE LINE
70
60
50
16CONTOURINGCONTOURINGEr. Pramesh Hada, Assistant
Professor, nec18

CHARACTERISTICS OF CONTOURS
vii) Contour line cross ridge or valley line at
right angles.If the higher values are
outside the bend, it
represents a Valley100
90
VALLEY LINE
90
80
70
60
50
17CONTOURINGCONTOURINGEr. Pramesh Hada, Assistant
Professor, nec19
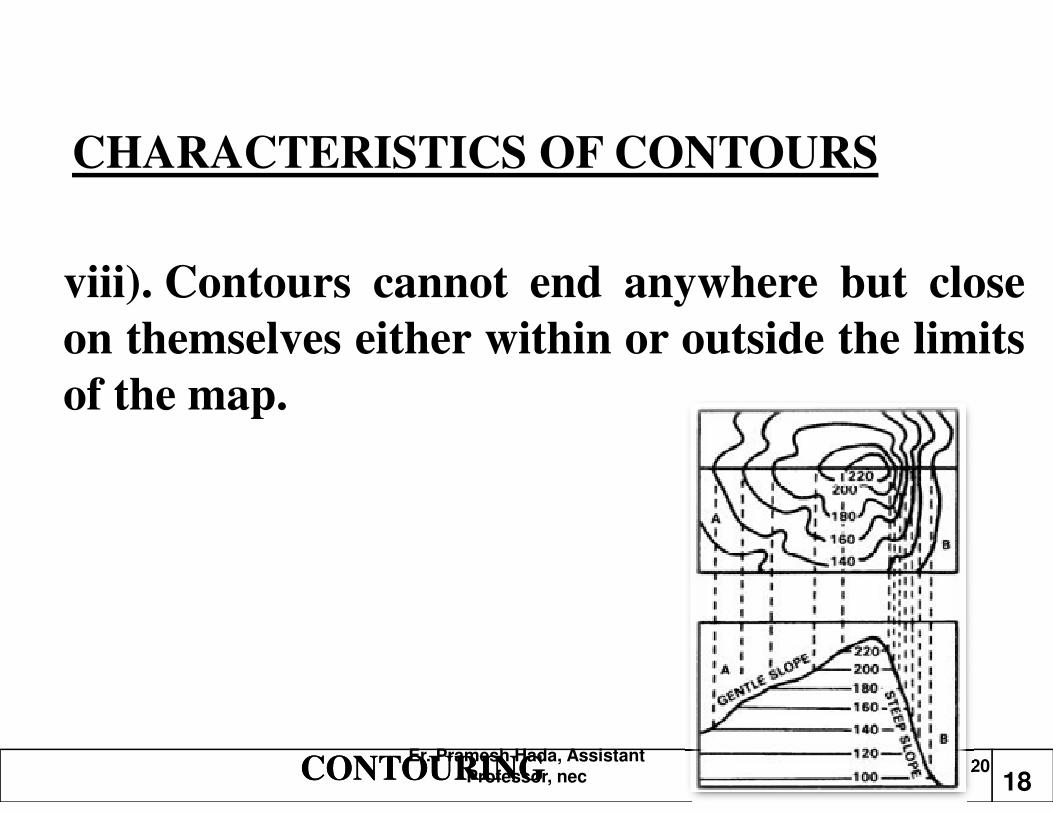
viii). Contours cannot end anywhere but close
on themselves either within or outside the limits
of the map.
CHARACTERISTICS OF CONTOURS
of the map.
18CONTOURINGCONTOURINGEr. Pramesh Hada, Assistant
Professor, nec20

ix).
Contour lines cannot
merge or cross one
another on map
except in the case of
CHARACTERISTICS OF CONTOURS
10
20
30
40
except in the case of
an overhanging cliff.
40 30 20 10
OVERHANGING CLIFF
10
19CONTOURINGCONTOURINGEr. Pramesh Hada, Assistant
Professor, nec21

x) Contour lines
never run into one
another except in
the case of a
vertical cliff. In
this case ,several
CHARACTERISTICS OF CONTOURS
10
20
30
40
VERTICA
CLIFF
50
this case ,several
contours coincide
and the horizontal
equivalent becomes
zero.
40302050
OVERHANGING CLIFF
10
10 50
20CONTOURINGCONTOURINGEr. Pramesh Hada, Assistant
Professor, nec22
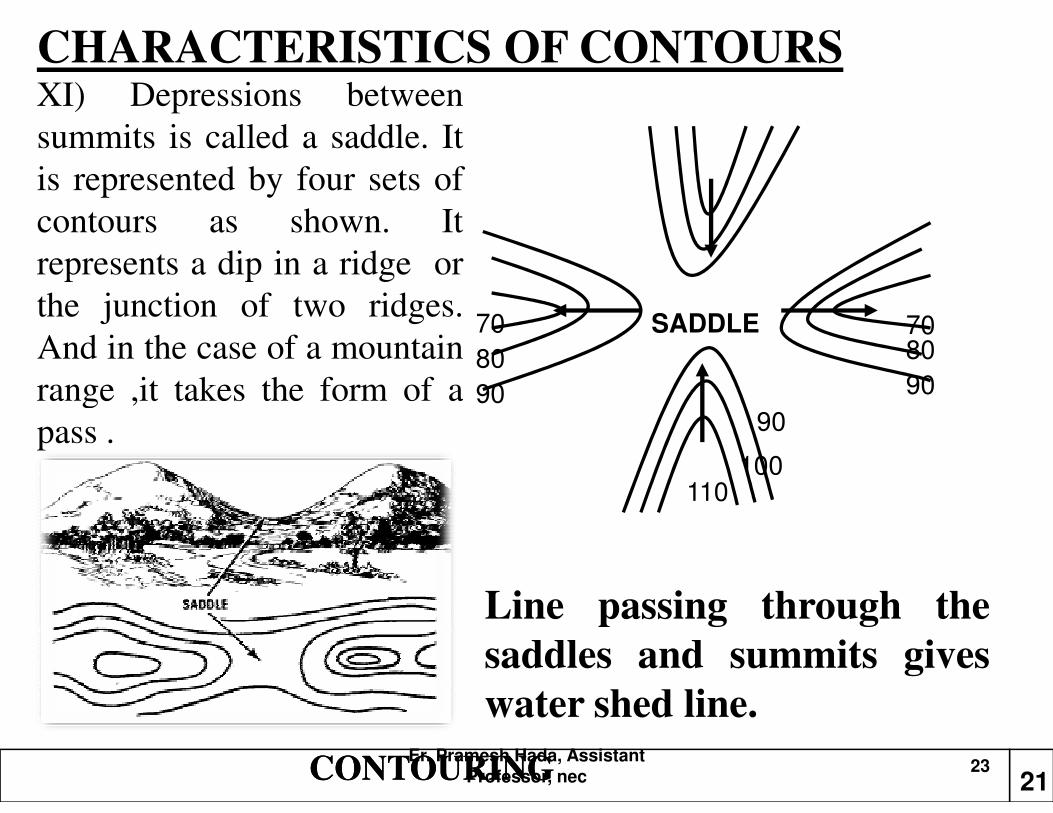
CHARACTERISTICS OF CONTOURSXI) Depressions between
summits is called a saddle. It
is represented by four sets of
contours as shown. It
represents a dip in a ridge or
the junction of two ridges.
And in the case of a mountain
range ,it takes the form of a
SADDLE70
80
90
7080
90range ,it takes the form of a
pass .
90
110100
90
21CONTOURINGCONTOURING
Line passing through the
saddles and summits gives
water shed line.Er. Pramesh Hada, Assistant
Professor, nec23

Think where is the steepest slope on this island?
150
200
XXXX
50
100
Er. Pramesh Hada, Assistant Professor, nec
24

Steepest slope –contour lines are closest together
Sparrow point 227
. 76
150
200
Sometimes spot heights can be shown as a dot with a note of the height of that particular place.
A trigonometrical point (or trig point) shows the highest point in an area (in meters) and is shown as a blue triangle
. 76
50
100
Er. Pramesh Hada, Assistant Professor, nec
25

the shape and pattern of the contours
Er. Pramesh Hada, Assistant Professor, nec
26

Er. Pramesh Hada, Assistant Professor, nec
27

Er. Pramesh Hada, Assistant Professor, nec
28

Er. Pramesh Hada, Assistant Professor, nec
29

Er. Pramesh Hada, Assistant Professor, nec
30

PURPOSE (uses) OF CONTOURING/CONTOUR MAP
Contour survey is carried out at the starting of any
engineering project such as a road, a railway, a canal, a
dam, a building etc.
i) contour maps is prepared in order to select the most
economical or suitable site.economical or suitable site.
ii) It helps to locate the alignment of a canal so that it
should follow a ridge line.
iii) It helps to mark the alignment of roads and railways so
that the quantity of earthwork both in cutting and filling
should be minimum.
4CONTOURINGCONTOURING 5Er. Pramesh Hada, Assistant
Professor, nec31

iv) It helps for getting information about the ground
whether it is flat, undulating or mountainous.
v) It helps to find the capacity of a reservoir and volume
of earthwork especially in a mountainous region.
vi) It helps to trace out the given grade of a particular
route.
PURPOSE(uses) OF CONTOURING/CONTOUR
MAP
route.
vii) It helps to locate the physical features of the ground
such as a pond depression, hill, steep or small slopes.
(Undulating – rising & falling)
CONTOURINGCONTOURING 6Er. Pramesh Hada, Assistant
Professor, nec32

USES OF CONTOUR MAP (Pu,09,11,13)
- A contour map furnishes information regarding the features
of the ground , whether it is flat, undulating or mountainous.
- From a contour map , sections may be easily drawn in any
direction
-Intervisibility between two ground points plotted on map can be
ascertained
- It enables an engineer to approximately select the most
45CONTOURINGCONTOURING
- It enables an engineer to approximately select the most
economical or suitable site for an engineering project such as
a road, a railway, a canal or a pipe line etc.
- A route of a given grade can be traced on the map.
- Catchment area and capacity of a reservoir may be determined
from the contour map.
- Contour map may be used to determine the quantities of earth
work.
Er. Pramesh Hada, Assistant Professor, nec
33

FACTORS ON WHICH CONTOUR -INTERVAL
DEPENDS
The contour interval depends upon the following
factors:-
i) The Nature of the Ground - In flat and
uniformly sloping country, the contouruniformly sloping country, the contour
interval is small , but in broken and
mountainous region the contour interval
should be large otherwise the contours will
come too close to each other.
CONTOURINGCONTOURING 8Er. Pramesh Hada, Assistant
Professor, nec34

FACTORS ON WHICH CONTOUR -
INTERVAL DEPENDS
ii) The Purpose and extent of the survey.
• Contour interval is small if the area to be surveyed
is small and the maps are required to be used for
the design work or for determining the quantities ofthe design work or for determining the quantities of
earth work etc.
• while wider interval shall have to be kept for large
areas and comparatively less important works.
CONTOURINGCONTOURING 9Er. Pramesh Hada, Assistant
Professor, nec35
FACTORS ON WHICH CONTOUR -
INTERVAL DEPENDS
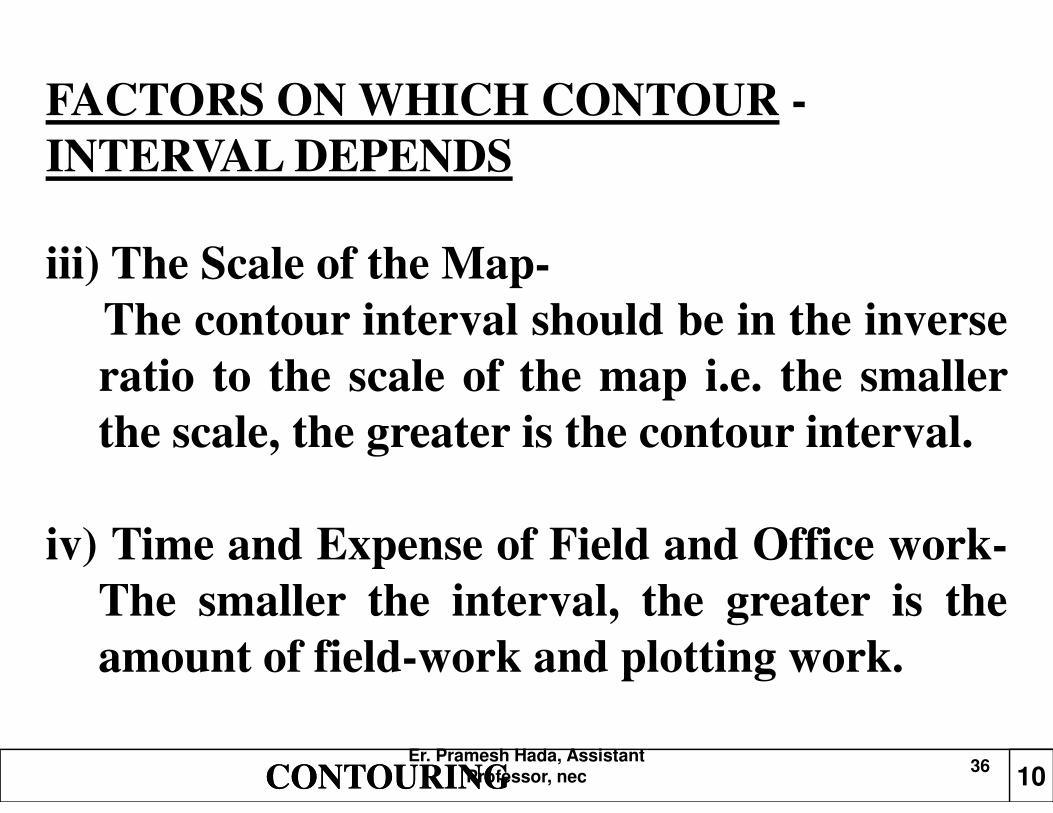
iii) The Scale of the Map-
The contour interval should be in the inverse
ratio to the scale of the map i.e. the smaller
the scale, the greater is the contour interval.the scale, the greater is the contour interval.
iv) Time and Expense of Field and Office work-
The smaller the interval, the greater is the
amount of field-work and plotting work.
CONTOURINGCONTOURING 10Er. Pramesh Hada, Assistant
Professor, nec36

COMMON VALUES OF THE CONTOUR -
INTERVAL
The following are the common values of the
contour interval adopted for various purposes:-
i) For large scale maps of flat country, for
building sites, for detailed design work and building sites, for detailed design work and
for calculation of quantities of earth work;
0.2 to 0.5 m.
CONTOURINGCONTOURING 11Er. Pramesh Hada, Assistant
Professor, nec37

COMMON VALUES OF THE CONTOUR -
INTERVAL
ii) For reservoirs and town planning schemes;
0.5 to 2m.
iii) For location surveys. 2 to 3m.iii) For location surveys. 2 to 3m.
iv) For small scale maps of broken country and
general topographic work; 3m,5m,10m,or
25m.
CONTOURINGCONTOURING 12Er. Pramesh Hada, Assistant
Professor, nec38

METHODS OF CONTOURING (PU 09,10,11,13,14)
There are mainly two methods of locating contours:-
(1)Direct Method and (2) Indirect Method.
Direct Method:
•In this method, the contours to be
located are directly traced out in the
field by locating and marking a
50
48
B.M
field by locating and marking a
number of points on each contour.
• These points are then surveyed and
plotted on plan and the contours
drawn through them. DIRECT METHOD OF CONTOURING
48
46
22CONTOURINGCONTOURINGEr. Pramesh Hada, Assistant
Professor, nec39

Er. Pramesh Hada, Assistant Professor, nec
40

Methods of Contouring (PU 09,10,11,13,14)
The location of a point in topographic survey involves bothhorizontal as well as vertical control. The method of contouringdepends upon the instruments used.
The method may be divided into two classes.
� The Direct Method
� The indirect method
In the direct method
• The contour to be plotted is actually traced on the ground. Onlythose points are surveyed which happen to be plotted and
• The contour to be plotted is actually traced on the ground. Onlythose points are surveyed which happen to be plotted andcontours are drawn through them.
• The method is slow and tedious and is applicable for small areasand where great accuracy is required.(as a lot of time is wastedin searching points of the same elevation for a contour).
In the indirect method
some suitable guide points are selected and surveyed(the guidepoints should not necessarily be on the contours but serve asbasis for interpolation of contours)
Er. Pramesh Hada, Assistant Professor, nec
41

Direct Method
Each contour is located by determining the positions of a series of points through which
the contour passes .
Vertical Control:
• The points on the contours are traced either with the help of a level and staff or hand
level.
• The level is set at a point to command as much area as is possible and is leveled.
• The staff is kept on BM and the height of the instrument is determined. If BM is not
nearby, fly leveling may be carried out to establish a temporary bench mark in that area.
• Having known the height of the instrument, the staff reading is calculated so that the Having known the height of the instrument, the staff reading is calculated so that the
bottom of the staff is at an elevation equal to the value of contour to be plotted.
Eg. If height of instrument is 800.250 meters the staff reading to plot a contour of 800 meters
will be 0.250 meters. Taking one contour at a time( for 800m contour) the staff man is
directed to keep the staff on those points where staff reading of 0.250 m is obtained
every time.
Er. Pramesh Hada, Assistant Professor, nec
42

Direct method
b) Horizontal Control:
• After having located the points for various contours vertically
they are to be surveyed with a suitable control system for
horizontally located.
• For this, the location of points are traced by the method of plane
tabling, chain survey or theodolite.
• Then the contour are drawn through these points.
• For accurate contouring sufficient number of the points at close
interval are required.
• The plotted positions of the consecutive points of any contour are
simply joined by straight lines to form contour lines
Er. Pramesh Hada, Assistant Professor, nec
43

Er. Pramesh Hada, Assistant Professor, nec
44

Procedure:
•To start with, a temporary B.M is established near the area to be
surveyed with reference to a permanent B.M by fly leveling.
•The level is then set up in such a position so that the maximum
number of points can be commanded from the instrument station.
• The height of instrument is determined by taking a back sight
on the B.M. and adding it to the R.L. of bench mark.on the B.M. and adding it to the R.L. of bench mark.
•The staff reading required to fix points on the various contours is
determined by subtracting the R.L. of each of the contours from
the height of instrument.
24CONTOURINGCONTOURINGEr. Pramesh Hada, Assistant
Professor, nec45

Example:
• If the height of instrument is 82.48m., then the staff readings
required to locate 82, 81 and 80m contours are 0.48, 1.48 and
2.48m respectively.
•The staff is held on an approximate position of point and then
moved up and down the slope until the desired reading is obtained.
The point is marked with a peg.
25CONTOURINGCONTOURINGEr. Pramesh Hada, Assistant
Professor, nec46
•Similarly various other points are marked on each contour.
•The line joining all these points give the required contour. It
may be noted that one contour is located at a time.
• Having fixed the contours within the range of the instrument,
the level is shifted and set up in a new position.

The new height of instrument and the
required staff readings are then calculated in a
similar manner and the process repeated till all
the contours are located. The positions of the
contour points are located suitably either
simultaneous with levelling or afterwards. A
Procedure (Contd…..)
simultaneous with levelling or afterwards. A
theodolite , a compass or a plane table
traversing is usually adopted for locating these
points. The points are then plotted on the plan
and the contours drawn by joining the
corresponding points by dotted curved lines.
27CONTOURINGCONTOURINGEr. Pramesh Hada, Assistant
Professor, nec47

2. Indirect Method:
•In this method some suitable guide points are selected and their
elevations are found. These point may form well shaped geometrical
figures.
•The location of such points are plotted by plane tabling and contours
are drawn by interpolation. These guide points do not fall except by
coincidence, on the contours to be located.
• While interpolating, it is considered that the slope between any two
adjacent guide points is uniform.adjacent guide points is uniform.
•Several representative points representing hills, depressions, ridge and
valley lines and the changes in the slope all over the area to be
contoured are also observed.
• Other Guide points are then plotted on the plan and the contours
drawn by interpolation.
•This method of contouring is also known as contouring by spot levels.
30CONTOURINGCONTOURINGEr. Pramesh Hada, Assistant
Professor, nec48

• This method is commonly employed in all kinds of surveys as
this is cheaper, quicker and less tedious as compared to direct
method.
• There are mainly three method of contouring in indirect
method:
(i) By Squares.
• In this method, the whole area is divided into number of
Indirect Method:
• In this method, the whole area is divided into number of
squares, the side of which may vary from 5m to 30m
depending upon the nature of the ground and the contour
interval.
• The corners of the squares are pegged out and the reduced
levels of these points are determined with a level.
31CONTOURINGCONTOURINGEr. Pramesh Hada, Assistant
Professor, nec49

SQUARE METHOD
31CONTOURINGCONTOURINGEr. Pramesh Hada, Assistant
Professor, nec50

Indirect Method: (Square Method)
13 14 15 16
100.4 97.60 96.05 94.40
98.00 98.00
10 11
6 7
1 2 3 4
5 8
9 12
SQURES LAID ON GROUND
97.45 99.25 98.75 99.40
98.65 99.60 97.80 89.55
100.90 99.70 99.85 98.45
98.00
98.0
99.0 99.0
98,00
CONTOURS INTERPOLATED
32CONTOURINGCONTOURINGEr. Pramesh Hada, Assistant
Professor, nec51

2. Indirect Method: (Square Method)
100.4 97.60 96.05 94.40
98.00 98.00
•The important points
within the squares
may be taken when
required and located
by measurements
from the corners.97.45 99.25 98.75 99.40
98.65 99.60 97.80 89.55
100.90 99.70 99.85 98.45
98.00
98.0
99.0 99.0
98,00
SQUARE METHOD
33CONTOURINGCONTOURING
from the corners.
• The squares are
plotted and the
reduced levels of the
corners are written on
the plan.
Er. Pramesh Hada, Assistant Professor, nec
52

2. Indirect Method:
By Cross- Sections:
• This method is most suitable for the surveys of long narrow
strips such as a road, railway or canal aignment etc.
• In this method cross sections perpendicular to the centre
line of the area are set out.
• The spacing of the cross-section depends upon the contour
interval, scale of plan and the characteristic of ground.interval, scale of plan and the characteristic of ground.
• The common value is 10 to 20 m in hilly country and 20-30m in
flat country.
•The centre line and cross sections are plotted along with
important features on the desired scale and their RLs are
entered.
•The contours are then interpolated with respect to these RLs.
35CONTOURINGCONTOURINGEr. Pramesh Hada, Assistant
Professor, nec53
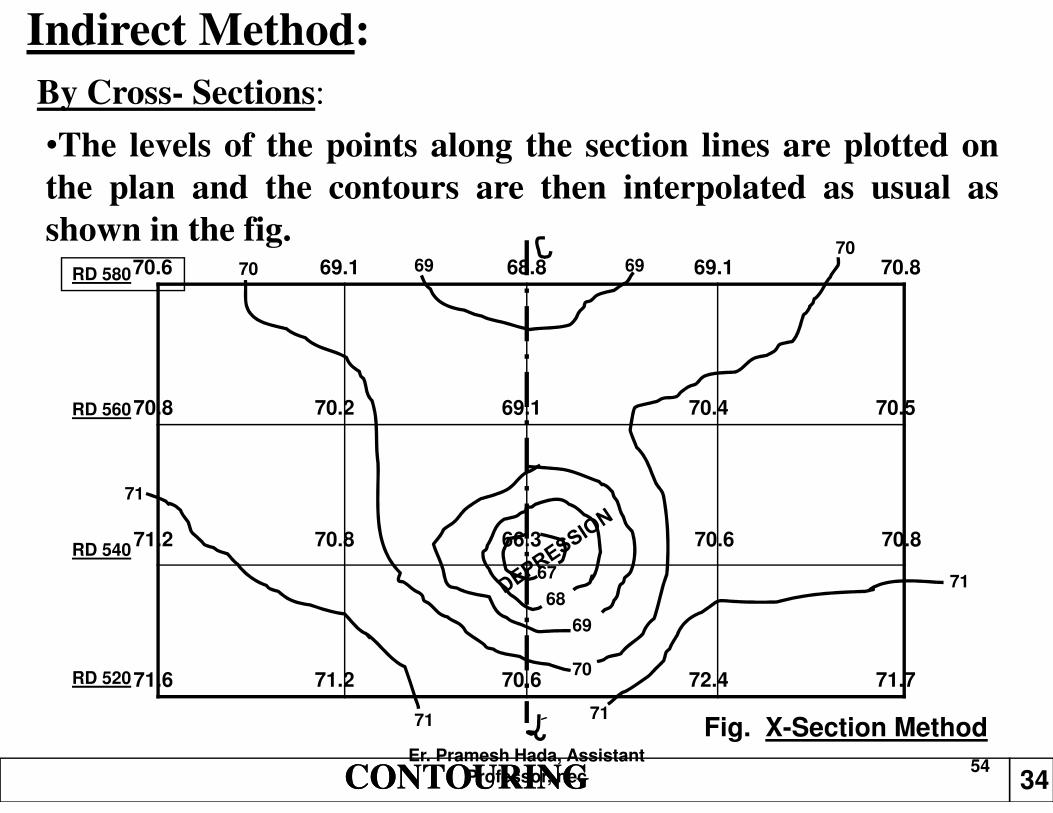
Indirect Method:
By Cross- Sections:
70.6 69.1 68.8 69.1 70.8
70.8 70.2 69.1 70.4 70.5
RD 580
RD 560
7070
69 69
•The levels of the points along the section lines are plotted on
the plan and the contours are then interpolated as usual as
shown in the fig.
70.8 70.2 69.1 70.4 70.5
71.2 70.8 66.3 70.6 70.8
71.6 71.2 70.6 72.4 71.7
RD 560
RD 540
RD 520
71
71
70
69
68
67
71
71
Fig. X-Section Method
34CONTOURINGCONTOURINGEr. Pramesh Hada, Assistant
Professor, nec54

2. Indirect Method:
(iii) By Tacheometric method:
• A tacheometer is a transit theodolite having a diaphragm
fitted with two stadia wires, one above and other below the
central wire.
Fig. Stadia Wires at Diaphragm
central wire.
• The horizontal distance between the instrument and staff
station may be determined by multiplying the difference of the
staff readings of the upper and lower stadia wires with the
stadia constant of the instrument, which is usually 100.
• Thus the tacheometer is used for both the vertical as well as
horizontal measurements.
37CONTOURINGCONTOURINGEr. Pramesh Hada, Assistant
Professor, nec55
2. Indirect Method:
iii) By Tacheometric method (contd…):
•This method is most suitable in hilly areas as the number of
stations which can be commanded by a tacheometer is far more
than those by a level and thus the number of instrument settings
are considerably reduced.
•A number of radial lines are laid out at a known angular•A number of radial lines are laid out at a known angular
interval and representative points are marked by pegs along
these radial lines.
•Their elevations and distances are then calculated and plotted
on the plan and the contour lines are then interpolated.
38CONTOURINGCONTOURINGEr. Pramesh Hada, Assistant
Professor, nec56

By Tacheometric method
Er. Pramesh Hada, Assistant Professor, nec
57

Difference between Direct and Indirect Methods of Contouring
Er. Pramesh Hada, Assistant Professor, nec
58

INTERPOLATION OF CONTOURS
• The process of spacing the contours proportionally
between the plotted ground – points is termed as
interpolation of contours .
• This becomes necessary in the case of indirect
contouring as only the spot levels are taken in this
method.method.
• While interpolation of contours the ground between any
two points is assumed to be uniformly sloping.
39CONTOURINGCONTOURINGEr. Pramesh Hada, Assistant
Professor, nec59

INTERPOLATION OF CONTOURS
There are three main methods of interpolation:
i) By arithmetical calculation:
• This is very tedious & time consuming but accurate
method .
• The positions of contour points between the guide points
are located by arithmetic calculation.
• used for small areas where accurate results are necessary.• used for small areas where accurate results are necessary.
40CONTOURINGCONTOURINGEr. Pramesh Hada, Assistant
Professor, nec60
•Find distance from A for a contourof 99m elevation. (Note – Square = 10*10m)
•Distance from A for contour of 99m = (99—98.75)/ (100.75 —98.75) *10 = 1.25m

INTERPOLATION OF CONTOURS
The contours are interpolated as under:
Example-
Suppose A and B are two points at a distance of 30 m and the
reduced level of A and B are 25.45m and 27.54m respectively .Taking
By arithmetical calculation:A B
30 m25.45m 27.54m
26m 27m
Diff (A-B)=2.09m
reduced level of A and B are 25.45m and 27.54m respectively .Taking
the contour interval as 1m, 26 and 27 m contours may be interpolated
in between A and B. The difference of level between A and B is
2.09m.the difference of level between A and 26m,and A and 27m is
0.55mand 1.55 m respectively.
Therefore the horizontal distance between A and 26 m contour
=0.55/2.09 x 30m ((Diff of A & 26m / Diff of A & B)* Dist.AB)) and
Between A and 27 m contour =1.55/2.09 x 30m.
These distances are then plotted to scale on the map.
41CONTOURINGCONTOURINGEr. Pramesh Hada, Assistant
Professor, nec61

INTERPOLATION OF CONTOURS
•Graphical method of
interpolation is simpler
as compared to
arithmetical method
and also the results
(ii) By Graphical method:
60
65
B62.5m
60m2
and also the results
obtained are accurate.
• Out of several
graphical methods, the
most common is as
given below:
50
55
A 51.5m
55m1
42CONTOURINGCONTOURINGEr. Pramesh Hada, Assistant
Professor, nec62

As shown in the fig.
suppose the contour interval is
5m, then on a piece of tracing
cloth or tracing paper, a number of
parallel lines spaced at 0.5 m
(usually 1/10th of the contour
Graphical method:
INTERPOLATION OF CONTOURS
(usually 1/10th of the contour
interval) are drawn. Every tenth
line being made thick.
Suppose it is required to
interpolate contours between two
points A and B of elevation 51.5m
and 62.5m respectively.
43CONTOURINGCONTOURINGEr. Pramesh Hada, Assistant
Professor, nec63

INTERPOLATION OF CONTOURSBy Graphical method:• If the bottom line represents an
elevation of 50m. Then the successive
thick lines will represent 55m, 60m and
65m, etc.
•Place the tracing cloth so that the
point A is on the third line from the
bottom, now move the tracing clothbottom, now move the tracing cloth
until B is on the fifth line above the
60m thick line.
• The intersection of the thick lines 1
and 2 representing elevations of 55m
and 60 m and the line AB give the
position of the points on the 55m and
60m contours respectively and are
pricked through on the plan with a pin.
44CONTOURINGCONTOURINGEr. Pramesh Hada, Assistant
Professor, nec64

iii) By Estimation:
– The position of the contour points between ground
- points are estimated roughly and the contours
are then drawn through these points.
INTERPOLATION OF CONTOURS
– This is a rough method and is suitable for small
scale maps.
• Accuracy of work depends upon the skill and
experience of surveyor.
Er. Pramesh Hada, Assistant Professor, nec
65
DRAWING THE CONTOUR LINESContour lines are drawn as fine and smooth free hand
curved lines. Sometimes they are represented by broken
lines .They are inked in either in black or brown colour. A
drawing pen gives a better line than a writing pen and
French curves should be used as much as possible .Every
fifth contour is made thicker than the rest.
The elevation of contours must be written in a uniformThe elevation of contours must be written in a uniform
manner, either on the higher side or in a gap left in the line
.When the contour lines are very long, their elevations are
written at two or three places along the contour .In the case
of small scale maps, it is sufficient to figure every fifth
contour.
45CONTOURINGCONTOURINGEr. Pramesh Hada, Assistant
Professor, nec66

Contour Gradient
• Contour gradient is a line lying throughout on the surface of the ground and preserving a constant inclination to the horizontal
• The inclination of a contour gradient is generally given either as rising gradient or falling gradient, and is expressed as ratio of the vertical height to a specified horizontal distance. If the inclination of a contour gradient is 1 in 50, it means that for every 50 m horizontal distance, there is a rise (or fall) of 1 m.rise (or fall) of 1 m.
• To locate the contour gradient in the field a clinometer, a theodolite or a level may be used.
• The inclination of a contour gradient is generally given either as rising or falling gradient and is expressed as ratio of the vertical height to a specified horizontal distance.
Er. Pramesh Hada, Assistant Professor, nec
67
Er. Pramesh Hada, Assistant Professor, nec
68