Continuous Welded Rail Track Buckling Safety...
14
TRANSPORTATION RESEARCH RECORD 1289 39 Continuous Welded Rail Track Buckling Safety Assurance Through Field Measurements of Track Resistance and Rail Force G. SAMAVEDAM AND A. KISH Techniques and hardware for field measurement of two important continuous welded rail (CWR) track parameters for safety from buckling-the track lateral resistance and the rail neutral tem- perature-are presented. It is shown here that by controlling the two parameters above their respective permi ss ible minimum val- ues, CWR track buckiing safety can be ensured. For the measure- ment of lateral resistance, a lightweight, portable device that tests the ties individually has been developed. Field data collected using the single-tie push test revealed that the scatter is within permissible limits if the data for three randomly selected ties in a 50-ft section of CWR are averaged. The data have also shown that the ties exhibit a softening resistance characteristic, a feature that has been ignored or not detected in work by other research- ers. Rail neutral temperature can be measured using the principle that the vertical deflection of a rail beam freed from ties is mea- surably sensitive to the longitudinal rail force when a vertical load is applied to the rail section. On the basis of that principle a rail uplift device (RUD) that gives the absolute rail force without site-specific calibration has been developed. The rail force test data from RUD are in agreement with the theoretical predictions. The Transportation Systems Center (TSC) provides technical support to FRA in the development of performance-based safety guidelines and specifications for continuous welded rail (CWR) track . A major problem with CWR track is lateral buckling under high thermal a nd vehicle loads. TSC recently completed a major analytical, experimental, and safety as- sessment study, which is discussed by the authors in another paper in this Record. The limitations of existing theories are discussed, and an advanced model that runs on a personal computer (TSC dynamic buckling model) and accounts for vehicle loads, nonlinearity in the lateral resistance, and all other significant parameters is described. Results from con- trolled full-scale buckling tests (1-3) that used artificial heat- ing artd moving train consists are also reported. The tests validated the theoretical model ( 4) and safety concepts and limits. On the basis of the TSC computer model, and on the knowl- edge of two parameters (track lateral resistance and rail neu- tral temperature), it is now possible to assess the in situ buck- ling strength of CWR track for an improved assurance of safety from buckling. G. Samavedam, Foster-Miller, Jnc., 350 Second Avenue, Waltham, Mass. 02254. A. Kish, Transportation Systems Center, DTS-76, 55 Broadway, Cambridge, Mass. 02142. Recent developments in the concepts, methodology, and hardware for the measurement of track resistance and rail longitudinal force (neutral temperature) , and their applica- bility to CWR track buckling safety assurance are described in this paper. BUCKLING SAFETY ASSESSMENT The TSC dynamic buckling model can predict upper and lower buckling temperatures for given input data. The data can be divided into (a) primary inputs: rail size, car parameters (truck center spacing and wheel loads), track curvature, misalign- ments , and lateral resistance, and (b) secondary inputs: lon- gitudinal resistance, track modulus, and tie-ballast friction coefficient. The primary input data have significant influence on track buckling response and therefore must be accurately known . A lightweight, portable device has been developed that can be used to determine the lateral resistance of the track, the most difficult of the five primary inputs for the track engineer to estimate. This hardware and the associated test method- ology can be used to determine the complete nonlinear resist- ance. Tie motion of only a fraction of an inch allows deter- mination of the peak value. To determine the complete nonlinear response, ties may be displaced to larger deflec- tions, or the response may be determined empirically, on the basis of correlation with existing field test data. The impor- tance of the complete nonlinear resistance for buckling pre- dictions is discussed by the authors in another paper in this Record. Once the lateral resistance in the field and the critical buck- ling temperatures from the TSC model have been determined, the safety criterion to be applied is as follows. For safe operations of CWR tracks with regard to buckling, the allowable temperature increase (/:J. T,,) should be greater than the difference between the maximum rail temperature (TM) and the neutral or the force-free temperature (TN)· (1) TM depends on the ambient conditions for which data are generally available. TN is not necessarily the installation tem- perature. The neutral temperature can change substantially
Transcript of Continuous Welded Rail Track Buckling Safety...
TRANSPORTATION RESEARCH RECORD 1289 39
Continuous Welded Rail Track Buckling Safety Assurance Through Field Measurements of Track Resistance and Rail Force
G. SAMAVEDAM AND A. KISH
Techniques and hardware for field measurement of two important continuous welded rail (CWR) track parameters for safety from buckling-the track lateral resistance and the rail neutral temperature-are presented. It is shown here that by controlling the two parameters above their respective permissible minimum values, CWR track buckiing safety can be ensured. For the measurement of lateral resistance, a lightweight, portable device that tests the ties individually has been developed. Field data collected using the single-tie push test revealed that the scatter is within permissible limits if the data for three randomly selected ties in a 50-ft section of CWR are averaged. The data have also shown that the ties exhibit a softening resistance characteristic, a feature that has been ignored or not detected in work by other researchers. Rail neutral temperature can be measured using the principle that the vertical deflection of a rail beam freed from ties is measurably sensitive to the longitudinal rail force when a vertical load is applied to the rail section. On the basis of that principle a rail uplift device (RUD) that gives the absolute rail force without site-specific calibration has been developed. The rail force test data from RUD are in agreement with the theoretical predictions.
The Transportation Systems Center (TSC) provides technical support to FRA in the development of performance-based safety guidelines and specifications for continuous welded rail (CWR) track . A major problem with CWR track is lateral buckling under high thermal and vehicle loads. TSC recently completed a major analytical, experimental, and safety assessment study, which is discussed by the authors in another paper in this Record. The limitations of existing theories are discussed, and an advanced model that runs on a personal computer (TSC dynamic buckling model) and accounts for vehicle loads, nonlinearity in the lateral resistance, and all other significant parameters is described. Results from controlled full-scale buckling tests (1-3) that used artificial heating artd moving train consists are also reported. The tests validated the theoretical model ( 4) and safety concepts and limits.
On the basis of the TSC computer model, and on the knowledge of two parameters (track lateral resistance and rail neutral temperature), it is now possible to assess the in situ buckling strength of CWR track for an improved assurance of safety from buckling.
G. Samavedam, Foster-Miller, Jnc., 350 Second Avenue, Waltham, Mass. 02254. A. Kish, Transportation Systems Center, DTS-76, 55 Broadway, Cambridge, Mass. 02142.
Recent developments in the concepts, methodology, and hardware for the measurement of track resistance and rail longitudinal force (neutral temperature) , and their applicability to CWR track buckling safety assurance are described in this paper.
BUCKLING SAFETY ASSESSMENT
The TSC dynamic buckling model can predict upper and lower buckling temperatures for given input data. The data can be divided into (a) primary inputs: rail size, car parameters (truck center spacing and wheel loads), track curvature, misalignments , and lateral resistance, and (b) secondary inputs: longitudinal resistance, track modulus, and tie-ballast friction coefficient. The primary input data have significant influence on track buckling response and therefore must be accurately known.
A lightweight, portable device has been developed that can be used to determine the lateral resistance of the track, the most difficult of the five primary inputs for the track engineer to estimate. This hardware and the associated test methodology can be used to determine the complete nonlinear resistance. Tie motion of only a fraction of an inch allows determination of the peak value. To determine the complete nonlinear response, ties may be displaced to larger deflections, or the response may be determined empirically, on the basis of correlation with existing field test data. The importance of the complete nonlinear resistance for buckling predictions is discussed by the authors in another paper in this Record.
Once the lateral resistance in the field and the critical buckling temperatures from the TSC model have been determined, the safety criterion to be applied is as follows.
For safe operations of CWR tracks with regard to buckling, the allowable temperature increase (/:J. T,,) should be greater than the difference between the maximum rail temperature (TM) and the neutral or the force-free temperature (TN)·
(1)
TM depends on the ambient conditions for which data are generally available. TN is not necessarily the installation temperature. The neutral temperature can change substantially
40
from its original value at installation because of several mechanisms discussed later. Its value must be upgraded each time track operations such as destressing, reanchoring, and lining are performed. Hardware and procedures, described later, have also been developed to determine the rail neutral temperature in the field. This method gives the absolute rail force and does not involve any specific site-dependent calibration and rail cutting.
Thus, Equation 1 can be used for buckling safety assessment once values for l::i. T" and TN are known. Among the primary parameters governing l::i. T,,, for the most commonly used woodtie track with cut spike construction, the ballast lateral resistance is the only variable that generally can be controlled by the track engineer. Hence, in revenue service conditions, l::i.T
0
is essentially controlled by the lateral resistance. A minimum value for l::i.T" can therefore be ensured by stipulating a minimum permissible value for the resistance. Likewise, if a minimum value for TN is also stipulated, Equation 1 will be satisfied for all values of resistance and the neutral temperature above the respective permissible values. The track can be rapidly tested for the two permissible values through the use of available equipment. A go or no-go criterion can be used for buckling safety. If the lateral resistance is below the critical value, ballast can be added, or the existing ballast can be consolidated by traffic or other means. Likewise, if the neutral temperature falls below the critical value stipulated, rail destressing can be performed. A slow order should be imposed on trains until the track attains the minimum stipulated values. The minimum required lateral resistance and neutral temperature values can be made available to the track supervisor in the form of simple charts or graphs.
LATERAL RESISTANCE
Track lateral resistance has been measured by a number of researchers in the United States and abroad. The currently recommended measurement scheme mobilizes a single tie; some previous techniques require lateral movement of a cut panel or the entire track section by a concentrated lateral load. In the case in which a single tie is mobilized, the resistance is directly represented by the load-deflection response of the tie, whereas in the case of the panel, the load-deflection response is a combined effect of rail flexural rigidity, rail longitudinal force, and nonuniform resistance offered by several ties. The panel deflection response is not directly usable as an input parameter in the buckling analysis, which requires individual tie resistance data. In past buckling investigations, single-tie push tests (STPTs) were not favored for the lateral resistance measurement because of the scatter, or variations, in the individual tie resistance values.
The advantages of the STPT over the panel test are
• STPTs yield a more fundamental characteristic of the ballast resistance;
• The test is easy to set up and perform; • The hardware is portable and can be used by track crew
with minimal training; •If a discrete panel is used, rail cutting is destructive; and •For the continuous panel, the data are substantially skewed
by rail longitudinal forces that influence the deflection response.
TRANSPORTATION RESEARCH RECORD 1289
The disadvantage of the STPT is the variation of results from tie to tie. However, an arithmetic average of the individual test results is adequate to determine the buckling and safe allowable temperatures from the safety limit charts currently under consideration. It will be shown in this paper that for a 50-ft section of CWR track, three randomly selected ties arc adequate to yield a resistance value that can predict the lower buckling temperatures within l0°F.
Test Hardware
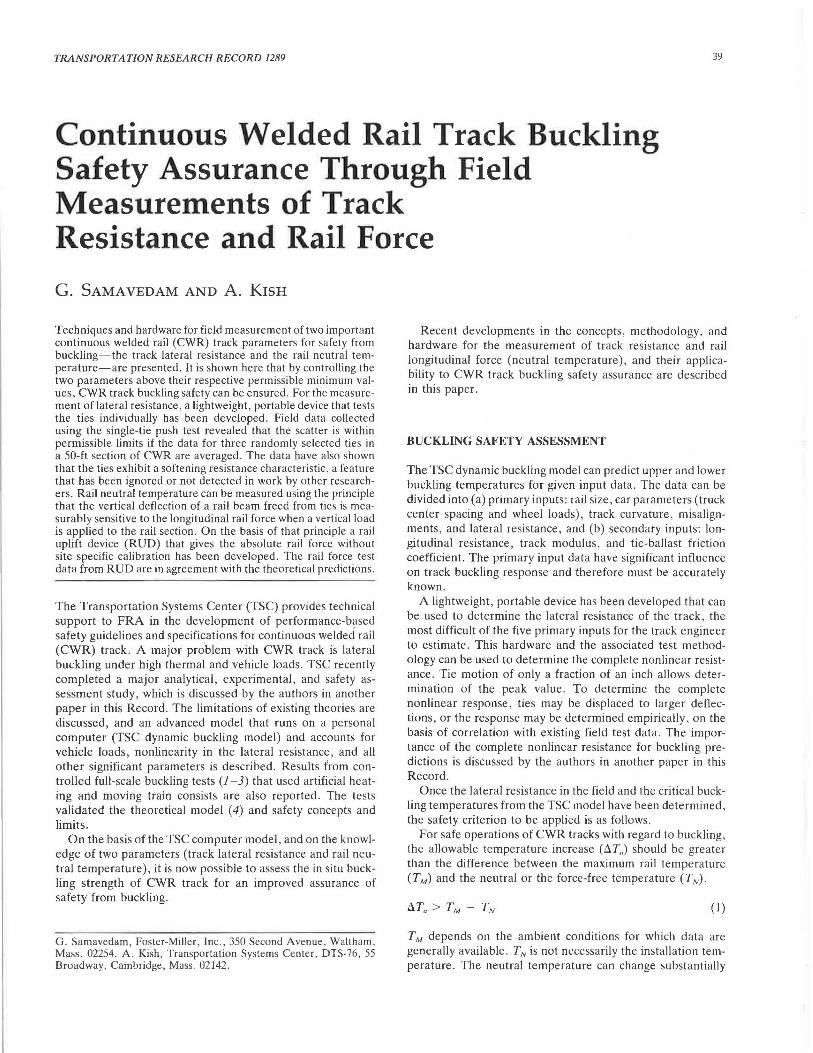
Although STPTs were performed many years ago in the United States and abroad, they were restricted to very small tie displacements and did not cover the "softening" portion of the resistance characteristic. Further, the equipment used was bulky and not suitable for generation of a large data base. A new, lightweight, portable device with an X-Y plotter was therefore developed. The STPT device, shown in Figure 1, consists of a hydraulic control unit with a pump and a rig with a hydraulic cylinder. Once the spikes, rail anchors, and tie plates are removed, the rig assembly grabs the test tie, which is now free to move laterally under the rails. The hydraulic piston mounted on the rig creates the force required to move the tie against one of the rails. Hydraulic pressure can be provided by the hand pump or by an electric pump to speed the operation. Most reported testing was performed by the latter method.
A pressure transducer or load cell in line with the piston and a pressure gauge in the control unit (as a backup) indicate the load applied; a rotary potentiometer mounted on the tie measures the displacement with respect to the stationary second rail. The load-displacement relationship is plotted using the X-Y plotter.
Typical Results
TSC conducted a large number of track characterization tests using the STPT device at the Transportation Test Center (TIC) in Pueblo, Colorado, and on a number of railroads. Detailed load deflection response curves for individual ties under a range of ballast and test conditions are presented by Pietrak et al. (6), and data analysis results and correlations among the parameters controlling the lateral resistance are presented elsewhere by Samavedam and Kish (7).
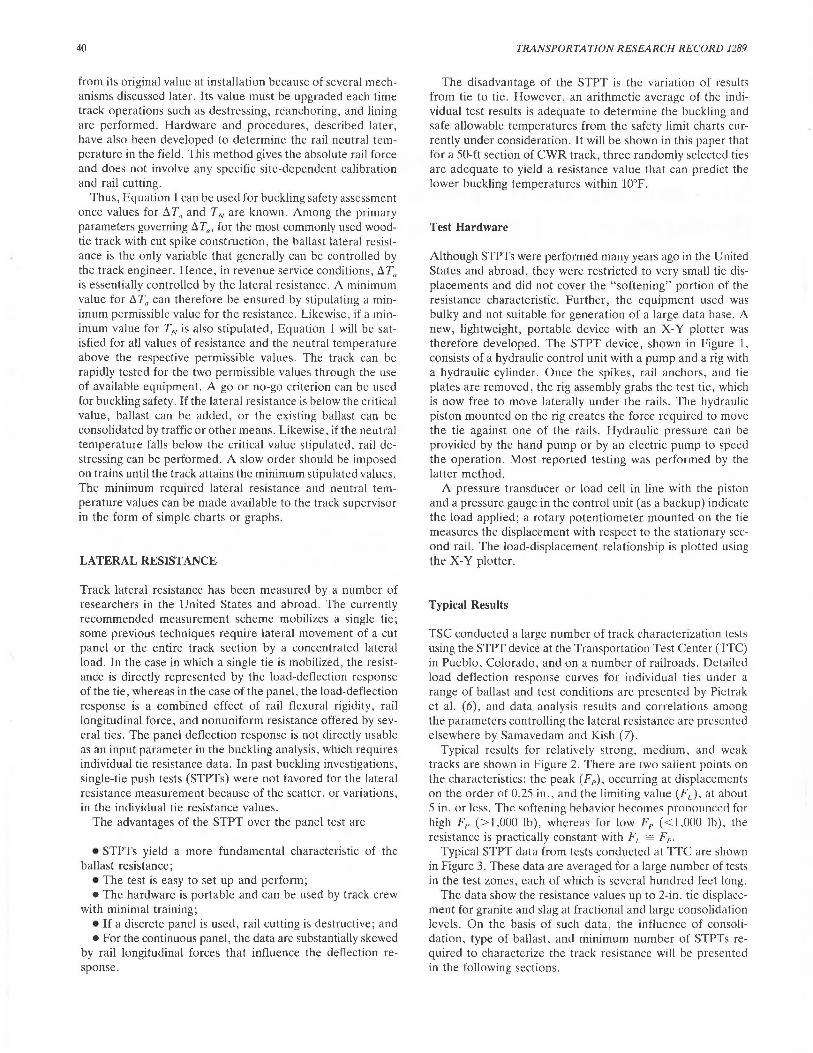
Typical results for relatively strong, medium, and weak tracks are shown in Figure 2. There are two salient points on the characteristics: the peak (Fp), occurring at displacements on the order of 0.25 in., and the limiting value (FL), at about .Sin. or less. The softening heh;ivior becomes pronouncerl for high FP (>l,000 lb), whereas for low Fp (<1,000 lb), the resistance is practically constant with FL ~ FP.
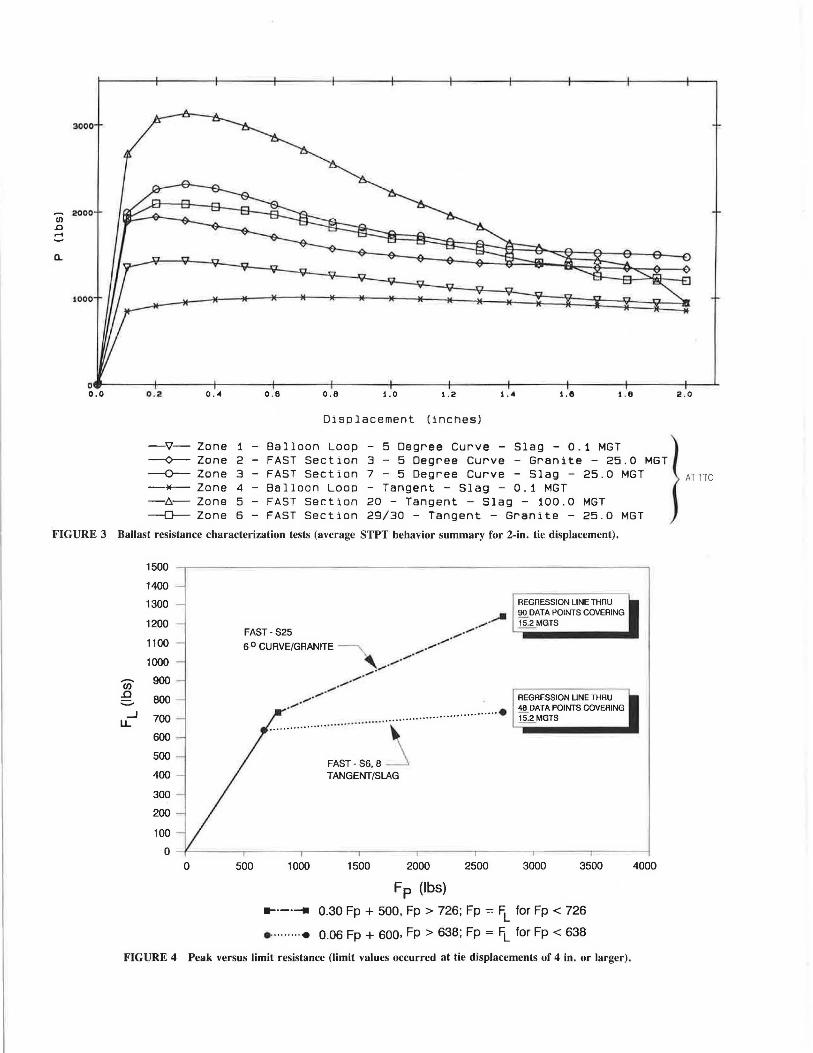
Typical STPT data from tests conducted at TIC are shown in Figure 3. These data are averaged for a large number of tests in the test zones, each of which is several hundred feet long.
The data show the resistance values up to 2-in. tie displacement for granite and slag at fractional and large consolidation levels. On the basis of such data, the influence of consolidation, type of ballast, and minimum number of STPTs required to characterize the track resistance will be presented in the following sections.
Samavedam and Kish
FIGURE 1 STPT device with plotter.
41
Correlation Study
From the previous data, it is seen that ties need to be laterally displaced over a large distance ( =5 in.) to capture the limiting resistance values. This may be undesirable in revenue service track. Therefore, a correlation between the peak value (Fp), which can be easily determined at small displacements, and the limiting value (FL) will be developed here for use in the buckling model. Attempts will also be made to correlate the peak value to the traffic tonnage [in million gross tons (MGT)], but there are some difficulties, as seen later. Finally, the scatter in the peak values for a given track will be presented, and the sampling size, that is, the number of required STPTs over a given track segment for the purpose of averaging the peaks, will be determined.
Limiting Versus Peak Resistance Values
Considerable test data have been generated to correlate the limiting resistance (FL) with the peak value (Fp). This correlation depends on the type of ballast material. For granite ballast, the linear regression analysis of the data has given the following equation:
FL = (0.3 FP + 500) lb for FP > 726 lb (2)
For FP ,,-;; 726 lb, the case of weak track, it can be assumed that FL = Fp.
For slag ballast, the equation is
FL = (0.06 FP + 600) lb for FP > 638 lb (3)
The ability of granite to provide higher limiting lateral resistance is seen from the equations plotted in Figure 4. It must be noted that the foregoing empirical equations are based on the tests on slag- and granite-ballasted tracks at TIC, which had a shoulder width of about 12 to 14 in. The equations may not be strictly applicable to other track conditions. A significant scatter also exists in the test data. The equations are provided to show that it may not be necessary to push test ties over large lateral displacements to determine the full characteristic. Knowledge of the peak value alone may be adequate and can be easily determined at small displacements without significantly damaging the track.
Effect of Track Consolidation
It is known that consolidation under traffic (measured by tonnage accumulation in MGT) increases lateral resistance to some limit. Beyond this limit, consolidation has little effect. However, there is a problem in correlating MGT with the absolute value of track lateral resistance. The problem is that immediately after tamping or other maintenance operation, the track resistance drops to a low but unknown value. The subsequent increase in the resistance from this condition would depend on the MGT level of consolidation. Due to the nonlinear relationship between the lateral resistance and MGT, it is difficult to predict the absolute resistance at a given MGT.
42 TRANSPORTATION RESEARCH RECORD 1289
~--- . ' . ' ' - ~ ·
-·--- __ . _:____~ - · . .
~~ - - --- --· - -- ·--·-·- _ ... ·-
STRONG TRACK
I. :
MEDIUM TRACK
I I I ~ --·-·-- I r---..... ,-----.. - h,- v -- ,- -,
-- --
; ~ - WEAK TRACK
TIE DISPLACEMENT (inches)
FIGURE 2 Typical STPT track response.
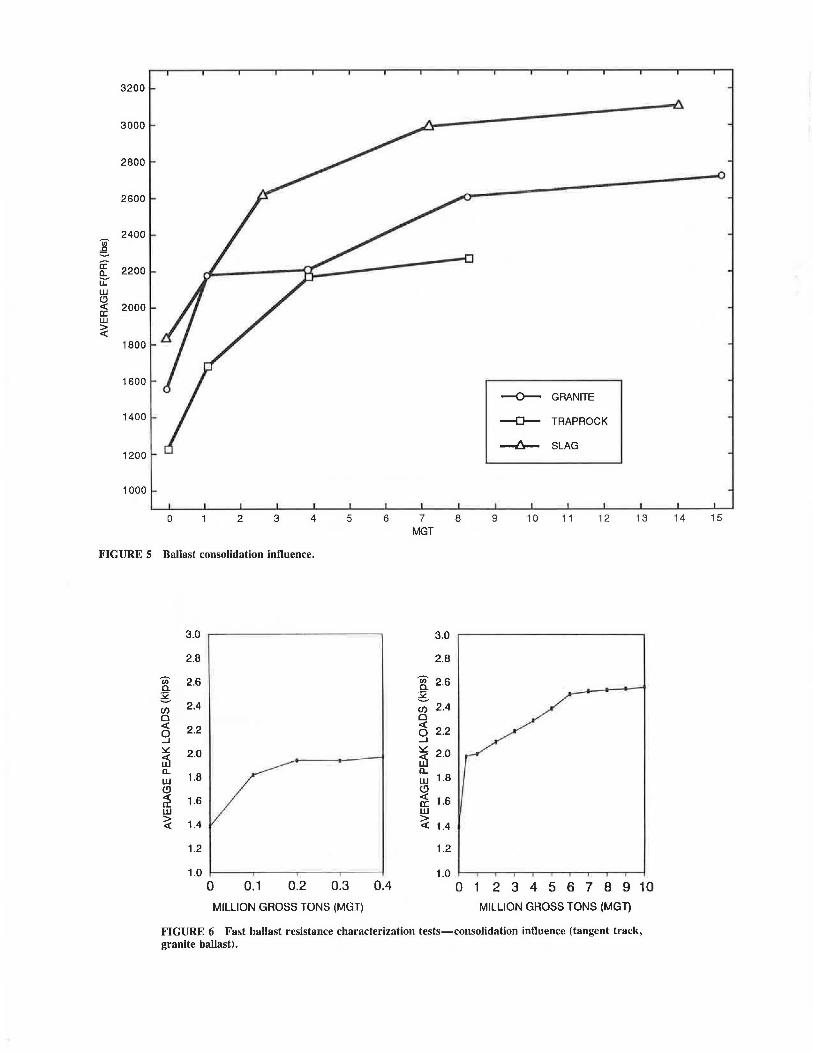
Tests to understand the influence of consolidation on the peak resistance values were conducted on three zones of slag, traprock, and granite ballast, respectively, that were subjected to the same traffic levels. The averages of STPT results are shown in Figure 5. Clearly, the resistances at zero MGT for the three zones were not equal, even though the same tamping procedure was employed at each zone. The starting values (1,800 lb for slag, 1,520 lb for granite, and 1,200 lb for traprock) should be considered as site-specific and cannot be attributed to a particular ballast. Previous track operations at these locations, tie condition and age, and resistance levels before tamping can play an important role in the reduced resistance levels after tamping.
Data on peak resistance· values collected at various increments in MGT are shown in Figures 5 and 6. These data
clearly indicate that the resistance values increase monotonically up to some level. Figure 6 is of particular interest because it shows the significant gain in peak lateral resistance for small increments in consolidation. Such data will be helpful in determining slow-order duration for reduced train speeds soon after tamping or similar track operations.
Sampling Size
Because of inherent variations in the ballast and tie conditions, not all the STPTs in a given section will yield the same values. The longer the section is, the greater will be the scatter in the individual resistance values. Besides the section length, the scatter will depend on the track maintenance standards
Ul .0 .....
a..
3000
2000
1000
0 0.0 0 . 2
-"V--¢---
----<r----t:J.--[}--
0 ·"'
Zone 1 -Zone 2 -Zone 3 -Zone 4 -Zone 5 -Zone 6 -
o.e o.e 1.0 1. 2 1."4 1.11 1 . e
Displacement (inches)
Balloon Loop - 5 Degree Curve - Slag - 0. 1 MGT FAST Section 3 - 5 Degree Curve - Granite - 25 . 0 MGT FAST Section 7 - 5 Degree Curve - Slag - 25.0 MGT Balloon Loop - Tangent - Slag - 0. 1 MGT FAST Section 20 - Tangent - Slag - 100.0 MGT FAST Section 29/30 - Tangent - Granite - 25.0 MGT
FIGURE 3 Ballast resistance characterization tests (average STPT behavior summary for 2-in. tie displacement).
1500
1400
1300
1200
1100
1000
c;; 900 .0 800 :::=-
_J 700 u. 600
500
400
300
200
100
0 0 500 1000
FAST-S6, 8 TANGENT /SLAG
1500
·················• ···········
2000 2500
Fp (lbs)
REGRESSION LINE THAU l!Q.DATA POINTS COVERING ~MGTS
REGRESSION LINE THAU 4a DATA POINTS COVERING 15.2 MGTS
3000 3500
.... -.--. 0.30 Fp + 500, Fp > 726; Fp = FL for Fp < 726
•··· · · ·· ·• 0.06 Fp + 600· Fp > 638; Fp = FL for Fp < 638
FIGURE 4 Peak versus limit resistance (limit values occurred at tie displacements of 4 in. or larger).
4000
2.0
ATTTC
3200
3000
2800
2600
2400 Ii) .0 = f2" 2200 a. i:L w (!) c( 2000 a: w ~
1800
1600
1400
1200
1000
0 2 3 4 5 6 7 MGT
8 9
--0-- GRANITE
--0-- TRAPROCK
--8- SLAG
10 11 12 13
FIGURE 5 Ballast consolidation influence.
3.0
2.8
U> 2.6 c. ;g_
2.4 (f) 0 c( 2.2 g ::.::: 2.0 L5 a.
1.8 w (!)
~ 1.6 w ~ 1.4
1.2
1.0 0 0.1 0.2 0.3 0.4
3.0
2.8
:g_ 2.6
~ {/) 2.4 0 c( 0 2.2 ...I ~ L5 2.0 a.. w 1.8
~ a:: 1.6 w
~ 1.4
1.2
1.0 0 2345678910
MILLION GROSS TONS (MGT) MILLION GROSS TONS (MGT)
FIGURE 6 Fast ballast resistance characterization tests-consolidation influence (tangent track, granite ballast).
14 15
Samavedam and Kish
of the rai lroad . Tests have also indicated that for a given track section, the scatter increases with the increasing consolidation level.
Although the computer model described by the authors in another paper in this Record can account for the individual tie variations, it is not practical or desirable to test a large number of ties for buckling safety predictions. The question therefore arises whether a minimum (optimum) number of single-tie tests can be established for a given section length, the average of which can be considered as the resistance for the section under consideration. Such an average can then be used as an input parameter in the buckling model.
To address the foregoing question , a large number of tests was performed at TIC on different track sections and at different consolidation levels. Test sections about 50 ft Jong were considered for the case studies. In each section, alternating ties were tested, and the average of the 15 tested ties was considered to be the lateral resistance for the section.
20
a: 0 a: a: w u. 10 0 ~ 0
x <( :::? ZONE1 0.1 MGT
0 2 3 4 5 6
a) CELL NUMBER
20
a: 0 a: a: w u. 10 0 ~ 0
x <( :::? ZONE 2 25 MGT
0 2 3 4 5 6
c) CELL NUMBER
20
a: 0 a: a: w u. 10 0 ~ 0
x <( :::? ZONE 3 25 MGT
0 2 3 4 5 6
e) CELL NUMBER
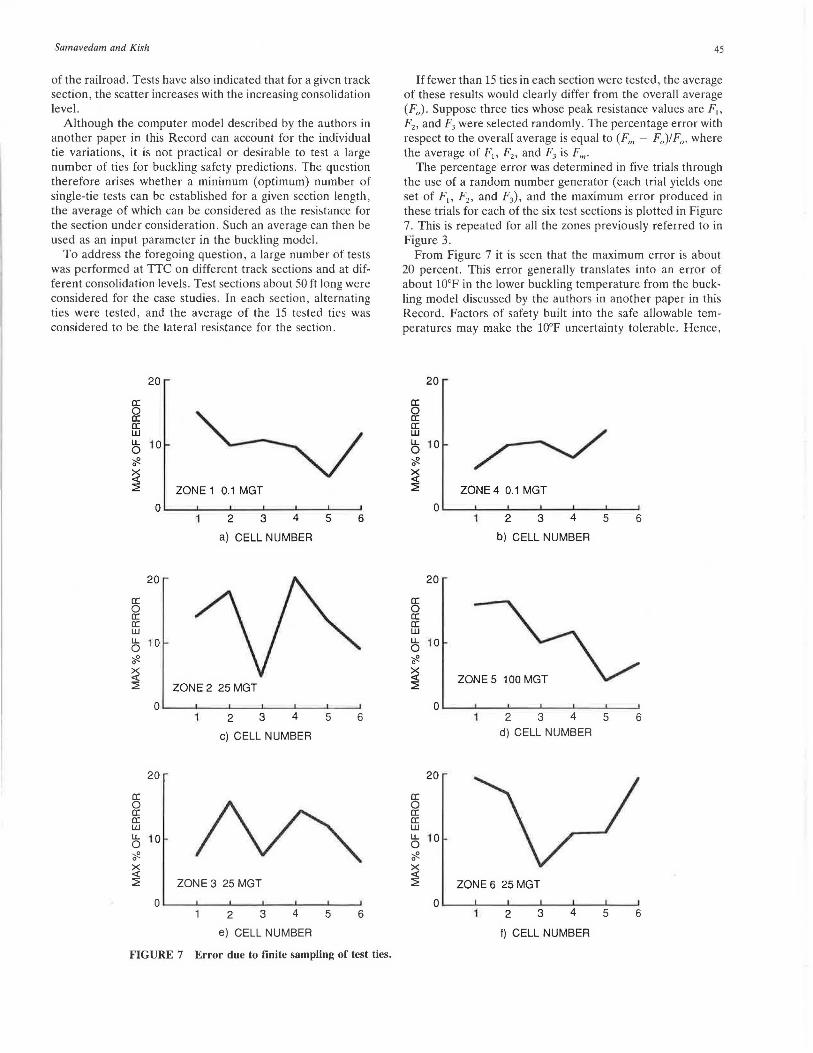
FIGURE 7 Error due to finite sampling of test ties.
45
Iffewer than 15 ties in each section were tested, the average of these results would clearly differ from the overall average (F0 ). Suppose three ties whose peak resistance values are F,, F2 , and F3 were selected randomly . The percentage error with respect to the overall average is equal to (F,,, - F0 )/F0 , where the average of F1 , F2 , and F3 is F,,,.
The percentage error was determined in five trials through the use of a random number generator (each trial yields one set of F 1, F2 , and F3), and the maximum error produced in these trials for each of the six test sections is plotted in Figure 7. This is repeated for all the zones previously referred to in Figure 3.
From Figure 7 it is seen that the maximum error is about 20 percent. This error generally translates into an error of about l0°F in the lower buckling temperature from the buckling model discussed by the authors in another paper in this Record. Factors of safety built into the safe allowable temperatures may make the 10°F uncertainty tolerable. Hence,
20
a: 0 a: a: w
~ u. 10 0 ~ 0
~ :::? ZONE 4 0.1 MGT
0 2 3 4 5 6
b) CELL NUMBER
20
a: 0 a: a: w u. 10 0 ~ 0
~ ZONE 5 100 MGT :::?
0 2 3 4 5 6
d) CELL NUMBER
20
a: 0 a: a: w u. 10 0 ~ 0
~ :::? ZONE6 25MGT
0 2 3 4 5 6
f) CELL NUMBER
46
it is concluded that a sample of three randomly selected ties for every 50-ft section may be adequate in the field application of STPT. Clearly, a linear extrapolation of this result would imply testing six ties for 100-ft sections. However, by visual inspection and proper engineering judgment, the number of STPTs required per unit of length can further be reduced as the length of the section increases. These and other practical considerations will be dealt with in upcoming studies.
Results for a sample size of five tics per 50-ft section, not presented here, indicate a maximum error of 10 percent, which is more than adequate from a practical point of view.
Figure 7 also indicates that tracks with low consolidation levels have a lower percentage error than highly consolidated tracks. This is fortunate because STPT is more important for tracks with low consolidation levels.
RAIL FORCE AND NEUTRAL TEMPERATURE MEASUREMENT
As stated earlier, the neutral or force-free temperature of CWR can be different from the initial temperature at installation. If the rail force Pis known at a given rail temperature T, then assuming the rails are fully constrained, the neutral temperature TN can be calculated from the equation
where
A = rail cross-sectional area, E = modulus, and ex = coefficient of thermal expansion.
TABLE 1 MAINTENANCE ACTIONS THAT INFLUENCE RAIL NEUTRAL TEMPERATURE VARIATIONS
Maintenance Activity Problem
CWR installation at extreme Hard to control a unifonn
temperatures laying temperature via rail
heating, cooling, and
des tressing
Destressing Difficulty in ensuring
uniform rail temperatures
(4)
during welding and anchoring
Replacing broken rail Rail stress free temperature
is usualJy not known, hence
it is difficult to adjust to it
Lining, lifting and tamping Rail longitudinal stress
distribution altered
TRANSPORTATION RESEARCH RECORD 1289
Of course, the rails are not fully constrained, but the equation can still be used to define a variable neutral temperature. Mechanisms contributing to neutral temperature variations are discussed elsewhere (8) . The mechanisms include rail longitudinal movements, track lateral shift and radial breathing in curves, and track vertical settlement. Rail longitudinal movement is caused by train braking and acceleration forces or by differential thermal forces (sun and shade). Track lateral shift can be caused by truck excessive hunting, lateral forces generated due to curving , or negotiation of lateral misalignments. Rail force can cause radial breathing of curves in weak ballast conditions. Vertical differential settlement of rails can occur on new or recently surfaced track or in areas of weak subgrade conditions.
These natural mechanisms demand that CWR neutral temperature be determined from time to time. Track maintenance operations, given in Table 1, can also affect the neutral temperature. It is desirable to determine the rail neutral temperatures after the track undergoes any of these operations. This is particularly important in spring and summer to ensure permissible values for buckling safety. Field data collected by TSC (8) using the strain gage affixed to rail on a number of revenue service tracks and tracks at TIC showed that the neutral temperature could drop from a typical installation value of 90°F to S0°F, thus significantly increasing the buckling risk on a hot day.
Measurement of Rail Force
Rail force measurement by Berry gage, strain gage, and the British Rail vibrating wire are well known but are not practical for use in the field, as explained elsewhere (9). They cannot provide the absolute rail force and need an initial reference level, usually obtained by cutting the rail. The vibrating wire technique requires that a hole be cut in the rail web. A number of other techniques (10) have been tried, some of which are listed in Table 2. These techniques generally suffer from problems of reliability, sensitivity to the rail residual stresses, and site-specific calibration requirements. To address these problems, a new technique has been recently developed, and a prototype test fixture has been used to validate the technique through field tests. The technique is founded on a well-known principle of mechanics , and it provides the absolute force without site-specific calibration. It is not destructive but requires removal of spikes and anchors from the test section rail.
The technique , which is based on rail uplift induced bending response, was originally described elsewhere by Kish and Samavedam (9).
Rail Uplift Method
If the rail is freed from the ties over some length, restrained vertically at the ends of the freed portion, and subjected to a concentrated uplift load at the center, the resulting deflec tion depends on the magnitude of the rail longitudinal force. Clearly, longitudinal compressive load will increase the deflection of the beam-column, and tensile force will reduce it . For a given length of rail, the vertical force required to pro-
Samavedam and Kish 47
TABLE 2 SUMMARY OF RAIL LONGITUDINAL STRESS MEASUREMENT TECHNIQUES
Technique
Flexural wave propagation
X-ray diffraction
Acousto-elastic
Magnetic coercion
Bark:hausen noise
Electromagnetic-acoustic
transducer (EMAT)
Laser "spackle"
T ...,_ _,.. p
Comment
Sensitive to the rail-tie
structure damping
Measures surface layer strains
only
Sensitive 10 rail microstructure
Sensitive to rail microstructure
and residual stress
Very difficult under field
conditions
Sensitive to rail microstructure
and rail surface condition
More useful in Jab application
due to accuracy required for
mapping laser interference
patterns
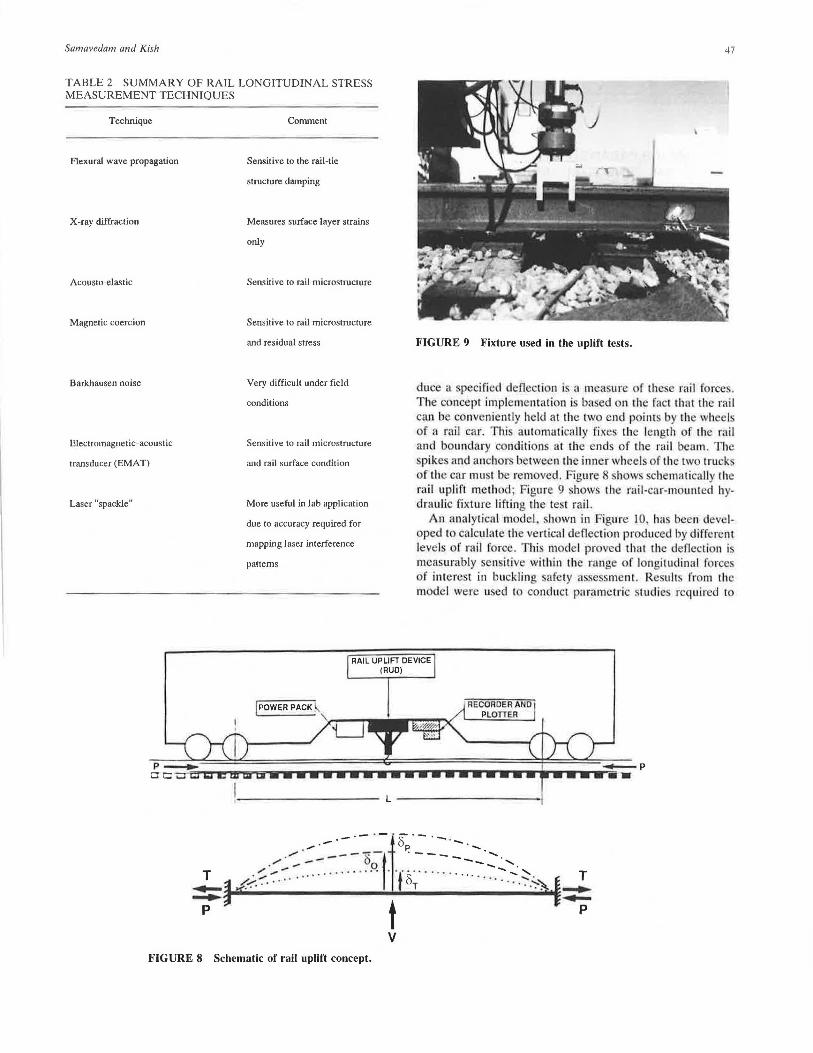
FIGURE 9 Fixture used in the uplift tests.
duce a specified deflection i a mea ure of th e rail force . The con ept implementation i ba ed on th fact that the rail can be conveniently held at the rwo end point · by the wh el of a rail car. This automatica lly fixes the length of the rnil and boundary conditi n at the ends of the rail cam. T he spikes and anchor between the inner wheels of the two truck of the car must be rem ved. Figure 8 how schematica lly the rail uplift method· Figure 9 show th rnil -car-m unted h -drnulic fixture lifting the tesr rail.
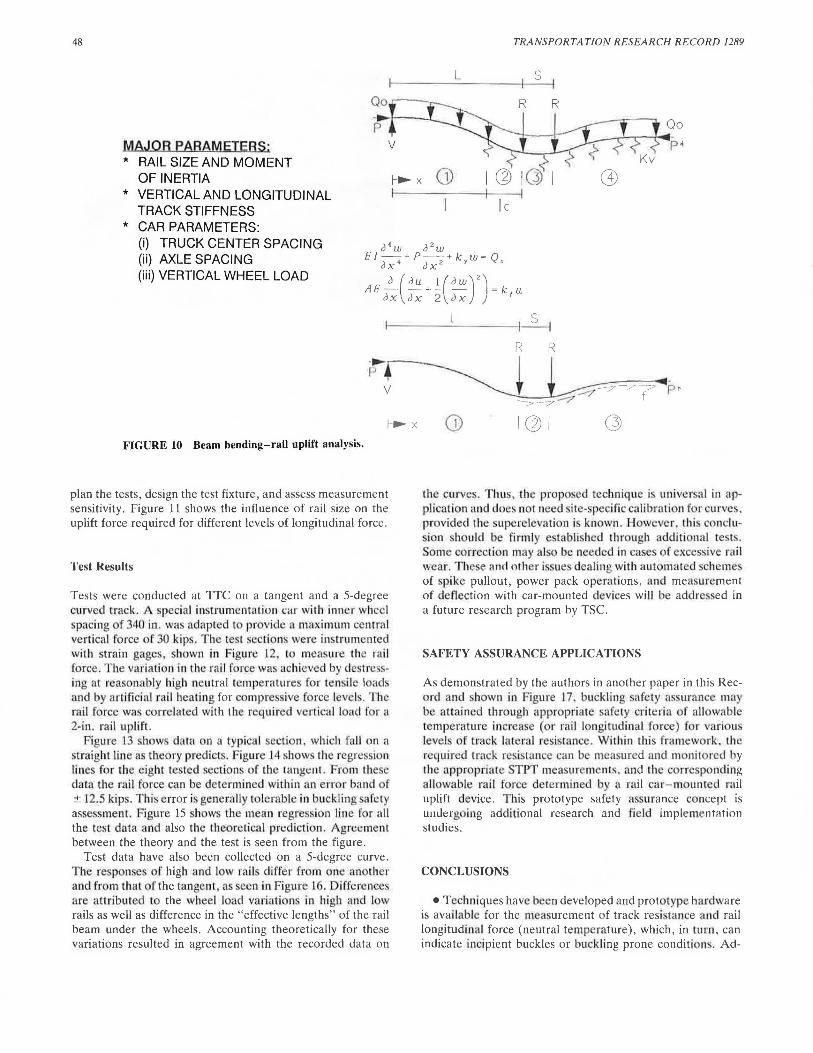
An analytica l model, shown in Figure 10, ha been developed to ca lculate the vertical deflection produced hy different level of rail force. Thi mod I pro ed that the d flection i measurably en itive within the range of longitudinal forces of interest in buckling a ety as es ment . Results from the mod I were used to conduct parametric . tudie required to
RAIL UPLIFT DEVICE (RUD)
RECORDER ANO PLOTTER
.----- · -·~-- --- -. ,,,... ..... ----x-t F! ____ -- ...... . • / - -- UQ -... ............. '-.
- ~-- ................ 't'8""" •· ........ - ..... ::::- . /.-:'.· · . • •. T .. . • · ·."':-'::-.
t v
T _,.. ..... p
FIGURE 8 Schematic of rail uplift concept.
48
MAJOR PARAMETERS: * RAIL SIZE AND MOMENT
OF INERTIA * VERTICAL AND LONGITUDINAL
TRACK STIFFNESS * CAR PARAMETERS:
TRANSPORTATION RESEARCH RECORD 1289
L s
le
(i) TRUCK CENTER SPACING (ii) AXLE SPACING
o•w o2 w Ef-+P-+k w=Q ox• ox 2 y 0
(iii) VERTICAL WHEEL LOAD llE~(ou+~(ow)
2
)=k u OX ox 2 ox I
t--~~~L~~~~~
v
FIGURE 10 Beam bending-rail uplift analysis.
plan the tests, design the test fixture, and assess measurement sensitivity. Figure 11 shows the influence of rail size on the uplift force required for different levels of longitudinal force.
Test Results
Tests were conducted at TIC on a tangent and a 5-degree curved track. A special instrumentation c;u· with inner wheel spacing of 340 in. was adapt d t provide a maximum central vertical force of ~o kip . The tes t section were in trumented with train gage ·, hown in Figure l 2 to measure Lli> rail force. 'T'he variation in the rail force was achieved by destr s -ing at reasonably high neutral temperatures for ten ile loads and by artificial rail heati ng for compressi e force level" The rail force was correlated with the required ertical load f r a 2-in. rail uplift.
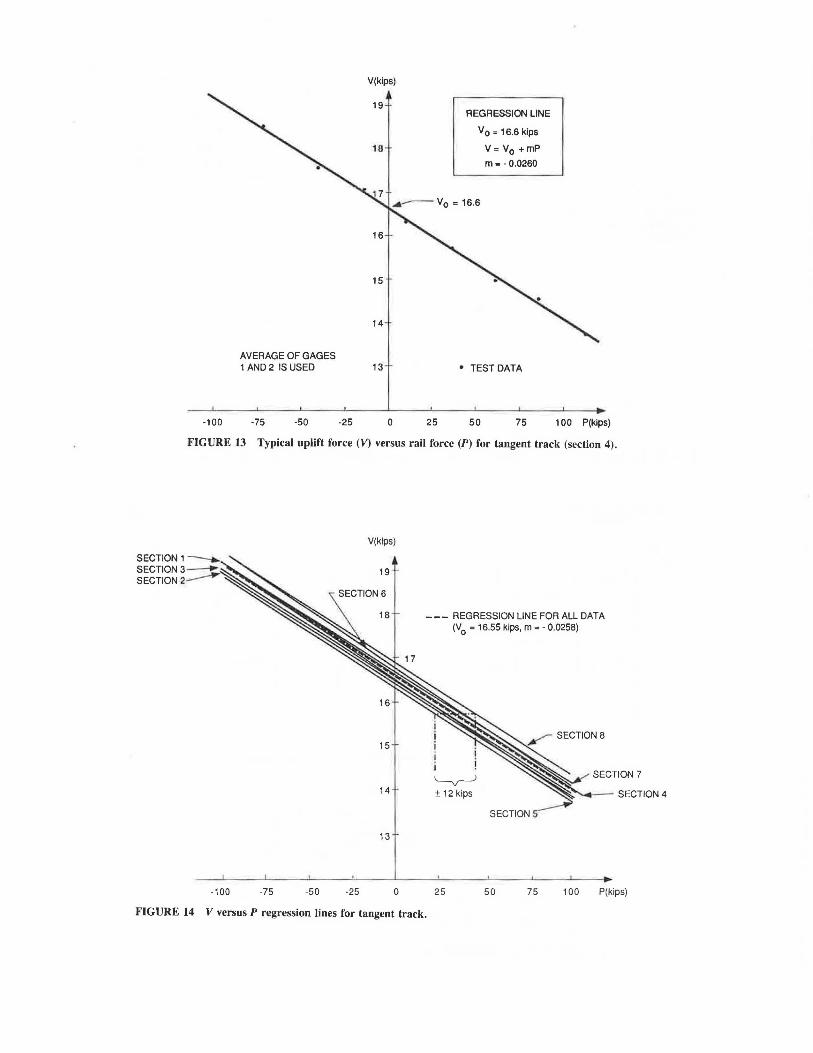
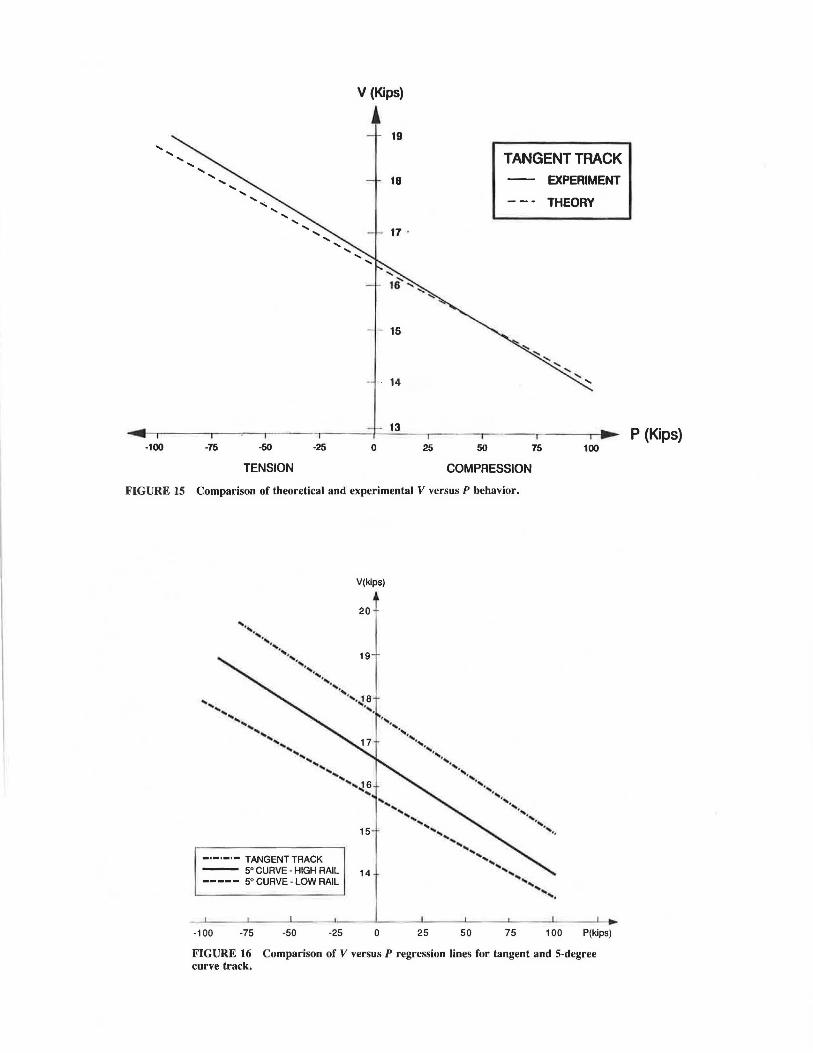
Figure l how data on a typical section, which fall on a straight line o. theory predicts . Figure J4 shows U1e regression lines for the eight tested sections of the tan •1::111. . r 111 the e data the rai l force can be determined within an error band of ± 12.5 kip . This error is generally tolerable in buckling afety assessment. Figure 15 shows the mean regre sion line for all the lest data and also the theoretical predicti n. Agreement between the theory and the test is seen from the figure.
Test data have also been collected on a 5-degree curve. The r pon. e of high and low rail differ from one another and from that of the tangent a seen in Figure 16. Differences are attributed to the wheel load variati ns in high and low rails as well as difference in the "effective lengths" of the rail beam under the wheels. Accounting theoretically for these variations resulted in agreement with the recorded data on
R
CD I (]) I
the curves. Thu • the proposed technique is univer al in application and does not need .itc-specific calibra ti n for curve • provided the superelevation is known. Howeve r thi. co11clu-io11 sh uld b firmly ·t, bli. heel through additional tests .
Some correction may also be needed in cases of excessive rail wear. The ·e C1ncl nther i. sue dealing with automat d schemes of -pike pullout, power pack operations, and mea urcment of deflection with car-mounted devices will b addre sed in a future research program by TSC.
SAFETY ASSURANCE APPLICATIONS
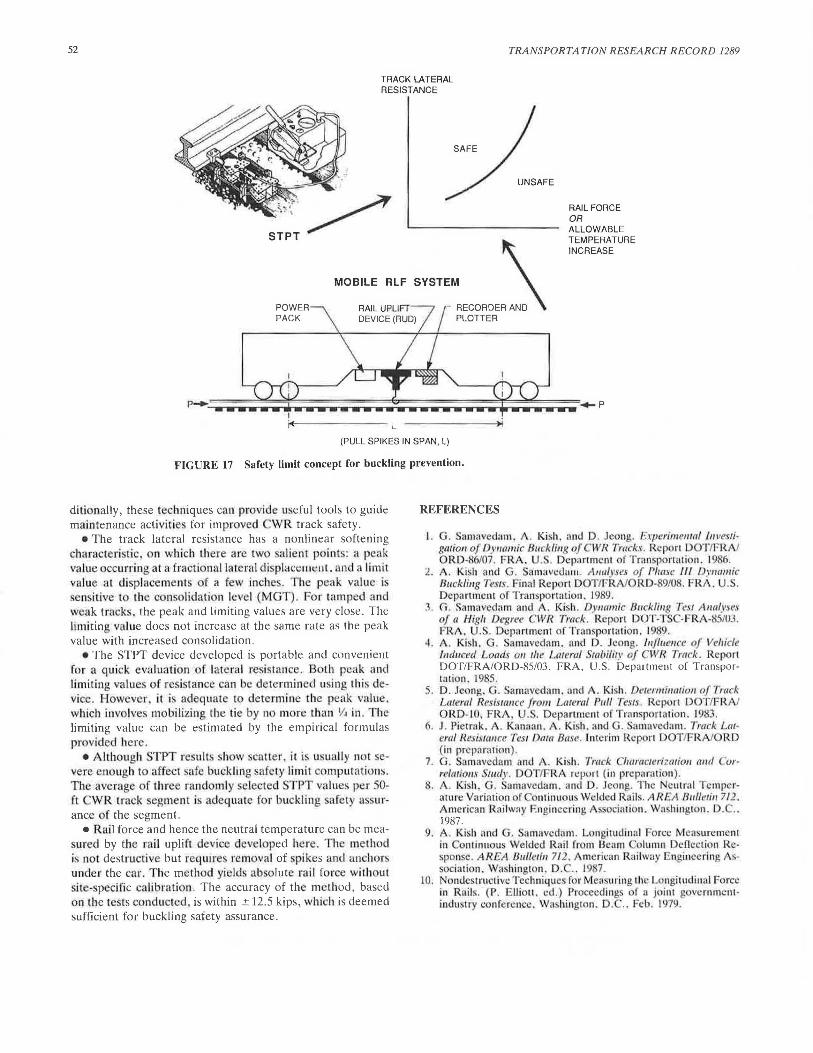
As demonstrated by the authors in another paper in this Record and shown in Figure 17, buckling afety a surance may be attained throu h appropriate safety criteria of allowable temperature incrca ·e (or rail longitudinal force) for various level of track lateral res.istance. Within thjs framework. the required track re ·istance can be measured and monitored l y the appropriate TPT mcasuremenrs. and the corre ponding allo~ able rail force determined by " mil car-mounted mil uplift device . This prototype safety a urance c ncept is undergoing additional research and field implemcntMion studies.
CONCLUSIONS
•Techniques have be n developed and prototype hardware is avai lable for the measurement of track resistance and rail longitudinal force (neutral temperature), which, in turn, can indicate incipient buckles or buckling prone condition~. Ad-
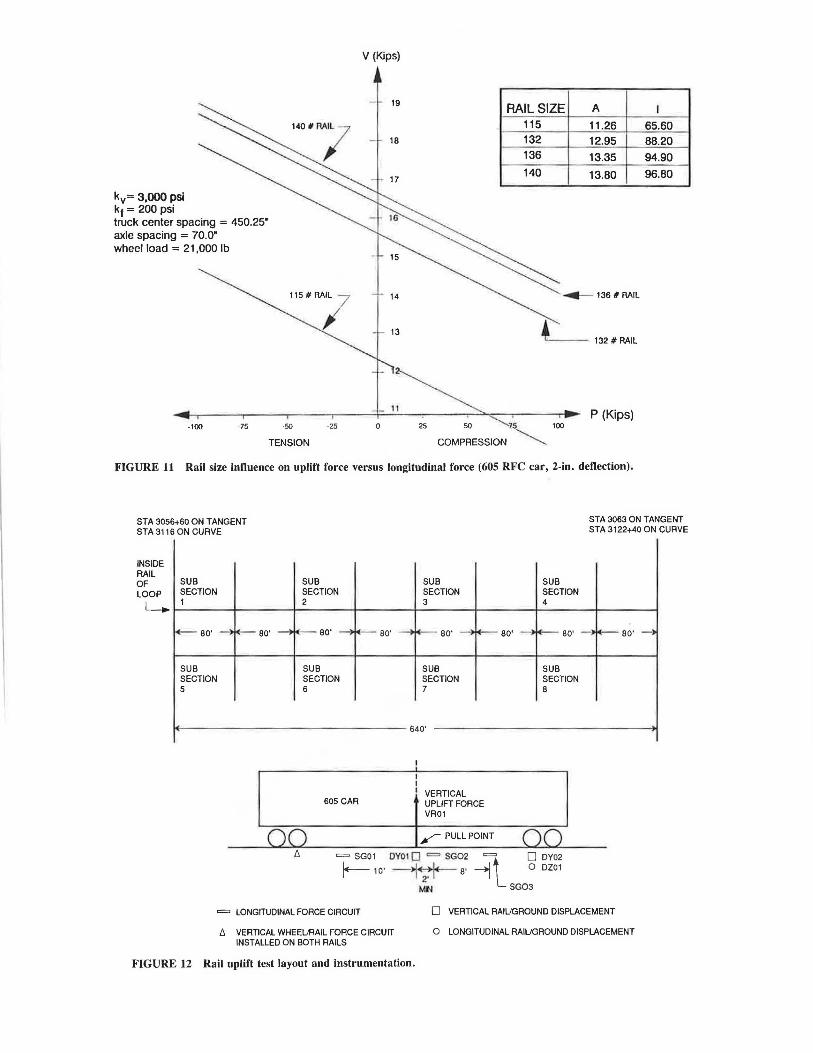
kv= 3,000 psi kt= 200 psi truck center spacing = 450.25" axle spacing = 70.0" wheel load = 21,000 lb
-100 -75
V (Kips)
19
18
-50 -25 0
TENSION
RAIL SIZE A
115 11.26 132 12.95 136 13.35 140 13.80
~136#RAIL
P (Kips) 25 50 75 100
COMPRESSION ~ FIGURE 11 Rail size influence on uplift force versus longitudinal force (605 RFC car, 2-in. deflection).
65.60 88.20
94.90
96.80
STA 3056+60 ON TANGENT STA 3116 ON CURVE
STA 3063 ON TANGENT STA 3122+40 ON CURVE
INSIDE RAIL OF LOOP
~
SUB SUB SECTION SECTION 1 2
80' 80' eo·
SUB SUB SECTION SECTION 5 6
SUB SECTION 3
-00· 80'
SUB SECTION 7
SUB SECTION 4
00· --i.,.._- 00·
SUB SECTION 8
- ---- ----- ----- - - 640'
605 CAR VERTICAL UPLIFT FORCE VR01
¥PULL POINT = SG01 DYOI 0 = SG02 =t 0 DY02 r-- 1 o· ir- s· -j 0 DZ01
MN SG03
= LONGITUDINAL FORCE CIRCUIT 0 VERTICAL RAIUGROUND DISPLACEMENT
00· -
l:J. VERTICAL WHEEURAIL FORCE CIRCUIT INSTALLED ON BOTH RAILS
0 LONGITUDINAL RAIUGROUND DISPLACEMENT
FIGURE 12 Rail uplift test layout and instrumentation.
-100
AVERAGE OF GAGES 1 AND 2 IS USED
-7S -SO -2S
V(kips)
19
18
16
1S
14
13
0 2S
REGRESSION LINE
Vo= 16.6 kips
V= V0 +mP
m= -0.0260
• TEST DATA
so 7S 100 P(kips)
FIGURE 13 Typical uplift force (V) versus rail force (P) for tangent track (section 4).
SECTION1 -., SECTION3~ SECTION 2--- .
V(kips)
19
18 --- REGRESSION LINE FOR All DATA
15
14
13
-100 -75 -50 -25 0
FIGURE 14 V versus P regression lines for tangent track.
(V0
= 16.SS kips, m = - 0.02S8)
~ ± 12 kips
25 so 7S
SECTION 7
......._.__ SECTION 4
100 P(kips)
.... .... .... .... ....
V (Kips)
19
.... .... 18 .... .... .... .... .... .... .... .... .... 17 . .... .... .... .... ....
15
• - 14
TANGENT TRACK EXPERIMENT
THEORY
...... 1-,-~~~y-~,-----,.-~~-.~~~,----'1_3~--r~~~,.-.~~-.-~~---,--...
-100 -75 -50 -25 0 25 50 75 100
TENSION COMPRESSION
FIGURE 15 Comparison of theoretical and experimental V versus P behavior.
V(klps)
... ... '·,, ...... .... ....
'·,,
20
19
.... ......... .J6
. .... ...... ...... ...... ..... ..... ...... ..... ...... ..... .....
-·-·-·- TANGENT TRACK
..... .... ,s ....
15
5° CURVE • HIGH RAIL 1 4 ----- 5° CURVE - LOW RAIL
-100 -75 -50 -25
. ... . .. ........ . .......
...... ...... .....
. ... .... . ... .,., . ... .... . ... .... ''·, . ... ...... ..... ...... ..... ..... ....
0 25 50
...... ...... .....
75
.........
...... ....
100 P(kips)
FIGURE 16 Comparison of V versus P regression lines for tangent and 5-degree curve track.
P (Kips)
52 TRANSPORTATION RESEARCH RECORD 1289
TRACK LATERAL RESISTANCE
MOBILE RLF
L
SYSTEM ~ RECORDER AN:\. PLOTTER
RAIL FORCE OR ALLOWABLE TEMPERATURE INCREASE
(PULL SPIKES IN SPAN, L)
FIGURE 17 Safety limit concept for buckling prevention.
ditionally, these techniques can provide useful tools to guide main tenance activit ie for improved WR track safety.
•The track lateral resistance has a nonlinear softening characrcri tic. on which there are two alie n1 p int : a peak value occurring at a fractional late ml d i place1111::11l. and, limit value at di p.lacement of a few inches. The peak value is sen ·itive t th consolidation I ·vcl (MGT) . For tampi.::d anu weak tracks, the peak and limiting values are very close. The limiting value does not increase at the same rate as the peak value with increased consolidation.
• The STPT device developed is portable and convenient for a quick evaluation of lateral resistance. B th peak and limiting values of re istanc can be determined usi n this device. However. it i adeq u. te to determine the peak value, which involv s mobilizing the tie by no more than l/J in . The limiting value can be estimated by the empirical formulas provided here.
•Although TPT re ·ults show sca lier. it. is u ·ually no! severe enough to affect safe buckli ng safety limit computations. The average of th ree randomly se lec ted STPT va lues per 50-ft WR track egment i adeq uate for buckling afe ty a ·surance of the segment.
• Rail force and hence the neutral temperature can be measured by the ra il uplift device d vel ped here. Tht: method is not destructive but rec1ui rcs removal of pikes and anchors under the car. The method yields absolute rai l fo rce without site- pccific calibration. The accuracy of the me thod, based on the tests conducted , is within ± 12 .S kips , which is deemed sufficient for buckling safety assurance.
REFERENCES
I.. . amavedam. A. Kish. aml D . Jeong. Experi111c111C1/ /11 11esti-ga1io11 oJ' Dym11n ic 811c:k/i11g of WR Tracks . Rep n DOT/FR/\/ O RD-86/07. FRA. U .. Departmcm of Tr;msportation. 19 6.
'..!. A . I i h a nd G. anrnvc<la111. ,.\1111/)\W! of f'lwsc Ill Dynnmic: 811ckli11g Tests. Fin;il Report D T R OJlD- 9/08. RA . .S. Depan111cn1 of Transporw tion. J989 .
3. Ci . Sam<1ved;un and A. Ki h. Dynamic B11ckli11g Tes! A11nly ·t•s of a Higli Degree WR Tl'(/c:k . Report DOT-1 . -FRA -115/UJ. FR/\ , U. ' . Dcpanmeni of Tran p n ation. 1989.
4. A. Kish. G . amnvcdam. and D. Jeong. l 11/lue11cc of Vt•hicle lllcluce<I Loads 011 1/u! Lmeral iability of WR Tmck . Report DOTIFRAIORD-85103. FRA, U.S. Department of Transporltlt ion. 1985.
5. D. Jeong. G. arnltvedam. and A. Kish. Der r111i11fltim1 of Track Lateral Re. isumce from Lmernl Pttll Te.1·1 • . Rcporl DOT/FR ORD-10, FRA. U .. De1>arlmcnt of rnnsportation. 1983.
6. J . Pietrek. A. Kanaan. A. Ki h. and . Samaved:1111. Track Lmeml Re is11111ce Tes1 Oma Br1 e. In terim Report OTIFR ORD (in preparation .
7. . amavcdam an l . Ki h. Tmck -11111'f1Ctt'rizmiu11 and ·or-r('/tlliom Study. DOTIPRA r.:pv1 t (in prcpnrai ion) .
8. A . Kish. . nmavcdam. and D. Jeong. The cutr<ll Temperature Vari.iii n of ontinu us Welded Rail.. AREA 811//t>1i11 712. American Railw:iy F.nginccring As ciation. Wa hingto n. D. .. 1987.
9. A. Kish and . nmavcdam. L )ngi tudina l Force Mca urement in ontinuous Welded Rai l from Beam o lumn Dencction Re· sponsc. AREA IJ11//eti11 712 , American Ruilwuy n •inecring Associ:1tion. Wa hington. D ... 19 7.
10. Nondestructive Techniques for lea uring the Lcmgitudin:i l Force in Rails. (P . lliott. ed.) Proceedings of a joint g vcrnmcnlindu try conference. Washington. D . .. Feb. 1979.