Continuous Water Quality Monitoring Periodic …...Continuous Water Quality Monitoring Periodic...
6
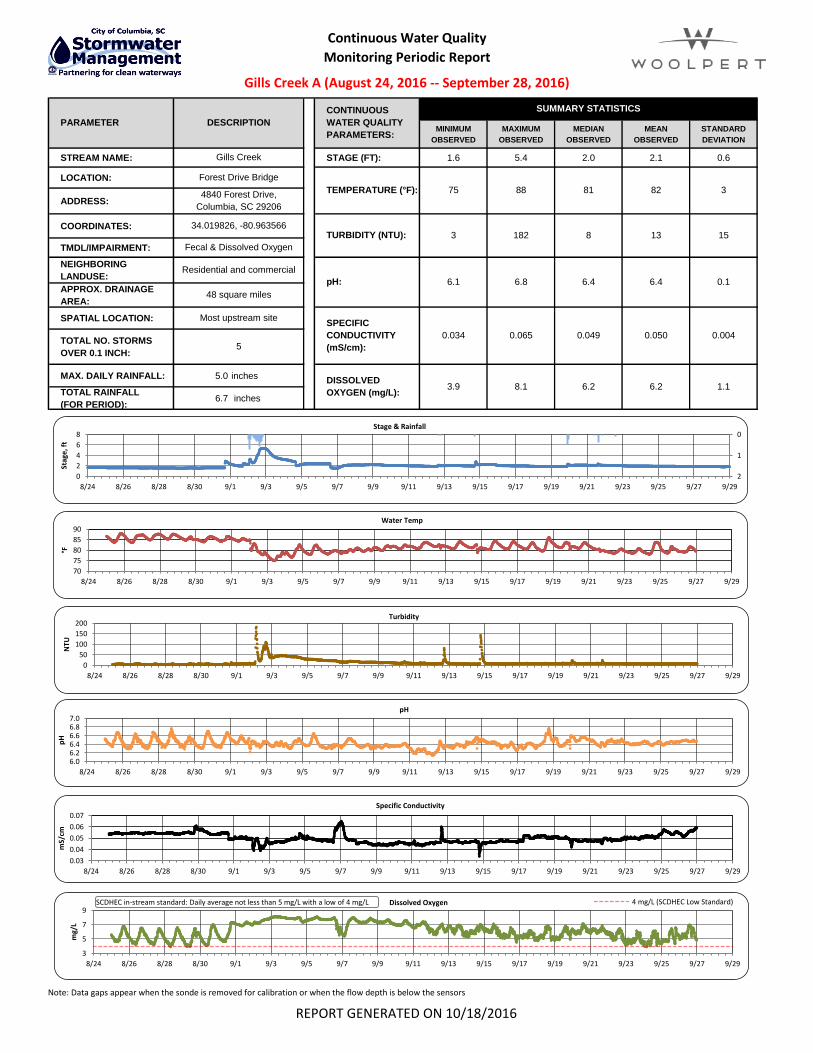
Continuous Water Quality Monitoring Periodic Report Gills Creek A (August 24, 2016 -- September 28, 2016) MINIMUM OBSERVED MAXIMUM OBSERVED MEDIAN OBSERVED MEAN OBSERVED STANDARD DEVIATION STREAM NAME: STAGE (FT): 1.6 5.4 2.0 2.1 0.6 LOCATION: ADDRESS: COORDINATES: TMDL/IMPAIRMENT: NEIGHBORING LANDUSE: APPROX. DRAINAGE AREA: SPATIAL LOCATION: TOTAL NO. STORMS OVER 0.1 INCH: MAX. DAILY RAINFALL: 5.0 inches TOTAL RAINFALL (FOR PERIOD): 6.7 inches Residential and commercial 48 square miles PARAMETER Gills Creek Forest Drive Bridge DESCRIPTION 4840 Forest Drive, Columbia, SC 29206 Most upstream site 5 3.9 TURBIDITY (NTU): 3 CONTINUOUS WATER QUALITY PARAMETERS: SUMMARY STATISTICS TEMPERATURE (°F): 75 88 81 82 3 34.019826, -80.963566 Fecal & Dissolved Oxygen 182 pH: 6.1 6.8 8.1 0.034 0.065 SPECIFIC CONDUCTIVITY (mS/cm): DISSOLVED OXYGEN (mg/L): 0.049 0.050 6.2 6.2 15 1.1 0.1 0.004 8 13 6.4 6.4 3 5 7 9 8/24 8/26 8/28 8/30 9/1 9/3 9/5 9/7 9/9 9/11 9/13 9/15 9/17 9/19 9/21 9/23 9/25 9/27 9/29 mg/L Dissolved Oxygen 4 mg/L (SCDHEC Low Standard) 0 50 100 150 200 8/24 8/26 8/28 8/30 9/1 9/3 9/5 9/7 9/9 9/11 9/13 9/15 9/17 9/19 9/21 9/23 9/25 9/27 9/29 NTU Turbidity 0 1 2 0 2 4 6 8 8/24 8/26 8/28 8/30 9/1 9/3 9/5 9/7 9/9 9/11 9/13 9/15 9/17 9/19 9/21 9/23 9/25 9/27 9/29 Stage, ft Stage & Rainfall 70 75 80 85 90 8/24 8/26 8/28 8/30 9/1 9/3 9/5 9/7 9/9 9/11 9/13 9/15 9/17 9/19 9/21 9/23 9/25 9/27 9/29 °F Water Temp 6.0 6.2 6.4 6.6 6.8 7.0 8/24 8/26 8/28 8/30 9/1 9/3 9/5 9/7 9/9 9/11 9/13 9/15 9/17 9/19 9/21 9/23 9/25 9/27 9/29 pH pH 0.03 0.04 0.05 0.06 0.07 8/24 8/26 8/28 8/30 9/1 9/3 9/5 9/7 9/9 9/11 9/13 9/15 9/17 9/19 9/21 9/23 9/25 9/27 9/29 mS/cm Specific Conductivity SCDHEC in-stream standard: Daily average not less than 5 mg/L with a low of 4 mg/L Note: Data gaps appear when the sonde is removed for calibration or when the flow depth is below the sensors REPORT GENERATED ON 10/18/2016
Transcript of Continuous Water Quality Monitoring Periodic …...Continuous Water Quality Monitoring Periodic...
Continuous Water Quality
Monitoring Periodic Report
Gills Creek A (August 24, 2016 -- September 28, 2016)
MINIMUM
OBSERVED
MAXIMUM
OBSERVED
MEDIAN
OBSERVED
MEAN
OBSERVED
STANDARD
DEVIATION
STREAM NAME: STAGE (FT): 1.6 5.4 2.0 2.1 0.6
LOCATION:
ADDRESS:
COORDINATES:
TMDL/IMPAIRMENT:
NEIGHBORING
LANDUSE:
APPROX. DRAINAGE
AREA:
SPATIAL LOCATION:
TOTAL NO. STORMS
OVER 0.1 INCH:
MAX. DAILY RAINFALL: 5.0 inches
TOTAL RAINFALL
(FOR PERIOD):6.7 inches
Residential and commercial
48 square miles
PARAMETER
Gills Creek
Forest Drive Bridge
DESCRIPTION
4840 Forest Drive,
Columbia, SC 29206
Most upstream site
5
3.9
TURBIDITY (NTU): 3
CONTINUOUS
WATER QUALITY
PARAMETERS:
SUMMARY STATISTICS
TEMPERATURE (°F): 75 88 81 82 3
34.019826, -80.963566
Fecal & Dissolved Oxygen
182
pH: 6.1 6.8
8.1
0.034 0.065
SPECIFIC
CONDUCTIVITY
(mS/cm):
DISSOLVED
OXYGEN (mg/L):
0.049 0.050
6.2 6.2
15
1.1
0.1
0.004
8 13
6.4 6.4
3
5
7
9
8/24 8/26 8/28 8/30 9/1 9/3 9/5 9/7 9/9 9/11 9/13 9/15 9/17 9/19 9/21 9/23 9/25 9/27 9/29
mg/
L
Dissolved Oxygen 4 mg/L (SCDHEC Low Standard)
0
50
100
150
200
8/24 8/26 8/28 8/30 9/1 9/3 9/5 9/7 9/9 9/11 9/13 9/15 9/17 9/19 9/21 9/23 9/25 9/27 9/29
NTU
Turbidity
0
1
20
2
4
6
8
8/24 8/26 8/28 8/30 9/1 9/3 9/5 9/7 9/9 9/11 9/13 9/15 9/17 9/19 9/21 9/23 9/25 9/27 9/29
Stag
e, f
t
Stage & Rainfall
70
75
80
85
90
8/24 8/26 8/28 8/30 9/1 9/3 9/5 9/7 9/9 9/11 9/13 9/15 9/17 9/19 9/21 9/23 9/25 9/27 9/29
°F
Water Temp
6.06.26.46.66.87.0
8/24 8/26 8/28 8/30 9/1 9/3 9/5 9/7 9/9 9/11 9/13 9/15 9/17 9/19 9/21 9/23 9/25 9/27 9/29
pH
pH
0.03
0.04
0.05
0.06
0.07
8/24 8/26 8/28 8/30 9/1 9/3 9/5 9/7 9/9 9/11 9/13 9/15 9/17 9/19 9/21 9/23 9/25 9/27 9/29
mS/
cm
Specific Conductivity
SCDHEC in-stream standard: Daily average not less than 5 mg/L with a low of 4 mg/L
Note: Data gaps appear when the sonde is removed for calibration or when the flow depth is below the sensors
REPORT GENERATED ON 10/18/2016
Continuous Water Quality
Monitoring Periodic Report
Gills Creek A (August 24, 2016 -- September 28, 2016)
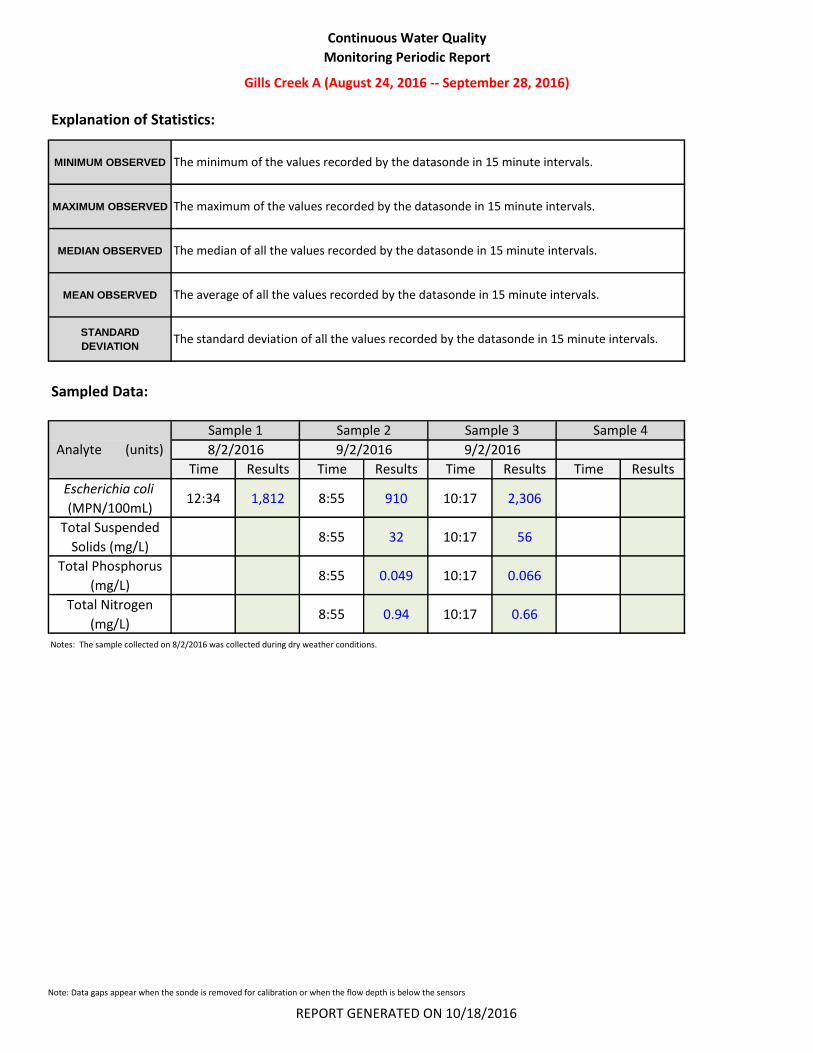
Explanation of Statistics:
MINIMUM OBSERVED
MAXIMUM OBSERVED
MEDIAN OBSERVED
MEAN OBSERVED
STANDARD
DEVIATION
Sampled Data:
Time Results Time Results Time Results Time Results
Escherichia coli
(MPN/100mL)12:34 1,812 8:55 910 10:17 2,306
Total Suspended
Solids (mg/L)8:55 32 10:17 56
Total Phosphorus
(mg/L)8:55 0.049 10:17 0.066
Total Nitrogen
(mg/L)8:55 0.94 10:17 0.66
Notes: The sample collected on 8/2/2016 was collected during dry weather conditions.
The minimum of the values recorded by the datasonde in 15 minute intervals.
The maximum of the values recorded by the datasonde in 15 minute intervals.
The median of all the values recorded by the datasonde in 15 minute intervals.
The average of all the values recorded by the datasonde in 15 minute intervals.
The standard deviation of all the values recorded by the datasonde in 15 minute intervals.
Analyte (units)
Sample 1 Sample 2 Sample 3 Sample 4
9/2/20169/2/20168/2/2016
Note: Data gaps appear when the sonde is removed for calibration or when the flow depth is below the sensors
REPORT GENERATED ON 10/18/2016
Continuous Water Quality
Monitoring Periodic Report
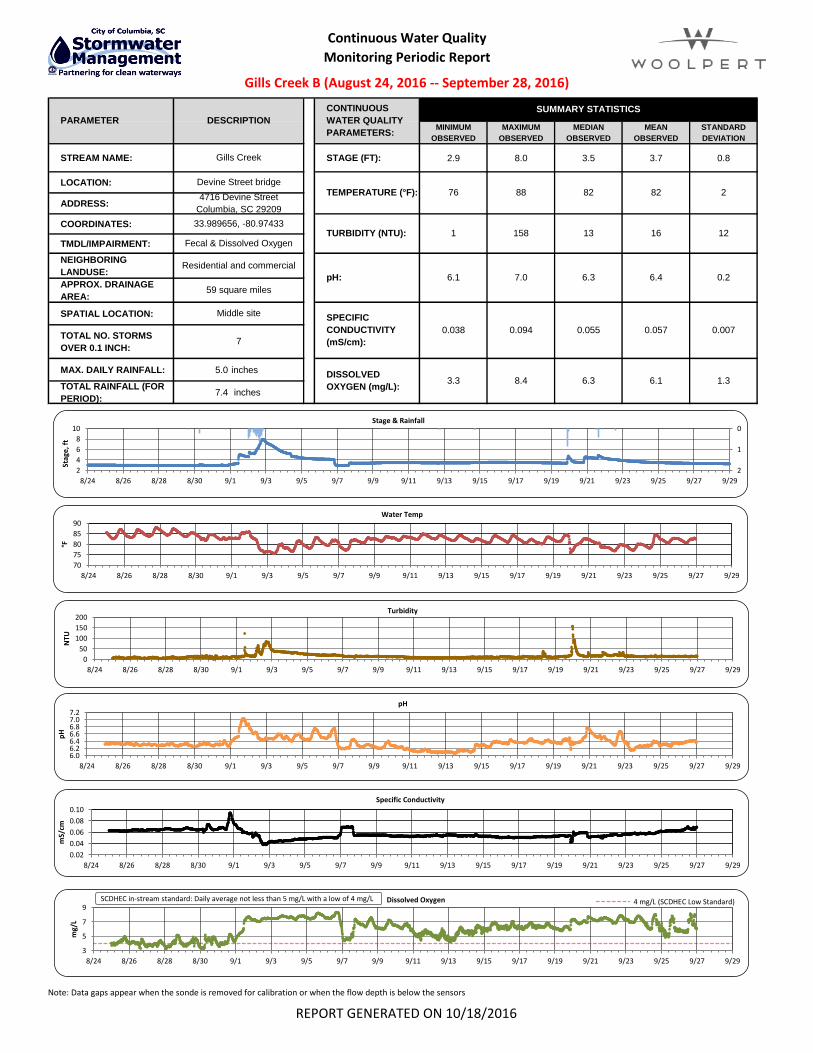
Gills Creek B (August 24, 2016 -- September 28, 2016)
MINIMUM
OBSERVED
MAXIMUM
OBSERVED
MEDIAN
OBSERVED
MEAN
OBSERVED
STANDARD
DEVIATION
STREAM NAME: STAGE (FT): 2.9 8.0 3.5 3.7 0.8
LOCATION:
ADDRESS:
COORDINATES:
TMDL/IMPAIRMENT:
NEIGHBORING
LANDUSE:
APPROX. DRAINAGE
AREA:
SPATIAL LOCATION:
TOTAL NO. STORMS
OVER 0.1 INCH:
MAX. DAILY RAINFALL: 5.0 inches
TOTAL RAINFALL (FOR
PERIOD):7.4 inches
PARAMETER
CONTINUOUS
WATER QUALITY
PARAMETERS:
SUMMARY STATISTICS
TEMPERATURE (°F): 76 88 82 82 2
Gills Creek
DESCRIPTION
Devine Street bridge
4716 Devine Street
Columbia, SC 29209
33.989656, -80.97433
Fecal & Dissolved Oxygen
7
SPECIFIC
CONDUCTIVITY
(mS/cm):
DISSOLVED
OXYGEN (mg/L):
Residential and commercial
59 square miles
Middle site
0.2
TURBIDITY (NTU): 1 158 13 16 12
pH: 6.1 7.0 6.3 6.4
1.3
0.038 0.094 0.055 0.057 0.007
3.3 8.4 6.3 6.1
3
5
7
9
8/24 8/26 8/28 8/30 9/1 9/3 9/5 9/7 9/9 9/11 9/13 9/15 9/17 9/19 9/21 9/23 9/25 9/27 9/29
mg/
L
Dissolved Oxygen 4 mg/L (SCDHEC Low Standard)
0
50
100
150
200
8/24 8/26 8/28 8/30 9/1 9/3 9/5 9/7 9/9 9/11 9/13 9/15 9/17 9/19 9/21 9/23 9/25 9/27 9/29
NTU
Turbidity
0
1
22
4
6
8
10
8/24 8/26 8/28 8/30 9/1 9/3 9/5 9/7 9/9 9/11 9/13 9/15 9/17 9/19 9/21 9/23 9/25 9/27 9/29
Stag
e, f
t
Stage & Rainfall
70
75
80
85
90
8/24 8/26 8/28 8/30 9/1 9/3 9/5 9/7 9/9 9/11 9/13 9/15 9/17 9/19 9/21 9/23 9/25 9/27 9/29
°F
Water Temp
6.06.26.46.66.87.07.2
8/24 8/26 8/28 8/30 9/1 9/3 9/5 9/7 9/9 9/11 9/13 9/15 9/17 9/19 9/21 9/23 9/25 9/27 9/29
pH
pH
0.02
0.04
0.06
0.08
0.10
8/24 8/26 8/28 8/30 9/1 9/3 9/5 9/7 9/9 9/11 9/13 9/15 9/17 9/19 9/21 9/23 9/25 9/27 9/29
mS/
cm
Specific Conductivity
SCDHEC in-stream standard: Daily average not less than 5 mg/L with a low of 4 mg/L
Note: Data gaps appear when the sonde is removed for calibration or when the flow depth is below the sensors
REPORT GENERATED ON 10/18/2016

Continuous Water Quality
Monitoring Periodic Report
Gills Creek B (August 24, 2016 -- September 28, 2016)
Explanation of Statistics:
MINIMUM OBSERVED
MAXIMUM OBSERVED
MEDIAN OBSERVED
MEAN OBSERVED
STANDARD
DEVIATION
Sampled Data:
Time Results Time Results Time Results Time Results
Escherichia coli
(MPN/100mL)12:18 6,152 10:43 1,112 13:30 4196
Total Suspended
Solids (mg/L)10:43 47.2 13:30 326
Total Phosphorus
(mg/L)10:43 0.089 13:30 0.11
Total Nitrogen
(mg/L)10:43 1.59 13:30 1.06
Notes: The sample collected on 8/2/2016 was collected during dry weather conditions.
The minimum of the values recorded by the datasonde in 15 minute intervals.
The maximum of the values recorded by the datasonde in 15 minute intervals.
The average of all the values recorded by the datasonde in 15 minute intervals.
The median of all the values recorded by the datasonde in 15 minute intervals.
The standard deviation of all the values recorded by the datasonde in 15 minute intervals.
Analyte (units)
Sample 1 Sample 2 Sample 3 Sample 4
9/2/20169/2/20168/2/2016
Note: Data gaps appear when the sonde is removed for calibration or when the flow depth is below the sensors
REPORT GENERATED ON 10/18/2016
Continuous Water Quality
Monitoring Periodic Report
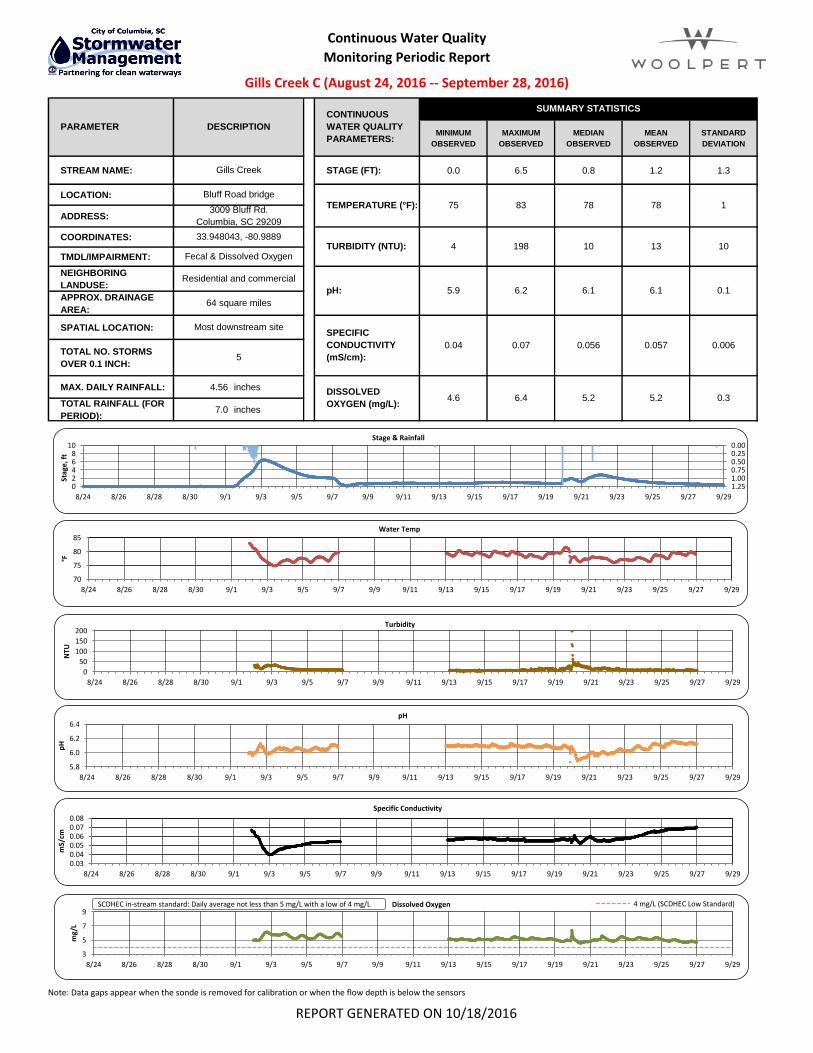
Gills Creek C (August 24, 2016 -- September 28, 2016)
MINIMUM
OBSERVED
MAXIMUM
OBSERVED
MEDIAN
OBSERVED
MEAN
OBSERVED
STANDARD
DEVIATION
STREAM NAME: STAGE (FT): 0.0 6.5 0.8 1.2 1.3
LOCATION:
ADDRESS:
COORDINATES:
TMDL/IMPAIRMENT:
NEIGHBORING
LANDUSE:
APPROX. DRAINAGE
AREA:
SPATIAL LOCATION:
TOTAL NO. STORMS
OVER 0.1 INCH:
MAX. DAILY RAINFALL: 4.56 inches
TOTAL RAINFALL (FOR
PERIOD):7.0 inches
33.948043, -80.9889
Fecal & Dissolved Oxygen
Residential and commercial
64 square miles
Most downstream site
PARAMETER
CONTINUOUS
WATER QUALITY
PARAMETERS:
SUMMARY STATISTICS
TEMPERATURE (°F): 75 83 78 78 1
Gills Creek
DESCRIPTION
Bluff Road bridge
3009 Bluff Rd.
Columbia, SC 29209
5
SPECIFIC
CONDUCTIVITY
(mS/cm):
0.1
TURBIDITY (NTU): 4 198 10 13 10
pH: 5.9 6.2 6.1 6.1
DISSOLVED
OXYGEN (mg/L):0.3
0.04 0.07 0.056 0.057 0.006
4.6 6.4 5.2 5.2
3
5
7
9
8/24 8/26 8/28 8/30 9/1 9/3 9/5 9/7 9/9 9/11 9/13 9/15 9/17 9/19 9/21 9/23 9/25 9/27 9/29
mg/
L
Dissolved Oxygen 4 mg/L (SCDHEC Low Standard)
0
50
100
150
200
8/24 8/26 8/28 8/30 9/1 9/3 9/5 9/7 9/9 9/11 9/13 9/15 9/17 9/19 9/21 9/23 9/25 9/27 9/29
NTU
Turbidity
0.000.250.500.751.001.250
2468
10
8/24 8/26 8/28 8/30 9/1 9/3 9/5 9/7 9/9 9/11 9/13 9/15 9/17 9/19 9/21 9/23 9/25 9/27 9/29
Stag
e, f
t
Stage & Rainfall
70
75
80
85
8/24 8/26 8/28 8/30 9/1 9/3 9/5 9/7 9/9 9/11 9/13 9/15 9/17 9/19 9/21 9/23 9/25 9/27 9/29
°F
Water Temp
5.8
6.0
6.2
6.4
8/24 8/26 8/28 8/30 9/1 9/3 9/5 9/7 9/9 9/11 9/13 9/15 9/17 9/19 9/21 9/23 9/25 9/27 9/29
pH
pH
0.030.040.050.060.070.08
8/24 8/26 8/28 8/30 9/1 9/3 9/5 9/7 9/9 9/11 9/13 9/15 9/17 9/19 9/21 9/23 9/25 9/27 9/29
mS/
cm
Specific Conductivity
SCDHEC in-stream standard: Daily average not less than 5 mg/L with a low of 4 mg/L
Note: Data gaps appear when the sonde is removed for calibration or when the flow depth is below the sensors
REPORT GENERATED ON 10/18/2016
Continuous Water Quality
Monitoring Periodic Report
Gills Creek C (August 24, 2016 -- September 28, 2016)
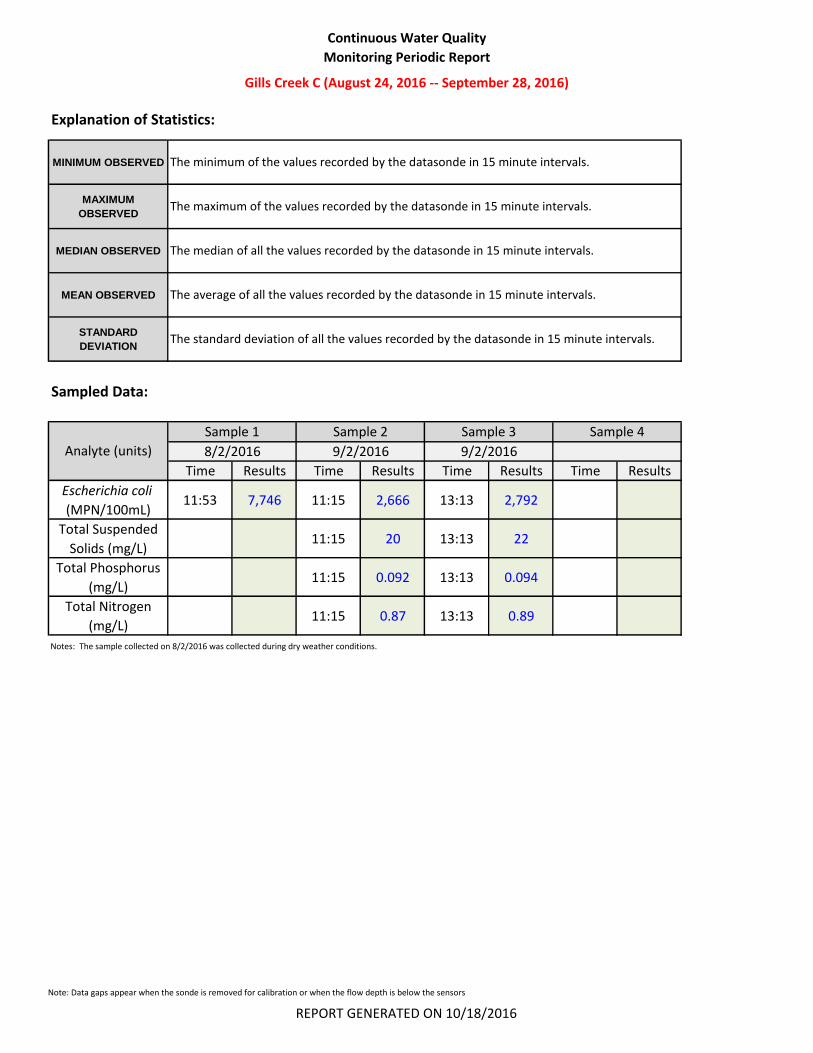
Explanation of Statistics:
MINIMUM OBSERVED
MAXIMUM
OBSERVED
MEDIAN OBSERVED
MEAN OBSERVED
STANDARD
DEVIATION
Sampled Data:
Time Results Time Results Time Results Time Results
Escherichia coli
(MPN/100mL)11:53 7,746 11:15 2,666 13:13 2,792
Total Suspended
Solids (mg/L)11:15 20 13:13 22
Total Phosphorus
(mg/L)11:15 0.092 13:13 0.094
Total Nitrogen
(mg/L)11:15 0.87 13:13 0.89
Notes: The sample collected on 8/2/2016 was collected during dry weather conditions.
Analyte (units)
The minimum of the values recorded by the datasonde in 15 minute intervals.
The maximum of the values recorded by the datasonde in 15 minute intervals.
The median of all the values recorded by the datasonde in 15 minute intervals.
The average of all the values recorded by the datasonde in 15 minute intervals.
The standard deviation of all the values recorded by the datasonde in 15 minute intervals.
8/2/2016 9/2/2016 9/2/2016
Sample 4Sample 3Sample 2Sample 1
Note: Data gaps appear when the sonde is removed for calibration or when the flow depth is below the sensors
REPORT GENERATED ON 10/18/2016