Continuous real-time correction and averaging for ... · PDF fileContinuous real-time...
8
Continuous real-time correction and averaging for frequency comb interferometry Julien Roy, 1 Jean-Daniel Deschênes, 1 Simon Potvin, 1 and Jérôme Genest 1,* 1 Centre d’optique, photonique et laser, 2375 rue de la Terrasse, Université Laval, Québec, Québec G1V 0A6, Canada * [email protected] Abstract: Interferograms from a dual-comb spectrometer are continuously corrected and averaged in real-time. The algorithm is implemented on a field-programmable gate array (FPGA) development board. The chosen approach and the algorithm are described. Measurements with high signal- to-noise ratio, resolution and bandwidth are shown to demonstrate the accuracy of the optical referencing and the processing algorithm with 24 hours of averaging time, reaching a signal to noise ratio of 10,750,000 (>21 bits) in the interferogram and 316,000 in the spectrum at 100 MHz resolution. An interferogram where signal dominates the noise over the full delay range imposed by the 100 MHz repetition rate is reported for the first time. ©2012 Optical Society of America OCIS codes: (120.3940) Metrology; (120.4640) Optical instruments; (140.4050) Mode-locked lasers; (300.6300) Spectroscopy, Fourier transforms. References and links 1. S.-J. Lee, B. Widiyatmoko, M. Kourogi, and M. Ohtsu, “Ultrahigh scanning speed optical coherence tomography,” Jpn. J. Appl. Phys. 40(Part 2, No. 8B), L878–L880 (2001). 2. S. Schiller, “Spectrometry with frequency combs,” Opt. Lett. 27(9), 766–768 (2002). 3. F. Keilmann, C. Gohle, and R. Holzwarth, “Time-domain mid-infrared frequency-comb spectrometer,” Opt. Lett. 29(13), 1542–1544 (2004). 4. A. Schliesser, M. Brehm, F. Keilmann, and D. van der Weide, “Frequency-comb infrared spectrometer for rapid, remote chemical sensing,” Opt. Express 13(22), 9029–9038 (2005). 5. B. Bernhardt, A. Ozawa, P. Jacquet, M. Jacquey, Y. Kobayashi, T. Udem, R. Holzwarth, G. Guelachvili, T. Hänsch, and N. Picqué, “Cavity-enhanced dual-comb spectroscopy,” Nat. Photonics 4(1), 55–57 (2010). 6. I. Coddington, W. C. Swann, and N. R. Newbury, “Coherent linear optical sampling at 15 bits of resolution,” Opt. Lett. 34(14), 2153–2155 (2009). 7. A. M. Zolot, F. R. Giorgetta, E. Baumann, J. W. Nicholson, W. C. Swann, I. Coddington, and N. R. Newbury, “Direct-comb molecular spectroscopy with accurate, resolved comb teeth over 43 THz,” Opt. Lett. 37(4), 638– 640 (2012). 8. S. Kray, F. Spöler, T. Hellerer, and H. Kurz, “Electronically controlled coherent linear optical sampling for optical coherence tomography,” Opt. Express 18(10), 9976–9990 (2010). 9. I. Coddington, W. C. Swann, and N. R. Newbury, “Coherent dual-comb spectroscopy at high signal-to-noise ratio,” Phys. Rev. A 82(4), 043817 (2010). 10. A. Poisson, T. Ideguchi, G. Guelachvili, N. Picqué, and T. Hänsch, “Adaptive dual-comb spectroscopy with free- running lasers and resolved comb lines,” in CLEO: Science and Innovations, OSA Technical Digest paper CW1J.1, (2012). 11. T. Ideguchi, A. Poisson, G. Guelachvili, N. Picqué, and T. Hänsch, “Adaptive real-time dual-comb spectroscopy”, arXiv:1201.4177v1 (2012). 12. J.-D. Deschênes, P. Giaccarri, and J. Genest, “Optical referencing technique with CW lasers as intermediate oscillators for continuous full delay range frequency comb interferometry,” Opt. Express 18(22), 23358–23370 (2010). 13. P. Giaccari, J.-D. Deschênes, P. Saucier, J. Genest, and P. Tremblay, “Active Fourier-transform spectroscopy combining the direct RF beating of two fiber-based mode-locked lasers with a novel referencing method,” Opt. Express 16(6), 4347–4365 (2008). 14. C. Mohr, A. Romann, A. Ruehl, I. Hartl, and M. Fermann, “Fourier transform spectrometry using a single cavity length modulated mode-locked fiber laser,” in Fiber Laser Applications, OSA Technical Digest (CD) (Optical Society of America, 2011), paper FWA2. 15. A. Ambardar, Digital signal processing: a modern introduction (Thomson, 2007) p. 294. #173588 - $15.00 USD Received 31 Jul 2012; revised 30 Aug 2012; accepted 30 Aug 2012; published 11 Sep 2012 (C) 2012 OSA 24 September 2012 / Vol. 20, No. 20 / OPTICS EXPRESS 21932
-
Upload
trinhkhuong -
Category
Documents
-
view
229 -
download
3
Transcript of Continuous real-time correction and averaging for ... · PDF fileContinuous real-time...
Continuous real-time correction and averaging for frequency comb interferometry
Julien Roy,1 Jean-Daniel Deschênes,1 Simon Potvin,1 and Jérôme Genest1,* 1Centre d’optique, photonique et laser, 2375 rue de la Terrasse, Université Laval, Québec, Québec G1V 0A6,
Canada *[email protected]
Abstract: Interferograms from a dual-comb spectrometer are continuously corrected and averaged in real-time. The algorithm is implemented on a field-programmable gate array (FPGA) development board. The chosen approach and the algorithm are described. Measurements with high signal-to-noise ratio, resolution and bandwidth are shown to demonstrate the accuracy of the optical referencing and the processing algorithm with 24 hours of averaging time, reaching a signal to noise ratio of 10,750,000 (>21 bits) in the interferogram and 316,000 in the spectrum at 100 MHz resolution. An interferogram where signal dominates the noise over the full delay range imposed by the 100 MHz repetition rate is reported for the first time.
©2012 Optical Society of America
OCIS codes: (120.3940) Metrology; (120.4640) Optical instruments; (140.4050) Mode-locked lasers; (300.6300) Spectroscopy, Fourier transforms.
References and links 1. S.-J. Lee, B. Widiyatmoko, M. Kourogi, and M. Ohtsu, “Ultrahigh scanning speed optical coherence
tomography,” Jpn. J. Appl. Phys. 40(Part 2, No. 8B), L878–L880 (2001). 2. S. Schiller, “Spectrometry with frequency combs,” Opt. Lett. 27(9), 766–768 (2002). 3. F. Keilmann, C. Gohle, and R. Holzwarth, “Time-domain mid-infrared frequency-comb spectrometer,” Opt. Lett.
29(13), 1542–1544 (2004). 4. A. Schliesser, M. Brehm, F. Keilmann, and D. van der Weide, “Frequency-comb infrared spectrometer for rapid,
remote chemical sensing,” Opt. Express 13(22), 9029–9038 (2005). 5. B. Bernhardt, A. Ozawa, P. Jacquet, M. Jacquey, Y. Kobayashi, T. Udem, R. Holzwarth, G. Guelachvili, T.
Hänsch, and N. Picqué, “Cavity-enhanced dual-comb spectroscopy,” Nat. Photonics 4(1), 55–57 (2010). 6. I. Coddington, W. C. Swann, and N. R. Newbury, “Coherent linear optical sampling at 15 bits of resolution,”
Opt. Lett. 34(14), 2153–2155 (2009). 7. A. M. Zolot, F. R. Giorgetta, E. Baumann, J. W. Nicholson, W. C. Swann, I. Coddington, and N. R. Newbury,
“Direct-comb molecular spectroscopy with accurate, resolved comb teeth over 43 THz,” Opt. Lett. 37(4), 638–640 (2012).
8. S. Kray, F. Spöler, T. Hellerer, and H. Kurz, “Electronically controlled coherent linear optical sampling for optical coherence tomography,” Opt. Express 18(10), 9976–9990 (2010).
9. I. Coddington, W. C. Swann, and N. R. Newbury, “Coherent dual-comb spectroscopy at high signal-to-noise ratio,” Phys. Rev. A 82(4), 043817 (2010).
10. A. Poisson, T. Ideguchi, G. Guelachvili, N. Picqué, and T. Hänsch, “Adaptive dual-comb spectroscopy with free-running lasers and resolved comb lines,” in CLEO: Science and Innovations, OSA Technical Digest paper CW1J.1, (2012).
11. T. Ideguchi, A. Poisson, G. Guelachvili, N. Picqué, and T. Hänsch, “Adaptive real-time dual-comb spectroscopy”, arXiv:1201.4177v1 (2012).
12. J.-D. Deschênes, P. Giaccarri, and J. Genest, “Optical referencing technique with CW lasers as intermediate oscillators for continuous full delay range frequency comb interferometry,” Opt. Express 18(22), 23358–23370 (2010).
13. P. Giaccari, J.-D. Deschênes, P. Saucier, J. Genest, and P. Tremblay, “Active Fourier-transform spectroscopy combining the direct RF beating of two fiber-based mode-locked lasers with a novel referencing method,” Opt. Express 16(6), 4347–4365 (2008).
14. C. Mohr, A. Romann, A. Ruehl, I. Hartl, and M. Fermann, “Fourier transform spectrometry using a single cavity length modulated mode-locked fiber laser,” in Fiber Laser Applications, OSA Technical Digest (CD) (Optical Society of America, 2011), paper FWA2.
15. A. Ambardar, Digital signal processing: a modern introduction (Thomson, 2007) p. 294.
#173588 - $15.00 USD Received 31 Jul 2012; revised 30 Aug 2012; accepted 30 Aug 2012; published 11 Sep 2012(C) 2012 OSA 24 September 2012 / Vol. 20, No. 20 / OPTICS EXPRESS 21932

16. W. Swann and S. Gilbert, “Pressure-induced shift and broadening of 1510–1540-nm acetylene wavelength calibration lines,” J. Opt. Soc. Am. B 17(7), 1263–1270 (2000).
17. W. Swann and S. Gilbert, “Line centers, pressure shift, and pressure broadening of 1530-1560 nm hydrogen cyanide wavelength calibration lines,” J. Opt. Soc. Am. B 22(8), 1749–1756 (2005).
18. V. Michaud-Belleau, J. Roy, S. Potvin, J.-R. Carrier, L.-S. Verret, M. Charlebois, J. Genest, and C. Nì Allen, “Whispering gallery mode sensing with a dual frequency comb probe,” Opt. Express 20(3), 3066–3075 (2012).
19. P. Jacquet, J. Mandon, B. Bernhardt, R. Holzwarth, G. Guelachvili, T. Hänsch, and N. Picqué, “Frequency comb Fourier transform spectroscopy with kHz optical resolution,” in Fourier Transform Spectroscopy, OSA Technical Digest (CD) (Optical Society of America, 2009), paper FMB2.
1. Introduction
The control of the interference between the pulses in a pair of slightly desynchronized mode-locked lasers is emerging as a tool of choice for high-precision and high-speed spectrometry and interferometry [1–8]. To fully benefit from the measurement speed however, one needs to acquire, process and average the data at a rate comparable to the laser pulse repetition rate. This has been achieved using combs stabilized against state-of-the-art cavity-stabilized continuous-wave lasers with a hertz-level line-width [6], where 5.1 seconds of data was coherently averaged. In 2010, the same group reported FPGA averaging in batches of 0.5 seconds, limited by the mutual coherence of the lasers [9]. Averaging was also reported [10] and further described in [11] using free-running lasers and a generated sampling grid where full-resolution interferograms were coherently added over 162 ms. In [12], we demonstrate a posteriori correction of 2 seconds of continuous data at full resolution. The a posteriori correction method reported in [12, 13] was deemed very complex [10, 14] however, we show in this paper that it is possible to implement it in commercial off-the-shelf programmable hardware, thus reporting the first true real-time and unlimited co-adding of dual comb interferograms.
Enabling turnkey operation of dual-comb interferometers is an important goal to widen the user base for all the aforementioned applications. To achieve this, a central unit must coordinate the data acquisition, processing and instrument control tasks. Given the high data rates involved, this seems perfectly suited for a field-programmable gate array (FPGA) platform. The FPGA board, with analog to digital converters (ADCs) can sample the interferograms, apply any required software post-correction in real-time, average batches of measurements and output the results to a personal computer. Using digital to analog converters (DACs), the FPGA system can also loosely control the free-running pulsed lasers and the continuous wave lasers to make sure all beating signals remain in the electrical frequency range of interest. Communicating with a program running on the computer this system can also provide an interface to the end-user to seamlessly start and stop acquisitions.
In this paper we report the continuous real-time averaging of dual-comb interferograms for a period of 24 hours (7,500,000 measurements) without losing a single interferogram. This is achieved using a system built around a Xilinx Vitex-5 FPGA. The coherent averaging leads to a spectral signal-to-noise ratio of 316,000:1 (55 dB) at the full (100 MHz) resolution of the dual-comb spectrometer. In the time domain, this corresponds to a signal to noise ratio of 10,750,000 on the interferogram. This represents more than 21 bits of dynamic range.
#173588 - $15.00 USD Received 31 Jul 2012; revised 30 Aug 2012; accepted 30 Aug 2012; published 11 Sep 2012(C) 2012 OSA 24 September 2012 / Vol. 20, No. 20 / OPTICS EXPRESS 21933
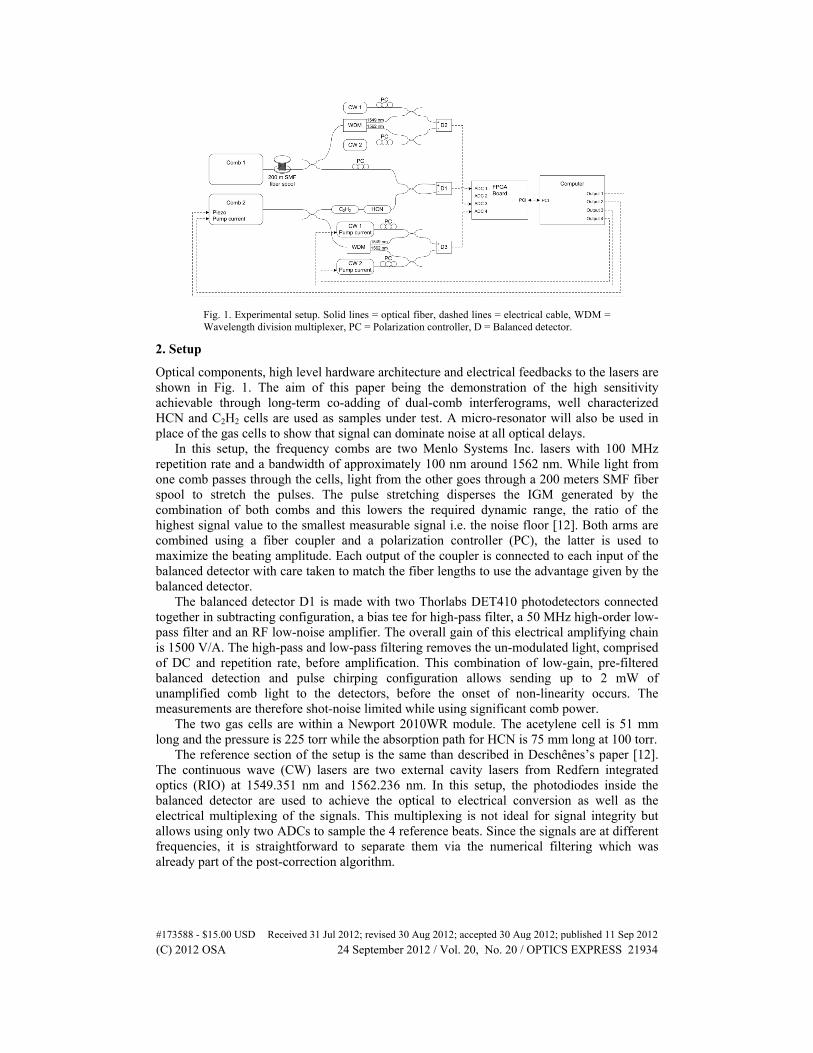
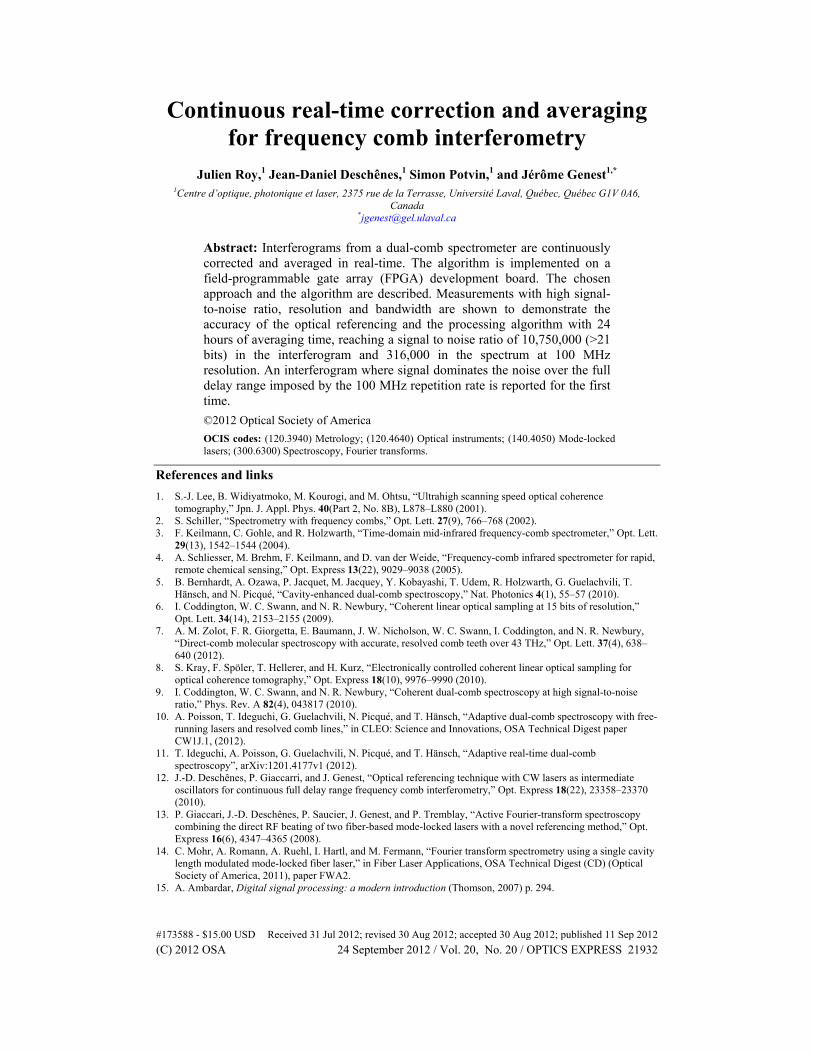
Fig. 1. Experimental setup. Solid lines = optical fiber, dashed lines = electrical cable, WDM = Wavelength division multiplexer, PC = Polarization controller, D = Balanced detector.
2. Setup
Optical components, high level hardware architecture and electrical feedbacks to the lasers are shown in Fig. 1. The aim of this paper being the demonstration of the high sensitivity achievable through long-term co-adding of dual-comb interferograms, well characterized HCN and C2H2 cells are used as samples under test. A micro-resonator will also be used in place of the gas cells to show that signal can dominate noise at all optical delays.
In this setup, the frequency combs are two Menlo Systems Inc. lasers with 100 MHz repetition rate and a bandwidth of approximately 100 nm around 1562 nm. While light from one comb passes through the cells, light from the other goes through a 200 meters SMF fiber spool to stretch the pulses. The pulse stretching disperses the IGM generated by the combination of both combs and this lowers the required dynamic range, the ratio of the highest signal value to the smallest measurable signal i.e. the noise floor [12]. Both arms are combined using a fiber coupler and a polarization controller (PC), the latter is used to maximize the beating amplitude. Each output of the coupler is connected to each input of the balanced detector with care taken to match the fiber lengths to use the advantage given by the balanced detector.
The balanced detector D1 is made with two Thorlabs DET410 photodetectors connected together in subtracting configuration, a bias tee for high-pass filter, a 50 MHz high-order low-pass filter and an RF low-noise amplifier. The overall gain of this electrical amplifying chain is 1500 V/A. The high-pass and low-pass filtering removes the un-modulated light, comprised of DC and repetition rate, before amplification. This combination of low-gain, pre-filtered balanced detection and pulse chirping configuration allows sending up to 2 mW of unamplified comb light to the detectors, before the onset of non-linearity occurs. The measurements are therefore shot-noise limited while using significant comb power.
The two gas cells are within a Newport 2010WR module. The acetylene cell is 51 mm long and the pressure is 225 torr while the absorption path for HCN is 75 mm long at 100 torr.
The reference section of the setup is the same than described in Deschênes’s paper [12]. The continuous wave (CW) lasers are two external cavity lasers from Redfern integrated optics (RIO) at 1549.351 nm and 1562.236 nm. In this setup, the photodiodes inside the balanced detector are used to achieve the optical to electrical conversion as well as the electrical multiplexing of the signals. This multiplexing is not ideal for signal integrity but allows using only two ADCs to sample the 4 reference beats. Since the signals are at different frequencies, it is straightforward to separate them via the numerical filtering which was already part of the post-correction algorithm.
#173588 - $15.00 USD Received 31 Jul 2012; revised 30 Aug 2012; accepted 30 Aug 2012; published 11 Sep 2012(C) 2012 OSA 24 September 2012 / Vol. 20, No. 20 / OPTICS EXPRESS 21934

Variations of the repetition rate difference (Δfr) and the carrier-to-envelope offset difference (ΔfCEO) are extracted from the reference signals in the FPGA and transferred periodically to the computer. The computer modifies the voltage applied to the piezoelectric stretcher located in the laser cavity and the pump current of Comb 2 to compensate for the slow drifts of Δfr and ΔfCEO. In order to maintain the electrical beating signal of the references away from DC and from the Nyquist frequency, the computer also modifies the pump currents on CW 1 and CW 2. All of these servo loops are only used to fix operating conditions for the acquisition and do not correct the sampled IGMs. All these servo loops are very slow with 1 update every few seconds and bandwidths smaller than 1 Hz.
3. Hardware architecture
To develop the real-time correction, a SMT351T FPGA module, a SMT384 ADC module and a SMT310Q carrier board from Sundance Multiprocessor Technology were used. The SMT351T has one Xilinx Vitex-5 (XC5VSX50T) FPGA, and 512 MB of RAM. The SMT384 has four ADS5500 Texas Instrument ADCs, operated at a rate of 125 MS/s with 14-bit quantification.
4. Software architecture
Most of the algorithms are done in the Virtex-5 FPGA to be able to do real-time averaging of corrected IGMs. The high-level software architecture is described in Fig. 2. Following subsections explain the functions of blocks presented in the software architecture diagram.
Fig. 2. Software architecture to acquire, post-correct and average in real-time the dual-comb interferograms.
4.1 Reference extraction
In order to be able to correct the distortion due to Δfr and ΔfCEO, reference signals must be extracted from electrical signals of ADC 3 and ADC 4. A reference corresponds to one tooth of Comb 1 and one tooth of Comb 2, around the CW laser frequency, beating together. Two references at two different optical frequencies are needed to correct the two varying parameters, Δfr and ΔfCEO. Band-pass filters (BPF) are used to separate the CW – Comb beatings previously multiplexed and to improve the signal to noise ratio (SNR) of the time domain signals. These filters are complex to only select the positive or negative frequencies of the beating. Complex multiplications after BPFs multiply beatings from CW 1 – Comb 1 with CW 1 – Comb 2 and CW 2 – Comb 1 with CW 2 – Comb 2. This step removes the fluctuations from CW 1 and CW 2 and generates both reference signals used for the second step.
4.2 Phase correction
The processing platform allows for the acquisition and real-time processing of two interferogram signals simultaneously. This can be useful for differential measurements. Signals from ADCs 1 and 2 are high-pass filtered to eliminate their DC offset. The IGMs are
#173588 - $15.00 USD Received 31 Jul 2012; revised 30 Aug 2012; accepted 30 Aug 2012; published 11 Sep 2012(C) 2012 OSA 24 September 2012 / Vol. 20, No. 20 / OPTICS EXPRESS 21935
then phase-corrected using the phase information of reference 1. The purpose of the angle and complex exponential blocks is to remove the amplitude fluctuations of the beat signal and keep the phase only. The phase correction then simply consists in a complex multiplication with the interferogram. The result of this phase correction can be seen as pinning the tooth of the spectrum at the frequency of reference 1 to DC. These baseband IGMs are then low-pass filtered to remove the negative frequencies and allow decimation.
4.3 Equidistant sampling grid
Because the content at the frequency of reference 1 is now brought to zero, the only remaining effect that the spectrum can suffer is a varying scaling factor that depends upon the difference between the frequencies of reference 1 and reference 2. Multiplying the two references and extracting the phase results in a signal whose slope is proportional to the instantaneous frequency difference between the two reference signals. The grid is unwrapped to generate a continuously increasing x-axis and it is low-pass filtered to eliminate high frequency noise. Sampling on equal increments of this phase signal therefore amounts to sample on an equidistant path delay grid.
4.4 Alignment and averaging
To average IGMs correctly, the exact period between two center bursts must be known and the IGMs must be phase aligned. Note that the zero delay position and phase can slowly drift because the fiber paths are different for the reference and measurement interferometer. Also, because Δfr is only coarsely controlled, the exact number of samples between consecutive IGMs is not necessarily an integer.
Before starting the averaging, sections around the zero path difference (ZPD) are transferred to the PC for two consecutive IGMs. Thousands of samples are transferred for each section and the exact number of samples between the sections is also sent to the computer. A complete cross-correlation is then computed in the PC and the exact period is returned to the FPGA to start the alignment. Because of the computational complexity of the cross-correlation operation, only few points can be computed in real-time in the FPGA. In the same manner as in a GPS receiver, a handful of correlation points around the center are computed, and it is enough to track the drifts of the IGM peak and phase. The maximal position of the cross-correlation between the newly corrected IGM and the stored average gives the position and phase offsets needed to sum them coherently. Its position and phase offset are fed back into Phase Correction and Resample blocks (see Fig. 2) to align the next IGM with those already averaged. The newly corrected IGM is then accumulated into the on-board memory.
5. Results
To demonstrate the reliability and the accuracy of the correction, a 24 hour measurement has been done using the setup shown in Fig. 1. One of the combs is filtered by two reference gas cells, respectively containing C2H2 and HCN. In this paper, the time-domain signal to noise ratio (SNR) refers to the ratio of peak amplitude over the standard deviation of the noise. The single shot measurement of our setup has a SNR of 126.2 for a 142 nm (22 THz) window. After 24 hours of averaging, a SNR of 341,066 is reached. These IGMs are presented in Fig. 3(a). The square root of the number of IGMs averaged provides the expected SNR gain, assuming uncorrelated noise. As 7,500,000 IGMs were averaged during the 24 hour measurement, a gain of 2,739 should be reached, which is close enough to the gain of 2,703 obtained experimentally. As the maximal amplitude scales with the number of IGMs summed and because the SNR increases with the square root of N, it is safe to say that IGMs were coherently summed during the 24 hours of the measurement.
#173588 - $15.00 USD Received 31 Jul 2012; revised 30 Aug 2012; accepted 30 Aug 2012; published 11 Sep 2012(C) 2012 OSA 24 September 2012 / Vol. 20, No. 20 / OPTICS EXPRESS 21936
Fig. 3. Acquired IGMs from the setup described in Fig. 2. (a) Single-shot (blue) measurement and (red) averaged IGMs chirped by 200 m of SMF fiber. (b) Averaged IGMs, dechirped numerically to retrieve the impulse response of the sample.
The IGMs sampled by the ADC were chirped to lower the dynamic range needed. This chirp can be numerically removed by post-processing to recover the impulse response of the sample [18]. Once the chirp is removed, the IGM (see Fig. 3(b)) has a SNR of 10,750,000. Quantization can be represented as an additive noise uniformly distributed on the quantization interval. Because the variance of a uniform noise is 2 2 /12LSBσ = , where LSB is the size of the quantization interval [15], the number of bits required to express a signal with given SNR is:
2
SNRlog ( )
12 (1)
Thus, the IGM has 21.57 bits of dynamic range. The free induction decay of the gases in the cells can be observed above the noise level floor up to optical delays larger than 2 ns. In [6], a 15 bit dynamic range was reported. This was not taking into account the variance of a uniformly distributed noise hence overestimating slightly their dynamic range.
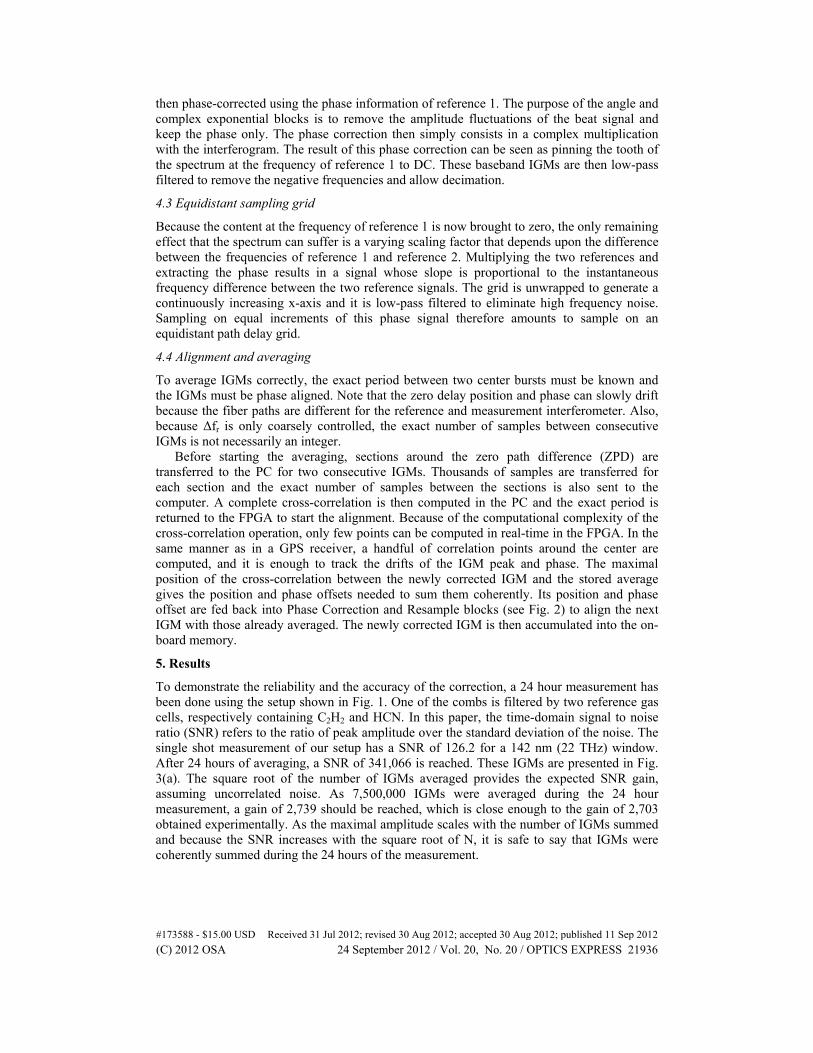
Fig. 4. Spectrum of the 24 hour measurement. (a) Full spectrum on a logarithmic scale. (b) Transmittance of the C2H2 and HCN cells. The baseline was normalized by fitting. (c) Zoom between 1527 nm and 1530.5 nm of the cells transmittance. Difference in the width between HCN and C2H2 lines is attributable to the pressure in the two cells.
#173588 - $15.00 USD Received 31 Jul 2012; revised 30 Aug 2012; accepted 30 Aug 2012; published 11 Sep 2012(C) 2012 OSA 24 September 2012 / Vol. 20, No. 20 / OPTICS EXPRESS 21937
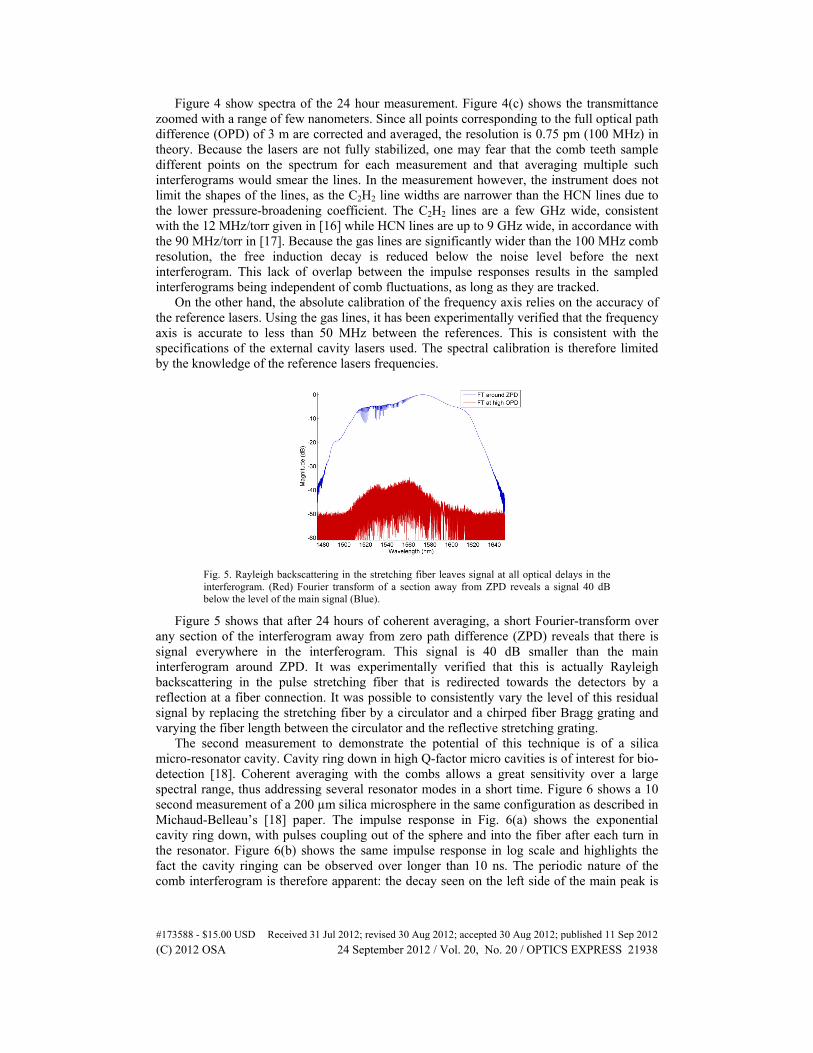
Figure 4 show spectra of the 24 hour measurement. Figure 4(c) shows the transmittance zoomed with a range of few nanometers. Since all points corresponding to the full optical path difference (OPD) of 3 m are corrected and averaged, the resolution is 0.75 pm (100 MHz) in theory. Because the lasers are not fully stabilized, one may fear that the comb teeth sample different points on the spectrum for each measurement and that averaging multiple such interferograms would smear the lines. In the measurement however, the instrument does not limit the shapes of the lines, as the C2H2 line widths are narrower than the HCN lines due to the lower pressure-broadening coefficient. The C2H2 lines are a few GHz wide, consistent with the 12 MHz/torr given in [16] while HCN lines are up to 9 GHz wide, in accordance with the 90 MHz/torr in [17]. Because the gas lines are significantly wider than the 100 MHz comb resolution, the free induction decay is reduced below the noise level before the next interferogram. This lack of overlap between the impulse responses results in the sampled interferograms being independent of comb fluctuations, as long as they are tracked.
On the other hand, the absolute calibration of the frequency axis relies on the accuracy of the reference lasers. Using the gas lines, it has been experimentally verified that the frequency axis is accurate to less than 50 MHz between the references. This is consistent with the specifications of the external cavity lasers used. The spectral calibration is therefore limited by the knowledge of the reference lasers frequencies.
Fig. 5. Rayleigh backscattering in the stretching fiber leaves signal at all optical delays in the interferogram. (Red) Fourier transform of a section away from ZPD reveals a signal 40 dB below the level of the main signal (Blue).
Figure 5 shows that after 24 hours of coherent averaging, a short Fourier-transform over any section of the interferogram away from zero path difference (ZPD) reveals that there is signal everywhere in the interferogram. This signal is 40 dB smaller than the main interferogram around ZPD. It was experimentally verified that this is actually Rayleigh backscattering in the pulse stretching fiber that is redirected towards the detectors by a reflection at a fiber connection. It was possible to consistently vary the level of this residual signal by replacing the stretching fiber by a circulator and a chirped fiber Bragg grating and varying the fiber length between the circulator and the reflective stretching grating.
The second measurement to demonstrate the potential of this technique is of a silica micro-resonator cavity. Cavity ring down in high Q-factor micro cavities is of interest for bio-detection [18]. Coherent averaging with the combs allows a great sensitivity over a large spectral range, thus addressing several resonator modes in a short time. Figure 6 shows a 10 second measurement of a 200 µm silica microsphere in the same configuration as described in Michaud-Belleau’s [18] paper. The impulse response in Fig. 6(a) shows the exponential cavity ring down, with pulses coupling out of the sphere and into the fiber after each turn in the resonator. Figure 6(b) shows the same impulse response in log scale and highlights the fact the cavity ringing can be observed over longer than 10 ns. The periodic nature of the comb interferogram is therefore apparent: the decay seen on the left side of the main peak is
#173588 - $15.00 USD Received 31 Jul 2012; revised 30 Aug 2012; accepted 30 Aug 2012; published 11 Sep 2012(C) 2012 OSA 24 September 2012 / Vol. 20, No. 20 / OPTICS EXPRESS 21938
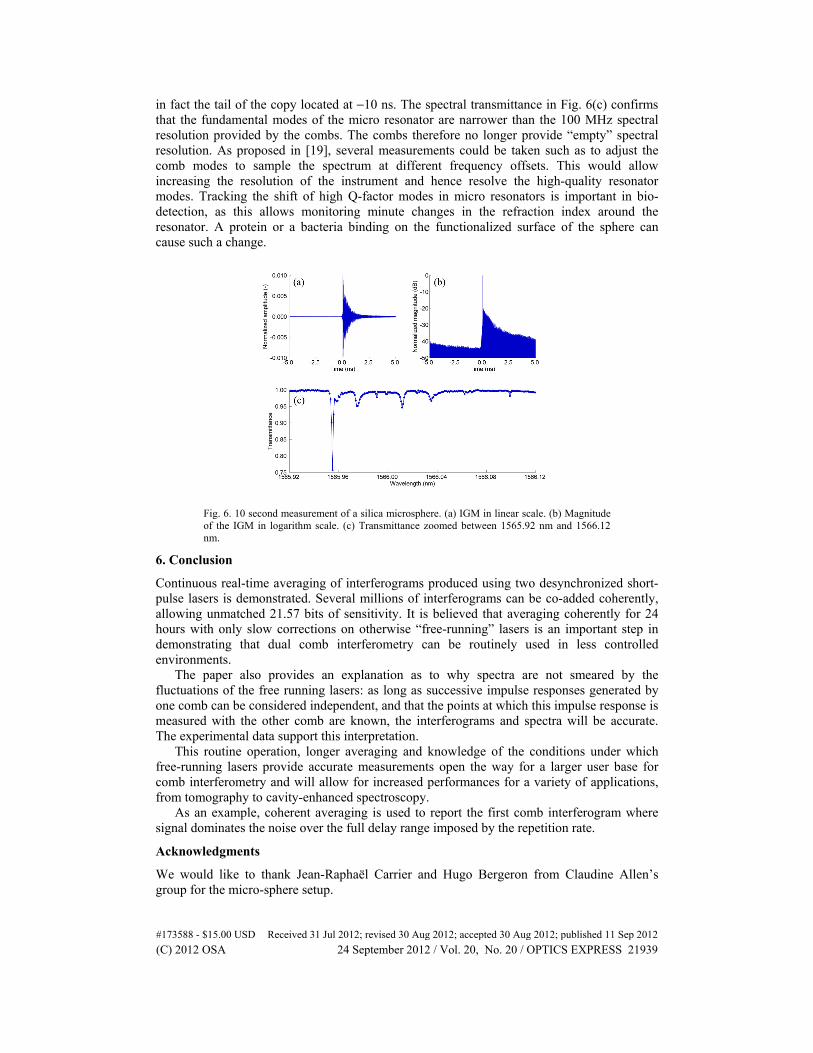
in fact the tail of the copy located at −10 ns. The spectral transmittance in Fig. 6(c) confirms that the fundamental modes of the micro resonator are narrower than the 100 MHz spectral resolution provided by the combs. The combs therefore no longer provide “empty” spectral resolution. As proposed in [19], several measurements could be taken such as to adjust the comb modes to sample the spectrum at different frequency offsets. This would allow increasing the resolution of the instrument and hence resolve the high-quality resonator modes. Tracking the shift of high Q-factor modes in micro resonators is important in bio-detection, as this allows monitoring minute changes in the refraction index around the resonator. A protein or a bacteria binding on the functionalized surface of the sphere can cause such a change.
Fig. 6. 10 second measurement of a silica microsphere. (a) IGM in linear scale. (b) Magnitude of the IGM in logarithm scale. (c) Transmittance zoomed between 1565.92 nm and 1566.12 nm.
6. Conclusion
Continuous real-time averaging of interferograms produced using two desynchronized short-pulse lasers is demonstrated. Several millions of interferograms can be co-added coherently, allowing unmatched 21.57 bits of sensitivity. It is believed that averaging coherently for 24 hours with only slow corrections on otherwise “free-running” lasers is an important step in demonstrating that dual comb interferometry can be routinely used in less controlled environments.
The paper also provides an explanation as to why spectra are not smeared by the fluctuations of the free running lasers: as long as successive impulse responses generated by one comb can be considered independent, and that the points at which this impulse response is measured with the other comb are known, the interferograms and spectra will be accurate. The experimental data support this interpretation.
This routine operation, longer averaging and knowledge of the conditions under which free-running lasers provide accurate measurements open the way for a larger user base for comb interferometry and will allow for increased performances for a variety of applications, from tomography to cavity-enhanced spectroscopy.
As an example, coherent averaging is used to report the first comb interferogram where signal dominates the noise over the full delay range imposed by the repetition rate.
Acknowledgments
We would like to thank Jean-Raphaël Carrier and Hugo Bergeron from Claudine Allen’s group for the micro-sphere setup.
#173588 - $15.00 USD Received 31 Jul 2012; revised 30 Aug 2012; accepted 30 Aug 2012; published 11 Sep 2012(C) 2012 OSA 24 September 2012 / Vol. 20, No. 20 / OPTICS EXPRESS 21939