CONTINUOUS, REAL-TIME CARDIOVASCULAR MONITORING
21
LiDCO ™ CONTINUOUS, REAL-TIME CARDIOVASCULAR MONITORING The Cardiovascular Monitoring Company www.lidco.com
Transcript of CONTINUOUS, REAL-TIME CARDIOVASCULAR MONITORING

L i D C O ™
CONTINUOUS, REAL-TIMECARDIOVASCULAR MONITORING
The CardiovascularMonitoring Companywww.lidco.com

T H E P R I N C I P L E
2 LiDCO™plus CONTINUOUS, REAL-TIME CARDIOVASCULAR MONITORING
Introducing the LiDCOplus Hemodynamic Monitor
CON T I N UOU S , R E A L - T I M E MON I TO R I NG O F C A R D I A C OU T P U T
• LiDCO Ltd’s starting point for its products is with therequirements of the clinician, nurse and hospital patient foradvanced minimally invasive cardiovascular monitoring.
• LiDCO Ltd’s products result from the consolidation of aphysiological knowledge base and leading physiologicalsoftware and sensor technology.
• LiDCO Ltd’s minimally invasive monitoring productsimprove hospital standards of care, improve patientoutcome and reduce costs 88.
• LiDCO Ltd’s products provide medical staff with essentialhemodynamic information, not just data, in an ‘easy tointerpret’ manner.
I N T R O D U C I N G L i D C O LT D
Monitoring of the key cardiovascular parameters of blood pressure, cardiac output and oxygen deliveryis essential for many major surgical and acutely ill patients. In addition, there are many other patientsthat could benefit from real-time cardiovascular monitoring if it were available in a safe and easy toapply manner. This was the philosophy that resulted in the development, design and manufacture of theunique LiDCOplus Hemodynamic Monitor.
The LiDCOplus system is a combination of the two innovative and novel monitors - the LiDCO Systemindicator dilution cardiac output monitor and the PulseCO System real time, continuous arterialwaveform monitor, produced by LiDCO Ltd.
This unique combination provides beat-to-beat measurement of cardiac output with lower riskand high precision 68.

Intro
duct
ion
LiDC
O™plus
L i D C O ™
3
The LiDCOplus System combines the LiDCO & PulseCO Systems software and provides a real-time andcontinuous assessment of a patient’s hemodynamic status.
The LiDCO™ System cardiac output method provides a bolus indicator dilution method of measuring cardiac output.A small dose of lithium chloride is injected via a central or peripheral venous line; the resulting arterial lithiumconcentration-time curve is recorded by withdrawing blood past a lithium sensor attached to the patient’s existingarterial line. In terms of accuracy, clinical studies have demonstrated that over a wide range of cardiac outputs theLiDCO method is at least as accurate as thermodilution and even in patients with varying cardiac outputs 7-12. In onestudy LiDCO and thermodilution cardiac output were compared with an electromagnetic flow probe. The results ofthis study indicated that LiDCO had a higher precision compared with conventional bolus thermodilution cardiacoutput 12. The dose of lithium needed (0.15 - 0.3 mmol for an average adult) is very small and has no knownpharmacological effects 74.
The PulseCO™ System software (incorporated in the LiDCO™plus Monitor) calculates continuous beat-to-beat cardiacoutput by analysis of the arterial blood pressure trace following calibration with an absolute LiDCO cardiac outputvalue. This method has been shown to be accurate and reliable in various clinical settings. It has also been shownthat recalibration is unnecessary for at least eight hours 2-6, 79, 80 and more recently for 24 hours94.
P U L S E CO S Y S T EM A U TOCO R R E L AT I ON A LGO R I T HM
The analogue arterial blood pressure trace is slaved from the conventional blood pressure monitor and undergoes athree step transformation
• Step 1 Arterial pressure transformationinto a volume-time waveform(incorporating arterialtree compliance)
• Step 2 Deriving nominalstroke volume andheartbeat duration
• Step 3 Actual stroke volume viacalibration with an absolutecardiac output value

L i D C O ™
Components of the LiDCOplus Monitor
The PulseCO software calculates continuous beat-to-beat cardiac output by analysis of the arterial bloodpressure trace following calibration with an absolute cardiac output value. This absolute cardiac outputvalue is accurately and precisely measured using the innovative LiDCO lithium chloride bolus indicatordilution method.
The PulseCO software calculates the pulse powerand derived stroke volume from the arterial waveform.This avoids the necessity for detection of any particularwaveform features such as the dichrotic notch.Furthermore, arterial wave reflection does not have to beestimated. Due to this innovative and patented method ofcalculation, the PulseCO remains accurate and reliableover a wide range of hemodynamic states in surgical,post operative and intensive care settings 2. Studies havedemonstrated that re-calibration is unnecessary for atleast eight hours 2-6 and more recently 24 hours 94.
The LiDCOplus serves as a reliable alternative tocontinuous cardiac output monitoring with the pulmonaryartery catheter and can easily be used intraoperatively,in the ICU/HDU, trauma or burns unit, and cath lab.
LiDCOplus ’s accuracy is ensured with the provenLiDCOplus lithium indicator dilution calibration procedurethat uses existing venous and arterial access, making itfast, cost effective and minimally invasive.
The LiDCOplus calculates cardiac output continuously byanalysis of the arterial blood pressure trace followingcalibration with the absolute LiDCO cardiac output value.The concept of estimating cardiac output from the arterialpressure waveform has been extensively researched with thefirst researchers (Erlanger and Hooker) publishing in 1904 1.
4 LiDCO™plus CONTINUOUS, REAL-TIME CARDIOVASCULAR MONITORING

Intro
duct
ion
LiDC
O™plusThe LiDCO System is an innovative bolus indicator dilution method of measuring cardiac output and
Intra-Thoracic Blood Volume (ITBV) - the innovation is the use of lithium chloride as the indicator. A smalldose of lithium chloride is injected via a central or peripheral venous line (Fig 1); the resulting arteriallithium concentration-time curve is recorded by withdrawing blood past a lithium sensor attached to thepatient’s existing arterial line (Fig 2); the Monitor then calculates the cardiac output from the area of theprimary dilution curve (Fig 3). The mean transit time of the lithium is derived for calculation of the ITBV.
The signal to noise ratio and hence accuracy for lithium is better than that seen with thermodilution - due to the factthat the lithium dose can be scaled to the size and cardiac output of the patient. Thermal noise from fluid infusion,respiration and patient warming has little, if any, effect on the lithium curve. The precision of the LiDCO System methodmeans that only one lithium injection is required to accurately determine the cardiac output. In terms of accuracy,clinical studies have demonstrated that the single bolus LiDCO System method is at least as accurate as triplicatebolus thermodilution over a wide range of cardiac outputs and even in patients with varying cardiac outputs 7-12.
5
The l i th ium chlor ide indicator di lu t ionmethod of measur ing cardiac outputand in t ra - thoracic blood volume ( ITBV)
Fig 2
Fig 1 Fig 3

L i D C O ™
6 LiDCO™plus CONTINUOUS, REAL-TIME CARDIOVASCULAR MONITORING
Arterial Pressure
The arterial pressure waveform is slaved from your conventional blood pressure monitor via an analoguecable link. At the touch of a button the arterial pressure waveform is displayed on the LiDCOplus screen.This can be viewed on the screen whenever the Trend, Graph and Chart screens are in use.
This Blood Pressure Waveform window is used to check the patient’s systolic, diastolic and mean pressure. Thepressure waveform shape and values should equate to those displayed on the primary blood pressure monitor.
This window also provides you with access to preload response values or volume status indicators of: SystolicPressure Variation (SPV), Pulse Pressure Variation (PPV%), Stroke Volume Variation (SVV%) as well as Heart RateVaration (HRV%).
SVV % = (SV max - SV min)/[(SV max + SV min)/2] x 100Patient with SVV less than 10% are unlikely to be preload responsive.
DYNAM IC VOLUME STATUS IND ICATORS FOR VENT I LAT ED PAT I ENTS
Thoracic pressure changes caused by mechanical ventilation induces cyclic changes in Left Ventricular Stroke Volume. Thesechanges can provide an indication of the patient’s ventricular preload status (see figure of Frank-Starling curve)18, 20, 26, 66, 81-83.
By superimposing the Preload Response Parameters Window onto the Trend, Graph, or Chart screens, a continuousmeasurement of Stroke Volume, Systolic Pressure and Pulse Pressure Variation is displayed numerically and graphically.
For closed chest ventilated patients these volume status measurements provide a way of predicting fluid volumestatus and likely response to volume infusions. A fluid imbalance can have an adverse effect on a patient’s cardiacperformance and, in turn, oxygen delivery to key organs 13-35, 50, 56, 66, 67, 81.
D
CB
A
SV
PRELOAD
A + C = Volume e.g. 500mlB = Patient is preload responsive
D = Patient not preload responsive
Frank-Starling Curve: Patient Preload Status

7
Event Response
P R E - L O A D R E S PON S I V EN E S S V I A T H E E V EN T R E S PON S E D I S P L AY
The Event Response display allows the user to view up to 2 hemodynamic variables in a higherresolution during a specific period (e.g. fluid challenge, inotrope change). The LiDCOplus will alsodisplay percent change from start for each variable as a numeric value. Trend lines can also be addedto the graphical display.
This feature is very useful when evaluating the patient’s response to targeted interventions such as a fluid challengesor changes in inotrope therapy. The advantage this screen brings is in averaging the data display to smooth anynoise and magnifying the display of changes so that they are easily viewed at a glance from a distance.
The Trend line isswitched on
Baseline value
Target Variable data:Starting baselineCurrent value and% Change frombaseline
Press to Restart
Press to StopPress to Exit
Press to minimize
Elapsed time until anew point is plotted
Press to capture screen image as JPG
Press the event button to reveal the submenu below.
Then press to open the Event Response Window.
Press to configure EventResponse
Press toselecttargetvariable(s)
Press toselectdisplayinterval
A new data point is plottedevery 10, 20 or 30 seconds.

8
Benefits to you and your patient
B EN E F I T S O F L I D CO p l u s CON T I N UOU S C A R D I A C OU T P U T
MON I TO R I NG I NC L U D E :
• Provides early warning of patient deterioration• Optimisation of oxygen delivery• Optimisation of fluid management• Rational drug administration (e.g. Inotropes)• The patient’s condition is clearly communicated to clinical staff• Reduces the work of health care staff• Decrease the procedural complications• Is minimally invasive and therefore widely applicable• Is accurate• Can be nurse driven• Provides real time, beat-to-beat cardiac output and oxygen delivery• Provides real time preload and afterload values• Provides indexed values• Provides easy data interpretation• Provides bedside information management• Has easy to use event markers• Provides information not simply data• Can be linked to most commonly found BP monitors• Records historical data
• Provides an absolute cardiac output value via a novel and proven indicator dilution technique• Provides ITBV• Requires no additional invasive catheters to insert into the patient• Is safe – using non-toxic bolus dosages• Is simple and quick to set up• Can be used with a range of LiCl dosages• Is as accurate as meaned triplicate thermodilution• Is not temperature dependent• Is less invasive monitoring• Utilises existing peripheral or central venous and arterial lines• Can be set up and used by nursing staff• Is a well studied and validated technique
B EN E F I T S O F T H E L I D CO – L I T H I UM CH LO R I D E I N D I C ATO R
D I L U T I ON CA R D I A C OU T P U T M E T HOD :

L i D C O ™
The Trend Screen
A C L E A R CON T I N UOU S D I S P L AY
The Trend screen provides a continuous record of the patients hemodynamics. This large, clear and continuouslyupdating screen displays the actual and indexed values for Cardiac Output, Systemic Vascular Resistance, MeanArterial Pressure, Heart Rate and Left Ventricle Stoke Volume. Oxygen Delivery and Venous Oxygen Saturation canalso be displayed if selected. The clinician can accurately track the patients’ trend over several hours or minutes.
This screen facilitates intraoperative patient management allowing assessment of the immediate response to fluidchallenge, drugs or other therapeutic interventions.
E V EN T MA R K E R
Mark any number of events, such as initiation of inotropic agent or start of fluid infusion, using the eventmarker button. There are several standard descriptions that can be selected and additional detail added.
The marked event will appear as a small flag on the Trend and History screens and will be recorded in the LiDCOplus data fileas the patient data is downloaded from the history screen. The event history window will allow selection of any events from thepast 24 hours and take the user to the area on the hemodynamic history screen where the event was marked.
Oxygen deliveryActual or Average data available
Heart Rate
Left VentricleStroke Volume
Mean ArterialPressure
Systemic VascularResistance
Cardiac Index
Cardiac Output
Venous OxygenSaturation
Pulse
CO
™BP
Wav
efor
mA
naly
sis
9 LiDCO™plus CONTINUOUS, REAL-TIME CARDIOVASCULAR MONITORING
L i D C O ™
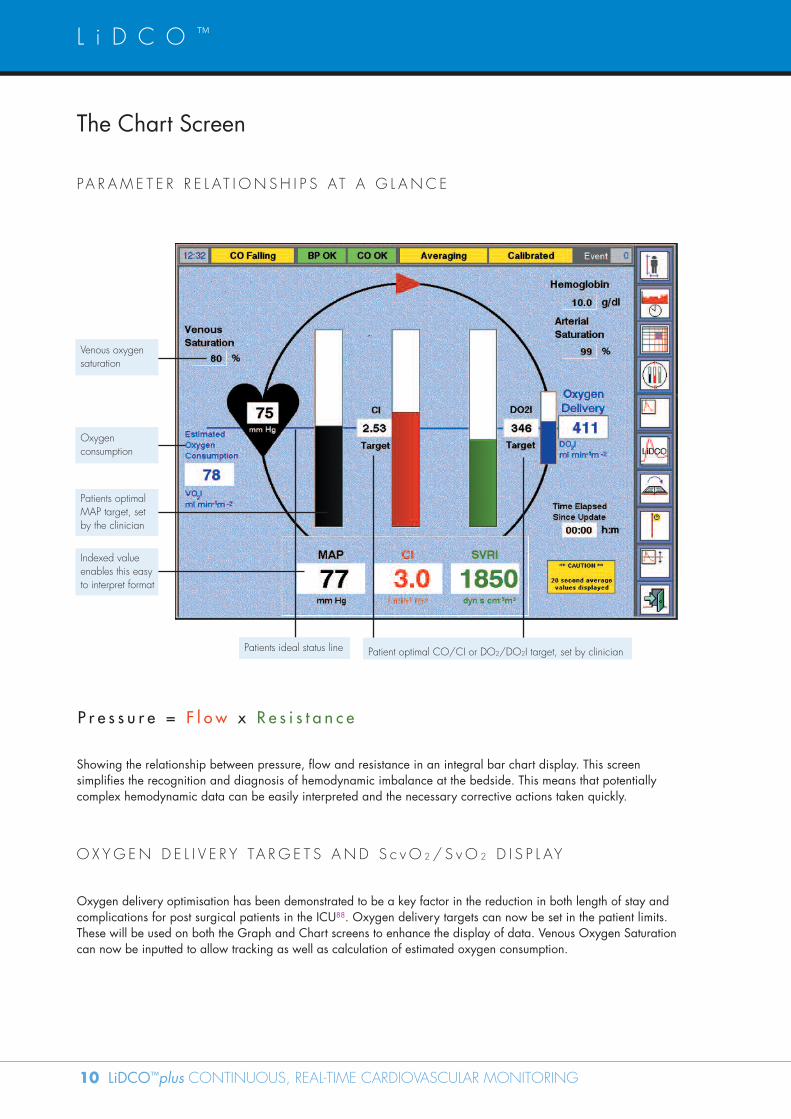
The Chart Screen
PA R AM E T E R R E L AT I ON SH I P S AT A G L ANC E
Showing the relationship between pressure, flow and resistance in an integral bar chart display. This screensimplifies the recognition and diagnosis of hemodynamic imbalance at the bedside. This means that potentiallycomplex hemodynamic data can be easily interpreted and the necessary corrective actions taken quickly.
OX YG EN D E L I V E R Y TA RG E T S AND S c vO 2 / S vO 2 D I S P L AY
Oxygen delivery optimisation has been demonstrated to be a key factor in the reduction in both length of stay andcomplications for post surgical patients in the ICU88. Oxygen delivery targets can now be set in the patient limits.These will be used on both the Graph and Chart screens to enhance the display of data. Venous Oxygen Saturationcan now be inputted to allow tracking as well as calculation of estimated oxygen consumption.
P r e s s u r e = F l o w x R e s i s t a n c e
Patients ideal status line
Indexed valueenables this easyto interpret format
Patient optimal CO/CI or DO2/DO2I target, set by clinician
Patients optimalMAP target, setby the clinician
Oxygenconsumption
Venous oxygensaturation
10 LiDCO™plus CONTINUOUS, REAL-TIME CARDIOVASCULAR MONITORING
Pulse
CO
™BP
Wav
efor
mA
naly
sis
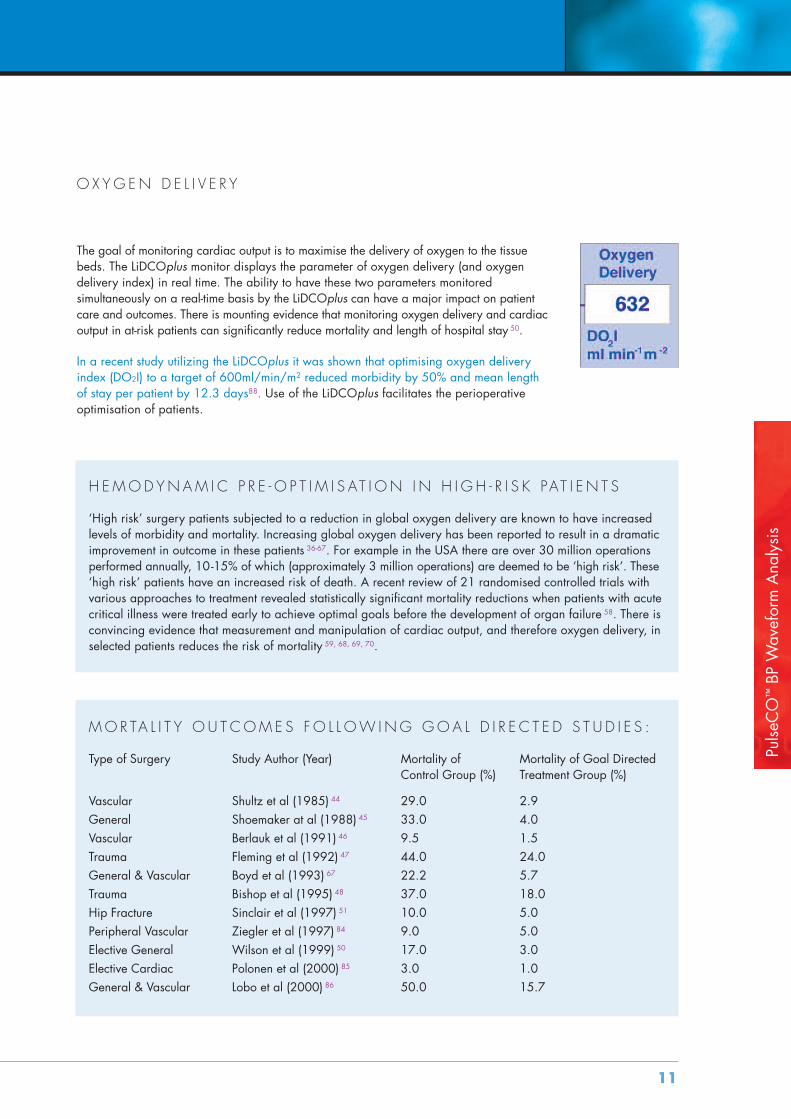
OX YG EN D E L I V E R Y
11
The goal of monitoring cardiac output is to maximise the delivery of oxygen to the tissuebeds. The LiDCOplus monitor displays the parameter of oxygen delivery (and oxygendelivery index) in real time. The ability to have these two parameters monitoredsimultaneously on a real-time basis by the LiDCOplus can have a major impact on patientcare and outcomes. There is mounting evidence that monitoring oxygen delivery and cardiacoutput in at-risk patients can significantly reduce mortality and length of hospital stay 50.
In a recent study utilizing the LiDCOplus it was shown that optimising oxygen deliveryindex (DO2I) to a target of 600ml/min/m2 reduced morbidity by 50% and mean lengthof stay per patient by 12.3 days88. Use of the LiDCOplus facilitates the perioperativeoptimisation of patients.
H EMOD YNAM I C P R E - O P T I M I S AT I ON I N H I GH - R I S K PAT I E N T S
‘High risk’ surgery patients subjected to a reduction in global oxygen delivery are known to have increasedlevels of morbidity and mortality. Increasing global oxygen delivery has been reported to result in a dramaticimprovement in outcome in these patients 36-67. For example in the USA there are over 30 million operationsperformed annually, 10-15% of which (approximately 3 million operations) are deemed to be ‘high risk’. These‘high risk’ patients have an increased risk of death. A recent review of 21 randomised controlled trials withvarious approaches to treatment revealed statistically significant mortality reductions when patients with acutecritical illness were treated early to achieve optimal goals before the development of organ failure 58. There isconvincing evidence that measurement and manipulation of cardiac output, and therefore oxygen delivery, inselected patients reduces the risk of mortality 59, 68, 69, 70.
MOR TA L I T Y O U T COM E S FO L L OW ING GOA L D I R E C T E D S T U D I E S :
Type of Surgery Study Author (Year) Mortality of Mortality of Goal DirectedControl Group (%) Treatment Group (%)
Vascular Shultz et al (1985) 44 29.0 2.9General Shoemaker at al (1988) 45 33.0 4.0Vascular Berlauk et al (1991) 46 9.5 1.5Trauma Fleming et al (1992) 47 44.0 24.0General & Vascular Boyd et al (1993) 67 22.2 5.7Trauma Bishop et al (1995) 48 37.0 18.0Hip Fracture Sinclair et al (1997) 51 10.0 5.0Peripheral Vascular Ziegler et al (1997) 84 9.0 5.0Elective General Wilson et al (1999) 50 17.0 3.0Elective Cardiac Polonen et al (2000) 85 3.0 1.0General & Vascular Lobo et al (2000) 86 50.0 15.7

L i D C O ™
The Graph Screen
K E E P I N G PA T I E N T C A R E O N TA R G E T
Allows easy assessment of the patients status at a glance and from a distance from the Monitor - useful in busyICU’s or high dependency units, as an early warning system to avoid adverse events. The graph screen is alsoideal for the implementation of goal directed protocols that target oxygen delivery. The graph screen is the ideal“bedside” mode providing clear, easy-to-read feedback on changes to pressure, flow, and resistance. A patientspecific “target zone” for Cardiac Output or Oxygen Delivery, Mean Arterial Pressure and thereby SystemicVascular Resistance is defined specifically for each patient. The continuous display of the patient’s last 12heartbeats provides a ready reference to how well the therapeutic/hemodynamic targets are being maintained.The LiDCOplus Monitor provides point of care information, not just more patient data.
12 LiDCO™plus CONTINUOUS, REAL-TIME CARDIOVASCULAR MONITORING
Patients preferredhemodynamicstatus presentedas a window or‘target zone’, setby the clinician.
Patients currentHemodynamicstatus, presentedas a series of 12colour codeddots in real-timeupdated for everyheart beat.
CON T I N UOU S , R E A L - T I M E MON I TO R I NG O F C A R D I A C OU T P U T

The History Screen
Pulse
CO
™BP
Wav
efor
mA
naly
sis
KEEPING PATIENT RECORDS, FOR AUDIT, TEACHING, ANALYSIS AND RESEARCH
The History Screen can be used to look back over the last 24 hours of the patient’s hemodynamic data. Thedisplay is similar to the display of the Trend Screen. Touch anywhere on the screen to see the parameterreadings, at that time, or track back through the hours of data as required.
This screen is designed to aid in data collection: for clinical studies or simply to have a complete record of thepatient’s treatment you can record the patient’s critical parameters at the touch of a button. The beat-to-beat patientdata, event markers and calibrations are recorded either as a file for LiDCOview or as an Excel file on a USBmemory stick. This powerful tool for data collection provides you with the ability to review, research and trainusing Historical data. Record several patients or several days of a single patient onto one easy to use USBmemory stick.
A picture can be taken of the entire history screen. This can be stored on the hard drive or immediatelydownloaded to a USB memory stick as a JPEG file.
13
Adjust timelineviewing
CalibrationHistory
Event History
Scroll throughhistorical data
Download datafor LiDCOviewor Excel
Capture screensas JPEG files
L i D C O ™
PulseCO Validation
14 LiDCO™plus CONTINUOUS, REAL-TIME CARDIOVASCULAR MONITORING
One study at the University of Texas evaluated the change/drift in calibration factor across a post operativeperiod of 8 hours in a group of 20 cardiac surgery patients 80.
The results of the study found:• that the range of cardiac outputs was 3.33 to 8.47 litres per minute;• that, once calibrated, the PulseCO tracked the cardiac output continuously through the post
surgery period without changes in calibration factor;• that no significant differences were noted between the LiDCO, the thermodilution control and
the PulseCO reading.
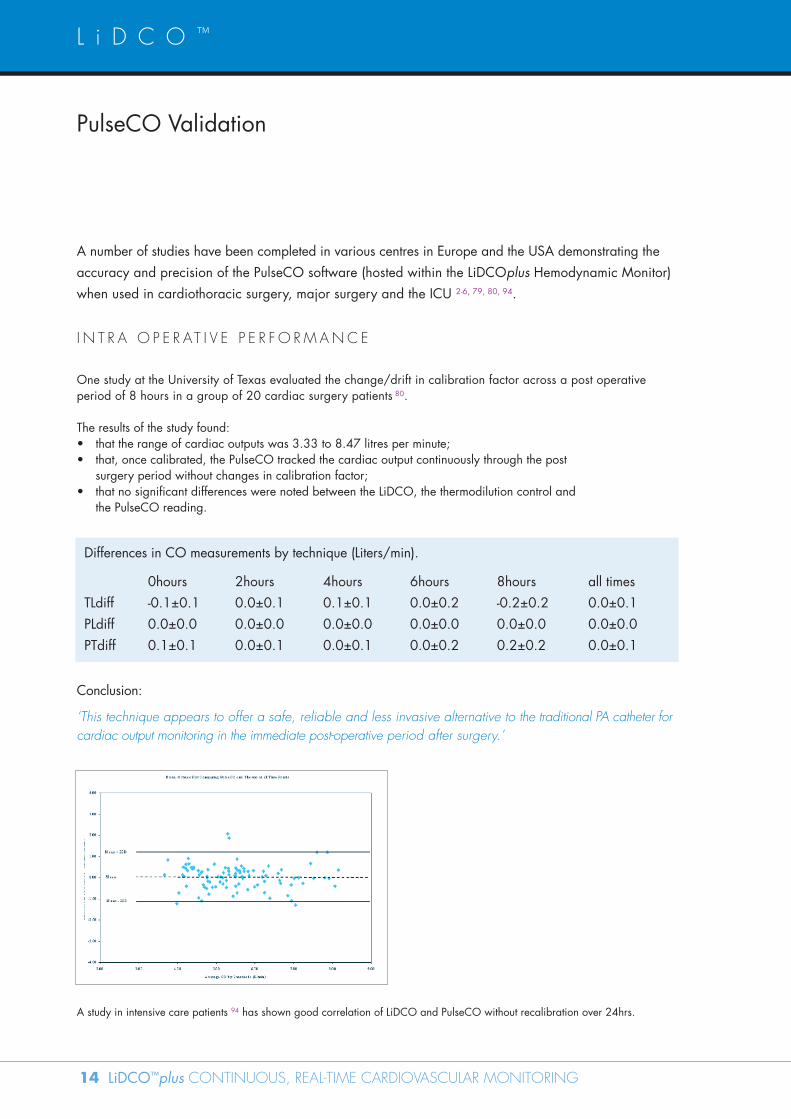
A study in intensive care patients 94 has shown good correlation of LiDCO and PulseCO without recalibration over 24hrs.
Differences in CO measurements by technique (Liters/min).
0hours 2hours 4hours 6hours 8hours all timesTLdiff -0.1±0.1 0.0±0.1 0.1±0.1 0.0±0.2 -0.2±0.2 0.0±0.1PLdiff 0.0±0.0 0.0±0.0 0.0±0.0 0.0±0.0 0.0±0.0 0.0±0.0PTdiff 0.1±0.1 0.0±0.1 0.0±0.1 0.0±0.2 0.2±0.2 0.0±0.1
I N T R A O P E R AT I V E P E R F O RMANC E
Conclusion:
‘This technique appears to offer a safe, reliable and less invasive alternative to the traditional PA catheter forcardiac output monitoring in the immediate post-operative period after surgery.’
A number of studies have been completed in various centres in Europe and the USA demonstrating theaccuracy and precision of the PulseCO software (hosted within the LiDCOplus Hemodynamic Monitor)when used in cardiothoracic surgery, major surgery and the ICU 2-6, 79, 80, 94.
Pulse
CO
™BP
Wav
efor
mA
naly
sis
15
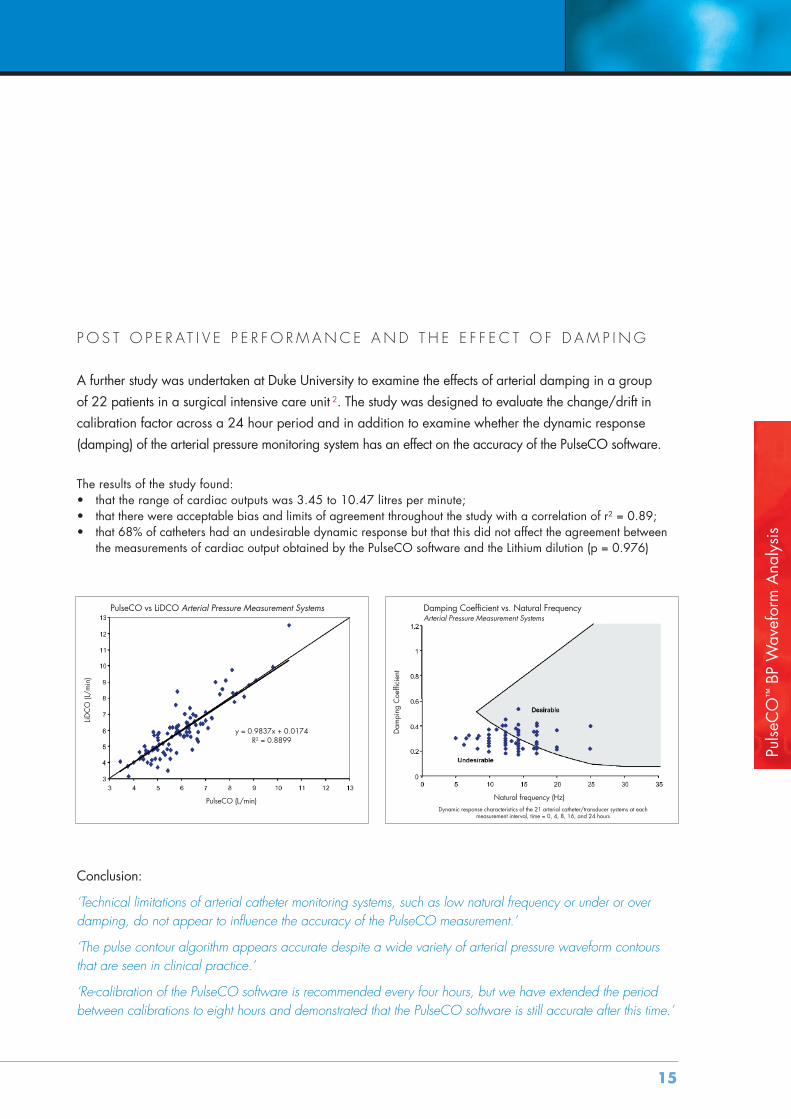
The results of the study found:• that the range of cardiac outputs was 3.45 to 10.47 litres per minute;• that there were acceptable bias and limits of agreement throughout the study with a correlation of r2 = 0.89;• that 68% of catheters had an undesirable dynamic response but that this did not affect the agreement between
the measurements of cardiac output obtained by the PulseCO software and the Lithium dilution (p = 0.976)
P O S T O P E R AT I V E P E R F O RMANC E AND T H E E F F E C T O F D AM P I NG
A further study was undertaken at Duke University to examine the effects of arterial damping in a groupof 22 patients in a surgical intensive care unit 2. The study was designed to evaluate the change/drift incalibration factor across a 24 hour period and in addition to examine whether the dynamic response(damping) of the arterial pressure monitoring system has an effect on the accuracy of the PulseCO software.
PulseCO vs LiDCO Arterial Pressure Measurement Systems
LiDC
O(L/
min
)
PulseCO (L/min)
y = 0.9837x + 0.0174R2 = 0.8899
Damping Coefficient vs. Natural FrequencyArterial Pressure Measurement Systems
Dam
ping
Coe
ffici
ent
Natural frequency (Hz)Dynamic response characteristics of the 21 arterial catheter/transducer systems at each
measurement interval, time = 0, 4, 8, 16, and 24 hours
Conclusion:
‘Technical limitations of arterial catheter monitoring systems, such as low natural frequency or under or overdamping, do not appear to influence the accuracy of the PulseCO measurement.’
‘The pulse contour algorithm appears accurate despite a wide variety of arterial pressure waveform contoursthat are seen in clinical practice.’
‘Re-calibration of the PulseCO software is recommended every four hours, but we have extended the periodbetween calibrations to eight hours and demonstrated that the PulseCO software is still accurate after this time.’
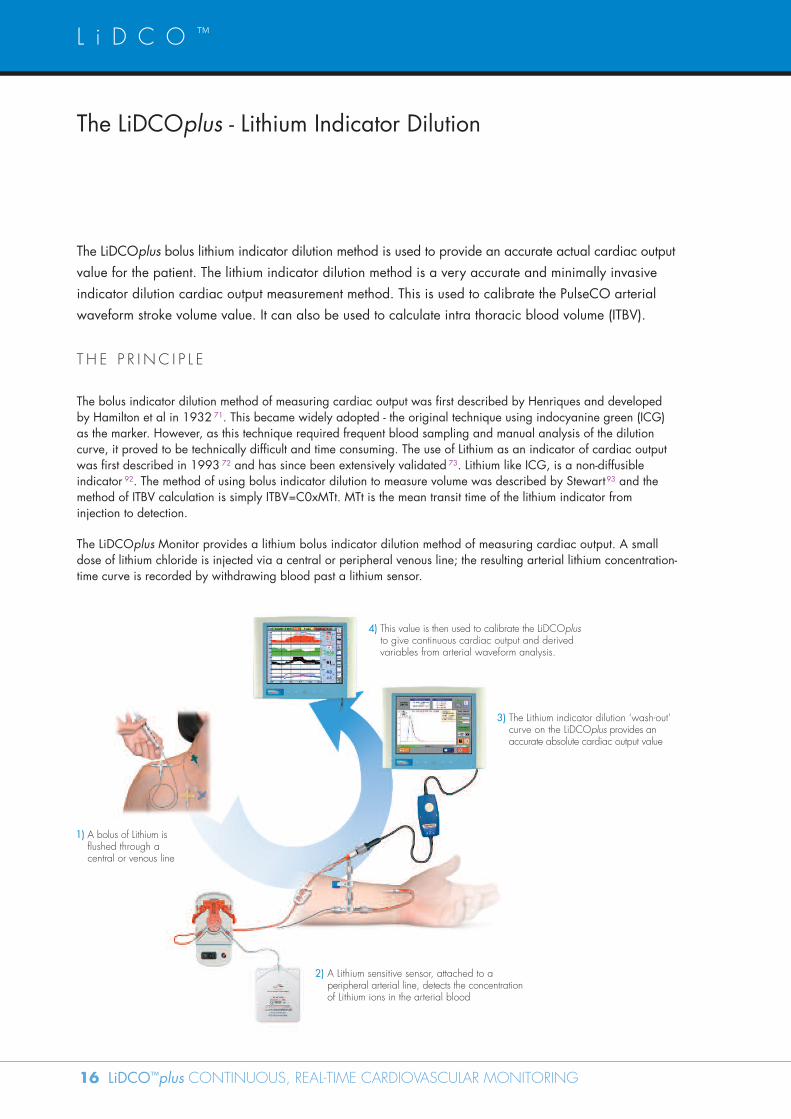
1) A bolus of Lithium isflushed through acentral or venous line
2) A Lithium sensitive sensor, attached to aperipheral arterial line, detects the concentrationof Lithium ions in the arterial blood
3) The Lithium indicator dilution ‘wash-out’curve on the LiDCOplus provides anaccurate absolute cardiac output value
4) This value is then used to calibrate the LiDCOplusto give continuous cardiac output and derivedvariables from arterial waveform analysis.
L i D C O ™
The LiDCOplus - Lithium Indicator Dilution
16 LiDCO™plus CONTINUOUS, REAL-TIME CARDIOVASCULAR MONITORING
The bolus indicator dilution method of measuring cardiac output was first described by Henriques and developedby Hamilton et al in 1932 71. This became widely adopted - the original technique using indocyanine green (ICG)as the marker. However, as this technique required frequent blood sampling and manual analysis of the dilutioncurve, it proved to be technically difficult and time consuming. The use of Lithium as an indicator of cardiac outputwas first described in 1993 72 and has since been extensively validated 73. Lithium like ICG, is a non-diffusibleindicator 92. The method of using bolus indicator dilution to measure volume was described by Stewart93 and themethod of ITBV calculation is simply ITBV=C0xMTt. MTt is the mean transit time of the lithium indicator frominjection to detection.
The LiDCOplus Monitor provides a lithium bolus indicator dilution method of measuring cardiac output. A smalldose of lithium chloride is injected via a central or peripheral venous line; the resulting arterial lithium concentration-time curve is recorded by withdrawing blood past a lithium sensor.
T H E P R I NC I P L E
The LiDCOplus bolus lithium indicator dilution method is used to provide an accurate actual cardiac outputvalue for the patient. The lithium indicator dilution method is a very accurate and minimally invasiveindicator dilution cardiac output measurement method. This is used to calibrate the PulseCO arterialwaveform stroke volume value. It can also be used to calculate intra thoracic blood volume (ITBV).
LiDC
OC
ardi
acO
utpu
tDet
erm
inat
ion
17
A D VAN TAG E S O F T H E L i D CO p l u s L I T H I UM
I N D I C ATO R D I L U T I ON M E T HOD
The advantages of the LiDCOplus method are that it is safe, accurate and simple to use:
• Safe - Central/peripheral venous and arterial catheters are usually already in place in patients needingcardiac output measurements. No further catheter is needed, so the method avoids the risks associatedwith pulmonary artery catheterisation. The method requires withdrawal of approximately 5 ml blood perdetermination; for an adult this is an insignificant amount. The injectate is a solution of lithium chloride. The doseneeded (0.15 - 0.30 mmol for an average adult) is very small and has no known pharmacological effect 74.The dosage regimen recommended is very conservative, making worst case assumptions on volume ofdistribution of lithium, patient weight (assumes 40kg) and absence of renal function.
• Accurate - Clinical trials have been completed that demonstrate that the LiDCO System is at least as accurateas thermodilution 11,12.
• Simple to use - The method is simple and quick to use. It has the advantage that there is no unpleasantprocedure for a conscious patient to undergo (such as insertion of a pulmonary artery catheter) and the timetaken to set up and apply is between 5 and 10 minutes 68.
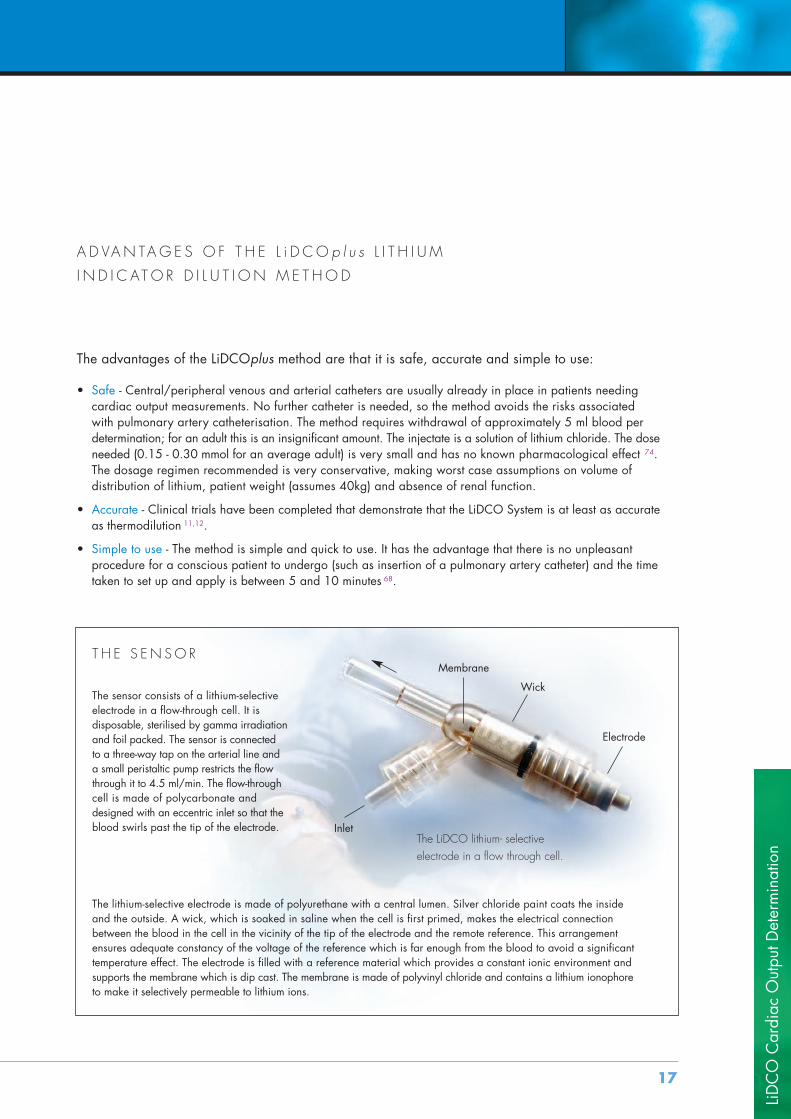
T H E S EN SO R
The sensor consists of a lithium-selectiveelectrode in a flow-through cell. It isdisposable, sterilised by gamma irradiationand foil packed. The sensor is connectedto a three-way tap on the arterial line anda small peristaltic pump restricts the flowthrough it to 4.5 ml/min. The flow-throughcell is made of polycarbonate anddesigned with an eccentric inlet so that theblood swirls past the tip of the electrode.
The lithium-selective electrode is made of polyurethane with a central lumen. Silver chloride paint coats the insideand the outside. A wick, which is soaked in saline when the cell is first primed, makes the electrical connectionbetween the blood in the cell in the vicinity of the tip of the electrode and the remote reference. This arrangementensures adequate constancy of the voltage of the reference which is far enough from the blood to avoid a significanttemperature effect. The electrode is filled with a reference material which provides a constant ionic environment andsupports the membrane which is dip cast. The membrane is made of polyvinyl chloride and contains a lithium ionophoreto make it selectively permeable to lithium ions.
The LiDCO lithium- selectiveelectrode in a flow through cell.
Inlet
Wick
Membrane
Electrode
L i D C O ™
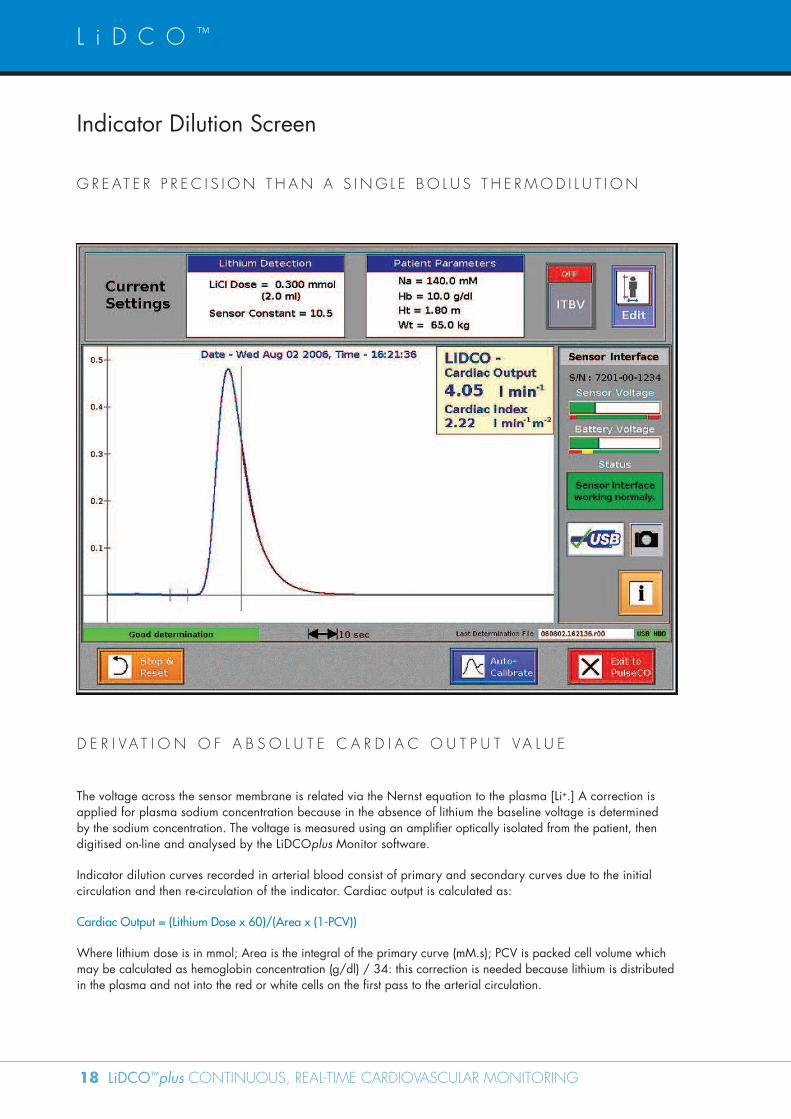
Indicator Dilution Screen
18 LiDCO™plus CONTINUOUS, REAL-TIME CARDIOVASCULAR MONITORING
G R E AT E R P R E C I S I ON T H AN A S I NG L E BO L U S T H E RMOD I L U T I ON
D E R I VA T I O N O F A B S O L U T E C A R D I A C O U T P U T VA L U E
The voltage across the sensor membrane is related via the Nernst equation to the plasma [Li+.] A correction isapplied for plasma sodium concentration because in the absence of lithium the baseline voltage is determinedby the sodium concentration. The voltage is measured using an amplifier optically isolated from the patient, thendigitised on-line and analysed by the LiDCOplus Monitor software.
Indicator dilution curves recorded in arterial blood consist of primary and secondary curves due to the initialcirculation and then re-circulation of the indicator. Cardiac output is calculated as:
Cardiac Output = (Lithium Dose x 60)/(Area x (1-PCV))
Where lithium dose is in mmol; Area is the integral of the primary curve (mM.s); PCV is packed cell volume whichmay be calculated as hemoglobin concentration (g/dl) / 34: this correction is needed because lithium is distributedin the plasma and not into the red or white cells on the first pass to the arterial circulation.
19
VA L I D AT I ON
2 3 4 5 6 7 8 9 102
3
4
5
6
7
8
9
10
BTD (L/min)
LiDC
O(L/
min
)
2 3 4 5 6 7 8 9 10-3
-2
-1
0
1
2
3
(LiDCO + BTD)/2 (L/min)
LiDC
O-B
TD(L/
min
)
L I T H I U M C H L O R I D E :T H E FA C T S
Multiple dosages of Lithium have beenextensively investigated and the safetyprofile is well established. Thepharmacokinetics of intravenous lithiumchloride in man (and animals) has beendocumented 74, Lithium chloride has beenused extensively in medicine forprophylactic and therapeutic treatment ofunipolar and bipolar manic-depressivedisorders 75, 76. The lithium chloride isdistributed throughout the total body waterand excreted almost entirely by the kidneys.The half-life of lithium chloride in humans is19.8 - 41.3 hrs 77, 78. The recommendedmaximum total dose for a Lithium indicatordilution would have to be exceeded manytimes before toxic levels are reached. In fact,a single lithium chloride LiDCO indicatordilution determination at 0.3mmol is theequivalent to a steady state plasma lithiumconcentration of 1/240th of the therapeuticlevel. Lithium has been used for themeasurement of cardiac output in thousandsof patients over many years without a singleside effect being reported.
(For warnings, contraindications and side-effectplease refer to LiDCO Ltd Lithium Chloride DataSheet and/or LiDCOplus manual)
0.1 1 10 1000.1
1
10
100
Thermodilution (l/min)
LiDC
O(l/
min
)
LiDCO = 0.97 thermodilution -0.14 l/min (r = 0.98)
Range 0.35 - 43 l/min17 Paediatric n = 48
40 adult n = 200 6 Horse n = 70
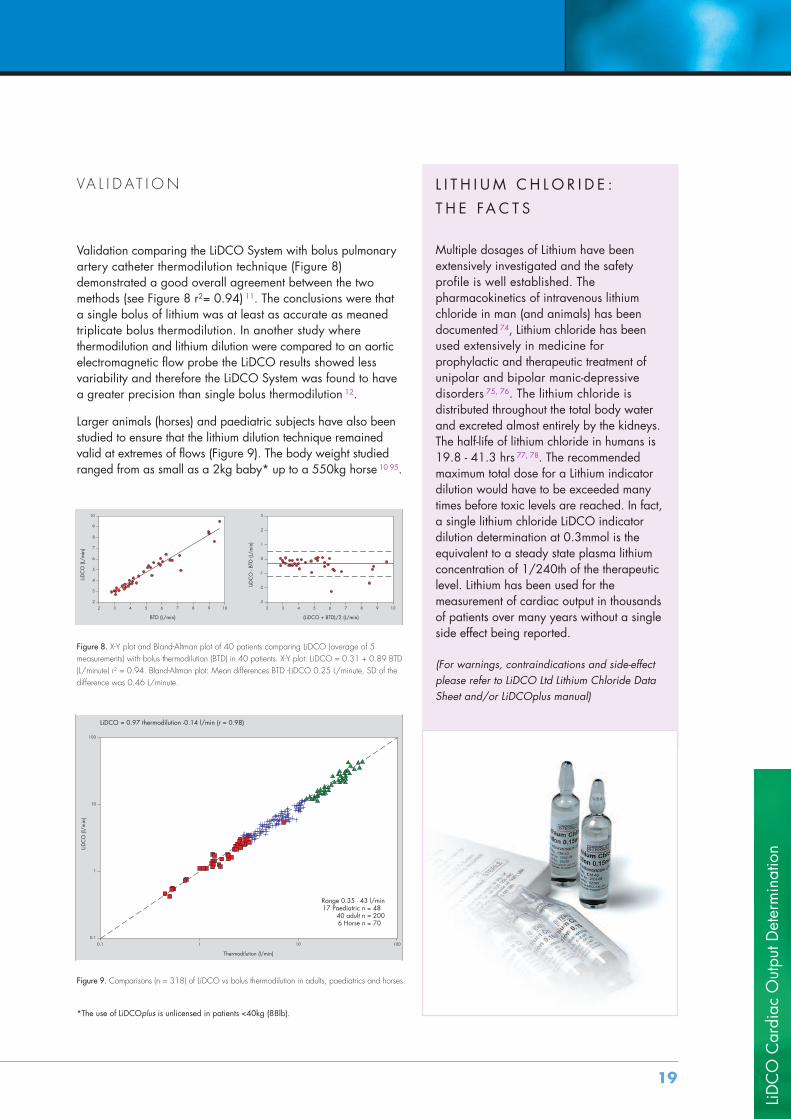
Figure 8. X-Y plot and Bland-Altman plot of 40 patients comparing LiDCO (average of 5measurements) with bolus thermodilution (BTD) in 40 patients. X-Y plot: LiDCO = 0.31 + 0.89 BTD(L/minute) r2 = 0.94. Bland-Altman plot: Mean differences BTD -LiDCO 0.25 L/minute, SD of thedifference was 0.46 L/minute.
Figure 9. Comparisons (n = 318) of LiDCO vs bolus thermodilution in adults, paediatrics and horses.
*The use of LiDCOplus is unlicensed in patients <40kg (88lb).
Validation comparing the LiDCO System with bolus pulmonaryartery catheter thermodilution technique (Figure 8)demonstrated a good overall agreement between the twomethods (see Figure 8 r2= 0.94) 11. The conclusions were thata single bolus of lithium was at least as accurate as meanedtriplicate bolus thermodilution. In another study wherethermodilution and lithium dilution were compared to an aorticelectromagnetic flow probe the LiDCO results showed lessvariability and therefore the LiDCO System was found to havea greater precision than single bolus thermodilution 12.
Larger animals (horses) and paediatric subjects have also beenstudied to ensure that the lithium dilution technique remainedvalid at extremes of flows (Figure 9). The body weight studiedranged from as small as a 2kg baby* up to a 550kg horse 10 95.
LiDC
OC
ardi
acO
utpu
tDet
erm
inat
ion

R E F E R E N C E S
20 LiDCO™plus CONTINUOUS, REAL-TIME CARDIOVASCULAR MONITORING
1. Erlanger & Hooker (1904) An experimental Study of blood pressure and of pulse pressure in man. John Hopkins HospRep 12:145-378
2. Pittman J, Bar Yosef S, SumPing J, Sherwood M, Mark J (2005) Continuous cardiac output monitoring with pulsecontour analysis: A comparison with lithium indicator dilution cardiac output measurement. Crit Care Med. 33 (9)2015-2021
3. Aronson A, Heller L, Jayakar D, Jeevanandam V, Fisher M, Pfanzelter N, Babb P, Dupont F, Chaney M, Tung A.(2002) Continuous intraoperative cardiac output determination with arterial pulse wave analysis (PulseCO™) isvalid and precise. Submitted to the Society of Cardiovascular Anesthesiologists Annual Meeting, May.
4. Hamilton et al (2002) PulseCO: A less-invasive method to monitor cardiac output from arterial pressure aftercardiac surgery. Ann Thorac Surg 74: S1408-12.
5. Heller L B, Fisher M, Pfanzelter N, Jayakar D, Jeevanandam V, Aronson S. (2002) Continuous Intraoperative CardiacOutput Determination with Arterial Pulse Wave Analysis (PulseCO™) is Valid and Precise. Anesth. Analg.2002;93,SCA1-SCA112
6. Jonas M, Bruce R, Knight J, Kelly F, O'Brien T, Band D. (2001) Comparison of cardiac output measurements using acontinuous arterial waveform analysis monitor (PulseCO) with an indicator dilution technique (LiDCO) in patients inintensive care. Accepted for presentation at the ICCM Sydney, October.
7. Mason DJ, O'Grady M, Woods JP, McDonell W. (2001) Assessment of lithium dilution cardiac output as a techniquefor measurement of cardiac output in dogs. American Journal of Veterinary Research Aug; 62(8): 1255 – 1261
8. Mason DJ, O'Grady M, Woods JP, McDonell W. (2000) Assessment of lithium chloride dilution as a new measure ofcardiac output in the dog as compared to thermodilution. Meeting of the American College of Veterinary InternalMedicine May 2000.
9. Linton RA, Jonas MM, Tibby SM, Murdoch IA, O'Brien TK, Linton NW, Band DM. (2000) Cardiac output measured bylithium dilution and transpulmonary thermodilution in patients in a paediatric intensive care unit. Intensive Care Med.Oct; 26(10): 1507-11.
10. Linton RA, Young LE, Marlin DJ, Blissett KJ, Brearley JC, Jonas MM, O'Brien TK, Linton NW, Band DM Jones RS.(2000) Cardiac output measured by lithium dilution, thermodilution and transesophageal Dopplerechocardiography in anesthetized horses. American Journal of Veterinary Research Jul; 61(7): 731-7.
11. Linton R, Band D, O'Brien T, Jonas MM & Leach R. (1997) Lithium dilution cardiac output measurement: Acomparison with thermodilution. Critical Care Medicine; 25: 1796-1800.
12. Kurita T, Morita K, Kato S, Kikura M, Horie M, Ikeda K. (1997) Comparison of the accuracy of the lithium dilutiontechnique with the thermodilution technique for measurement of cardiac output. British Journal of Anaesthesia;79: 770-775.
13. Cohn JN, Pinkerson AL, Tristani FE: Mechanism of pulus paradoxus in clinical shock. J. Clin. Invest. 1967; 46:1744-5514. Reuter et al (2002) Optimizing fluid therapy in mechanically ventilated patients after cardiac surgery by on-line
monitoring of left ventricular stroke variations. Comparison with aortic systolic pressure variations. Brit Jour Anesth88 (1) 124-126
15. Avila et al (2002) Predicting hypovolemia during mechanical ventilation: A prospective, clinical trial of dopplervariations of aorta and axillary arterial velocities to identify systolic pressure variation. Poster Presentation.American Society of Critical Care Anestheiologists, Anaesthesiology 97 (3) B17
16. Gunn and Pinsky (2001) Implications of arterial pressure variation in patients in the intensive care unit. Critical Care7: 212-217
17. Michard et al (1999) Clinical use of respiratory changes in arterial pulse pressure to monitor the hemodynamiceffects of PEEP. Critical Care Medicine 159: 935-939
18. Michard et al (2000) Relation between respiratory changes in arterial pulse pressure and fluid responsiveness inseptic patients with acute circulatory failure. Critical Care Medicine 162: 134-138
19. Michard & Teboul (2000) Using heart-lung interactions to assess fluid responsiveness during mechanicalventilation. Crit Care 4: 282-289
20. Berkenstadt et al (2001) Stroke volume variation as a predictor of fluid responsiveness in patients undergoingbrain surgery. Anesth Analg 92: 984-989
21. Perel et al (1987) Systolic blood pressure variation is a sensitive indicator of hypovolemia in ventilated dogssubjected to graded hemorrhage. Anesth 67: 498-502
22. Harrigan & Pinsky (2001) Heart-lung interactions. Part 1: effects of lung volume and ventilation as exercise.Int Jour Inten Care Spring 2001: 6-13
23. Harrigan & Pinsky (2001) Heart-lung interactions. Part 2: effects of intrathoracic pressure. Int Jour Inten CareSummer 2001: 99-108
24. Rooke et al (1995) The effect of graded hemorrhage and intravascular volume replacement on systolic pressurevariation in humans during mechanical and spontaneous ventilation. Anesth Analg 80: 925-932
25. Marik (1993) The systolic blood pressure variation as an indicator of pulmonary capillary wedge pressure inventilated patients. Anaes & Intens Care 21 (4) 405-408
26. Tavernier et al (1998) Systolic pressure variation as a guide to fluid therapy in patients with sepsis-inducedhypotension. Anesth 89 (6) 1309-1310 [Abstract]
27. Pizov et al (1996) Positive end-expiratory pressure-induced hemodynamic changes are reflected in the arterialpressure waveform. Crit Care Med 24 (8) 1381-7 [Abstract]
28. Szold et al (1989) The effect of tidal volume and intravascular volume state on systolic pressure variation inventilated dogs. Inten Care Med 15 (6) 368-371 [Abstract]
29. Baeaussier et al (1995) Determinants of systolic pressure variation in patients ventilated after vascular surgery.J Cardioth Vasc Anesth 9 (5) 547-551 [Abstract]
30. Pizov et al (1990) The use of systolic pressure variation in hemodynamic monitoring during deliberatehypotension in spine surgery. J Clin Anesth 2 (2) 96-100 [Abstract]
31. Perel et al (1987) Systolic blood pressure variation is a sensitive indicator of hypovolemia in ventilated dogssubjected to graded hemorrhage. Anesth 67 (4) 498-502 [Abstract]
32. Weiss et al (1999) Systolic pressure variation in hemodynamic monitoring after severe blast injury. J Clin Anesth11 (2) 132-135 [Abstract]
33. Ornstein et al (1998) Systolic pressure variation predicts the response to acute blood loss. J Clin Anesth 10 (2) 137-140[Abstract]
34. Klingzing et al.(2002) Stroke volume variation as a predictor of fluid responsiveness for cardiac output in patientsundergoing cardiac surgery. SCCM 173/M55 [Abstract]
35. Reuter et al (2002) Left Ventricular stroke volume variations for functional preload monitoring after cardiacsurgery in high risk patients. SCCM 93/M1[Abstract]
36 R Boyd, RE Tremblay, Spencer FC et al (1959) Estimation of Cardiac output soon after intracardiac surgery withcardio-pulmonary bypass. Ann Surg 150: 613
37 Clowes GHA, Del Guercio LRM (1960) Circulatory response to trauma of surgical operations. Metabolism 9:67-8138 Clowes et al, (1966) Early Study in Peritonitis. Ann Surg 1966:163; 86639 Shoemaker WC, Czer LS. (1979) Evaluation of the biologic importance of various Hemodynamic and oxygen
transport variables: which should be monitored in postoperative shock? Crit Care Med 7: 42440 Shoemaker WC, Montgomery ES, Kaplan E, et al. (1973) Physiological patterns in surviving and non-surviving shock
patients. Use of sequential cardio respiratory variables in defining criteria for therapeutic goals and early warning ofdeath. Arch Surg 106: 630
41 Shoemaker WC, Pierchala C, Chang P et al (1977) Prediction of outcome and severity of illness by analysis of thefrequency distributions of cardio respiratory variables. Crit Care Med 5: 82
42 Shoemaker WC, Appel PL, Waxman K et al (1982) Clinical trial of survivors’ cardio-respiratory patterns astherapeutic goals in critically ill postoperative patients. Crit Care Med 10: 398
43 Edwards JD, Brown GC, Nightingale P, et al (1989) Use of survivors’ cardio-respiratory values as therapeutic goalsin septic shock. Crit Care Med 17:1098
44 Schultz RJ, Whitfield GF, LaMura et al (1985) The role of physiologic monitoring in patients with fractures of thehip. J Trauma 25: 309
45 Shoemaker et al (1988) Prospective trial of supranormal values of survivors as therapeutic goals in high-riskpatients. Chest 94:1176-1186
46 Berlauk et al (1991) Preoperative optimisation of cardiovascular hemodynamics improves outcome in peripheralvascular surgery: A prospective, randomised clinical trial. Ann Surg 214:289-297
47 Fleming A, Bishop M, Shoemaker W et al (1992) Prospective trial of supranormal values as goals of resuscitationin severe trauma. Arch Surg 127:1175-1179
48 Bishop MH, Shoemaker WC, Appel PL et al (1995) Prospective, randomised trial of survivor values of cardiacindex, oxygen delivery, and oxygen consumption as resuscitation endpoints in severe trauma. J Trauma.38:780-787
49 Boyd O, Grounds RM, Bennett ED. (1993) A randomised clinical trial of the effect of deliberate perioperativeincrease of oxygen delivery on mortality in high-risk surgical patients. JAMA 270: 2699
50 Wilson et al (1999) Reducing the risk of major elective surgery: randomised controlled trial of preoperativeoptimisation of oxygen delivery. BMJ 318:1099-1103.
51 Sinclair et al (1997) Intraoperative intravascular volume optimisation and length of hospital stay after repair ofproximal femoral fracture: randomised controlled trial. BMJ 315:909-912
52 Shoemaker et al (1999) Intraoperative evaluation of tissue perfusion in high-risk patients by invasive and non-invasive Hemodynamic monitoring. Crit Care Med 27 (10) 2147-2152
53 Shoemaker et al (1990) The efficacy of central venous and pulmonary artery catheters and therapy based uponthem in reducing mortality and morbidity. Arch Surg 125:1332-1338
54 Bland, Shoemaker et al (1985) Hemodynamic and oxygen transport patterns in surviving and non-survivingpostoperative patients. Crit Care Med 13 (2) 85-90
55 Gutierrez G, Palizas F, Doglio G et al (1992) Gastric intramucosal pH as a therapeutic index of tissue oxygenationin critically ill patients. Lancet 339: 19
56 Grounds R.M., (2003) Reducing mortality and complications in patients undergoing surgery at high risk for postoperative complications and death. In: Recent Advances in Anaesthesia and intensive care 22 ed: Adams, AP.,Cashman, JN., Grounds, RM., Greenwich Medical Media Ltd, London.
57 Grocott &Gan, Hemodynamic "Optimisation" Goal Is Improved Outcome58 Kern & Shoemaker (2002) Meta-analysis of hemodynamic optimisation in high-risk patients. Crit Care Med 30 (8)
1686-169259 Bennett (2002) Goal-directed therapy is successful in the right patients. Crit Care Med 30 (8) 1909-1060 Singh and Manji (2001) A survey of pre-operative optimisation of high-risk surgical patients undergoing major
elective surgery. Anaesthesia 56:988-100261 Wilson et al (2001) Cardiovascular optimisation for high-risk surgery. Cur Op Crit Care 7:195-19962 Boyd & Bennett (1999) Achieving the goal. Crit Care Med 27:2298-963 Nethirasigamani & Fielden (2002) "Pre-operative optimisation of high risk surgical patients [Letter]" Anaesthesia
57:405-664 Poeze et al (2000) Goal-orientated haemodynamic therapy: a plea for a closer look at using peri-operative
oxygen transport. Int Care Med 26:635-63765 Traber (2002) Fluid resuscitation after hypovolemia. Crit Care Med 30 (8) 192266 Parry-Jones AJD and Pittman JAL (2003) Arterial pressure and stroke volume variability as measurements for
cardiovascular optimisation. International Journal of Intensive Care, Summer vol. 10 (2)67 Boyd, Grounds, Bennett (1993) The use of dopexamine hydrochloride to increase oxygen delivery perioperatively.
Anesth. Analg. 76: 372-37668 Jonas M et al (2002) Real-time, continuous monitoring of cardiac output and oxygen delivery. Inter J. Intensive
Care 9 (1) 33-42.69 Yu et al (1993) Affect of maximum oxygen delivery on morbidity and mortality in critically ill patients: a
prospective, randomised controlled study. Crit. Care Med 21:830-83870 Rivers et al (2001) Early goal-directed therapy in the treatment of severe sepsis and septic shock. N Engl J Med
345 (19) 1368-7771 Hamilton et al (1932) Studies on the circulation IV. Further analysis of the injection methods and of changes in
hemodynamics under physiological conditions. Am.J. Physiol 99:534-55172 Linton et al (1993) A new method of measuring cardiac output in man using lithium dilution. Br.J. Anaeth.
71:262-26673 Linton et al (1998) Lithium dilution cardiac output measurement – a brief review. In: Ikeda et al, State of the art
technology in anaesthesia & intensive care. Elsevier 61-66.74 Jonas et al (2001) The pharmacokinetics of intravenous lithium chloride in patients and normal volunteers. J. trace
Elements Microprobe Technologies 19:313-32075 Amidsen (1980) Lithium. In: Schentag et al, Applied pharmacokinetics: principles of therapeutic drug monitoring.
San Francisco: Therapeutics Inc 586-617.76 Price et al (1994) Lithium in the treatment of mood disorders. N Engl J Med. 331:591-59877 Neilsen-Kudsk, Amidsen (1979) Analysis of the Pharmcokinetics in man. Eur J Clin Pharmacol. 16:271-27778 Mason, McQueen, Keary (1978) Pharmcokinetics of lithium elimination and half-life, renal clearance and
apparent volume distribution in schizophrenia. Clin Pharmacokinet 3:241-246.79 Mappes et al (2001) Perioperative hemodynamic beat-to-beat monitoring of cardiac output:the new PulseCO
system. American Soc. Of Anesthesiology, New Orleans, Oct., Abstracts80 Hamilton TT., Jessen ME ., (2002) PulseCO: Accurate monitoring of cardiac output from the arterial waveform.
Presented at the 8th Annual Current Trends in Thoracic Surgery VIII Meeting 2002.81 Teboul J-L (2003) Editorial: Dynamic concepts of volume responsiveness. International Journal of Intensive Care,
Summer vol. 10 (2)82 Reuter et al (2002) Stroke volume variations for assessment of cardiac responsiveness to volume variations for
assessment of cardiac responsiveness to volume loading in mechanically ventilated patients after cardiac surgery.Intensive Care Med. 28:392-398.
83 Friese, R., Lemaire, S., Minei, J. (2003) Reduction of pulse pressure variation is correlated with preload recruitableincreases in cardiac index. University of Texas, Southwestern medical center, Dallas TX. Poster abstract presentedat the AAST (Tampa).
84 Ziegler et al (1997) A prospective randomised trial of preoperative ‘optimisation’ of cardiac function in patientsundergoing elective peripheral vascular surgery. Surgery 122:584-592.
85 Polonen et al (2000) A prospective, randomised study of goal-oriented hemodynamic therapy in cardiac surgicalpatients. Anaesth Analg 90:1052-1059.
86 Lobo et al (2000) Effects of maximizing oxygen delivery on morbidity and mortality in high-risk surgical patients.Crit Care Med 28:3396-3404.
87 Smith J, Kirwan C, Lei K, Beale R (2005) Cardiac Output measured by lithium dilution and transpulmonarythermodilution in adult intensive care patients. Crit Care Med. 33(12) Suppl; 207-S; A56.
88 Rupert Pearse, Deborah Dawson, Jayne Fawcett, Andrew Rhodes, R Michael Grounds and E David Bennett (2005)Early goal-directed therapy after major surgery reduces complications and duration of hospital stay. Arandomised,controlled trial. [ISRCTN38797445], Critical Care 2005, 9:R687-R693 (DOI 10.1186/cc3887).
89 Hallowell G, Corley K (2005) Use of lithium dilution and pulse contour analysis cardiac output determination inanestheized horses: a clinical evaluation. Vet Anaes & Analgesia 32, 201-211.
90 Costa MG, Lugano M, Coccia C, Della Rocca G (2004) Continuous and intermittent lithium dilution cardiac outputmeasurements. European J of Anaesthesiology Vol. 21, Supplement 32, A-88.
91 Costa MG, Cecconi M, Coccia C, Chiarandini P, Della Rocca G (2005) Continuous and intermittent cardiac outputmeasurement, Pulmonary Artery Catheter vs. Lithium Dilution technique: Agreement at different levels of cardiacoutput. Presented at the Society of Critical Care Medicine, Phoenix Arizona, 15-19th January 2005
92 Chinard FP, ‘The Pulmonary Circulation and Interstitial Space’ 1969 Ch6 79-98.93 Stewart GN, ‘The Pulmonary Circulation time, the quantity of blood on the lungs and the output of the heart.
Am J Physiol 1921 58 20-44.94 Kirwan C et al (2005) A comparison of two calibrated, continuous, arterial pressure waveform based
measurements of cardiac output over 24 hours. Crit Care Med. 33(12) Suppl; 207-S; A56.95 Kim JJ, Dreyer WJ, Chang AC, Breinholt JP, Grifka RG (2006) Arterial pulse wave analysis: An accurate means of
determining cardiac output in children; Pediatr Crit Care Med 2006 Vol. 7, No. 6, 532-35.

The CardiovascularMonitoring Companywww.lidco.com
L i D C O ™
Global Sales:
Email: [email protected]: +44 (0) 1223 830 666Fax: +44 (0) 1223 837 241
LiDCO Ltd, Unit M, South Cambridge Business ParkBabraham Road, Sawston, Cambridge, CB22 3JH, UK
For USA Ordering:
Email: [email protected]: +1 877 LiDCO11 (877 543 2611)Fax: +1 847 265 3737
LiDCO Ltd, 500 Park Ave., Suite103Lake Villa, IL 60046, USA19
14
1914 lidcoplus sales aid bro 1:Layout 1 22/4/10 15:21 Page 1