Continuing professional development audit report
68
2013 –15 Continuing professional development audit report
Transcript of Continuing professional development audit report

2013 –15
Continuing professional development audit report

Foreword 3
Executive summary 4
Introduction 5
About us 5
Our main functions 5
Continuing professional development and the HCPC 5
The standards 5
About this report 5
The CPD audit process 6
Registration and CPD 6
Selection 6
Sample size 6
Assessing the profiles 7
CPD assessors 7
Assessment outcomes 7
Deferral 7
Appeals 7
Assessor feedback 8
Audit results 9
Key to tables and graphs 9
Paramedics 10
Orthoptists 13
Speech and language therapists 16
Prosthetists / orthotists 19
Clinical scientists 22
Occupational therapists 25
Biomedical scientists 28
Radiographers 31
Physiotherapists 34
Arts therapists 37
Dietitians 40
Chiropodists / podiatrists 43
Hearing aid dispensers 46
Operating department practitioners 49
Social workers in England 52
Practitioner psychologists 54
Overall audit summary 59
Conclusion 62
List of tables and graphs 63
Further information 67
Contents

3Continuing professional development audit report
Foreword
Our approach to auditing the quality and effectiveness of registrants’ continuing professional development (CPD) activities is now becoming an embedded feature of the registration cycle. We have audited most professions more than once and seen a high level of engagement with the process among registrants.
This is our fourth report on CPD audits, which covers the period between 2013–15. During that time we invited 8,164 registrants to submit their CPD portfolios. In the majority of cases the quality was high, with the vast majority of registrants demonstrating they had met the standards.
The CPD standards were published in 2006 and the first audits began in 2008. This year we published the findings of an external review into our CPD process, which can be found on our website. The key findings were as follows.
— 90 per cent of respondents said they understood the CPD standards ‘well’ or ‘completely’.
— 57 per cent of respondents felt that the current standards should remain as they are, this view was echoed by professional bodies and employers.
— 69 per cent of respondents agreed that the current CPD standards encouraged them to reflect and think critically about their practice.
The research made some recommendations for possible improvements which we are progressing. As part of this, in 2016 we will be consulting on a revised version of our guidance for registrants on the CPD standards and process.
For those registrants who are about to embark on the process of submitting their CPD portfolio, I would urge them to look at our website and relevant professional body sites. Also to share this with managers and colleagues, and elicit support from as many sources as possible.
Elaine Buckley Chair

4 Continuing professional development audit report
Executive Summary
This report describes the outcomes of the audits for the 16 professions who were audited between 2013 and 2015. The majority of registrants successfully completed their CPD audit, with most CPD profiles being accepted after their first time. Out of the fifteen professions included in this report that have been through more than one audit, nine have seen an increase in the number of profiles accepted compared to their previous audit.
Voluntary deregistration rates varied across the professions. The majority of registrants who requested voluntary deregistration were in the over 50 age range, as was the case in our previous three reports. This trend seems to indicate that those registrants are retiring from their profession.
Of those selected for audit there was a lower rate across all professions who did not renew their registration compared to the previous report. In regards to the rate of deferrals, this varied across the professions. The average deferral rate across all 16 professions was also slightly less than the previous audit.
There are a very small number of registrants whose profiles remain ‘under assessment’. There is a number of different reasons why some registrants are still listed as being ‘under assessment’. This includes a small number of registrants who did not renew their registration before the renewal deadline but who have subsequently been readmitted to the Register.
A very small number of those selected for audit were removed from the Register. Those decisions were made because registrants had failed to submit either a CPD profile or further information in support of their profile. In each case we will have given them several opportunities to comply before the decision was taken to remove them from the Register. No registrants were removed because their profile was assessed as not meeting the standards. Three appeals were made during the period covered by this report.
Our initial analysis is that there are no significant differences between the outcomes in different professions. Approximately 75–85 per cent of CPD profiles submitted for audit were accepted. Most professions have seen an improvement in the percentage of CPD profiles that were accepted compared to previous audits.
The quality of the CPD profiles we have seen so far is high and continues to improve with each round of audits. The majority of profiles continue to demonstrate links between ongoing learning and benefits to practice and service users.

5Continuing professional development audit report
Introduction
About us We are the Health and Care Professions Council. We are a regulator and our main aim is to protect the public. To do this, we keep a register of professionals who meet our standards for their education and training, professional skills and behaviour. We can take action if someone on our Register falls below our standards.
Our main functionsTo protect the public, we:
— set standards for the education and training, professional skills, conduct, performance and ethics of registrants;
— keep a register of professionals who meet those standards;
— approve programmes which professionals must complete before they can register with us; and
— take action when registrants do not meet our standards.
Continuing professional development and the HCPCWe define continuing professional development (CPD) as a way for registrants to continue to learn and develop throughout their careers in order to keep their knowledge and skills up to date and be able to work safely and effectively.
Each time a profession renews its registration, we take a random sample of registrants and ask them to provide us with information about their CPD to demonstrate that they have met our CPD standards.
The standardsOur standards say that a registrant must:
1. maintain a continuous, up-to-date and accurate record of their CPD activities;
2. demonstrate that their CPD activities are a mixture of learning activities relevant to current or future practice;
3. seek to ensure that their CPD has contributed to the quality of their practice and service delivery;
4. seek to ensure that their CPD benefits the service user; and
5. upon request, present a written profile (which must be their own work and supported by evidence) explaining how they have met the standards for CPD.
About this reportThis report describes the outcomes of the audits for the 16 professions who were audited between 2013 and 2015. It includes information about the audit process, statistics showing the outcomes of the audits and describes some trends we identified in the audits.
Below is a list of the audits that took place between 2013 and 2015, by profession and in the order that the audits took place.
— Paramedics
— Orthoptists
— Speech and language therapists
— Prosthetists / orthotists
— Clinical scientists
— Occupational therapists
— Biomedical scientists
— Radiographers
— Physiotherapists
— Arts therapists
— Dietitians
— Chiropodists / podiatrists
— Hearing aid dispensers
— Operating department practitioners
— Social workers
— Practitioner psychologists

6 Continuing professional development audit report
The CPD audit process
Registration and CPDRegistrants must renew their HCPC registration every two years and each profession has fixed renewal dates. Each time a profession renews its registration, registrants are asked to sign a renewal form to confirm that they continue to meet our standards of conduct, performance and ethics; the standards of proficiency for their profession; and have met the standards for continuing professional development.
Continuing professional development (CPD) is linked to registration renewal. This means that each time a profession renews its registration we also select a sample of registrants, asking them to send us a ‘CPD profile’ which provides information about their CPD activities and shows how they have met the CPD standards.
SelectionWe currently select a random sample of 2.5 per cent of registrants to participate in the CPD audit when a profession renews its registration.
A registrant has to be on the Register for a full two years before they will be selected for audit. This allows them time to undertake CPD which meets our requirements and avoids selecting those new to their profession or those returning to practice after a break.
The selection is random because CPD is an ongoing requirement for all registrants. A random selection ensures all registrants have an equal chance of being selected for audit. This also means that a registrant could be selected to participate in an audit more than once in their professional career or, indeed, in consecutive audits.
Sample sizeWhen the first audits took place in 2008, we selected five per cent of the first two professions to renew and asked them to complete a CPD profile. Those professions
were chiropodists / podiatrists and operating department practitioners. Following the positive results of these audits, we subsequently reduced the sample size to 2.5 per cent.
The sample sizes we chose were in part informed by analysis carried out on our behalf by the University of Reading1. This looked at how confident we could be with different sample sizes that the audits would be successful in picking up instances where registrants were not meeting our standards. In deciding upon the sample size we also considered the role of the audits in encouraging all registrants to undertake CPD.
We are confident that auditing 2.5 per cent of registrants is a proportionate approach which gives us a good picture of whether or not professionals are meeting our standards, while keeping costs down to manageable levels. However, we will continue to monitor trends in the audit outcomes and the findings of ongoing research activities to consider whether our approach should change in the future.
All of the 13 professions that were regulated when the CPD standards were introduced in 2006 have now been audited at least twice. Since then three new professions – hearing aid dispensers, practitioner psychologists and social workers in England – have joined the Register.
The first CPD audit for each of these professions was as follows.
— Hearing aid dispensers – from May 2012
— Practitioner psychologists – from March 2013
— Social workers in England – from September 2014
1 University of Reading (2009). Advice on sample size for CPD audit process. www.hcpc-uk.org/assets/documents/1000275520090326-Council-enclosure24-CPDsamplesizes.pdf
7Continuing professional development audit report
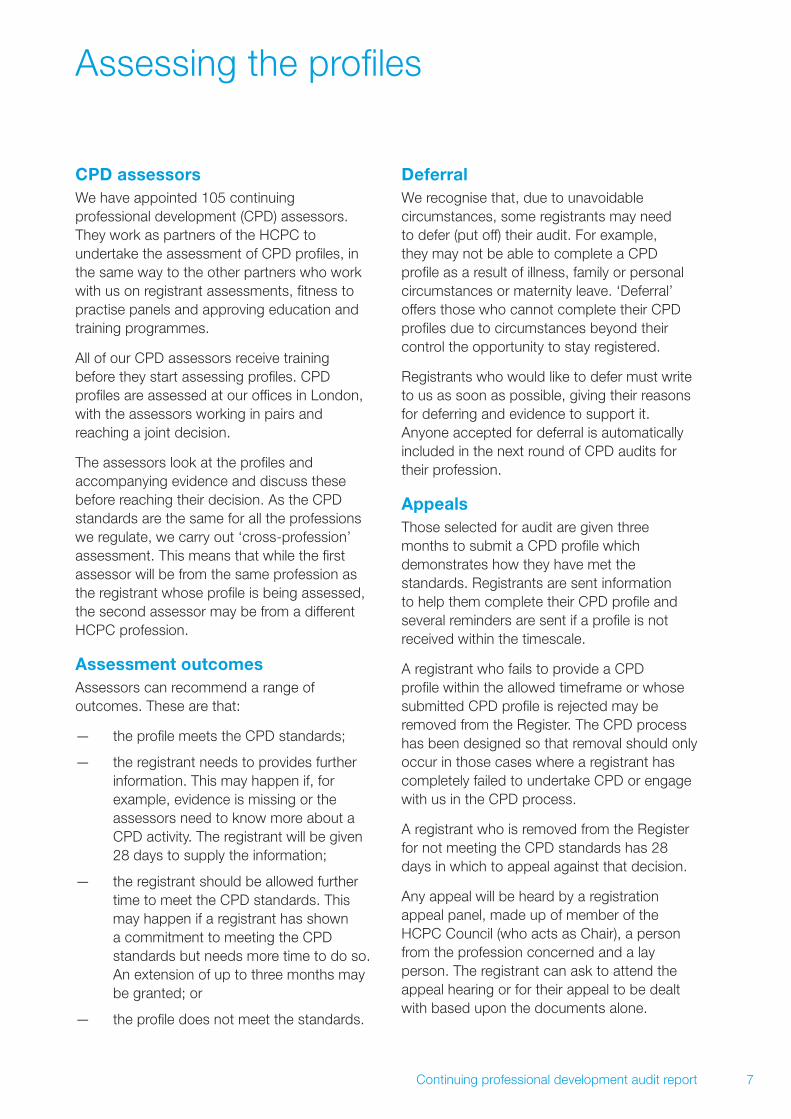
CPD assessorsWe have appointed 105 continuing professional development (CPD) assessors. They work as partners of the HCPC to undertake the assessment of CPD profiles, in the same way to the other partners who work with us on registrant assessments, fitness to practise panels and approving education and training programmes.
All of our CPD assessors receive training before they start assessing profiles. CPD profiles are assessed at our offices in London, with the assessors working in pairs and reaching a joint decision.
The assessors look at the profiles and accompanying evidence and discuss these before reaching their decision. As the CPD standards are the same for all the professions we regulate, we carry out ‘cross-profession’ assessment. This means that while the first assessor will be from the same profession as the registrant whose profile is being assessed, the second assessor may be from a different HCPC profession.
Assessment outcomes Assessors can recommend a range of outcomes. These are that:
— the profile meets the CPD standards;
— the registrant needs to provides further information. This may happen if, for example, evidence is missing or the assessors need to know more about a CPD activity. The registrant will be given 28 days to supply the information;
— the registrant should be allowed further time to meet the CPD standards. This may happen if a registrant has shown a commitment to meeting the CPD standards but needs more time to do so. An extension of up to three months may be granted; or
— the profile does not meet the standards.
DeferralWe recognise that, due to unavoidable circumstances, some registrants may need to defer (put off) their audit. For example, they may not be able to complete a CPD profile as a result of illness, family or personal circumstances or maternity leave. ‘Deferral’ offers those who cannot complete their CPD profiles due to circumstances beyond their control the opportunity to stay registered.
Registrants who would like to defer must write to us as soon as possible, giving their reasons for deferring and evidence to support it. Anyone accepted for deferral is automatically included in the next round of CPD audits for their profession.
Appeals Those selected for audit are given three months to submit a CPD profile which demonstrates how they have met the standards. Registrants are sent information to help them complete their CPD profile and several reminders are sent if a profile is not received within the timescale.
A registrant who fails to provide a CPD profile within the allowed timeframe or whose submitted CPD profile is rejected may be removed from the Register. The CPD process has been designed so that removal should only occur in those cases where a registrant has completely failed to undertake CPD or engage with us in the CPD process.
A registrant who is removed from the Register for not meeting the CPD standards has 28 days in which to appeal against that decision.
Any appeal will be heard by a registration appeal panel, made up of member of the HCPC Council (who acts as Chair), a person from the profession concerned and a lay person. The registrant can ask to attend the appeal hearing or for their appeal to be dealt with based upon the documents alone.
Assessing the profiles

8 Continuing professional development audit report
Assessing the profiles
Assessor feedback In the last CPD report, we asked our assessors for feedback on the CPD audit submissions they had assessed. Below are some key recommendations from CPD assessors who were involved in the audits between 2013 and 2015 which they think would help registrants to complete a CPD profile.
Do
— Keep it simple. Use simple language to describe the CPD you have done, what you have learnt from it, and how it has benefited you and your service user(s).
— Choose three to five CPD activities over the last two years. Tell us what you did, what you learnt, and the benefits to you and your service user(s).
— Ensure the activities you discuss are a mixture of learning types and were undertaken in the last two years.
— Remember to include a dated list, in chronological order, of all the CPD activities you have completed in the last two years to demonstrate that you have met CPD standard 1. Please explain any gaps of three consecutive months or more.
— Provide a clear, easy to follow portfolio of evidence. Profile templates, examples and guidance can be found on our website.
— Double check your profile before submitting it to us, ensuring all relevant documentation is included.
Don’t
— Try to describe in detail every activity you have undertaken over the last two years. Selecting a small number of different activities that you feel benefited you the most and writing about each one is a better approach (see previous examples).
— Send us evidence of all your CPD activities. We only need evidence to support the activities you have written about to demonstrate standards 3 and 4.
— Include identifiable information, this must be anonymised before including it with your CPD profile. This is any information you hold about a service user(s) that could identify them, such as names, addresses or any other personal information.
— Include CVs.

9Continuing professional development audit report
Audit results
In this section we give statistics for the outcome of the continuing professional development (CPD) audits for the 16 professions we audited between June 2013 and March 2015.
For each of the professions we have included a table which outlines the outcome of the audit. We have also included some descriptive information, pie charts and graphs to illustrate some of the trends we identified in the audit. The audit outcomes are listed by profession, in the order that we audited each profession.
Key to tables and graphsThe results of the CPD audits are presented by profession. We have categorised each registrant audited into one of six different categories. An explanation of these categories is given below.
Accepted The CPD profile met the CPD standards.
Deferred The registrant was selected for audit, but requested deferral due to unavoidable circumstances and we accepted their request.
Deregistered (voluntarily) The registrant was selected for audit but removed their name from the Register and so did not participate in the audit.
Deregistered (did not renew) The registrant was removed from the Register because they did not renew their registration.
Under assessment The registrant’s CPD profile is currently being assessed.
Removed The registrant was removed from the Register because they did not meet the CPD standards.
Table 1 – Summary of overall results 2013 –15
Outcome Number of registrants % sample
Accepted 6,593 80.8
Deferred 877 10.7
Deregistered (voluntarily) 397 4.8
Deregistered (did not renew) 261 3.2
Under assessment 14 0.2
Removed 22 0.3
Total 8,164 100

10 Continuing professional development audit report
ParamedicsWe selected 2.5 per cent of paramedics for audit in June 2013.
Table 2 – Outcome of paramedic CPD audit
Outcome Number of registrants
% of registrants
Accepted 430 88.3
Deferred 32 6.6
Deregistered (voluntarily)
17 3.5
Deregistered (did not renew)
8 1.6
Under assessment 0 0
Removed 0 0
Total 487 100
Graph 1 – Outcome of paramedic CPD audit
Accepted(88.3%)
Deferred(6.6%)
Deregistered (voluntarily)(3.5%)
Deregistered (did not renew)(1.6%)
— The average age of those selected for audit was 47 years, compared to an average age of 43 for the profession as a whole.
— The gender of those selected for audit closely reflected the gender split of the profession as a whole; 37 per cent of those selected were female and 63 per cent were male.
— Approximately one in nineteen registrants selected for audit were either voluntarily removed from the Register or did not renew their registration. This compares with approximately one in 32 registrants across the profession as a whole.
— The average age of paramedics selected for audit who requested voluntary deregistration was 55 years. The average age of paramedics who requested voluntary deregistration in the profession as a whole was 58 years.
— The average age of paramedics selected for audit who did not renew their registration was 49 years. The average age of paramedics who did not renew their registration in the profession as a whole was 48 years.
The following graphs illustrate the age range and gender split of paramedics as a profession as a whole and those selected for audit.
Audit results

11Continuing professional development audit report
Graph 2 – Age and gender of paramedics across the whole profession
0
500
1,000
1,500
2,000
2,500
Female Male
Num
ber
Age range
20–2
425
–29
30–3
435
–39
40–4
445
–49
50–5
455
–59
60–6
465
–69
70–7
4
75+
Graph 3 – Age and gender of paramedics selected for CPD
0
10
20
30
40
50
60
70
Num
ber
Age range
Female Male
20–2
425
–29
30–3
435
–39
40–4
445
–49
50–5
455
–59
60–6
465
–69
70–7
475
+
Deferrals
There were 32 successful deferral requests.
Table 3 – Reasons for deferral – paramedics
Reason for deferral Number
Maternity leave 7
Health 13
Family health 2
Employment situation 3
Domestic situation 3
Academic study 2
Bereavement 2
Comparison with previous audit
This was the third CPD audit for paramedics. Their first audit took place in June 2009. The following table compares the results from the three audits.
Audit results

12 Continuing professional development audit report
Table 4 – Comparison with previous audits – paramedics
%
Accepted
Deferred
Deregistered (voluntarily)
Deregistered (did not renew)
Under assessment
Removed
2009 audit 79.8 6.9 2.4 1.1 9.8 0
2011 audit 85 11 1.9 1.9 0 0.2
2013 audit 88.3 6.6 3.5 1.6 0 0
Difference 2011 v 2009 5.2 4.1 -0.5 0.8 -9.8 0.2
Difference 2013 v 2011 3.3 -4.4 1.6 -0.3 0 -0.2
This shows that more paramedic profiles were accepted in the 2013 audit than in the previous audits. There were also more deferral requests in 2011. It should be noted that when the 2009 data was collected, there were a higher number of paramedic profiles still under assessment.
Audit results

13Continuing professional development audit report
OrthoptistsWe selected 2.5 per cent of orthoptists in June 2013.
Table 5 – Outcome of orthoptist CPD audit
Outcome Number of registrants
% of registrants
Accepted 28 84.8
Deferred 0 0
Deregistered (voluntarily)
2 6.1
Deregistered (did not renew)
3 9.1
Under assessment 0 0
Removed 0 0
Total 33 100
Graph 4 – Outcome of orthoptist CPD audit
Deregistered(voluntarily)(6.1%)
Accepted(84.8%)
Deregistered(did not renew)(9.1%)
— The average age of those selected for audit was 45 years, compared to an average age of 41 for the profession as a whole.
— The gender of those selected for audit closely reflected the gender split of the profession as a whole; 91 per cent of those selected were female and nine per cent were male.
— Approximately one in seven registrants selected for audit were either voluntarily removed from the Register or did not renew their registration. This compares with approximately one in thirteen registrants across the profession as a whole.
— The average age of orthoptists selected for audit who requested voluntary deregistration was 57 years. The average age of orthoptists who requested voluntary deregistration in the profession as a whole was 60 years.
— The average age of orthoptists selected for audit who did not renew their registration was 42 years. The average age of orthoptists who did not renew their registration in the profession as a whole was 39 years.
The following graphs illustrate the age range and gender split of orthoptists as a profession as a whole and those selected for audit.
Audit results

14 Continuing professional development audit report
Graph 5 – Age and gender of orthoptists across the whole profession
0
50
100
150
200
Num
ber
Age range
Female Male
20–2
425
–29
30–3
435
–39
40–4
445
–49
50–5
455
–59
60–6
465
–69
70–7
4
75+
Graph 6 – Age and gender of orthoptists selected for CPD
0
1
2
3
4
5
6
Num
ber
Age range
Female Male
20–2
425
–29
30–3
435
–39
40–4
445
–49
50–5
455
–59
60–6
465
–69
70–7
4
75+
Deferrals
There were no deferral requests.
Comparison with previous audit
This was the third CPD audit for orthoptists. Their first audit took place in June 2009. The following table compares the results from the three audits.
Audit results

15Continuing professional development audit report
This shows that more orthoptist profiles were accepted in 2013 than in the previous audits. There were no deferral requests and fewer voluntary deregistration requests. It should also be noted that when the 2009 data was collected, there were a higher number of orthoptist profiles still under assessment.
Table 6 – Comparison with previous audits – orthoptists
%
Accepted
Deferred
Deregistered (voluntarily)
Deregistered (did not renew)
Under assessment
Removed
2009 audit 73.4 10 3.3 3.3 10 0
2011 audit 75.8 12.1 12.1 0 0 0
2013 audit 84.8 0 6.1 9.1 0 0
Difference 2011 v 2009 2.4 2.1 8.8 -3.3 -10 0
Difference 2013 v 2011 9 -12.1 -6 9.1 0 0
Audit results

16 Continuing professional development audit report
Speech and language therapistsWe selected 2.5 per cent of speech and language therapists for audit in July 2013.
Table 7 – Outcome of speech and language therapist CPD audit
Outcome Number of registrants
% of registrants
Accepted 281 79.8
Deferred 48 13.6
Deregistered (voluntarily)
13 3.7
Deregistered (did not renew)
9 2.6
Under assessment 0 0
Removed 1 0.3
Total 352 100
Graph 7 – Outcome of speech and language therapist CPD audit
Accepted(79.8%)
Removed(0.3%)
Deferred(13.6%)
Deregistered (voluntarily)(3.7%)
Deregistered (did not renew)(2.6%)
— The average age of those selected for audit was 44 years, compared to an average age of 41 for the profession as a whole.
— The gender of those selected for audit closely reflected the gender split of the profession as a whole; 98 per cent of those selected were female and two per cent were male.
— Approximately one in sixteen registrants selected for audit were either voluntarily removed from the Register or did not renew their registration. This reflects the average of the profession as a whole during the period covered by this report.
— The average age of speech and language therapists selected for audit who requested voluntary deregistration was 50 years. The average age of speech and language therapists who requested voluntary deregistration in the profession as a whole was 51 years.
— The average age of speech and language therapists selected for audit who did not renew their registration was 44 years. The average age of speech and language therapists who did not renew their registration in the profession as a whole was 38 years.
— One registrant was removed from the Register for failing to send in their CPD profile despite being sent several reminders. They did not appeal that decision.
The following graphs illustrate the age range and gender split of speech and language therapists as a profession as a whole and those selected for audit.
Audit results

17Continuing professional development audit report
Graph 8 – Age and gender of speech and language therapists across the whole profession
0
500
1,000
1,500
2,000
2,500
3,000
Num
ber
Age range
Female Male
20–2
425
–29
30–3
435
–39
40–4
445
–49
50–5
455
–59
60–6
465
–69
70–7
4
75+
Graph 9 – Age and gender of speech and language therapists selected for CPD
0
10
20
30
40
50
60
70
Num
ber
Age range
Female Male
20–2
425
–29
30–3
435
–39
40–4
445
–49
50–5
455
–59
60–6
465
–69
70–7
4
75+
Deferrals
There were 48 successful deferral requests.
Table 8 – Reasons for deferral – speech and language therapists
Reason for deferral Number
Maternity leave 33
Health 4
Family health 1
Employment situation 6
Domestic situation 1
Bereavement 3
Comparison with previous audit
This was the third CPD audit for speech and language therapists. Their first audit took place in July 2009. The following table compares the results from the three audits.
Audit results

18 Continuing professional development audit report
Table 9 – Comparison with previous audits – speech and language therapists
%
Accepted
Deferred
Deregistered (voluntarily)
Deregistered (did not renew)
Under assessment
Removed
2009 audit 82.6 9.5 4.9 3 0 0
2011 audit 77.5 15.2 3.3 4 0 0
2013 audit 79.8 13.6 3.7 2.6 0 0.3
Difference 2011 v 2009 -5.1 5.7 -1.6 1 0 0
Difference 2013 v 2011 2.3 -1.6 0.4 -1.4 0 0.3
This shows that more speech and language therapist profiles were accepted in the 2013 audit compared to 2011. There were fewer deferral requests in 2013.
Audit results

19Continuing professional development audit report
Prosthetists / orthotistsWe selected 2.5 per cent of prosthetists / orthotists for audit in July 2013.
Table 10 – Outcome of prosthetist / orthotist CPD audit
Outcome Number of registrants
% of registrants
Accepted 18 75
Deferred 2 8.3
Deregistered (voluntarily)
3 12.5
Deregistered (did not renew)
1 4.2
Under assessment 0 0
Removed 0 0
Total 24 100
Graph 10 – Outcome of prosthetist / orthotist CPD audit
Deregistered(voluntarily)(12.5%)
Accepted(75%)
Deferred(8.3%)
Deregistered (did not renew)(4.2%)
— The average age of those selected for audit was 44 years, compared to an average age of 42 for the profession as a whole.
— 42 per cent of those selected were female and 58 per cent were male. In the profession as a whole, 51 per cent are female and 49 per cent are male.
— Approximately one in six registrants selected for audit were either voluntarily removed from the Register or did not renew their registration. This compares with approximately one in fifteen registrants across the profession as a whole.
— The average age of prosthetists / orthotists selected for audit who requested voluntary deregistration was 62 years. The average age of prosthetists / orthotists who requested voluntary deregistration in the profession as a whole was 61 years.
— Only one prosthetist / orthotist selected for audit did not renew their registration. The average age of prosthetists / orthotists who did not renew their registration in the profession as a whole was 44 years.
The following graphs illustrate the age range and gender split of prosthetists / orthotists as a profession as a whole and those selected for audit.
Audit results

20 Continuing professional development audit report
Graph 11 – Age and gender of prosthetists / orthotists across the whole profession
0
10
20
30
40
50
60
70
80
90
100
110
Num
ber
Age range
Female Male
20–2
425
–29
30–3
435
–39
40–4
445
–49
50–5
455
–59
60–6
465
–69
70–7
4
75+
Graph 12 – Age and gender of prosthetists / orthotists selected for CPD
0
1
2
3
Num
ber
Age range
Female Male
20–2
425
–29
30–3
435
–39
40–4
445
–49
50–5
455
–59
60–6
465
–69
70–7
4
75+
Deferrals
There were two successful deferral requests.
Table 11 – Reasons for deferral – prosthetists / orthotists
Reason for deferral Number
Employment situation 1
Health 1
Comparison with previous audit
This was the third CPD audit for prosthetists / orthotists. Their first audit took place in July 2009. The following table compares the results from the three audits.
Audit results

21Continuing professional development audit report
This shows that fewer prosthetist / orthotist profiles were accepted in 2013 than in the previous audits. However there were more voluntary deregistration requests in this audit but less prosthetists / orthotists who did not renew their registration.
Table 12 – Comparison with previous audits – prosthetists / orthotists
%
Accepted
Deferred
Deregistered (voluntarily)
Deregistered (did not renew)
Under assessment
Removed
2009 audit 77.4 4.5 9.1 4.5 0 4.5
2011 audit 86.4 4.5 0 9.1 0 0
2013 audit 75 8.3 12.5 4.2 0 0
Difference 2011 v 2009
9 0 -9.1 4.6 0 -4.5
Difference 2013 v 2011
-11.4 3.8 12.5 -4.9 0 0
Audit results

22 Continuing professional development audit report
Clinical scientistsWe selected 2.5 per cent of clinical scientists for audit in July 2013.
Table 13 – Outcome of clinical scientist CPD audit
Outcome Number of registrants
% of registrants
Accepted 104 84.6
Deferred 8 6.5
Deregistered (voluntarily)
8 6.5
Deregistered (did not renew)
3 2.4
Under assessment 0 0
Removed 0 0
Total 123 100
Graph 13 – Outcome of clinical scientist CPD audit
Deferred(6.5%)
Deregistered (voluntarily)(6.5%) Accepted
(84.6%)
Deregistered (did not renew)(2.4%)
— The average age of those selected for audit was 43 years, compared to an average age of 44 for the profession as a whole.
— The gender of those selected for audit closely reflected the gender split of the whole profession as a whole; 59 per cent of those selected were female and 41 per cent were male.
— Approximately one in eleven registrants selected for audit were either voluntarily removed from the Register or did not renew their registration. This compares with approximately one in sixteen registrants across the profession as a whole.
— The average age of clinical scientists selected for audit who requested voluntary deregistration was 56 years. The average age of clinical scientists who requested voluntary deregistration in the profession as a whole was 58 years.
— The average age of clinical scientists selected for audit who did not renew their registration was 54 years. The average age of clinical scientists who did not renew their registration in the profession as a whole was 56 years.
The following graphs illustrate the age range and gender split of clinical scientists as a profession as a whole and those selected for audit.
Audit results

23Continuing professional development audit report
Graph 14 – Age and gender of clinical scientists across the whole profession
0
100
200
300
400
500
600
700
Num
ber
Age range
Female Male
20–2
425
–29
30–3
435
–39
40–4
445
–49
50–5
455
–59
60–6
465
–69
70–7
4
75+
Graph 15 – Age and gender of clinical scientists selected for CPD
0
5
10
15
20
25
Num
ber
Age range
Female Male
20–2
425
–29
30–3
435
–39
40–4
445
–49
50–5
455
–59
60–6
465
–69
70–7
4
75+
Deferrals
There were eight successful deferral requests.
Table 14 – Reasons for deferral – clinical scientists
Reason for deferral Number
Maternity leave 3
Health 2
Employment situation 2
Domestic situation 1
Comparison with previous audit
This was the third CPD audit for clinical scientists. Their first audit took place in July 2009. The following table compares the results from the three audits.
Audit results

24 Continuing professional development audit report
The results of the 2011 and 2013 audits were very similar. There was a slight increase in the number of clinical scientist voluntarily deregistering but a slight decrease in the number of those who did not renew their registration.
Table 15 – Comparison with previous audits – clinical scientists
%
Accepted
Deferred
Deregistered (voluntarily)
Deregistered (did not renew)
Under assessment
Removed
2009 audit 83.9 6.2 4.5 3.6 0 1.8
2011 audit 84.8 6.8 4.2 4.2 0 0
2013 audit 84.6 6.5 6.5 2.4 0 0
Difference 2011 v 2009 0.9 0.6 -0.3 0.6 0 -1.8
Difference 2013 v 2011
-0.2 -0.3 2.3 -1.8 0 0
Audit results

25Continuing professional development audit report
Occupational therapistsWe selected 2.5 per cent of occupational therapists for audit in August 2013.
Table 16 – Outcome of occupational therapist CPD audit
Outcome Number of registrants
% of registrants
Accepted 656 76.6
Deferred 135 15.8
Deregistered (voluntarily)
36 4.2
Deregistered (did not renew)
28 3.3
Under assessment 0 0
Removed 1 0.1
Total 856 100
Graph 16 – Outcome of occupational therapist CPD audit
Accepted(76.6%)Deferred
(15.8%)
Removed(0.1%)
Deregistered (voluntarily)(4.2%)
Deregistered (did not renew)(3.3%)
— The average age of those selected for audit was 39 years, compared to an average age of 41 for the profession as a whole.
— The gender of those selected for audit reflected the gender split of the profession as a whole; 93 per cent of those selected were female and seven per cent were male.
— Approximately one in thirteen registrants selected for audit were either voluntarily removed from the Register or did not renew their registration. This compares with approximately one in seventeen registrants across the profession as a whole.
— The average age of occupational therapists selected for audit who requested voluntary deregistration was 44 years. The average age of occupational therapists who requested voluntary deregistration in the profession as a whole was 51 years.
— The average age of occupational therapists selected for audit who did not renew their registration was 43 years. The average age of occupational therapists who did not renew their registration in the profession as a whole was 40 years.
— One registrant was removed from the Register for failing to send in further information following the initial assessment. The registrant did not appeal the decision.
The following graphs illustrate the age range and gender split of occupational therapists as a profession as a whole and those selected for audit.
Audit results

26 Continuing professional development audit report
Graph 17 – Age and gender of occupational therapists across the whole profession
0
1,000
2,000
3,000
4,000
5,000
6,000
Num
ber
Age range
Female Male
20–2
425
–29
30–3
435
–39
40–4
445
–49
50–5
455
–59
60–6
465
–69
70–7
4
75+
Graph 18 – Age and gender of occupational therapists selected for CPD
0
50
100
150
200
Num
ber
Age range
Female Male
20–2
425
–29
30–3
435
–39
40–4
445
–49
50–5
455
–59
60–6
465
–69
70–7
4
75+
Deferrals
There were 135 successful deferral requests.
Table 17 – Reasons for deferral – occupational therapists
Reason for deferral Number
Maternity leave 65
Health 36
Family health 10
Employment situation 6
Domestic situation 4
Bereavement 7
Career break / travel 5
Adoption leave 1
Academic study 1
Comparison with previous audit
This was the third CPD audit for occupational therapists. Their first audit took place in August 2009. The following table compares the results from the three audits.
Audit results

27Continuing professional development audit report
Slightly fewer profiles were accepted in this audit, however there was an increase in the number of successful deferrals requests. Fewer occupational therapists voluntarily deregistered or did not renew their registration compared to the previous audit.
Table 18 – Comparison with previous audits – occupational therapists
%
Accepted
Deferred
Deregistered (voluntarily)
Deregistered (did not renew)
Under assessment
Removed
2009 audit 79.9 10.7 6.2 3 0.1 0.1
2011 audit 79.2 11.8 5.3 3.6 0 0.1
2013 audit 76.6 15.8 4.2 3.3 0 0.1
Difference 2011 v 2009
-0.7 1.1 -0.9 0.6 -0.1 0
Difference 2013 v 2011
-2.6 4 -1.1 0.3 0 0
Audit results

28 Continuing professional development audit report
Biomedical scientistsWe selected 2.5 per cent of biomedical scientists for audit in September 2013.
Table 19 – Outcome of biomedical scientist CPD audit
Outcome Number of registrants
% of registrants
Accepted 466 82.5
Deferred 44 7.8
Deregistered (voluntarily)
29 5.1
Deregistered (did not renew)
22 3.9
Under assessment 0 0
Removed 4 0.7
Total 565 100
Graph 19 – Outcome of biomedical scientist CPD audit
Accepted(82.5%)Deferred
(7.8%)
Removed(0.7%)Deregistered (voluntarily)
(5.1%)
Deregistered (did not renew)(3.9%)
— The average age of those selected for audit was 47 years, compared to an average age of 44 for the profession as a whole.
— 66 per cent of those selected were female and 34 per cent were male. In the profession as a whole, 69 per cent are female and 31 per cent are male.
— Approximately one in eleven registrants selected for audit were either voluntarily removed from the Register or did not renew their registration. This compares with approximately one in 16 registrants across the profession as a whole.
— The average age of biomedical scientists selected for audit who requested voluntary deregistration was 54 years. The average age of biomedical scientists who requested voluntary deregistration in the profession as a whole was 57 years.
— The average age of biomedical scientists selected for audit who did not renew their registration was 51 years. The average age of biomedical scientists who did not renew their registration in the profession as a whole was 46 years.
— Four registrants were removed from the Register for failing to submit a CPD profile, despite several requests. None of those registrants appealed any of those decisions.
The following graphs illustrate the age range and gender split of biomedical scientists as a profession as a whole and those selected for audit.
Audit results
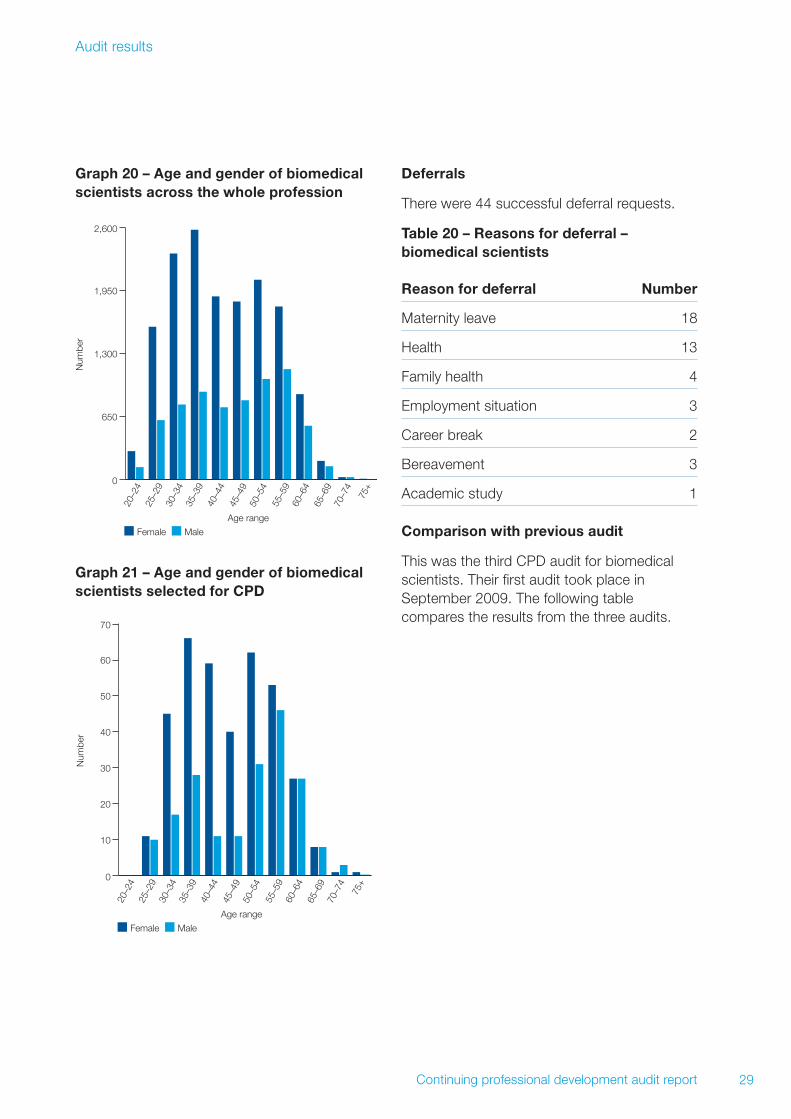
29Continuing professional development audit report
Graph 20 – Age and gender of biomedical scientists across the whole profession
0
650
1,300
1,950
2,600
Num
ber
Age range
Female Male
20–2
425
–29
30–3
435
–39
40–4
445
–49
50–5
455
–59
60–6
465
–69
70–7
4
75+
Graph 21 – Age and gender of biomedical scientists selected for CPD
0
10
20
30
40
50
60
70
Num
ber
Age range
Female Male
20–2
425
–29
30–3
435
–39
40–4
445
–49
50–5
455
–59
60–6
465
–69
70–7
4
75+
Deferrals
There were 44 successful deferral requests.
Table 20 – Reasons for deferral – biomedical scientists
Reason for deferral Number
Maternity leave 18
Health 13
Family health 4
Employment situation 3
Career break 2
Bereavement 3
Academic study 1
Comparison with previous audit
This was the third CPD audit for biomedical scientists. Their first audit took place in September 2009. The following table compares the results from the three audits.
Audit results

30 Continuing professional development audit report
The results of the 2011 and 2013 audits were very similar. There was a slight increase in the number of biomedical scientist profiles that were accepted in 2011. However slightly more deferrals were accepted in 2013 and more registrants were removed compared to 2011.
Table 21 – Comparison with previous audits – biomedical scientists
%
Accepted
Deferred
Deregistered (voluntarily)
Deregistered (did not renew)
Under assessment
Removed
2009 audit 83.9 6.7 4.9 3.4 0.9 0.2
2011 audit 84.8 6.7 4.7 3.3 0.2 0.3
2013 audit 82.5 7.8 5.1 3.9 0 0.7
Difference 2011 v 2009 0.9 0 -0.2 -0.1 -0.7 0.1
Difference 2013 v 2011
-2.3 1.1 0.4 0.6 -0.2 0.4
Audit results

31Continuing professional development audit report
RadiographersWe selected 2.5 per cent of radiographers for audit in December 2013.
Table 22 – Outcome of radiographer CPD audit
Outcome Number of registrants
% of registrants
Accepted 616 84.7
Deferred 68 9.4
Deregistered (voluntarily)
25 3.4
Deregistered (did not renew)
18 2.5
Under assessment 0 0
Removed 0 0
Total 727 100
Graph 22 – Outcome of radiographer CPD audit
Accepted(84.7%)Deferred
(9.4%)
Deregistered (voluntarily)(3.4%)
Deregistered (did not renew)(2.5%)
— The average age of those selected for audit was 44 years, compared to an average age of 43 for the profession as a whole.
— The gender of those selected for audit reflected the gender split of the profession as a whole; 78 per cent of those selected were female and 22 per cent were male.
— Approximately one in seventeen registrants selected for audit were either voluntarily removed from the Register or did not renew their registration. This compares with approximately one in twenty registrants across the profession as a whole.
— The average age of radiographers selected for audit who requested voluntary deregistration was 59 years. The average age of radiographers who requested voluntary deregistration in the profession as a whole was also 57 years.
— The average age of radiographers selected for audit who did not renew their registration was 44 years. The average age of radiographers who did not renew their registration in the profession as a whole was 40 years.
The following graphs illustrate the age range and gender split of radiographers as a profession as a whole and those selected for audit.
Audit results

32 Continuing professional development audit report
Graph 23 – Age and gender of radiographers across the whole profession
0
500
1,000
1,500
2,000
2,500
3,000
3,500
Num
ber
Age range
Female Male
20–2
425
–29
30–3
435
–39
40–4
445
–49
50–5
455
–59
60–6
465
–69
70–7
4
75+
Graph 24 – Age and gender of radiographers selected for CPD
0
20
40
60
80
100
Num
ber
Age range
Female Male
20–2
425
–29
30–3
435
–39
40–4
445
–49
50–5
455
–59
60–6
465
–69
70–7
4
75+
Deferrals
There were 68 successful deferral requests.
Table 23 – Reasons for deferral – radiographers
Reason for deferral Number
Maternity leave 31
Health 15
Family health 10
Employment situation 2
Bereavement 5
Career break / travel 2
Academic study 3
Comparison with previous audit
This was the third CPD audit for radiographers. Their first audit took place in December 2009. The following table compares the results from the three audits.
Audit results

33Continuing professional development audit report
This shows there was a slight increase in the number of radiographer profiles that were accepted in 2013. The number of deferrals requests decreased slightly compared to the previous audit.
Table 24 – Comparison with previous audits – radiographers
%
Accepted
Deferred
Deregistered (voluntarily)
Deregistered (did not renew)
Under assessment
Removed
2009 audit 86.7 5.1 2.9 4.4 0.6 0.3
2011 audit 82.9 9.6 4.5 3 0 0
2013 audit 84.7 9.4 3.4 2.5 0 0
Difference 2011 v 2009 -3.8 4.5 1.6 -1.4 -0.6 -0.3
Difference 2013 v 2011
1.8 -0.2 -1.1 -0.5 0 0
Audit results

34 Continuing professional development audit report
PhysiotherapistsWe selected 2.5 per cent of physiotherapists for audit in February 2014.
Table 25 – Outcome of physiotherapist CPD audit
Outcome Number of registrants
% of registrants
Accepted 1,000 81.7
Deferred 141 11.6
Deregistered (voluntarily)
59 4.8
Deregistered (did not renew)
20 1.6
Under assessment 0 0
Removed 4 0.3
Total 1,224 100
Graph 25 – Outcome of physiotherapist CPD audit
Accepted(81.7%)
Deferred(11.6%)
Deregistered (voluntarily)(4.8%)
Deregistered (did not renew)(1.6%)
Removed(0.3%)
— The average age of those selected for audit was 42 years, compared to an average age of 39 for the profession as a whole.
— 81 per cent of those selected were female and 19 per cent were male. In the profession as a whole, 78 per cent are female and 22 per cent are male.
— Approximately one in fifteen registrants selected for audit were either voluntarily removed from the Register or did not renew their registration. This compares with approximately one in seventeen registrants across the profession as a whole.
— The average age of physiotherapists selected for audit who requested voluntary deregistration was 51 years. The average age of physiotherapists who requested voluntary deregistration in the profession as a whole was also 51 years.
— The average age of physiotherapists selected for audit who did not renew their registration was 44 years. The average age of physiotherapists who did not renew their registration in the profession as a whole was 38 years.
— Four registrants were removed from the Register following the audit. One failed to submit a CPD profile and three failed to submit further information requested by the assessors. None of them appealed against any of those decisions.
The following graphs illustrate the age range and gender split of physiotherapists as a profession as a whole and those selected for audit.
Audit results

35Continuing professional development audit report
Graph 26 – Age and gender of physiotherapists across the whole profession
0
1,000
2,000
3,000
4,000
5,000
6,000
7,000
8,000
Num
ber
Age range
Female Male
20–2
425
–29
30–3
435
–39
40–4
445
–49
50–5
455
–59
60–6
465
–69
70–7
4
75+
Graph 27 – Age and gender of physiotherapists selected for CPD
0
50
100
150
200
250
Num
ber
Age range
Female Male
20–2
425
–29
30–3
435
–39
40–4
445
–49
50–5
455
–59
60–6
465
–69
70–7
4
75+
Deferrals
There were 141 successful deferral requests.
Table 26 – Reasons for deferral – physiotherapists
Reason for deferral Number
Maternity leave 69
Health 26
Family health 15
Employment situation 7
Domestic situation 5
Bereavement 7
Career break / travel 6
Academic study 5
Adoption leave 1
Comparison with previous audit
This was the third CPD audit for physiotherapists. Their first audit took place in February 2010. The following table compares the results from the three audits.
Audit results
36 Continuing professional development audit report
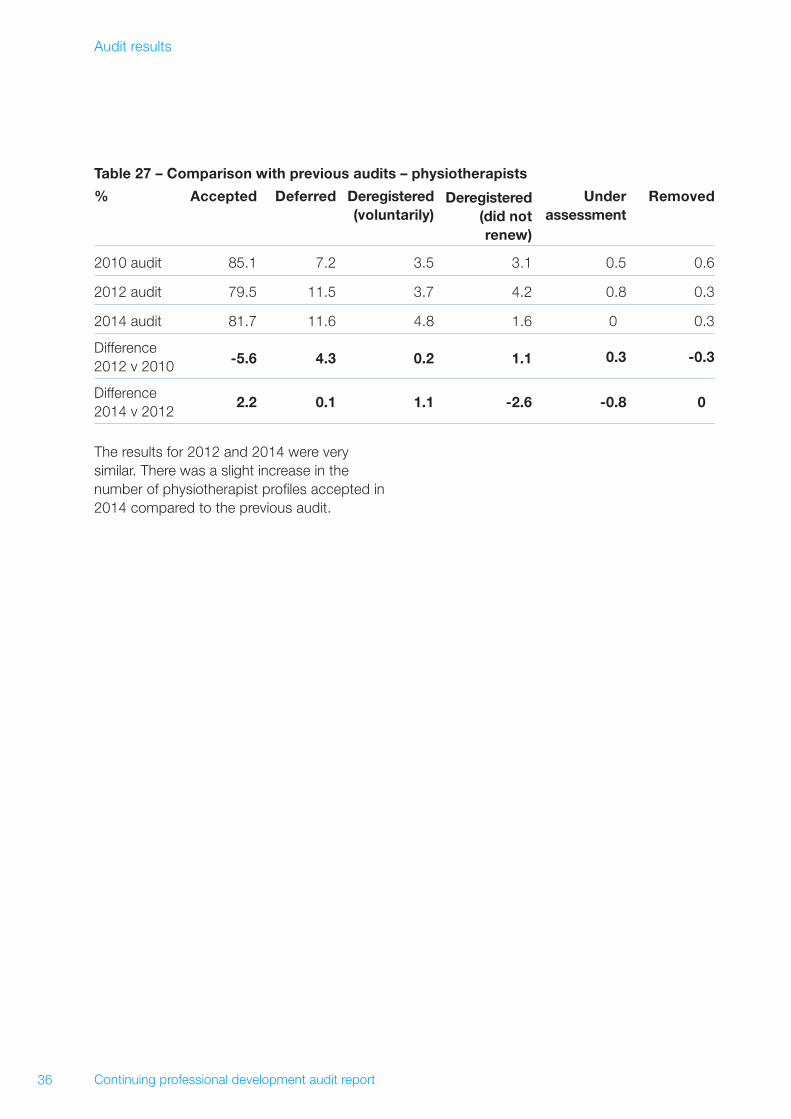
The results for 2012 and 2014 were very similar. There was a slight increase in the number of physiotherapist profiles accepted in 2014 compared to the previous audit.
Table 27 – Comparison with previous audits – physiotherapists
%
Accepted
Deferred
Deregistered (voluntarily)
Deregistered (did not renew)
Under assessment
Removed
2010 audit 85.1 7.2 3.5 3.1 0.5 0.6
2012 audit 79.5 11.5 3.7 4.2 0.8 0.3
2014 audit 81.7 11.6 4.8 1.6 0 0.3
Difference 2012 v 2010 -5.6 4.3 0.2 1.1 0.3 -0.3
Difference 2014 v 2012
2.2 0.1 1.1 -2.6 -0.8 0
Audit results

37Continuing professional development audit report
Arts therapistsWe selected 2.5 per cent of arts therapists for audit in March 2014.
Table 28 – Outcome of arts therapist CPD audit
Outcome Number of registrants
% of registrants
Accepted 60 69.8
Deferred 10 11.6
Deregistered (voluntarily)
11 12.8
Deregistered (did not renew)
4 4.6
Under assessment 0 0
Removed 1 1.2
Total 86 100
Graph 28 – Outcome of arts therapist CPD audit
Deregistered (did not renew)(4.6%)
Accepted(69.8%)
Deferred(11.6%)
Removed(1.2%)
Deregistered (voluntarily)(12.8%)
— The average age of those selected for audit was 50 years, compared to an average age of 46 for the profession as a whole.
— 80 per cent of those selected were female and 20 per cent were male. In the profession as a whole, 85 per cent are female and 15 per cent are male.
— Approximately one in six registrants selected for audit were either voluntarily removed from the Register or did not renew their registration. This compares with approximately one in ten registrants across the profession as a whole.
— The average age of arts therapists selected for audit who requested voluntary deregistration was 59 years. The average age of arts therapists who requested voluntary deregistration in the profession as a whole was 53 years.
— The average age of arts therapists selected for audit who did not renew their registration was 52 years. The average age of arts therapists who did not renew their registration in the profession as a whole was 46 years.
— One registrant was removed from the Register for failing to submit further information requested by the assessors despite several requests. The registrant did not appeal that decision.
The following graphs illustrate the age range and gender split of arts therapists as a profession as a whole and those selected for audit.
Audit results

38 Continuing professional development audit report
Graph 29 – Age and gender of arts therapists across the whole profession
0
100
200
300
400
500
Num
ber
Age range
Female Male
20–2
425
–29
30–3
435
–39
40–4
445
–49
50–5
455
–59
60–6
465
–69
70–7
4
75+
Graph 30 – Age and gender of arts therapists selected for CPD
0
3
6
9
12
15
Num
ber
Age range
Female Male
20–2
425
–29
30–3
435
–39
40–4
445
–49
50–5
455
–59
60–6
465
–69
70–7
4
75+
Deferrals
There were ten successful deferral requests.
Table 29 – Reasons for deferral – arts therapists
Reason for deferral Number
Maternity leave 4
Family health 3
Health 1
Employment situation 1
Academic study 1
Comparison with previous audit
This was the third CPD audit for arts therapists. Their first audit took place in March 2010. The following table compares the results from the three audits.
Audit results

39Continuing professional development audit report
The number of accepted profiles has slightly decreased in the 2014 audit. The number of successful deferral requests decreased. The number of voluntary deregistration requests and arts therapists who did not renew their registration increased slightly in 2014.
Table 30 – Comparison with previous audits – arts therapists%
Accepted
Deferred
Deregistered (voluntarily)
Deregistered (did not renew)
Under assessment
Removed
2010 audit 77.1 14.3 2.9 5.7 0 0
2012 audit 74.3 12.8 9 2.6 0 1.3
2014 audit 69.8 11.6 12.8 4.6 0 1.2
Difference 2012 v 2010 -2.8 -1.5 6.1 -3.1 0 1.3
Difference 2014 v 2012
-4.5 -1.2 3.8 2 0 -0.1
Audit results

40 Continuing professional development audit report
DietitiansWe selected 2.5 per cent of dietitians for audit in April 2012.
Table 31 – Outcome of dietitian CPD audit
Outcome Number of registrants
% of registrants
Accepted 167 79.9
Deferred 25 12
Deregistered (voluntarily)
9 4.3
Deregistered (did not renew)
7 3.3
Under assessment 0 0
Removed 1 0.5
Total 209 100
Graph 31 – Outcome of dietitian CPD audit
Accepted(79.9%)Deferred
(12%)
Removed(0.5%)
Deregistered (voluntarily)(4.3%)
Deregistered (did not renew)(3.3%)
— The average age of those selected for audit was 42 years, compared to an average age of 39 for the profession as a whole.
— 97 per cent of those selected were female and three per cent were male. In the profession as a whole, 95 per cent are female and five per cent are male.
— Approximately one in thirteen registrants selected for audit were either voluntarily removed from the Register or did not renew their registration. This compares with approximately one in eighteen registrants across the profession as a whole.
— The average age of dietitians selected for audit who requested voluntary deregistration was 54 years. The average age of dietitians who requested voluntary deregistration in the profession as a whole was 49 years.
— The average age of dietitians selected for audit who did not renew their registration was 53 years. The average age of dietitians who did not renew their registration in the profession as a whole was 36 years.
The following graphs illustrate the age range and gender split of dietitians as a profession as a whole and those selected for audit.
Audit results

41Continuing professional development audit report
Graph 32 – Age and gender of dietitians across the whole profession
0
500
1,000
1,500
Num
ber
Age range
Female Male
20–2
425
–29
30–3
435
–39
40–4
445
–49
50–5
455
–59
60–6
465
–69
70–7
4
75+
Graph 33 – Age and gender of dietitians selected for CPD
0
10
20
30
40
50
Num
ber
Age range
Female Male
20–2
425
–29
30–3
435
–39
40–4
445
–49
50–5
455
–59
60–6
465
–69
70–7
4
75+
Deferrals
There were 25 successful deferral requests.
Table 32 – Reasons for deferral – dietitians
Reason for deferral Number
Maternity leave 12
Family health 5
Health 2
Employment situation 2
Domestic situation 2
Bereavement 2
Comparison with previous audit
This was the third CPD audit for dietitians. Their first audit took place in April 2010. The following table compares the results from the three audits.
Audit results

42 Continuing professional development audit report
This shows that slightly more dietitian profiles were accepted in the 2014 audit. The number of voluntary deregistration requests decreased in 2014. The number of successful deferral requests slightly decreased.
Table 33 – Comparison with previous audits – dietitians
%
Accepted
Deferred
Deregistered (voluntarily)
Deregistered (did not renew)
Under assessment
Removed
2010 audit 75.4 12.3 7.3 3.9 1.1 0
2012 audit 79.1 12.2 5.1 2.1 1.5 0
2014 audit 79.9 12 4.3 3.3 0 0.5
Difference 2012 v 2010 3.7 -0.1 -2.2 -1.8 0.4 0
Difference 2014 v 2012
0.8 -0.2 -0.8 1.2 -1.5 0.5
Audit results

43Continuing professional development audit report
Chiropodists / podiatristsWe selected 2.5 per cent of chiropodists / podiatrists for audit in May 2014.
Table 34 – Outcome of chiropodist / podiatrist CPD audit
Outcome Number of registrants
% of registrants
Accepted 250 76.6
Deferred 44 13.5
Deregistered (voluntarily)
22 6.8
Deregistered (did not renew)
9 2.8
Under assessment 0 0
Removed 1 0.3
Total 326 100
Graph 34 – Outcome of chiropodist / podiatrist CPD audit
Accepted(76.6%)Deferred
(13.5%)
Removed(0.3%)
Deregistered (voluntarily)(6.8%)
Deregistered (did not renew)(2.8%)
— The average age of those selected for audit was 51 years, compared to an average age of 48 for the profession as a whole.
— The gender of those selected for audit reflected the gender split of the profession as a whole; 77 per cent of those selected were female and 23 per cent were male.
— Approximately one in eleven registrants selected for audit were either voluntarily removed from the Register or did not renew their registration. This compares with approximately one in eighteen registrants across the profession as a whole.
— The average age of chiropodists / podiatrists selected for audit who requested voluntary deregistration was 59 years. The average age of chiropodists / podiatrists who requested voluntary deregistration in the profession as a whole was also 59 years.
— The average age of chiropodists / podiatrists selected for audit who did not renew their registration was 63 years. The average age of chiropodists / podiatrists who did not renew their registration in the profession as a whole was 47 years.
The following graphs illustrate the age range and gender split of chiropodists / podiatrists as a profession as a whole and those selected for audit.
Audit results

44 Continuing professional development audit report
Graph 35 – Age and gender of chiropodists / podiatrists across the whole profession
0
500
1,000
1,500
2,000
Num
ber
Age range
Female Male
20–2
425
–29
30–3
435
–39
40–4
445
–49
50–5
455
–59
60–6
465
–69
70–7
4
75+
Graph 36 – Age and gender of chiropodists / podiatrists selected for CPD
0
10
20
30
40
50
Num
ber
Age range
Female Male
20–2
425
–29
30–3
435
–39
40–4
445
–49
50–5
455
–59
60–6
465
–69
70–7
4
75+
Deferrals
There were 44 successful deferral requests.
Table 35 – Reasons for deferral – chiropodists / podiatrists
Reason for deferral Number
Maternity leave 14
Health 13
Family health 6
Domestic situation 2
Bereavement 8
Employment situation 1
Comparison with previous audit
This was the fourth CPD audit for chiropodists / podiatrists. Their previous audits took place in May 2008, May 2010 and May 2012. The following table compares the results from the four audits.
Audit results

45Continuing professional development audit report
This shows the number of chiropodists / podiatrist profiles that are accepted has increased with each audit. The number of deferral requests has also increased with each audit. The number of chiropodists / podiatrists who did not renew has decreased.
Table 36 – Comparison with previous audits – chiropodists / podiatrists
%
Accepted
Deferred
Deregistered (voluntarily)
Deregistered (did not renew)
Under assessment
Removed
2008 audit 73.8 10.2 6.3 9.5 0 0.2
2010 audit 75.1 11.8 5.6 4.4 3.1 0
2012 audit 75.8 12.9 5.5 4.6 1.2 0
2014 audit 76.6 13.5 6.8 2.8 0 0.3
Difference 2010 v 2008
1.3 1.6 -0.7 -5.1 3.1 -0.2
Difference 2012 v 2010
0.7 1.1 -0.1 0.2 -1.9 0
Difference 2014 v 2012
0.8 0.6 1.3 -1.8 -1.2 0.3
Audit results

46 Continuing professional development audit report
Hearing aid dispensersWe selected 2.5 per cent of hearing aid dispensers for audit in May 2014.
Table 37 – Outcome of hearing aid dispenser CPD audit
Outcome Number of registrants
% of registrants
Accepted 50 98
Deferred 1 2
Deregistered (voluntarily)
0 0
Deregistered (did not renew)
0 0
Under assessment 0 0
Removed 0 0
Total 51 100
Graph 37 – Outcome of hearing aid dispenser CPD audit
Accepted(98%)
Deferred(2%)
— The average age of those selected for audit was 52 years, compared to an average age of 44 for the profession as a whole.
— 35 per cent of those selected were female and 65 per cent were male. In the profession as a whole, 48 per cent are female and 52 per cent are male.
— No hearing aid dispensers who were selected for CPD were voluntarily removed from the Register or did not renew their registration. This compares with approximately one in fifteen registrants across the profession as a whole who were voluntarily removed or did not renew their registration.
The following graphs illustrate the age range and gender split of hearing aid dispensers as a profession as a whole and those selected for audit.
Audit results

47Continuing professional development audit report
Graph 38 – Age and gender of hearing aid dispensers across the whole profession
0
50
100
150
200
250
Num
ber
Age range
Female Male
20–2
425
–29
30–3
435
–39
40–4
445
–49
50–5
455
–59
60–6
465
–69
70–7
4
75+
Graph 39 – Age and gender of hearing aid dispensers selected for CPD
0
2
4
6
8
Num
ber
Age range
Female Male
20–2
425
–29
30–3
435
–39
40–4
445
–49
50–5
455
–59
60–6
465
–69
70–7
4
75+
Deferrals
There was one successful deferral request.
Table 38 – Reasons for deferral – hearing aid dispensers
Reason for deferral Number
Health 1
Comparison with previous audit
This was the second CPD audit for hearing aid dispensers. The first audit took place in May 2012. The following table compares the results from the two audits.
Audit results

48 Continuing professional development audit report
Audit results
This shows the number of hearing aid dispenser profiles that were accepted has increased compared to the first audit. The number of deferral requests has also increased. No registrants voluntarily deregistered or did not renew.
Table 39 – Comparison with previous audits – hearing aid dispensers
%
Accepted
Deferred
Deregistered (voluntarily)
Deregistered (did not renew)
Under assessment
Removed
2012 audit 86 0 4.7 7 0 2.3
2014 audit 98 2 0 0 0 0
Difference 12 2 -4.7 -7 0 -2.3

49Continuing professional development audit report
Operating department practitionersWe selected 2.5 per cent of operating department practitioners for audit in September 2014.
Table 40 – Outcome of operating department practitioner CPD audit
Outcome Number of registrants
% of registrants
Accepted 242 80.7
Deferred 32 10.7
Deregistered (voluntarily)
11 3.7
Deregistered (did not renew)
13 4.3
Under assessment 0 0
Removed 2 0.6
Total 300 100
Graph 40 – Outcome of operating department practitioner CPD audit
Accepted(80.7%)Deferred
(10.7%)
Removed(0.6%)
Deregistered(voluntarily)(3.7%)
Deregistered (did not renew)(4.3%)
— The average age of those selected for audit was 46 years, compared to an average age of 43 for the profession as a whole.
— The gender of those selected for audit closely reflected the gender split of the profession as a whole; 62 per cent of those selected were female and 38 per cent were male.
— Approximately one in thirteen registrants selected for audit were either voluntarily removed from the Register or did not renew their registration. This compares with approximately one in 26 registrants across the profession as a whole.
— The average age of operating department practitioners selected for audit who requested voluntary deregistration was 50 years. The average age of operating department practitioners who requested voluntary deregistration in the profession as a whole was 54 years.
— The average age of operating department practitioners selected for audit who did not renew their registration was 54 years. The average age of operating department practitioners who did not renew their registration in the profession as a whole was 47 years.
— One registrant was removed from the Register for failing to submit their CPD profile despite several requests. The registrant did not appeal that decision.
— Another registrant who for the purpose of these statistics appears as removed, was in fact struck off the Register by a Panel of the Conduct and Competence Committee. The registrant submitted a plagiarised CPD profile and, by reason of that misconduct, the Panel found that the registrant’s fitness to practise was impaired.
The following graphs illustrate the age range and gender split of operating department practitioners as a profession as a whole and those selected for audit.
Audit results

50 Continuing professional development audit report
Graph 41 – Age and gender of operating department practitioners across the whole profession
0
250
500
750
1000
1250
Num
ber
Age range
Female Male
20–2
425
–29
30–3
435
–39
40–4
445
–49
50–5
455
–59
60–6
465
–69
70–7
4
75+
Graph 42 – Age and gender of operating department practitioners selected for CPD
0
5
10
15
20
25
30
35
40
Num
ber
Age range
Female Male
20–2
425
–29
30–3
435
–39
40–4
445
–49
50–5
455
–59
60–6
465
–69
70–7
4
75+
Deferrals
There were 32 successful deferral requests.
Table 41 – Reasons for deferral – operating department practitioners
Reason for deferral Number
Maternity leave 7
Health 15
Family health 3
Carer break / travel 3
Domestic situation 1
Bereavement 3
Comparison with previous audit
This was the fourth CPD audit for operating department practitioners. Their previous audits took place in September 2008, September 2010. September 2012 and September 2014. The following table compares the results from the four audits.
Audit results

51Continuing professional development audit report
This shows the number of operating department practitioner profiles that were accepted has increased between 2012 and 2014. There was a decrease in the number of successful deferral requests.
Table 42 – Comparison with previous audits - operating department practitioners
% Accepted Deferred Deregistered (voluntarily)
Deregistered (did not renew)
Under assessment
Removed
2008 audit 78.9 10.4 2.6 3.6 2.8 1.7
2010 audit 71.3 10.9 2.7 5 9.3 0.8
2012 audit 78.4 13 2.2 3.2 3.2 0
2014 audit 80.7 10.7 3.7 4.3 0 0.6
Difference 2010 v 2008
-7.6 0.5 0.1 1.4 6.5 -0.9
Difference 2012 v 2010
7.1 2.1 -0.5 -1.8 -6.1 -0.8
Difference 2014 v 2012
2.3 -2.3 1.5 1.1 -3.2 0.6
Audit results

52 Continuing professional development audit report
Social workers in England We selected 2.5 per cent of social workers for audit in September 2014.
Table 43 – Outcome of social worker CPD audit
Outcome Number of registrants
% of registrants
Accepted 1,789 78.6
Deferred 234 10.3
Deregistered (voluntarily)
130 5.7
Deregistered (did not renew)
104 4.6
Under assessment 13 0.5
Removed 6 0.3
Total 2,276 100
Graph 43 – Outcome of social worker CPD audit
Accepted(78.6%)
Deferred(10.3%)
Deregistered (voluntarily)(5.7%)
Deregistered (did not renew)(4.6%)
Under assessment(0.5%) Removed
(0.3%)
— The average age of those selected for audit was 49 years, compared to an average age of 46 for the profession as a whole.
— 80 per cent of those selected were female and 20 per cent were male. In the profession as a whole, 81 per cent are female and 19 per cent are male.
— Approximately one in ten registrants selected for audit were either voluntarily removed from the Register or did not renew their registration. This compares with approximately one in twelve registrants across the profession as a whole.
— The average age of social workers selected for audit who requested voluntary deregistration was 58 years. The average age of social workers who requested voluntary deregistration in the profession as a whole was also 58 years.
— The average age of social workers selected for audit who did not renew their registration was 53 years. The average age of social workers who did not renew their registration in the profession as a whole was 52 years.
— Six registrants were removed from the Register. Five of those registrants failed to submit a complete CPD profile and one failed to submit further information requested by the assessors, despite several requests. None of those registrants appealed any of those decisions.
The following graphs illustrate the age range and gender split of social workers as a profession as a whole and those selected for audit.
Audit results

53Continuing professional development audit report
Graph 44 – Age and gender of social workers across the whole profession
0
2,000
4,000
6,000
8,000
10,000
12,000
Num
ber
Age range
Female Male
20–2
425
–29
30–3
435
–39
40–4
445
–49
50–5
455
–59
60–6
465
–69
70–7
4
75+
Graph 45 – Age and gender of social workers selected for CPD
0
50
100
150
200
250
300
Num
ber
Age range
Female Male
20–2
425
–29
30–3
435
–39
40–4
445
–49
50–5
455
–59
60–6
465
–69
70–7
4
75+
Deferrals
There were 234 successful deferral requests.
Table 44 – Reasons for deferral – social workers
Reason for deferral Number
Maternity leave 56
Health 94
Family health 28
Adoption leave 1
Employment situation 8
Career break / travel 8
Domestic situation 10
Bereavement 29
Comparisons with previous audits
This was the first CPD audit for this profession.
Audit results

54 Continuing professional development audit report
Practitioner psychologistsWe selected 2.5 per cent of practitioner psychologists for audit in March 2015.
Table 45 – Outcome of practitioner psychologist CPD audit
Outcome Number of registrants
% of registrants
Accepted 436 83
Deferred 53 10.1
Deregistered (voluntarily)
22 4.2
Deregistered (did not renew)
12 2.3
Under assessment 1 0.2
Removed 1 0.2
Total 525 100
Graph 46 – Outcome of practitioner psychologist CPD audit
Deferred(10.1%)
Accepted(83%)
Deregistered (voluntarily)(4.2%)
Deregistered (did not renew)(2.3%)
Under assessment(0.2%) Removed
(0.2%)
— The average age of those selected for audit was 47 years, compared to an average age of 45 for the profession as a whole.
— 83 per cent of those selected were female and 17 per cent were male. In the profession as a whole, 80 per cent are female and 20 per cent are male.
— Approximately one in fifteen registrants selected for audit were either voluntarily removed from the Register or did not renew their registration. This compares with approximately one in twenty registrants across the profession as a whole.
— The average age of practitioner psychologists selected for audit who requested voluntary deregistration was 59 years. The average age of practitioner psychologists who requested voluntary deregistration in the profession as a whole was also 59 years.
— The average age of practitioner psychologists selected for audit who did not renew their registration was 59 years. The average age of practitioner psychologists who did not renew their registration in the profession as a whole was 54 years.
— One registrant was removed from the Register for failing to submit a complete CPD profile despite several requests. The registrant did not appeal the decision.
The following graphs illustrate the age range and gender split of practitioner psychologists as a profession as a whole and those selected for audit.
Audit results

55Continuing professional development audit report
Graph 47 – Age and gender of practitioner psychologists across the whole profession
0
500
1,000
1,500
2,000
2,500
3,000
3,500
Num
ber
Age range
Female Male
20–2
425
–29
30–3
435
–39
40–4
445
–49
50–5
455
–59
60–6
465
–69
70–7
4
75+
Graph 48 – Age and gender of practitioner psychologists selected for CPD
0
20
40
60
80
100
120
Num
ber
Age range
Female Male
20–2
425
–29
30–3
435
–39
40–4
445
–49
50–5
455
–59
60–6
465
–69
70–7
4
75+
Deferrals
There were 53 successful deferral requests.
Table 46 – Reasons for deferral – practitioner psychologists
Reason for deferral Number
Maternity leave 27
Bereavement 1
Career break / travel 4
Health 13
Family health 5
Employment situation 2
Domestic situation 1
Comparisons with previous audits
This was the second CPD audit for practitioner psychologists. The first audit took place in 1 March 2013. The following table compares the results from the two audits.
Audit results

56 Continuing professional development audit report
This shows the number of practitioner psychologist profiles that were accepted were very similar between the two audits. There was an increase in the number of successful deferral requests.
Table 47 – Comparison with previous audits - practitioner psychologists
% Accepted Deferred Deregistered (voluntarily)
Deregistered (did not renew)
Under assessment
Removed
2013 audit 83.8 8.1 3.7 1.5 2.9 0
2015 audit 83 10.1 4.2 2.3 0.2 0.2
Difference -0.8 2 0.5 0.8 -2.7 0.2
Audit results

57Continuing professional development audit report
Tab
le 4
8 -
Sum
mar
y o
f au
dit
res
ults
(per
cent
ages
)
Pro
fess
ion
Acc
epte
dD
efer
red
Der
egis
tere
d
(vo
lunt
arily
)D
ereg
iste
red
(d
id n
ot
rene
w)
Und
er
asse
ssm
ent
Rem
ove
dTo
tal
Art
s th
erap
ists
69.8
11.6
12.8
4.6
0.0
1.2
100
Bio
med
ical
sci
entis
ts82
.57.
85.
13.
90.
00.
710
0
Chi
ropo
dist
s /
podi
atris
ts76
.613
.56.
82.
80.
00.
310
0
Clin
ical
sci
entis
ts84
.66.
56.
52.
40.
00.
010
0
Die
titia
ns79
.912
.04.
33.
30.
00.
510
0
Hea
ring
aid
disp
ense
rs98
.02.
00.
00.
00.
00.
010
0
Occ
upat
iona
l the
rapi
sts
76.6
15.8
4.2
3.3
0.0
0.1
100
Ope
ratin
g de
part
men
t pr
actit
ione
rs80
.710
.73.
74.
30.
00.
610
0
Ort
hopt
ists
84.8
0.0
6.1
9.1
0.0
0.0
100
Par
amed
ics
88.3
6.6
3.5
1.6
0.0
0.0
100
Phy
siot
hera
pist
s81
.711
.64.
81.
60.
00.
310
0
Pra
ctiti
oner
psy
chol
ogis
ts83
.010
.14.
22.
30.
20.
210
0
Pro
sthe
tists
/ o
rtho
tists
75.0
8.3
12.5
4.2
0.0
0.0
100
Rad
iogr
aphe
rs84
.79.
43.
42.
50.
00.
010
0
Soc
ial w
orke
rs78
.610
.35.
74.
60.
50.
310
0
Spe
ech
and
lang
uage
th
erap
ists
79.8
13.6
3.7
2.6
0.0
0.3
100
Audit results

58 Continuing professional development audit report
Tab
le 4
9 –
Sum
mar
y o
f d
efer
ral r
easo
ns (p
erce
ntag
es)
Pro
fess
ion
Mat
erni
ty
leav
eH
ealt
hFa
mily
he
alth
Do
mes
tic
situ
atio
nE
mp
loym
ent
situ
atio
nB
erea
vem
ent
Car
eer
bre
ak /
tr
avel
Aca
dem
ic
stud
yA
do
pti
on
Leav
e To
tal
Art
s th
erap
ists
4010
300
100
010
010
0
Bio
med
ical
sci
entis
ts41
29.5
9.1
06.
86.
84.
52.
30
100
Chi
ropo
dist
s /
po
diat
rists
31.9
29.6
13.6
4.5
2.3
18.1
00
010
0
Clin
ical
sci
entis
ts37
.525
012
.525
00
00
100
Die
titia
ns48
820
88
80
00
100
Hea
ring
aid
di
spen
sers
010
00
00
00
00
100
Occ
upat
iona
l th
erap
ists
48.1
26.7
7.4
3.1
4.4
5.2
3.7
0.7
0.7
100
Ope
ratin
g
depa
rtm
ent
prac
titio
ners
21.9
46.8
9.4
3.1
09.
49.
40
010
0
Ort
hopt
ists
00
00
00
00
00
Par
amed
ics
21.8
40.6
6.3
9.3
9.3
6.3
06.
30
100
Phy
siot
hera
pist
s49
18.4
10.6
3.6
55
4.3
3.4
0.7
100
Pra
ctiti
oner
ps
ycho
logi
sts
50.9
24.5
9.4
1.9
3.8
1.9
7.6
00
100
Pro
sthe
tists
/
orth
otis
ts0
500
050
00
00
100
Rad
iogr
aphe
rs45
.622
.114
.70
2.9
7.4
2.9
4.4
010
0
Soc
ial w
orke
rs
23.5
40.2
124.
43.
512
.53.
50
0.4
100
Spe
ech
and
lang
uage
th
erap
ists
68.7
8.3
2.1
2.1
12.5
6.3
00
010
0
Audit results

59Continuing professional development audit report
Overall audit summary
This report looks at the outcomes of the continuing professional development (CPD) audits for all 16 professions regulated by us, which took place between 2013–15. This includes social workers in England who have been audited for the first time. Chiropodists / podiatrists and operating department practitioners have been audited for the fourth time. All other professions are now on their second or third audit.
In this section, we provide a summary of the outcomes of the audits across the 16 professions covered by this report, identifying possible trends and suggesting potential explanations for them.
In our previous three reports (covering 2008–9, 2009–10 and 2011–13 respectively) we made the following observations.
— The majority of registrants successfully completed their CPD audit, with most CPD profiles being accepted after their first assessment.
— Those who requested voluntary deregistration after being selected for audit were generally in the 50+ age group.
Those observations remain the case throughout the audits and we have again noticed an increase in the number of registrants whose profiles were accepted as submitted, without the need for them to submit further information to the assessors. Our assessors have also noted an improvement in the quality of the profiles being submitted, which suggests the guidance provided by us is helping registrants to complete their CPD profiles in a way that demonstrates they meet the CPD standards.
Further guidance is available on our website, which includes updated profile examples and several videos which explain the different stages of the CPD process. In addition to the CPD resources available online we also carried out two CPD webinars when social workers
first went through the audit process. We continue to work on ensuring all information communicated and correspondence is up to date. This includes a current review of our ‘How to complete your continuing professional development profile’ booklet which we send out to those registrants selected for CPD audit.
We have found that updating our guidance and information has continued to contribute to fewer registrants being asked to submit further information and helps registrants to understand our CPD standards. In this audit report you can see that the number of profiles still under assessment has decreased across most professions compared to previous audits.
In our first report we noticed that in each of the professions, the proportion of registrants selected for CPD audit who did not renew their registration or voluntarily deregistered was higher than for the profession as a whole. In contrast to this, our second report found no clear trend in the data between selection for CPD audit and the likelihood of a registrant not renewing or voluntarily deregistering. In the third report, twelve out of the fifteen professions covered had a higher proportion of registrants selected for CPD who did not renew or voluntarily deregistered compared to the profession as a whole. For two professions (speech and language therapists and hearing aid dispensers) the rate of non-renewal or voluntary deregistration is in line with the profession as a whole. Only one profession, practitioner psychologists, has a higher rate of non-renewal or voluntary deregistration across the profession as a whole as compared to those selected for audit.
In this, our fourth report, 14 out of the 16 professions covered have a higher proportion of registrants selected for CPD who did not renew or voluntarily deregistered compared to the profession as a whole. For one profession (speech and language therapists) the rate of non-renewal or voluntary deregistration is in line with the profession as a whole. The

60 Continuing professional development audit report
Overall audit summary
remaining profession (hearing aid dispensers) had no registrants selected for CPD who did not renew or who voluntarily deregistered.
Out of the fifteen professions included in this report that have been through more than one audit, nine have seen an increase in the number of profiles accepted compared to their previous audit. The six professions that saw a decrease in the number of profiles accepted, all saw an increase in either the number of deferrals or number of registrants who voluntarily deregistered.
We have again included information in this report about the age profile of those in each profession requesting voluntary deregistration. This shows that the majority were in the over 50 age range, as was the case in our previous three reports. This trend seems to indicate that those registrants are retiring from their profession.
DeferralsThe rate of deferral varied across the professions. The average deferral rate across all 16 professions was 9.4 per cent, which is slightly less than the previous audit.
No orthoptists selected for audit requested deferral. The highest deferral rate was amongst occupational therapists (15.8%). In the previous reports speech and language therapists had the highest rate. The most common reasons for deferring were being, or having been, on maternity leave or health issues which meant the registrant was unable to complete their CPD profile.
Voluntary deregistration and non- renewal Voluntary deregistration rates varied across the professions. The overall average voluntary deregistration rate for those selected for audit was 5.5 per cent, which is an increase compared to the previous report which saw 4.7 per cent request voluntary deregistration. No hearing aid dispensers selected for audit requested voluntary deregistration. The highest
rate was for arts therapists (12.8%) although they are one of the smaller professions on our Register, so the numbers involved are very small.
A lower rate of 3.3 per cent of those selected for audit across all professions did not renew their registration. This is a slight decrease compared to the previous report, which saw 3.6 per cent of those selected not renewing their registration. No hearing aid dispensers selected for audit failed to renew their registration. The highest rate was for orthoptists (9.1%). Again, this is also one of the smaller professions on our Register so the numbers involved are very small.
Under assessmentThere are a very small number of registrants whose profiles remain ‘under assessment’ and only from two professions (social workers and psychologists). It is worth mentioning that these two professions went through the audit most recently compared to the other professions.
There is a number of different reasons why some registrants are still listed as being ‘under assessment’. This includes a small number of registrants who did not renew their registration before the renewal deadline but who have subsequently been readmitted to the Register. If a registrant who has been selected for CPD audit chooses to deregister or not renew their registration but then applies for readmission within two years, they will be included in the next CPD audit.
It also includes registrants who have become the subject of a fitness to practise investigation after they are selected for CPD audit. In those cases, the CPD process is suspended until any fitness to practise investigation or proceedings have concluded.
RemovalsOnly 0.3 per cent (22 registrants) of those selected for audit were removed from the Register. This is a slight increase compared

61Continuing professional development audit report
Overall audit summary
to the previous report, which saw 0.2% of those selected for audit being removed from the Register.
Those decisions were made because they had failed to submit either a CPD profile or further information in support of their profile. In each case we will have given them several opportunities to comply before the decision was taken to remove them from the Register. No registrants were removed because their profile was assessed as not meeting the standards.
AppealsThree appeals were made during the period covered by this report. In all cases the registrants had failed to submit their CPD profile (or the requested further information) to us in time. In one case, the registrant was allowed to defer their audit as there were extenuating circumstances that came to light during the appeal hearing. One appeal was allowed but subject to the registrant submitting a completed CPD profile. The third appeal has not yet concluded.

62 Continuing professional development audit report
Conclusion
Our initial analysis is that there are no significant differences between the outcomes in different professions. Approximately 75–85 per cent of CPD profiles submitted for audit were accepted and there was what appears to be a random fluctuation in the numbers of registrants in each profession deferring their audit, not renewing their registration or voluntarily deregistering. Most professions have seen an improvement in the percentage of CPD profiles that were accepted compared to previous audits.
The majority of profiles continue to demonstrate links between ongoing learning and benefits to practice and service users. The quality of the CPD profiles we have seen so far is high and continues to improve with each round of audits. This shows the commitment that registrants have to maintaining their CPD portfolios through a broad range of activities.
We hope that you have found this report informative. We are committed to implementing a process for CPD that is valuable and fair to registrants. Further research regarding our CPD standards will continue over the next twelve months which will further inform our understanding of this process.

63Continuing professional development audit report
List of tables and graphs
TablesTable 1 – Summary of overall results 9
Table 2 – Outcome of paramedic CPD audit 10
Table 3 – Reasons for deferral - paramedics 11
Table 4 – Comparison with previous audits – paramedics 12
Table 5 – Outcome of orthoptist CPD audit 13
Table 6 – Comparison with previous audits – orthoptists 15
Table 7 – Outcome of speech and language therapist CPD audit 16
Table 8 – Reasons for deferral – speech and language therapists 17
Table 9 – Comparison with previous audits – speech and language therapists 18
Table 10 – Outcome of prosthetist / orthotist CPD audit 19
Table 11 – Reasons for deferral – prosthetists / orthotists 20
Table 12 – Comparison with previous audits – prosthetists / orthotists 21
Table 13 – Outcome of clinical scientist CPD audit 22
Table 14 – Reasons for deferral – clinical scientists 23
Table 15 – Comparison with previous audits – clinical scientists 24
Table 16 – Outcome of occupational therapist CPD audit 25
Table 17 – Reasons for deferral – occupational therapists 26
Table 18 – Comparison with previous audits – occupational therapists 27
Table 19 – Outcome of biomedical scientist CPD audit 28
Table 20 – Reasons for deferral – biomedical scientists 29
Table 21 – Comparison with previous audits – biomedical scientists 30
Table 22 – Outcome of radiographer CPD audit 31
Table 23 – Reasons for deferral – radiographers 32
Table 24 – Comparison with previous audits – radiographers 33
Table 25 – Outcome of physiotherapist CPD audit 34
Table 26 – Reasons for deferral – physiotherapists 35
Table 27 – Comparison with previous audits – physiotherapists 36
Table 28 – Outcome of arts therapist CPD audit 37
Table 29 – Reasons for deferral – arts therapists 38

64 Continuing professional development audit report
List of tables and graphs
Table 30 – Comparison with previous audits – arts therapists 39
Table 31 – Outcome of dietitian CPD audit 40
Table 32 – Reasons for deferral – dietitians 41
Table 33 – Comparison with previous audits – dietitians 42
Table 34 – Outcome of chiropodist / podiatrist CPD audit 43
Table 35 – Reasons for deferral – chiropodists / podiatrists 44
Table 36 – Comparison with previous audits – chiropodists / podiatrists 45
Table 37 – Outcome of hearing aid dispenser CPD audit 46
Table 38 – Reasons for deferral – hearing aid dispenser 47
Table 39 – Comparison with previous audits – hearing aid dispenser 48
Table 40 – Outcome of operating department practitioner CPD audit 49
Table 41 – Reasons for deferral – operating department practitioners 50
Table 42 – Comparison with previous audits – operating department practitioners 51
Table 43 – Outcome of social worker CPD audit 52
Table 44 – Reasons for deferral – social workers 53
Table 45 – Outcome of practitioner psychologist CPD audit 54
Table 46 – Reasons for deferral – practitioner psychologists 55
Table 47 – Comparison with previous audits – practitioner psychologists 56
Table 48 – Overall summary – audit results (percentages) 57
Table 49 – Overall summary – reasons for deferral (percentages) 58

65Continuing professional development audit report
List of tables and graphs
GraphsGraph 1 – Outcome of paramedic CPD audit 10
Graph 2 – Age and gender of paramedics across the whole profession 11
Graph 3 – Age and gender of paramedics selected for CPD 11
Graph 4 – Outcome of orthoptist CPD audit 13
Graph 5 – Age and gender of orthoptists across the whole profession 14
Graph 6 – Age and gender of orthoptists selected for CPD 14
Graph 7 – Outcome of speech and language therapist CPD audit 16
Graph 8 – Age and gender of speech and language therapists across the whole profession 17
Graph 9 – Age and gender of speech and language therapists selected for CPD 17
Graph 10 – Outcome of prosthetist / orthotist CPD audit 19
Graph 11 – Age and gender of prosthetists / orthotists across the whole profession 20
Graph 12 – Age and gender of prosthetists / orthotists selected for CPD 20
Graph 13 – Outcome of clinical scientist CPD audit 22
Graph 14 – Age and gender of clinical scientists across the whole profession 23
Graph 15 – Age and gender of clinical scientists selected for CPD 23
Graph 16 – Outcome of occupational therapist CPD audit 25
Graph 17 – Age and gender of occupational therapists across the whole profession 26
Graph 18 – Age and gender of occupational therapists selected for CPD 26
Graph 19 – Outcome of biomedical scientist CPD audit 28
Graph 20 – Age and gender of biomedical scientists across the whole profession 29
Graph 21 – Age and gender of biomedical scientists selected for CPD 29
Graph 22 – Outcome of radiographer CPD audit 31
Graph 23 – Age and gender of radiographers across the whole profession 32
Graph 24 – Age and gender of radiographers selected for CPD 32
Graph 25 – Outcome of physiotherapist CPD audit 34
Graph 26 – Age and gender of physiotherapists across the whole profession 35
Graph 27 – Age and gender of physiotherapists selected for CPD 35
Graph 28 – Outcome of arts therapist CPD audit 37
Graph 29 – Age and gender of arts therapists across the whole profession 38

66 Continuing professional development audit report
List of tables and graphs
Graph 30 – Age and gender of arts therapists selected for CPD 38
Graph 31 – Outcome of dietitian CPD audit 40
Graph 32 – Age and gender of dietitians across the whole profession 41
Graph 33 – Age and gender of dietitians selected for CPD 41
Graph 34 – Outcome of chiropodist / podiatrist CPD audit 43
Graph 35 – Age and gender of chiropodists / podiatrists across the whole profession 44
Graph 36 – Age and gender of chiropodists / podiatrists selected for CPD 44
Graph 37 – Outcome of hearing aid dispenser CPD audit 46
Graph 38 – Age and gender of hearing aid dispensers across the whole profession 47
Graph 39 – Age and gender of hearing aid dispensers selected for CPD 47
Graph 40 – Outcome of operating department practitioner CPD audit 49
Graph 41 – Age and gender of operating department practitioners across the whole profession 50
Graph 42 – Age and gender of operating department practitioners selected for CPD 50
Graph 43 – Outcome of social worker CPD audit 52
Graph 44 – Age and gender of social workers across the whole profession 53
Graph 45 – Age and gender of social workers selected for CPD 53
Graph 46 – Outcome of practitioner psychologist CPD audit 54
Graph 47 – Age and gender of practitioner psychologists across the whole profession 55
Graph 48 – Age and gender of practitioner psychologists selected for CPD 55

67Continuing professional development audit report
Further information
The following publications are available from our website at www.hcpc-uk.org/publications/brochures
— Your guide to our standards for continuing professional development
— Continuing professional development and your registration
— How to complete your continuing professional development profile
A number of audio-visual presentations relating to the CPD standards and audit process are available on our website at www.hcpc-uk.org/registrants/cpd
Sample profiles can be downloaded in the registrant section of our website at www.hcpc-uk.org/registrants/cpd/sampleprofiles
The following consultations are available from our website at www.hcpc-uk.org/publications/consultations
— Continuing Professional Development – Consultation paper
— Continuing Professional Development – Key decisions
— Consultation on an amendment to the Health Professions Council Standards for Continuing Professional Development
You can find more information on the CPD professional liaison group (PLG) on our website at www.hcpc-uk.org/aboutus/professionalliaisongroups/cpd
The Health and Social Work Professions Order 2001 is available on our website at www.hcpc-uk.org/aboutus/legislation/orders

Park House184 Kennington Park RoadLondon SE11 4BU
tel +44 (0)300 500 6184fax +44 (0)20 7820 9684www.hcpc-uk.org
To request this document in Welsh or an alternative format, email [email protected]
© Health and Care Professions Council 2016Publication code: CPDreport16 (printed September 2016)This publication is produced using trees from sustainable forests and recycled fibre.