Continuing Collaboration Between IT Operations + Research · Continuing Collaboration Between IT...
33
Continuing Collaboration Between IT Operations + Research The Impact of Student Achievement Predictions to Operational Prediction…and back again Matt Bernacki | College of Education Faculty, University of Nevada, Las Vegas Cyndi Backstrom | IT Operations, University of Nevada, Las Vegas September 25-28, 2017 | Washington, DC
Transcript of Continuing Collaboration Between IT Operations + Research · Continuing Collaboration Between IT...
Continuing Collaboration Between IT Operations + ResearchThe Impact of Student Achievement Predictions to Operational Prediction…and back again
Matt Bernacki | College of Education Faculty, University of Nevada, Las VegasCyndi Backstrom | IT Operations, University of Nevada, Las Vegas
September 25-28, 2017 | Washington, DC

During the course of this presentation, we may make forward-looking statements regarding future events or the expected performance of the company. We caution you that such statements reflect our current expectations and estimates based on factors currently known to us and that actual events or results could differ materially. For important factors that may cause actual results to differ from those contained in our forward-looking statements, please review our filings with the SEC.
The forward-looking statements made in this presentation are being made as of the time and date of its live presentation. If reviewed after its live presentation, this presentation may not contain current or accurate information. We do not assume any obligation to update any forward looking statements we may make. In addition, any information about our roadmap outlines our general product direction and is subject to change at any time without notice. It is for informational purposes only and shall not be incorporated into any contract or other commitment. Splunk undertakes no obligation either to develop the features or functionality described or to include any such feature or functionality in a future release.
Splunk, Splunk>, Listen to Your Data, The Engine for Machine Data, Splunk Cloud, Splunk Light and SPL are trademarks and registered trademarks of Splunk Inc. in the United States and other countries. All other brand names, product names, or trademarks belong to their respective owners. © 2017 Splunk Inc. All rights reserved.
Forward-Looking Statements
THIS SLIDE IS REQUIRED FOR ALL 3 PARTY PRESENTATIONS.
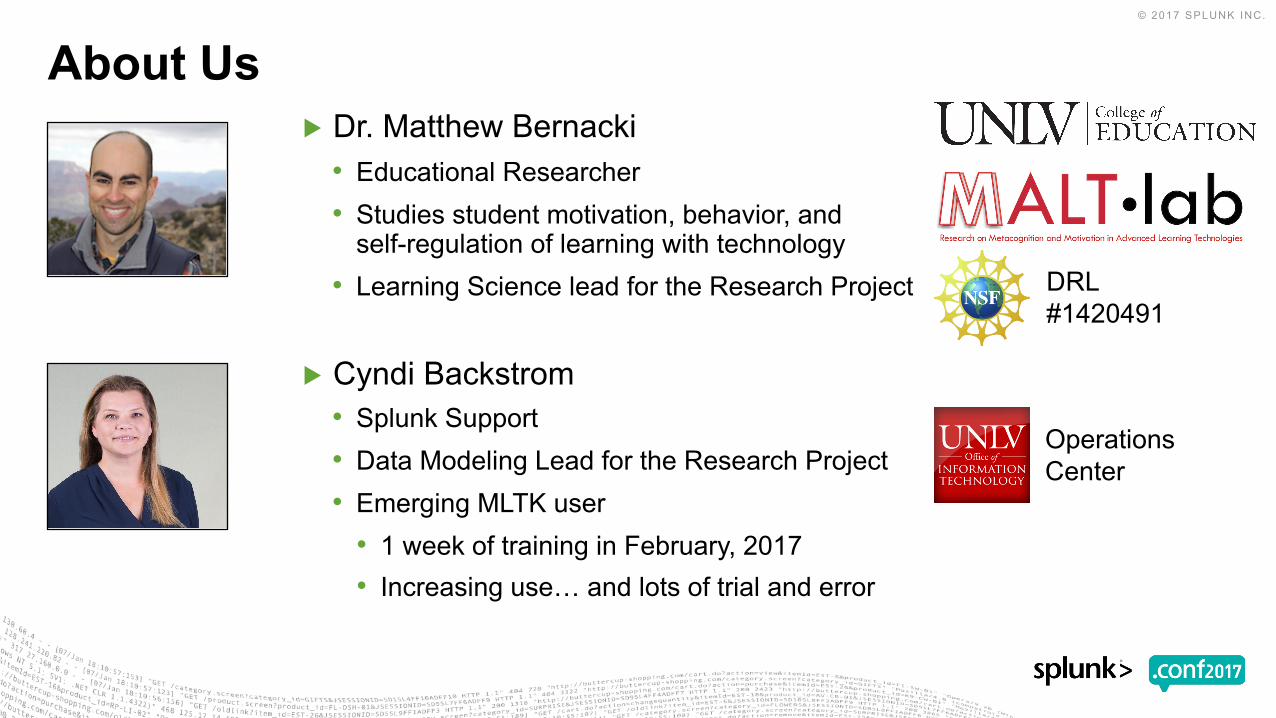
▶ Dr. Matthew Bernacki• Educational Researcher• Studies student motivation, behavior, and
self-regulation of learning with technology• Learning Science lead for the Research Project
▶ Cyndi Backstrom• Splunk Support• Data Modeling Lead for the Research Project• Emerging MLTK user
• 1 week of training in February, 2017• Increasing use… and lots of trial and error
About Us
DRL #1420491
OperationsCenter
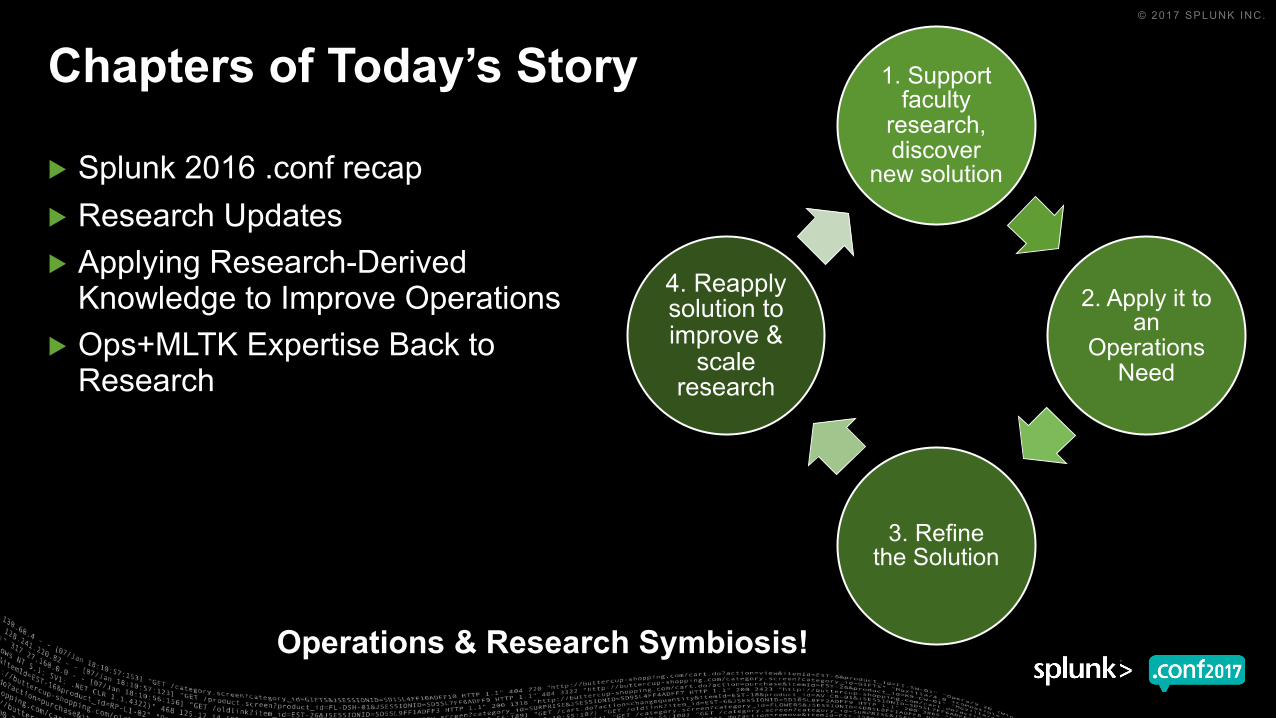
Chapters of Today’s Story
Operations & Research Symbiosis!
▶ Splunk 2016 .conf recap▶ Research Updates▶ Applying Research-Derived
Knowledge to Improve Operations▶ Ops+MLTK Expertise Back to
Research
1. Support faculty
research, discover
new solution
2. Apply it to an
Operations Need
3. Refine the Solution
4. Reapply solution to improve &
scale research
The .conf 2016 Recap

Research Context
~ 29,000 Students (24,000 Undergraduates)Minority Serving Institution (MSI)
Hispanic Serving Institution (HSI)Asian, Native American & Pacific Islander Serving Institution (ANAPISI)
Majority first generation & Title 1 HS graduation

▶ Project Goals1. Work with STEM instructors to digitize and host materials they use in large lecture courses2. Use Splunk to build data models to trace student learning with digital LMS-hosted resources3. Use student traces + grades to develop prediction models that identify those who will struggle4. Program the prediction model into Splunk; provide alerts to students before they begin to fail
The .conf 2016 StoryResearch+Operations: A Love Story
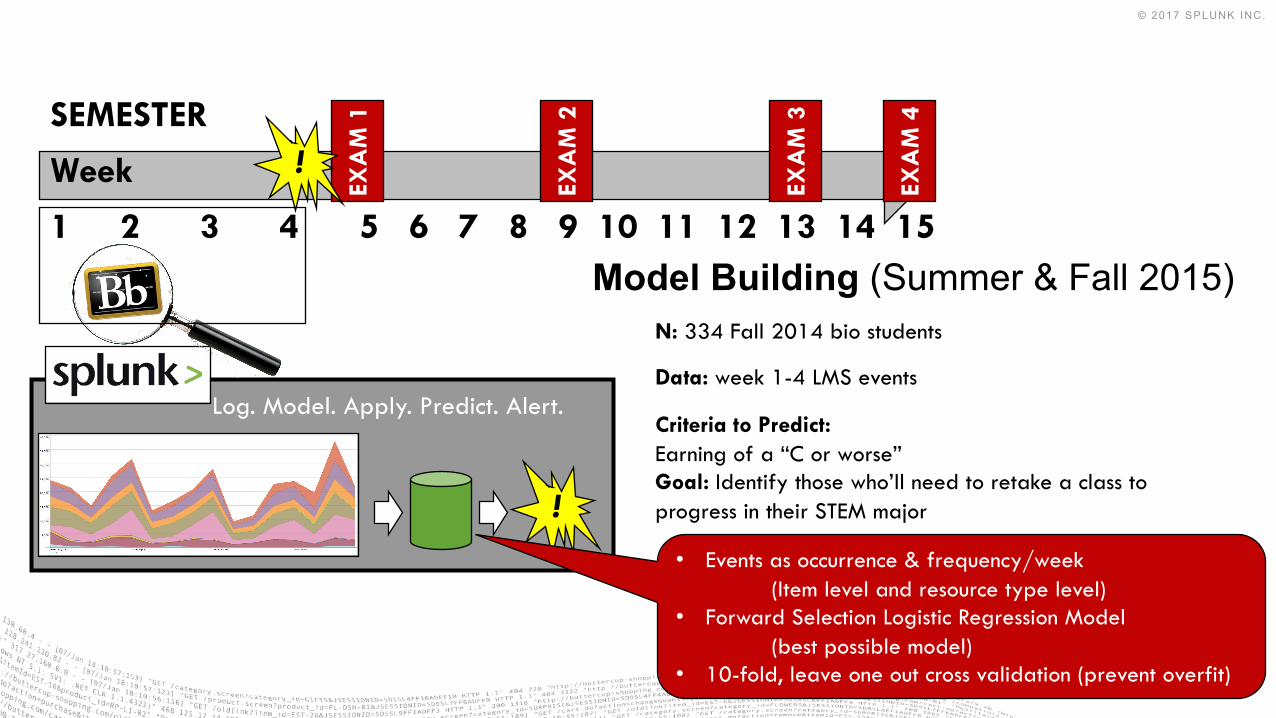
8Log. Model. Apply. Predict. Alert.
SEMESTER
Week
1 2 3 4 5 6 7 8 9 10 11 12 13 14 15
EXA
M 1
!
!
EXA
M 2
EXA
M 3
EXA
M 4
Criteria to Predict: Earning of a “C or worse”Goal: Identify those who’ll need to retake a class to progress in their STEM major
Model Building (Summer & Fall 2015)N: 334 Fall 2014 bio students
Data: week 1-4 LMS events
• Events as occurrence & frequency/week (Item level and resource type level)
• Forward Selection Logistic Regression Model (best possible model)
• 10-fold, leave one out cross validation (prevent overfit)

Study 1 ResultsEffects on Exam scores
vs. ▶ No immediate effect…▶ … but over time, messaged students
increase their gains
Does the content of the message matter?
▶ Oversampled (80%) to test message features:• Personalized Salutation• Negative Feedback• No impact on student responsiveness…
…but Impacts on performance
50556065707580859095
100
Exam 1 2 3 Final
Followed Messaged
d = .06 .02 .31 .431% <1% 7% 10%
50
60
70
80
90
100
Not Personalized
Personalized Salutation
50
60
70
80
90
100
No Feedback Feedback
Personalization made a difference (d = .28)
Feedback did not(d = .01)

Research Updates

FinalExam 2 Exam 4
Refinement & Extension: Study 2 & 3
Biology #2▶ Refit the prediction model using 2
semesters of data• Similar accuracy, less likely overfit
▶ Personalized message, no feedback… Also tested new message features (source)
And Calculus!
▶ Replicated prediction modeling method▶ Messaged Day 1 of Week 4
(Exam on Friday [Day 5])▶ Create Math specific advice page
• Learning strategies re: problem solving
50556065707580859095
100
Exam 1 (+4 days) Exam 2 Exam 3
d=.20 (3%) d=.40 (4%) d=.34 (6%) 50556065707580859095
100
Exam
Sco
re
Exam 1(+4 days)
Exam 3
(9%) (12%) (12%) (12%) (15%)

Applying Research-Derived Knowledge to
Improve OperationsHow to make your day better!

▶ Data integrity• Data interruptions • Incomplete database import• Duplicate data
▶ Operations passive to active
Pivot Research to Operations
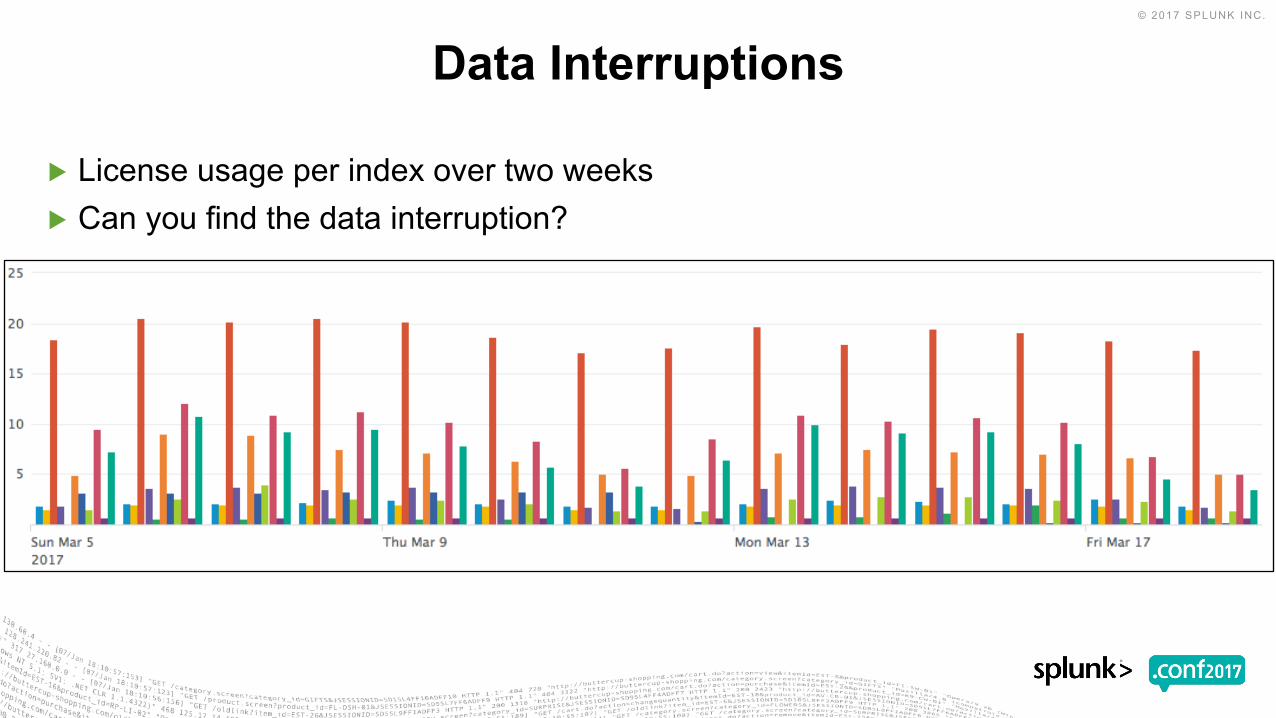
▶ License usage per index over two weeks▶ Can you find the data interruption?
Data Interruptions

▶ License usage for one index over two weeks▶ Can you find the data interruption?
Data Interruptions - Found
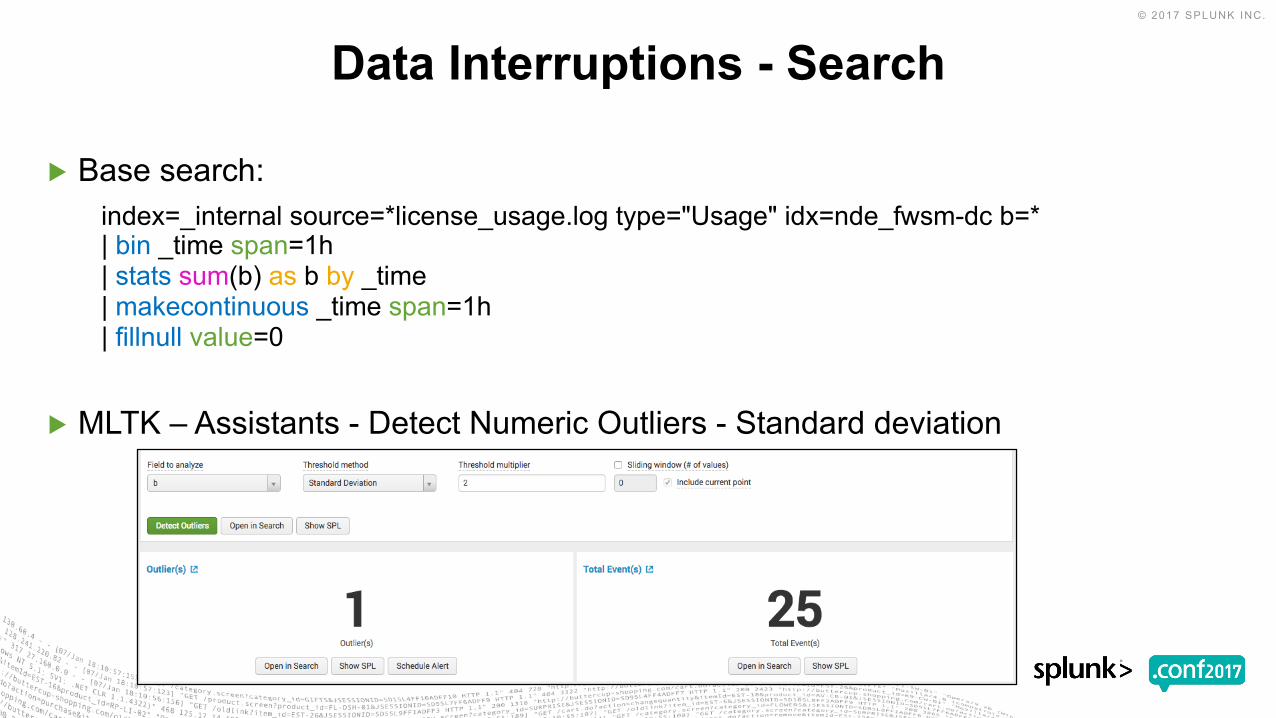
▶ Base search:index=_internal source=*license_usage.log type="Usage" idx=nde_fwsm-dc b=*| bin _time span=1h | stats sum(b) as b by _time| makecontinuous _time span=1h | fillnull value=0
▶ MLTK – Assistants - Detect Numeric Outliers - Standard deviation
Data Interruptions - Search

▶ Operations solution:• Report on all indexes• Send alert if an issue is found
Data Interruptions - Operations

▶ Operations solution:
Data Interruptions - Operations
index=_internal source=*license_usage.log type="Usage" idx=* b=*| stats count(result_count) by idx| map maxsearches=25 search="search index=_internal source=*license_usage.log type="Usage" idx=$idx$ b=*| bin _time span=1d | stats sum(b) as b by _time, idx| makecontinuous _time span=1h | fillnull value=0| eval b=round(b,0)| eventstats avg(b) as avg stdev(b) as stdev by idx| eval lowerBound=if((avg-stdev*1)<0,(0),(avg-stdev*1)), upperBound=(avg+stdev*1) | eval isOutlier=if('b' < lowerBound OR 'b' > upperBound, 1, 0)| where isOutlier=1 | table _time, idx, b, lowerBound, upperBound, isOutlier, avg, stdev| sort idx, _time”| eval alert_send=if(_time=(relative_time(now(),"-1d@d")),"send","no send") | search alert_send="send"
Generate list of indexes
Calculate outliersper index
Send alert
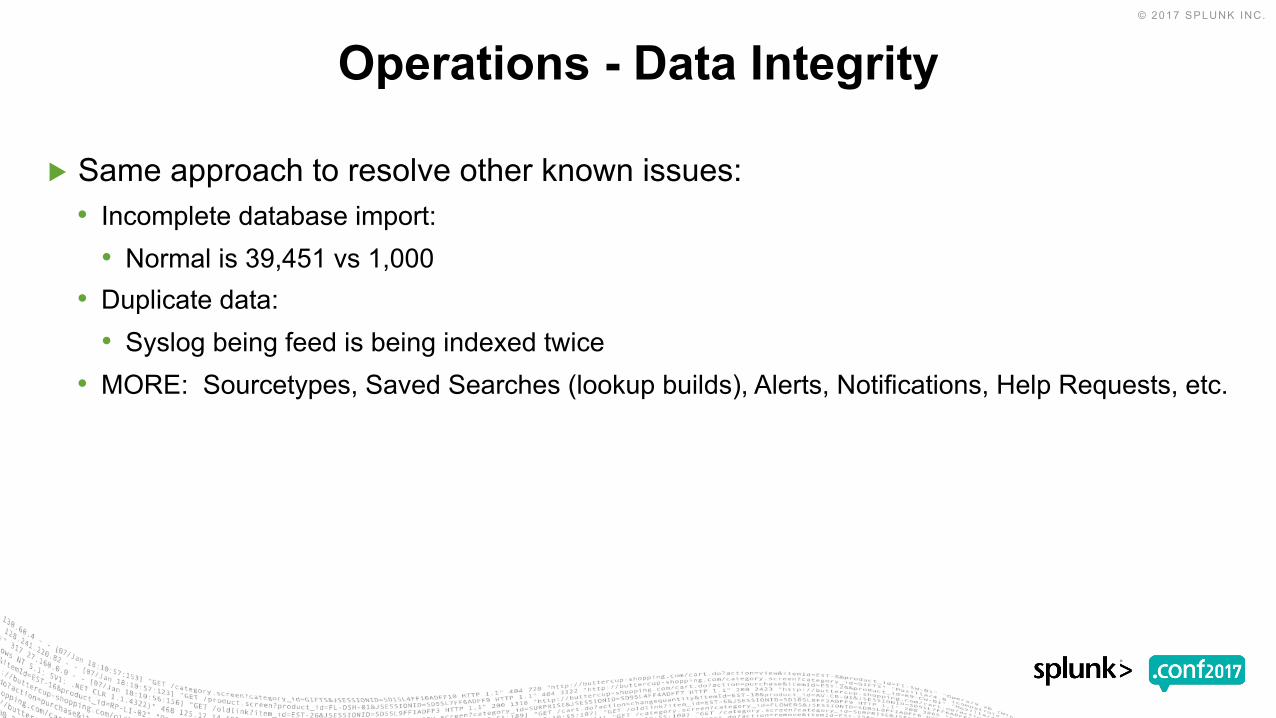
▶ Same approach to resolve other known issues:• Incomplete database import:
• Normal is 39,451 vs 1,000• Duplicate data:
• Syslog being feed is being indexed twice• MORE: Sourcetypes, Saved Searches (lookup builds), Alerts, Notifications, Help Requests, etc.
Operations - Data Integrity

▶ Future:• Comparing like events
• Cyclical events (start of the semester)• Monday to Monday
• Adding metadata:• Static lower bounds• Alert priority
Operations - Data Integrity
▶ Recommendation:• Outreach to other groups• Different projects may provide insight into providing solutions for yourself
Pivot Operations to Research
Ops + MLTK Expertise Back To Research
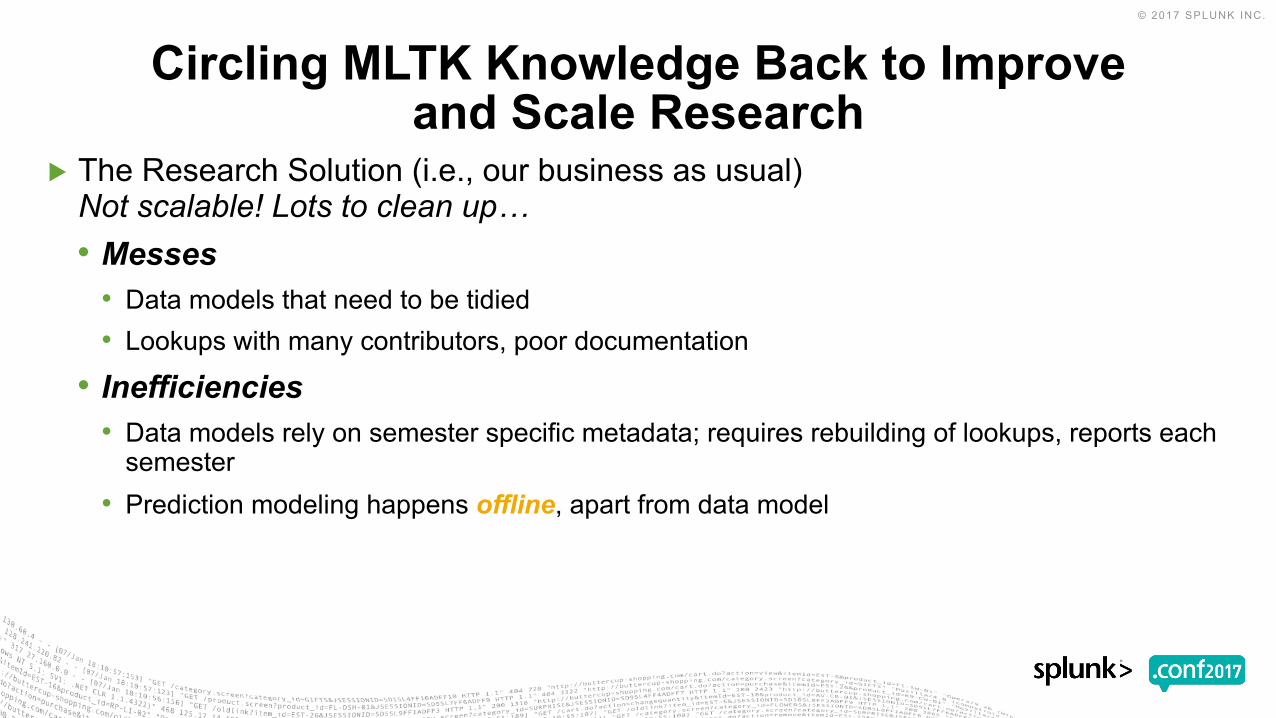
▶ The Research Solution (i.e., our business as usual) Not scalable! Lots to clean up…• Messes
• Data models that need to be tidied• Lookups with many contributors, poor documentation
• Inefficiencies• Data models rely on semester specific metadata; requires rebuilding of lookups, reports each
semester • Prediction modeling happens offline, apart from data model
Circling MLTK Knowledge Back to Improve and Scale Research

▶ To model, data fields need to be • Selected into 1+ report(s)• Frozen into a static table of predictors• Exported (and per FERPA, deidentified)
▶ When modeling offline• Some prediction algorithms have quirks
(and poor documentation)• Processing power limits the size of your
predictor set
▶ To build the model back into Splunk for predicting student success• Rebuilding is work intensive, repetitive, and
human-driven
Current Problems With Offline Prediction Modeling
Solutions Provided By MLTK
▶ Data grab• MLTK can use an SPL interface to conduct
modeling based reports that are live, editable▶ Model Building
• Algorithms are known, plentiful• Processing power is immense; optimal models
can be identified quickly
▶ Applying Prediction Models• No rebuilding required; can clone data models
and point and the new source
Similar levels of accuracySimilar set of predictors
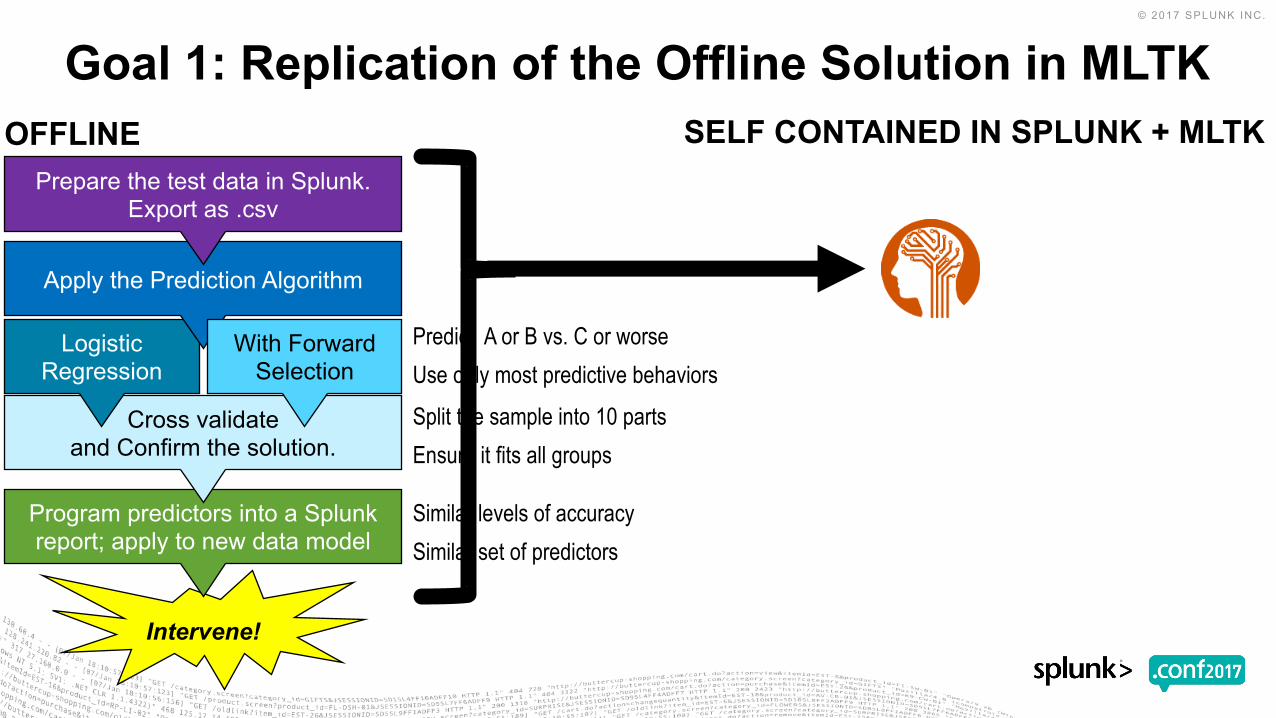
Goal 1: Replication of the Offline Solution in MLTK
Intervene!
Program predictors into a Splunk report; apply to new data model
Cross validate and Confirm the solution.
Logistic Regression
Apply the Prediction Algorithm
Prepare the test data in Splunk. Export as .csv
With Forward Selection
Predict A or B vs. C or worseUse only most predictive behaviorsSplit the sample into 10 parts Ensure it fits all groups
OFFLINE SELF CONTAINED IN SPLUNK + MLTK

Goal 1: Replication of the Offline Solution in MLTK
Intervene!
Program predictors into a Splunk report; Apply to new data model
Cross validate! Confirm the solution!
Logistic Regression
Apply the Prediction Algorithm
Prepare the test data in Splunk. Export as .csv
With Forward Selection
OFFLINE SELF CONTAINED IN SPLUNK + MLTKNo need. We can do our whole workflow in Splunk now!
Logistic Regression is available out of the box.
Forward Selection can be added from a python library and wrapped into the Splunk MLTK App.
Cross validation isn’t included out of the box…… but it can be written right in search!:
Predictors, accuracy metrics are similar. * SEE APPENDIX
Success! We can now model right in Splunk, improve our models as new data are available, and update our predictor sets to make more precise predictions and
Intervenewith confidence

The workflow: Pre-Splunk In Splunk MLTK▶ SPL anyone can read and reference:
• MLTK• |fit FieldSelector type=categorical param=10
Grade from * • |fit LogisticRegression Grade from fs_* into
model_a• | fit SVM Grade from fs_* into model_b• | fit RandomizedLogisticRegression Grade from
fs_* into model_c• Consume immediately as a report/dashboard/alert
Goal 2: Use MLTK to Improve the Approach!
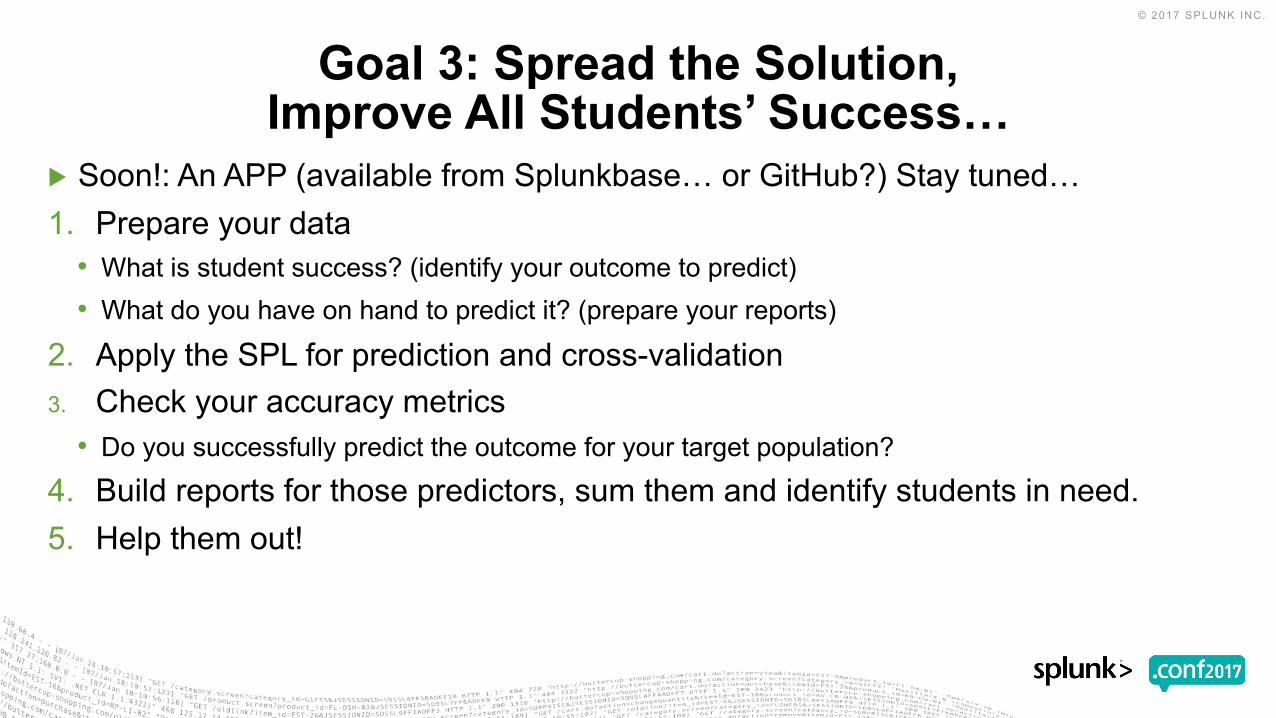
▶ Soon!: An APP (available from Splunkbase… or GitHub?) Stay tuned…1. Prepare your data
• What is student success? (identify your outcome to predict)• What do you have on hand to predict it? (prepare your reports)
2. Apply the SPL for prediction and cross-validation3. Check your accuracy metrics
• Do you successfully predict the outcome for your target population?4. Build reports for those predictors, sum them and identify students in need.5. Help them out!
Goal 3: Spread the Solution, Improve All Students’ Success…

© 2017 SPLUNK INC.
Don't forget to rate this session in the .conf2017 mobile app
Questions?CONTACT
[email protected] • [email protected]
faculty.unlv.edu/wpmu/bernacki/
© 2017 SPLUNK INC.
Don't forget to rate this session in the .conf2017 mobile app
Thank You

APPENDIXMACHINE LEARNING TOOL KIT
SPL FOR CROSS VALIDATION

From the Desk of Alexander Johnson| makeresults count=10| streamstats count| rename comment as "0-indexed partition_numbers require us to subtract 1”| eval count = count – 1| map maxsearches=10 search=" | inputlookup airline_tweets.csv where airline_sentiment_confidence > 0.8 | fields airline_sentiment text | sample partitions=10 seed=42 | search partition_number != $count$ | fit TFIDF text stop_words=english into vectorizer_$count$ | fit LogisticRegression airline_sentiment from text_tfidf* into lr_$count$ "
Cross Validation Informally in SPLStep 1 : Create your models with one partition holdout randomly

From the Desk of Alexander Johnson| makeresults count=10| streamstats count| rename comment as "0-indexed partition_numbers require us to subtract 1”| eval count = count – 1| map maxsearches=10 search=" | inputlookup airline_tweets.csv where airline_sentiment_confidence > 0.8 | fields airline_sentiment text | sample partitions=10 seed=42 | search partition_number = $count$ | apply vectorizer_$count$| apply lr_$count$ as p| `classificationstatistics(airline_sentiment, p)`"
Cross Validation Informally in SPLStep 2 : Score your models on the holdouts