Continuation of Survey GPS Measurements and Installation...
4
GRC Transactions, Vol. 37, 2013 895 Keywords The Geysers California, Enhanced Geothermal Systems, sub- sidence, survey GPS, continuous GPS, deformation monitoring ABSTRACT We present updated time-series and velocities based on sur- vey (episodic) Global Positioning System (GPS) measurements across the geothermal field at The Geysers, California. These surveys show that a slowing of the rapid rate of subsidence and contraction seen across The Geysers has occurred since the start of the Southeast Geysers Effluent Pipeline (SEGEP) in October 1997 and the Santa Rosa Geysers Recharge Pipeline (SRGRP) in September 2003, most significantly in areas close to high volume injector wells, although subsidence is still occurring. We also in- troduce the first continuous GPS sites in The Geysers, which were installed in December 2012 and January 2013. These continuous sites are intended to capture and monitor transient deformation associated with Calpine’s Enhanced Geothermal Systems dem- onstration projects. 1. Introduction Geodetic measurements were first made in The Geysers, California, using a leveling network established during the first surveys in 1973 (Lofgren, 1981). These surveys, between 1973 and 1977, quantified the magnitude and broad pattern of subsidence occurring across The Geysers geothermal field. Contemporary GPS measurements were made to complement and update these leveling surveys beginning in 1994 (e.g. Mossop and Segall, 1997; Mossop and Segall, 1999). Analysis showed that this subsidence may be explained by a series of point sources of volumetric contraction. The magnitude of this strain is not consistent with a thermal contraction alone, due to the extraction of steam and injection of cooler condensate, but may be explained by a poro- elastic contraction. We extended these survey measurements during surveys in 2006, 2009, 2010 and 2011. Between the last measurements in the 1990s (1996) and the first of these later measurements in 2006, two wastewater injection projects were begun: the Southeast Geysers Effluent Pipeline (SEGEP) was opened in October 1997 followed by the Santa Rosa Geysers Recharge Pipeline (SRGRP) in September 2003. These projects greatly augmented the volume of steam condensate that was being injected to sustain reservoir pressures. Rates of seismicity for earthquakes smaller than M 2.0 were found to increase, although there were no detected increases in the frequency of larger earthquake occurrences (Beall et al., 1999). We test the hypothesis that there was also a statistically significant change in the rate of surface deformation associated with the start of these waste-water injection projects. These GPS surveys are presented in Section 2 and a brief analysis is presented in Section 3. The nature of episodic measurements, however, is that no information exists on the nature of transient or short-term devia- tions from long-term trends between the epochs of observation. The availability of such information is especially important in the case where continuous manipulation of the steam reservoir is undertaken to maintain or recharge it for continued efficient and economic power production. We expect that, if rapid subsidence is associated with reduction in steam pressures, this subsidence may arrest if the steam pressures are maintained or restored to previous, more productive levels such as those in the 1980s. An Enhanced Geothermal Systems demonstration project is underway at The Geysers since October 6, 2011 (e.g. http://www. geysers.com/egsGeysers.aspx). In order to ascertain if there is any relationship between injection volume, well head pressure, seismic- ity rates and measureable deformation at the surface, we began the installation of network of continuous GPS (cGPS) sites within The Geysers in December 2012. Two sites were installed and record- ing continuously as of January 2013 and we intend to expand this network in the near future as resources deem possible. Preliminary results from these cGPS sites are presented in Section 4. In addition to understanding the immediate temporal relationships between surface deformation and quantities important to reservoir pro- ductivity such as rate of injection volume and well head pressure, densifying this network may also prove to be a valuable mapping tool for the rate and area of dispersion of the injected water away Continuation of Survey GPS Measurements and Installation of Continuous GPS Sites at The Geysers, California, for Geothermal Deformation Monitoring Michael A. Floyd 1 and Gareth J. Funning 2 1 Department of Earth, Atmospheric and Planetary Sciences, Massachusetts Institute of Technology, Cambridge, MA, USA 2 Department of Earth Sciences, University of California, Riverside, CA, USA
Transcript of Continuation of Survey GPS Measurements and Installation...
GRC Transactions, Vol. 37, 2013
895
KeywordsThe Geysers California, Enhanced Geothermal Systems, sub-sidence, survey GPS, continuous GPS, deformation monitoring
ABSTRACT
We present updated time-series and velocities based on sur-vey (episodic) Global Positioning System (GPS) measurements across the geothermal field at The Geysers, California. These surveys show that a slowing of the rapid rate of subsidence and contraction seen across The Geysers has occurred since the start of the Southeast Geysers Effluent Pipeline (SEGEP) in October 1997 and the Santa Rosa Geysers Recharge Pipeline (SRGRP) in September 2003, most significantly in areas close to high volume injector wells, although subsidence is still occurring. We also in-troduce the first continuous GPS sites in The Geysers, which were installed in December 2012 and January 2013. These continuous sites are intended to capture and monitor transient deformation associated with Calpine’s Enhanced Geothermal Systems dem-onstration projects.
1. Introduction
Geodetic measurements were first made in The Geysers, California, using a leveling network established during the first surveys in 1973 (Lofgren, 1981). These surveys, between 1973 and 1977, quantified the magnitude and broad pattern of subsidence occurring across The Geysers geothermal field. Contemporary GPS measurements were made to complement and update these leveling surveys beginning in 1994 (e.g. Mossop and Segall, 1997; Mossop and Segall, 1999). Analysis showed that this subsidence may be explained by a series of point sources of volumetric contraction. The magnitude of this strain is not consistent with a thermal contraction alone, due to the extraction of steam and injection of cooler condensate, but may be explained by a poro-elastic contraction.
We extended these survey measurements during surveys in 2006, 2009, 2010 and 2011. Between the last measurements in the
1990s (1996) and the first of these later measurements in 2006, two wastewater injection projects were begun: the Southeast Geysers Effluent Pipeline (SEGEP) was opened in October 1997 followed by the Santa Rosa Geysers Recharge Pipeline (SRGRP) in September 2003. These projects greatly augmented the volume of steam condensate that was being injected to sustain reservoir pressures. Rates of seismicity for earthquakes smaller than M 2.0 were found to increase, although there were no detected increases in the frequency of larger earthquake occurrences (Beall et al., 1999). We test the hypothesis that there was also a statistically significant change in the rate of surface deformation associated with the start of these waste-water injection projects. These GPS surveys are presented in Section 2 and a brief analysis is presented in Section 3.
The nature of episodic measurements, however, is that no information exists on the nature of transient or short-term devia-tions from long-term trends between the epochs of observation. The availability of such information is especially important in the case where continuous manipulation of the steam reservoir is undertaken to maintain or recharge it for continued efficient and economic power production. We expect that, if rapid subsidence is associated with reduction in steam pressures, this subsidence may arrest if the steam pressures are maintained or restored to previous, more productive levels such as those in the 1980s.
An Enhanced Geothermal Systems demonstration project is underway at The Geysers since October 6, 2011 (e.g. http://www.geysers.com/egsGeysers.aspx). In order to ascertain if there is any relationship between injection volume, well head pressure, seismic-ity rates and measureable deformation at the surface, we began the installation of network of continuous GPS (cGPS) sites within The Geysers in December 2012. Two sites were installed and record-ing continuously as of January 2013 and we intend to expand this network in the near future as resources deem possible. Preliminary results from these cGPS sites are presented in Section 4. In addition to understanding the immediate temporal relationships between surface deformation and quantities important to reservoir pro-ductivity such as rate of injection volume and well head pressure, densifying this network may also prove to be a valuable mapping tool for the rate and area of dispersion of the injected water away
Continuation of Survey GPS Measurements and Installation of Continuous GPS Sites at The Geysers, California,
for Geothermal Deformation Monitoring
Michael A. Floyd1 and Gareth J. Funning2
1Department of Earth, Atmospheric and Planetary Sciences, Massachusetts Institute of Technology, Cambridge, MA, USA
2Department of Earth Sciences, University of California, Riverside, CA, USA
896
Floyd and Funning
from the point of injection and throughout the reservoir. This may help to identify permeable rock bodies and conduits at depth, and guide future projects for injection or extraction.
2. GPS Surveys
We systematically reprocessed surveys from 1994 (2), 1995 and 1996 performed by the Stanford group. In 2006, a grav-
ity survey performed by a group at the University of Utah also collected GPS data. In 2009, 2010 and 2011, three further sur-veys were undertaken by the University of California, Riverside and University of Utah. These surveys were used to determine velocities during the 1990s and 2000s separately and the entire period assuming there was no change in velocity. Permanent scatterer intereferometric synthetic aperture radar (PS-InSAR) measurements from the same period as the 1990s GPS data were also available (Vasco et al., 2013) and were aligned to the same reference frame as the GPS data. Figure 2 shows the results of the GPS analysis in which velocities are estimated for the 1990s and 2000s separately.
3. Significance of Velocity Changes
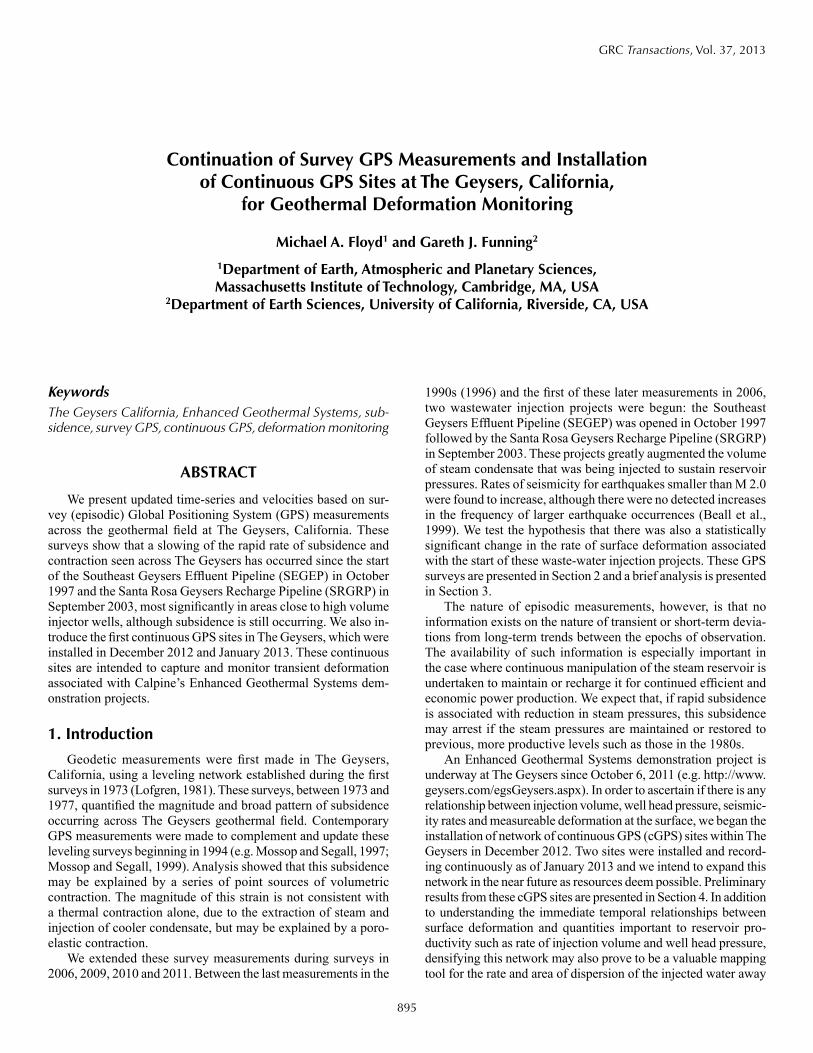
Visual inspection of Figure 1 shows that there is an overall reduction in the rate of subsidence from the 1990s to the 2000s. Two likely reasons for this are (1) the natural reduction of the steam reservoir pressures being proportional to the rate at which the reservoir volume changes and (2) the influence of the SEGEP and SRGRP wastewater injection projects in 1997 and 2003, respectively, or a combination of the two.
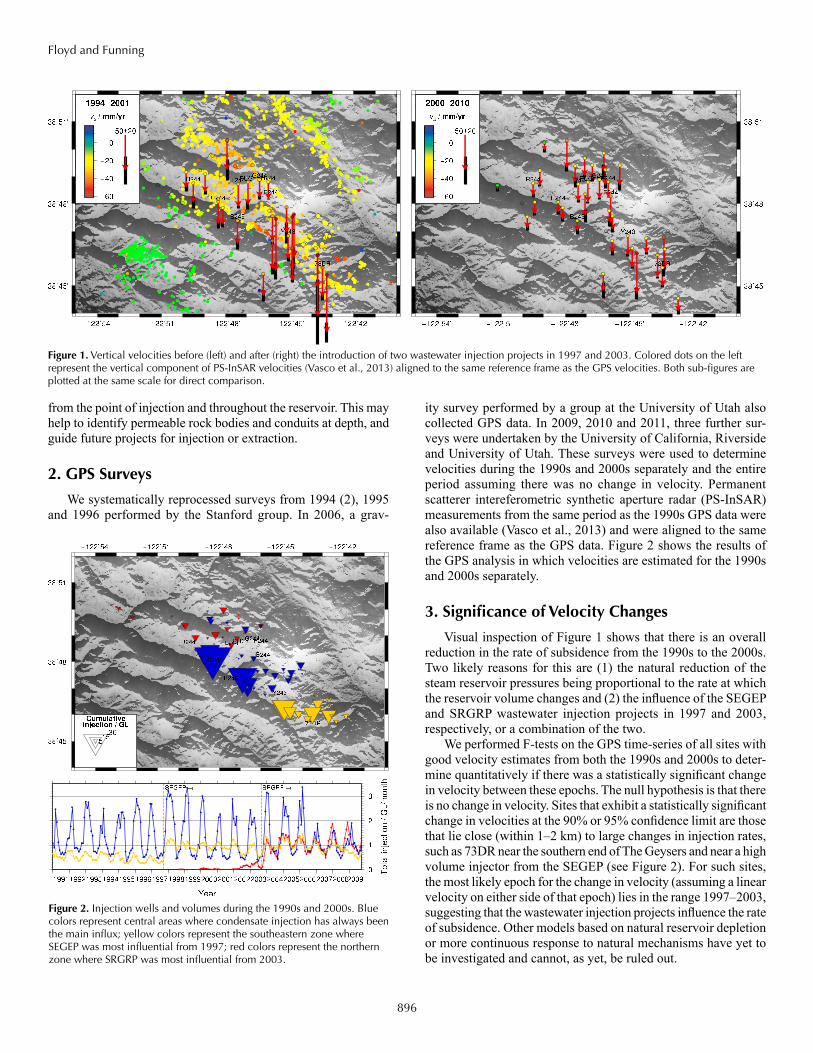
We performed F-tests on the GPS time-series of all sites with good velocity estimates from both the 1990s and 2000s to deter-mine quantitatively if there was a statistically significant change in velocity between these epochs. The null hypothesis is that there is no change in velocity. Sites that exhibit a statistically significant change in velocities at the 90% or 95% confidence limit are those that lie close (within 1–2 km) to large changes in injection rates, such as 73DR near the southern end of The Geysers and near a high volume injector from the SEGEP (see Figure 2). For such sites, the most likely epoch for the change in velocity (assuming a linear velocity on either side of that epoch) lies in the range 1997–2003, suggesting that the wastewater injection projects influence the rate of subsidence. Other models based on natural reservoir depletion or more continuous response to natural mechanisms have yet to be investigated and cannot, as yet, be ruled out.
Figure 1. Vertical velocities before (left) and after (right) the introduction of two wastewater injection projects in 1997 and 2003. Colored dots on the left represent the vertical component of PS-InSAR velocities (Vasco et al., 2013) aligned to the same reference frame as the GPS velocities. Both sub-figures are plotted at the same scale for direct comparison.
Figure 2. Injection wells and volumes during the 1990s and 2000s. Blue colors represent central areas where condensate injection has always been the main influx; yellow colors represent the southeastern zone where SEGEP was most influential from 1997; red colors represent the northern zone where SRGRP was most influential from 2003.
897
Floyd and Funning
4. Continuous GPS
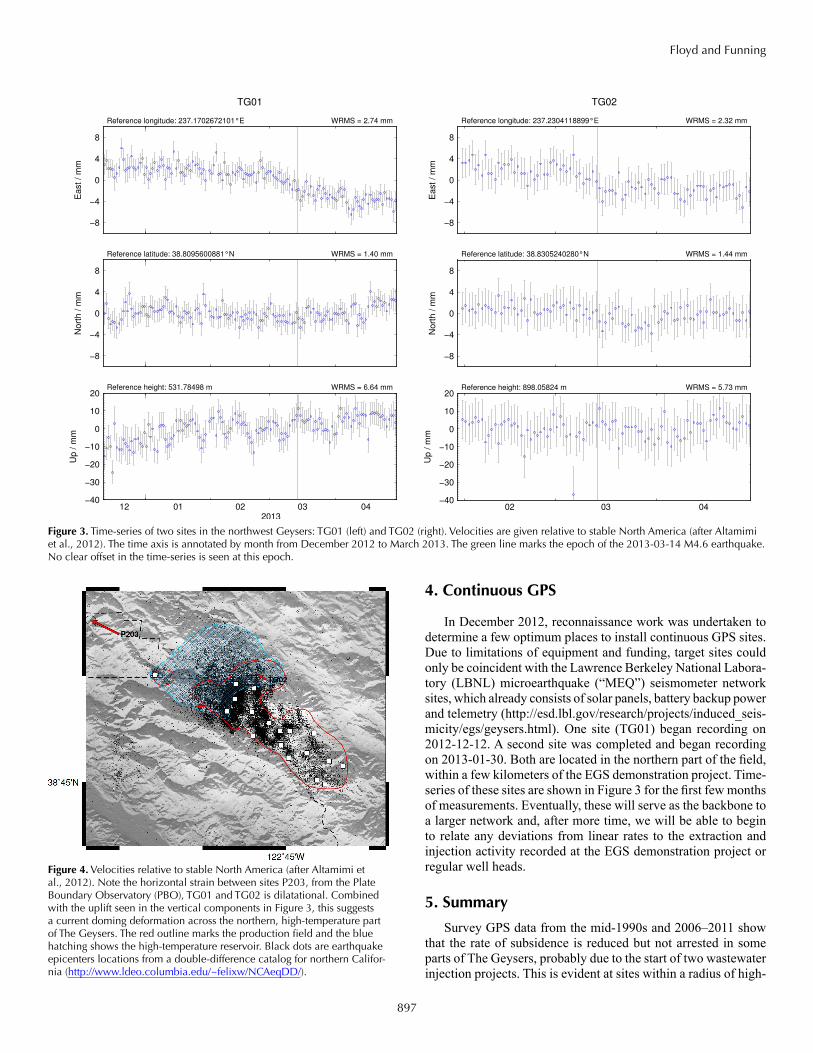
In December 2012, reconnaissance work was undertaken to determine a few optimum places to install continuous GPS sites. Due to limitations of equipment and funding, target sites could only be coincident with the Lawrence Berkeley National Labora-tory (LBNL) microearthquake (“MEQ”) seismometer network sites, which already consists of solar panels, battery backup power and telemetry (http://esd.lbl.gov/research/projects/induced_seis-micity/egs/geysers.html). One site (TG01) began recording on 2012-12-12. A second site was completed and began recording on 2013-01-30. Both are located in the northern part of the field, within a few kilometers of the EGS demonstration project. Time-series of these sites are shown in Figure 3 for the first few months of measurements. Eventually, these will serve as the backbone to a larger network and, after more time, we will be able to begin to relate any deviations from linear rates to the extraction and injection activity recorded at the EGS demonstration project or regular well heads.
5. Summary
Survey GPS data from the mid-1990s and 2006–2011 show that the rate of subsidence is reduced but not arrested in some parts of The Geysers, probably due to the start of two wastewater injection projects. This is evident at sites within a radius of high-
−40
−30
−20
−10
0
10
20
Up
/ m
m
12 01 02 03 042013
Reference height: 531.78498 m WRMS = 6.64 mm
−8
−4
0
4
8
No
rth
/ m
m
Reference latitude: 38.8095600881°N WRMS = 1.40 mm
−8
−4
0
4
8
Ea
st
/ m
m
TG01
Reference longitude: 237.1702672101°E WRMS = 2.74 mm
−40
−30
−20
−10
0
10
20
Up / m
m
02 03 04
Reference height: 898.05824 m WRMS = 5.73 mm
−8
−4
0
4
8
Nort
h / m
m
Reference latitude: 38.8305240280°N WRMS = 1.44 mm
−8
−4
0
4
8
East / m
m
TG02
Reference longitude: 237.2304118899°E WRMS = 2.32 mm
Figure 3. Time-series of two sites in the northwest Geysers: TG01 (left) and TG02 (right). Velocities are given relative to stable North America (after Altamimi et al., 2012). The time axis is annotated by month from December 2012 to March 2013. The green line marks the epoch of the 2013-03-14 M4.6 earthquake. No clear offset in the time-series is seen at this epoch.
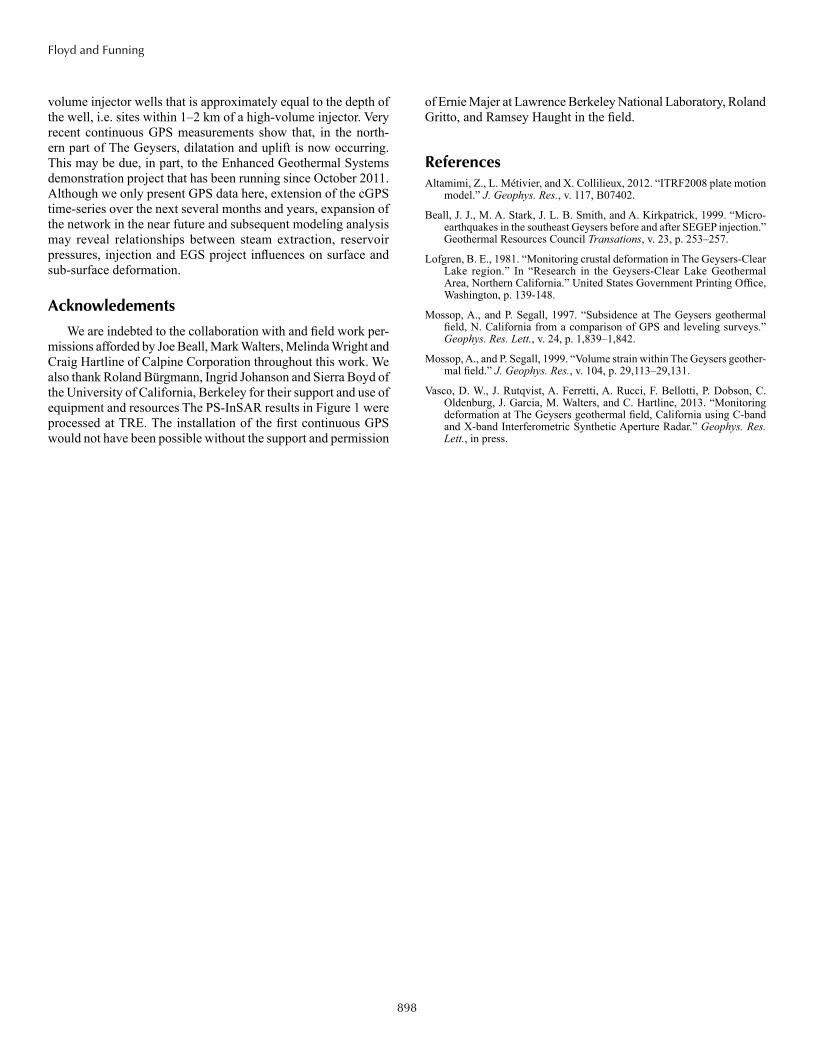
Figure 4. Velocities relative to stable North America (after Altamimi et al., 2012). Note the horizontal strain between sites P203, from the Plate Boundary Observatory (PBO), TG01 and TG02 is dilatational. Combined with the uplift seen in the vertical components in Figure 3, this suggests a current doming deformation across the northern, high-temperature part of The Geysers. The red outline marks the production field and the blue hatching shows the high-temperature reservoir. Black dots are earthquake epicenters locations from a double-difference catalog for northern Califor-nia (http://www.ldeo.columbia.edu/~felixw/NCAeqDD/).
898
Floyd and Funning
volume injector wells that is approximately equal to the depth of the well, i.e. sites within 1–2 km of a high-volume injector. Very recent continuous GPS measurements show that, in the north-ern part of The Geysers, dilatation and uplift is now occurring. This may be due, in part, to the Enhanced Geothermal Systems demonstration project that has been running since October 2011. Although we only present GPS data here, extension of the cGPS time-series over the next several months and years, expansion of the network in the near future and subsequent modeling analysis may reveal relationships between steam extraction, reservoir pressures, injection and EGS project influences on surface and sub-surface deformation.
Acknowledements
We are indebted to the collaboration with and field work per-missions afforded by Joe Beall, Mark Walters, Melinda Wright and Craig Hartline of Calpine Corporation throughout this work. We also thank Roland Bürgmann, Ingrid Johanson and Sierra Boyd of the University of California, Berkeley for their support and use of equipment and resources The PS-InSAR results in Figure 1 were processed at TRE. The installation of the first continuous GPS would not have been possible without the support and permission
of Ernie Majer at Lawrence Berkeley National Laboratory, Roland Gritto, and Ramsey Haught in the field.
ReferencesAltamimi, Z., L. Métivier, and X. Collilieux, 2012. “ITRF2008 plate motion
model.” J. Geophys. Res., v. 117, B07402.
Beall, J. J., M. A. Stark, J. L. B. Smith, and A. Kirkpatrick, 1999. “Micro-earthquakes in the southeast Geysers before and after SEGEP injection.” Geothermal Resources Council Transations, v. 23, p. 253–257.
Lofgren, B. E., 1981. “Monitoring crustal deformation in The Geysers-Clear Lake region.” In “Research in the Geysers-Clear Lake Geothermal Area, Northern California.” United States Government Printing Office, Washington, p. 139-148.
Mossop, A., and P. Segall, 1997. “Subsidence at The Geysers geothermal field, N. California from a comparison of GPS and leveling surveys.” Geophys. Res. Lett., v. 24, p. 1,839–1,842.
Mossop, A., and P. Segall, 1999. “Volume strain within The Geysers geother-mal field.” J. Geophys. Res., v. 104, p. 29,113–29,131.
Vasco, D. W., J. Rutqvist, A. Ferretti, A. Rucci, F. Bellotti, P. Dobson, C. Oldenburg, J. Garcia, M. Walters, and C. Hartline, 2013. “Monitoring deformation at The Geysers geothermal field, California using C-band and X-band Interferometric Synthetic Aperture Radar.” Geophys. Res. Lett., in press.