Continental Resources, Inc. - Platts000 2,000 3,000 4,000 5,000 6,000 7,000 -50,000 100,000 150,000...
8
Continental Resources, Inc. Platts 4 th Annual Midstream Development and Management Conference Houston May 12, 2011
Transcript of Continental Resources, Inc. - Platts000 2,000 3,000 4,000 5,000 6,000 7,000 -50,000 100,000 150,000...

Continental Resources, Inc.
Platts 4th Annual Midstream Development and Management ConferenceHoustonMay 12, 2011
This presentation includes forward-looking information that is subject to a number of risks and uncertainties, many ofwhich are beyond the Company’s control. All information, other than historical facts included in this presentation,regarding strategy, future operations, drilling plans, estimated reserves, future production, estimated capital expenditures,projected costs, the potential of drilling prospects and other plans and objectives of management is forward-lookinginformation. All forward-looking statements speak only as of the date of this presentation. Although the Company believesthat the plans, intentions and expectations reflected in or suggested by the forward-looking statements are reasonable,there is no assurance that these plans, intentions or expectations will be achieved. Actual results may differ materiallyfrom those anticipated due to many factors, including oil and natural gas prices, industry conditions, drilling results,uncertainties in estimating reserves, uncertainties in estimating future production from enhanced recovery operations,availability of drilling rigs, pipe and other services and equipment, availability of oil and natural gas transportationcapacity, availability of capital resources and other factors listed in reports we have filed or may file with the Securities andExchange Commission.
This presentation also includes information on reserves potentially recoverable through additional drilling or enhancedrecovery operations. Non-proven estimates are generally not permitted to be disclosed in SEC filings and are subject to asubstantial risk of not being realized.
2
3
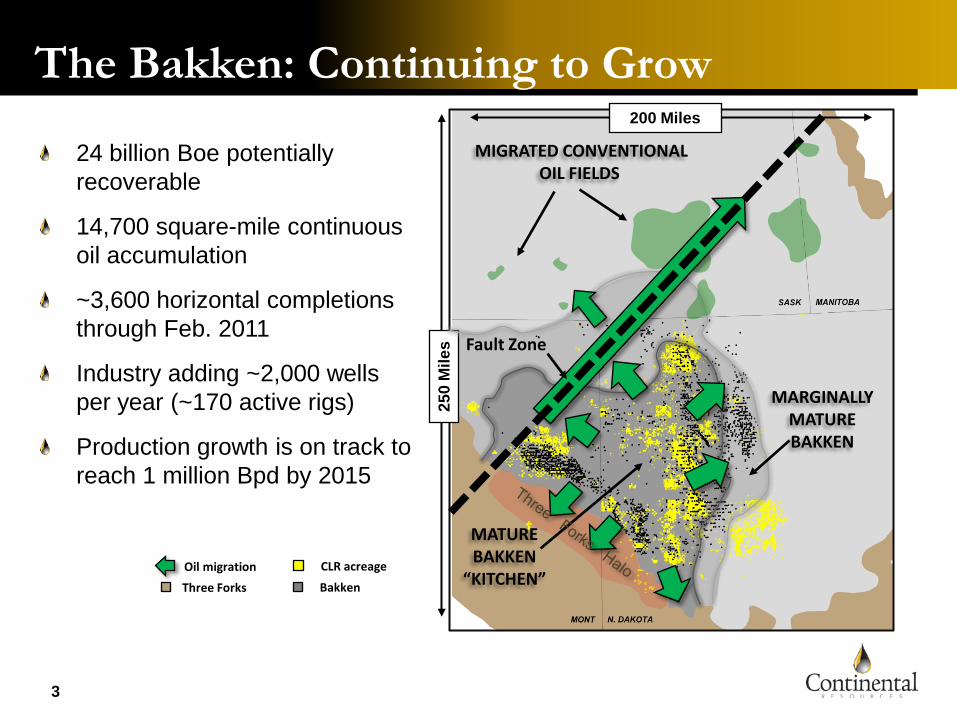
The Bakken: Continuing to Grow
24 billion Boe potentially recoverable
14,700 square-mile continuous oil accumulation
~3,600 horizontal completions through Feb. 2011
Industry adding ~2,000 wells per year (~170 active rigs)
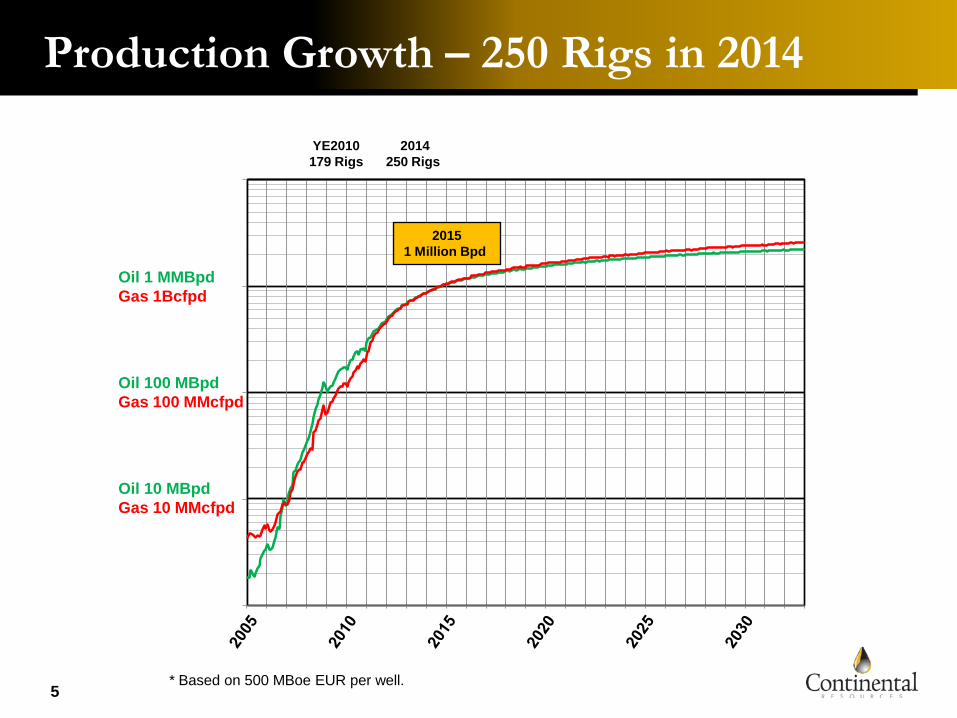
Production growth is on track to reach 1 million Bpd by 2015
Oil migration CLR acreage
BakkenThree Forks
MATURE BAKKEN
“KITCHEN”
MIGRATED CONVENTIONAL OIL FIELDS
250
Mile
s
200 Miles
Fault Zone
MARGINALLY MATURE BAKKEN

-
1,000
2,000
3,000
4,000
5,000
6,000
7,000
-
50,000
100,000
150,000
200,000
250,000
300,000
350,000
~2,700WELLS
Bakken Production History (MT&ND)
4
~350 MBO
Multi Leg HZ Open hole Frac
HZ wells No frac
Single Leg HZLiner / Multi-stage Frac
WellsDaily Oil Production (Bopd)
4
1,000
10,000
100,000
1,000,000
10,000,000
05 06 07 08 09 10 11 12 13 14 15 16 17 18 19 20 21 22 23 24 25 26 27 28 29 30 31 32
Oil, Bbl/Day
Gas, Mcf/Day
Production Growth – 250 Rigs in 2014
Oil 1 MMBpdGas 1Bcfpd
Oil 100 MBpdGas 100 MMcfpd
Oil 10 MBpdGas 10 MMcfpd
YE2010179 Rigs
2014250 Rigs
20151 Million Bpd
* Based on 500 MBoe EUR per well.5

Williston Crude Oil Capacity (May 2011)Barrels in 000s per day
DateDec. 2008Feb. 2009Dec. 2009Jan. 2010Feb. 2010Jun. 2011Jan. 2012Jul. 2012Mar. 2013Jun. 2013
*Enbridge line from Berthold, ND to Cromer, Manitoba**Trenton to Regina via new line and Wascana reversal***Bakken Marketlink initial capacity via Keystone XL****BNSF states rail capacity up to 730,000 Bopd
Tesoro58585858585858686868
Butte118118118118118150150150150150
BelleFourche
South------
50505050
Enbridgeto
Clearbrook110110130162162185185185185185
PortalLine
Reverse*-----
252525
145145
PlainsBakkenNorth**
--------
7575
Key-stoneXL***
--------
100100
TotalPipeline
286286306338338418468478773773
EOGRail
--
1530606060606060
OtherRail****20202030303090
150210210
TotalwithRail306306341398428508618688
1,0431,043

Bakken Gas Processing Capacity (May 2011)MMcf per day
DateDec. 2008Apr. 2009Nov. 2010June 2011Feb. 2012Dec. 2012Mar. 2013June 2013
Avg. BTU: 1380 to 1500Avg. Yield: 11,5 to 13 GPM (~50% Ethane)
HessTiogaPlant
110110110110110110250250
Petro-Hunt
L. Knife3232323232323232
SaddleButte
Pipeline
4545454545
BearpawGrass-
lands100100100100100100100100
BearpawGarden
Creek
100100100100
BearpawStateline
I and II
100200200
PecanPipeline
20 40 80 80 80 80 80 80
Whiting Robinson
Lake
30303090909090
HilandPartnersRichland& Norse
2535505050505050
HilandPartnersWatford
City
3030858585
TotalProcessing
Capacity
287347402477637792
1,0321,032

8
ND Oil Production and Transportation