Continental Overlay HVDC-Grid - ABB
9
21, rue d’Artois, F-75008 PARIS B4-109 CIGRE 2010 http : //www.cigre.org Continental Overlay HVDC-Grid G. ASPLUND B. JACOBSON B. BERGGREN K. LINDÉN* ABB Sweden SUMMARY The growth in renewable power generation, increases in power trade across national borders, deregulation and global climate discussions are posing new challenges to power generation and high voltage transmission systems. The need for new power transfer corridors, especially in mature networks such as in Europe and North America, is impeded by the permitting process to build new overhead lines, which is very slow or even impossible. An HVDC-grid, using converted ac-overhead lines or dc-underground cables could offer an alternative. In a two terminal HVDC-transmission the load flow is fully controlled, whereas in a meshed dc-grid it might not be possible to directly control currents in all lines. Buses connected to large production areas will have higher voltages than buses connected to major load centres. To make sure that no branch is overloaded, no bus has too high voltage and to minimise losses, load flow calculations need to be done both during the designing stage and during the operation of the dc-grid together with the ac- system. This paper shows how power flow calculations can be done by a simple routine which has been implemented in the well-known program MATLAB. The paper also shows how dc-voltage and power are controlled in smaller dc-systems and shows the analogy with power-frequency control in an ac- system. The need for a new power flow control strategy for large HVDC-systems such as in an Overlay HVDC-Grid is discussed. KEYWORDS Multi terminal – HVDC VSC – Grid – Overlay – System – Long distance – Transmission – Power Flow – Control – Droop *) [email protected] 1
Transcript of Continental Overlay HVDC-Grid - ABB
21, rue d’Artois, F-75008 PARIS B4-109 CIGRE 2010
http : //www.cigre.org
Continental Overlay HVDC-Grid
G. ASPLUND B. JACOBSON B. BERGGREN K. LINDÉN* ABB
Sweden
SUMMARY The growth in renewable power generation, increases in power trade across national borders, deregulation and global climate discussions are posing new challenges to power generation and high voltage transmission systems.
The need for new power transfer corridors, especially in mature networks such as in Europe and North America, is impeded by the permitting process to build new overhead lines, which is very slow or even impossible. An HVDC-grid, using converted ac-overhead lines or dc-underground cables could offer an alternative.
In a two terminal HVDC-transmission the load flow is fully controlled, whereas in a meshed dc-grid it might not be possible to directly control currents in all lines. Buses connected to large production areas will have higher voltages than buses connected to major load centres. To make sure that no branch is overloaded, no bus has too high voltage and to minimise losses, load flow calculations need to be done both during the designing stage and during the operation of the dc-grid together with the ac-system.
This paper shows how power flow calculations can be done by a simple routine which has been implemented in the well-known program MATLAB. The paper also shows how dc-voltage and power are controlled in smaller dc-systems and shows the analogy with power-frequency control in an ac-system. The need for a new power flow control strategy for large HVDC-systems such as in an Overlay HVDC-Grid is discussed.
KEYWORDS Multi terminal – HVDC VSC – Grid – Overlay – System – Long distance – Transmission – Power Flow – Control – Droop
*) [email protected] 1

1. INTRODUCTION A dc-grid, would be a multi-terminal dc-system (MTDC), which consists of several converter terminals connected in parallel with the dc-buses. Each terminal consists of forced commutated voltage source converters (VSC), since VSC is very compact it is easy to site, and has the potential to be built as a large multi-terminal system. The VSC can allow current in both directions and there is no need to change the polarity when the direction of power is changed. The dc-network can be radial, meshed or a combination of both. The terminals would be connected to several points in a synchronised ac-network, unsynchronised ac-networks or as a dc-hub. The dc-grid would be used for interconnection of multiple off-shore wind farms or as a backbone/an overlay system, and is characterised by long distance transmission, low losses and a flat voltage profile.
In a two terminal HVDC-transmission the load flow is fully controlled, whereas in a meshed dc-grid it might not be possible to directly control currents in all lines. Buses connected to large production areas will have higher voltages than buses connected to major load centres. To make sure that no branch is overloaded, no bus has too high voltage and to minimise losses, load flow calculations need to be done both during the designing stage and during the operation of the dc-grid together with the ac-system.
2. CONTROL OF POWER BALANCE IN AN HVDC-VSC SYSTEM In a physical system, the power balance is kept if the power input is equal to the power output, including losses. The power-balance indicator in a dc-system is the dc-voltage – in case of a power surplus, the dc-voltage increases and in case of a power deficit the dc-voltage decreases. After a power change, the dc-voltage will change until the power balance is reached, and the dc-voltage will remain at the new steady-state value. Analogous to the dc-voltage, the frequency is the indicator of power balance in an ac-system – if more power is fed into the ac-system than out from the system, the frequency will increase, and vice versa. Whereas, the change in the total energy in the ac-system is the change in stored kinetic energy in the turbine-generator system, the energy change in the dc-system is the sum of the change in stored energy in the capacitances (and inductances). To keep the voltage at a pre-set value, i.e. to keep the energy balance, dc-voltage control is used together with power control, where one terminal is controlling the dc-voltage and the other terminal(s) is controlling the power. Referring to the dc-system in Figure 1, the rectifier is used to control the dc-voltage and the inverters are used to control the power to the pre-set values at the two terminals, respectively. In case of new power order(s) (new power reference value(s)), the dc-voltage will change, and the dc-voltage controller will act depending on the change and reduce/increase the power input to restore the voltage in the system.
Figure 1. Characteristic curves : Keeping the energy balance, with dc-voltage control in the rectifier and power control in the two inverters. First a new lower power order is given in converter 2, and the voltage control in converter 1 decreases the power input to restore the voltage. In the next step, a new higher power order is given in converter 3, and again the power control in converter 1 restores the voltage, but this time by increasing the power input to the dc-system.
2

3. STEADY-STATE POWER FLOW CALCULATIONS IN VSC-HVDC-GRID A power flow program has been developed and implemented in the well-known calculation program MATLAB [1]. For each node i on the dc-side, the power flow program uses the following power flow equation, where Pi is the total dc-power injected into the node, Vi the node dc-voltage, Yij is the element in the admittance (conductance) matrix, Vj is the dc-voltage in the adjacent node and n the number of dc-nodes [2, 3]:
∑=
=n
jjijii VYVP
1
At each dc-node the power or the voltage is unknown. Considering bipole-converters in the above equation, together with metallic return, and making use of the power flow equations for the ac-side, the whole system of equations can be solved by using the Newton-Raphson method [2, 3]. For interface equations between the ac and dc-side, converter loss equations can be used, however not yet in this version of the program. Through the inclusion of the ac-side, the power reference can be kept at the point of common coupling (PCC), i.e. the point for power exchange between the ac-system and the dc-system. And by including bipole-converters, i.e. positive and negative poles, also unsymmetrical conditions on the dc-side can be studied, for instance the loss of a monopole in a bipole-converter or loss of one of the pole-cables. The above have been implemented and tested, and the results are presented in the next section. Calculating steady-state power flows in a dc-system together with an ac-system, can of course be done using tools like PSS/E, Power Factory, SIMPOW or other similar power simulations programs, but to test alternative control principles, i.e. new dc power flow controls, MATLAB is a powerful tool. 4. THE AC AND DC GRID SIMULATION MODEL The dc-grid shown in Figure 2 has been used to simulate dc-power flows and consists of a forty-(40)-terminal meshed dc-system with a 30 GW infeed of renewable power. The dc-grid is assumed to be an overlay or backbone-system of the European synchronous and asynchronous ac-networks, where the main sources of generation are solar energy in the Sahara desert in the south (19,200 MW), hydro power in northern Europe (2,200 MW), and wind power from western Europe (7,800 MW). Though European city names are used for many of the network nodes, the location of the terminal stations should be considered as fictive and is mainly given as a help for the reader to navigate in the network and also to help specifying approximate line-lengths for an overlay system in Europe.
The power produced in the renewable energy sources is transmitted through the dc-grid to load centres all around Europe, see Figure 3, using 640 kV cables, which, at such a high voltage, is yet to be developed. No actual planning work has been done to obtain the most economical and technological ratings of the grid, i.e. parts of the dc-grid might be over or under-rated for different load conditions and contingencies in the network, and in addition overhead lines could also be used on part of the routes if found more feasible. The terminals in the dc-grid are forced commutated VSCs, all in bipolar configuration together with metallic return cables, with the assumed rated power 2x1200 MW. Each monopole converter is connected to a phase reactor, transformer and to an infinite ac-bus. The lengths of the cables feeding solar power from Sahara to Europe are assumed to be 1000 km each. The stations in Sahara are named after the North-African countries they are passing through before crossing the Mediterranean Sea. Further assumed cable lengths are given in Table 1.
The four main bulk power transfer from North-Africa to central Europe, consists of parallel bipoles (2x2400 MW): 1) Sahara-(Marocco)-Cordoba-Madrid-Toulouse-Paris 2) Sahara-(Algeria)-Sardinia-Corsica-Milan-Zürich-Munich 3) Sahara-(Tunisia)-Sicily-Napoli-Milan-Vienna 4) Sahara-(Libya)-Crete-Athens-Sarajevo-Vienna
The total network length from North to South is about 4000 km long, and from West to East about 3500 km wide.
3

The cable resistance was chosen to give a loss of 35 W/m at 1,875 kA, and gives r=0.01 Ω/km.
Munich is used as the dc-voltage controlling terminal, and all the other terminals are in power control mode.
Table I. Line-lengths between stations [km]
Figure 2. The used system model, a 40-nodes overlay dc-grid.
Figure 3. Power infeed and tappings in each station [MW].
4
5. STUDY CASES The following cases were simulated for pre-contingency and post-contingency steady state solutions:
C1. The Base Case, which is used as the Pre-contingency case. Power in-feeds and tappings according to Figure 3.
C2. Loss of one rectifier bipole in Sahara (Algeria), i.e. only 2400 MW in-feed, but with parallel pole cables.
C3. Loss of one inverter monopole in London, i.e. ac-in-feed loss of 1200 MW in the United Kingdom-system.
Case C1 can be considered as a power production situation when there is low production of hydro-power and wind power, but a high production of solar energy, e.g. during summer time during fair weather conditions over Europe. Even though a loss of a bipole is very rare, case C2 is chosen to show the impact of losing a large power in-feed. Case C3 is a trip of a monopole-converter, a short trip, which in present-day HVDC systems statistically happens about 1-2 times a year, usually due to errors in control or auxiliary systems [4].
6. SIMULATION RESULTS The power flow results for the three cases are shown in Table II through Table IV, where the voltages are given in per-unit values based on the rated voltage and the power flows are given in MW.
Even though it is a very large system (4000 x 3500 km), the dc-grid has flat voltages, with the lowest voltage in Malmö, with 0.9870 p.u. in case C2 and the highest voltage in Sahara (through Tunisia) with 1.065 p.u. in case C3.
The loss of in-feed or tapping results in major changes in the station in Munich, since this is the dc-voltage regulating station. The dc-regulating station act as the system slack bus, i.e. its input and output is constantly changed to changes in other stations and in system losses. In this way the dc-voltage is kept at the set-point value, here chosen to 1.0 p.u. In addition, in case C3, the positive pole in Munich becomes overloaded (1912 MW), since the output is already about 700 MW in each pole, before the loss of the monopole inverter (1200 MW) in London. The power in the negative pole becomes lower than before the contingency due to the asymmetry, resulting in 687 MW in the negative pole.
7. DISCUSSIONS: REQUIREMENTS ON POWER FLOW CONTROL IN A VSC-HVDC-GRID
Having one slack station only in a dc-grid, means that station needs to be over-rated or the power- settings at the other stations need to be revised after a contingency. In the shown case with converter rated to the same values, the slack bus need to be at zero power in order to make the slack bus ready for a sudden change in surplus or deficit power of 1200 MW in each pole. The slack station will be of little use for the system operator, and in addition, the impact on the ac-system connected to the dc-voltage controlling station will be large – in one instant exporting large power and in the next importing.
To limit the impact, several voltage controlling stations could be used. However, having several voltage controlling stations, may lead to dc-controller instability, since several stations are trying to control the voltage with integral control [5]. Also the set-points on each voltage controlling station will be difficult to establish.
This gives the tentatively requirements on the power flow control in a VSC-HVDC-Grid:
o The operation points should be possible to set individually
o The operations points should be stable at temporary and permanent outages
o The control should have a defined and limited impact on the ac-system
5

Table II. Voltages and power flows in one pole for the Base Case (C1). The voltages are given in per-unit (p.u.) and power flows in MW. The power tapping in Munich is 704 MW from each pole.
Branches
Power flow in one pole (+ out from station) MW MW
6

Table III. Voltages and power flows in one pole for the Case C2. The voltages are given in per-unit (p.u.) and power flows in MW. The slack bus in Munich is now feeding in power. And the power infeed in Munich is 401.5 MW from each pole.
[p.u.]
Branches
Power flow in one pole (+ out from station) MW MW
7

Table IV. Voltages and power flows in Case C3. Pole-pole voltages and power flows in the positive and negative pole networks. The voltages are given in per-unit (p.u.) and power flows in MW. The power tapping in Munich is now 1912 (heavy overload) from the positive pole and 687 MW from the negative pole.
Branches
Power flow in positive-pole network (+ out from station) MW MW
Power flow in negative-pole network (+ out from station) MW MW
Stations
Pole-pole
Voltages [p.u.]
8
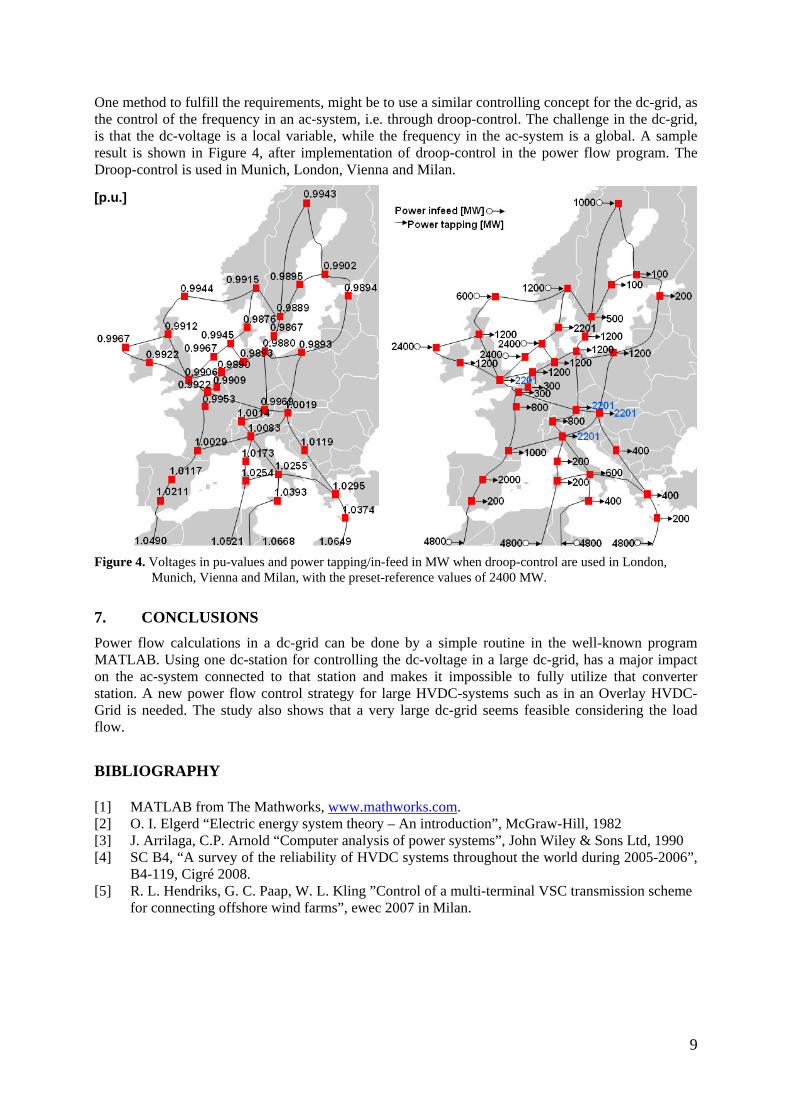
One method to fulfill the requirements, might be to use a similar controlling concept for the dc-grid, as the control of the frequency in an ac-system, i.e. through droop-control. The challenge in the dc-grid, is that the dc-voltage is a local variable, while the frequency in the ac-system is a global. A sample result is shown in Figure 4, after implementation of droop-control in the power flow program. The Droop-control is used in Munich, London, Vienna and Milan.
[p.u.]
Figure 4. Voltages in pu-values and power tapping/in-feed in MW when droop-control are used in London, Munich, Vienna and Milan, with the preset-reference values of 2400 MW.
7. CONCLUSIONS Power flow calculations in a dc-grid can be done by a simple routine in the well-known program MATLAB. Using one dc-station for controlling the dc-voltage in a large dc-grid, has a major impact on the ac-system connected to that station and makes it impossible to fully utilize that converter station. A new power flow control strategy for large HVDC-systems such as in an Overlay HVDC-Grid is needed. The study also shows that a very large dc-grid seems feasible considering the load flow.
BIBLIOGRAPHY [1] MATLAB from The Mathworks, www.mathworks.com. [2] O. I. Elgerd “Electric energy system theory – An introduction”, McGraw-Hill, 1982 [3] J. Arrilaga, C.P. Arnold “Computer analysis of power systems”, John Wiley & Sons Ltd, 1990 [4] SC B4, “A survey of the reliability of HVDC systems throughout the world during 2005-2006”,
B4-119, Cigré 2008. [5] R. L. Hendriks, G. C. Paap, W. L. Kling ”Control of a multi-terminal VSC transmission scheme
for connecting offshore wind farms”, ewec 2007 in Milan.
9