CONTINENTAL HOLDINGS CORPORATION Annual Report 2020
208
Annual Report 2020 ( Translaon) CONTINENTAL HOLDINGS CORPORATION TSE : 3703 Printed on April 3, 2021 Taiwan Stock Exchange Market Observaon Post System: mops.twse.com.tw CHC website: www.Connental-holdings.com
Transcript of CONTINENTAL HOLDINGS CORPORATION Annual Report 2020
Annual Report 2020( Translation)
CONTINENTAL HOLDINGS CORPORATION
TSE : 3703Printed on April 3, 2021
Taiwan Stock Exchange Market Observation Post System: mops.twse.com.twCHC website: www.Continental-holdings.com
CHC SpokespersonName: Kris Lin (Asst. Manager)Tel:(02)3701-2000Email:[email protected] Deputy SpokespersonName: Emily Liu (Vice President)Tel:(02)3701-2000Email:[email protected]
Continental Holdings CorporationAddress: No. 95 Dun Hua S. Road, Sec 2, Taipei, TaiwanTel: (02)3701-2000Website: http:// www. Continental-holdings.com
Members of Continental Holdings CorporationContinental Engineering CorporationAddress: No. 95 Dun Hua S. Road, Sec 2, Taipei, TaiwanTel: (02)3701-1000Website: http://www.continental-engineering.comContinental Development CorporationAddress: No. 95 Dun Hua S. Road, Sec 2, Taipei, TaiwanTel: (02)3701-3000Website: https://www.continental-propertydevelopment.comHDEC CorporationAddress: No. 95 Dun Hua S. Road, Sec 2, Taipei, TaiwanTel: (02)3701-5000Website: http:// www.hdec-corp.com
Common Share Transfer Agent and Registrar Company: The Transfer Agency Department of Taishin BankAddress: B1F., No. 96, Sec. 1, Jianguo N. Rd., Taipei City ,Taiwan, R.O.C. Tel: 02-2504-8125 Website: http://www.taishinbank.com.tw
Certified Public AccountantsAuditors: Chung-Che Chen, Ti- Nuan, ChienAuditors Company: KPMGAddress: 68F, No. 7, Xinyi Rd., Taipei City, Taiwan, R.O.C. Website: http://www.kpmg.com.tw Tel: 02-8101-6666
Public listings and securities trading in overseas stock exchanges: None
Note: The English version is a translation of Chinese version. If there is any discrepancy between the English version and Chinese version, the Chinese version shall prevail.
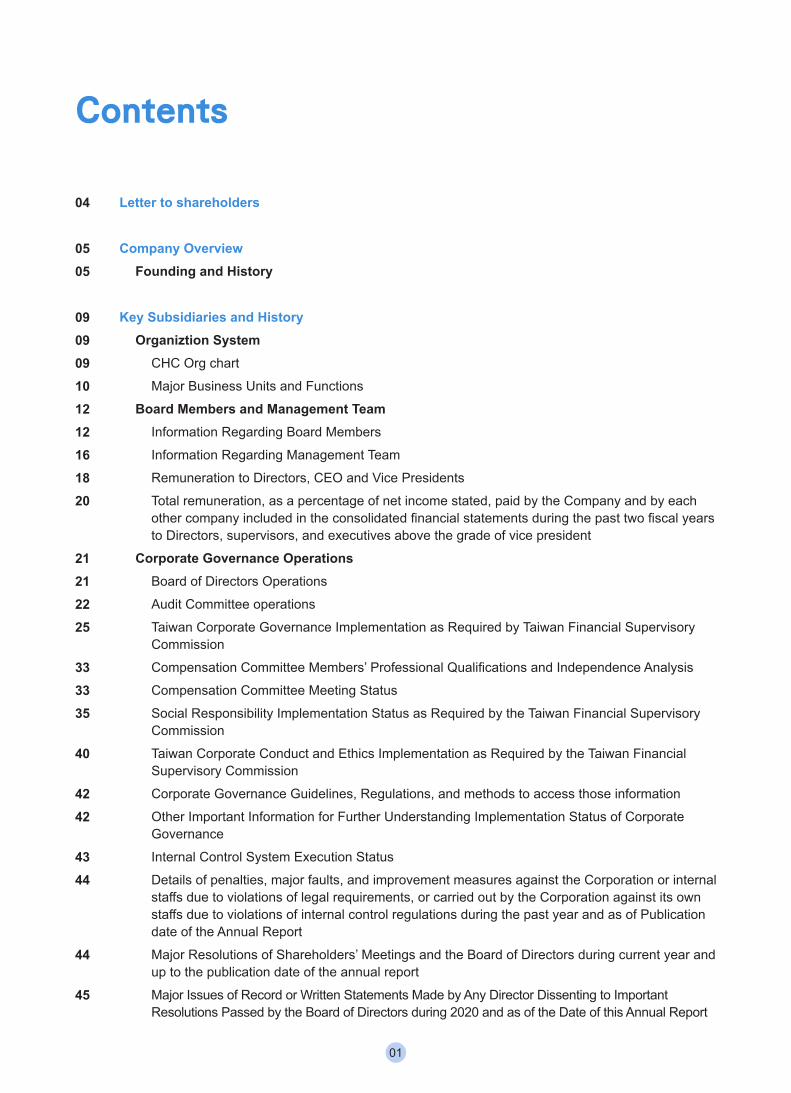
Contents
Letter to shareholders
Company OverviewFounding and History
Key Subsidiaries and HistoryOrganiztion System
CHC Org chart
Major Business Units and Functions
Board Members and Management TeamInformation Regarding Board Members
Information Regarding Management Team
Remuneration to Directors, CEO and Vice Presidents
Total remuneration, as a percentage of net income stated, paid by the Company and by each other company included in the consolidated financial statements during the past two fiscal years to Directors, supervisors, and executives above the grade of vice president
Corporate Governance OperationsBoard of Directors Operations
Audit Committee operations
Taiwan Corporate Governance Implementation as Required by Taiwan Financial Supervisory Commission
Compensation Committee Members’ Professional Qualifications and Independence Analysis
Compensation Committee Meeting Status
Social Responsibility Implementation Status as Required by the Taiwan Financial Supervisory Commission
Taiwan Corporate Conduct and Ethics Implementation as Required by the Taiwan Financial Supervisory Commission
Corporate Governance Guidelines, Regulations, and methods to access those information
Other Important Information for Further Understanding Implementation Status of Corporate Governance
Internal Control System Execution Status
Details of penalties, major faults, and improvement measures against the Corporation or internal staffs due to violations of legal requirements, or carried out by the Corporation against its own staffs due to violations of internal control regulations during the past year and as of Publication date of the Annual Report
Major Resolutions of Shareholders’ Meetings and the Board of Directors during current year and up to the publication date of the annual report
Major Issues of Record or Written Statements Made by Any Director Dissenting to Important Resolutions Passed by the Board of Directors during 2020 and as of the Date of this Annual Report
04
0505
090909101212161820
21212225
333335
40
4242
4344
44
45
01
Resignation or Dismissal of Chairman, President, and Heads of Accounting, Finance, Internal Audit, Corporate Governance Officer and R&D during 2019 and as of the Date of this Annual Report
Information on CPA Professional FeesReplacement of CPACHC’s Chairman, Chief Executive Officer, and Managers in Charge of Its Finance and Accounting Operations Did Not Hold Any Positions within TSMC’s Independent Audit Firm or Its Affiliates in the Most Recent YearNet Change in Shareholding by Directors, Management and Shareholders with 10% Shareholdings or MoreRelationship among the Top Ten ShareholdersThe total number of shares and total equity stake held in any single enterprise by the company, its directors, supervisors, managers, and any companies controlled either directly or indirectly by the Company
Capital OverviewCapital and Shares
Capitalization
Status of Shareholders
Distribution Profile of Share Ownership
Major Shareholders
Market Price, Net Worth, Earnings, and Dividends per Share
Dividend Policy and Distribution of Earnings
Impact to 2020 Business Performance and EPS Resulting from Stock Dividend Distribution
Remuneration to Directors and Compensation to Employees
Buyback of Common Stock
Corporate bond operationsPreferred SharesIssuance of Global Depositary ReceiptsStatus of Employee Stock Option PlanStatus of New Share Issuance in Connection with Mergers and AcquisitionsFinancing Plans and Implementation
Operational HighlightsBusiness activities
Business areas
Industry Overview
Overview of Technology and R&D
Long and Short-term Business Development Plans
Market and Sales OverviewMarket Analysis
Production Procedures of Main Products
45
464647
48
4950
5050505051515252535353545454545454
555555576060636365
02
Supply Status of Main Materials
Major customers in 2019 and 2020
Production in 2019 and 2020
Sales in 2019 and 2020
Employee InformationEnvironmental Protection ExpenditureLabor relationsWorkplace SafetyMaterial Contracts
Financial InformationCondensed Balance Sheet and Statement of Comprehensive IncomeFinancial AnalysisAudit Committee’s Review ReportIndependent Auditors’ ReportParent Company Only Financial Statements Independent Auditors’ ReportThe Impact of financial difficulties in the Company and its affiliates on the Company's financial situation
Review of Financial Conditions, Financial PerformanceFinancial StatusFinancial PerformanceCash Flow, and Impact of Recent Years Major Capital ExpendituresImpact Posed by Material Capital Expenditure to Finance/Business in the Most Recent YearThe investment policy for the most recent year, major causes for profits or losses thereof, corrective measures, and investment plans in the next yearAnalysis of Risk ManagementOther important Matters
Special items to be includedSummary of affiliated companiesPrivate Placement Securities in 2020 and as of the Date of this Annual ReportInformation on Shares Held or Sold by Subsidiaries in 2020 and the Date of this Annual Reportthe Necessary SupplementAny Events in 2020 and as of the Date of this Annual Report that Had Material Impacts on Shareholders’ Interests or Securities Prices as Stated in Item 3 Paragraph 2 of Article 36 of Securities and Exchange Law of Taiwan
666668686969707375
7979828587151189
190190191191192192
193195
196196205205
205205
03
Letter to shareholders
Continental Holdings Corp. (CHC), despite faced with the industry environment and society impacted by COVID-19 pandemic in 2020, saw all three main businesses of Civil & Building Construction, Real Estate Development, and Environmental Project Development with significant increase in net operating profit thanks to the efforts of all employees and the support from business partners. CHC’s consolidated revenues of NT$21,689 million was slightly lower than the 2019 result of NT$22,665 million but consolidated gross margin was 15.2%, better than the 2019 result of 12.1%; operating profit was NT$1,762 million, up 33% from 2019. Net profit after tax reached NT$1,539 million in 2020 for an EPS of NT$1.87. This represented a significant increase from the previous year where net profit after tax was NT$97 million and EPS was NT$0.12.
The Civil & Building Construction business has now accumulated a solid volume of backlog to meet revenue growth targets for the next few years. Major public sector projects now under construction include: “Taoyuan MRT Green Line GC01 Contract”, “Taoyuan MRT Green Line GC03 Contract”, and “Construction of Public Housing at Nangang Depot Site in Nangang District, Taipei City.” Future focus include railroad, high-class housing, and commercial building construction projects. We also continue evaluating the development of new markets, leveraging our core abilities and solid credentials in construction in order to expand new sectors of growth.
For the Real Estate Development business, “La Bella Vita” has been completed and started to settle in 2020. Presale projects “Drawing the Dream Life”, “Timeless and Modern Expression”, “Tianjin Street Project” and “Arranging New Asia Bay” all saw strong interests from market in 2020, and are expected to drive profit growth upon their completion in the future. In 2021, the Real Estate Development business is planning to launch four new residential projects, and the iconic project “Bountiful Journey” is also scheduled for completion in the second half of the year. Overseas developments in San Francisco, U.S.A and Kuala Lumpur, Malaysia, are expected to be completed in 2021 as well.
The Environmental Project Development business was awarded with “Tongluo Science Park Wastewater Treatment Plant Phase II EPC Project” and “Tainan City Anping Reclaimed Water Plant New Construction Turnkey DBO Project” in 2020, an expansion to the project portfolio. The Environmental Project Development business also supported the domestic water resource policy in regard to climate change. The Environmental Project Development business will not only continue to enhance its professional capabilities in water resource related businesses, but also appraise opportunities thoroughly and constantly in order to enter other environmental engineering sectors such as biomass energy and solid waste treatment.
CHC will continue to focus on managing subsidiaries, planning the Group’s business strategy, and coordinating Group resources. We have established the Corporate Social Responsibility Committee in 2020, dedicating more efforts on the environment, society and corporate governance. We are also committed properly responding to stakeholders’ expectations. Looking to the future, we will focus more on core businesses and enhancing enterprise value, as well as putting more effort on promoting corporate sustainability.
Chairman
04
Company Overview
Founding and HistoryContinental Holdings Corporation
Established: April 8, 2010Capitalization: NTD$8,232,160 thousands
Continental Holdings Corporation (CHC) is a publicly listed company on the Taiwan Stock Exchange (TWSE: 3703). Its member companies include Continental Engineering Corporation (CEC), Continental Development Corporation (CDC), and HDEC Corporation (HDEC); the business portfolio encompasses Civil and Building Construction, Real Estate Development, and Environmental Project Development.
CHC traces its roots back to 1945, when Mr. Glyn T. H. Ing founded CEC in Sichuan Province, China, following the Second World War. With the need for a separate entity to provide governance and strategy, CHC was incorporated in 2010 as CEC’s parent company, and was publicly listed on April 8th.
CHC is not only responsible for formulating development strategy of the group as a whole, but also for integrated synergy of group resources as well as oversight of subsidiaries. CHC pursues revenue and profit growth by utilizing core competencies while ensuring sustainability in all aspects of operation, such as corporate governance, talent development, community engagement, and maximizing business value for shareholders in a fast-changing global market.
Key Subsidiaries and HistoryContinental Engineering Corporation
Established: December 29, 1945Capitalization: NTD$4,400,621 thousands
CHC’s construction and engineering arm is Continental Engineering Corporation (CEC). Founded in 1945, CEC has built a reputation for delivering superior engineering and construction work in both public and private sectors, with a presence in Taiwan, Hong Kong, Macau, Malaysia, and India.
CEC has successfully completed many significant infrastructure projects, including major civil construction works involving viaducts, bridges, and tunnels for highway, metro, and railway projects. The company was also one of the principal consortium investors and contractors for the US$17 billion Taiwan High Speed Rail, one of the world’s largest Build, Operate, and Transfer (BOT) projects.
CEC has also delivered a comprehensive range of building projects, including hospitals, hotels, office buildings, multifunctional complexes, high-end residences, education and research facilities, as well as township communities.
05
Continental Development Corporation
Established: June 2, 2010Capitalization: NTD$5,907,670 thousands
Continental Development Corporation (CDC) has its roots in the property development business sector of Continental Engineer Corporation (CEC), Taiwan’s leading engineering construction company founded in 1945. In response to the fast-changing construction market, CEC was restructured in 2010, spinning off its property development business division to form an independent entity—CDC. Thereafter, CDC became a premium property developer, specializing in residential, commercial, hotel, and community sectors. The company’s business strategy centers on ensuring the highest quality and customer satisfaction.
Following the corporate values of “integrity, discipline, quality and innovation” conceived by CEC’s founder Mr. Glyn T. H. Ing, CDC is dedicated to cutting edge innovation and collaboration with the very best talent from across the globe to deliver outstanding solutions and services which cater to customers’ needs.
CDC has pioneered innovative architectural concepts and partnered with master architects to accomplish many landmark buildings including, Richard Meier (1984 Pritzker Architecture Prize laureate), Antonio Citterio (2008 Royal Designer for Industry, by the Royal Society for the Encouragement of Arts, Manufactures & Commerce of London), and Benedetta Tagliabue (designer of the Spanish Pavilion at the 2010 World Expo Shanghai). CDC currently holds investments in Taiwan, Southeast Asia, and the United States.
HDEC Corporation
Established: May 24, 2006Capitalization: NTD$1,978,000 thousands
HDEC Corporation (HDEC), originally a fully-owned subsidiary of Continental Engineering Corporation (CEC), was established in 2006. In an effort to boost the company’s competitiveness as well as enhance its financial and management synergies, CEC transferred all of its shares in HDEC to parent company Continental Holdings Corporation (CHC) through a series of mergers and acquisitions in July 2017, making HDEC a direct subsidiary of CHC.
HDEC inherited the environmental engineering technology and capabilities of CEC. The company has also leveraged CEC’s extensive engineering experience and project management ability to enter the emerging domestic market for environmental engineering. By bidding on local governments’ sewage system BOT projects and BTO projects for water reclamation and reuse, HDEC was able to demonstrate its comprehensive experience and capabilities in every phase from planning, design, construction, operation, and maintenance.
HDEC mainly focuses on waterworks such as sewage treatment and water purification projects, and extends to waste treatment and renewable energy projects. Currently HDEC has the following subsidiaries: HDEC Construction Corp., HDEC (Puding) Environment Corp., North Shore Corp., Blue Whale Corporation, HDEC-CTCI (Linhai) Corp., and CTCI-HDEC (Chungli) Corporation.
06
Recent Milestones2020 CEC and HDEC joint venture was awarded “Tongluo Science Park Wastewater Treatment Plant Phase II Project-
Functional Enhancement of Conductivity Treatment Facilities Turnkey Project.” CEC completed Contract CJ910 and CJ930 construction of the Taichung Metropolitan MRT System. CDC completed La Bella Vita, the landmark residential project located in the 7th Redevelopment Zone of
Taichung. CDC partnered with Japanese Daiwa House Group to launch Arranging New Asia Bay, a hotel-residential joint
development project, as its first foray into southern Taiwan. HDEC was awarded the “Tainan City Anping Reclaimed Water Plant New Construction Turnkey Project.”2019 HDEC completed phase II of “Fengshan River Wastewater Reclamation and Reuse BTO Project”, which is now
operational. CDC and Taipei Fullerton signed a joint construction agreement for Fullerton Taipei Nanjing, the first-ever
reconstruction and renewal of unsafe and old hotel project in Taiwan. CEC-led joint venture was awarded “Taoyuan MRT Green Line Contract GC03 - Underground Civil Turnkey
Project.” CEC-led joint venture was awarded “Taipei Nangang Depot Public Housing Design and Build Project.” CEC was awarded “Contract G506 - Construction of Station Square at Kai Tak Phase 1” in Hong Kong. CDC partnered with Daiwa House Group, a Japanese company, for CDC’s first property investments in
Kaohsiung.2018 CEC was awarded “Taoyuan MRT Green Line Contract GC01 - Elevated Viaduct Civil Turnkey Project.” CDC invested in Bangsar Rising Sdn. Bhd. to develop high-end residential properties in Kuala Lumpur. HDEC was awarded “Linhai Wastewater Treatment Plant and Reclaimed Water BTO Project, Kaohsiung City”2017 CEC was awarded “Tainan Urban District Railway Underground Project” and “Guanci Po-Ai Park Public Housing
Development Project”. CEC was awarded “Contract C214 - South Tainan Station section of the Tainan Railway Underground Project” HDEC became BOT contractor for CTCI-HDEC (Chungli) Corporation’s Chungli Area Sewerage System BOT
Project. HDEC became the contractor for HDEC (Puding) Environmental Corporation’s “Public Sewerage System Design
and Build Turnkey Project.” CDC established CDC US Corporation as its US subsidiary for investing in the development of hotels and high-
end residential properties in San Francisco. HDEC was spun-off from CEC to become a 100% CHC-owned subsidiary.2016 HDEC was awarded contract for “Promotion of Private Participation: Puding Area Sewerage System BOT
Project” HDEC was awarded contract for “Promotion of Private Participation: Fengshan River Wastewater Reclamation
and Reuse BTO Project, Kaohsiung City” HDEC was awarded contract for “Promotion of Private Participation: Chungli Area Sewerage System BOT
Project” CEC was awarded contract for CQ840 section of Taipei MRT Wanda-Zhonghe-Shulin Line. CEC was awarded contract for CQ850A section of Taipei MRT Wanda-Zhonghe-Shulin Line.2015 CEC celebrates its 70th anniversary CEC was awarded contract for Kai Tak Development – Stage 2 Infrastructure Works in Hong Kong. CEC was awarded contract for the Liantang/Heung Yuen Wai Boundary Control Point and associated works-
Contract 6, by the HK SAR Government. CEC was awarded contracts for the Noida-Greater Noida Metro Project in India. CDC invested in Grand River D. Ltd. to take part in the Xinyi A7 - Sky Tower development.2014 CEC was awarded contract for CQ842 section of Taipei MRT Wanda-Zhonghe-Shulin Line. CEC received Taipei City’s Distinguished Public Construction Award for the Taipei Metro Xinyi Line (Project
CR580A). The project included the Daan Forest Park Station and Daan Station, underground tunnel connecting the east side of the Dongmen Station and the west side of the Xinyi-Anhe Station, and common conduits.
CEC was awarded contracts for the C2 Renshui Tunnel of the Suhua Highway Mountain Section Improvement Project, and a residential building project at the site of the former Jingmei Financial Training Center.
07

CEC was awarded contract for the CM01 section of the project for connecting Taiwan Taoyuan International Airport to the MRT system and extension to Zhongli TRA Station.
CDC entered the Malaysian market by securing a majority stake in MEGA CAPITAL DEVELOPMENT SDN. BHD. Mega Capital Development Sdn. Bhd. to develop serviced apartments in Kuala Lumpur.
2013 CEC was awarded contract for Jaipur Metro in Rajasthan, India. CEC was awarded a Civil Construction Project Contract in New Delhi, India. CEC was awarded contract for CJ930 section of Taipei MRT by the Central District Office, Department of Rapid
Transit Systems, Taipei City Government. CDC Taichung Office established as part of business expansion to Central Taiwan.2012 CEC was awarded tunnel construction contract for Klang Valley MRT, Malaysia. CEC was awarded contract for CJ910 section of Taipei MRT by the Central District Office, Department of Rapid
Transit Systems, Taipei City Government. CEC was awarded electrical and mechanical construction contract for the National Convention and Exhibition
Center (Nangang Exhibition Hall Expansion). CEC was awarded contract for “Widening of Tin Ha Road and Tan Kwai Tsuen Road” by Civil Engineering and
Development Department, HK SAR Government. CEC was awarded contract for “Upgrading of Mui Wo Sewage Treatment Works and Village Sewerage at Wang
Tong and Yue Kwong Chuen” in Hong Kong. CEC established a subsidiary, CEC International Malaysia Sdn. Bhd (CIMY). CEC was awarded contract for “Macau Light Rail Project Phase 1 - C360 Cotai Section” by Macau SAR
Government. CEC and its subsidiary, CICI, formed a joint venture to win the Delhi Metro Railway Project Contract (CC04) in
India.2011 HDEC was awarded EPC contract for Chinchu Water Treatment Plant by Taiwan Water Corporation. CEC was awarded contract for Stonecutter Island Sewage Treatment Works Effluent Tunnel and Disinfection
Facilities, Hong Kong.2010 CHC became parent company of CEC with a 100% stake through a one-to-one share swap. CDC was spun off from CEC Real Estate Development Business Sector to become a 100% CHC-owned
subsidiary. CEC was awarded contract for section CL-314 for civil construction project from Shanli Tunnel to Taitung Railway
Station by Taiwan Railway Administration. CEC was awarded contract for metro tunnel construction project (BMR-UG02) in Bangalore, India.
08
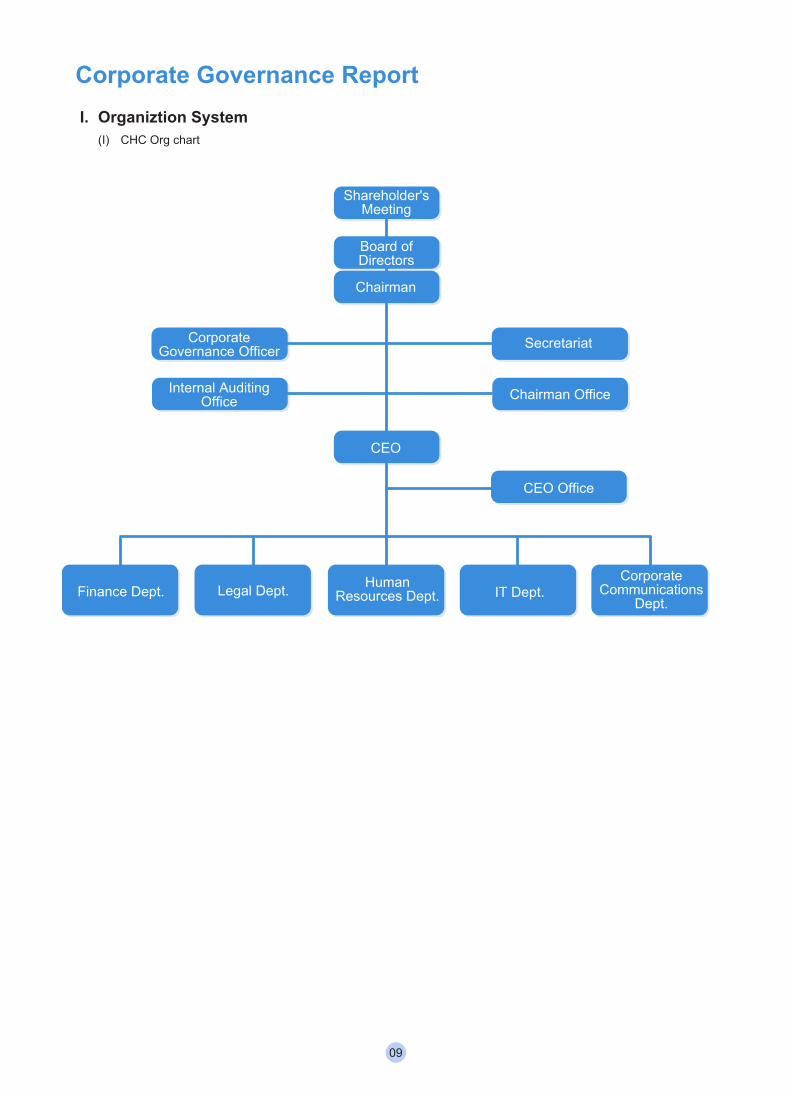
Corporate Governance Report I. Organiztion System
(I) CHC Org chart
Board ofDirectors
Shareholder'sMeeting
CorporateGovernance Officer
Internal AuditingOffice
Chairman
CEO
Secretariat
Chairman Office
CEO Office
Finance Dept. Legal Dept. HumanResources Dept. IT Dept.
CorporateCommunications
Dept.
09
(II) Major Business Units and Functions1. Corporate Governance Officer
To supervise Corporate Governance matters, support the Board members to carry out their duties and strengthen the Board function.
2. Secretariat(1) Planning and managing of Board and functional committee meetings. It also provides and supports the
Directors with the resources to perform their duties.(2) Managing the board meetings at tier-1 member companies including CEC, CDC and HDEC.(3) Planning, preparation and proceedings of shareholders’ meetings.(4) Assist with the planning and execution of disclosure activities.(5) Assist with the planning of corporate governance-related matters.
3. Chairman OfficeThe administrative staff of the Chairman.
4. Internal Auditing Office(1) Assist the Board of Directors and executives to ensure due diligence on internal controls.(2) Inspect and review deficiencies in the Company’s internal control systems, measure business
performance and efficiency, and provide recommendations on improvements when appropriate.
5. CEO OfficeThe administrative staff of the CEO.
6. Finance Department(1) Planning and execution of the Group’s financial strategies to increase shareholder returns while keeping
the Group’s financial and taxation risk to an appropriate level.(2) Provide the Group with timely and accurate financial information as well as collate and track budget
spending to facilitate business decision-making and operational management.(3) Prepare statutory financial and taxation reports in accordance with laws and regulations governing listed
companies.(4) Manage investor relations.(5) Assist with promoting CSR initiatives, and prepare CSR reports
10
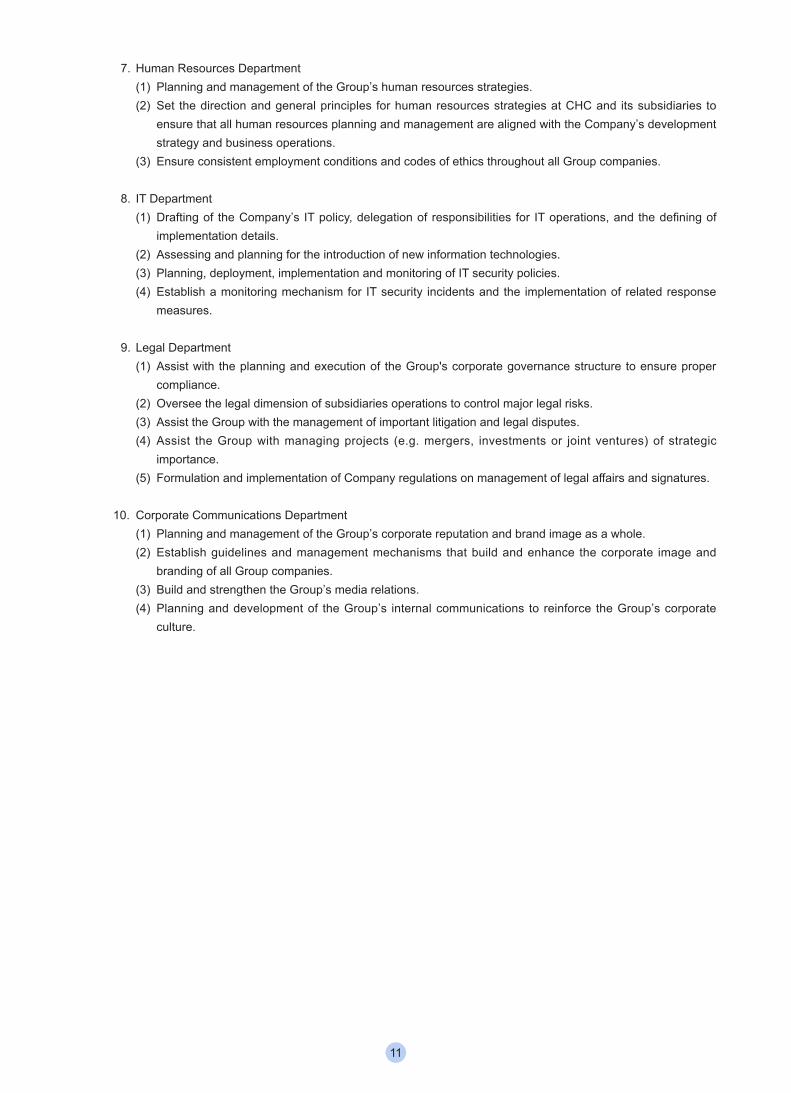
7. Human Resources Department(1) Planning and management of the Group’s human resources strategies.(2) Set the direction and general principles for human resources strategies at CHC and its subsidiaries to
ensure that all human resources planning and management are aligned with the Company’s development strategy and business operations.
(3) Ensure consistent employment conditions and codes of ethics throughout all Group companies.
8. IT Department(1) Drafting of the Company’s IT policy, delegation of responsibilities for IT operations, and the defining of
implementation details.(2) Assessing and planning for the introduction of new information technologies.(3) Planning, deployment, implementation and monitoring of IT security policies.(4) Establish a monitoring mechanism for IT security incidents and the implementation of related response
measures.
9. Legal Department(1) Assist with the planning and execution of the Group's corporate governance structure to ensure proper
compliance.(2) Oversee the legal dimension of subsidiaries operations to control major legal risks.(3) Assist the Group with the management of important litigation and legal disputes.(4) Assist the Group with managing projects (e.g. mergers, investments or joint ventures) of strategic
importance.(5) Formulation and implementation of Company regulations on management of legal affairs and signatures.
10. Corporate Communications Department(1) Planning and management of the Group’s corporate reputation and brand image as a whole.(2) Establish guidelines and management mechanisms that build and enhance the corporate image and
branding of all Group companies.(3) Build and strengthen the Group’s media relations.(4) Planning and development of the Group’s internal communications to reinforce the Group’s corporate
culture.
11

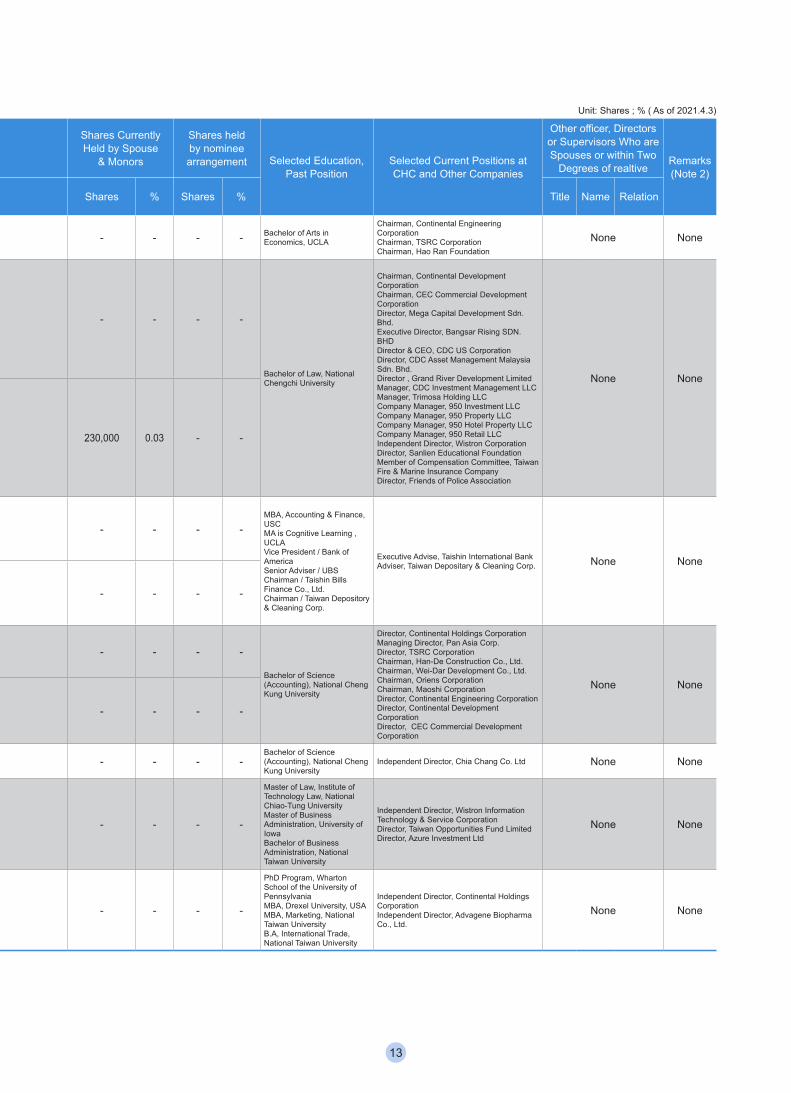
II. Board Members and Management Team( I ) Information Regarding Board Members
Unit: Shares ; % ( As of 2021.4.3)
Title Name GenderNationality or Place of registration
Date Elected
Tenure of
Office(Year)
Date First Elected
Shares Held When Elected Share Currently Held
Shares Currently Held by Spouse
& Monors
Shares held by nominee arrangement Selected Education,
Past PositionSelected Current Positions at CHC and Other Companies
Other officer, Directors or Supervisors Who are Spouses or within Two
Degrees of realtiveRemarks(Note 2)
Shares % Shares % Shares % Shares % Title Name Relation
Chairman Nita Ing Female R.O.C 2018.6.5 3 2009.11.2 903,298 0.11 903,298 0.11 - - - - Bachelor of Arts in Economics, UCLA
Chairman, Continental Engineering CorporationChairman, TSRC CorporationChairman, Hao Ran Foundation
None None
Director
Christopher ChangRepresentative of
Wei-Dar Development Co., Ltd
R.O.C 2018.6.5 3 2009.11.2 160,525,200 19.50 206,025,200 25.03 - - - -
Bachelor of Law, National Chengchi University
Chairman, Continental Development CorporationChairman, CEC Commercial Development CorporationDirector, Mega Capital Development Sdn. Bhd.Executive Director, Bangsar Rising SDN. BHDDirector & CEO, CDC US CorporationDirector, CDC Asset Management Malaysia Sdn. Bhd. Director , Grand River Development LimitedManager, CDC Investment Management LLCManager, Trimosa Holding LLC Company Manager, 950 Investment LLC Company Manager, 950 Property LLC Company Manager, 950 Hotel Property LLC Company Manager, 950 Retail LLC Independent Director, Wistron CorporationDirector, Sanlien Educational FoundationMember of Compensation Committee, Taiwan Fire & Marine Insurance CompanyDirector, Friends of Police Association
None None
Male R.O.C 2018.6.5 3 2009.11.2 - - - - 230,000 0.03 - -
Director
Helena KuoRepresentative of
Wei-Dar Development Co., Ltd
R.O.C 2018.6.5 3 2009.11.2 160,525.200 19.50 206,025,200 25.03 - - - -MBA, Accounting & Finance, USCMA is Cognitive Learning , UCLAVice President / Bank of AmericaSenior Adviser / UBSChairman / Taishin Bills Finance Co., Ltd. Chairman / Taiwan Depository & Cleaning Corp.
Executive Advise, Taishin International BankAdviser, Taiwan Depositary & Cleaning Corp. None None
Female R.O.C 2018.6.5 3 2009.11.2 - - - - - - - -
Director
John Huang Representative of
Han-De Construction Co., Ltd.
R.O.C 2018.6.5 3 2015.5.22 63,755,667 7.74 63,755,667 7.74 - - - -
Bachelor of Science (Accounting), National Cheng Kung University
Director, Continental Holdings Corporation Managing Director, Pan Asia Corp.Director, TSRC CorporationChairman, Han-De Construction Co., Ltd.Chairman, Wei-Dar Development Co., Ltd.Chairman, Oriens CorporationChairman, Maoshi CorporationDirector, Continental Engineering Corporation Director, Continental Development CorporationDirector, CEC Commercial Development Corporation
None None
Male R.O.C 2018.6.5 3 2018.6.5 - - - - - - - -
Independent Director
Donny Kao Male R.O.C 2018.6.5 3 2010.6.29 - - - - - - - -Bachelor of Science (Accounting), National Cheng Kung University
Independent Director, Chia Chang Co. Ltd None None
Independent Director
Frank Juang Male R.O.C 2018.6.5 3 2015.5.22 - - - - - - - -
Master of Law, Institute of Technology Law, National Chiao-Tung UniversityMaster of Business Administration, University of IowaBachelor of Business Administration, National Taiwan University
Independent Director, Wistron Information Technology & Service CorporationDirector, Taiwan Opportunities Fund LimitedDirector, Azure Investment Ltd
None None
Independent Director
Allen Lee Male R.O.C 2018.6.5 3 2015.5.22 - - - - - - - -
PhD Program, Wharton School of the University of PennsylvaniaMBA, Drexel University, USA MBA, Marketing, National Taiwan UniversityB.A, International Trade, National Taiwan University
Independent Director, Continental Holdings CorporationIndependent Director, Advagene Biopharma Co., Ltd.
None None
Note 1: Director as the legal representative, the major shareholder of institutional shareholder on page. 14Note 2: Chairman and CEO are not the same person.Note 3: CHC's Directors did not hold and Positions within the company's independent audit firm or its Affiliates.
12
II. Board Members and Management Team( I ) Information Regarding Board Members
Unit: Shares ; % ( As of 2021.4.3)
Title Name GenderNationality or Place of registration
Date Elected
Tenure of
Office(Year)
Date First Elected
Shares Held When Elected Share Currently Held
Shares Currently Held by Spouse
& Monors
Shares held by nominee arrangement Selected Education,
Past PositionSelected Current Positions at CHC and Other Companies
Other officer, Directors or Supervisors Who are Spouses or within Two
Degrees of realtiveRemarks(Note 2)
Shares % Shares % Shares % Shares % Title Name Relation
Chairman Nita Ing Female R.O.C 2018.6.5 3 2009.11.2 903,298 0.11 903,298 0.11 - - - - Bachelor of Arts in Economics, UCLA
Chairman, Continental Engineering CorporationChairman, TSRC CorporationChairman, Hao Ran Foundation
None None
Director
Christopher ChangRepresentative of
Wei-Dar Development Co., Ltd
R.O.C 2018.6.5 3 2009.11.2 160,525,200 19.50 206,025,200 25.03 - - - -
Bachelor of Law, National Chengchi University
Chairman, Continental Development CorporationChairman, CEC Commercial Development CorporationDirector, Mega Capital Development Sdn. Bhd.Executive Director, Bangsar Rising SDN. BHDDirector & CEO, CDC US CorporationDirector, CDC Asset Management Malaysia Sdn. Bhd. Director , Grand River Development LimitedManager, CDC Investment Management LLCManager, Trimosa Holding LLC Company Manager, 950 Investment LLC Company Manager, 950 Property LLC Company Manager, 950 Hotel Property LLC Company Manager, 950 Retail LLC Independent Director, Wistron CorporationDirector, Sanlien Educational FoundationMember of Compensation Committee, Taiwan Fire & Marine Insurance CompanyDirector, Friends of Police Association
None None
Male R.O.C 2018.6.5 3 2009.11.2 - - - - 230,000 0.03 - -
Director
Helena KuoRepresentative of
Wei-Dar Development Co., Ltd
R.O.C 2018.6.5 3 2009.11.2 160,525.200 19.50 206,025,200 25.03 - - - -MBA, Accounting & Finance, USCMA is Cognitive Learning , UCLAVice President / Bank of AmericaSenior Adviser / UBSChairman / Taishin Bills Finance Co., Ltd. Chairman / Taiwan Depository & Cleaning Corp.
Executive Advise, Taishin International BankAdviser, Taiwan Depositary & Cleaning Corp. None None
Female R.O.C 2018.6.5 3 2009.11.2 - - - - - - - -
Director
John Huang Representative of
Han-De Construction Co., Ltd.
R.O.C 2018.6.5 3 2015.5.22 63,755,667 7.74 63,755,667 7.74 - - - -
Bachelor of Science (Accounting), National Cheng Kung University
Director, Continental Holdings Corporation Managing Director, Pan Asia Corp.Director, TSRC CorporationChairman, Han-De Construction Co., Ltd.Chairman, Wei-Dar Development Co., Ltd.Chairman, Oriens CorporationChairman, Maoshi CorporationDirector, Continental Engineering Corporation Director, Continental Development CorporationDirector, CEC Commercial Development Corporation
None None
Male R.O.C 2018.6.5 3 2018.6.5 - - - - - - - -
Independent Director
Donny Kao Male R.O.C 2018.6.5 3 2010.6.29 - - - - - - - -Bachelor of Science (Accounting), National Cheng Kung University
Independent Director, Chia Chang Co. Ltd None None
Independent Director
Frank Juang Male R.O.C 2018.6.5 3 2015.5.22 - - - - - - - -
Master of Law, Institute of Technology Law, National Chiao-Tung UniversityMaster of Business Administration, University of IowaBachelor of Business Administration, National Taiwan University
Independent Director, Wistron Information Technology & Service CorporationDirector, Taiwan Opportunities Fund LimitedDirector, Azure Investment Ltd
None None
Independent Director
Allen Lee Male R.O.C 2018.6.5 3 2015.5.22 - - - - - - - -
PhD Program, Wharton School of the University of PennsylvaniaMBA, Drexel University, USA MBA, Marketing, National Taiwan UniversityB.A, International Trade, National Taiwan University
Independent Director, Continental Holdings CorporationIndependent Director, Advagene Biopharma Co., Ltd.
None None
Note 1: Director as the legal representative, the major shareholder of institutional shareholder on page. 14Note 2: Chairman and CEO are not the same person.Note 3: CHC's Directors did not hold and Positions within the company's independent audit firm or its Affiliates.
13
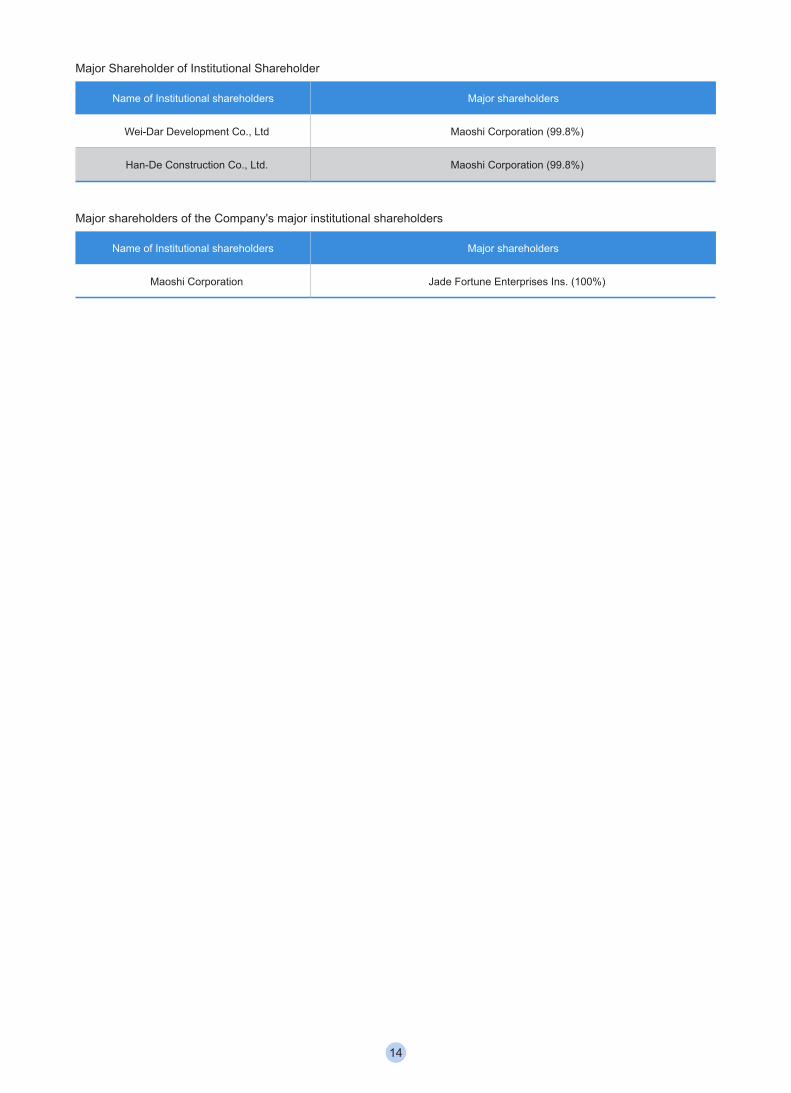
Major Shareholder of Institutional Shareholder
Name of Institutional shareholders Major shareholders
Wei-Dar Development Co., Ltd Maoshi Corporation (99.8%)
Han-De Construction Co., Ltd. Maoshi Corporation (99.8%)
Major shareholders of the Company's major institutional shareholders
Name of Institutional shareholders Major shareholders
Maoshi Corporation Jade Fortune Enterprises Ins. (100%)
14
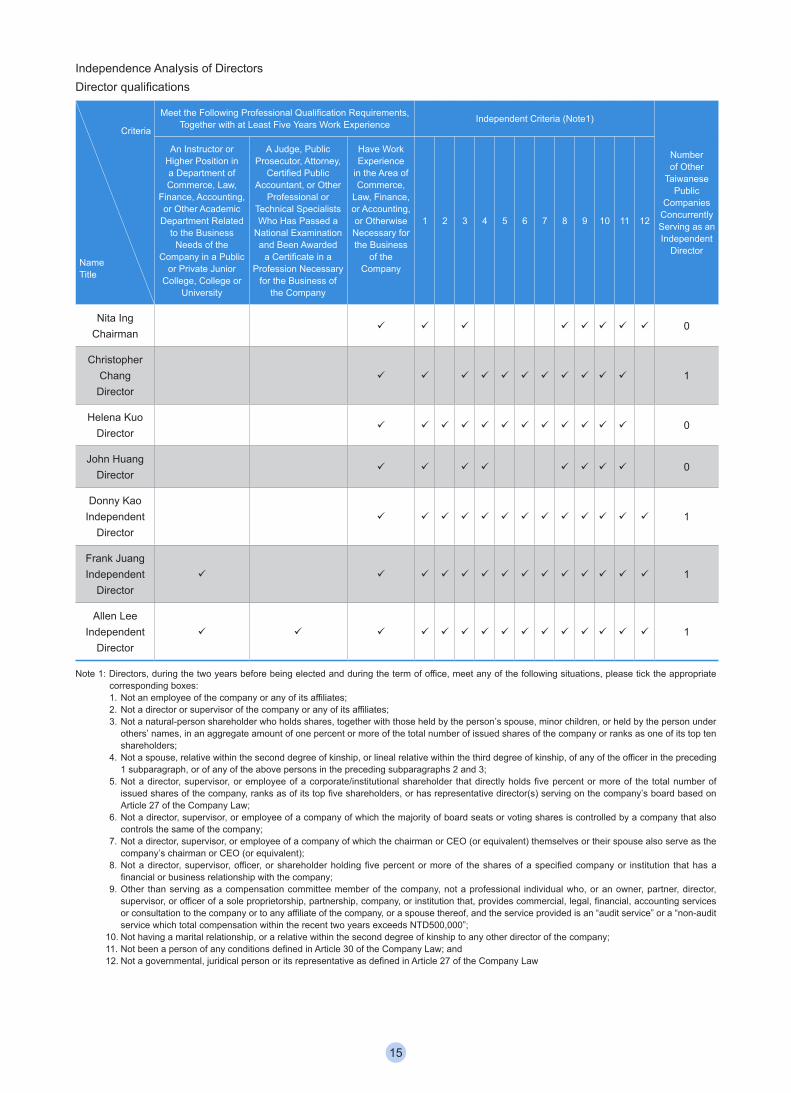
Independence Analysis of Directors Director qualifications
Criteria
NameTitle
Meet the Following Professional Qualification Requirements, Together with at Least Five Years Work Experience Independent Criteria (Note1)
Number of Other
Taiwanese Public
Companies Concurrently Serving as an Independent
Director
An Instructor or Higher Position in a Department of Commerce, Law,
Finance, Accounting, or Other Academic
Department Related to the Business
Needs of the Company in a Public
or Private Junior College, College or
University
A Judge, Public Prosecutor, Attorney,
Certified Public Accountant, or Other
Professional or Technical Specialists Who Has Passed a
National Examination and Been Awarded
a Certificate in a Profession Necessary
for the Business of the Company
Have Work Experience
in the Area of Commerce,
Law, Finance, or Accounting, or Otherwise Necessary for the Business
of the Company
1 2 3 4 5 6 7 8 9 10 11 12
Nita Ing Chairman
0
Christopher ChangDirector
1
Helena Kuo Director
0
John Huang Director
0
Donny Kao Independent
Director 1
Frank Juang Independent
Director 1
Allen Lee Independent
Director 1
Note 1: Directors, during the two years before being elected and during the term of office, meet any of the following situations, please tick the appropriate corresponding boxes:1. Not an employee of the company or any of its affiliates;2. Not a director or supervisor of the company or any of its affiliates; 3. Not a natural-person shareholder who holds shares, together with those held by the person’s spouse, minor children, or held by the person under
others’ names, in an aggregate amount of one percent or more of the total number of issued shares of the company or ranks as one of its top ten shareholders;
4. Not a spouse, relative within the second degree of kinship, or lineal relative within the third degree of kinship, of any of the officer in the preceding 1 subparagraph, or of any of the above persons in the preceding subparagraphs 2 and 3;
5. Not a director, supervisor, or employee of a corporate/institutional shareholder that directly holds five percent or more of the total number of issued shares of the company, ranks as of its top five shareholders, or has representative director(s) serving on the company’s board based on Article 27 of the Company Law;
6. Not a director, supervisor, or employee of a company of which the majority of board seats or voting shares is controlled by a company that also controls the same of the company;
7. Not a director, supervisor, or employee of a company of which the chairman or CEO (or equivalent) themselves or their spouse also serve as the company’s chairman or CEO (or equivalent);
8. Not a director, supervisor, officer, or shareholder holding five percent or more of the shares of a specified company or institution that has a financial or business relationship with the company;
9. Other than serving as a compensation committee member of the company, not a professional individual who, or an owner, partner, director, supervisor, or officer of a sole proprietorship, partnership, company, or institution that, provides commercial, legal, financial, accounting services or consultation to the company or to any affiliate of the company, or a spouse thereof, and the service provided is an “audit service” or a “non-audit service which total compensation within the recent two years exceeds NTD500,000”;
10. Not having a marital relationship, or a relative within the second degree of kinship to any other director of the company; 11. Not been a person of any conditions defined in Article 30 of the Company Law; and 12. Not a governmental, juridical person or its representative as defined in Article 27 of the Company Law
15
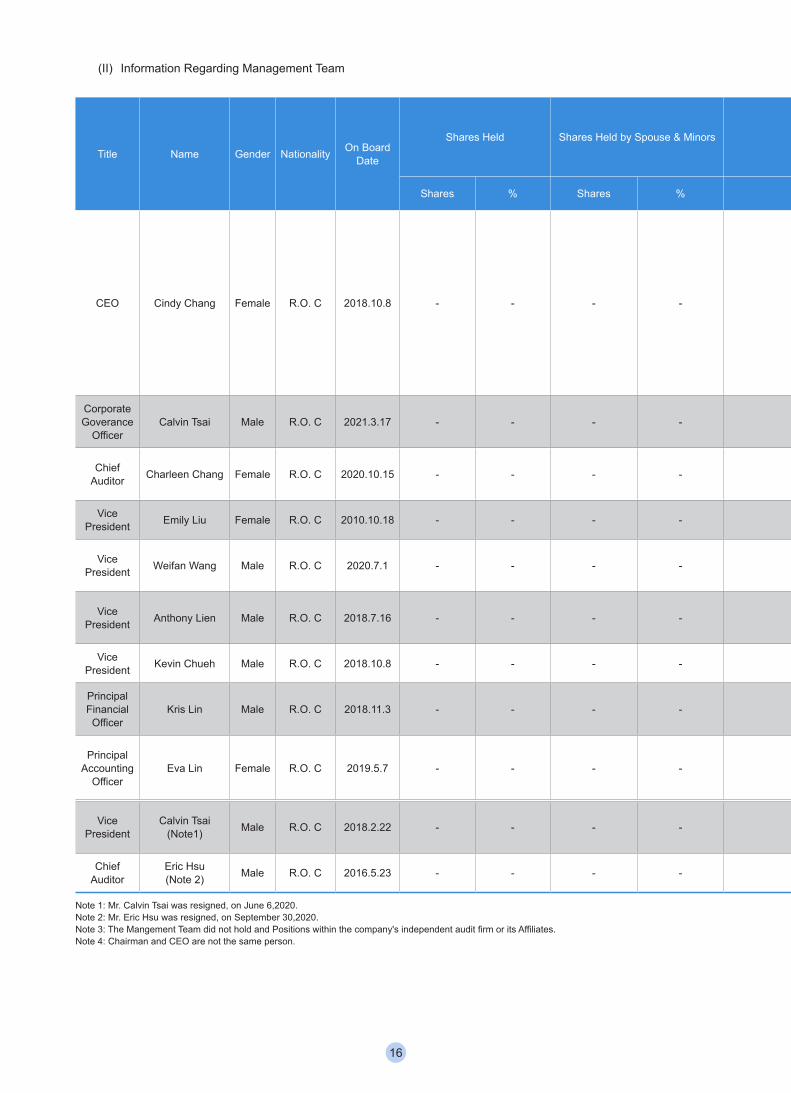
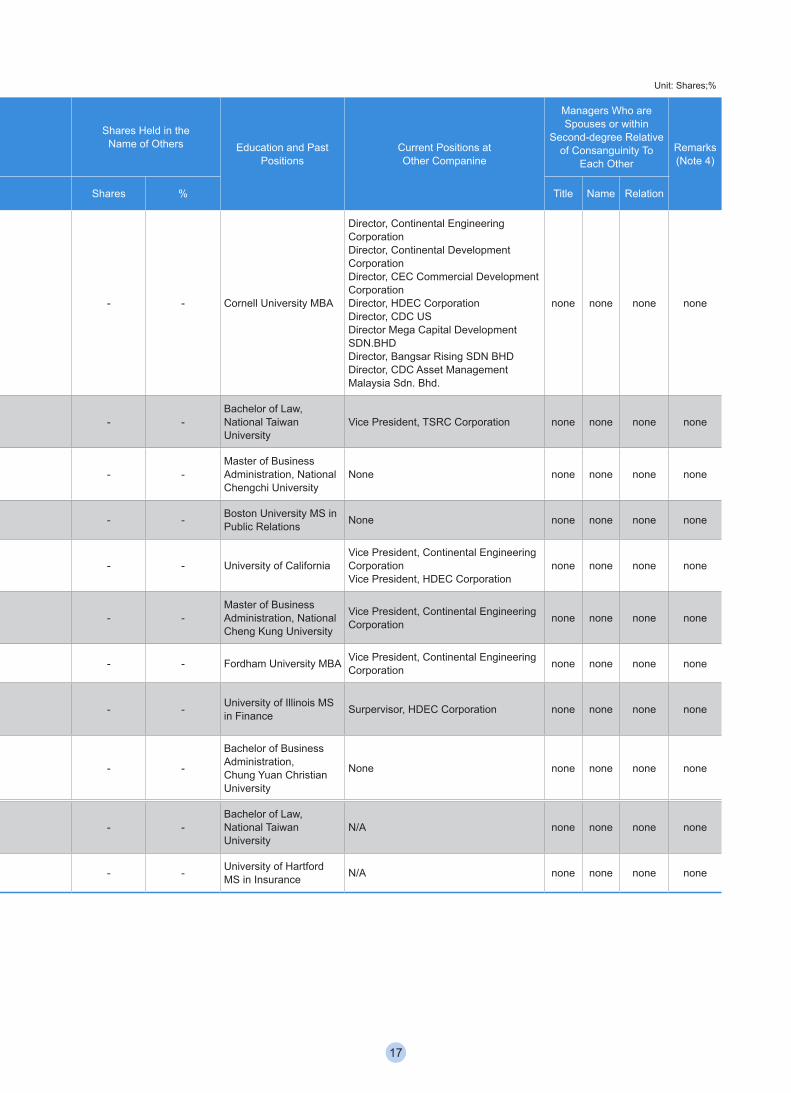
(II) Information Regarding Management TeamUnit: Shares;%
Title Name Gender Nationality On Board Date
Shares Held Shares Held by Spouse & Minors Shares Held in the Name of Others Education and Past
PositionsCurrent Positions at Other Companine
Managers Who are Spouses or within
Second-degree Relative of Consanguinity To
Each OtherRemarks (Note 4)
Shares % Shares % Shares % Title Name Relation
CEO Cindy Chang Female R.O. C 2018.10.8 - - - - - - Cornell University MBA
Director, Continental Engineering CorporationDirector, Continental Development CorporationDirector, CEC Commercial Development CorporationDirector, HDEC CorporationDirector, CDC USDirector Mega Capital Development SDN.BHDDirector, Bangsar Rising SDN BHD Director, CDC Asset Management Malaysia Sdn. Bhd.
none none none none
Corporate Goverance
OfficerCalvin Tsai Male R.O. C 2021.3.17 - - - - - -
Bachelor of Law, National Taiwan University
Vice President, TSRC Corporation none none none none
Chief Auditor Charleen Chang Female R.O. C 2020.10.15 - - - - - -
Master of Business Administration, National Chengchi University
None none none none none
Vice President Emily Liu Female R.O. C 2010.10.18 - - - - - - Boston University MS in
Public Relations None none none none none
Vice President Weifan Wang Male R.O. C 2020.7.1 - - - - - - University of California
Vice President, Continental Engineering CorporationVice President, HDEC Corporation
none none none none
Vice President Anthony Lien Male R.O. C 2018.7.16 - - - - - -
Master of Business Administration, National Cheng Kung University
Vice President, Continental Engineering Corporation none none none none
Vice President Kevin Chueh Male R.O. C 2018.10.8 - - - - - - Fordham University MBA Vice President, Continental Engineering
Corporation none none none none
Principal Financial Officer
Kris Lin Male R.O. C 2018.11.3 - - - - - - University of Illinois MS in Finance Surpervisor, HDEC Corporation none none none none
Principal Accounting
OfficerEva Lin Female R.O. C 2019.5.7 - - - - - -
Bachelor of Business Administration, Chung Yuan Christian University
None none none none none
Vice President
Calvin Tsai(Note1) Male R.O. C 2018.2.22 - - - - - -
Bachelor of Law, National Taiwan University
N/A none none none none
Chief Auditor
Eric Hsu(Note 2) Male R.O. C 2016.5.23 - - - - - - University of Hartford
MS in Insurance N/A none none none none
Note 1: Mr. Calvin Tsai was resigned, on June 6,2020.Note 2: Mr. Eric Hsu was resigned, on September 30,2020.Note 3: The Mangement Team did not hold and Positions within the company's independent audit firm or its Affiliates.Note 4: Chairman and CEO are not the same person.
16
(II) Information Regarding Management TeamUnit: Shares;%
Title Name Gender Nationality On Board Date
Shares Held Shares Held by Spouse & Minors Shares Held in the Name of Others Education and Past
PositionsCurrent Positions at Other Companine
Managers Who are Spouses or within
Second-degree Relative of Consanguinity To
Each OtherRemarks (Note 4)
Shares % Shares % Shares % Title Name Relation
CEO Cindy Chang Female R.O. C 2018.10.8 - - - - - - Cornell University MBA
Director, Continental Engineering CorporationDirector, Continental Development CorporationDirector, CEC Commercial Development CorporationDirector, HDEC CorporationDirector, CDC USDirector Mega Capital Development SDN.BHDDirector, Bangsar Rising SDN BHD Director, CDC Asset Management Malaysia Sdn. Bhd.
none none none none
Corporate Goverance
OfficerCalvin Tsai Male R.O. C 2021.3.17 - - - - - -
Bachelor of Law, National Taiwan University
Vice President, TSRC Corporation none none none none
Chief Auditor Charleen Chang Female R.O. C 2020.10.15 - - - - - -
Master of Business Administration, National Chengchi University
None none none none none
Vice President Emily Liu Female R.O. C 2010.10.18 - - - - - - Boston University MS in
Public Relations None none none none none
Vice President Weifan Wang Male R.O. C 2020.7.1 - - - - - - University of California
Vice President, Continental Engineering CorporationVice President, HDEC Corporation
none none none none
Vice President Anthony Lien Male R.O. C 2018.7.16 - - - - - -
Master of Business Administration, National Cheng Kung University
Vice President, Continental Engineering Corporation none none none none
Vice President Kevin Chueh Male R.O. C 2018.10.8 - - - - - - Fordham University MBA Vice President, Continental Engineering
Corporation none none none none
Principal Financial Officer
Kris Lin Male R.O. C 2018.11.3 - - - - - - University of Illinois MS in Finance Surpervisor, HDEC Corporation none none none none
Principal Accounting
OfficerEva Lin Female R.O. C 2019.5.7 - - - - - -
Bachelor of Business Administration, Chung Yuan Christian University
None none none none none
Vice President
Calvin Tsai(Note1) Male R.O. C 2018.2.22 - - - - - -
Bachelor of Law, National Taiwan University
N/A none none none none
Chief Auditor
Eric Hsu(Note 2) Male R.O. C 2016.5.23 - - - - - - University of Hartford
MS in Insurance N/A none none none none
Note 1: Mr. Calvin Tsai was resigned, on June 6,2020.Note 2: Mr. Eric Hsu was resigned, on September 30,2020.Note 3: The Mangement Team did not hold and Positions within the company's independent audit firm or its Affiliates.Note 4: Chairman and CEO are not the same person.
17
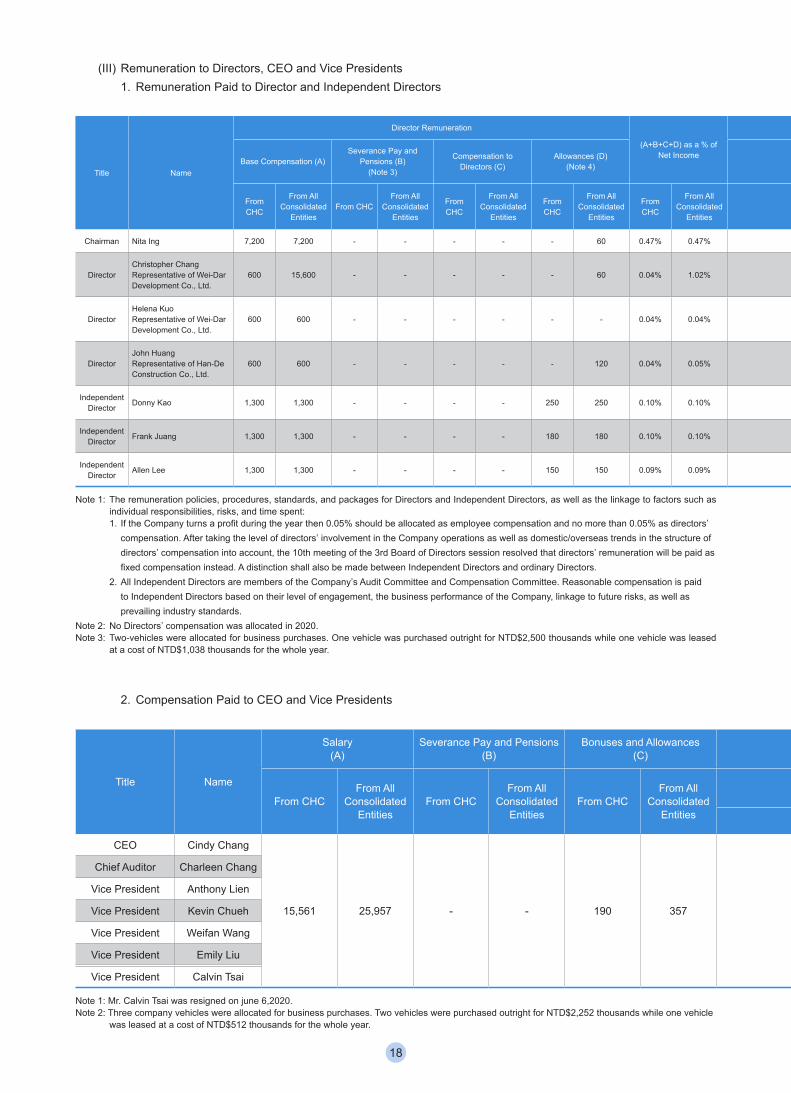
(III) Remuneration to Directors, CEO and Vice Presidents1. Remuneration Paid to Director and Independent Directors
Unit: NT$ thousands
Title Name
Director Remuneration
(A+B+C+D) as a % of Net Income
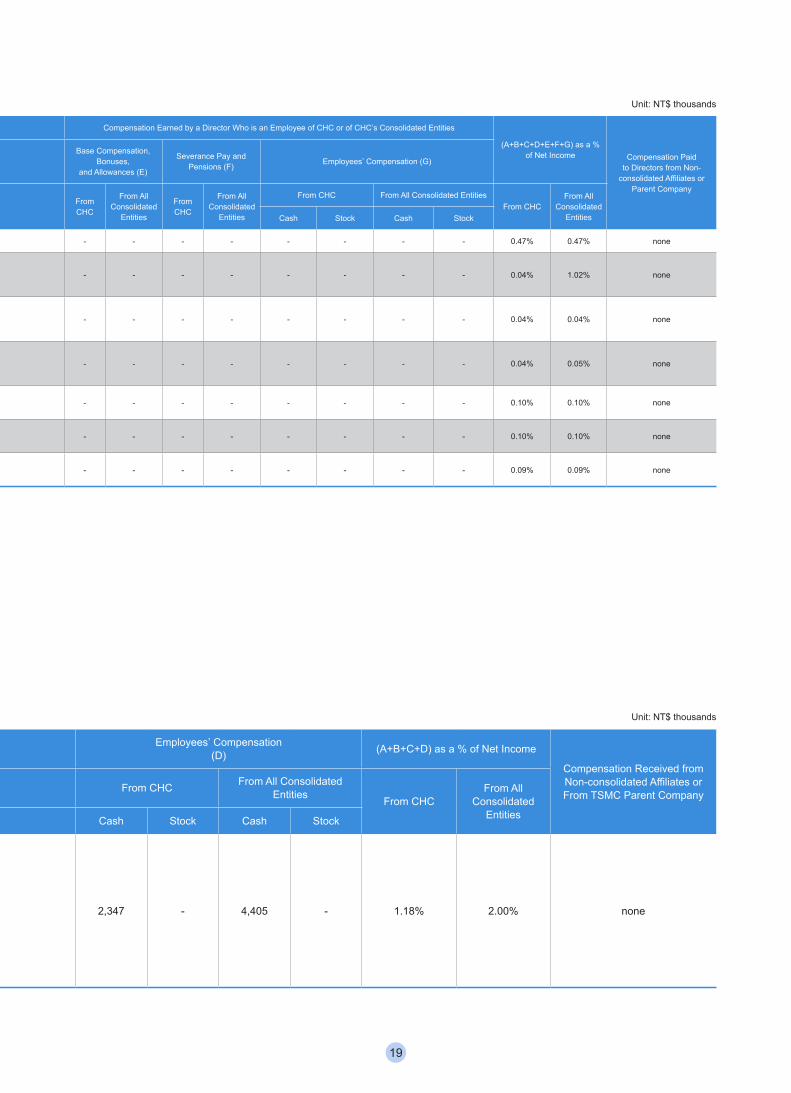
Compensation Earned by a Director Who is an Employee of CHC or of CHC’s Consolidated Entities
(A+B+C+D+E+F+G) as a % of Net Income Compensation Paid
to Directors from Non-consolidated Affiliates or
Parent Company
Base Compensation (A)Severance Pay and
Pensions (B)(Note 3)
Compensation toDirectors (C)
Allowances (D)(Note 4)
Base Compensation, Bonuses,
and Allowances (E)
Severance Pay and Pensions (F) Employees’ Compensation (G)
From CHC
From All Consolidated
EntitiesFrom CHC
From All Consolidated
Entities
From CHC
From All Consolidated
Entities
From CHC
From All Consolidated
Entities
From CHC
From All Consolidated
Entities
From CHC
From All Consolidated
Entities
From CHC
From All Consolidated
Entities
From CHC From All Consolidated EntitiesFrom CHC
From All Consolidated
EntitiesCash Stock Cash Stock
Chairman Nita Ing 7,200 7,200 - - - - - 60 0.47% 0.47% - - - - - - - - 0.47% 0.47% none
DirectorChristopher Chang Representative of Wei-Dar Development Co., Ltd.
600 15,600 - - - - - 60 0.04% 1.02% - - - - - - - - 0.04% 1.02% none
DirectorHelena Kuo Representative of Wei-Dar Development Co., Ltd.
600 600 - - - - - - 0.04% 0.04% - - - - - - - - 0.04% 0.04% none
DirectorJohn Huang Representative of Han-De Construction Co., Ltd.
600 600 - - - - - 120 0.04% 0.05% - - - - - - - - 0.04% 0.05% none
Independent Director Donny Kao 1,300 1,300 - - - - 250 250 0.10% 0.10% - - - - - - - - 0.10% 0.10% none
Independent Director Frank Juang 1,300 1,300 - - - - 180 180 0.10% 0.10% - - - - - - - - 0.10% 0.10% none
Independent Director Allen Lee 1,300 1,300 - - - - 150 150 0.09% 0.09% - - - - - - - - 0.09% 0.09% none
2. Compensation Paid to CEO and Vice PresidentsUnit: NT$ thousands
Title Name
Salary(A)
Severance Pay and Pensions(B)
Bonuses and Allowances(C)
Employees’ Compensation(D) (A+B+C+D) as a % of Net Income
Compensation Received from Non-consolidated Affiliates or From TSMC Parent CompanyFrom CHC
From AllConsolidated
EntitiesFrom CHC
From AllConsolidated
EntitiesFrom CHC
From AllConsolidated
Entities
From CHC From All Consolidated Entities From CHC
From All Consolidated
EntitiesCash Stock Cash Stock
CEO Cindy Chang
15,561 25,957 - - 190 357 2,347 - 4,405 - 1.18% 2.00% none
Chief Auditor Charleen Chang
Vice President Anthony Lien
Vice President Kevin Chueh
Vice President Weifan Wang
Vice President Emily Liu
Vice President Calvin Tsai
Note 1: Mr. Calvin Tsai was resigned on june 6,2020.Note 2: Three company vehicles were allocated for business purchases. Two vehicles were purchased outright for NTD$2,252 thousands while one vehicle
was leased at a cost of NTD$512 thousands for the whole year.
Note 1: The remuneration policies, procedures, standards, and packages for Directors and Independent Directors, as well as the linkage to factors such as individual responsibilities, risks, and time spent:1. If the Company turns a profit during the year then 0.05% should be allocated as employee compensation and no more than 0.05% as directors’
compensation. After taking the level of directors’ involvement in the Company operations as well as domestic/overseas trends in the structure of directors’ compensation into account, the 10th meeting of the 3rd Board of Directors session resolved that directors’ remuneration will be paid as fixed compensation instead. A distinction shall also be made between Independent Directors and ordinary Directors.
2. All Independent Directors are members of the Company’s Audit Committee and Compensation Committee. Reasonable compensation is paid to Independent Directors based on their level of engagement, the business performance of the Company, linkage to future risks, as well as prevailing industry standards.
Note 2: No Directors’ compensation was allocated in 2020.Note 3: Two-vehicles were allocated for business purchases. One vehicle was purchased outright for NTD$2,500 thousands while one vehicle was leased
at a cost of NTD$1,038 thousands for the whole year.
18
(III) Remuneration to Directors, CEO and Vice Presidents1. Remuneration Paid to Director and Independent Directors
Unit: NT$ thousands
Title Name
Director Remuneration
(A+B+C+D) as a % of Net Income
Compensation Earned by a Director Who is an Employee of CHC or of CHC’s Consolidated Entities
(A+B+C+D+E+F+G) as a % of Net Income Compensation Paid
to Directors from Non-consolidated Affiliates or
Parent Company
Base Compensation (A)Severance Pay and
Pensions (B)(Note 3)
Compensation toDirectors (C)
Allowances (D)(Note 4)
Base Compensation, Bonuses,
and Allowances (E)
Severance Pay and Pensions (F) Employees’ Compensation (G)
From CHC
From All Consolidated
EntitiesFrom CHC
From All Consolidated
Entities
From CHC
From All Consolidated
Entities
From CHC
From All Consolidated
Entities
From CHC
From All Consolidated
Entities
From CHC
From All Consolidated
Entities
From CHC
From All Consolidated
Entities
From CHC From All Consolidated EntitiesFrom CHC
From All Consolidated
EntitiesCash Stock Cash Stock
Chairman Nita Ing 7,200 7,200 - - - - - 60 0.47% 0.47% - - - - - - - - 0.47% 0.47% none
DirectorChristopher Chang Representative of Wei-Dar Development Co., Ltd.
600 15,600 - - - - - 60 0.04% 1.02% - - - - - - - - 0.04% 1.02% none
DirectorHelena Kuo Representative of Wei-Dar Development Co., Ltd.
600 600 - - - - - - 0.04% 0.04% - - - - - - - - 0.04% 0.04% none
DirectorJohn Huang Representative of Han-De Construction Co., Ltd.
600 600 - - - - - 120 0.04% 0.05% - - - - - - - - 0.04% 0.05% none
Independent Director Donny Kao 1,300 1,300 - - - - 250 250 0.10% 0.10% - - - - - - - - 0.10% 0.10% none
Independent Director Frank Juang 1,300 1,300 - - - - 180 180 0.10% 0.10% - - - - - - - - 0.10% 0.10% none
Independent Director Allen Lee 1,300 1,300 - - - - 150 150 0.09% 0.09% - - - - - - - - 0.09% 0.09% none
2. Compensation Paid to CEO and Vice PresidentsUnit: NT$ thousands
Title Name
Salary(A)
Severance Pay and Pensions(B)
Bonuses and Allowances(C)
Employees’ Compensation(D) (A+B+C+D) as a % of Net Income
Compensation Received from Non-consolidated Affiliates or From TSMC Parent CompanyFrom CHC
From AllConsolidated
EntitiesFrom CHC
From AllConsolidated
EntitiesFrom CHC
From AllConsolidated
Entities
From CHC From All Consolidated Entities From CHC
From All Consolidated
EntitiesCash Stock Cash Stock
CEO Cindy Chang
15,561 25,957 - - 190 357 2,347 - 4,405 - 1.18% 2.00% none
Chief Auditor Charleen Chang
Vice President Anthony Lien
Vice President Kevin Chueh
Vice President Weifan Wang
Vice President Emily Liu
Vice President Calvin Tsai
Note 1: Mr. Calvin Tsai was resigned on june 6,2020.Note 2: Three company vehicles were allocated for business purchases. Two vehicles were purchased outright for NTD$2,252 thousands while one vehicle
was leased at a cost of NTD$512 thousands for the whole year.
19
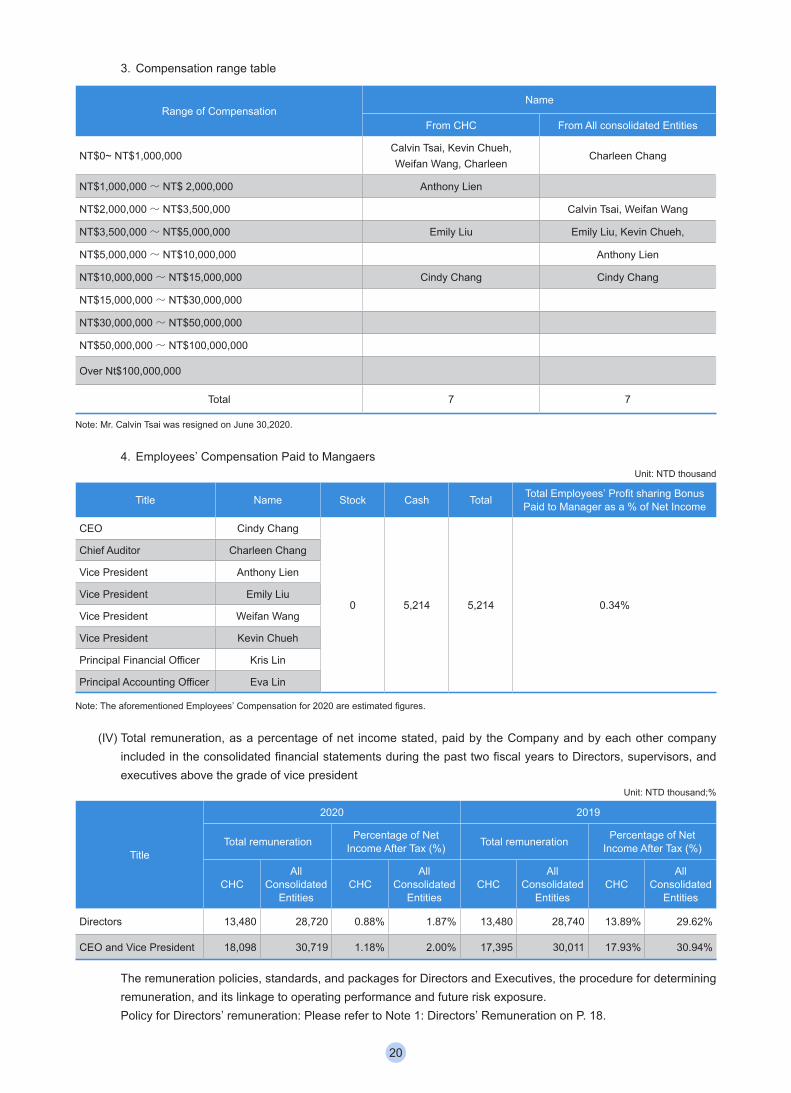
3. Compensation range table
Range of CompensationName
From CHC From All consolidated Entities
NT$0~ NT$1,000,000Calvin Tsai, Kevin Chueh, Weifan Wang, Charleen
Charleen Chang
NT$1,000,000~ NT$ 2,000,000 Anthony Lien
NT$2,000,000~ NT$3,500,000 Calvin Tsai, Weifan Wang
NT$3,500,000~ NT$5,000,000 Emily Liu Emily Liu, Kevin Chueh,
NT$5,000,000~ NT$10,000,000 Anthony Lien
NT$10,000,000~ NT$15,000,000 Cindy Chang Cindy Chang
NT$15,000,000~ NT$30,000,000
NT$30,000,000~ NT$50,000,000
NT$50,000,000~ NT$100,000,000
Over Nt$100,000,000
Total 7 7
Note: Mr. Calvin Tsai was resigned on June 30,2020.
4. Employees’ Compensation Paid to MangaersUnit: NTD thousand
Title Name Stock Cash Total Total Employees’ Profit sharing Bonus Paid to Manager as a % of Net Income
CEO Cindy Chang
0 5,214 5,214 0.34%
Chief Auditor Charleen Chang
Vice President Anthony Lien
Vice President Emily Liu
Vice President Weifan Wang
Vice President Kevin Chueh
Principal Financial Officer Kris Lin
Principal Accounting Officer Eva Lin
Note: The aforementioned Employees’ Compensation for 2020 are estimated figures.
(IV) Total remuneration, as a percentage of net income stated, paid by the Company and by each other company included in the consolidated financial statements during the past two fiscal years to Directors, supervisors, and executives above the grade of vice president
Unit: NTD thousand;%
Title
2020 2019
Total remuneration Percentage of Net Income After Tax (%) Total remuneration Percentage of Net
Income After Tax (%)
CHCAll
Consolidated Entities
CHCAll
Consolidated Entities
CHCAll
Consolidated Entities
CHCAll
Consolidated Entities
Directors 13,480 28,720 0.88% 1.87% 13,480 28,740 13.89% 29.62%
CEO and Vice President 18,098 30,719 1.18% 2.00% 17,395 30,011 17.93% 30.94%
The remuneration policies, standards, and packages for Directors and Executives, the procedure for determining remuneration, and its linkage to operating performance and future risk exposure.Policy for Directors’ remuneration: Please refer to Note 1: Directors’ Remuneration on P. 18.
20
Policy for Employees and Managers’ compensationCHC strives to provide competitive total reward packages. To ensure internal fairness and external competitiveness, salary surveys are conducted each year to serve as a reference for adjustments to compensation and to respond to changes in the external salary market in a timely manner. To ensure equal working rights regardless of gender, there is no gender-based difference in compensation at every level. Gender equality in the workplace is enforced by basing compensation purely on the qualifications required for each position, individual ability and performance. To encourage the continued pursuit of excellence among employees, the Company has drawn up regulations governing performance bonuses. Employees that make a contribution to the Company’s development are rewarded with performance bonuses based on the Company’s and their individual performance for the year. The performance-based bonuses establish a fair and reasonable reward system for encouraging greater employee initiative.
Management and employee remuneration at CHC consist of fixed compensation and variable bonuses. Fixed compensation is the monthly salary based mainly on factors such as roles, skills, market rates, and company operations. Variable bonuses are based on the Company’s operating performance for the year, the contributions made by managers and employees during the year, as well as the Company’s operating risks. The procedure for determining remuneration requires approval through the internal the Level of Authority Table. Management compensation should be submitted to the Compensation Committee for review before being presented to the Board for approval.
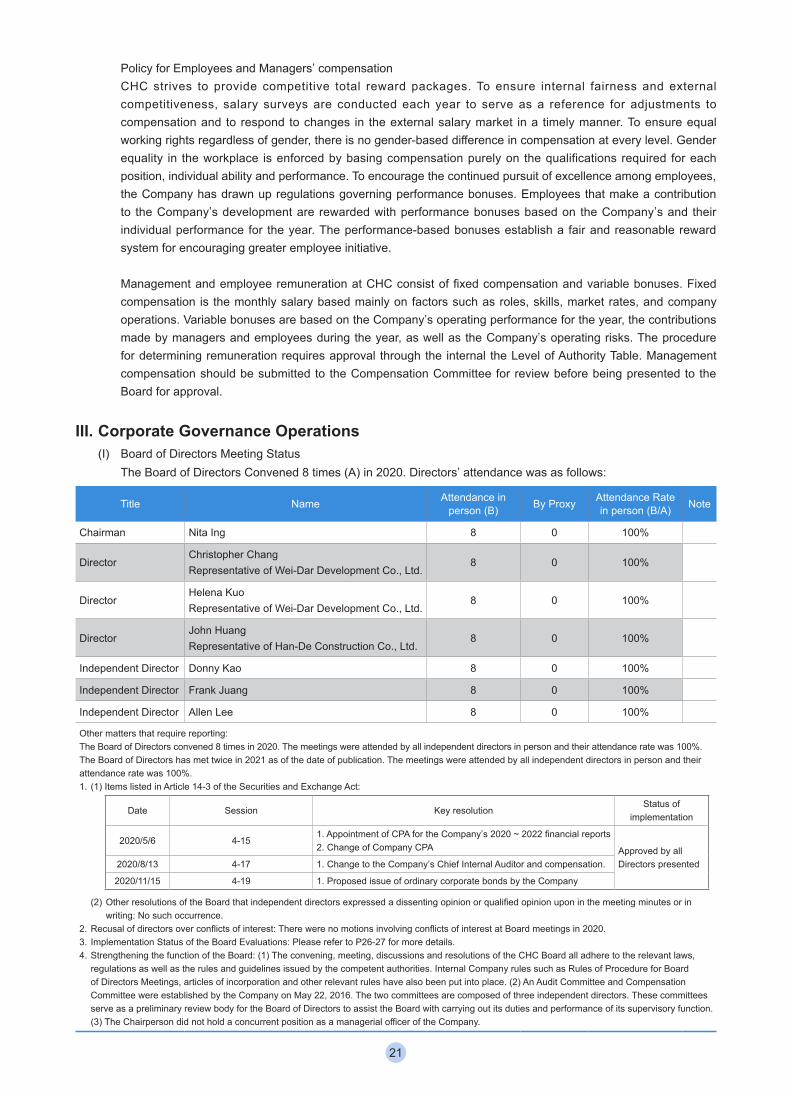
III. Corporate Governance Operations(I) Board of Directors Meeting Status
The Board of Directors Convened 8 times (A) in 2020. Directors’ attendance was as follows:
Title Name Attendance in person (B) By Proxy Attendance Rate
in person (B/A) Note
Chairman Nita Ing 8 0 100%
DirectorChristopher ChangRepresentative of Wei-Dar Development Co., Ltd.
8 0 100%
DirectorHelena KuoRepresentative of Wei-Dar Development Co., Ltd.
8 0 100%
DirectorJohn HuangRepresentative of Han-De Construction Co., Ltd.
8 0 100%
Independent Director Donny Kao 8 0 100%
Independent Director Frank Juang 8 0 100%
Independent Director Allen Lee 8 0 100%
Other matters that require reporting:The Board of Directors convened 8 times in 2020. The meetings were attended by all independent directors in person and their attendance rate was 100%.The Board of Directors has met twice in 2021 as of the date of publication. The meetings were attended by all independent directors in person and their attendance rate was 100%.1. (1) Items listed in Article 14-3 of the Securities and Exchange Act:
Date Session Key resolutionStatus of
implementation
2020/5/6 4-151. Appointment of CPA for the Company’s 2020 ~ 2022 financial reports2. Change of Company CPA Approved by all
Directors presented2020/8/13 4-17 1. Change to the Company’s Chief Internal Auditor and compensation.
2020/11/15 4-19 1. Proposed issue of ordinary corporate bonds by the Company
(2) Other resolutions of the Board that independent directors expressed a dissenting opinion or qualified opinion upon in the meeting minutes or in writing: No such occurrence.
2. Recusal of directors over conflicts of interest: There were no motions involving conflicts of interest at Board meetings in 2020.3. Implementation Status of the Board Evaluations: Please refer to P26-27 for more details.4. Strengthening the function of the Board: (1) The convening, meeting, discussions and resolutions of the CHC Board all adhere to the relevant laws,
regulations as well as the rules and guidelines issued by the competent authorities. Internal Company rules such as Rules of Procedure for Board of Directors Meetings, articles of incorporation and other relevant rules have also been put into place. (2) An Audit Committee and Compensation Committee were established by the Company on May 22, 2016. The two committees are composed of three independent directors. These committees serve as a preliminary review body for the Board of Directors to assist the Board with carrying out its duties and performance of its supervisory function. (3) The Chairperson did not hold a concurrent position as a managerial officer of the Company.
21
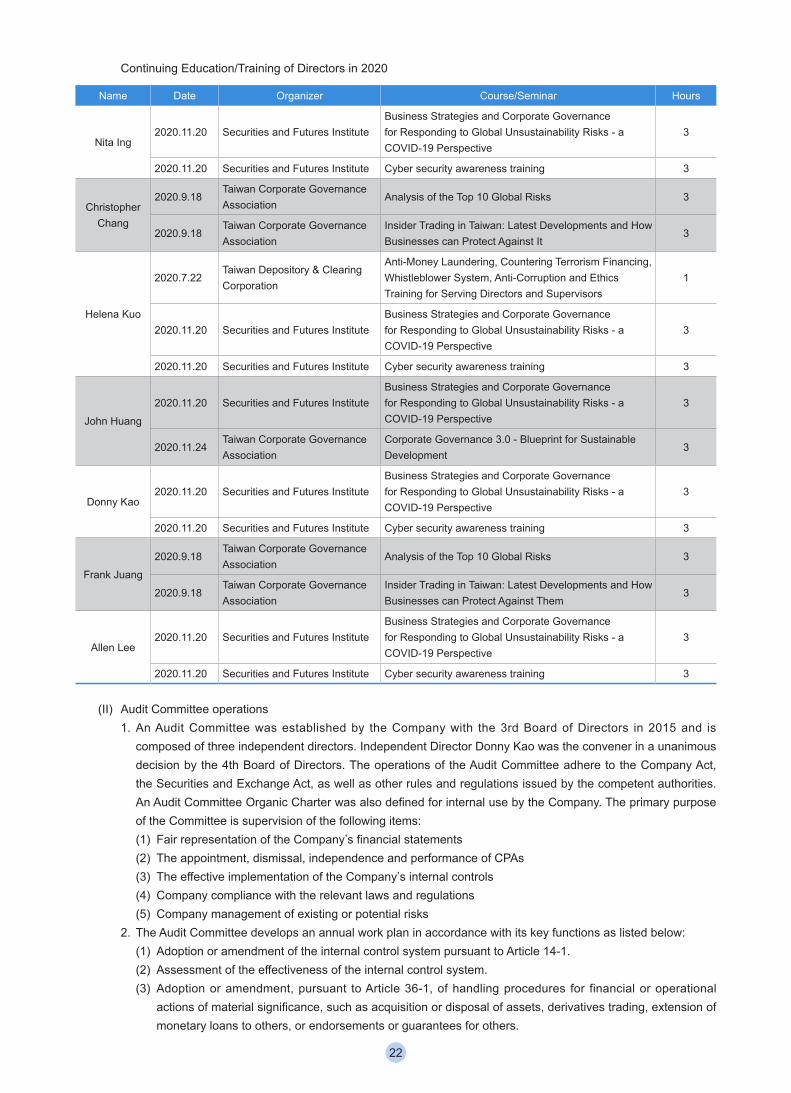
Continuing Education/Training of Directors in 2020
Name Date Organizer Course/Seminar Hours
Nita Ing2020.11.20 Securities and Futures Institute
Business Strategies and Corporate Governance for Responding to Global Unsustainability Risks - a COVID-19 Perspective
3
2020.11.20 Securities and Futures Institute Cyber security awareness training 3
Christopher Chang
2020.9.18Taiwan Corporate Governance Association
Analysis of the Top 10 Global Risks 3
2020.9.18Taiwan Corporate Governance Association
Insider Trading in Taiwan: Latest Developments and How Businesses can Protect Against It
3
Helena Kuo
2020.7.22Taiwan Depository & Clearing Corporation
Anti-Money Laundering, Countering Terrorism Financing, Whistleblower System, Anti-Corruption and Ethics Training for Serving Directors and Supervisors
1
2020.11.20 Securities and Futures InstituteBusiness Strategies and Corporate Governance for Responding to Global Unsustainability Risks - a COVID-19 Perspective
3
2020.11.20 Securities and Futures Institute Cyber security awareness training 3
John Huang
2020.11.20 Securities and Futures InstituteBusiness Strategies and Corporate Governance for Responding to Global Unsustainability Risks - a COVID-19 Perspective
3
2020.11.24Taiwan Corporate Governance Association
Corporate Governance 3.0 - Blueprint for Sustainable Development
3
Donny Kao2020.11.20 Securities and Futures Institute
Business Strategies and Corporate Governance for Responding to Global Unsustainability Risks - a COVID-19 Perspective
3
2020.11.20 Securities and Futures Institute Cyber security awareness training 3
Frank Juang
2020.9.18Taiwan Corporate Governance Association
Analysis of the Top 10 Global Risks 3
2020.9.18Taiwan Corporate Governance Association
Insider Trading in Taiwan: Latest Developments and How Businesses can Protect Against Them
3
Allen Lee2020.11.20 Securities and Futures Institute
Business Strategies and Corporate Governance for Responding to Global Unsustainability Risks - a COVID-19 Perspective
3
2020.11.20 Securities and Futures Institute Cyber security awareness training 3
(II) Audit Committee operations1. An Audit Committee was established by the Company with the 3rd Board of Directors in 2015 and is
composed of three independent directors. Independent Director Donny Kao was the convener in a unanimous decision by the 4th Board of Directors. The operations of the Audit Committee adhere to the Company Act, the Securities and Exchange Act, as well as other rules and regulations issued by the competent authorities. An Audit Committee Organic Charter was also defined for internal use by the Company. The primary purpose of the Committee is supervision of the following items:(1) Fair representation of the Company’s financial statements(2) The appointment, dismissal, independence and performance of CPAs(3) The effective implementation of the Company’s internal controls(4) Company compliance with the relevant laws and regulations(5) Company management of existing or potential risks
2. The Audit Committee develops an annual work plan in accordance with its key functions as listed below:(1) Adoption or amendment of the internal control system pursuant to Article 14-1.(2) Assessment of the effectiveness of the internal control system.(3) Adoption or amendment, pursuant to Article 36-1, of handling procedures for financial or operational
actions of material significance, such as acquisition or disposal of assets, derivatives trading, extension of monetary loans to others, or endorsements or guarantees for others.
22
(4) Matters bearing on the personal interests of a director.(5) Material assets or derivatives transactions.(6) Material monetary loans, endorsements, or provisions of guarantee.(7) The offering, issuance, or private placement of any equity-type securities.(8) The hiring or dismissal of an attesting CPA, or the compensation given thereto.(9) The appointment or discharge of a financial, accounting, or internal auditing officer.
(10) Annual financial reports and second quarter financial reports.(11) Any other material matter so required by the company or the competent authority.
3. Key matters reviewed during 2020 were as follows:(1) 2019 business report and financial statements, and issuing the statement of internal control(2) Distribution of the Company’s 2019 surplus(3) Financial reports for 2020 Q1 ~ Q3(4) Removal of anti-compete clause for directors(5) Review of amendment to rules and regulations: Group Internal Control System,Charter of Audit
Committee, Guidelines for related party transaction, Guidelines for Budge Management, and Group Risk Management Policy.
(6) Change to the Company’s Chief Internal Auditor and compensation(7) Review of the 2021 Company budget(8) Review of the first issue of domestic secured vorporate bonds in 2020
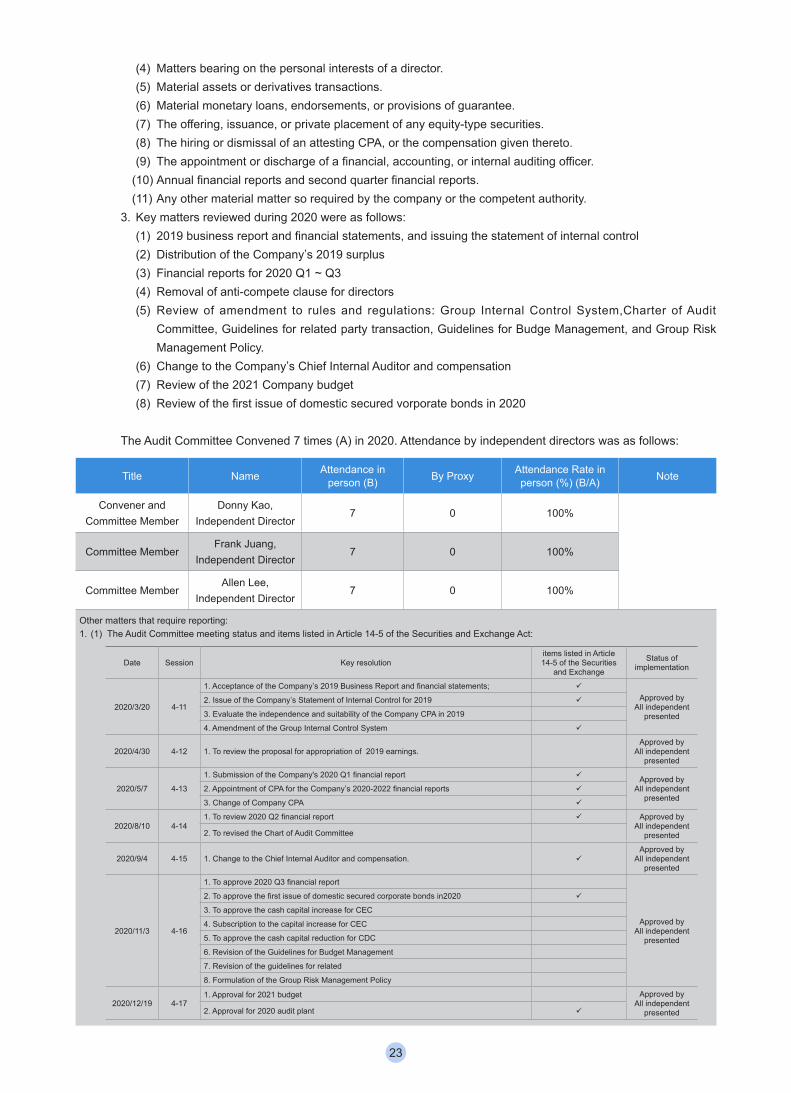
The Audit Committee Convened 7 times (A) in 2020. Attendance by independent directors was as follows:
Title Name Attendance in person (B) By Proxy Attendance Rate in
person (%) (B/A) Note
Convener andCommittee Member
Donny Kao, Independent Director
7 0 100%
Committee MemberFrank Juang,
Independent Director7 0 100%
Committee MemberAllen Lee,
Independent Director7 0 100%
Other matters that require reporting:1. (1) The Audit Committee meeting status and items listed in Article 14-5 of the Securities and Exchange Act:
Date Session Key resolutionitems listed in Article 14-5 of the Securities
and Exchange
Status of implementation
2020/3/20 4-11
1. Acceptance of the Company’s 2019 Business Report and financial statements;
Approved by All independent
presented
2. Issue of the Company’s Statement of Internal Control for 2019
3. Evaluate the independence and suitability of the Company CPA in 2019
4. Amendment of the Group Internal Control System
2020/4/30 4-12 1. To review the proposal for appropriation of 2019 earnings.Approved by
All independent presented
2020/5/7 4-13
1. Submission of the Company's 2020 Q1 financial report Approved by All independent
presented2. Appointment of CPA for the Company’s 2020-2022 financial reports
3. Change of Company CPA
2020/8/10 4-141. To review 2020 Q2 financial report Approved by
All independent presented2. To revised the Chart of Audit Committee
2020/9/4 4-15 1. Change to the Chief Internal Auditor and compensation. Approved by
All independent presented
2020/11/3 4-16
1. To approve 2020 Q3 financial report
Approved by All independent
presented
2. To approve the first issue of domestic secured corporate bonds in2020
3. To approve the cash capital increase for CEC
4. Subscription to the capital increase for CEC
5. To approve the cash capital reduction for CDC
6. Revision of the Guidelines for Budget Management
7. Revision of the guidelines for related
8. Formulation of the Group Risk Management Policy
2020/12/19 4-171. Approval for 2021 budget Approved by
All independent presented2. Approval for 2020 audit plant
23
(2) Other matters that independent directors expressed a dissenting opinion or qualified opinion upon in the meeting minutes or in writing: No such occurrence.
2. Recusal of independent directors over conflicts of interest: There were no motions involving conflicts of interest at Audit Committee meetings in 2020.3. Communication between independent directors, chief internal auditor, and CPAs:
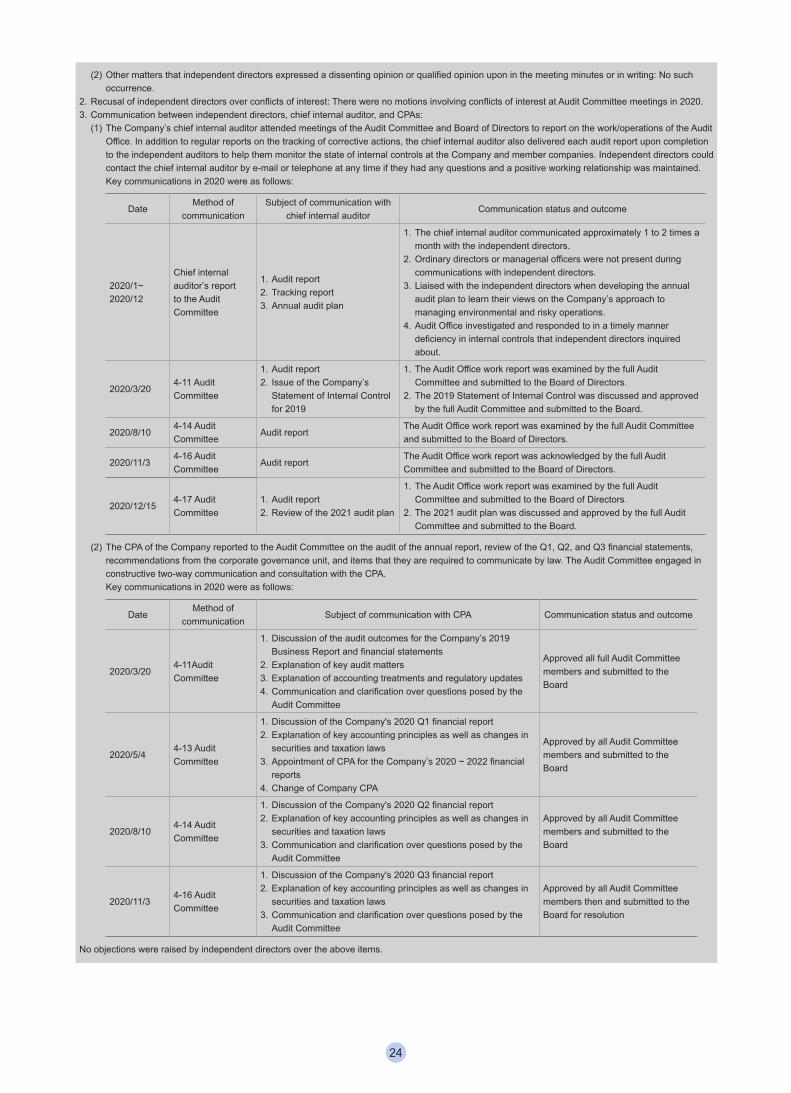
(1) The Company’s chief internal auditor attended meetings of the Audit Committee and Board of Directors to report on the work/operations of the Audit Office. In addition to regular reports on the tracking of corrective actions, the chief internal auditor also delivered each audit report upon completion to the independent auditors to help them monitor the state of internal controls at the Company and member companies. Independent directors could contact the chief internal auditor by e-mail or telephone at any time if they had any questions and a positive working relationship was maintained.
Key communications in 2020 were as follows:
DateMethod of
communicationSubject of communication with
chief internal auditorCommunication status and outcome
2020/1~2020/12
Chief internal auditor’s report to the Audit Committee
1. Audit report2. Tracking report3. Annual audit plan
1. The chief internal auditor communicated approximately 1 to 2 times a month with the independent directors.
2. Ordinary directors or managerial officers were not present during communications with independent directors.
3. Liaised with the independent directors when developing the annual audit plan to learn their views on the Company’s approach to managing environmental and risky operations.
4. Audit Office investigated and responded to in a timely manner deficiency in internal controls that independent directors inquired about.
2020/3/204-11 Audit Committee
1. Audit report2. Issue of the Company’s
Statement of Internal Control for 2019
1. The Audit Office work report was examined by the full Audit Committee and submitted to the Board of Directors.
2. The 2019 Statement of Internal Control was discussed and approved by the full Audit Committee and submitted to the Board.
2020/8/104-14 Audit Committee
Audit reportThe Audit Office work report was examined by the full Audit Committee and submitted to the Board of Directors.
2020/11/34-16 Audit Committee
Audit reportThe Audit Office work report was acknowledged by the full Audit Committee and submitted to the Board of Directors.
2020/12/154-17 Audit Committee
1. Audit report2. Review of the 2021 audit plan
1. The Audit Office work report was examined by the full Audit Committee and submitted to the Board of Directors.
2. The 2021 audit plan was discussed and approved by the full Audit Committee and submitted to the Board.
(2) The CPA of the Company reported to the Audit Committee on the audit of the annual report, review of the Q1, Q2, and Q3 financial statements, recommendations from the corporate governance unit, and items that they are required to communicate by law. The Audit Committee engaged in constructive two-way communication and consultation with the CPA.
Key communications in 2020 were as follows:
DateMethod of
communicationSubject of communication with CPA Communication status and outcome
2020/3/204-11Audit Committee
1. Discussion of the audit outcomes for the Company’s 2019 Business Report and financial statements
2. Explanation of key audit matters3. Explanation of accounting treatments and regulatory updates 4. Communication and clarification over questions posed by the
Audit Committee
Approved all full Audit Committee members and submitted to the Board
2020/5/44-13 Audit Committee
1. Discussion of the Company's 2020 Q1 financial report2. Explanation of key accounting principles as well as changes in
securities and taxation laws3. Appointment of CPA for the Company’s 2020 ~ 2022 financial
reports4. Change of Company CPA
Approved by all Audit Committee members and submitted to the Board
2020/8/104-14 Audit Committee
1. Discussion of the Company's 2020 Q2 financial report2. Explanation of key accounting principles as well as changes in
securities and taxation laws3. Communication and clarification over questions posed by the
Audit Committee
Approved by all Audit Committee members and submitted to the Board
2020/11/34-16 Audit Committee
1. Discussion of the Company's 2020 Q3 financial report2. Explanation of key accounting principles as well as changes in
securities and taxation laws3. Communication and clarification over questions posed by the
Audit Committee
Approved by all Audit Committee members then and submitted to the Board for resolution
No objections were raised by independent directors over the above items.
24
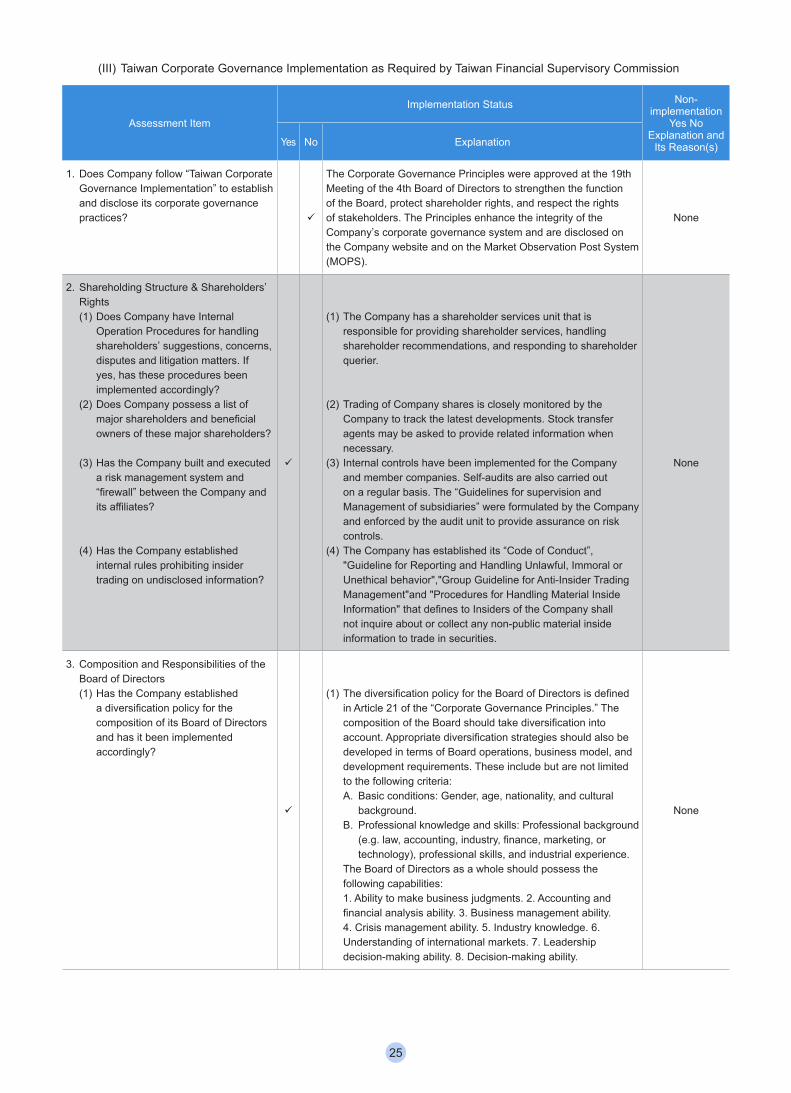
(III) Taiwan Corporate Governance Implementation as Required by Taiwan Financial Supervisory Commission
Assessment Item
Implementation Status Non-implementation
Yes No Explanation and
Its Reason(s)Yes No Explanation
1. Does Company follow “Taiwan Corporate Governance Implementation” to establish and disclose its corporate governance practices?
The Corporate Governance Principles were approved at the 19th Meeting of the 4th Board of Directors to strengthen the function of the Board, protect shareholder rights, and respect the rights of stakeholders. The Principles enhance the integrity of the Company’s corporate governance system and are disclosed on the Company website and on the Market Observation Post System (MOPS).
None
2. Shareholding Structure & Shareholders’ Rights(1) Does Company have Internal
Operation Procedures for handling shareholders’ suggestions, concerns, disputes and litigation matters. If yes, has these procedures been implemented accordingly?
(2) Does Company possess a list of major shareholders and beneficial owners of these major shareholders?
(3) Has the Company built and executed a risk management system and “firewall” between the Company and its affiliates?
(4) Has the Company established internal rules prohibiting insider trading on undisclosed information?
(1) The Company has a shareholder services unit that is responsible for providing shareholder services, handling shareholder recommendations, and responding to shareholder querier.
(2) Trading of Company shares is closely monitored by the Company to track the latest developments. Stock transfer agents may be asked to provide related information when necessary.
(3) Internal controls have been implemented for the Company and member companies. Self-audits are also carried out on a regular basis. The “Guidelines for supervision and Management of subsidiaries” were formulated by the Company and enforced by the audit unit to provide assurance on risk controls.
(4) The Company has established its “Code of Conduct”, "Guideline for Reporting and Handling Unlawful, Immoral or Unethical behavior","Group Guideline for Anti-Insider Trading Management"and "Procedures for Handling Material Inside Information" that defines to Insiders of the Company shall not inquire about or collect any non-public material inside information to trade in securities.
None
3. Composition and Responsibilities of the Board of Directors(1) Has the Company established
a diversification policy for the composition of its Board of Directors and has it been implemented accordingly?
(1) The diversification policy for the Board of Directors is defined in Article 21 of the “Corporate Governance Principles.” The composition of the Board should take diversification into account. Appropriate diversification strategies should also be developed in terms of Board operations, business model, and development requirements. These include but are not limited to the following criteria:A. Basic conditions: Gender, age, nationality, and cultural
background.B. Professional knowledge and skills: Professional background
(e.g. law, accounting, industry, finance, marketing, or technology), professional skills, and industrial experience.
The Board of Directors as a whole should possess the following capabilities:
1. Ability to make business judgments. 2. Accounting and financial analysis ability. 3. Business management ability. 4. Crisis management ability. 5. Industry knowledge. 6. Understanding of international markets. 7. Leadership decision-making ability. 8. Decision-making ability.
None
25
Assessment Item
Implementation Status Non-implementation
Yes No Explanation and
Its Reason(s)Yes No Explanation
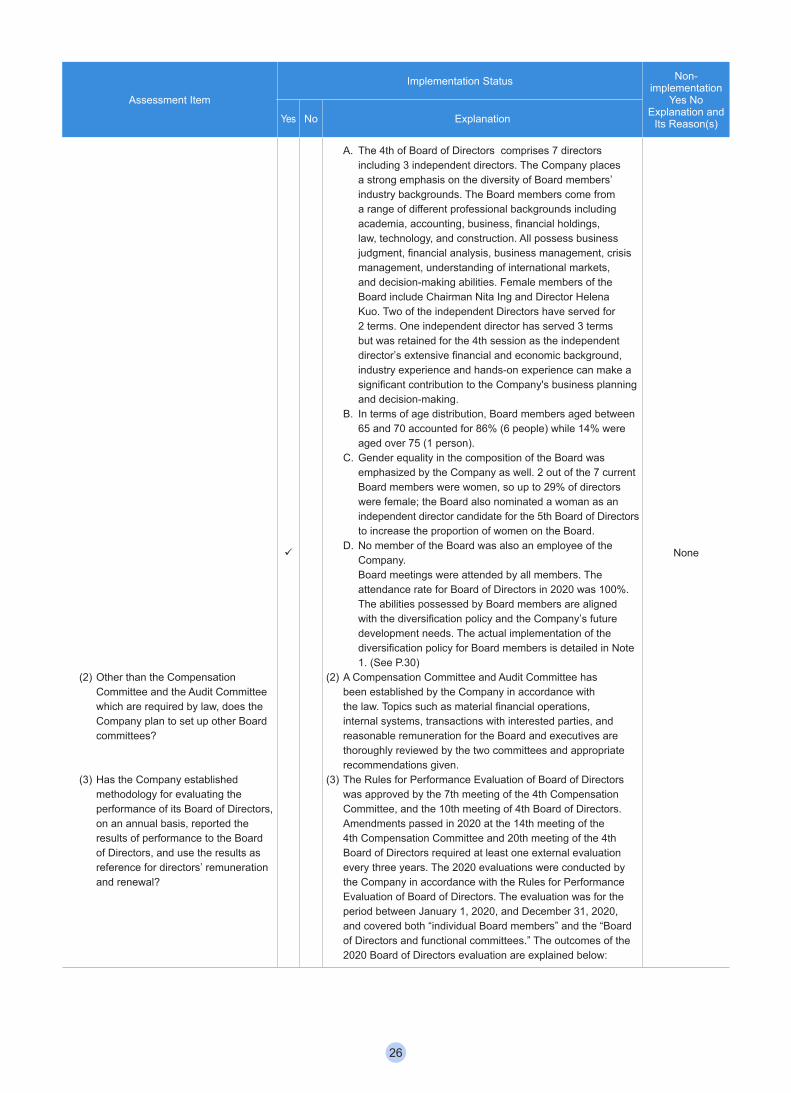
(2) Other than the Compensation Committee and the Audit Committee which are required by law, does the Company plan to set up other Board committees?
(3) Has the Company established methodology for evaluating the performance of its Board of Directors, on an annual basis, reported the results of performance to the Board of Directors, and use the results as reference for directors’ remuneration and renewal?
A. The 4th of Board of Directors comprises 7 directors including 3 independent directors. The Company places a strong emphasis on the diversity of Board members’ industry backgrounds. The Board members come from a range of different professional backgrounds including academia, accounting, business, financial holdings, law, technology, and construction. All possess business judgment, financial analysis, business management, crisis management, understanding of international markets, and decision-making abilities. Female members of the Board include Chairman Nita Ing and Director Helena Kuo. Two of the independent Directors have served for 2 terms. One independent director has served 3 terms but was retained for the 4th session as the independent director’s extensive financial and economic background, industry experience and hands-on experience can make a significant contribution to the Company's business planning and decision-making.
B. In terms of age distribution, Board members aged between 65 and 70 accounted for 86% (6 people) while 14% were aged over 75 (1 person).
C. Gender equality in the composition of the Board was emphasized by the Company as well. 2 out of the 7 current Board members were women, so up to 29% of directors were female; the Board also nominated a woman as an independent director candidate for the 5th Board of Directors to increase the proportion of women on the Board.
D. No member of the Board was also an employee of the Company.
Board meetings were attended by all members. The attendance rate for Board of Directors in 2020 was 100%. The abilities possessed by Board members are aligned with the diversification policy and the Company’s future development needs. The actual implementation of the diversification policy for Board members is detailed in Note 1. (See P.30)
(2) A Compensation Committee and Audit Committee has been established by the Company in accordance with the law. Topics such as material financial operations, internal systems, transactions with interested parties, and reasonable remuneration for the Board and executives are thoroughly reviewed by the two committees and appropriate recommendations given.
(3) The Rules for Performance Evaluation of Board of Directors was approved by the 7th meeting of the 4th Compensation Committee, and the 10th meeting of 4th Board of Directors. Amendments passed in 2020 at the 14th meeting of the 4th Compensation Committee and 20th meeting of the 4th Board of Directors required at least one external evaluation every three years. The 2020 evaluations were conducted by the Company in accordance with the Rules for Performance Evaluation of Board of Directors. The evaluation was for the period between January 1, 2020, and December 31, 2020, and covered both “individual Board members” and the “Board of Directors and functional committees.” The outcomes of the 2020 Board of Directors evaluation are explained below:
None
26
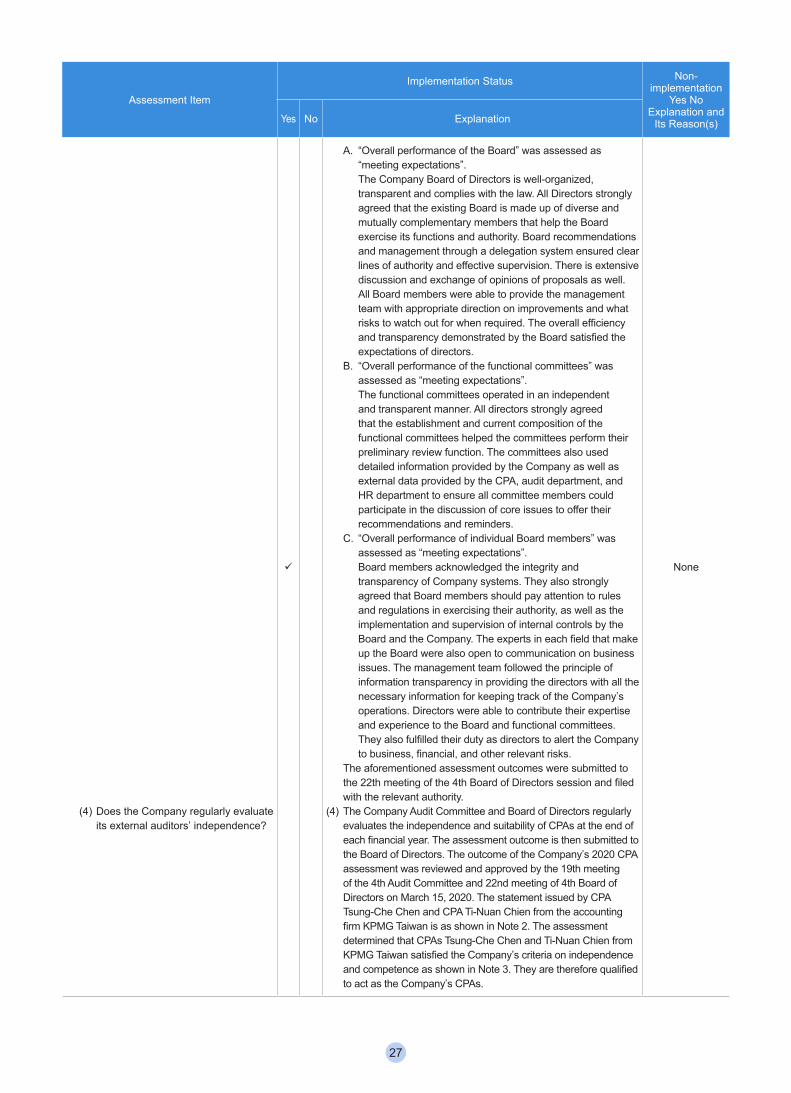
Assessment Item
Implementation Status Non-implementation
Yes No Explanation and
Its Reason(s)Yes No Explanation
(4) Does the Company regularly evaluate its external auditors’ independence?
A. “Overall performance of the Board” was assessed as “meeting expectations”.
The Company Board of Directors is well-organized, transparent and complies with the law. All Directors strongly agreed that the existing Board is made up of diverse and mutually complementary members that help the Board exercise its functions and authority. Board recommendations and management through a delegation system ensured clear lines of authority and effective supervision. There is extensive discussion and exchange of opinions of proposals as well. All Board members were able to provide the management team with appropriate direction on improvements and what risks to watch out for when required. The overall efficiency and transparency demonstrated by the Board satisfied the expectations of directors.
B. “Overall performance of the functional committees” was assessed as “meeting expectations”.
The functional committees operated in an independent and transparent manner. All directors strongly agreed that the establishment and current composition of the functional committees helped the committees perform their preliminary review function. The committees also used detailed information provided by the Company as well as external data provided by the CPA, audit department, and HR department to ensure all committee members could participate in the discussion of core issues to offer their recommendations and reminders.
C. “Overall performance of individual Board members” was assessed as “meeting expectations”.
Board members acknowledged the integrity and transparency of Company systems. They also strongly agreed that Board members should pay attention to rules and regulations in exercising their authority, as well as the implementation and supervision of internal controls by the Board and the Company. The experts in each field that make up the Board were also open to communication on business issues. The management team followed the principle of information transparency in providing the directors with all the necessary information for keeping track of the Company’s operations. Directors were able to contribute their expertise and experience to the Board and functional committees. They also fulfilled their duty as directors to alert the Company to business, financial, and other relevant risks.
The aforementioned assessment outcomes were submitted to the 22th meeting of the 4th Board of Directors session and filed with the relevant authority.
(4) The Company Audit Committee and Board of Directors regularly evaluates the independence and suitability of CPAs at the end of each financial year. The assessment outcome is then submitted to the Board of Directors. The outcome of the Company’s 2020 CPA assessment was reviewed and approved by the 19th meeting of the 4th Audit Committee and 22nd meeting of 4th Board of Directors on March 15, 2020. The statement issued by CPA Tsung-Che Chen and CPA Ti-Nuan Chien from the accounting firm KPMG Taiwan is as shown in Note 2. The assessment determined that CPAs Tsung-Che Chen and Ti-Nuan Chien from KPMG Taiwan satisfied the Company’s criteria on independence and competence as shown in Note 3. They are therefore qualified to act as the Company’s CPAs.
None
27
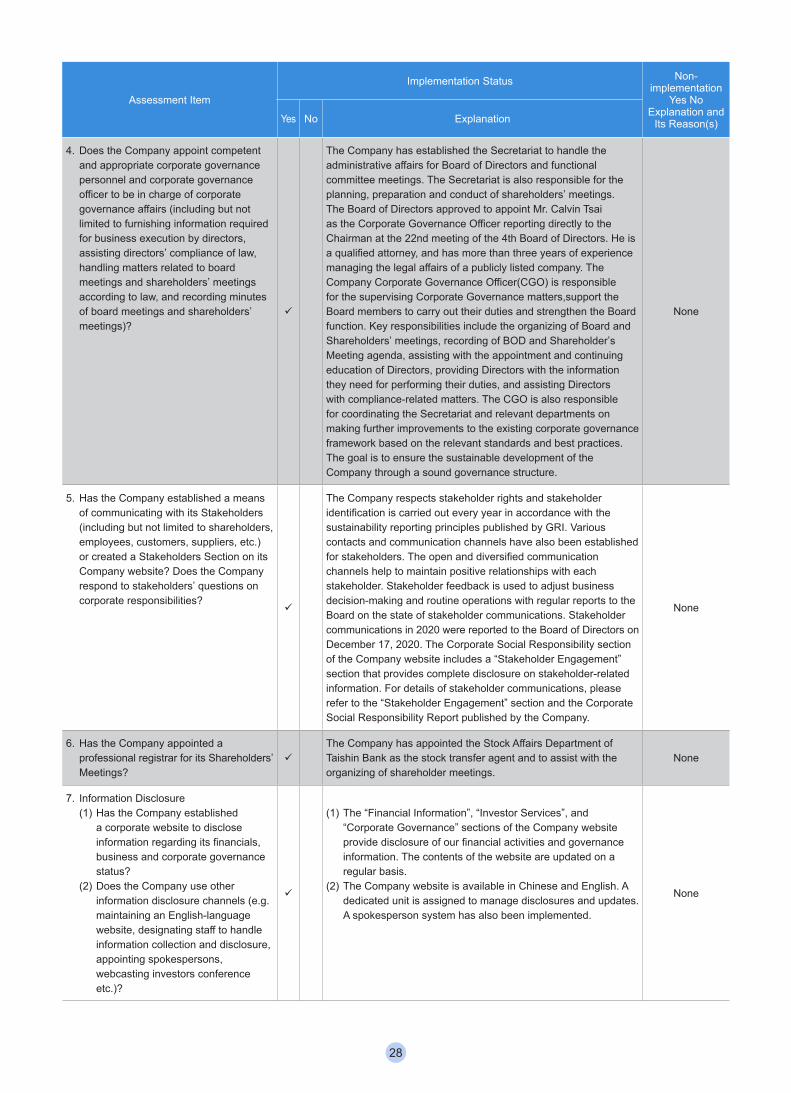
Assessment Item
Implementation Status Non-implementation
Yes No Explanation and
Its Reason(s)Yes No Explanation
4. Does the Company appoint competent and appropriate corporate governance personnel and corporate governance officer to be in charge of corporate governance affairs (including but not limited to furnishing information required for business execution by directors, assisting directors’ compliance of law, handling matters related to board meetings and shareholders’ meetings according to law, and recording minutes of board meetings and shareholders’ meetings)?
The Company has established the Secretariat to handle the administrative affairs for Board of Directors and functional committee meetings. The Secretariat is also responsible for the planning, preparation and conduct of shareholders’ meetings.The Board of Directors approved to appoint Mr. Calvin Tsai as the Corporate Governance Officer reporting directly to the Chairman at the 22nd meeting of the 4th Board of Directors. He is a qualified attorney, and has more than three years of experience managing the legal affairs of a publicly listed company. The Company Corporate Governance Officer(CGO) is responsible for the supervising Corporate Governance matters,support the Board members to carry out their duties and strengthen the Board function. Key responsibilities include the organizing of Board and Shareholders’ meetings, recording of BOD and Shareholder’s Meeting agenda, assisting with the appointment and continuing education of Directors, providing Directors with the information they need for performing their duties, and assisting Directors with compliance-related matters. The CGO is also responsible for coordinating the Secretariat and relevant departments on making further improvements to the existing corporate governance framework based on the relevant standards and best practices. The goal is to ensure the sustainable development of the Company through a sound governance structure.
None
5. Has the Company established a means of communicating with its Stakeholders (including but not limited to shareholders, employees, customers, suppliers, etc.) or created a Stakeholders Section on its Company website? Does the Company respond to stakeholders’ questions on corporate responsibilities?
The Company respects stakeholder rights and stakeholder identification is carried out every year in accordance with the sustainability reporting principles published by GRI. Various contacts and communication channels have also been established for stakeholders. The open and diversified communication channels help to maintain positive relationships with each stakeholder. Stakeholder feedback is used to adjust business decision-making and routine operations with regular reports to the Board on the state of stakeholder communications. Stakeholder communications in 2020 were reported to the Board of Directors on December 17, 2020. The Corporate Social Responsibility section of the Company website includes a “Stakeholder Engagement” section that provides complete disclosure on stakeholder-related information. For details of stakeholder communications, please refer to the “Stakeholder Engagement” section and the Corporate Social Responsibility Report published by the Company.
None
6. Has the Company appointed a professional registrar for its Shareholders’ Meetings?
The Company has appointed the Stock Affairs Department of Taishin Bank as the stock transfer agent and to assist with the organizing of shareholder meetings.
None
7. Information Disclosure(1) Has the Company established
a corporate website to disclose information regarding its financials, business and corporate governance status?
(2) Does the Company use other information disclosure channels (e.g. maintaining an English-language website, designating staff to handle information collection and disclosure, appointing spokespersons, webcasting investors conference etc.)?
(1) The “Financial Information”, “Investor Services”, and “Corporate Governance” sections of the Company website provide disclosure of our financial activities and governance information. The contents of the website are updated on a regular basis.
(2) The Company website is available in Chinese and English. A dedicated unit is assigned to manage disclosures and updates. A spokesperson system has also been implemented.
None
28
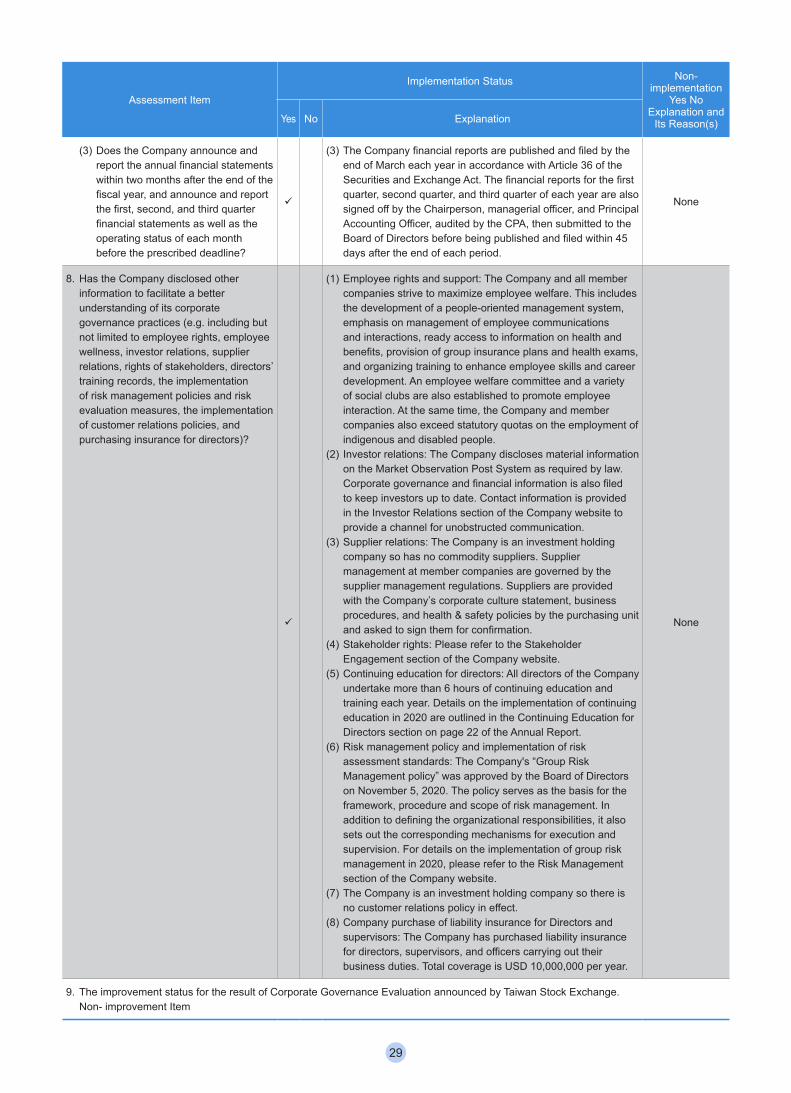
Assessment Item
Implementation Status Non-implementation
Yes No Explanation and
Its Reason(s)Yes No Explanation
(3) Does the Company announce and report the annual financial statements within two months after the end of the fiscal year, and announce and report the first, second, and third quarter financial statements as well as the operating status of each month before the prescribed deadline?
(3) The Company financial reports are published and filed by the end of March each year in accordance with Article 36 of the Securities and Exchange Act. The financial reports for the first quarter, second quarter, and third quarter of each year are also signed off by the Chairperson, managerial officer, and Principal Accounting Officer, audited by the CPA, then submitted to the Board of Directors before being published and filed within 45 days after the end of each period.
None
8. Has the Company disclosed other information to facilitate a better understanding of its corporate governance practices (e.g. including but not limited to employee rights, employee wellness, investor relations, supplier relations, rights of stakeholders, directors’ training records, the implementation of risk management policies and risk evaluation measures, the implementation of customer relations policies, and purchasing insurance for directors)?
(1) Employee rights and support: The Company and all member companies strive to maximize employee welfare. This includes the development of a people-oriented management system, emphasis on management of employee communications and interactions, ready access to information on health and benefits, provision of group insurance plans and health exams, and organizing training to enhance employee skills and career development. An employee welfare committee and a variety of social clubs are also established to promote employee interaction. At the same time, the Company and member companies also exceed statutory quotas on the employment of indigenous and disabled people.
(2) Investor relations: The Company discloses material information on the Market Observation Post System as required by law. Corporate governance and financial information is also filed to keep investors up to date. Contact information is provided in the Investor Relations section of the Company website to provide a channel for unobstructed communication.
(3) Supplier relations: The Company is an investment holding company so has no commodity suppliers. Supplier management at member companies are governed by the supplier management regulations. Suppliers are provided with the Company’s corporate culture statement, business procedures, and health & safety policies by the purchasing unit and asked to sign them for confirmation.
(4) Stakeholder rights: Please refer to the Stakeholder Engagement section of the Company website.
(5) Continuing education for directors: All directors of the Company undertake more than 6 hours of continuing education and training each year. Details on the implementation of continuing education in 2020 are outlined in the Continuing Education for Directors section on page 22 of the Annual Report.
(6) Risk management policy and implementation of risk assessment standards: The Company's “Group Risk Management policy” was approved by the Board of Directors on November 5, 2020. The policy serves as the basis for the framework, procedure and scope of risk management. In addition to defining the organizational responsibilities, it also sets out the corresponding mechanisms for execution and supervision. For details on the implementation of group risk management in 2020, please refer to the Risk Management section of the Company website.
(7) The Company is an investment holding company so there is no customer relations policy in effect.
(8) Company purchase of liability insurance for Directors and supervisors: The Company has purchased liability insurance for directors, supervisors, and officers carrying out their business duties. Total coverage is USD 10,000,000 per year.
None
9. The improvement status for the result of Corporate Governance Evaluation announced by Taiwan Stock Exchange. Non- improvement Item
29
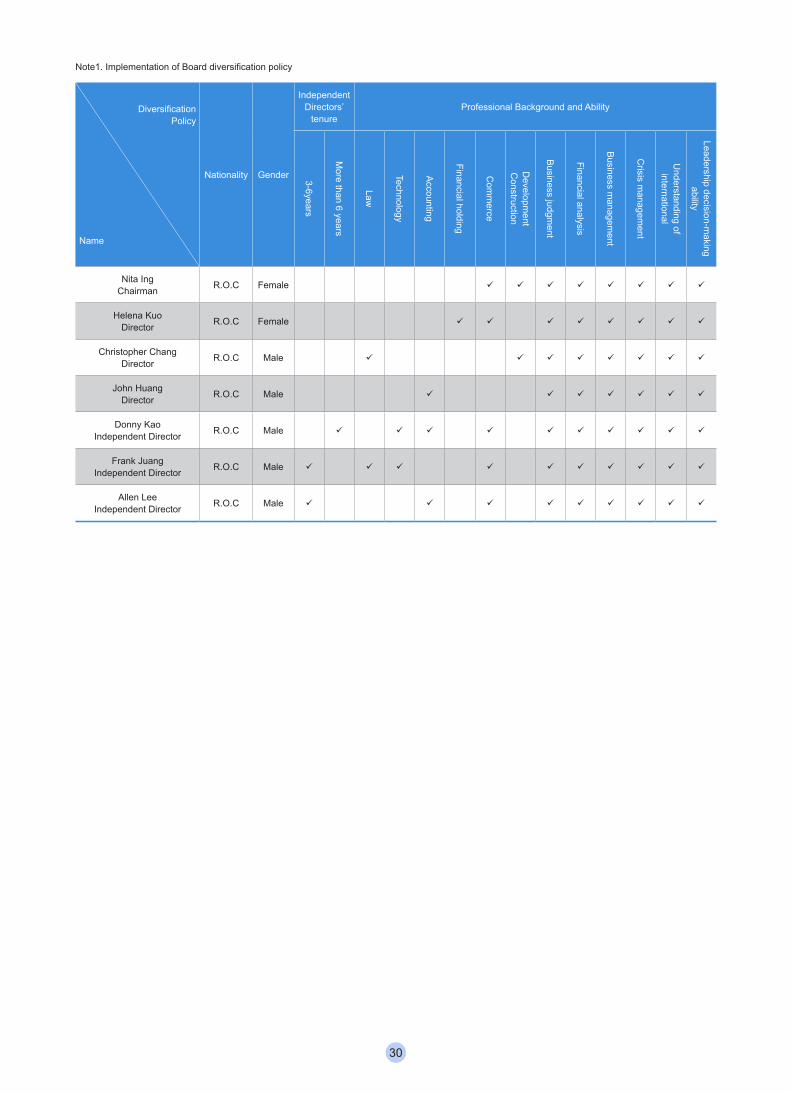
Note1. Implementation of Board diversification policy
Diversification Policy
Name
Nationality Gender
Independent Directors’
tenureProfessional Background and Ability
3-6years
More than 6 years
Law
Technology
Accounting
Financial holding
Com
merce
Developm
entC
onstruction
Business judgment
Financial analysis
Business managem
ent
Crisis m
anagement
Understanding of international
Leadership decision-making
ability
Nita Ing Chairman R.O.C Female
Helena KuoDirector R.O.C Female
Christopher Chang Director R.O.C Male
John HuangDirector R.O.C Male
Donny KaoIndependent Director R.O.C Male
Frank JuangIndependent Director R.O.C Male
Allen Lee Independent Director R.O.C Male
30
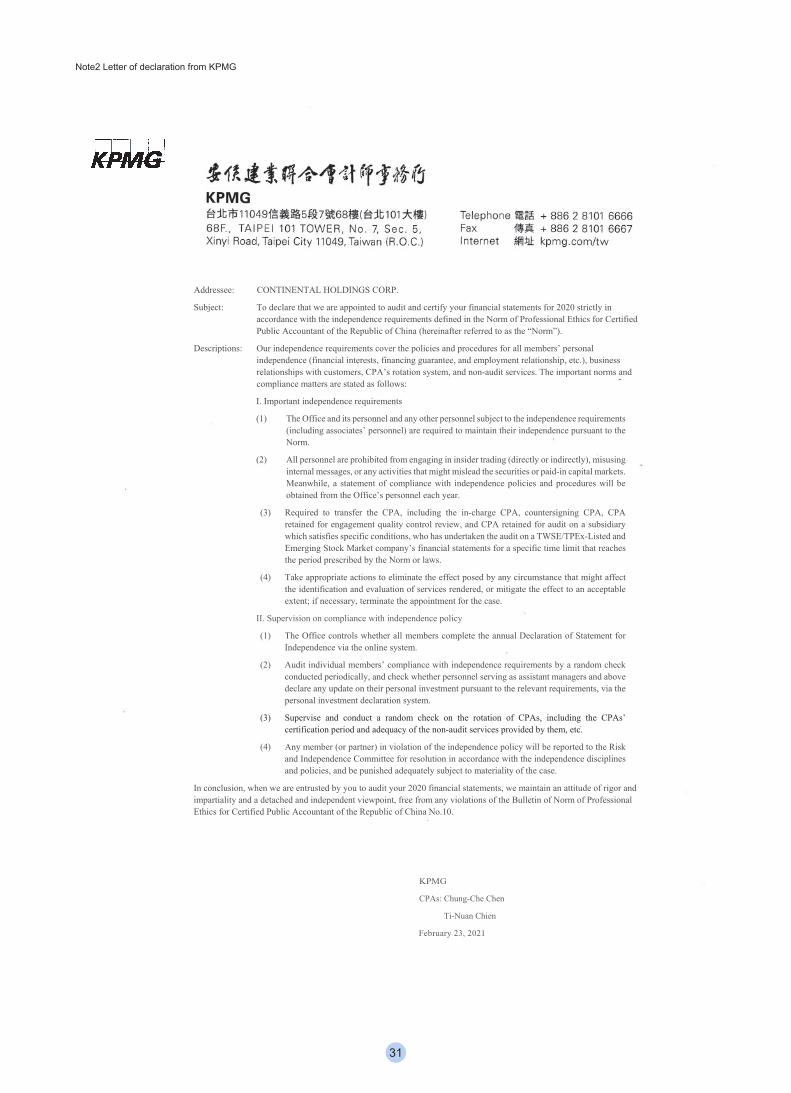
Note2 Letter of declaration from KPMG
Addressee: CONTINENTAL HOLDINGS CORP.
Subject: To declare that we are appointed to audit and certify your financial statements for 2020 strictly in accordance with the independence requirements defined in the Norm of Professional Ethics for Certified Public Accountant of the Republic of China (hereinafter referred to as the “Norm”).
Descriptions: Our independence requirements cover the policies and procedures for all members’ personal independence (financial interests, financing guarantee, and employment relationship, etc.), business relationships with customers, CPA’s rotation system, and non-audit services. The important norms and compliance matters are stated as follows:
I. Important independence requirements
(1) The Office and its personnel and any other personnel subject to the independence requirements (including associates’ personnel) are required to maintain their independence pursuant to the Norm.
(2) All personnel are prohibited from engaging in insider trading (directly or indirectly), misusing internal messages, or any activities that might mislead the securities or paid-in capital markets. Meanwhile, a statement of compliance with independence policies and procedures will be obtained from the Office’s personnel each year.
(3) Required to transfer the CPA, including the in-charge CPA, countersigning CPA, CPA retained for engagement quality control review, and CPA retained for audit on a subsidiary which satisfies specific conditions, who has undertaken the audit on a TWSE/TPEx-Listed and Emerging Stock Market company’s financial statements for a specific time limit that reaches the period prescribed by the Norm or laws.
(4) Take appropriate actions to eliminate the effect posed by any circumstance that might affect the identification and evaluation of services rendered, or mitigate the effect to an acceptable extent; if necessary, terminate the appointment for the case.
II. Supervision on compliance with independence policy
(1) The Office controls whether all members complete the annual Declaration of Statement for Independence via the online system.
(2) Audit individual members’ compliance with independence requirements by a random check conducted periodically, and check whether personnel serving as assistant managers and above declare any update on their personal investment pursuant to the relevant requirements, via the personal investment declaration system.
(3) Supervise and conduct a random check on the rotation of CPAs, including the CPAs’ certification period and adequacy of the non-audit services provided by them, etc.
(4) Any member (or partner) in violation of the independence policy will be reported to the Risk and Independence Committee for resolution in accordance with the independence disciplines and policies, and be punished adequately subject to materiality of the case.
In conclusion, when we are entrusted by you to audit your 2020 financial statements, we maintain an attitude of rigor and impartiality and a detached and independent viewpoint, free from any violations of the Bulletin of Norm of Professional Ethics for Certified Public Accountant of the Republic of China No.10.
KPMG
CPAs: Chung-Che Chen
Ti-Nuan Chien
February 23, 2021
31
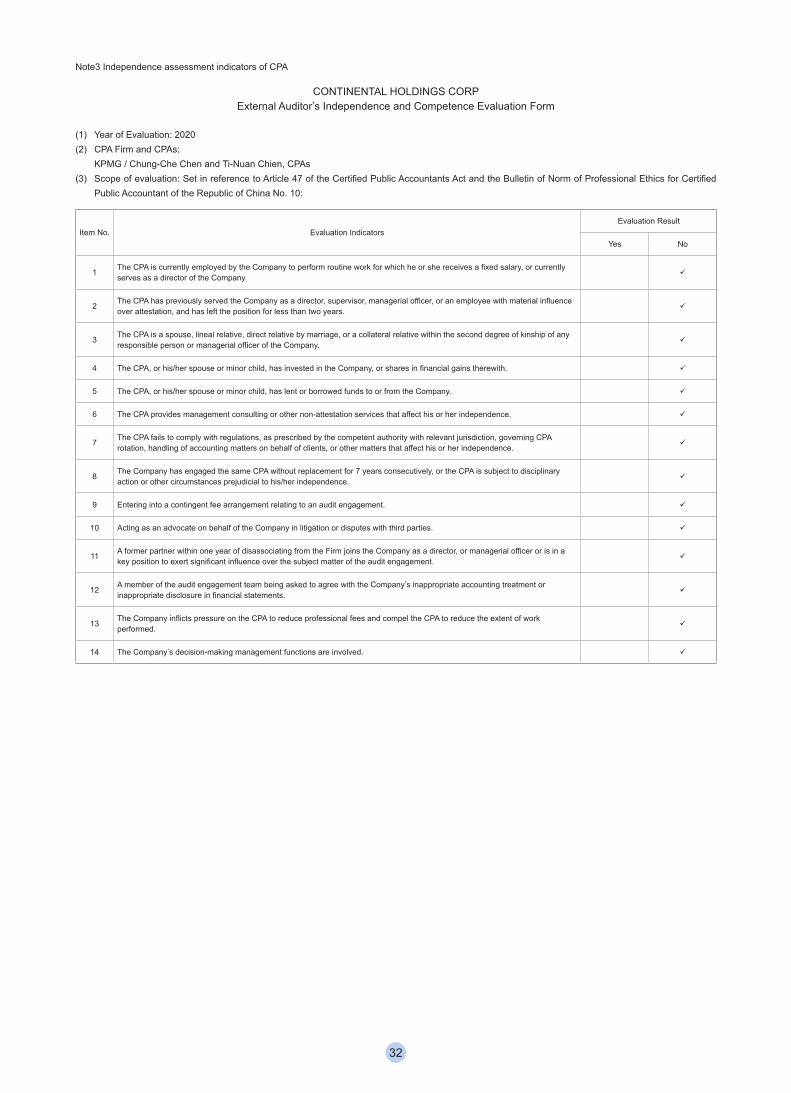
Note3 Independence assessment indicators of CPA
CONTINENTAL HOLDINGS CORPExternal Auditor’s Independence and Competence Evaluation Form
(1) Year of Evaluation: 2020(2) CPA Firm and CPAs: KPMG / Chung-Che Chen and Ti-Nuan Chien, CPAs(3) Scope of evaluation: Set in reference to Article 47 of the Certified Public Accountants Act and the Bulletin of Norm of Professional Ethics for Certified
Public Accountant of the Republic of China No. 10:
Item No. Evaluation IndicatorsEvaluation Result
Yes No
1 The CPA is currently employed by the Company to perform routine work for which he or she receives a fixed salary, or currently serves as a director of the Company.
2 The CPA has previously served the Company as a director, supervisor, managerial officer, or an employee with material influence over attestation, and has left the position for less than two years.
3 The CPA is a spouse, lineal relative, direct relative by marriage, or a collateral relative within the second degree of kinship of any responsible person or managerial officer of the Company.
4 The CPA, or his/her spouse or minor child, has invested in the Company, or shares in financial gains therewith.
5 The CPA, or his/her spouse or minor child, has lent or borrowed funds to or from the Company.
6 The CPA provides management consulting or other non-attestation services that affect his or her independence.
7 The CPA fails to comply with regulations, as prescribed by the competent authority with relevant jurisdiction, governing CPA rotation, handling of accounting matters on behalf of clients, or other matters that affect his or her independence.
8 The Company has engaged the same CPA without replacement for 7 years consecutively, or the CPA is subject to disciplinary action or other circumstances prejudicial to his/her independence.
9 Entering into a contingent fee arrangement relating to an audit engagement.
10 Acting as an advocate on behalf of the Company in litigation or disputes with third parties.
11 A former partner within one year of disassociating from the Firm joins the Company as a director, or managerial officer or is in a key position to exert significant influence over the subject matter of the audit engagement.
12 A member of the audit engagement team being asked to agree with the Company’s inappropriate accounting treatment or inappropriate disclosure in financial statements.
13 The Company inflicts pressure on the CPA to reduce professional fees and compel the CPA to reduce the extent of work performed.
14 The Company’s decision-making management functions are involved.
32

(IV) Compensation Committee Members’ Professional Qualifications and Independence Analysis
Name Title
Meet the Following Professional Qualification Requirements, Together with at Least Five Years Work
ExperienceCriteria (Note1)
Number of Other
Taiwanese Public
Companies Concurrently Serving as a
Compensation Committee
Member
Note
An Instructor or Higher Position in a Department of Commerce, Law,
Finance, Accounting, or Other Academic
Department Related to the Business Needs of the
Company in a Public or Private Junior
College, College or University
A Judge, Public Prosecutor, Attorney,
Certified Public Accountant, or Other
Professional or Technical Specialists Who Has Passed a
National Examination and Been Awarded
a Certificate in a Profession Necessary for the Business of the
Company
Have Work Experience
in the Area of Commerce,
Law, Finance, or Accounting, or Otherwise Necessary for
the Business of the Company
1 2 3 4 5 6 7 8 9 10
Donny Kao Independent Director 1
Frank Juang Independent Director 1
Allen Lee Independent Director 1
Note 1: Compensation Committee Members, during the two years before being elected or during the term of office, meet any of the following situations, please tick the appropriate corresponding boxes:1. Not an employee of the company or any of its affiliates;2. Not a director or supervisor of the company or any of its affiliates.;3. Not a natural-person shareholder who holds shares, together with those held by the person’s spouse, minor children, or held by the person
under others’ names, in an aggregate amount of one percent or more of the total number of issued shares of the company or ranks as one of its top ten shareholders;
4. Not a spouse, relative within the second degree of kinship, or lineal relative within the third degree of kinship, of any of the officer in the preceding 1 subparagraph, or of any of the above persons in the preceding subparagraphs 2 and 3;
5. Not a director, supervisor, or employee of a corporate/institutional shareholder that directly holds five percent or more of the total number of issued shares of the company, ranks as of its top five shareholders, or has representative director(s) serving on the company’s board based on Article 27 of the Company Law.
6. Not a director, supervisor, or employee of a company of which the majority of board seats or voting shares is controlled by a company that also controls the same of the company;
7. Not a director, supervisor, or employee of a company of which the chairman or CEO (or equivalent) themselves or their spouse also serve as the company’s chairman or CEO (or equivalent);
8. Not a director, supervisor, officer, or shareholder holding five percent or more of the shares of a specified company or institution that has a financial or business relationship with the company;
9. Other than serving as a compensation committee member of the company, not a professional individual who, or an owner, partner, director, supervisor, or officer of a sole proprietorship, partnership, company, or institution that, provides commercial, legal, financial, accounting services or consultation to the company or to any affiliate of the company, or a spouse thereof, and the service provided is an “audit service” or a “non-audit service which total compensation within the recent two years exceeds NTD500,000”;
10. Not been a person of any conditions defined in Article 30 of the Company Law.
(V) Compensation Committee Meeting Status1. The CHC Compensation Committee has three members. The Compensation Committee is made up of the
three Independent Directors and Independent Director Frank Juang was unanimously nominated by the 4th Board of Directors as the convener. The purpose of the Compensation Committee is to evaluate the Company’s remuneration policies for directors and executives in a professional and objective manner, and to make recommendations to the Board to serve as a reference during decision making. The key responsibilities and annual tasks of the Compensation Committee are as follows:(1) Regularly review the Company’s remuneration regulations and propose recommendations for
improvement.(2) Formulate and regularly review the annual and long-term performance targets for the Company’s directors
and executives, as well as the remuneration policies, procedures, standards and packages.(3) Regularly evaluate the performance of the Company’s directors and executives, and set the contents and
amount of their individual remunerations accordingly.
33
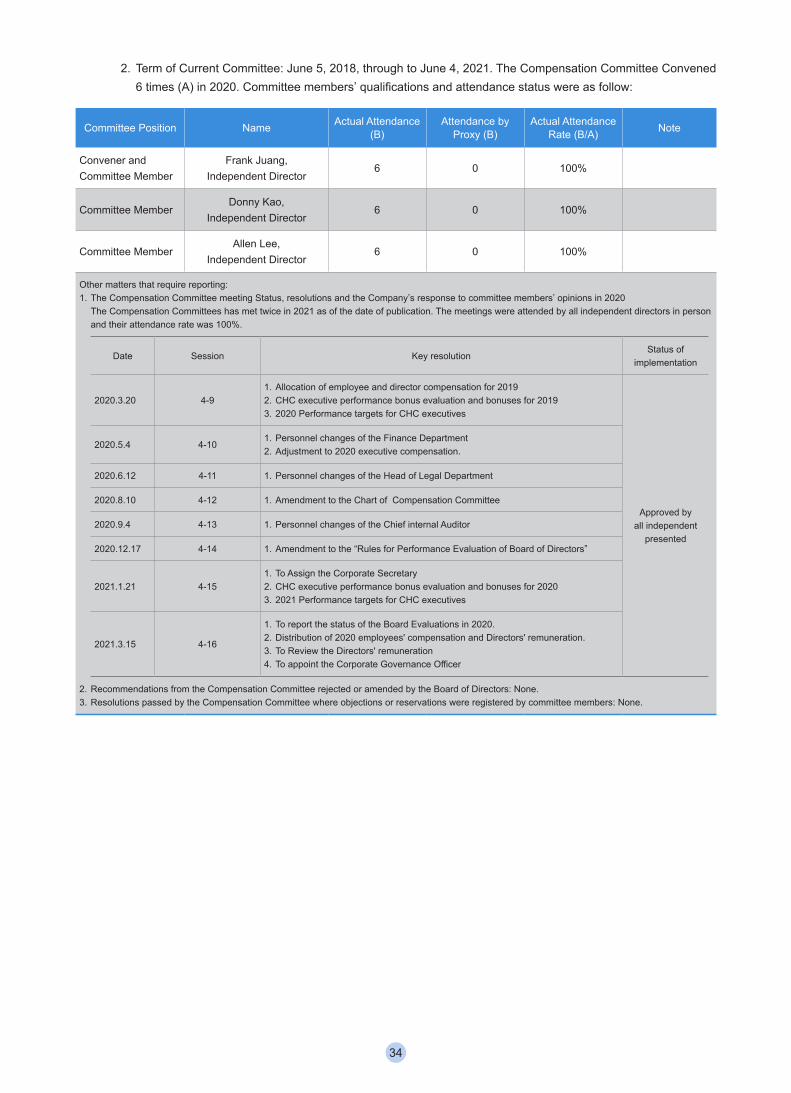
2. Term of Current Committee: June 5, 2018, through to June 4, 2021. The Compensation Committee Convened 6 times (A) in 2020. Committee members’ qualifications and attendance status were as follow:
Committee Position Name Actual Attendance (B)
Attendance by Proxy (B)
Actual Attendance Rate (B/A) Note
Convener and Committee Member
Frank Juang, Independent Director
6 0 100%
Committee MemberDonny Kao,
Independent Director6 0 100%
Committee MemberAllen Lee,
Independent Director6 0 100%
Other matters that require reporting:1. The Compensation Committee meeting Status, resolutions and the Company’s response to committee members’ opinions in 2020 The Compensation Committees has met twice in 2021 as of the date of publication. The meetings were attended by all independent directors in person
and their attendance rate was 100%.
Date Session Key resolutionStatus of
implementation
2020.3.20 4-91. Allocation of employee and director compensation for 20192. CHC executive performance bonus evaluation and bonuses for 20193. 2020 Performance targets for CHC executives
Approved by all independent
presented
2020.5.4 4-101. Personnel changes of the Finance Department2. Adjustment to 2020 executive compensation.
2020.6.12 4-11 1. Personnel changes of the Head of Legal Department
2020.8.10 4-12 1. Amendment to the Chart of Compensation Committee
2020.9.4 4-13 1. Personnel changes of the Chief internal Auditor
2020.12.17 4-14 1. Amendment to the “Rules for Performance Evaluation of Board of Directors”
2021.1.21 4-151. To Assign the Corporate Secretary2. CHC executive performance bonus evaluation and bonuses for 20203. 2021 Performance targets for CHC executives
2021.3.15 4-16
1. To report the status of the Board Evaluations in 2020.2. Distribution of 2020 employees' compensation and Directors' remuneration.3. To Review the Directors' remuneration4. To appoint the Corporate Governance Officer
2. Recommendations from the Compensation Committee rejected or amended by the Board of Directors: None.3. Resolutions passed by the Compensation Committee where objections or reservations were registered by committee members: None.
34
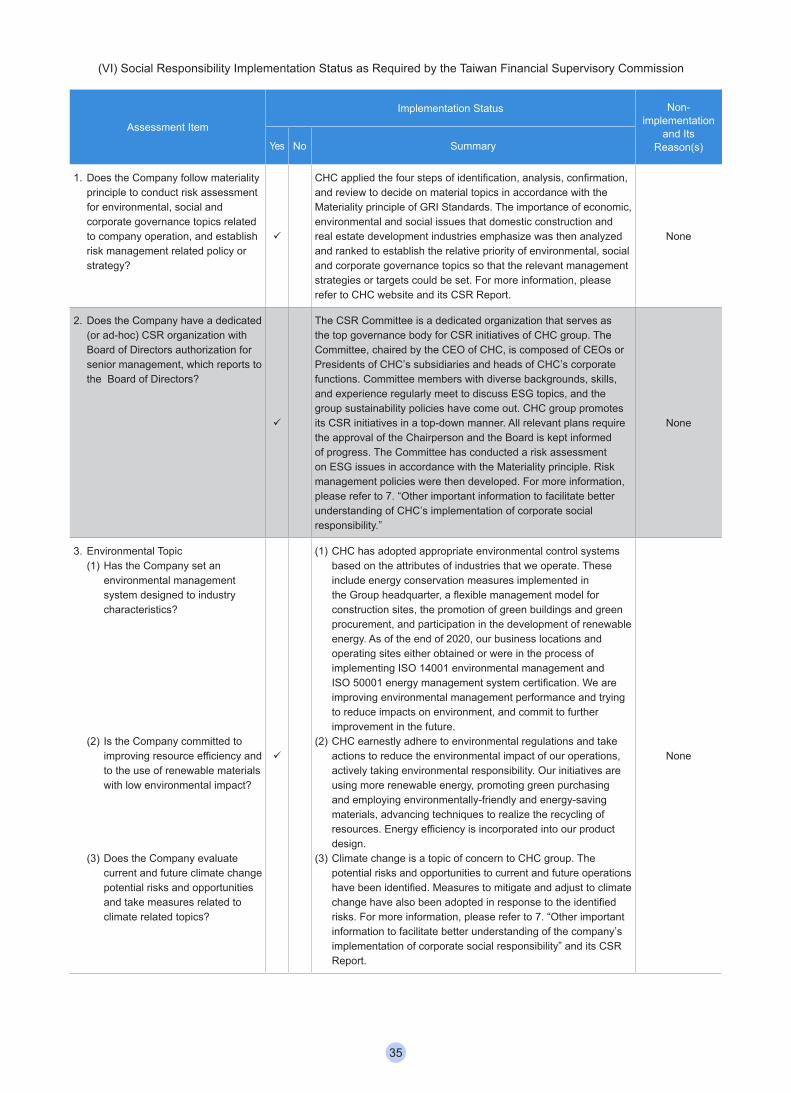
(VI) Social Responsibility Implementation Status as Required by the Taiwan Financial Supervisory Commission
Assessment Item
Implementation Status Non-implementation
and Its Reason(s)Yes No Summary
1. Does the Company follow materiality principle to conduct risk assessment for environmental, social and corporate governance topics related to company operation, and establish risk management related policy or strategy?
CHC applied the four steps of identification, analysis, confirmation, and review to decide on material topics in accordance with the Materiality principle of GRI Standards. The importance of economic, environmental and social issues that domestic construction and real estate development industries emphasize was then analyzed and ranked to establish the relative priority of environmental, social and corporate governance topics so that the relevant management strategies or targets could be set. For more information, please refer to CHC website and its CSR Report.
None
2. Does the Company have a dedicated (or ad-hoc) CSR organization with Board of Directors authorization for senior management, which reports to the Board of Directors?
The CSR Committee is a dedicated organization that serves as the top governance body for CSR initiatives of CHC group. The Committee, chaired by the CEO of CHC, is composed of CEOs or Presidents of CHC’s subsidiaries and heads of CHC’s corporate functions. Committee members with diverse backgrounds, skills, and experience regularly meet to discuss ESG topics, and the group sustainability policies have come out. CHC group promotes its CSR initiatives in a top-down manner. All relevant plans require the approval of the Chairperson and the Board is kept informed of progress. The Committee has conducted a risk assessment on ESG issues in accordance with the Materiality principle. Risk management policies were then developed. For more information, please refer to 7. “Other important information to facilitate better understanding of CHC’s implementation of corporate social responsibility.”
None
3. Environmental Topic(1) Has the Company set an
environmental management system designed to industry characteristics?
(2) Is the Company committed to improving resource efficiency and to the use of renewable materials with low environmental impact?
(3) Does the Company evaluate current and future climate change potential risks and opportunities and take measures related to climate related topics?
(1) CHC has adopted appropriate environmental control systems based on the attributes of industries that we operate. These include energy conservation measures implemented in the Group headquarter, a flexible management model for construction sites, the promotion of green buildings and green procurement, and participation in the development of renewable energy. As of the end of 2020, our business locations and operating sites either obtained or were in the process of implementing ISO 14001 environmental management and ISO 50001 energy management system certification. We are improving environmental management performance and trying to reduce impacts on environment, and commit to further improvement in the future.
(2) CHC earnestly adhere to environmental regulations and take actions to reduce the environmental impact of our operations, actively taking environmental responsibility. Our initiatives are using more renewable energy, promoting green purchasing and employing environmentally-friendly and energy-saving materials, advancing techniques to realize the recycling of resources. Energy efficiency is incorporated into our product design.
(3) Climate change is a topic of concern to CHC group. The potential risks and opportunities to current and future operations have been identified. Measures to mitigate and adjust to climate change have also been adopted in response to the identified risks. For more information, please refer to 7. “Other important information to facilitate better understanding of the company’s implementation of corporate social responsibility” and its CSR Report.
None
35
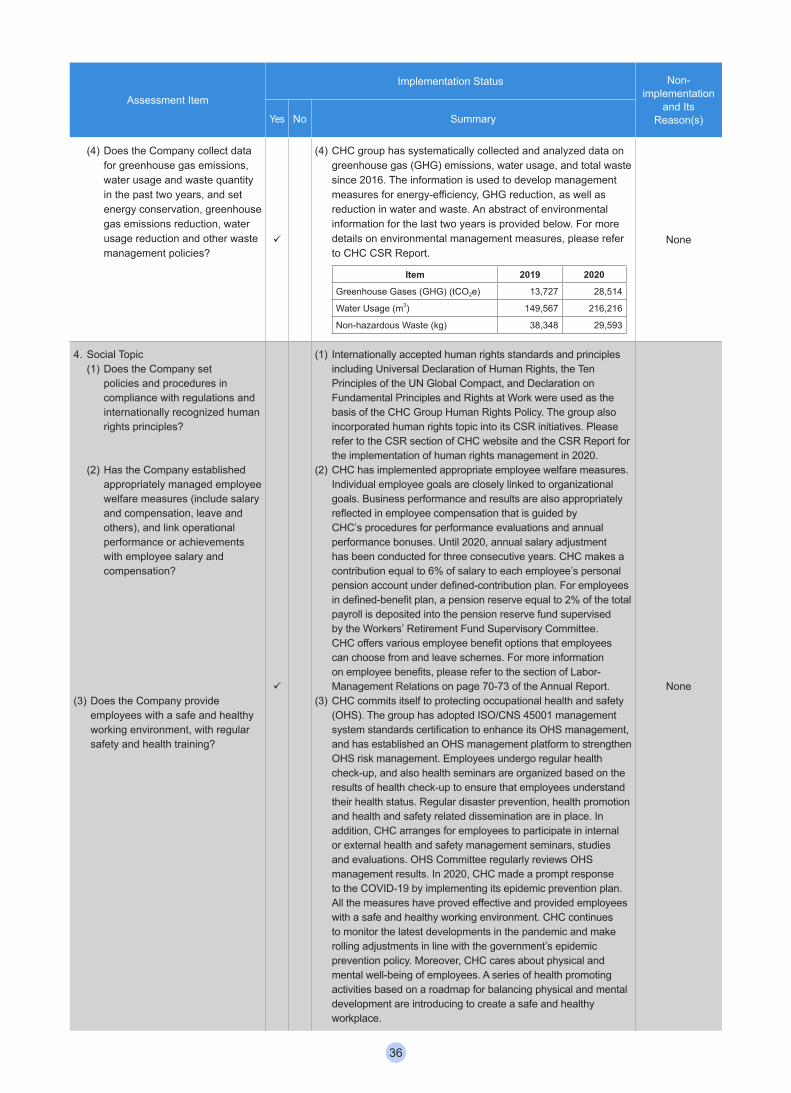
Assessment Item
Implementation Status Non-implementation
and Its Reason(s)Yes No Summary
(4) Does the Company collect data for greenhouse gas emissions, water usage and waste quantity in the past two years, and set energy conservation, greenhouse gas emissions reduction, water usage reduction and other waste management policies?
(4) CHC group has systematically collected and analyzed data on greenhouse gas (GHG) emissions, water usage, and total waste since 2016. The information is used to develop management measures for energy-efficiency, GHG reduction, as well as reduction in water and waste. An abstract of environmental information for the last two years is provided below. For more details on environmental management measures, please refer to CHC CSR Report.
Item 2019 2020
Greenhouse Gases (GHG) (tCO2e) 13,727 28,514
Water Usage (m3) 149,567 216,216
Non-hazardous Waste (kg) 38,348 29,593
None
4. Social Topic(1) Does the Company set
policies and procedures in compliance with regulations and internationally recognized human rights principles?
(2) Has the Company established appropriately managed employee welfare measures (include salary and compensation, leave and others), and link operational performance or achievements with employee salary and compensation?
(3) Does the Company provide employees with a safe and healthy working environment, with regular safety and health training?
(1) Internationally accepted human rights standards and principles including Universal Declaration of Human Rights, the Ten Principles of the UN Global Compact, and Declaration on Fundamental Principles and Rights at Work were used as the basis of the CHC Group Human Rights Policy. The group also incorporated human rights topic into its CSR initiatives. Please refer to the CSR section of CHC website and the CSR Report for the implementation of human rights management in 2020.
(2) CHC has implemented appropriate employee welfare measures. Individual employee goals are closely linked to organizational goals. Business performance and results are also appropriately reflected in employee compensation that is guided by CHC’s procedures for performance evaluations and annual performance bonuses. Until 2020, annual salary adjustment has been conducted for three consecutive years. CHC makes a contribution equal to 6% of salary to each employee’s personal pension account under defined-contribution plan. For employees in defined-benefit plan, a pension reserve equal to 2% of the total payroll is deposited into the pension reserve fund supervised by the Workers’ Retirement Fund Supervisory Committee. CHC offers various employee benefit options that employees can choose from and leave schemes. For more information on employee benefits, please refer to the section of Labor-Management Relations on page 70-73 of the Annual Report.
(3) CHC commits itself to protecting occupational health and safety (OHS). The group has adopted ISO/CNS 45001 management system standards certification to enhance its OHS management, and has established an OHS management platform to strengthen OHS risk management. Employees undergo regular health check-up, and also health seminars are organized based on the results of health check-up to ensure that employees understand their health status. Regular disaster prevention, health promotion and health and safety related dissemination are in place. In addition, CHC arranges for employees to participate in internal or external health and safety management seminars, studies and evaluations. OHS Committee regularly reviews OHS management results. In 2020, CHC made a prompt response to the COVID-19 by implementing its epidemic prevention plan. All the measures have proved effective and provided employees with a safe and healthy working environment. CHC continues to monitor the latest developments in the pandemic and make rolling adjustments in line with the government’s epidemic prevention policy. Moreover, CHC cares about physical and mental well-being of employees. A series of health promoting activities based on a roadmap for balancing physical and mental development are introducing to create a safe and healthy workplace.
None
36
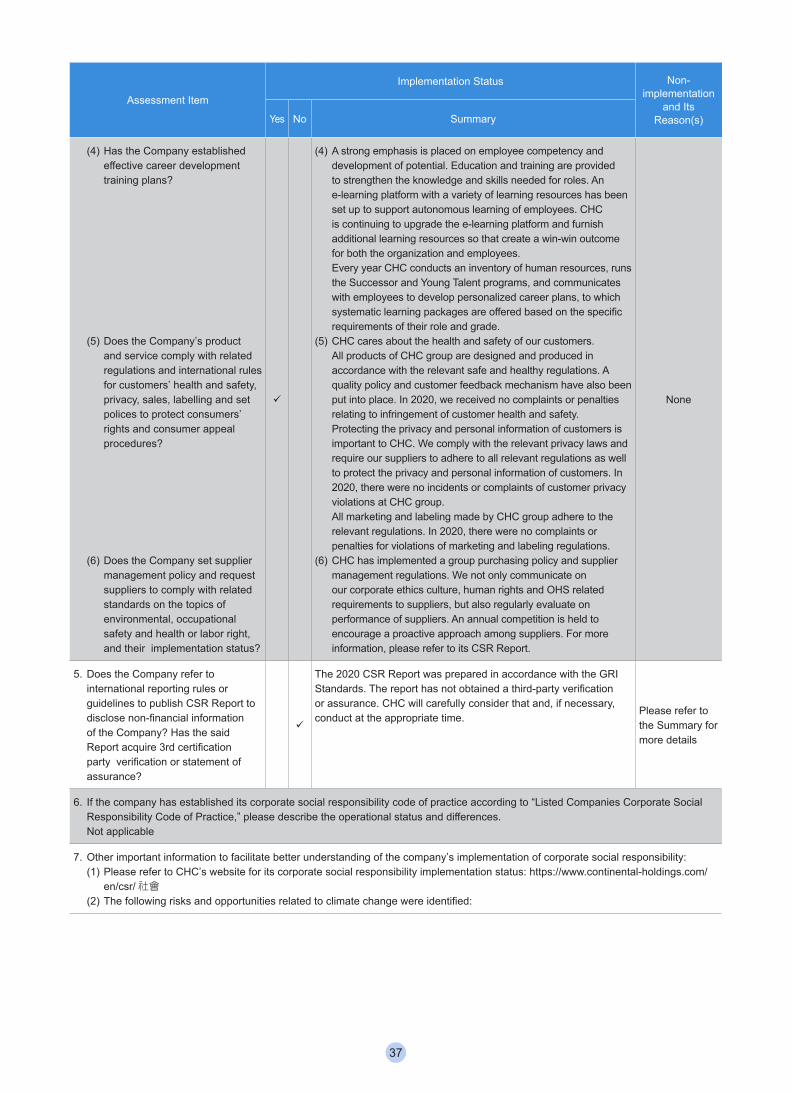
Assessment Item
Implementation Status Non-implementation
and Its Reason(s)Yes No Summary
(4) Has the Company established effective career development training plans?
(5) Does the Company’s product and service comply with related regulations and international rules for customers’ health and safety, privacy, sales, labelling and set polices to protect consumers’ rights and consumer appeal procedures?
(6) Does the Company set supplier management policy and request suppliers to comply with related standards on the topics of environmental, occupational safety and health or labor right, and their implementation status?
(4) A strong emphasis is placed on employee competency and development of potential. Education and training are provided to strengthen the knowledge and skills needed for roles. An e-learning platform with a variety of learning resources has been set up to support autonomous learning of employees. CHC is continuing to upgrade the e-learning platform and furnish additional learning resources so that create a win-win outcome for both the organization and employees.
Every year CHC conducts an inventory of human resources, runs the Successor and Young Talent programs, and communicates with employees to develop personalized career plans, to which systematic learning packages are offered based on the specific requirements of their role and grade.
(5) CHC cares about the health and safety of our customers. All products of CHC group are designed and produced in accordance with the relevant safe and healthy regulations. A quality policy and customer feedback mechanism have also been put into place. In 2020, we received no complaints or penalties relating to infringement of customer health and safety.
Protecting the privacy and personal information of customers is important to CHC. We comply with the relevant privacy laws and require our suppliers to adhere to all relevant regulations as well to protect the privacy and personal information of customers. In 2020, there were no incidents or complaints of customer privacy violations at CHC group.
All marketing and labeling made by CHC group adhere to the relevant regulations. In 2020, there were no complaints or penalties for violations of marketing and labeling regulations.
(6) CHC has implemented a group purchasing policy and supplier management regulations. We not only communicate on our corporate ethics culture, human rights and OHS related requirements to suppliers, but also regularly evaluate on performance of suppliers. An annual competition is held to encourage a proactive approach among suppliers. For more information, please refer to its CSR Report.
None
5. Does the Company refer to international reporting rules or guidelines to publish CSR Report to disclose non-financial information of the Company? Has the said Report acquire 3rd certification party verification or statement of assurance?
The 2020 CSR Report was prepared in accordance with the GRI Standards. The report has not obtained a third-party verification or assurance. CHC will carefully consider that and, if necessary, conduct at the appropriate time.
Please refer to the Summary for more details
6. If the company has established its corporate social responsibility code of practice according to “Listed Companies Corporate Social Responsibility Code of Practice,” please describe the operational status and differences.
Not applicable
7. Other important information to facilitate better understanding of the company’s implementation of corporate social responsibility:(1) Please refer to CHC’s website for its corporate social responsibility implementation status: https://www.continental-holdings.com/
en/csr/社會(2) The following risks and opportunities related to climate change were identified:
37
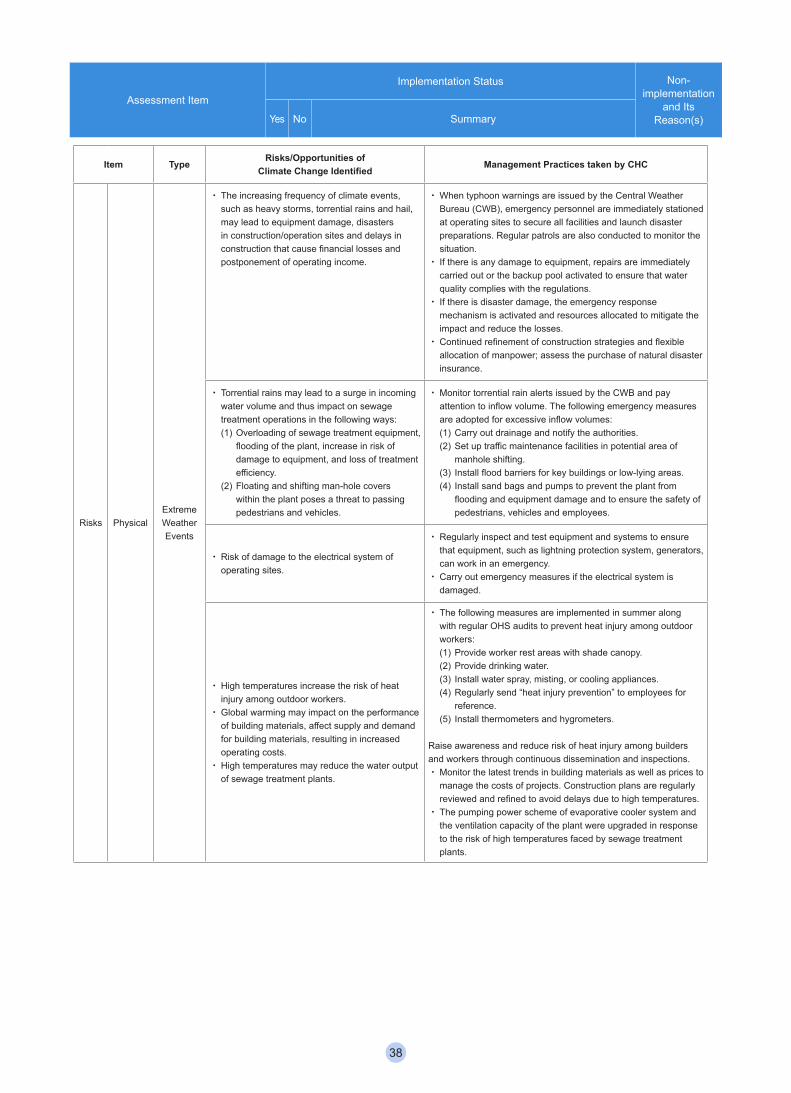
Assessment Item
Implementation Status Non-implementation
and Its Reason(s)Yes No Summary
Item Type Risks/Opportunities of Climate Change Identified Management Practices taken by CHC
Risks PhysicalExtreme Weather Events
‧ The increasing frequency of climate events, such as heavy storms, torrential rains and hail, may lead to equipment damage, disasters in construction/operation sites and delays in construction that cause financial losses and postponement of operating income.
‧ When typhoon warnings are issued by the Central Weather Bureau (CWB), emergency personnel are immediately stationed at operating sites to secure all facilities and launch disaster preparations. Regular patrols are also conducted to monitor the situation.
‧ If there is any damage to equipment, repairs are immediately carried out or the backup pool activated to ensure that water quality complies with the regulations.
‧ If there is disaster damage, the emergency response mechanism is activated and resources allocated to mitigate the impact and reduce the losses.
‧ Continued refinement of construction strategies and flexible allocation of manpower; assess the purchase of natural disaster insurance.
‧ Torrential rains may lead to a surge in incoming water volume and thus impact on sewage treatment operations in the following ways:(1) Overloading of sewage treatment equipment,
flooding of the plant, increase in risk of damage to equipment, and loss of treatment efficiency.
(2) Floating and shifting man-hole covers within the plant poses a threat to passing pedestrians and vehicles.
‧ Monitor torrential rain alerts issued by the CWB and pay attention to inflow volume. The following emergency measures are adopted for excessive inflow volumes:(1) Carry out drainage and notify the authorities.(2) Set up traffic maintenance facilities in potential area of
manhole shifting.(3) Install flood barriers for key buildings or low-lying areas.(4) Install sand bags and pumps to prevent the plant from
flooding and equipment damage and to ensure the safety of pedestrians, vehicles and employees.
‧ Risk of damage to the electrical system of operating sites.
‧ Regularly inspect and test equipment and systems to ensure that equipment, such as lightning protection system, generators, can work in an emergency.
‧ Carry out emergency measures if the electrical system is damaged.
‧ High temperatures increase the risk of heat injury among outdoor workers.
‧ Global warming may impact on the performance of building materials, affect supply and demand for building materials, resulting in increased operating costs.
‧ High temperatures may reduce the water output of sewage treatment plants.
‧ The following measures are implemented in summer along with regular OHS audits to prevent heat injury among outdoor workers:(1) Provide worker rest areas with shade canopy. (2) Provide drinking water.(3) Install water spray, misting, or cooling appliances.(4) Regularly send “heat injury prevention” to employees for
reference.(5) Install thermometers and hygrometers.
Raise awareness and reduce risk of heat injury among builders and workers through continuous dissemination and inspections.‧ Monitor the latest trends in building materials as well as prices to
manage the costs of projects. Construction plans are regularly reviewed and refined to avoid delays due to high temperatures.
‧ The pumping power scheme of evaporative cooler system and the ventilation capacity of the plant were upgraded in response to the risk of high temperatures faced by sewage treatment plants.
38
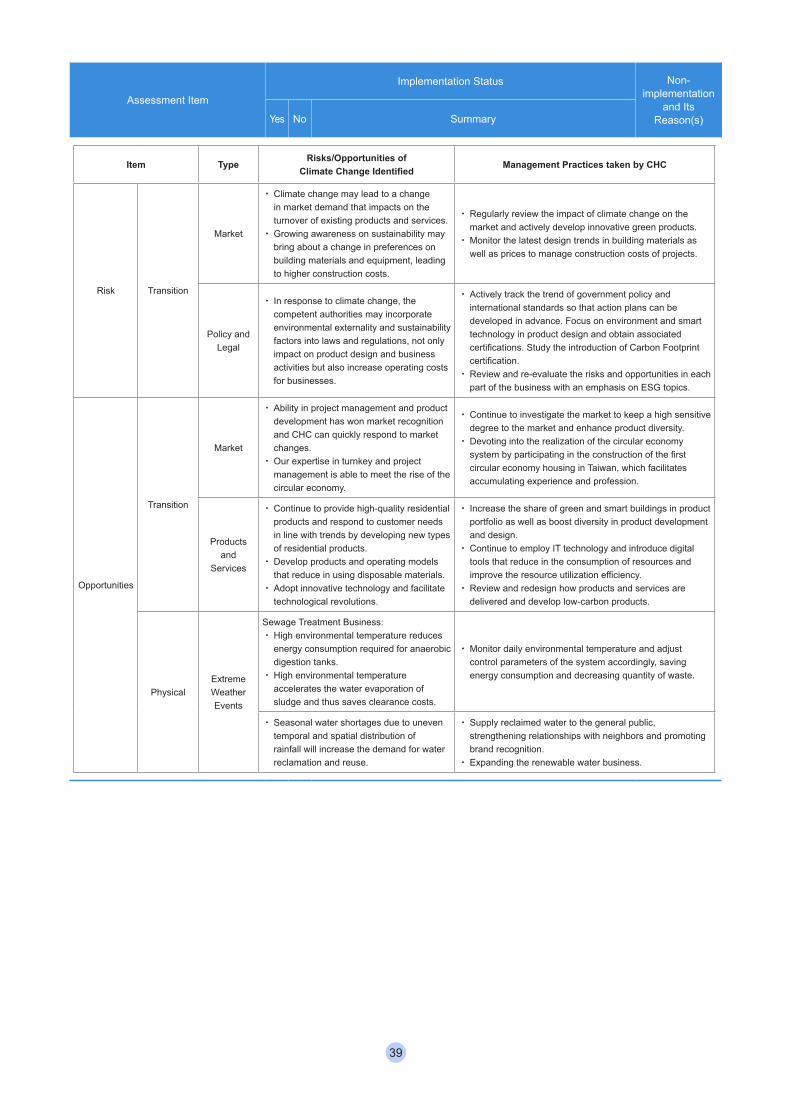
Assessment Item
Implementation Status Non-implementation
and Its Reason(s)Yes No Summary
Item Type Risks/Opportunities of Climate Change Identified Management Practices taken by CHC
Risk Transition
Market
‧ Climate change may lead to a change in market demand that impacts on the turnover of existing products and services.
‧ Growing awareness on sustainability may bring about a change in preferences on building materials and equipment, leading to higher construction costs.
‧ Regularly review the impact of climate change on the market and actively develop innovative green products.
‧ Monitor the latest design trends in building materials as well as prices to manage construction costs of projects.
Policy and Legal
‧ In response to climate change, the competent authorities may incorporate environmental externality and sustainability factors into laws and regulations, not only impact on product design and business activities but also increase operating costs for businesses.
‧ Actively track the trend of government policy and international standards so that action plans can be developed in advance. Focus on environment and smart technology in product design and obtain associated certifications. Study the introduction of Carbon Footprint certification.
‧ Review and re-evaluate the risks and opportunities in each part of the business with an emphasis on ESG topics.
Opportunities
Transition
Market
‧ Ability in project management and product development has won market recognition and CHC can quickly respond to market changes.
‧ Our expertise in turnkey and project management is able to meet the rise of the circular economy.
‧ Continue to investigate the market to keep a high sensitive degree to the market and enhance product diversity.
‧ Devoting into the realization of the circular economy system by participating in the construction of the first circular economy housing in Taiwan, which facilitates accumulating experience and profession.
Products and
Services
‧ Continue to provide high-quality residential products and respond to customer needs in line with trends by developing new types of residential products.
‧ Develop products and operating models that reduce in using disposable materials.
‧ Adopt innovative technology and facilitate technological revolutions.
‧ Increase the share of green and smart buildings in product portfolio as well as boost diversity in product development and design.
‧ Continue to employ IT technology and introduce digital tools that reduce in the consumption of resources and improve the resource utilization efficiency.
‧ Review and redesign how products and services are delivered and develop low-carbon products.
PhysicalExtreme Weather Events
Sewage Treatment Business:‧ High environmental temperature reduces
energy consumption required for anaerobic digestion tanks.
‧ High environmental temperature accelerates the water evaporation of sludge and thus saves clearance costs.
‧ Monitor daily environmental temperature and adjust control parameters of the system accordingly, saving energy consumption and decreasing quantity of waste.
‧ Seasonal water shortages due to uneven temporal and spatial distribution of rainfall will increase the demand for water reclamation and reuse.
‧ Supply reclaimed water to the general public, strengthening relationships with neighbors and promoting brand recognition.
‧ Expanding the renewable water business.
39
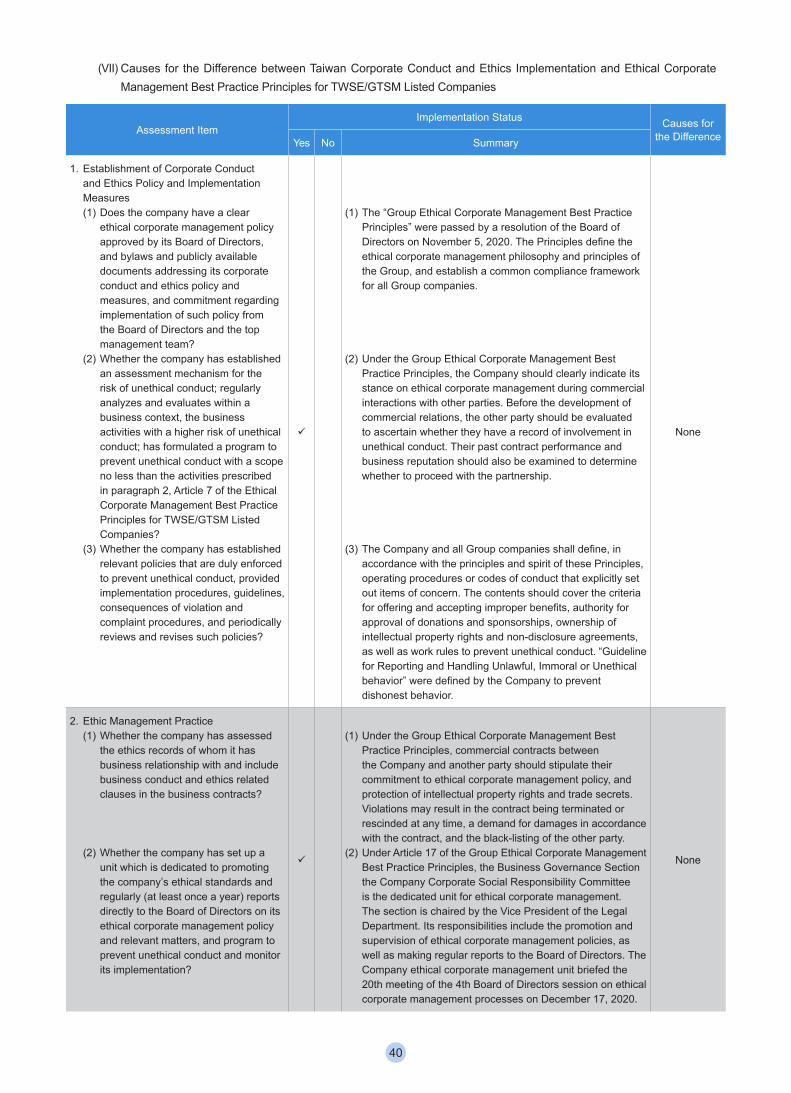
(VII) Causes for the Difference between Taiwan Corporate Conduct and Ethics Implementation and Ethical Corporate Management Best Practice Principles for TWSE/GTSM Listed Companies
Assessment ItemImplementation Status Causes for
the DifferenceYes No Summary
1. Establishment of Corporate Conduct and Ethics Policy and Implementation Measures (1) Does the company have a clear
ethical corporate management policy approved by its Board of Directors, and bylaws and publicly available documents addressing its corporate conduct and ethics policy and measures, and commitment regarding implementation of such policy from the Board of Directors and the top management team?
(2) Whether the company has established an assessment mechanism for the risk of unethical conduct; regularly analyzes and evaluates within a business context, the business activities with a higher risk of unethical conduct; has formulated a program to prevent unethical conduct with a scope no less than the activities prescribed in paragraph 2, Article 7 of the Ethical Corporate Management Best Practice Principles for TWSE/GTSM Listed Companies?
(3) Whether the company has established relevant policies that are duly enforced to prevent unethical conduct, provided implementation procedures, guidelines, consequences of violation and complaint procedures, and periodically reviews and revises such policies?
(1) The “Group Ethical Corporate Management Best Practice Principles” were passed by a resolution of the Board of Directors on November 5, 2020. The Principles define the ethical corporate management philosophy and principles of the Group, and establish a common compliance framework for all Group companies.
(2) Under the Group Ethical Corporate Management Best Practice Principles, the Company should clearly indicate its stance on ethical corporate management during commercial interactions with other parties. Before the development of commercial relations, the other party should be evaluated to ascertain whether they have a record of involvement in unethical conduct. Their past contract performance and business reputation should also be examined to determine whether to proceed with the partnership.
(3) The Company and all Group companies shall define, in accordance with the principles and spirit of these Principles, operating procedures or codes of conduct that explicitly set out items of concern. The contents should cover the criteria for offering and accepting improper benefits, authority for approval of donations and sponsorships, ownership of intellectual property rights and non-disclosure agreements, as well as work rules to prevent unethical conduct. “Guideline for Reporting and Handling Unlawful, Immoral or Unethical behavior” were defined by the Company to prevent dishonest behavior.
None
2. Ethic Management Practice(1) Whether the company has assessed
the ethics records of whom it has business relationship with and include business conduct and ethics related clauses in the business contracts?
(2) Whether the company has set up a unit which is dedicated to promoting the company’s ethical standards and regularly (at least once a year) reports directly to the Board of Directors on its ethical corporate management policy and relevant matters, and program to prevent unethical conduct and monitor its implementation?
(1) Under the Group Ethical Corporate Management Best Practice Principles, commercial contracts between the Company and another party should stipulate their commitment to ethical corporate management policy, and protection of intellectual property rights and trade secrets. Violations may result in the contract being terminated or rescinded at any time, a demand for damages in accordance with the contract, and the black-listing of the other party.
(2) Under Article 17 of the Group Ethical Corporate Management Best Practice Principles, the Business Governance Section the Company Corporate Social Responsibility Committee is the dedicated unit for ethical corporate management. The section is chaired by the Vice President of the Legal Department. Its responsibilities include the promotion and supervision of ethical corporate management policies, as well as making regular reports to the Board of Directors. The Company ethical corporate management unit briefed the 20th meeting of the 4th Board of Directors session on ethical corporate management processes on December 17, 2020.
None
40
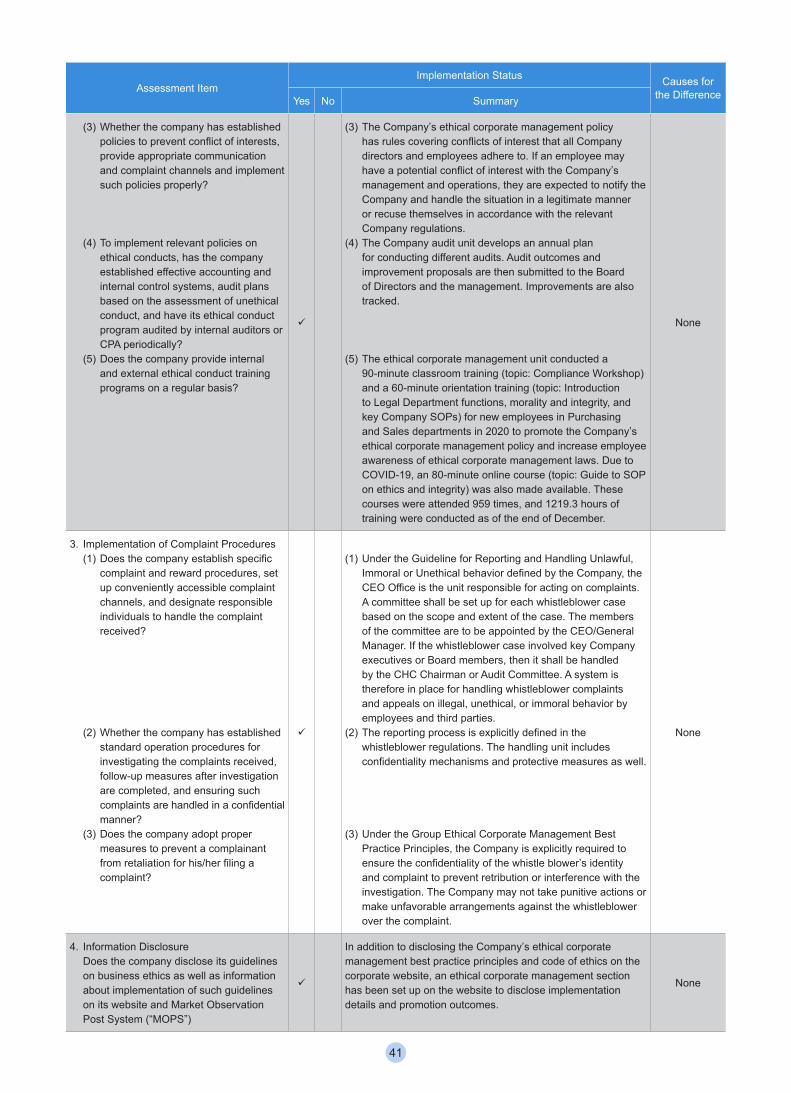
Assessment ItemImplementation Status Causes for
the DifferenceYes No Summary
(3) Whether the company has established policies to prevent conflict of interests, provide appropriate communication and complaint channels and implement such policies properly?
(4) To implement relevant policies on ethical conducts, has the company established effective accounting and internal control systems, audit plans based on the assessment of unethical conduct, and have its ethical conduct program audited by internal auditors or CPA periodically?
(5) Does the company provide internal and external ethical conduct training programs on a regular basis?
(3) The Company’s ethical corporate management policy has rules covering conflicts of interest that all Company directors and employees adhere to. If an employee may have a potential conflict of interest with the Company’s management and operations, they are expected to notify the Company and handle the situation in a legitimate manner or recuse themselves in accordance with the relevant Company regulations.
(4) The Company audit unit develops an annual plan for conducting different audits. Audit outcomes and improvement proposals are then submitted to the Board of Directors and the management. Improvements are also tracked.
(5) The ethical corporate management unit conducted a 90-minute classroom training (topic: Compliance Workshop) and a 60-minute orientation training (topic: Introduction to Legal Department functions, morality and integrity, and key Company SOPs) for new employees in Purchasing and Sales departments in 2020 to promote the Company’s ethical corporate management policy and increase employee awareness of ethical corporate management laws. Due to COVID-19, an 80-minute online course (topic: Guide to SOP on ethics and integrity) was also made available. These courses were attended 959 times, and 1219.3 hours of training were conducted as of the end of December.
None
3. Implementation of Complaint Procedures(1) Does the company establish specific
complaint and reward procedures, set up conveniently accessible complaint channels, and designate responsible individuals to handle the complaint received?
(2) Whether the company has established standard operation procedures for investigating the complaints received, follow-up measures after investigation are completed, and ensuring such complaints are handled in a confidential manner?
(3) Does the company adopt proper measures to prevent a complainant from retaliation for his/her filing a complaint?
(1) Under the Guideline for Reporting and Handling Unlawful, Immoral or Unethical behavior defined by the Company, the CEO Office is the unit responsible for acting on complaints. A committee shall be set up for each whistleblower case based on the scope and extent of the case. The members of the committee are to be appointed by the CEO/General Manager. If the whistleblower case involved key Company executives or Board members, then it shall be handled by the CHC Chairman or Audit Committee. A system is therefore in place for handling whistleblower complaints and appeals on illegal, unethical, or immoral behavior by employees and third parties.
(2) The reporting process is explicitly defined in the whistleblower regulations. The handling unit includes confidentiality mechanisms and protective measures as well.
(3) Under the Group Ethical Corporate Management Best Practice Principles, the Company is explicitly required to ensure the confidentiality of the whistle blower’s identity and complaint to prevent retribution or interference with the investigation. The Company may not take punitive actions or make unfavorable arrangements against the whistleblower over the complaint.
None
4. Information Disclosure Does the company disclose its guidelines
on business ethics as well as information about implementation of such guidelines on its website and Market Observation Post System (“MOPS”)
In addition to disclosing the Company’s ethical corporate management best practice principles and code of ethics on the corporate website, an ethical corporate management section has been set up on the website to disclose implementation details and promotion outcomes.
None
41
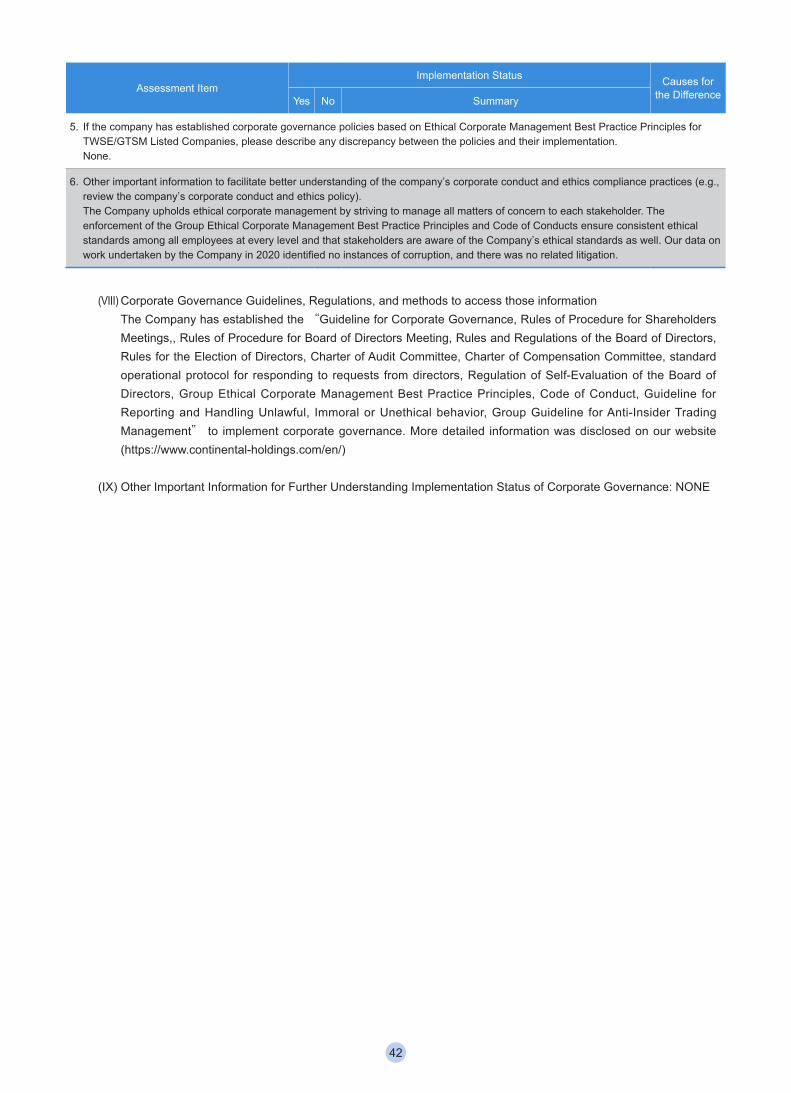
Assessment ItemImplementation Status Causes for
the DifferenceYes No Summary
5. If the company has established corporate governance policies based on Ethical Corporate Management Best Practice Principles for TWSE/GTSM Listed Companies, please describe any discrepancy between the policies and their implementation.
None.
6. Other important information to facilitate better understanding of the company’s corporate conduct and ethics compliance practices (e.g., review the company’s corporate conduct and ethics policy).
The Company upholds ethical corporate management by striving to manage all matters of concern to each stakeholder. The enforcement of the Group Ethical Corporate Management Best Practice Principles and Code of Conducts ensure consistent ethical standards among all employees at every level and that stakeholders are aware of the Company’s ethical standards as well. Our data on work undertaken by the Company in 2020 identified no instances of corruption, and there was no related litigation.
(VIII) Corporate Governance Guidelines, Regulations, and methods to access those informationThe Company has established the “Guideline for Corporate Governance, Rules of Procedure for Shareholders Meetings,, Rules of Procedure for Board of Directors Meeting, Rules and Regulations of the Board of Directors, Rules for the Election of Directors, Charter of Audit Committee, Charter of Compensation Committee, standard operational protocol for responding to requests from directors, Regulation of Self-Evaluation of the Board of Directors, Group Ethical Corporate Management Best Practice Principles, Code of Conduct, Guideline for Reporting and Handling Unlawful, Immoral or Unethical behavior, Group Guideline for Anti-Insider Trading Management" to implement corporate governance. More detailed information was disclosed on our website (https://www.continental-holdings.com/en/)
(IX) Other Important Information for Further Understanding Implementation Status of Corporate Governance: NONE
42
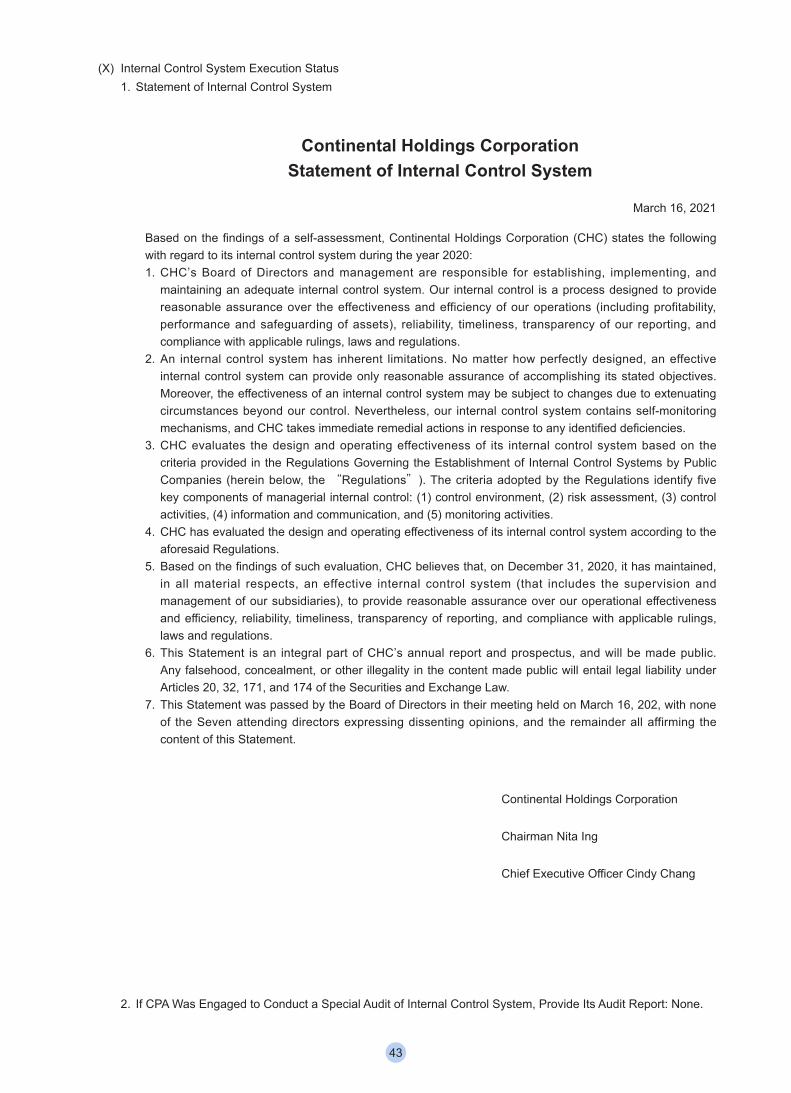
(X) Internal Control System Execution Status1. Statement of Internal Control System
Continental Holdings CorporationStatement of Internal Control System
March 16, 2021
Based on the findings of a self-assessment, Continental Holdings Corporation (CHC) states the following with regard to its internal control system during the year 2020:1. CHC’s Board of Directors and management are responsible for establishing, implementing, and
maintaining an adequate internal control system. Our internal control is a process designed to provide reasonable assurance over the effectiveness and efficiency of our operations (including profitability, performance and safeguarding of assets), reliability, timeliness, transparency of our reporting, and compliance with applicable rulings, laws and regulations.
2. An internal control system has inherent limitations. No matter how perfectly designed, an effective internal control system can provide only reasonable assurance of accomplishing its stated objectives. Moreover, the effectiveness of an internal control system may be subject to changes due to extenuating circumstances beyond our control. Nevertheless, our internal control system contains self-monitoring mechanisms, and CHC takes immediate remedial actions in response to any identified deficiencies.
3. CHC evaluates the design and operating effectiveness of its internal control system based on the criteria provided in the Regulations Governing the Establishment of Internal Control Systems by Public Companies (herein below, the “Regulations"). The criteria adopted by the Regulations identify five key components of managerial internal control: (1) control environment, (2) risk assessment, (3) control activities, (4) information and communication, and (5) monitoring activities.
4. CHC has evaluated the design and operating effectiveness of its internal control system according to the aforesaid Regulations.
5. Based on the findings of such evaluation, CHC believes that, on December 31, 2020, it has maintained, in all material respects, an effective internal control system (that includes the supervision and management of our subsidiaries), to provide reasonable assurance over our operational effectiveness and efficiency, reliability, timeliness, transparency of reporting, and compliance with applicable rulings, laws and regulations.
6. This Statement is an integral part of CHC’s annual report and prospectus, and will be made public. Any falsehood, concealment, or other illegality in the content made public will entail legal liability under Articles 20, 32, 171, and 174 of the Securities and Exchange Law.
7. This Statement was passed by the Board of Directors in their meeting held on March 16, 202, with none of the Seven attending directors expressing dissenting opinions, and the remainder all affirming the content of this Statement.
Continental Holdings Corporation
Chairman Nita Ing
Chief Executive Officer Cindy Chang
2. If CPA Was Engaged to Conduct a Special Audit of Internal Control System, Provide Its Audit Report: None.
43
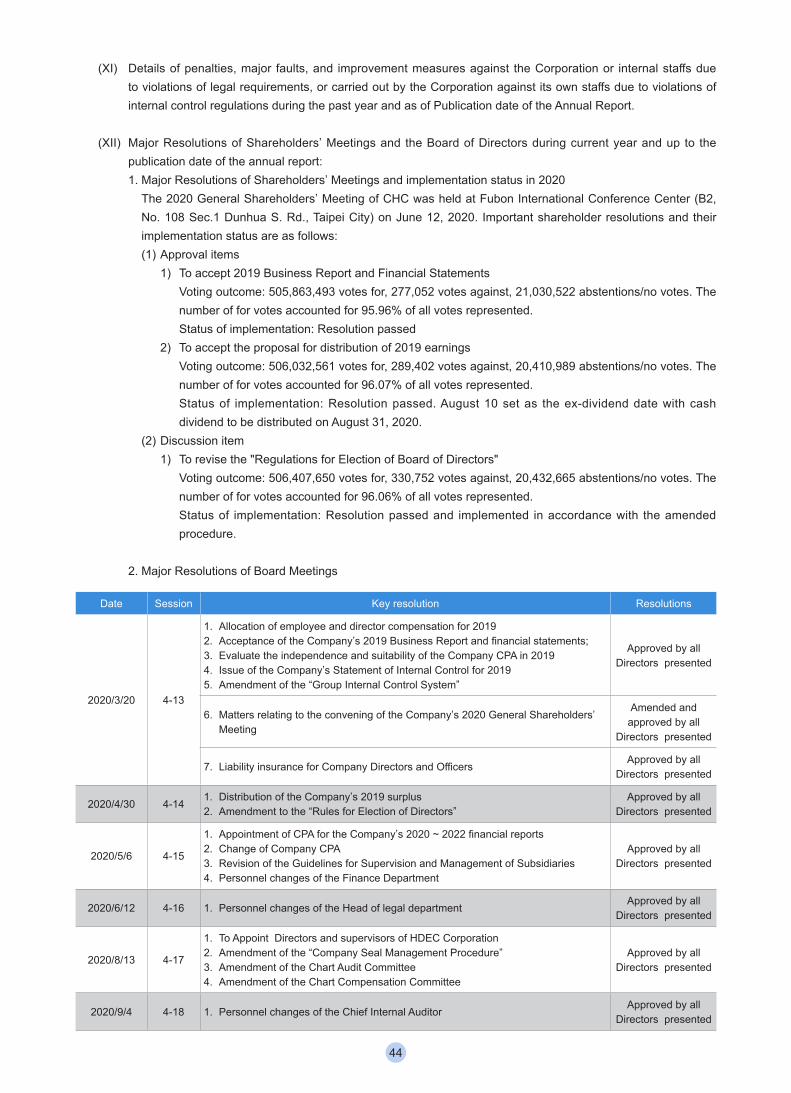
(XI) Details of penalties, major faults, and improvement measures against the Corporation or internal staffs due to violations of legal requirements, or carried out by the Corporation against its own staffs due to violations of internal control regulations during the past year and as of Publication date of the Annual Report.
(XII) Major Resolutions of Shareholders’ Meetings and the Board of Directors during current year and up to the publication date of the annual report:1. Major Resolutions of Shareholders’ Meetings and implementation status in 2020 The 2020 General Shareholders’ Meeting of CHC was held at Fubon International Conference Center (B2,
No. 108 Sec.1 Dunhua S. Rd., Taipei City) on June 12, 2020. Important shareholder resolutions and their implementation status are as follows:(1) Approval items
1) To accept 2019 Business Report and Financial Statements Voting outcome: 505,863,493 votes for, 277,052 votes against, 21,030,522 abstentions/no votes. The
number of for votes accounted for 95.96% of all votes represented. Status of implementation: Resolution passed2) To accept the proposal for distribution of 2019 earnings Voting outcome: 506,032,561 votes for, 289,402 votes against, 20,410,989 abstentions/no votes. The
number of for votes accounted for 96.07% of all votes represented. Status of implementation: Resolution passed. August 10 set as the ex-dividend date with cash
dividend to be distributed on August 31, 2020.(2) Discussion item
1) To revise the "Regulations for Election of Board of Directors" Voting outcome: 506,407,650 votes for, 330,752 votes against, 20,432,665 abstentions/no votes. The
number of for votes accounted for 96.06% of all votes represented. Status of implementation: Resolution passed and implemented in accordance with the amended
procedure.
2. Major Resolutions of Board Meetings
Date Session Key resolution Resolutions
2020/3/20 4-13
1. Allocation of employee and director compensation for 20192. Acceptance of the Company’s 2019 Business Report and financial statements;3. Evaluate the independence and suitability of the Company CPA in 20194. Issue of the Company’s Statement of Internal Control for 20195. Amendment of the “Group Internal Control System”
Approved by all Directors presented
6. Matters relating to the convening of the Company’s 2020 General Shareholders’ Meeting
Amended and approved by all
Directors presented
7. Liability insurance for Company Directors and OfficersApproved by all
Directors presented
2020/4/30 4-141. Distribution of the Company’s 2019 surplus2. Amendment to the “Rules for Election of Directors”
Approved by all Directors presented
2020/5/6 4-15
1. Appointment of CPA for the Company’s 2020 ~ 2022 financial reports2. Change of Company CPA3. Revision of the Guidelines for Supervision and Management of Subsidiaries4. Personnel changes of the Finance Department
Approved by all Directors presented
2020/6/12 4-16 1. Personnel changes of the Head of legal departmentApproved by all
Directors presented
2020/8/13 4-17
1. To Appoint Directors and supervisors of HDEC Corporation2. Amendment of the “Company Seal Management Procedure”3. Amendment of the Chart Audit Committee4. Amendment of the Chart Compensation Committee
Approved by all Directors presented
2020/9/4 4-18 1. Personnel changes of the Chief Internal AuditorApproved by all
Directors presented
44

Date Session Key resolution Resolutions
2020/11/5 4-19
1. To approve the Cash capital increase for CEC2. Subscription to the cash capital increase for CEC3. To approve the Cash capital reduction for CEC4. Proposed issue of ordinary corporate bonds by the Company5. Revision of the Guideline on related party transactions6. Revision of the Guideline for Budget Management7. Formulation of the “Group Risk Management Policy”8. Formulation of the “Group Ethical Policy”9. Formulation of the “Corporate Governance Principles”
Approved by all Directors presented
2020/12/17 4-20
1. Approval of 2021 budget of the Company2. Approval of 2021 audit plan of the Company
Approved by all Directors presented
3. Revision of the Rules for Performance Evaluation of Board of DirectorsApproved by all
Directors presented
2021/1/21 4-21
1. Lending funds to HDEC 2. To assign the Corporate Secretary3. CHC executive performance bonus evaluation and bonuses for 20204. 2021 Performance targets for CHC executives
Approved by all Directors presented
2021/3/16 4-22
1. To report the status of the Board Evaluations in 2020.2. To approve Distribution of 2020 employees' compensation and Directors'
remuneration.3. To review 2020 business report and financial Statements.4. To review the proposal for appropriation of 2020 earings.5. To approve the distribution of 2020 Cash Dividends6. Amendment to "Articles of Incorporation"7. Board nominations for the 7 Directors of the 5th Board of Directors8. To release non-competition restrictions on the members of the 5th Board of
Directors9. Convening the 2021 General Shareholders' Meeting10. Lending funds to HDEC 11. Evaluate the independence and suitability of the Company CPA in 202012. Change of the CPA13. Issue of the Company's statement of Internal Control for 202014. To review the Liability insurance for the Company Directors and officer15. To review the Directors' remuneration16. To appoint the Corporate Governance Officer17. To release non-competition restrictions on the manager18. Adjustments of Company’s organization
Approved by all Directors presented
(XIII) Major Issues of Record or Written Statements Made by Any Director Dissenting to Important Resolutions Passed by the Board of Directors during 2020 and as of the Date of this Annual Report: None.
(XVI) Resignation or Dismissal of Chairman, President, and Heads of Accounting, Finance, Internal Audit, Corporate Governance Officer and R&D during 2019 and as of the Date of this Annual Report:1. Mr. Eric Hsu, Chief Internal Auditor, resigned his position on September 30, 2020. Ms. Louise Tsao, Assistant
Manager of the Audit Office, took over as the acting Chief Internal Auditor between October 1 and October 14, 2020. Ms. Charleen Chang was appointed as the Chief Internal Auditor as of October 15, 2020.
45
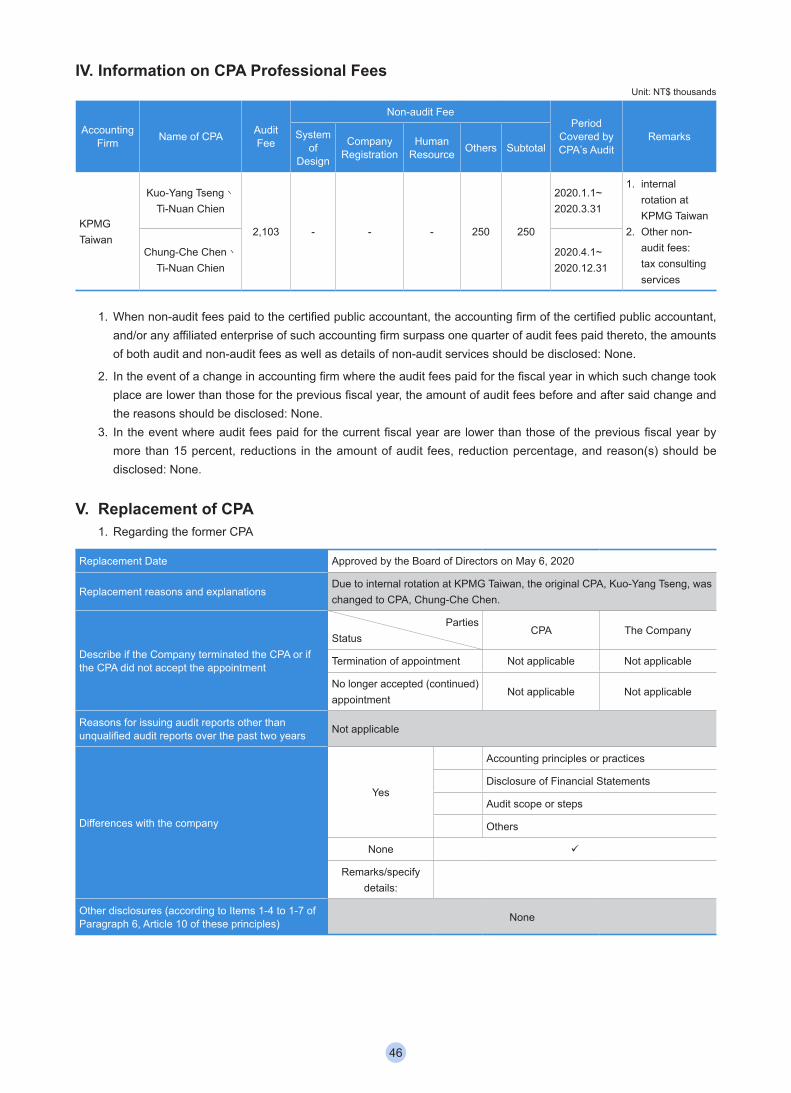
IV. Information on CPA Professional FeesUnit: NT$ thousands
Accounting Firm Name of CPA Audit
Fee
Non-audit FeePeriod
Covered by CPA’s Audit
RemarksSystem of
Design
Company Registration
Human Resource Others Subtotal
KPMG Taiwan
Kuo-Yang Tseng、Ti-Nuan Chien
2,103 - - - 250 250
2020.1.1~2020.3.31
1. internal rotation at KPMG Taiwan
2. Other non-audit fees: tax consulting services
Chung-Che Chen、Ti-Nuan Chien
2020.4.1~2020.12.31
1. When non-audit fees paid to the certified public accountant, the accounting firm of the certified public accountant, and/or any affiliated enterprise of such accounting firm surpass one quarter of audit fees paid thereto, the amounts of both audit and non-audit fees as well as details of non-audit services should be disclosed: None.
2. In the event of a change in accounting firm where the audit fees paid for the fiscal year in which such change took place are lower than those for the previous fiscal year, the amount of audit fees before and after said change and the reasons should be disclosed: None.
3. In the event where audit fees paid for the current fiscal year are lower than those of the previous fiscal year by more than 15 percent, reductions in the amount of audit fees, reduction percentage, and reason(s) should be disclosed: None.
V. Replacement of CPA1. Regarding the former CPA
Replacement Date Approved by the Board of Directors on May 6, 2020
Replacement reasons and explanationsDue to internal rotation at KPMG Taiwan, the original CPA, Kuo-Yang Tseng, was changed to CPA, Chung-Che Chen.
Describe if the Company terminated the CPA or if the CPA did not accept the appointment
PartiesStatus
CPA The Company
Termination of appointment Not applicable Not applicable
No longer accepted (continued) appointment
Not applicable Not applicable
Reasons for issuing audit reports other than unqualified audit reports over the past two years Not applicable
Differences with the company
Yes
Accounting principles or practices
Disclosure of Financial Statements
Audit scope or steps
Others
None
Remarks/specify details:
Other disclosures (according to Items 1-4 to 1-7 of Paragraph 6, Article 10 of these principles) None
46
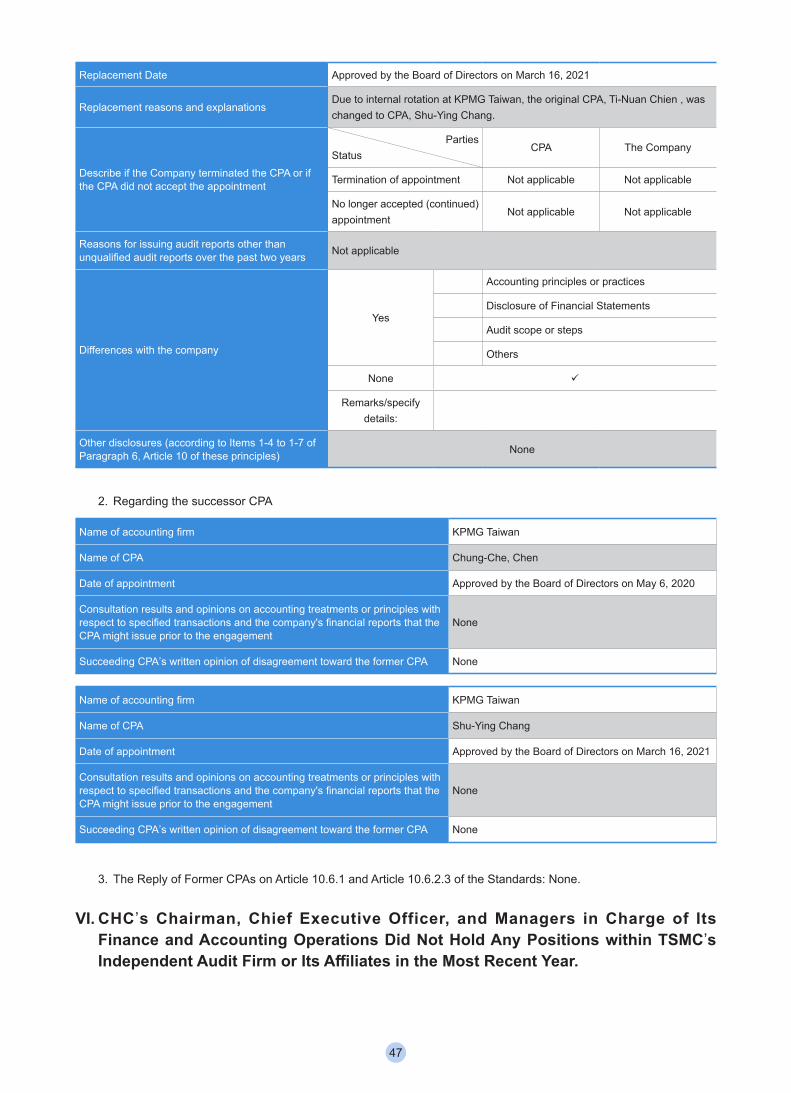
Replacement Date Approved by the Board of Directors on March 16, 2021
Replacement reasons and explanationsDue to internal rotation at KPMG Taiwan, the original CPA, Ti-Nuan Chien , was changed to CPA, Shu-Ying Chang.
Describe if the Company terminated the CPA or if the CPA did not accept the appointment
PartiesStatus
CPA The Company
Termination of appointment Not applicable Not applicable
No longer accepted (continued) appointment
Not applicable Not applicable
Reasons for issuing audit reports other than unqualified audit reports over the past two years Not applicable
Differences with the company
Yes
Accounting principles or practices
Disclosure of Financial Statements
Audit scope or steps
Others
None
Remarks/specify details:
Other disclosures (according to Items 1-4 to 1-7 of Paragraph 6, Article 10 of these principles) None
2. Regarding the successor CPA
Name of accounting firm KPMG Taiwan
Name of CPA Chung-Che, Chen
Date of appointment Approved by the Board of Directors on May 6, 2020
Consultation results and opinions on accounting treatments or principles with respect to specified transactions and the company's financial reports that the CPA might issue prior to the engagement
None
Succeeding CPA’s written opinion of disagreement toward the former CPA None
Name of accounting firm KPMG Taiwan
Name of CPA Shu-Ying Chang
Date of appointment Approved by the Board of Directors on March 16, 2021
Consultation results and opinions on accounting treatments or principles with respect to specified transactions and the company's financial reports that the CPA might issue prior to the engagement
None
Succeeding CPA’s written opinion of disagreement toward the former CPA None
3. The Reply of Former CPAs on Article 10.6.1 and Article 10.6.2.3 of the Standards: None.
VI. CHC’s Chairman, Chief Executive Officer, and Managers in Charge of Its Finance and Accounting Operations Did Not Hold Any Positions within TSMC’s Independent Audit Firm or Its Affiliates in the Most Recent Year.
47
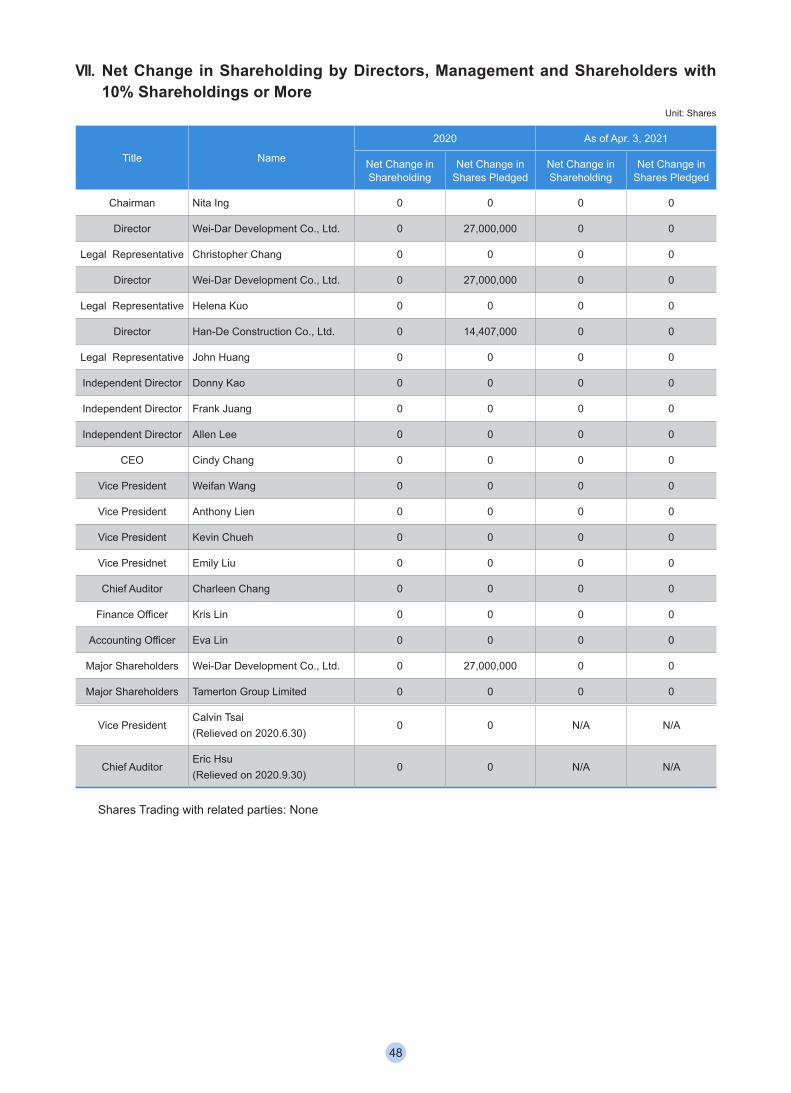
VII. Net Change in Shareholding by Directors, Management and Shareholders with 10% Shareholdings or More
Unit: Shares
Title Name
2020 As of Apr. 3, 2021
Net Change in Shareholding
Net Change in Shares Pledged
Net Change in Shareholding
Net Change in Shares Pledged
Chairman Nita Ing 0 0 0 0
Director Wei-Dar Development Co., Ltd. 0 27,000,000 0 0
Legal Representative Christopher Chang 0 0 0 0
Director Wei-Dar Development Co., Ltd. 0 27,000,000 0 0
Legal Representative Helena Kuo 0 0 0 0
Director Han-De Construction Co., Ltd. 0 14,407,000 0 0
Legal Representative John Huang 0 0 0 0
Independent Director Donny Kao 0 0 0 0
Independent Director Frank Juang 0 0 0 0
Independent Director Allen Lee 0 0 0 0
CEO Cindy Chang 0 0 0 0
Vice President Weifan Wang 0 0 0 0
Vice President Anthony Lien 0 0 0 0
Vice President Kevin Chueh 0 0 0 0
Vice Presidnet Emily Liu 0 0 0 0
Chief Auditor Charleen Chang 0 0 0 0
Finance Officer Kris Lin 0 0 0 0
Accounting Officer Eva Lin 0 0 0 0
Major Shareholders Wei-Dar Development Co., Ltd. 0 27,000,000 0 0
Major Shareholders Tamerton Group Limited 0 0 0 0
Vice PresidentCalvin Tsai(Relieved on 2020.6.30)
0 0 N/A N/A
Chief AuditorEric Hsu (Relieved on 2020.9.30)
0 0 N/A N/A
Shares Trading with related parties: None
48
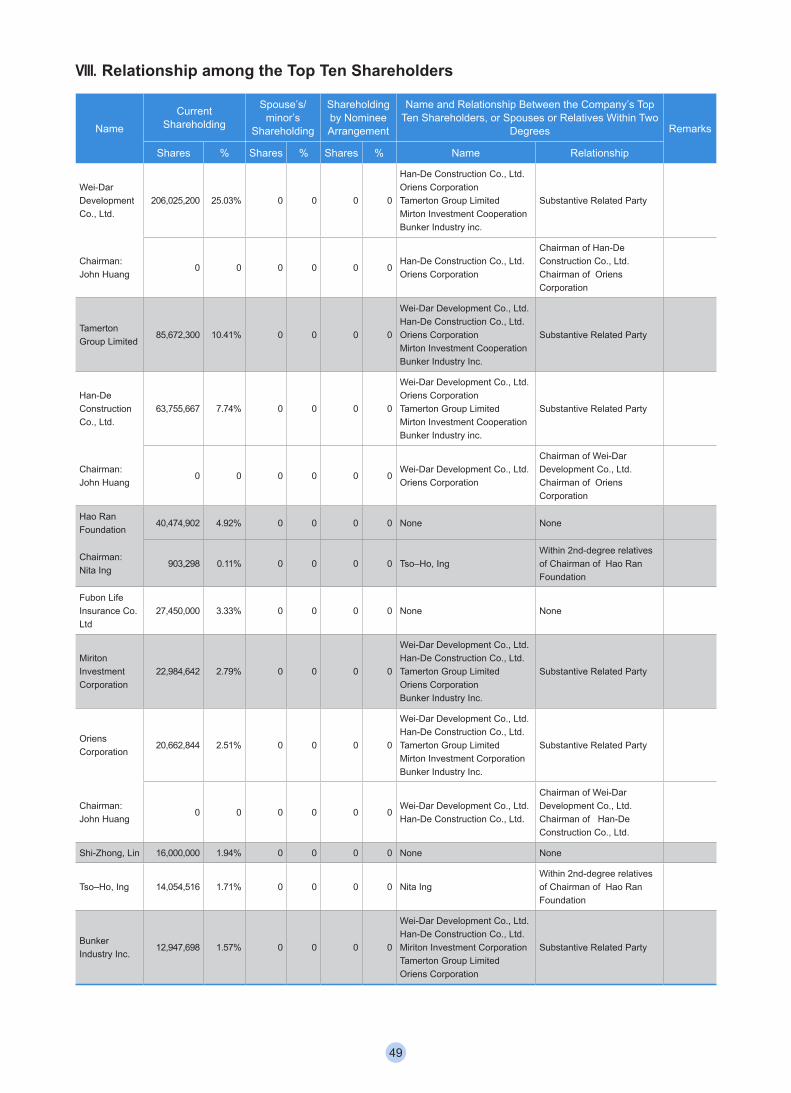
VIII. Relationship among the Top Ten Shareholders
NameCurrent
Shareholding
Spouse’s/minor’s
Shareholding
Shareholding by Nominee Arrangement
Name and Relationship Between the Company’s Top Ten Shareholders, or Spouses or Relatives Within Two
Degrees Remarks
Shares % Shares % Shares % Name Relationship
Wei-Dar Development Co., Ltd.
206,025,200 25.03% 0 0 0 0
Han-De Construction Co., Ltd.Oriens Corporation Tamerton Group LimitedMirton Investment CooperationBunker Industry inc.
Substantive Related Party
Chairman: John Huang
0 0 0 0 0 0Han-De Construction Co., Ltd.Oriens Corporation
Chairman of Han-De Construction Co., Ltd.Chairman of Oriens Corporation
Tamerton Group Limited
85,672,300 10.41% 0 0 0 0
Wei-Dar Development Co., Ltd.Han-De Construction Co., Ltd.Oriens CorporationMirton Investment CooperationBunker Industry Inc.
Substantive Related Party
Han-De Construction Co., Ltd.
63,755,667 7.74% 0 0 0 0
Wei-Dar Development Co., Ltd.Oriens CorporationTamerton Group LimitedMirton Investment CooperationBunker Industry inc.
Substantive Related Party
Chairman: John Huang
0 0 0 0 0 0Wei-Dar Development Co., Ltd.Oriens Corporation
Chairman of Wei-Dar Development Co., Ltd.Chairman of Oriens Corporation
Hao Ran Foundation
40,474,902 4.92% 0 0 0 0 None None
Chairman: Nita Ing
903,298 0.11% 0 0 0 0 Tso–Ho, IngWithin 2nd-degree relatives of Chairman of Hao Ran Foundation
Fubon Life Insurance Co. Ltd
27,450,000 3.33% 0 0 0 0 None None
Miriton Investment Corporation
22,984,642 2.79% 0 0 0 0
Wei-Dar Development Co., Ltd.Han-De Construction Co., Ltd.Tamerton Group LimitedOriens CorporationBunker Industry Inc.
Substantive Related Party
Oriens Corporation
20,662,844 2.51% 0 0 0 0
Wei-Dar Development Co., Ltd.Han-De Construction Co., Ltd.Tamerton Group LimitedMirton Investment CorporationBunker Industry Inc.
Substantive Related Party
Chairman: John Huang
0 0 0 0 0 0Wei-Dar Development Co., Ltd.Han-De Construction Co., Ltd.
Chairman of Wei-Dar Development Co., Ltd.Chairman of Han-De Construction Co., Ltd.
Shi-Zhong, Lin 16,000,000 1.94% 0 0 0 0 None None
Tso–Ho, Ing 14,054,516 1.71% 0 0 0 0 Nita IngWithin 2nd-degree relatives of Chairman of Hao Ran Foundation
Bunker Industry Inc.
12,947,698 1.57% 0 0 0 0
Wei-Dar Development Co., Ltd.Han-De Construction Co., Ltd.Miriton Investment CorporationTamerton Group LimitedOriens Corporation
Substantive Related Party
49
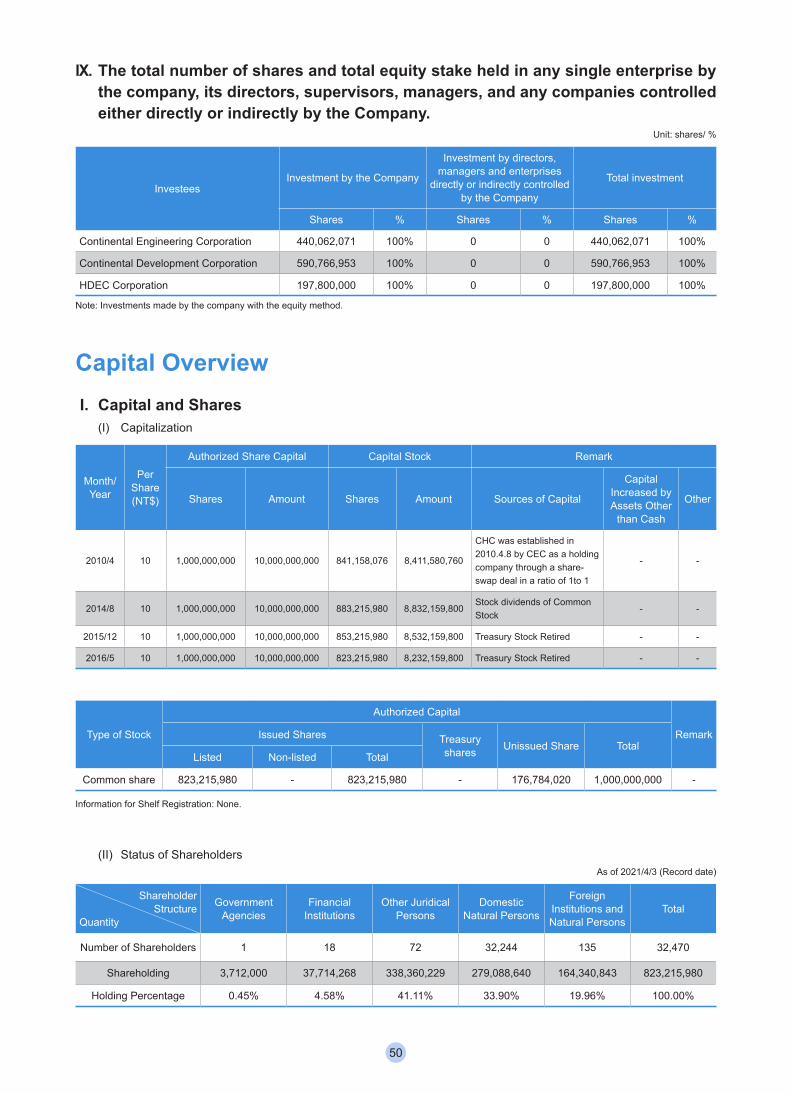
IX. The total number of shares and total equity stake held in any single enterprise by the company, its directors, supervisors, managers, and any companies controlled either directly or indirectly by the Company.
Unit: shares/ %
InvesteesInvestment by the Company
Investment by directors, managers and enterprises
directly or indirectly controlled by the Company
Total investment
Shares % Shares % Shares %
Continental Engineering Corporation 440,062,071 100% 0 0 440,062,071 100%
Continental Development Corporation 590,766,953 100% 0 0 590,766,953 100%
HDEC Corporation 197,800,000 100% 0 0 197,800,000 100%
Note: Investments made by the company with the equity method.
Capital Overview I. Capital and Shares
(I) Capitalization
Month/Year
PerShare(NT$)
Authorized Share Capital Capital Stock Remark
Shares Amount Shares Amount Sources of Capital
Capital Increased by Assets Other
than Cash
Other
2010/4 10 1,000,000,000 10,000,000,000 841,158,076 8,411,580,760
CHC was established in 2010.4.8 by CEC as a holding company through a share-swap deal in a ratio of 1to 1
- -
2014/8 10 1,000,000,000 10,000,000,000 883,215,980 8,832,159,800Stock dividends of Common Stock
- -
2015/12 10 1,000,000,000 10,000,000,000 853,215,980 8,532,159,800 Treasury Stock Retired - -
2016/5 10 1,000,000,000 10,000,000,000 823,215,980 8,232,159,800 Treasury Stock Retired - -
Type of Stock
Authorized Capital
RemarkIssued Shares Treasury shares Unissued Share Total
Listed Non-listed Total
Common share 823,215,980 - 823,215,980 - 176,784,020 1,000,000,000 -
Information for Shelf Registration: None.
(II) Status of ShareholdersAs of 2021/4/3 (Record date)
Shareholder Structure
Quantity
Government Agencies
Financial Institutions
Other Juridical Persons
Domestic Natural Persons
Foreign Institutions and Natural Persons
Total
Number of Shareholders 1 18 72 32,244 135 32,470
Shareholding 3,712,000 37,714,268 338,360,229 279,088,640 164,340,843 823,215,980
Holding Percentage 0.45% 4.58% 41.11% 33.90% 19.96% 100.00%
50
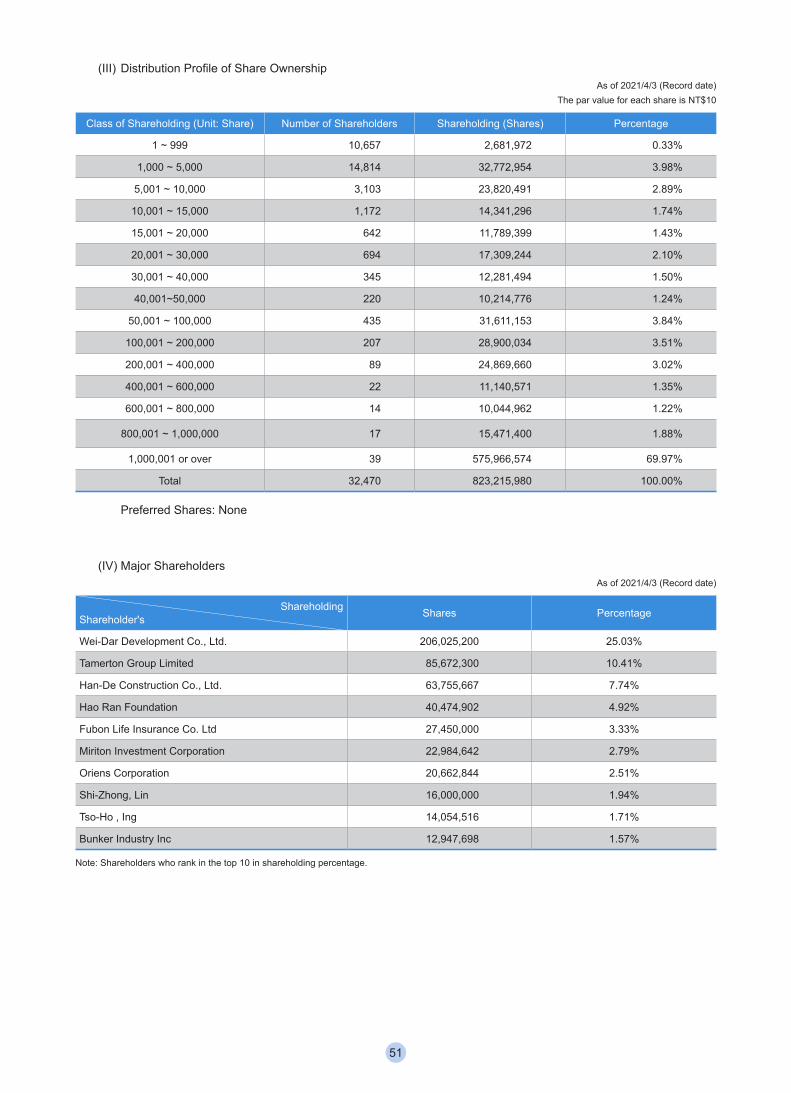
(III) Distribution Profile of Share OwnershipAs of 2021/4/3 (Record date)
The par value for each share is NT$10
Class of Shareholding (Unit: Share) Number of Shareholders Shareholding (Shares) Percentage
1 ~ 999 10,657 2,681,972 0.33%
1,000 ~ 5,000 14,814 32,772,954 3.98%
5,001 ~ 10,000 3,103 23,820,491 2.89%
10,001 ~ 15,000 1,172 14,341,296 1.74%
15,001 ~ 20,000 642 11,789,399 1.43%
20,001 ~ 30,000 694 17,309,244 2.10%
30,001 ~ 40,000 345 12,281,494 1.50%
40,001~50,000 220 10,214,776 1.24%
50,001 ~ 100,000 435 31,611,153 3.84%
100,001 ~ 200,000 207 28,900,034 3.51%
200,001 ~ 400,000 89 24,869,660 3.02%
400,001 ~ 600,000 22 11,140,571 1.35%
600,001 ~ 800,000 14 10,044,962 1.22%
800,001 ~ 1,000,000 17 15,471,400 1.88%
1,000,001 or over 39 575,966,574 69.97%
Total 32,470 823,215,980 100.00%
Preferred Shares: None
(IV) Major ShareholdersAs of 2021/4/3 (Record date)
ShareholdingShareholder's Shares Percentage
Wei-Dar Development Co., Ltd. 206,025,200 25.03%
Tamerton Group Limited 85,672,300 10.41%
Han-De Construction Co., Ltd. 63,755,667 7.74%
Hao Ran Foundation 40,474,902 4.92%
Fubon Life Insurance Co. Ltd 27,450,000 3.33%
Miriton Investment Corporation 22,984,642 2.79%
Oriens Corporation 20,662,844 2.51%
Shi-Zhong, Lin 16,000,000 1.94%
Tso-Ho , Ing 14,054,516 1.71%
Bunker Industry Inc 12,947,698 1.57%
Note: Shareholders who rank in the top 10 in shareholding percentage.
51
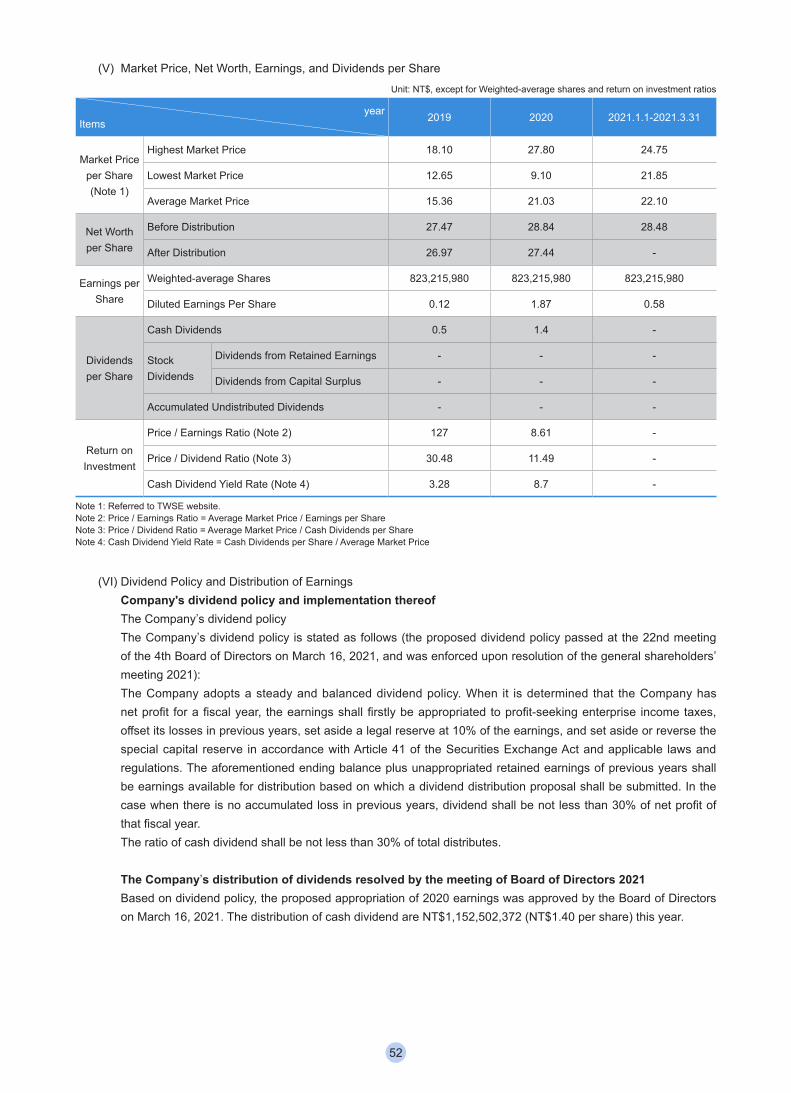
(V) Market Price, Net Worth, Earnings, and Dividends per ShareUnit: NT$, except for Weighted-average shares and return on investment ratios
yearItems 2019 2020 2021.1.1-2021.3.31
Market Price per Share (Note 1)
Highest Market Price 18.10 27.80 24.75
Lowest Market Price 12.65 9.10 21.85
Average Market Price 15.36 21.03 22.10
Net Worth per Share
Before Distribution 27.47 28.84 28.48
After Distribution 26.97 27.44 -
Earnings per Share
Weighted-average Shares 823,215,980 823,215,980 823,215,980
Diluted Earnings Per Share 0.12 1.87 0.58
Dividends per Share
Cash Dividends 0.5 1.4 -
Stock Dividends
Dividends from Retained Earnings - - -
Dividends from Capital Surplus - - -
Accumulated Undistributed Dividends - - -
Return on Investment
Price / Earnings Ratio (Note 2) 127 8.61 -
Price / Dividend Ratio (Note 3) 30.48 11.49 -
Cash Dividend Yield Rate (Note 4) 3.28 8.7 -
Note 1: Referred to TWSE website.Note 2: Price / Earnings Ratio = Average Market Price / Earnings per ShareNote 3: Price / Dividend Ratio = Average Market Price / Cash Dividends per ShareNote 4: Cash Dividend Yield Rate = Cash Dividends per Share / Average Market Price
(VI) Dividend Policy and Distribution of EarningsCompany's dividend policy and implementation thereofThe Company’s dividend policyThe Company’s dividend policy is stated as follows (the proposed dividend policy passed at the 22nd meeting of the 4th Board of Directors on March 16, 2021, and was enforced upon resolution of the general shareholders’ meeting 2021):The Company adopts a steady and balanced dividend policy. When it is determined that the Company has net profit for a fiscal year, the earnings shall firstly be appropriated to profit-seeking enterprise income taxes, offset its losses in previous years, set aside a legal reserve at 10% of the earnings, and set aside or reverse the special capital reserve in accordance with Article 41 of the Securities Exchange Act and applicable laws and regulations. The aforementioned ending balance plus unappropriated retained earnings of previous years shall be earnings available for distribution based on which a dividend distribution proposal shall be submitted. In the case when there is no accumulated loss in previous years, dividend shall be not less than 30% of net profit of that fiscal year. The ratio of cash dividend shall be not less than 30% of total distributes.
The Company’s distribution of dividends resolved by the meeting of Board of Directors 2021Based on dividend policy, the proposed appropriation of 2020 earnings was approved by the Board of Directors on March 16, 2021. The distribution of cash dividend are NT$1,152,502,372 (NT$1.40 per share) this year.
52
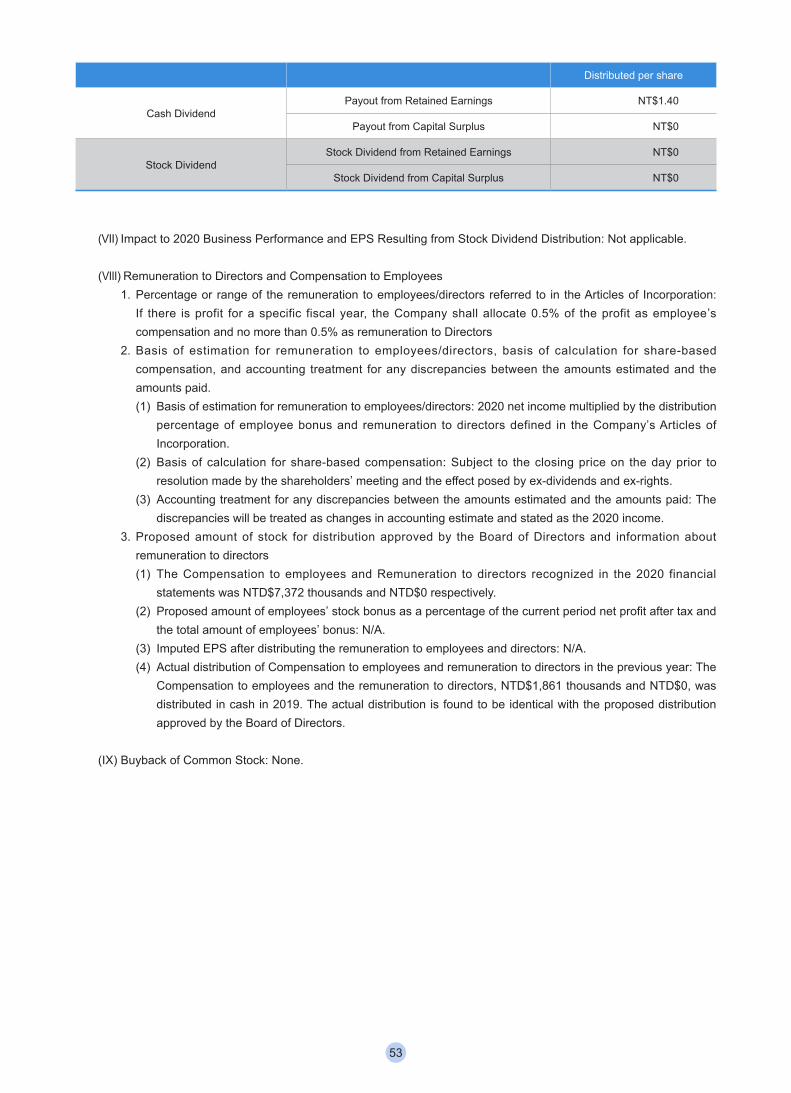
Distributed per share
Cash DividendPayout from Retained Earnings NT$1.40
Payout from Capital Surplus NT$0
Stock DividendStock Dividend from Retained Earnings NT$0
Stock Dividend from Capital Surplus NT$0
(VII) Impact to 2020 Business Performance and EPS Resulting from Stock Dividend Distribution: Not applicable.
(VIII) Remuneration to Directors and Compensation to Employees1. Percentage or range of the remuneration to employees/directors referred to in the Articles of Incorporation:
If there is profit for a specific fiscal year, the Company shall allocate 0.5% of the profit as employee’s compensation and no more than 0.5% as remuneration to Directors
2. Basis of estimation for remuneration to employees/directors, basis of calculation for share-based compensation, and accounting treatment for any discrepancies between the amounts estimated and the amounts paid.(1) Basis of estimation for remuneration to employees/directors: 2020 net income multiplied by the distribution
percentage of employee bonus and remuneration to directors defined in the Company’s Articles of Incorporation.
(2) Basis of calculation for share-based compensation: Subject to the closing price on the day prior to resolution made by the shareholders’ meeting and the effect posed by ex-dividends and ex-rights.
(3) Accounting treatment for any discrepancies between the amounts estimated and the amounts paid: The discrepancies will be treated as changes in accounting estimate and stated as the 2020 income.
3. Proposed amount of stock for distribution approved by the Board of Directors and information about remuneration to directors(1) The Compensation to employees and Remuneration to directors recognized in the 2020 financial
statements was NTD$7,372 thousands and NTD$0 respectively.(2) Proposed amount of employees’ stock bonus as a percentage of the current period net profit after tax and
the total amount of employees’ bonus: N/A. (3) Imputed EPS after distributing the remuneration to employees and directors: N/A.(4) Actual distribution of Compensation to employees and remuneration to directors in the previous year: The
Compensation to employees and the remuneration to directors, NTD$1,861 thousands and NTD$0, was distributed in cash in 2019. The actual distribution is found to be identical with the proposed distribution approved by the Board of Directors.
(IX) Buyback of Common Stock: None.
53
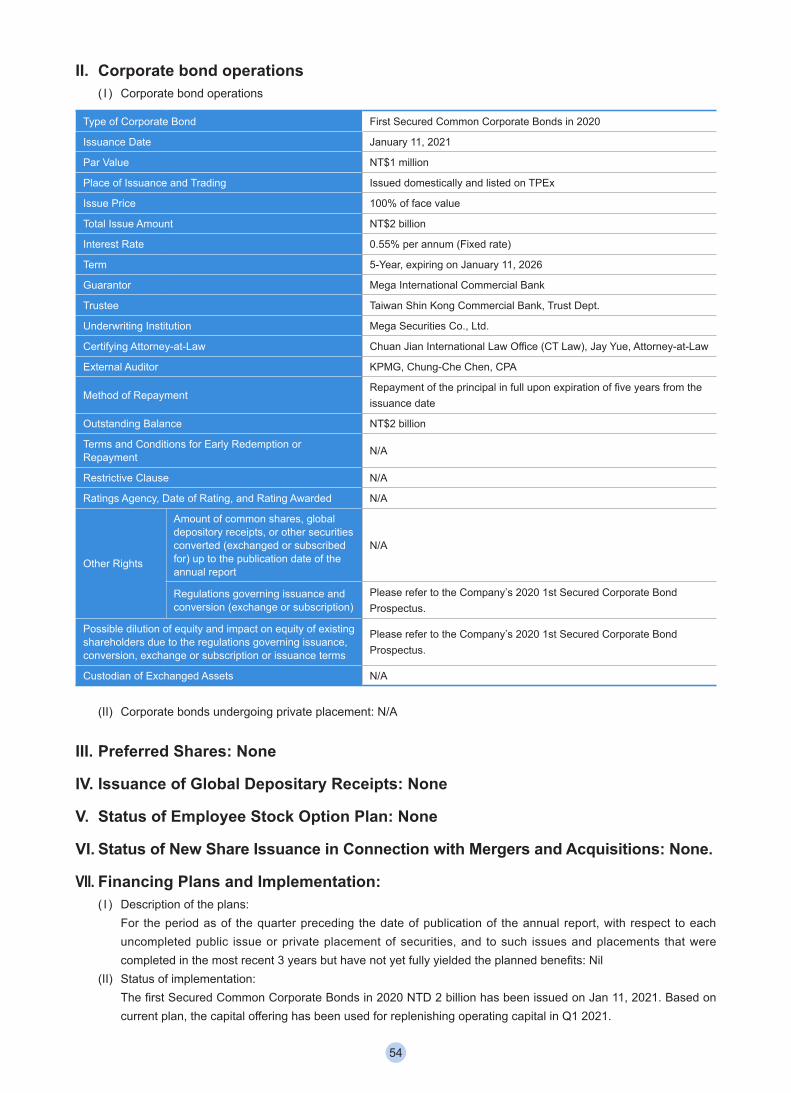
II. Corporate bond operations( I ) Corporate bond operations
Type of Corporate Bond First Secured Common Corporate Bonds in 2020
Issuance Date January 11, 2021
Par Value NT$1 million
Place of Issuance and Trading Issued domestically and listed on TPEx
Issue Price 100% of face value
Total Issue Amount NT$2 billion
Interest Rate 0.55% per annum (Fixed rate)
Term 5-Year, expiring on January 11, 2026
Guarantor Mega International Commercial Bank
Trustee Taiwan Shin Kong Commercial Bank, Trust Dept.
Underwriting Institution Mega Securities Co., Ltd.
Certifying Attorney-at-Law Chuan Jian International Law Office (CT Law), Jay Yue, Attorney-at-Law
External Auditor KPMG, Chung-Che Chen, CPA
Method of RepaymentRepayment of the principal in full upon expiration of five years from the issuance date
Outstanding Balance NT$2 billion
Terms and Conditions for Early Redemption or Repayment N/A
Restrictive Clause N/A
Ratings Agency, Date of Rating, and Rating Awarded N/A
Other Rights
Amount of common shares, global depository receipts, or other securities converted (exchanged or subscribed for) up to the publication date of the annual report
N/A
Regulations governing issuance and conversion (exchange or subscription)
Please refer to the Company’s 2020 1st Secured Corporate Bond Prospectus.
Possible dilution of equity and impact on equity of existing shareholders due to the regulations governing issuance, conversion, exchange or subscription or issuance terms
Please refer to the Company’s 2020 1st Secured Corporate Bond Prospectus.
Custodian of Exchanged Assets N/A
(II) Corporate bonds undergoing private placement: N/A
III. Preferred Shares: None
IV. Issuance of Global Depositary Receipts: None
V. Status of Employee Stock Option Plan: None
VI. Status of New Share Issuance in Connection with Mergers and Acquisitions: None.
VII. Financing Plans and Implementation:( I ) Description of the plans:
For the period as of the quarter preceding the date of publication of the annual report, with respect to each uncompleted public issue or private placement of securities, and to such issues and placements that were completed in the most recent 3 years but have not yet fully yielded the planned benefits: Nil
(II) Status of implementation:The first Secured Common Corporate Bonds in 2020 NTD 2 billion has been issued on Jan 11, 2021. Based on current plan, the capital offering has been used for replenishing operating capital in Q1 2021.
54
Operational Highlights
I. Business activities(I) Business areas
CHC provides expertise in investment, corporate governance structure and finance to assist member companies compete effectively in the global market. Member companies are currently involved in infrastructure construction projects, property planning and development, construction of commercial, office, and residential buildings, and environmental engineering projects.
Business areas of key subsidiaries
CEC Business AreasCEC focuses on general contracting of public/private sector civil and construction projects:Current projects include:
Public sector: Shield tunnels of Song-Hu~Da-An, Shen-Mei~Da-An 345kv Power Cable Transmission Lines Design and Build ProjectContract CQ842 “Station LG02; LG02 to LG03, and LG02 to LG01 TBM Tunnels Civil Construction”Taipei Metropolitan Area Rapid Transit System Wanda- Zhonghe- Shulin Line District Contract (Phase I) CQ840 ProjectTaipei Metropolitan Area Rapid Transit System Wanda- Zhonghe- Shulin Line District Contract (Phase I) CQ850A ProjectContract C214 - South Tainan Station Southern section of the Tainan Railway Underground ProjectContract C211 - Tainan Northern section of the Tainan Railway Underground ProjectContract E of the Guanci Po-Ai Park Public Housing Development ProjectTaoyuan MRT Green Line Contract GC01 - Elevated Viaduct Civil Turnkey ProjectTaipei Nangang Depot Public Housing Design and Build ProjectTaoyuan MRT Green Line Contract GC03 - Elevated Viaduct Civil Turnkey Project
Private Sector:Sunland 41 Residential ProjectKeishen Grand Victory Residential ProjectThe South Manor Congregate Housing ProjectWinbond Zhubei Office Building - Mechanical-Electrical Engineering ProjectLegend Riverview Landmark Residential ProjectAmidst the Best Residential ProjectFEGC T-Park - Mechanical-Engineering ProjectGrand River Xinyi A7 Office ProjectTaiming Beitou Residential/Commercial ProjectTaichung CMP Midtown Hotel/Church/Art Gallery/Residential Project Truefull Land - Zhubei Zhuangjing Section Residential ProjectTruefull Land - Dayuan Qingchuan Section Residential ProjectArcade Gallery Phase 2 Residential ProjectHeming (Hehuan Group) Xindian Residential ProjectFanlu Kaohsiung Hotel & Resdential ProjectTruefull Land - Bade Residential ProjectFubon Urban Legend Residential ProjectWiden Your Horizons Residential ProjectThe One & Only Congregate Housing Project
55
CDC:Nanjing Songjiang Business Hotel and Residential ProjectTaichung La Bella Vita Residential ProjectFullerton Hotel Renewal ProjectXindian Yangbei Residential ProjectTaichung Hui-Go 101 Residential ProjectDexing East Road Residential ProjectTianjin Street Commercial/Office/Residential Project
Overseas projects:Station Square at Kai Tak-Phase 1India Mumbai Metro Line 3-04Kai Tak development-infrastructure works for developments at the southern part of the former runway-Stage 2
Planning and development of new products (services)Large-scale development projectsCondominium constructionCommercial office buildingsHotelsMass transit general contractor and system engineeringRailway viaduct/tunnel constructionPort and pier constructionTaipower power plant and power transmission projectsFuel tank and LNG storage tank project
CDC Business Areas:CDC is mainly involved in land development, urban renewal, community development, and property leasing/management.Current projects and services include:Residential/hotel building in Taipei City Residential/office building in Taipei CityResidential building in New Taipei City Hotel building in MalaysiaResidential/hotel building in the US Residential/commercial building in Taichung CityResidential/hotel building in Kaohsiung City Other property leasingPlanned products and services: Developments in Taipei City, New Taipei City, Taichung City, Kaohsiung City, and Kuala Lumpur etc.
HDEC Business areas:HDEC specializes in the construction of environmental engineering projects. Its business encompasses the construction, refurbishment, and operation of “water affairs, bio-energy, and waste markets”. Business is mainly concentrated in the construction, operation and maintenance of water treatment projects. HDEC is a vertically integrated environmental engineering company that encompasses “planning, investment, construction and operations”. Its core businesses are currently water treatment, sewage treatment, reclaimed water treatment, industrial wastewater treatment, pipeline network construction, user connections, as well as equipment operation and maintenance. HDEC is also working on the development and application of sludge reduction, energy conservation equipment, and green energy technologies. It can provide customers with a complete range of professional services ranging from feasibility studies and analysis, planning and design, to equipment procurement and installation.
56

Current projects include:Planning, design, construction and operation of New Taipei City Tamsui Area Sewerage System BOT ProjectPlanning, design, construction and operation of Taoyuan City Chungli Area Sewerage System BOT ProjectPlanning, design, construction and operation of Taoyuan City Puding Area Sewerage System BOT ProjectPlanning, design, construction and operation of Kaohsiung Linhai Wastewater Treatment Plant and Reclaimed Water BTO ProjectPlanning, design, construction and operation of Kaohsiung Fengshan River Wastewater Treatment Plant and Reuse BTO ProjectTongluo Science Park Wastewater Treatment Plant Phase II Project - Functional Enhancement of Conductivity Treatment Facilities Turnkey ProjectTainan City Anping Reclaimed Water Plant New Construction Turnkey Project
Planning and development of new products (services):HDEC is continuing to focus on water affairs engineering to boost our core competitiveness. HDEC will also continue to develop the high-end “water affairs market”, expand business. The development of zero discharge technology and advanced water supply technologies have been set as market goals. HDEC is expanding into the industrial wastewater treatment market to compete for contracts relating to the refurbishment, consolidation, and automation of legacy plants.
Experience from past projects as well as current progress on anaerobic digestion technology and operations for sewage treatment plants will be leveraged to develop the “bio-energy” industry. HDEC will actively take part in public projects related to on bio-energy such as kitchen scraps, organic sludge, food, and agricultural waste. Affiliates for BOT projects as well as planning and application on bio-energy projects will be assessed on the basis of the Public-Private Partnership (PPP) Act.
Developing of the waste market is now a gola as. HDEC will play an active role in the “waste disposal” market through strategic alliances and establishment of a professional brand for waste treatment. Future affairs will concentrate in the two growth engines of “water affairs” and “waste” in order to meet the needs of future markets needs.
(II) Industry OverviewOverview of the Domestic Construction IndustryIndustry Status and Development:The governments economic development plan seeks to boost private sector investment and stimulate overall economic growth through infrastructure improvements and construction. A “Forward-looking Infrastructure Development Program” was launched in July 2017. The program includes five major construction plans including “Green Energy”, “Digital Technology”, “Water Environment”, “Railways”, and “Urban-Rural Projects.” The programs are to be completed over 8 years through a special budget totaling NT$882.49 billion. The Company has actively competed for related projects based on a principle of careful selection and accurate costing. Though the COVID-19 pandemic led to a sharp increase in domestic manpower and construction costs in 2020, the Company continued to assess and select construction projects in a prudent and practical manner after assessing all related risks. A solid portfolio of projects has now been lined up for 2021.
The Company’s construction business continued to focus on high-quality residential buildings in Taipei, New Taipei, Taoyuan, and Zhubei during the course of 2020. These include the Zhubei Zhuanjing project, Dayuan Qingchuan and Taoyuan Bade projects for Truefull Land, and the Xindian Yangbei project for CDC. In response to the government's push to accelerated urban development, the Company actively took part in several urban renewal projects suitable for the Company’s construction operations. These included “Timeless and Modern Expression” and “Bountiful Journey” projects for CDC, “Urban Legend” project for Fubon Land, the “Widen Your Horizons” project for Wonderful Union, and “The One & Only” project for Sheng De Fu. Total value of the contracts was approximately NT$10 billion.
57
The mechanical-electrical engineering business continued to develop as well with an emphasis on building brand recognition and a portfolio of past projects.
The government attempted to kick-start many construction projects under the Forward-looking Infrastructure Development Program 2020. International border restrictions imposed in response to COVID-19, however, led to a sharp drop in the number of foreign workers which created labor shortages for the construction industry. COVID-19 also caused shortages or import difficulties for building materials. The sharp increase in construction manpower and costs all served to dampen enthusiasm for public construction projects among domestic construction companies and many public tenders failed as a result. The government may be able to remedy this situation in the construction market by adjusting the material costs of construction. Despite variables such as a tightening of mortgage lending restrictions, government attempts to rein in the housing market, and higher bank interest rates, the domestic property market showed no signs of being affected by the pandemic during 2020. Many developers continued to launch new projects with. Future demand in the construction market from hotel, factory, office and mixed residential-commercial buildings is therefore expected to remain strong.
The Company is the undisputed leader in technology and market recognition when it comes to Metro TBM and mountain tunnel projects. Continued intervention is however still required for special projects such as power plants, transmission/transformer stations, petroleum storage tanks, airports and ports to stay competitive. The Company enjoys a high level of market recognition in commercial office and residential construction projects. Our business has expanded to include special buildings such as hotels in recent years, but more time is needed to establish a substantial portfolio. Future construction projects will therefore not only maintain our market position but also continue to focus on high-end residential and hotel projects. In mechanical-electrical engineering, synergies created by a strategy of integration with construction and civil engineering means the Company is beginning to build market acceptance in these two categories. In the future, mechanical-engineering projects will continue to focus on brand-building, with an emphasis on competing for special mechanical-engineering projects such as hotels, shopping centers, green energy, and the technology and biotechnology industries.
Overview of Overseas MarketsHong Kong continues to be a very challenging market filled with uncertainty. The overall value of the construction
industry will nevertheless remain roughly unchanged due to strong support from government budgets.
In the short-term, Hong Kong’s overall spending on construction is expected to range between 225 billion to 315
billion HKD.
Construction on most of the main transportation infrastructure was completed in the past 5 to 10 years. The
government of Hong Kong will need to continue investing to maintain the scale of its construction industry. The
market can therefore expect further government investments to meet the demand from changing demographics
such as housing, roads, tunnels, cavern development, metro expansion, new hospitals, and other social
infrastructure.
Overview of the Building Industry:The COVID-19 pandemic in 2020 triggered lock downs and border restrictions that sent the global economy
into recession. The impact on the Taiwanese economy was less severe due to effective epidemic prevention
measures. New historicalyy low interest rates, Taiwanese companies returning for domestic investment, and the
shutdown of all international tourism all contributed to an unexpected surge in the domestic property market.
There were 326,000 property transactions in 2020, a year-on-year increase of 8.7%. Construction financing and
home loans both reached record highs in December as well.
58
The overstated property market led to targeted credit controls being imposed by the Central Bank in December
2020. Limits were set on loan-to-value ratio of mortgages for investors and loans for land developers in an effort
to ensure the sound development of the property market and to reduce systemic risks associated with excessive
bank lending in the property sector. The Ministry of Interior also proposed an “Actual Transaction Price Registration
2.0” scheme in response to deficiencies in existing actual transaction price registration system. The Ministry of
Finance also set a minimum tax threshold to plug the loophole where personal income from property transactions
was converted into income from trading of securities. An extension to the ownership period for which the maximum
tax rate for integrated housing and land tax applies was also studied to curb property speculation. Basel III accord
will be progressively implemented by all local banks in 2021. The cost of construction financing will be increased as
a result and this may lead to higher interest rates on loans to developers.
All of these measures may cause potential home buyers to adopt a wait-and-see attitude. Developers might
also reduce the number of new projects, leading to a cooling down of the property market. The economic
fundamentals of Taiwan remain strong with the overall economic indicator score in December 2020 was the
highest since March 2011. Economic growth is therefore expected to reach 4.64% in 2021. Low interest rates,
investment by returning Taiwanese and foreign companies, as well as no reduction in rigid demand from first-
home owners all suggest that the 2021 property market will remain on an even keel with relatively stable prices
amidst tight supply.
Overview of Environmental Engineering Industry:Environmental engineering services encompass the water affairs market, biomass energy market, and waste
market.” The overall market is expected to be worth between NT$15 billion to NT$33 billion a year between 2021
and 2023. The water affairs market will consist mostly of water reclamation and functional upgrades to sewage
treatment plants, and is expected to be worth NT$46.9 billion in total over 2021 ~ 2023. The biomass energy
market will be worth NT$8.9 billion over 2021 ~ 2023, while the waste market (construction and refurbishment
of incinerators) will be worth a total of NT$15.9 billion over 2021 ~ 2023. The environmental protection industry
will be a key policy area for the government in the future. Despite the conservative outlook on future growth in
the overall market and the Taiwan economy, the development of environmental engineering business will benefit
from government’s expansion of environmental engineering works in recent years.
The water affairs market consists mainly of water reclamation projects and functional upgrades to sewage
treatment plants. For water reclamation projects, the Water Resources Agency is promoting a variety of
water resource development and reclamation projects in accordance with “Principle Plan of Water Resources
Development in Taiwan Area.” Projects planned for 2021 ~ 2023 include Taipei Binjiang, Taoyuan North District,
Taichung Shuinan, Taichung Futian, Taichung Fengyuan, Tainan Rende, and Kaohsiung Luzhu Science Park.
Functional upgrade projects for sewage treatment plants include the construction, refurbishment and upgrade of
the Taoyuan Guishan Water Resource Center, Keelung’s Heping Island and Bali Sewage Treatment Plants, and
Kaohsiung Zhongzhou Sewage Treatment Plant.
For biomass energy, the Environmental Protection Agency encourages local governments to install kitchen scrap
recovery and treatment facilities. Turnkey or BOT projects for resource and energy conversion facilities are also
being promoted as part of the energy diversification policy. Taiwan Sugar Corp. has been actively modernizing pig
pen facilities in recent years and plans to issue an integrated contract for pig pens and methane to energy systems.
The construction of biomass energy factories in Taipei City, New Taipei City, Kaohsiung City, and Pingtung County
are planned for 2021, while Taiwan Sugar plans to promote methane to energy systems in Chiayi County and
Pingtung County. The biomass energy market is concentrated in 2021 and will be worth up to NT$8.9 billion.
59
For the waste market, there are 24 waste incinerators in Taiwan at present including 19 that have been in service
for more than 20 years. The EPA and local governments have now budgeted for their replacement. In the next
5 years, contracts at 13 large urban incinerators are also set to expire. 12 of these will be seeking contractors
on a BOT/ROT model under the Act for Promotion of Private Participation in Infrastructure Projects, with 9 to be
replaced between 2021 ~ 2023.
(III) Overview of Technology and R&D
CHC is mainly an investment holding company so there is no requirement for technology or R&D at present.
R&D at CEC SubsidiaryR&D at CEC is concentrated in the development of automated construction techniques, the development of shield tunneling technique for hard ground, as well as the development and introduction of new technologies for treatment of construction waste water. The development, mastery and application of core technologies serves to enhance professionalism and competitiveness.R&D spending in 2020 amounted to NT$18,951,000.
Research ReportsApplication of VR Technology to BIM interior design interface reviews Development of automated testing API for net indoor height in BIM.
Research into application of the freezing method for ground improvement.
Secondary development of API for application of BIM Cloud platforms to construction sites.
Research into construction of safety partitions for shield tunnel arrival zones.
Development of AI for rapid modeling of mechanical-electrical and structural interface integration in BIM.
Research into safe and stable construction techniques for deep excavation of underground structures.
Research into the application of design management model for elevated transit system projects.
R&D at HDEC SubsidiaryDevelopment of construction and operating technologies for sludge construction projects.
Planning and construction of energy recovery system for water reclamation.
Removal of urea in water through a combination of Advanced Oxidation Process (AOP) and mixing techniques.
Removal of Boron ions in water through a combination of low-pressure RO and high-efficiency RO technologies.
Treatment of highly conductive wastewater through the use of RO, evaporation, crystallization and heat exchange technologies.
Use of new biological carrier to improve ammonia removal efficiency of the conventional activated sludge method.
Development of remote monitoring, operations management information, and automated management systems for sewage treatment/water reclamation plants.
(IV) Long and Short-term Business Development PlansCHCCHC will continue to focus on investment holdings in civil engineering, building construction, property development and environmental engineering to assist each subsidiary enhance their ability to engage in sustainable development.
Business Development Plans of Key Subsidiaries (CEC, CDC and HDEC)Long-term development strategy for the construction industry:Maintain a high level of brand (quality) identification.
Continue to increase the scope and depth of products.
60
Continue to assess, develop and expand into other highly specialized fields such as power plant construction.
Continue to improve the safety of production sites as well as the physical and mental well-being of personnel.
Development strategy for overseas markets:Despite the impact of the COVID-19 pandemic, the Company continued to cultivate the core team for overseas tunneling projects in 2020. The team will soon begin bidding on projects to expand our business in the chosen target market. In the future, the Company will combine our extensive experience with tunneling projects (including 12 years of involvement in overseas tunnel projects) with the efforts of the core team as well as support from local partners to develop the capability to undertake regional tunnel construction projects.
At the same time, the Company will continue to actively invest in the development of new technologies. We hope this will transform existing technical capabilities from support of internal operations into a business for provision of services, creating a new source of revenue for the Company and spearheading the digital transformation of the industry.
Short-term development strategy for the construction industry:Vertical integration of civil engineering/mechanical-electrical engineering & building/mechanical-electrical businesses.
Cultivation of professional human resources in project management.
The Company’s current business direction in Taiwan is based on increasing project volume and margins by not competing on price for civil engineering projects, and winning high-margin projects through detailed estimates.
The advantages of our company brand and past record will be used to focus on advantageous in civil engineering projects tenders. For building construction projects our focus will mainly be on participation in turnkey projects.
By improving our management efficiency in building projects and concentrating on large developments, we can concentrate our manpower and resources for optimal management.
Long-term development strategy for the building industry:Become a benchmark enterprise among building brands with planning ability, construction quality and after-sales service performance as our core values.
In the long term, project development will focus on large projects, community developments, or urban renewal in order to increase the scale of individual development projects and build up our land inventory.
In terms of product planning, product innovation and R&D will be emphasized with safe, healthy and eco-friendly housing as the main selling points in keeping with future development trends.
In terms of marketing planning, customer information knowledge management system will be used to achieve effective control over sales channels and enhance our planning ability for commercial facilities in order to added product value.
In terms of customer service, customer complaints and maintenance management information systems will be used in conjunction with external information to expand customer support functions and build up customer trust in our brand.
Short-term development strategy for the building industry:For brand development, new projects continue to be released in central parts of cities like Taipei, New Taipei, Taichung and Kaohsiung. Product planning, project management and after-sales support will also be integrated to cultivate the brand image for quality residences.
In terms of project development, our focus will be on prime real estate in Taipei City, New Taipei City, Taichung City and Kaohsiung City. Developments in Tainan and Hsinchu’s urban areas will also be assessed. Developments will take the form of co-construction or joint development.
61
In terms of product planning, housing products targeted at first home buyers or owner-occupiers will be developed based on location and market demand. The concepts of healthy homes and green building will continue to be promoted with greater emphasis given to the planning of composite products that provide added value.
In terms of marketing planning, the attributes of the location and the target market will be considered during the product planning stage. Partner resources such as well-known local/foreign architects as well as interior, lighting and landscape designers will be leveraged and applied to product packaging in order to effectively meet the needs of the target market.
In terms of customer services, a customer feedback mechanism will be enforced to improve product planning and construction quality. The efficiency of customer service will also be reinforced to increase customer satisfaction.
Long-term development strategy for the environmental engineering industry:Experience from past projects as well as current progress on anaerobic digestion technology and operations for sewage treatment plants will be leveraged to actively compete for local governments’ biomass energy center projects for kitchen scraps, organic sludge, food, and agricultural waste. Taiwan currently has 24 waste treatment plants (incinerators) but most are reaching the end of their service lives and need to be refurbished. The government will soon begin inviting bids for refurbishment and operations. A relatively closed market will be opened once again due to construction demand creating a good opportunity for market entry. A total of 13 large metropolitan incinerator contracts are set to expire in the next 5 years, creating a market for construction work worth approximately NT$16 billion, as well as business opportunities for incinerator operators worth NT$7 billion a year. Alliances with partners that have experience with waste processing will be leveraged to draw on their management experience and obtain an overall understanding of the material supply market.
Short-term development strategy for the environmental engineering industry:The existing water affairs business will serve as the foundation for accumulating experience in the construction and operation of sewage networks, water purification, sewage and reclaimed water treatment projects. The development of a diversified water affairs business will enhance our competitive advantage and generate further revenue growth.
Efforts will focus on the development of water treatment technology. We will partner with vendors with experience in industrial wastewater treatment to develop zero-emissions discharge technology and water supply technology for high-tech industries. We will actively work to combine the updating of old plants with the development of automated management in order to expand the size of our business.
Standardization of management systems will be enforced along with further upgrades to the information management system and control capabilities. These include the implementation of a standardized management system and review mechanism as well as remote monitoring and information management systems for sustainable development. The consolidation of procurement resources will continue to build up a pool of civil engineering contractors. We will continue to maintain and optimize the contracts database and set up a database for purchasing and construction costs. In response to the potential for rapid business growth in 2021, a core team was set up to quickly create standards for project management. This will compensate for the slow pace of personnel mobilization during the early stages of projects and ensure that the project can proceed. A unified standard of occupational safety facilities and operations will also be established through contract terms and on-site management. Design management functions will continue to be strengthened including the establishment of a review mechanism for key project equipment, continued improvements to design and integration ability, and the integration ability of the BIM team. The resources of external construction and design partners will continue to be integrated as well to set up a team for long-term cooperation. Finally, improvements in project management will be used to improve the management of quality documentation, strengthen contract management, and enhance our ability to age civil engineering projects.
62
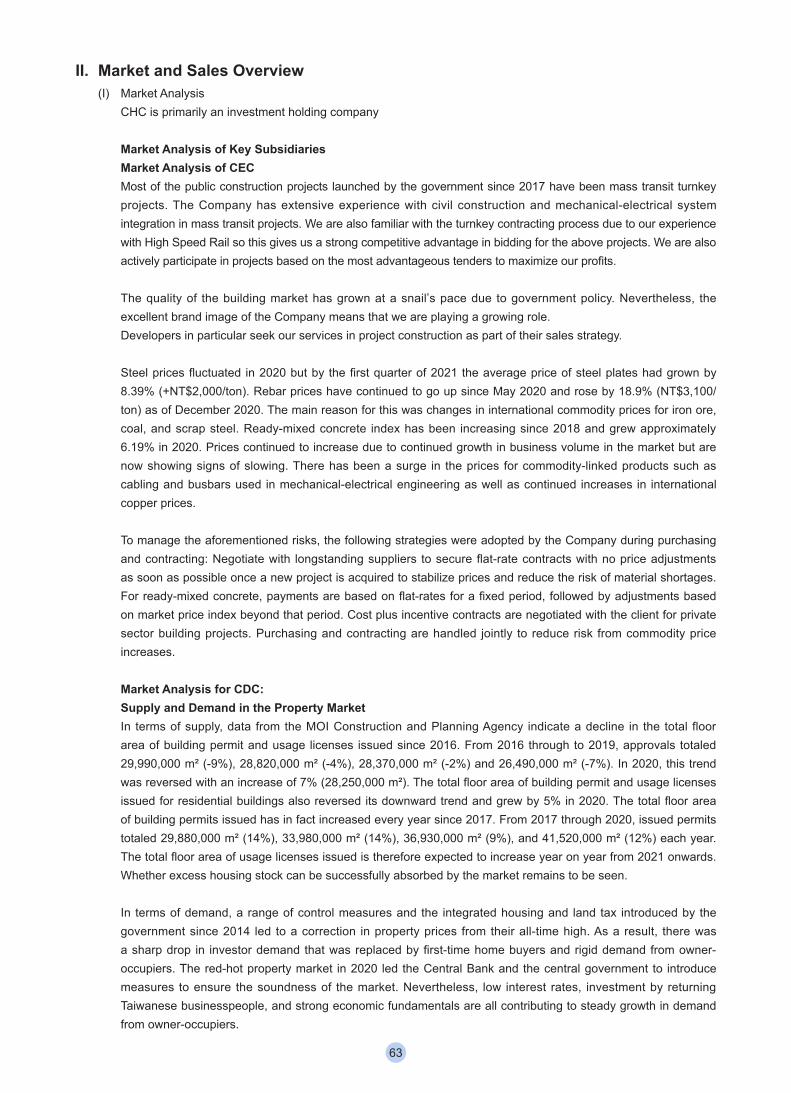
II. Market and Sales Overview(I) Market Analysis
CHC is primarily an investment holding company
Market Analysis of Key SubsidiariesMarket Analysis of CECMost of the public construction projects launched by the government since 2017 have been mass transit turnkey projects. The Company has extensive experience with civil construction and mechanical-electrical system integration in mass transit projects. We are also familiar with the turnkey contracting process due to our experience with High Speed Rail so this gives us a strong competitive advantage in bidding for the above projects. We are also actively participate in projects based on the most advantageous tenders to maximize our profits.
The quality of the building market has grown at a snail’s pace due to government policy. Nevertheless, the excellent brand image of the Company means that we are playing a growing role.Developers in particular seek our services in project construction as part of their sales strategy.
Steel prices fluctuated in 2020 but by the first quarter of 2021 the average price of steel plates had grown by 8.39% (+NT$2,000/ton). Rebar prices have continued to go up since May 2020 and rose by 18.9% (NT$3,100/ton) as of December 2020. The main reason for this was changes in international commodity prices for iron ore, coal, and scrap steel. Ready-mixed concrete index has been increasing since 2018 and grew approximately 6.19% in 2020. Prices continued to increase due to continued growth in business volume in the market but are now showing signs of slowing. There has been a surge in the prices for commodity-linked products such as cabling and busbars used in mechanical-electrical engineering as well as continued increases in international copper prices.
To manage the aforementioned risks, the following strategies were adopted by the Company during purchasing and contracting: Negotiate with longstanding suppliers to secure flat-rate contracts with no price adjustments as soon as possible once a new project is acquired to stabilize prices and reduce the risk of material shortages. For ready-mixed concrete, payments are based on flat-rates for a fixed period, followed by adjustments based on market price index beyond that period. Cost plus incentive contracts are negotiated with the client for private sector building projects. Purchasing and contracting are handled jointly to reduce risk from commodity price increases.
Market Analysis for CDC:Supply and Demand in the Property MarketIn terms of supply, data from the MOI Construction and Planning Agency indicate a decline in the total floor area of building permit and usage licenses issued since 2016. From 2016 through to 2019, approvals totaled 29,990,000 m² (-9%), 28,820,000 m² (-4%), 28,370,000 m² (-2%) and 26,490,000 m² (-7%). In 2020, this trend was reversed with an increase of 7% (28,250,000 m²). The total floor area of building permit and usage licenses issued for residential buildings also reversed its downward trend and grew by 5% in 2020. The total floor area of building permits issued has in fact increased every year since 2017. From 2017 through 2020, issued permits totaled 29,880,000 m² (14%), 33,980,000 m² (14%), 36,930,000 m² (9%), and 41,520,000 m² (12%) each year. The total floor area of usage licenses issued is therefore expected to increase year on year from 2021 onwards. Whether excess housing stock can be successfully absorbed by the market remains to be seen.
In terms of demand, a range of control measures and the integrated housing and land tax introduced by the government since 2014 led to a correction in property prices from their all-time high. As a result, there was a sharp drop in investor demand that was replaced by first-time home buyers and rigid demand from owner-occupiers. The red-hot property market in 2020 led the Central Bank and the central government to introduce measures to ensure the soundness of the market. Nevertheless, low interest rates, investment by returning Taiwanese businesspeople, and strong economic fundamentals are all contributing to steady growth in demand from owner-occupiers.
63
Main Strategic Direction‧ Consolidate core business and maintain growth through the development of new market segments and
product types.‧ Create value-added products by continuing to develop hybrid residential projects and assessing the
development of office products.
Competitive Niche‧ Use brand image along with construction sites in quality locations to expand land development.‧ Design and integration ability based on a combination of the right product niche and international trends.‧ Establish client trust in the brand through sound planning and construction quality.‧ Provide sustainable after-sales service through a professional support team.‧ Guarantee financing of developments through sound finances.
Development BusinessCurrent Development ProjectsMost of the Company’s development projects are located in Greater Taipei and Taichung City. We expanded into Kaohsiung City in 2020 and will begin expanding into San Francisco and Kuala Lumpur from 2021. In addition to continued marketing of existing developments such as Treasure Garden, La Bella Vita, 55Timeless, and off-the-plan sales of Arranging New Asia Bay in Kaohsiung, we also plan to release the Sensuous Garden development and Republic Plaza urban renewal project in Taipei City. The Ankang Road development will be released in New Taipei City, and the Hui-Go 101 project and Dakeng Village Community project is in Taichung City. Overseas residential developments will also be released in the aforementioned San Francisco and Kuala Lumpur.
Favorable/Unfavorable Factors and Response Strategies for the Future Property MarketFavorable Factors‧ The adoption of quantitative easing policies in Taiwan and around the world means market interest rates
remain low.‧ An increase in investment from Taiwanese businesspeople returning from China as well as foreign companies
has increased property demand.‧ Steady economic growth is helping boost property demand.‧ The government’s continued construction of mass transit projects is stimulating home-buying demand along
Metro routes.‧ The “Statute for Expediting Reconstruction of Urban Unsafe and Old Buildings” offers incentives for urban
renewal.
Unfavorable Factors‧ Intervention by the Central Bank and central government has affected investor interest due to increased
property ownership and transaction costs.‧ Increase in volume of projects in the market is slowing down the rate at which excess housing stock is being
consumed.‧ COVID-19 is still a threat If the pandemic becomes more severe, economic activity and property market may
be impacted.
Response Strategies‧ Develop high-end residential condos and middle-class residential products.‧ Continue to operate in the Greater Taipei and Taichung markets as well as develop the Kaohsiung market.‧ Develop composite residential products and increase product value through the development of commercial
properties.‧ Develop all-age housing and smart home products in response to socio-demographic changes.‧ Assess the feasibility of office development.
64
Market Analysis for HDEC: Water affairs is the largest market for the environmental protection industry. Our environmental engineering business will continue to develop the market for the construction, operation and maintenance of sewage systems, water treatment, wastewater treatment and water reclamation plants. We will also participate in public construction projects for biomass energy and waste disposal. The development of new environmental engineering business areas will diversify our business, increase competitive advantage, and generate continued revenue growth.
Business Development SituationThe core business of HDEC encompasses the construction and operation of sewage network systems, water treatment plants, sewage treatments plants, and water reclamation plants. We have experience operating large-scale sewage networks with concession periods of more than 15 years. As such, HDEC is a profitable integrated environmental engineering company with planning, construction, and execution capabilities.
Completed Projects:Northern Linkou Wastewater Treatment Plant EPC Project with a rated capacity of 23,000 CMD.
Tamsui Wastewater Treatment Plant Phase I and Phase II expansion with a rated capacity of 42,000 CMD including the construction of 56 km of sewage pipeline.
Baoshan Water Treatment Plant Phase III Expansion with a rated capacity of 340,000 CMD.
Chinchu Water Treatment Plant EPC Project with a rated capacity of 80,000 CMD.
Kaohsiung Fengshan River Wastewater Reclamation and Reuse BTO Project with a rated wastewater reclamation and reuse capacity of 45,000 CMD.
Current projects:Tamsui Area Sewerage System BOT Project.
Fengshan River Wastewater Reclamation and Reuse BTO Project.
Chungli Area Sewerage System BOT Project.
Puding Area Sewerage System BOT Project.
Linhai Reclaimed Water BOT Project.
Anping Reclaimed Water Plant Turnkey Project.
Tongluo Science Park Wastewater Treatment Plant - Functional Enhancement of Conductivity Treatment Facilities Turnkey Project.
(II) Production Procedures of Main ProductsCHC is primarily an investment holding company
Key subsidiariesMajor products and their production processes at CECMain products and uses:Civil engineering: projects such as the construction of roads, bridges, tunnels, and harbors, dam desilting, mass transit construction, oil and natural gas storage tank construction, power plant engineering, and environmental engineering.
Building projects: contractor for residential buildings, commercial offices, factories, hospitals, hotels and other buildings.
Mechanical-electrical engineering: electrical, plumbing, fire safety and air-conditioning contractor for residential buildings, commercial office buildings, factories, hospitals, hotels, and other buildings.
65
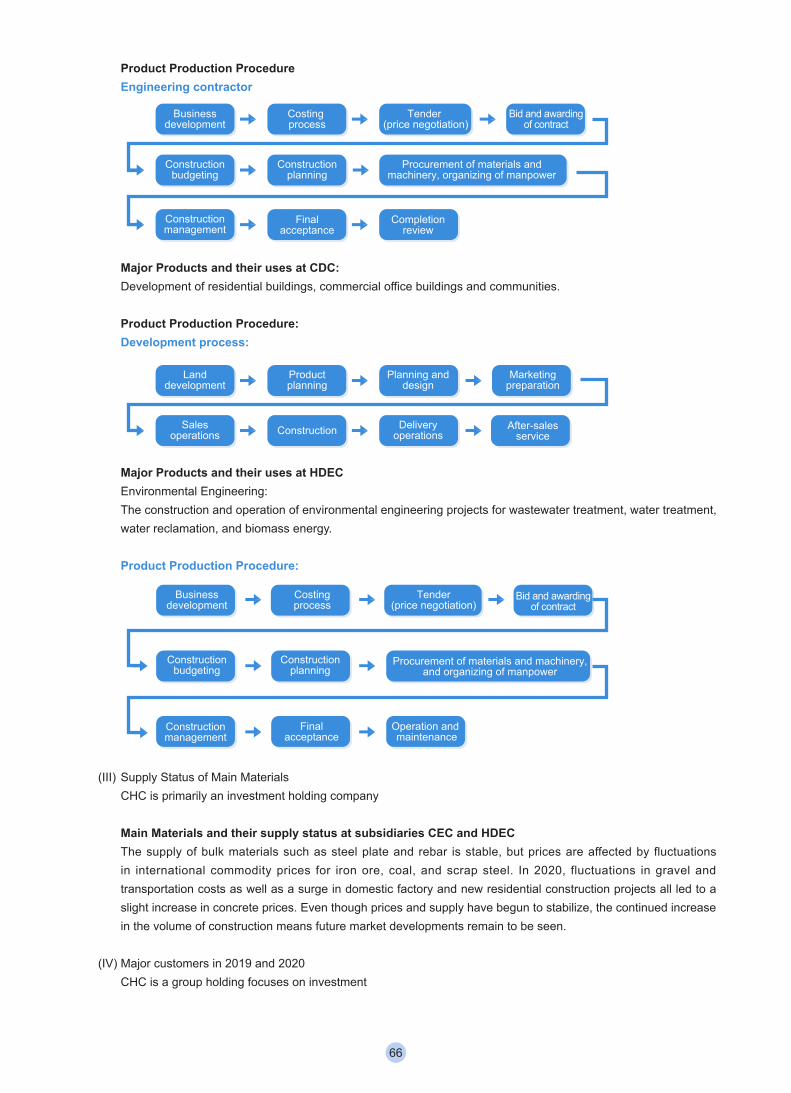
Product Production ProcedureEngineering contractor
Businessdevelopment
Constructionbudgeting
Constructionmanagement
Landdevelopment
Salesoperations
Costing process
Constructionplanning
Finalacceptance
Productplanning
Construction
Completionreview
Planning anddesign
Deliveryoperations
Marketingpreparation
After-salesservice
Procurement of materials and machinery, organizing of manpower
Tender (price negotiation)
Bid and awardingof contract
Major Products and their uses at CDC:Development of residential buildings, commercial office buildings and communities.
Product Production Procedure:Development process:
Businessdevelopment
Constructionbudgeting
Constructionmanagement
Landdevelopment
Salesoperations
Costing process
Constructionplanning
Finalacceptance
Productplanning
Construction
Completionreview
Planning anddesign
Deliveryoperations
Marketingpreparation
After-salesservice
Procurement of materials and machinery, organizing of manpower
Tender (price negotiation)
Bid and awardingof contract
Major Products and their uses at HDECEnvironmental Engineering: The construction and operation of environmental engineering projects for wastewater treatment, water treatment, water reclamation, and biomass energy.
Product Production Procedure:
Businessdevelopment
Constructionbudgeting
Constructionmanagement
Constructionplanning
Finalacceptance
Operation and maintenance
Procurement of materials and machinery,and organizing of manpower
Costingprocess
Tender(price negotiation)
Bid and awardingof contract
(III) Supply Status of Main MaterialsCHC is primarily an investment holding company
Main Materials and their supply status at subsidiaries CEC and HDECThe supply of bulk materials such as steel plate and rebar is stable, but prices are affected by fluctuations in international commodity prices for iron ore, coal, and scrap steel. In 2020, fluctuations in gravel and transportation costs as well as a surge in domestic factory and new residential construction projects all led to a slight increase in concrete prices. Even though prices and supply have begun to stabilize, the continued increase in the volume of construction means future market developments remain to be seen.
(IV) Major customers in 2019 and 2020CHC is a group holding focuses on investment
66
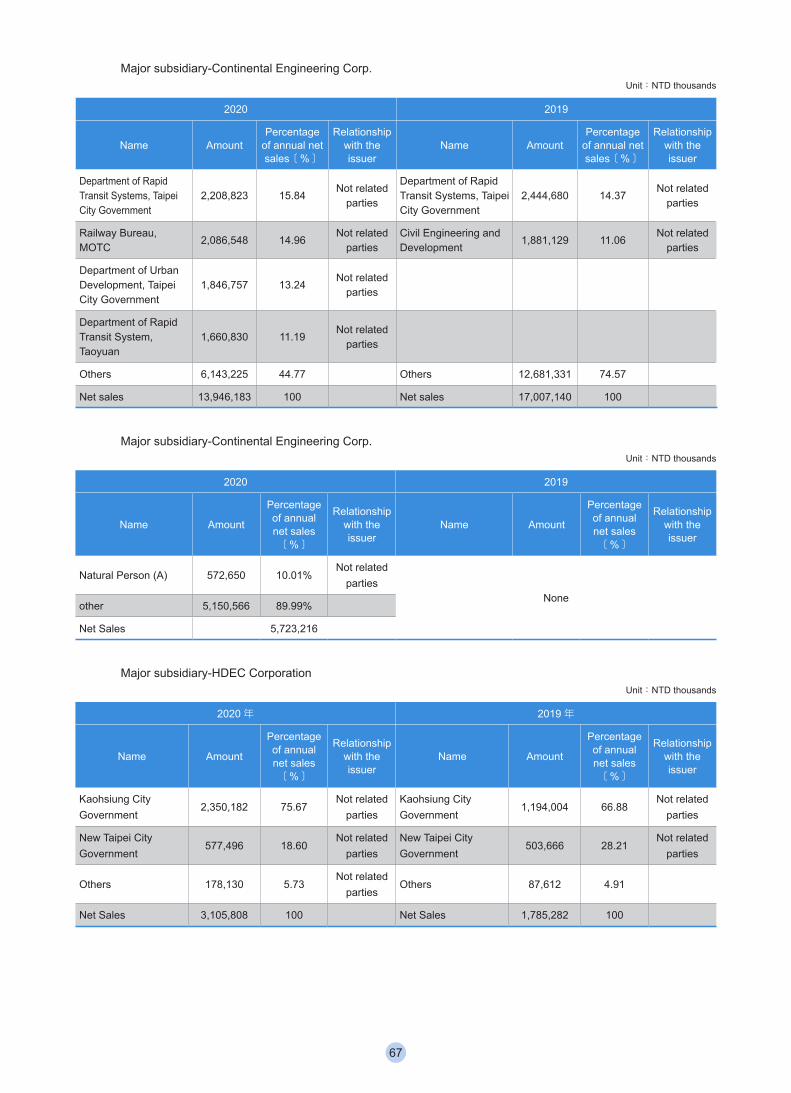
Major subsidiary-Continental Engineering Corp.Unit:NTD thousands
2020 2019
Name AmountPercentage
of annual net sales[%]
Relationship with the issuer
Name AmountPercentage
of annual net sales[%]
Relationship with the issuer
Department of Rapid Transit Systems, Taipei City Government
2,208,823 15.84Not related
parties
Department of Rapid Transit Systems, Taipei City Government
2,444,680 14.37Not related
parties
Railway Bureau, MOTC
2,086,548 14.96Not related
partiesCivil Engineering and Development
1,881,129 11.06Not related
parties
Department of Urban Development, Taipei City Government
1,846,757 13.24Not related
parties
Department of Rapid Transit System, Taoyuan
1,660,830 11.19Not related
parties
Others 6,143,225 44.77 Others 12,681,331 74.57
Net sales 13,946,183 100 Net sales 17,007,140 100
Major subsidiary-Continental Engineering Corp.Unit:NTD thousands
2020 2019
Name Amount
Percentage of annual net sales[%]
Relationship with the issuer
Name Amount
Percentage of annual net sales[%]
Relationship with the issuer
Natural Person (A) 572,650 10.01%Not related
partiesNone
other 5,150,566 89.99%
Net Sales 5,723,216
Major subsidiary-HDEC CorporationUnit:NTD thousands
2020年 2019年
Name Amount
Percentage of annual net sales[%]
Relationship with the issuer
Name Amount
Percentage of annual net sales[%]
Relationship with the issuer
Kaohsiung City Government
2,350,182 75.67Not related
partiesKaohsiung City Government
1,194,004 66.88Not related
parties
New Taipei City Government
577,496 18.60Not related
partiesNew Taipei City Government
503,666 28.21Not related
parties
Others 178,130 5.73Not related
partiesOthers 87,612 4.91
Net Sales 3,105,808 100 Net Sales 1,785,282 100
67
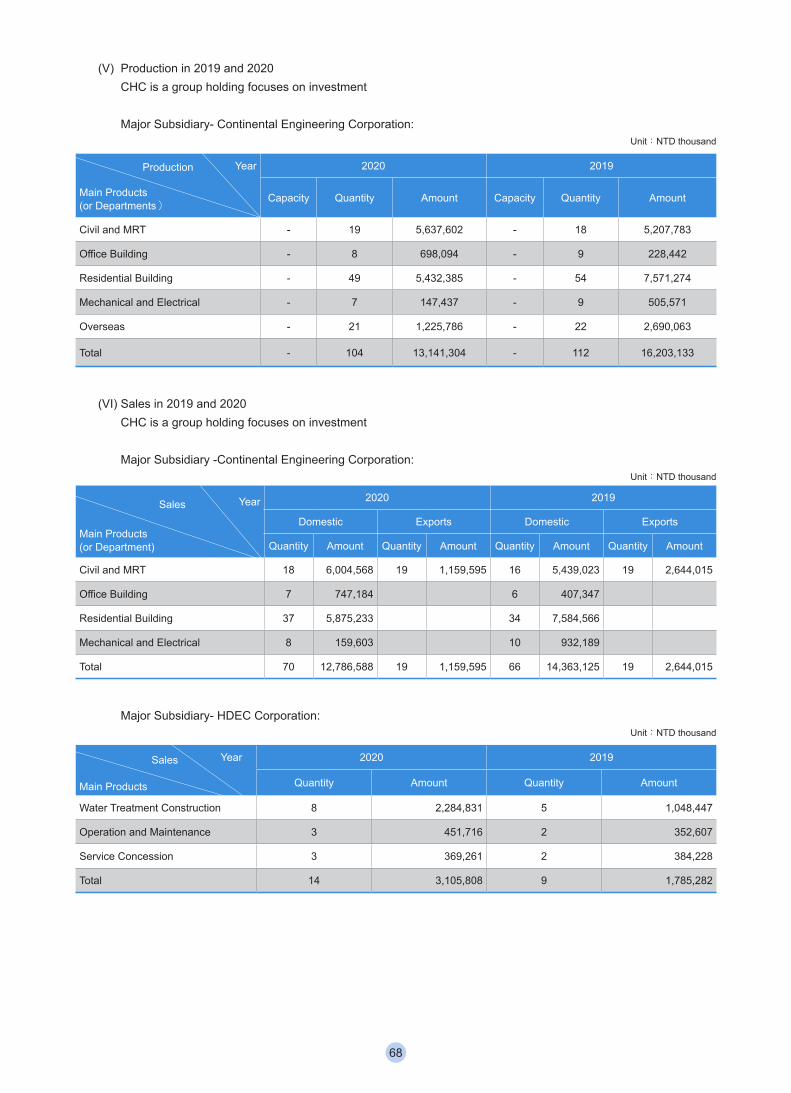
(V) Production in 2019 and 2020CHC is a group holding focuses on investment
Major Subsidiary- Continental Engineering Corporation:Unit:NTD thousand
YearProduction
Main Products(or Departments)
2020 2019
Capacity Quantity Amount Capacity Quantity Amount
Civil and MRT - 19 5,637,602 - 18 5,207,783
Office Building - 8 698,094 - 9 228,442
Residential Building - 49 5,432,385 - 54 7,571,274
Mechanical and Electrical - 7 147,437 - 9 505,571
Overseas - 21 1,225,786 - 22 2,690,063
Total - 104 13,141,304 - 112 16,203,133
(VI) Sales in 2019 and 2020CHC is a group holding focuses on investment
Major Subsidiary -Continental Engineering Corporation: Unit:NTD thousand
Sales Year
Main Products(or Department)
2020 2019
Domestic Exports Domestic Exports
Quantity Amount Quantity Amount Quantity Amount Quantity Amount
Civil and MRT 18 6,004,568 19 1,159,595 16 5,439,023 19 2,644,015
Office Building 7 747,184 6 407,347
Residential Building 37 5,875,233 34 7,584,566
Mechanical and Electrical 8 159,603 10 932,189
Total 70 12,786,588 19 1,159,595 66 14,363,125 19 2,644,015
Major Subsidiary- HDEC Corporation:Unit:NTD thousand
Sales Year
Main Products
2020 2019
Quantity Amount Quantity Amount
Water Treatment Construction 8 2,284,831 5 1,048,447
Operation and Maintenance 3 451,716 2 352,607
Service Concession 3 369,261 2 384,228
Total 14 3,105,808 9 1,785,282
68
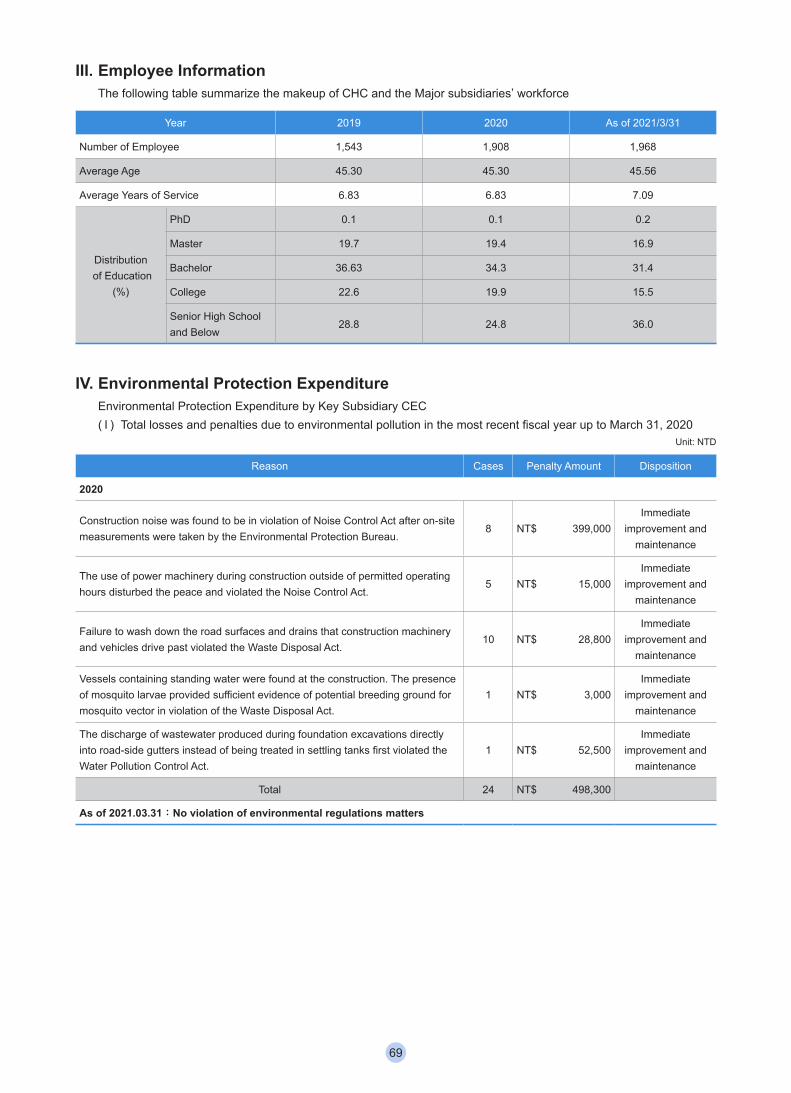
III. Employee InformationThe following table summarize the makeup of CHC and the Major subsidiaries’ workforce
Year 2019 2020 As of 2021/3/31
Number of Employee 1,543 1,908 1,968
Average Age 45.30 45.30 45.56
Average Years of Service 6.83 6.83 7.09
Distribution of Education
(%)
PhD 0.1 0.1 0.2
Master 19.7 19.4 16.9
Bachelor 36.63 34.3 31.4
College 22.6 19.9 15.5
Senior High School and Below
28.8 24.8 36.0
IV. Environmental Protection ExpenditureEnvironmental Protection Expenditure by Key Subsidiary CEC( I ) Total losses and penalties due to environmental pollution in the most recent fiscal year up to March 31, 2020
Unit: NTD
Reason Cases Penalty Amount Disposition
2020
Construction noise was found to be in violation of Noise Control Act after on-site measurements were taken by the Environmental Protection Bureau.
8 NT$ 399,000Immediate
improvement and maintenance
The use of power machinery during construction outside of permitted operating hours disturbed the peace and violated the Noise Control Act.
5 NT$ 15,000Immediate
improvement and maintenance
Failure to wash down the road surfaces and drains that construction machinery and vehicles drive past violated the Waste Disposal Act.
10 NT$ 28,800Immediate
improvement and maintenance
Vessels containing standing water were found at the construction. The presence of mosquito larvae provided sufficient evidence of potential breeding ground for mosquito vector in violation of the Waste Disposal Act.
1 NT$ 3,000Immediate
improvement and maintenance
The discharge of wastewater produced during foundation excavations directly into road-side gutters instead of being treated in settling tanks first violated the Water Pollution Control Act.
1 NT$ 52,500Immediate
improvement and maintenance
Total 24 NT$ 498,300
As of 2021.03.31:No violation of environmental regulations matters
69
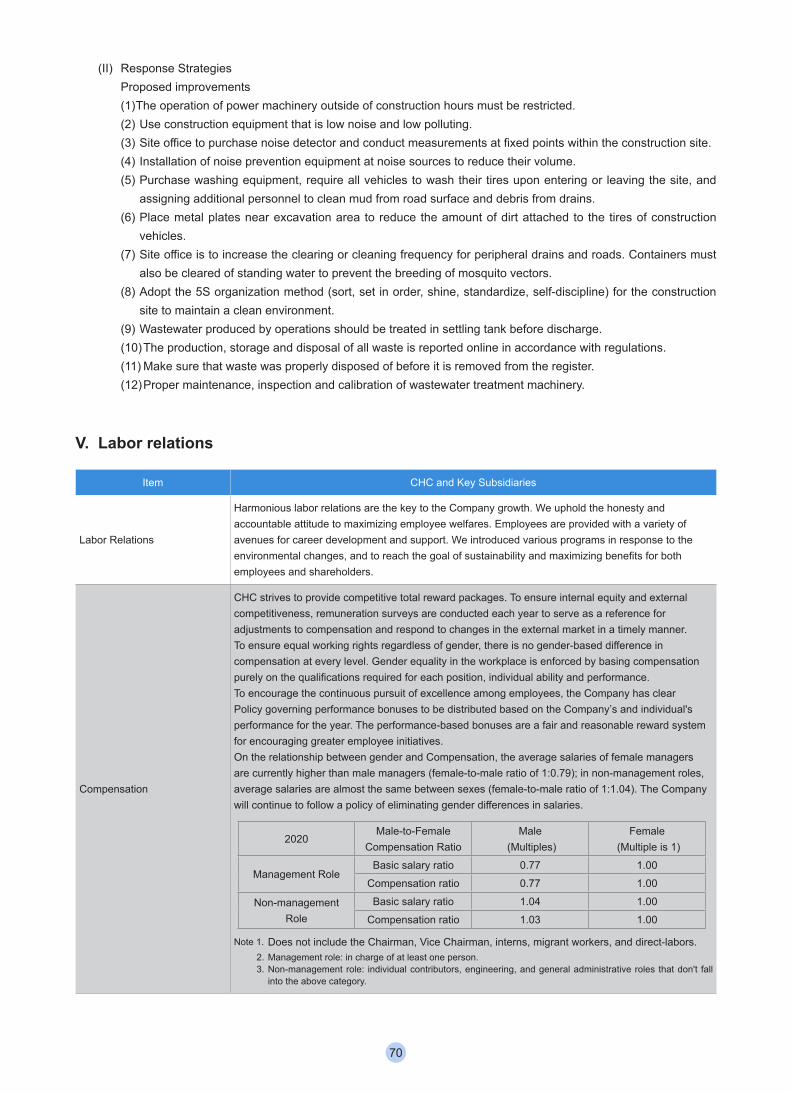
(II) Response StrategiesProposed improvements(1) The operation of power machinery outside of construction hours must be restricted.(2) Use construction equipment that is low noise and low polluting.(3) Site office to purchase noise detector and conduct measurements at fixed points within the construction site.(4) Installation of noise prevention equipment at noise sources to reduce their volume.(5) Purchase washing equipment, require all vehicles to wash their tires upon entering or leaving the site, and
assigning additional personnel to clean mud from road surface and debris from drains.(6) Place metal plates near excavation area to reduce the amount of dirt attached to the tires of construction
vehicles.(7) Site office is to increase the clearing or cleaning frequency for peripheral drains and roads. Containers must
also be cleared of standing water to prevent the breeding of mosquito vectors.(8) Adopt the 5S organization method (sort, set in order, shine, standardize, self-discipline) for the construction
site to maintain a clean environment.(9) Wastewater produced by operations should be treated in settling tank before discharge.(10) The production, storage and disposal of all waste is reported online in accordance with regulations.(11) Make sure that waste was properly disposed of before it is removed from the register.(12) Proper maintenance, inspection and calibration of wastewater treatment machinery.
V. Labor relations
Item CHC and Key Subsidiaries
Labor Relations
Harmonious labor relations are the key to the Company growth. We uphold the honesty and accountable attitude to maximizing employee welfares. Employees are provided with a variety of avenues for career development and support. We introduced various programs in response to the environmental changes, and to reach the goal of sustainability and maximizing benefits for both employees and shareholders.
Compensation
CHC strives to provide competitive total reward packages. To ensure internal equity and external competitiveness, remuneration surveys are conducted each year to serve as a reference for adjustments to compensation and respond to changes in the external market in a timely manner. To ensure equal working rights regardless of gender, there is no gender-based difference in compensation at every level. Gender equality in the workplace is enforced by basing compensation purely on the qualifications required for each position, individual ability and performance.To encourage the continuous pursuit of excellence among employees, the Company has clear Policy governing performance bonuses to be distributed based on the Company’s and individual's performance for the year. The performance-based bonuses are a fair and reasonable reward system for encouraging greater employee initiatives.On the relationship between gender and Compensation, the average salaries of female managers are currently higher than male managers (female-to-male ratio of 1:0.79); in non-management roles, average salaries are almost the same between sexes (female-to-male ratio of 1:1.04). The Company will continue to follow a policy of eliminating gender differences in salaries.
2020Male-to-Female
Compensation RatioMale
(Multiples)Female
(Multiple is 1)
Management RoleBasic salary ratio 0.77 1.00
Compensation ratio 0.77 1.00
Non-management Role
Basic salary ratio 1.04 1.00
Compensation ratio 1.03 1.00
Note 1. Does not include the Chairman, Vice Chairman, interns, migrant workers, and direct-labors.2. Management role: in charge of at least one person.3. Non-management role: individual contributors, engineering, and general administrative roles that don't fall
into the above category.
70
Item CHC and Key Subsidiaries
Management system rationalization
Management regulations are amended when necessary in accordance with the Labor Standards Act and related regulations. The needs of business management and employees are also taken into account to ensure that the management system is in line with the times.
Strengthening of employee communication channels
An internal corporate portal website is provided to provide information on company policy, systems, benefits and activities. A forum for employee discussions has also been set up for employees to freely express their opinions. The following channels are provided as well for two-way communication with employees:‧ Regular labor-management meetings‧ Employee feedback platform and Idea Box on internal website‧ Employee engagement surveys are conducted and analyzed so that action plans can be proposed
and followed up on for areas requiring improvement‧ Sexual harassment complaints channel (including complaints hotline and mailbox)‧ Establishment of “Occupational Safety and Health Committee” and “Employee Welfare Committee”
Organizing of company insurance policy and health exams for all employees
The Company provides employees with life, accident, medical and cancer insurance cover in addition to Labor Insurance and National Health Insurance. Employees are also provided with health exams that exceed statutory requirements for extra protection.
Strengthening of employee education and training
The Company budgets for employee education and training every year to help employees improve their professional skills and advance their professional career.
Talent development, education and training
The Company has established management systems for personnel “selection, education, employment, and retention” to attract quality talent. More resources are also being actively invested in talent development by providing tailored learning resources for each role including courses on professional skills, as well as courses on personal development and management leadership to enhance and energize competency development.1. CHC Group places a strong emphasis on the development of employee competency and potential.
Every effort is made to develop a comprehensive education and training program for every employee. The Company is continuing to develop different learning resources and channels based on the needs of each role and position including on-the-job training, job rotation, site tours, classroom training, seminars, forums, workshops, blended learning, external certification and exams. All these different learning methods serve to energize competency development for talented personnel.
2. The CHC Group is adapting to the current age of digital transformation by continuing to develop more internal methods and channels for passing down knowledge and experience. An example of this is the live streaming of certain courses so that employees in different locations do not have to travel long distances for access to learning. Having broken down barriers to learning with the introduction of the iLearn online learning platform in 2019, CHC Group determined that helping employees select the right learning resources is also critical in the current age of information explosion. Particular emphasis was therefore placed on accelerating the expansion and screening of online learning resources in 2020.
3. In addition to developing an internal pool of learning resources for professional knowledge to help pass down knowledge and experience, a variety of domestic and foreign external learning resources were also selected for different targets. Encompassing a wide range of aspects such as business information and trends, leadership and management, inter-personal relationships and communications, technology and innovation, personal growth and specialist fields, these resources help employees strengthen their core competencies in know-how, management, leadership and management while also meeting the needs of different students. Our active development of learning resources also ensured that the Company’s talent development plans could still be implemented during a very challenging 2020 and despite the impact of COVID-19. Further progress was made on the cultivation of a learning culture that both the enterprise and employees can benefit from.
4. The Successor program is conducted every year by the Company and in 2020 the scope of the program was expanded to identify candidates for most key positions. The program not only helps with employees’ career development but also ensures that a talent pipeline is in place to ensure continuity of key management roles within the Company. Supervisors use assessment reports as an aid to help every potential candidate draw up a personalized development plan. Different learning methods and resources are then provided including: job rotation, role or project assignment, domestic or overseas learning resources, English courses, certification courses, or even external trainers. These serve to enhance and track the professional knowledge, skills, experience, certification, English proficiency, leadership and management skills that each person may require.
71
Item CHC and Key Subsidiaries
Talent development, education and training
5. In such a talent shortage labor market, the selection and cultivation of talented young people is one of the keys to the sustainable development of an organization. In 2020, we conducted the process of young talents identification throughout all subsidiaries, helped talents to develop their individual development plans and provided supports and resources in helping them achieving their potential.
Comprehensive Retirement System
1. To look after employees in their retirement, Group Guideline of Retirement and Supervisory Committee of Labor Retirement Reserve were set up in accordance with the law. A monthly contribution of 2% of applicable employees’ salary is deposited in the designated pension reserve fund account at the Bank of Taiwan to secure employees’ rights.
2. The new pension system was introduced on July 1 2005, with the Company making a monthly contribution equal to 6% of each applicable employee’s salary into their individual pension account. Employees can also opt to make voluntary monthly contributions to their pension account with the Labor Insurance Bureau through direct payroll deductions.
3. Retirement Criteria:(1) Voluntary retirement
Employees may apply for voluntary retirement if they meet any one of the following conditions: A. Over 15 years of service and age of 55.B. Over 25 years of service.C. Over 10 years of service and age of 60.
(2) Mandatory retirement Employees may be forced to be retired if they meet any one of the following conditions:
A. Over age of 65.B. Those that are physically or mentally incapable of carrying out their duties.C. Those engaged in dangerous, physically demanding or other work of special character with
the approval of the central competent authority but must be least 55 years of age.(3) Pension payments and standards
A. For employees with seniority from before and after the enforcement of the Labor Standards Act, as well as employees that choose to be covered by the pension system of the Labor Standards Act or retain their seniority from before the Labor Standards Act in accordance with the Labor Pension Act, their pension payments shall be calculated in accordance with Article 84, Paragraph 2, and Article 55 of the Labor Standards Act.
B. For employees covered by the pension system of the Labor Pension Act, the Company makes a monthly contribution equal to 6% of their salary to their personal pension account.
Emphasis on Employee Welfares
For employee welfare, We provide the following comprehensive benefits in addition to the statutory leave, Labor Insurance, National Health Insurance, and pension contributions:1. Flextime: Flextime, unpaid leave and other benefits are offered out of respect for diversity and in
response to job requirements. 2. Nurture and bereavement: To help employees keep their family affairs in order, we offer standard
stipends ranging from $3,000 to $10,000 for weddings, funerals, and other matters. We also offer emergency financial assistance of up to $60,000 for employees in distress.
3. Festival bonuses: In line with traditional Taiwanese folk customs, a bonus of $2,000 was distributed for the 2020 Lunar New Year holidays, and a bonus of $1,000 was distributed for Labor Day and Mid-Autumn Festival.
4. Lifestyle support: We offer employees, their spouses and dependents free enrollment in the corporate health plan for hospital and cancer cover. Employees can choose the type of coverage appropriate to their situation.
5. Health promotion: Health exams and health seminars are organized regularly. An employee health management platform for information on maternity protection, overwork prevention and health has also been set up to encourage self-health management by employees. Work-life Coach services were introduced in February 2021. Professional external coaches help employees deal with a variety of different work and life issues.
6. Flexible benefits design: To help reduce employee stress and cater for their different requirements, we created a benefits program with an allowance up to $17,000 per person. Employees can choose to spend their allowance on their children's education, personal development, gym membership, or travel.
72
Item CHC and Key Subsidiaries
Emphasis on employee welfare
7. Club activities: We offer a variety of club activities to encourage employees to engage in healthy recreation activities outside of work to alleviate the pressures of work or family life. There are currently clubs for yoga, arts, mountaineering, golf, and badminton.
8. Employees that require unpaid maternity leave of absence and meet the statutory requirements are provided with the benefits and support by CHC in accordance with the law. The relevant provisions are explicitly defined in the guideline of employment management.
9. Comfortable working environment: We provide a safe and comfortable working environment with rest facilities. Helpful services include unlimited coffee and tea, cheap and convenient laundry services, meal ordering service etc.
Recognition Programs
A variety of recognition programs are deployed to encourage the pursuit of innovation and excellence by employees and teams and to recognize their sacrifices and contributions.‧ Employee Recognition Program: Good conduct, outstanding performance, and embodiment of
Company values is encouraged for employees.‧ Star Awards (CEC): Recognition of teams of operational excellence, excellence in Occupational
Health and Safety and Wellbeing.‧ Idea Box (CEC): Prize-winning proposals are shared publicly to encourage innovation and
employee participation. The best ideas of the year are also picked out for awards and public recognition.
‧ Service Awards: Expression of gratitude to employees with seniority for th
VI. Workplace Safety(I) Occupational Health and Safety Committee
The Company has established an Occupational Health and Safety Committee (OHS Committee) with 12 committee members. The 5 labor representatives account for more than one-third of the committee membership. The OHS Committee is convened every quarter to review OHS management matters and to discuss matters relating to health and safety. Resolutions passed by the OHS Committee are then announced and implemented through management meetings.
(II) Health and safety certification and management systemCEC, a subsidiary of the Company, has implemented an occupational health and safety management system. Both ISO 45001:2018 and CNS 45001:2018 certifications were obtained on September 17, 2019, and the certifications have been renewed. The health and safety management systems at each unit are audited every year to ensure their validity. A total of 35 units were audited for 2040 items in 2020. Technologies are continuing to be applied and developed for health and safety management as well. In 2020, AI was applied to image recognition technology as part of the Industrial Development Bureau’s technology development program. The two resulting applications were “AI recognition of personal protective equipment” and “AI smart electronic fence.” AI recognition of personal protective equipment uses AI image recognition to check each worker when they enter a construction site to ensure that their personal protective equipment is worn properly. The AI smart electronic fence improves on the conventional electronic fence by training the AI to only alert the administrator when it detects humans approaching. To enforce the engineering patrol system in 2020, a duty engineer patrol log system was adopted throughout the Company. All engineering personnel assigned to site health and safety patrols now use their mobile phones to report the health and safety situation at the construction site directly to the cloud system. Administrators then have an up-to-date picture of health and safety at all sites. If any health and safety deficiencies are detected, corrective actions can be taken immediately to reduce health and safety risks on the construction site. Accolades received include the Taipei City Labor Safety Award - Outstanding Unit, New Taipei Industrial Safety Award - Outstanding Unit, Taichung City Government Golden Safety Project - Distinction, Occupational Safety and Health (OSHA) Administration - Excellence in Promotion of Occupational Safety and Health, and OSHA - Golden Public Construction Golden Safety Award.
73
(III) OHS Policy, - and TrainingThe Company is continuing to conduct hazard identification and risk assessment for health and safety for Group subsidiaries and branches in accordance with the Group Occupational Health and Safety Policy. The hazard identification and risk assessment process promotes employee engagement and helps employees understand the hazards that they may encounter in their work environment, and the corresponding preventive actions. Hazard identification and risk assessments were completed by 41 units in 2020. A health and safety road tour was organized for engineering personnel at all projects under construction in support of the “industrial safety is everyone’s responsibility” policy. The training is aimed at enhancing the ability of employees to engage in on-site hazard identification and risk management. In 2020, 38 training sessions were conducted and attended by 669 employees; at the same time, annual emergency response drills were conducted to maintain the hazard awareness and response skills of employees. Emergency response drills were carried out at 28 units in 2020. In addition to the education and training mentioned above, 601 sessions of routine refresher training for occupational safety personnel as well as internal safety and health training were carried out. Taiwan Occupational Safety Card (internal) training was conducted for 718 people, while the Company’s Virtual Reality (VR) health and safety education was completed by 230 people. Under the Group health and safety policy, safety and health performance is included as one of the Company’s group performance indicators. All employees are expected to pay attention to health and safety in order to realize the goal of total health and safety. A clearly-defined health and safety incentive scheme was also established with different criteria and references for different roles. Front-line workers, contractors, and engineers all have a chance of competing for the incentives.
(IV) Employee health promotion and well-beingThe Company is committed to health management and health promotion in the workplace. In 2020, initiatives aimed at the physical and mental well-being of employees were planned and implemented. A total of 31 health promoting notices were mailed out to all employees in 2020. 6 health seminars were also held for employees to attend. Topics at the seminars included: first-aid training, fall and electrocution prevention training, CPR and AED training, Mental Health - Fun and De-Stress, Immunity-boosting diets, workplace stretching exercises - reduction of cumulative muscle strain. Practicing physicians were also invited to conduct at least one on-site clinic (total of 8 sessions) every two months. A workplace and working hazard assessment was conducted for maternity protection at the Company. The results of the health exams and workload assessment were used to identify employees with high health risks for physical and mental health promotion. Many construction workers are habitual betel nut chewers and are at higher risk of oral cancer. As prevention is better than cure, “oral cancer screening” sessions were conducted by engineering units. The 8 sessions in northern, central, and southern Taiwan were attended by a total of 447 people. Due to the COVID-19 epidemic, epidemic prevention initiatives were launched in 2020 to protect the health of employees. These included: Establishment of epidemic prevention procedures, access control for arriving personnel, temperature measurement, designated routes, epidemic prevention surveys, working from home, split team drills and more. To prevent cluster transmission, employee health exams were postponed to 2021. The actual format of the health exams will depend on COVID-19 developments to protect employee health.
74
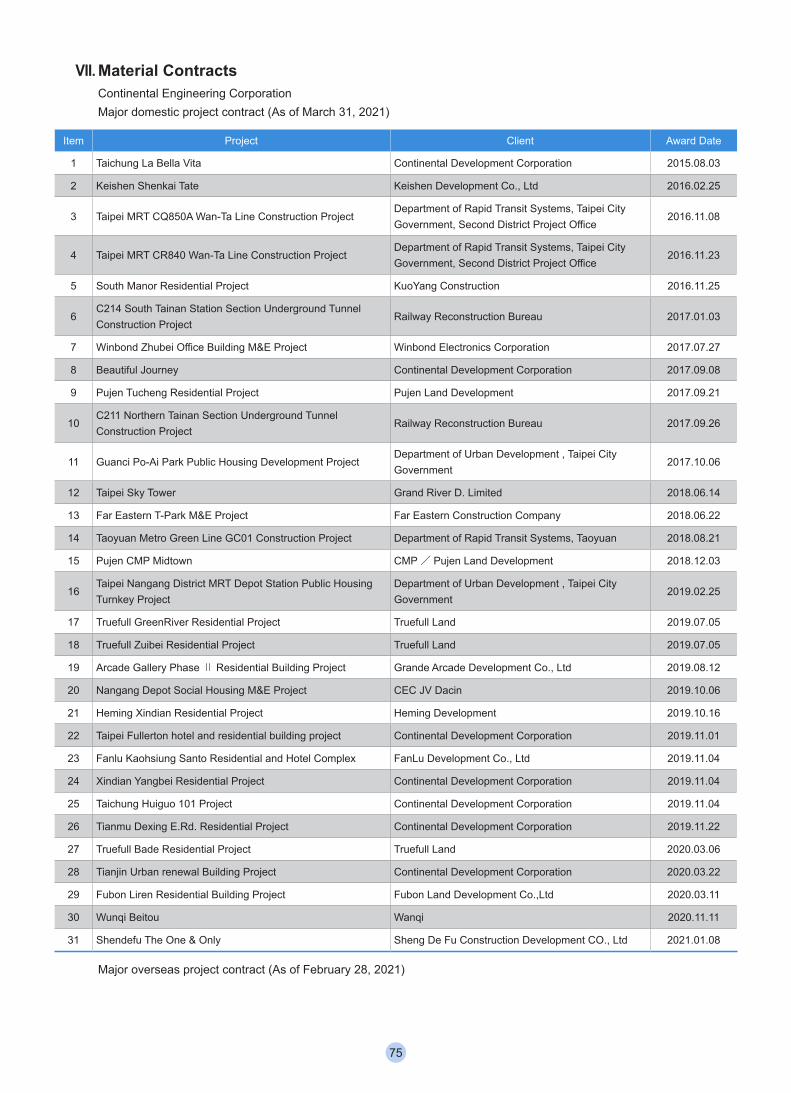
VII. Material Contracts Continental Engineering CorporationMajor domestic project contract (As of March 31, 2021)
Item Project Client Award Date
1 Taichung La Bella Vita Continental Development Corporation 2015.08.03
2 Keishen Shenkai Tate Keishen Development Co., Ltd 2016.02.25
3 Taipei MRT CQ850A Wan-Ta Line Construction ProjectDepartment of Rapid Transit Systems, Taipei City Government, Second District Project Office
2016.11.08
4 Taipei MRT CR840 Wan-Ta Line Construction ProjectDepartment of Rapid Transit Systems, Taipei City Government, Second District Project Office
2016.11.23
5 South Manor Residential Project KuoYang Construction 2016.11.25
6C214 South Tainan Station Section Underground Tunnel Construction Project
Railway Reconstruction Bureau 2017.01.03
7 Winbond Zhubei Office Building M&E Project Winbond Electronics Corporation 2017.07.27
8 Beautiful Journey Continental Development Corporation 2017.09.08
9 Pujen Tucheng Residential Project Pujen Land Development 2017.09.21
10C211 Northern Tainan Section Underground Tunnel Construction Project
Railway Reconstruction Bureau 2017.09.26
11 Guanci Po-Ai Park Public Housing Development ProjectDepartment of Urban Development , Taipei City Government
2017.10.06
12 Taipei Sky Tower Grand River D. Limited 2018.06.14
13 Far Eastern T-Park M&E Project Far Eastern Construction Company 2018.06.22
14 Taoyuan Metro Green Line GC01 Construction Project Department of Rapid Transit Systems, Taoyuan 2018.08.21
15 Pujen CMP Midtown CMP/ Pujen Land Development 2018.12.03
16Taipei Nangang District MRT Depot Station Public Housing Turnkey Project
Department of Urban Development , Taipei City Government
2019.02.25
17 Truefull GreenRiver Residential Project Truefull Land 2019.07.05
18 Truefull Zuibei Residential Project Truefull Land 2019.07.05
19 Arcade Gallery Phase Ⅱ Residential Building Project Grande Arcade Development Co., Ltd 2019.08.12
20 Nangang Depot Social Housing M&E Project CEC JV Dacin 2019.10.06
21 Heming Xindian Residential Project Heming Development 2019.10.16
22 Taipei Fullerton hotel and residential building project Continental Development Corporation 2019.11.01
23 Fanlu Kaohsiung Santo Residential and Hotel Complex FanLu Development Co., Ltd 2019.11.04
24 Xindian Yangbei Residential Project Continental Development Corporation 2019.11.04
25 Taichung Huiguo 101 Project Continental Development Corporation 2019.11.04
26 Tianmu Dexing E.Rd. Residential Project Continental Development Corporation 2019.11.22
27 Truefull Bade Residential Project Truefull Land 2020.03.06
28 Tianjin Urban renewal Building Project Continental Development Corporation 2020.03.22
29 Fubon Liren Residential Building Project Fubon Land Development Co.,Ltd 2020.03.11
30 Wunqi Beitou Wanqi 2020.11.11
31 Shendefu The One & Only Sheng De Fu Construction Development CO., Ltd 2021.01.08
Major overseas project contract (As of February 28, 2021)
75
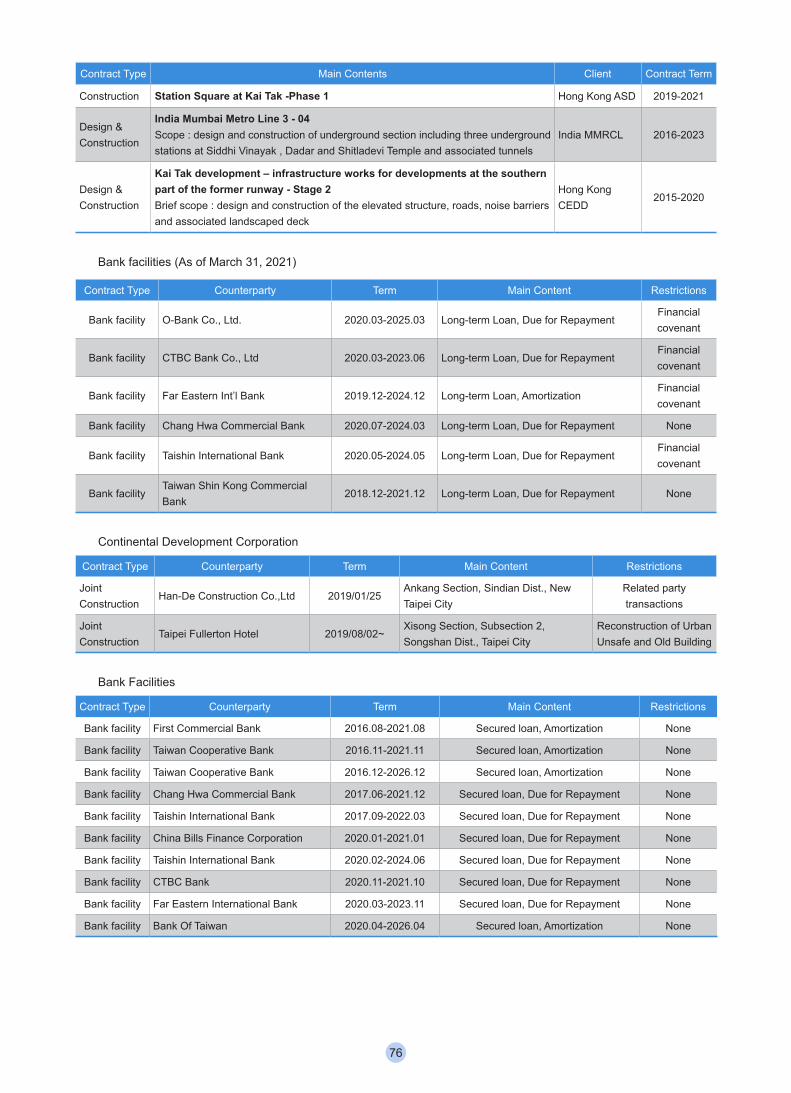
Contract Type Main Contents Client Contract Term
Construction Station Square at Kai Tak -Phase 1 Hong Kong ASD 2019-2021
Design & Construction
India Mumbai Metro Line 3 - 04Scope : design and construction of underground section including three underground stations at Siddhi Vinayak , Dadar and Shitladevi Temple and associated tunnels
India MMRCL 2016-2023
Design & Construction
Kai Tak development – infrastructure works for developments at the southern part of the former runway - Stage 2Brief scope : design and construction of the elevated structure, roads, noise barriers and associated landscaped deck
Hong Kong CEDD
2015-2020
Bank facilities (As of March 31, 2021)
Contract Type Counterparty Term Main Content Restrictions
Bank facility O-Bank Co., Ltd. 2020.03-2025.03 Long-term Loan, Due for RepaymentFinancial covenant
Bank facility CTBC Bank Co., Ltd 2020.03-2023.06 Long-term Loan, Due for RepaymentFinancial covenant
Bank facility Far Eastern Int’l Bank 2019.12-2024.12 Long-term Loan, AmortizationFinancial covenant
Bank facility Chang Hwa Commercial Bank 2020.07-2024.03 Long-term Loan, Due for Repayment None
Bank facility Taishin International Bank 2020.05-2024.05 Long-term Loan, Due for RepaymentFinancial covenant
Bank facilityTaiwan Shin Kong Commercial Bank
2018.12-2021.12 Long-term Loan, Due for Repayment None
Continental Development Corporation
Contract Type Counterparty Term Main Content Restrictions
Joint Construction
Han-De Construction Co.,Ltd 2019/01/25Ankang Section, Sindian Dist., New Taipei City
Related party transactions
Joint Construction
Taipei Fullerton Hotel 2019/08/02~Xisong Section, Subsection 2, Songshan Dist., Taipei City
Reconstruction of Urban Unsafe and Old Building
Bank Facilities
Contract Type Counterparty Term Main Content Restrictions
Bank facility First Commercial Bank 2016.08-2021.08 Secured loan, Amortization None
Bank facility Taiwan Cooperative Bank 2016.11-2021.11 Secured loan, Amortization None
Bank facility Taiwan Cooperative Bank 2016.12-2026.12 Secured loan, Amortization None
Bank facility Chang Hwa Commercial Bank 2017.06-2021.12 Secured loan, Due for Repayment None
Bank facility Taishin International Bank 2017.09-2022.03 Secured loan, Due for Repayment None
Bank facility China Bills Finance Corporation 2020.01-2021.01 Secured loan, Due for Repayment None
Bank facility Taishin International Bank 2020.02-2024.06 Secured loan, Due for Repayment None
Bank facility CTBC Bank 2020.11-2021.10 Secured loan, Due for Repayment None
Bank facility Far Eastern International Bank 2020.03-2023.11 Secured loan, Due for Repayment None
Bank facility Bank Of Taiwan 2020.04-2026.04 Secured loan, Amortization None
76
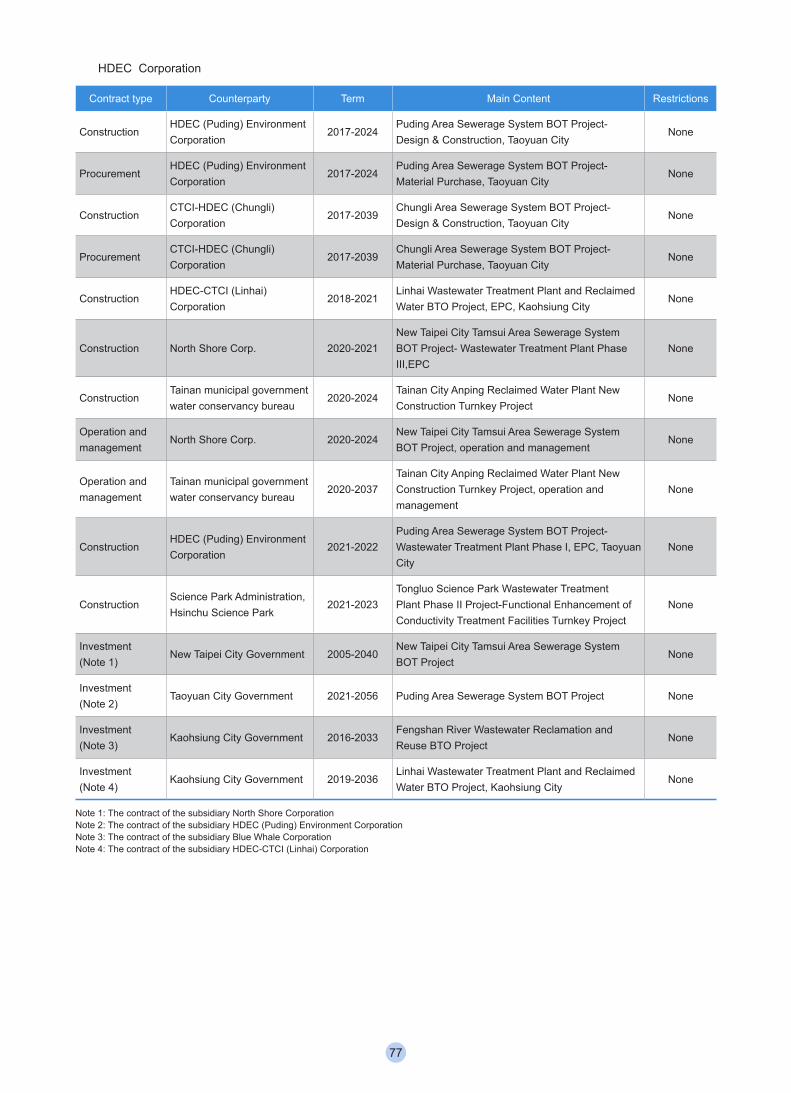
HDEC Corporation
Contract type Counterparty Term Main Content Restrictions
ConstructionHDEC (Puding) Environment Corporation
2017-2024Puding Area Sewerage System BOT Project- Design & Construction, Taoyuan City
None
Procurement HDEC (Puding) Environment Corporation
2017-2024Puding Area Sewerage System BOT Project- Material Purchase, Taoyuan City
None
ConstructionCTCI-HDEC (Chungli) Corporation
2017-2039Chungli Area Sewerage System BOT Project- Design & Construction, Taoyuan City
None
ProcurementCTCI-HDEC (Chungli) Corporation
2017-2039Chungli Area Sewerage System BOT Project-Material Purchase, Taoyuan City
None
ConstructionHDEC-CTCI (Linhai) Corporation
2018-2021Linhai Wastewater Treatment Plant and Reclaimed Water BTO Project, EPC, Kaohsiung City
None
Construction North Shore Corp. 2020-2021New Taipei City Tamsui Area Sewerage System BOT Project- Wastewater Treatment Plant Phase III,EPC
None
ConstructionTainan municipal government water conservancy bureau
2020-2024Tainan City Anping Reclaimed Water Plant New Construction Turnkey Project
None
Operation and management
North Shore Corp. 2020-2024New Taipei City Tamsui Area Sewerage System BOT Project, operation and management
None
Operation and management
Tainan municipal government water conservancy bureau
2020-2037Tainan City Anping Reclaimed Water Plant New Construction Turnkey Project, operation and management
None
ConstructionHDEC (Puding) Environment Corporation
2021-2022Puding Area Sewerage System BOT Project- Wastewater Treatment Plant Phase I, EPC, Taoyuan City
None
ConstructionScience Park Administration, Hsinchu Science Park
2021-2023Tongluo Science Park Wastewater Treatment Plant Phase II Project-Functional Enhancement of Conductivity Treatment Facilities Turnkey Project
None
Investment(Note 1)
New Taipei City Government 2005-2040New Taipei City Tamsui Area Sewerage System BOT Project
None
Investment(Note 2)
Taoyuan City Government 2021-2056 Puding Area Sewerage System BOT Project None
Investment(Note 3)
Kaohsiung City Government 2016-2033Fengshan River Wastewater Reclamation and Reuse BTO Project
None
Investment(Note 4)
Kaohsiung City Government 2019-2036Linhai Wastewater Treatment Plant and Reclaimed Water BTO Project, Kaohsiung City
None
Note 1: The contract of the subsidiary North Shore CorporationNote 2: The contract of the subsidiary HDEC (Puding) Environment CorporationNote 3: The contract of the subsidiary Blue Whale CorporationNote 4: The contract of the subsidiary HDEC-CTCI (Linhai) Corporation
77
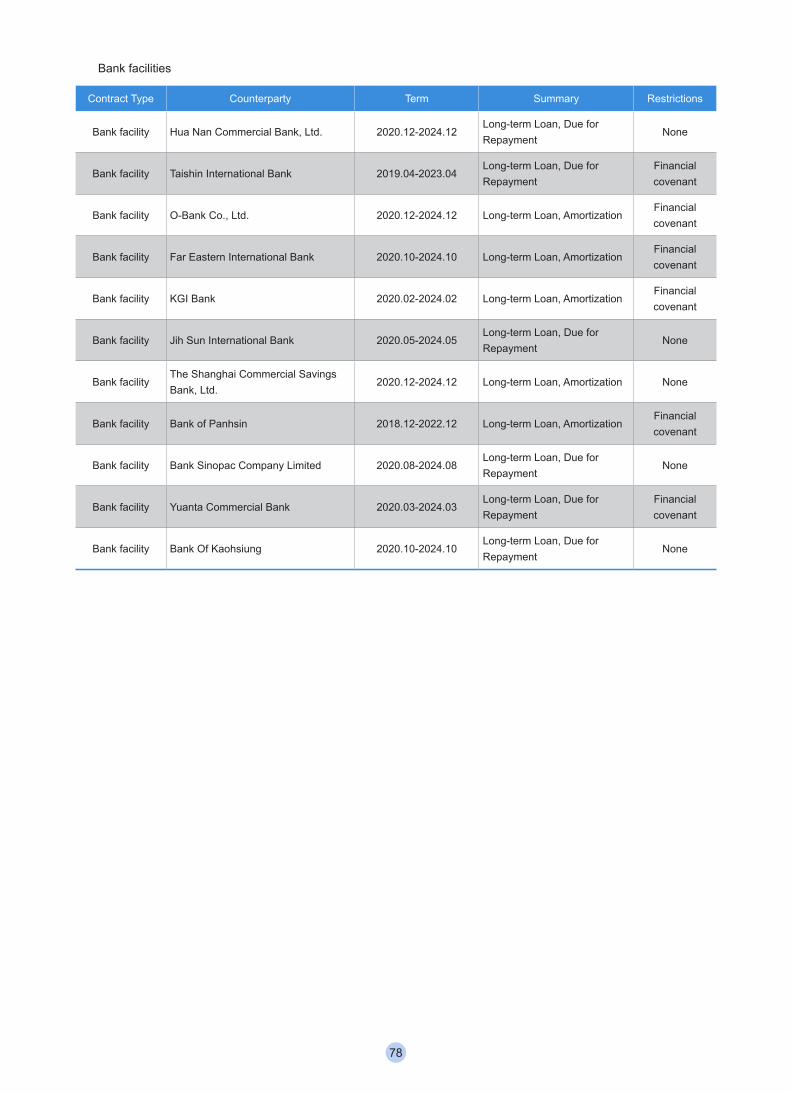
Bank facilities
Contract Type Counterparty Term Summary Restrictions
Bank facility Hua Nan Commercial Bank, Ltd. 2020.12-2024.12Long-term Loan, Due for Repayment
None
Bank facility Taishin International Bank 2019.04-2023.04Long-term Loan, Due for Repayment
Financial covenant
Bank facility O-Bank Co., Ltd. 2020.12-2024.12 Long-term Loan, AmortizationFinancial covenant
Bank facility Far Eastern International Bank 2020.10-2024.10 Long-term Loan, AmortizationFinancial covenant
Bank facility KGI Bank 2020.02-2024.02 Long-term Loan, AmortizationFinancial covenant
Bank facility Jih Sun International Bank 2020.05-2024.05Long-term Loan, Due for Repayment
None
Bank facilityThe Shanghai Commercial Savings Bank, Ltd.
2020.12-2024.12 Long-term Loan, Amortization None
Bank facility Bank of Panhsin 2018.12-2022.12 Long-term Loan, AmortizationFinancial covenant
Bank facility Bank Sinopac Company Limited 2020.08-2024.08Long-term Loan, Due for Repayment
None
Bank facility Yuanta Commercial Bank 2020.03-2024.03Long-term Loan, Due for Repayment
Financial covenant
Bank facility Bank Of Kaohsiung 2020.10-2024.10Long-term Loan, Due for Repayment
None
78
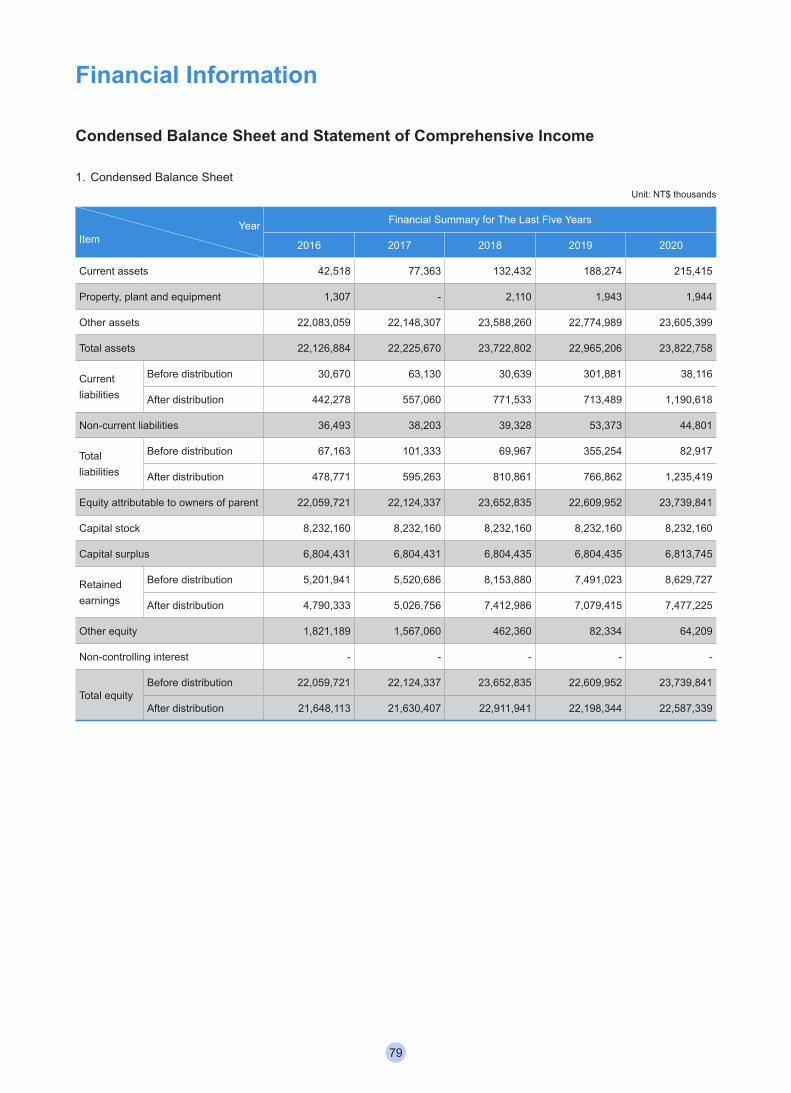
Financial Information
Condensed Balance Sheet and Statement of Comprehensive Income
1. Condensed Balance SheetUnit: NT$ thousands
YearItem
Financial Summary for The Last Five Years
2016 2017 2018 2019 2020
Current assets 42,518 77,363 132,432 188,274 215,415
Property, plant and equipment 1,307 - 2,110 1,943 1,944
Other assets 22,083,059 22,148,307 23,588,260 22,774,989 23,605,399
Total assets 22,126,884 22,225,670 23,722,802 22,965,206 23,822,758
Current liabilities
Before distribution 30,670 63,130 30,639 301,881 38,116
After distribution 442,278 557,060 771,533 713,489 1,190,618
Non-current liabilities 36,493 38,203 39,328 53,373 44,801
Total liabilities
Before distribution 67,163 101,333 69,967 355,254 82,917
After distribution 478,771 595,263 810,861 766,862 1,235,419
Equity attributable to owners of parent 22,059,721 22,124,337 23,652,835 22,609,952 23,739,841
Capital stock 8,232,160 8,232,160 8,232,160 8,232,160 8,232,160
Capital surplus 6,804,431 6,804,431 6,804,435 6,804,435 6,813,745
Retained earnings
Before distribution 5,201,941 5,520,686 8,153,880 7,491,023 8,629,727
After distribution 4,790,333 5,026,756 7,412,986 7,079,415 7,477,225
Other equity 1,821,189 1,567,060 462,360 82,334 64,209
Non-controlling interest - - - - -
Total equityBefore distribution 22,059,721 22,124,337 23,652,835 22,609,952 23,739,841
After distribution 21,648,113 21,630,407 22,911,941 22,198,344 22,587,339
79
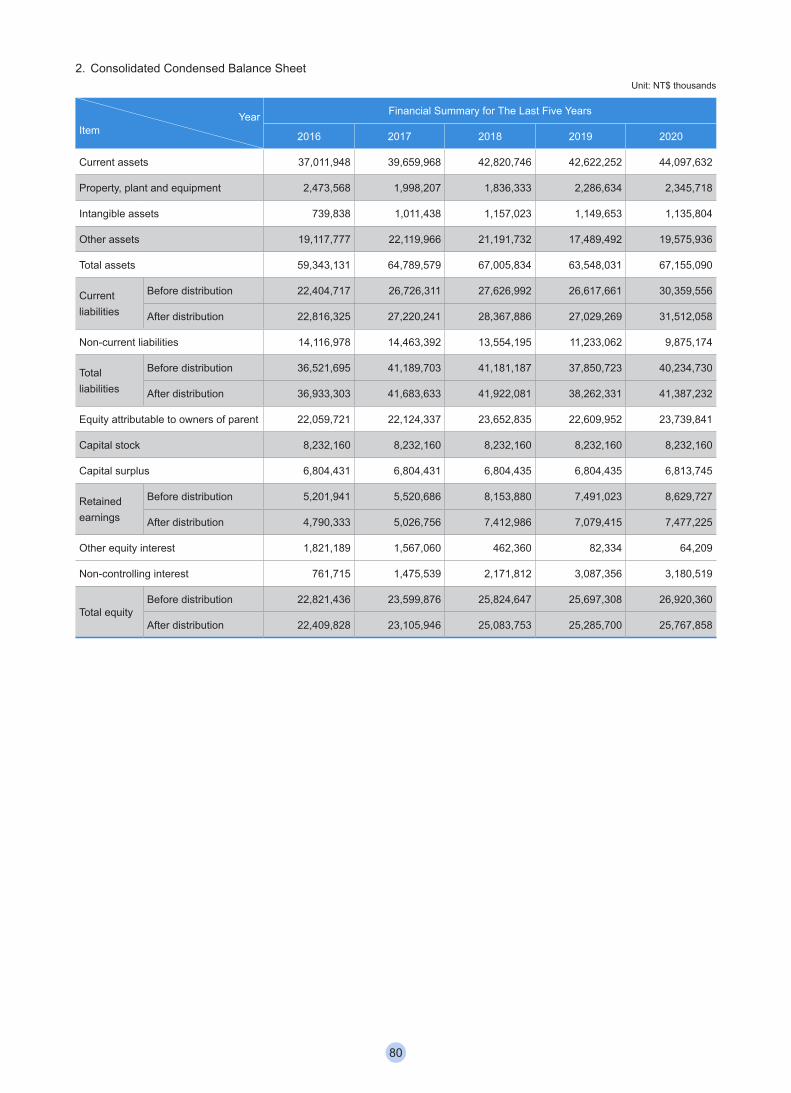
2. Consolidated Condensed Balance SheetUnit: NT$ thousands
YearItem
Financial Summary for The Last Five Years
2016 2017 2018 2019 2020
Current assets 37,011,948 39,659,968 42,820,746 42,622,252 44,097,632
Property, plant and equipment 2,473,568 1,998,207 1,836,333 2,286,634 2,345,718
Intangible assets 739,838 1,011,438 1,157,023 1,149,653 1,135,804
Other assets 19,117,777 22,119,966 21,191,732 17,489,492 19,575,936
Total assets 59,343,131 64,789,579 67,005,834 63,548,031 67,155,090
Current liabilities
Before distribution 22,404,717 26,726,311 27,626,992 26,617,661 30,359,556
After distribution 22,816,325 27,220,241 28,367,886 27,029,269 31,512,058
Non-current liabilities 14,116,978 14,463,392 13,554,195 11,233,062 9,875,174
Total liabilities
Before distribution 36,521,695 41,189,703 41,181,187 37,850,723 40,234,730
After distribution 36,933,303 41,683,633 41,922,081 38,262,331 41,387,232
Equity attributable to owners of parent 22,059,721 22,124,337 23,652,835 22,609,952 23,739,841
Capital stock 8,232,160 8,232,160 8,232,160 8,232,160 8,232,160
Capital surplus 6,804,431 6,804,431 6,804,435 6,804,435 6,813,745
Retained earnings
Before distribution 5,201,941 5,520,686 8,153,880 7,491,023 8,629,727
After distribution 4,790,333 5,026,756 7,412,986 7,079,415 7,477,225
Other equity interest 1,821,189 1,567,060 462,360 82,334 64,209
Non-controlling interest 761,715 1,475,539 2,171,812 3,087,356 3,180,519
Total equityBefore distribution 22,821,436 23,599,876 25,824,647 25,697,308 26,920,360
After distribution 22,409,828 23,105,946 25,083,753 25,285,700 25,767,858
80
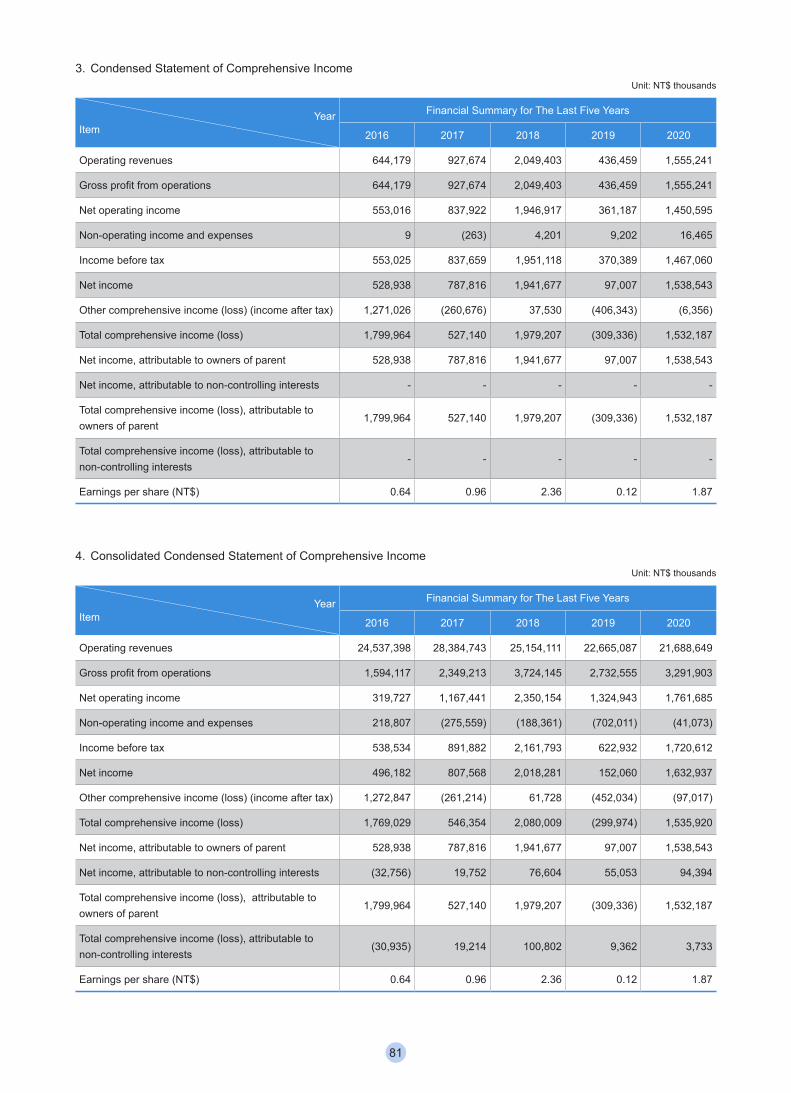
3. Condensed Statement of Comprehensive IncomeUnit: NT$ thousands
YearItem
Financial Summary for The Last Five Years
2016 2017 2018 2019 2020
Operating revenues 644,179 927,674 2,049,403 436,459 1,555,241
Gross profit from operations 644,179 927,674 2,049,403 436,459 1,555,241
Net operating income 553,016 837,922 1,946,917 361,187 1,450,595
Non-operating income and expenses 9 (263) 4,201 9,202 16,465
Income before tax 553,025 837,659 1,951,118 370,389 1,467,060
Net income 528,938 787,816 1,941,677 97,007 1,538,543
Other comprehensive income (loss) (income after tax) 1,271,026 (260,676) 37,530 (406,343) (6,356)
Total comprehensive income (loss) 1,799,964 527,140 1,979,207 (309,336) 1,532,187
Net income, attributable to owners of parent 528,938 787,816 1,941,677 97,007 1,538,543
Net income, attributable to non-controlling interests - - - - -
Total comprehensive income (loss), attributable to owners of parent
1,799,964 527,140 1,979,207 (309,336) 1,532,187
Total comprehensive income (loss), attributable to non-controlling interests
- - - - -
Earnings per share (NT$) 0.64 0.96 2.36 0.12 1.87
4. Consolidated Condensed Statement of Comprehensive IncomeUnit: NT$ thousands
YearItem
Financial Summary for The Last Five Years
2016 2017 2018 2019 2020
Operating revenues 24,537,398 28,384,743 25,154,111 22,665,087 21,688,649
Gross profit from operations 1,594,117 2,349,213 3,724,145 2,732,555 3,291,903
Net operating income 319,727 1,167,441 2,350,154 1,324,943 1,761,685
Non-operating income and expenses 218,807 (275,559) (188,361) (702,011) (41,073)
Income before tax 538,534 891,882 2,161,793 622,932 1,720,612
Net income 496,182 807,568 2,018,281 152,060 1,632,937
Other comprehensive income (loss) (income after tax) 1,272,847 (261,214) 61,728 (452,034) (97,017)
Total comprehensive income (loss) 1,769,029 546,354 2,080,009 (299,974) 1,535,920
Net income, attributable to owners of parent 528,938 787,816 1,941,677 97,007 1,538,543
Net income, attributable to non-controlling interests (32,756) 19,752 76,604 55,053 94,394
Total comprehensive income (loss), attributable to owners of parent
1,799,964 527,140 1,979,207 (309,336) 1,532,187
Total comprehensive income (loss), attributable to non-controlling interests
(30,935) 19,214 100,802 9,362 3,733
Earnings per share (NT$) 0.64 0.96 2.36 0.12 1.87
81
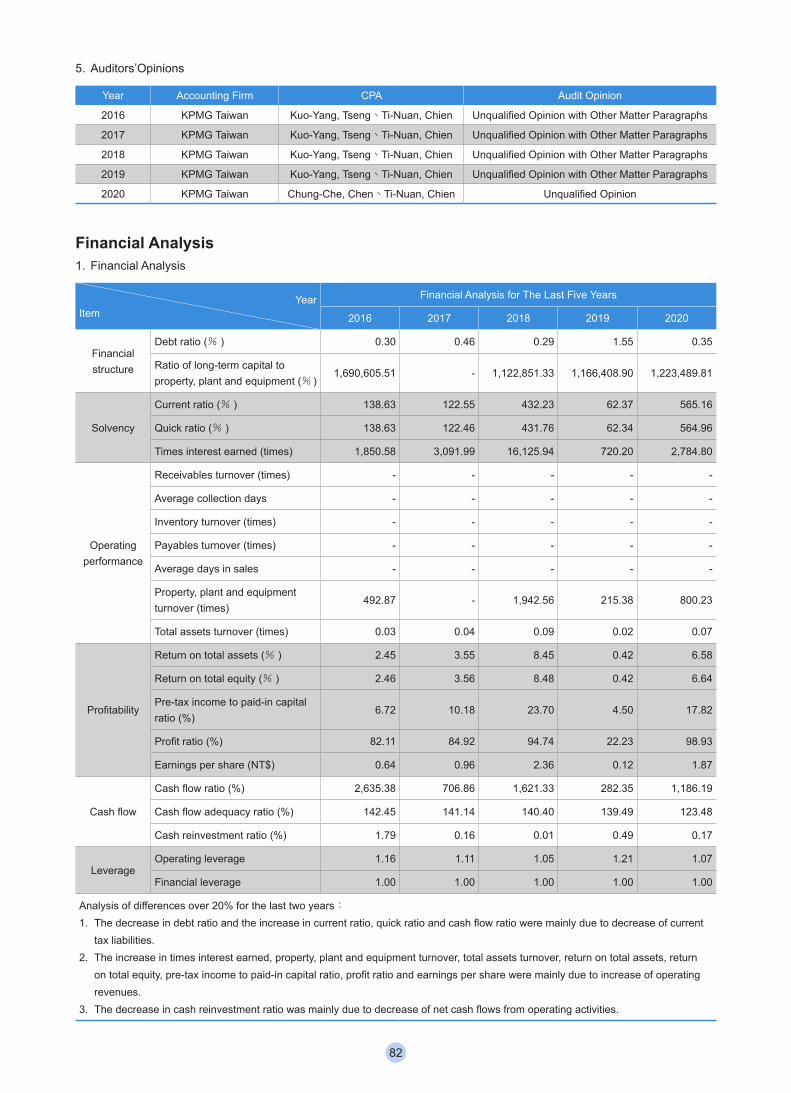
5. Auditors’Opinions
Year Accounting Firm CPA Audit Opinion
2016 KPMG Taiwan Kuo-Yang, Tseng、Ti-Nuan, Chien Unqualified Opinion with Other Matter Paragraphs
2017 KPMG Taiwan Kuo-Yang, Tseng、Ti-Nuan, Chien Unqualified Opinion with Other Matter Paragraphs
2018 KPMG Taiwan Kuo-Yang, Tseng、Ti-Nuan, Chien Unqualified Opinion with Other Matter Paragraphs
2019 KPMG Taiwan Kuo-Yang, Tseng、Ti-Nuan, Chien Unqualified Opinion with Other Matter Paragraphs
2020 KPMG Taiwan Chung-Che, Chen、Ti-Nuan, Chien Unqualified Opinion
Financial Analysis1. Financial Analysis
YearItem
Financial Analysis for The Last Five Years
2016 2017 2018 2019 2020
Financial structure
Debt ratio (% ) 0.30 0.46 0.29 1.55 0.35
Ratio of long-term capital to property, plant and equipment (% )
1,690,605.51 - 1,122,851.33 1,166,408.90 1,223,489.81
Solvency
Current ratio (% ) 138.63 122.55 432.23 62.37 565.16
Quick ratio (% ) 138.63 122.46 431.76 62.34 564.96
Times interest earned (times) 1,850.58 3,091.99 16,125.94 720.20 2,784.80
Operating performance
Receivables turnover (times) - - - - -
Average collection days - - - - -
Inventory turnover (times) - - - - -
Payables turnover (times) - - - - -
Average days in sales - - - - -
Property, plant and equipment turnover (times)
492.87 - 1,942.56 215.38 800.23
Total assets turnover (times) 0.03 0.04 0.09 0.02 0.07
Profitability
Return on total assets (% ) 2.45 3.55 8.45 0.42 6.58
Return on total equity (% ) 2.46 3.56 8.48 0.42 6.64
Pre-tax income to paid-in capital ratio (%)
6.72 10.18 23.70 4.50 17.82
Profit ratio (%) 82.11 84.92 94.74 22.23 98.93
Earnings per share (NT$) 0.64 0.96 2.36 0.12 1.87
Cash flow
Cash flow ratio (%) 2,635.38 706.86 1,621.33 282.35 1,186.19
Cash flow adequacy ratio (%) 142.45 141.14 140.40 139.49 123.48
Cash reinvestment ratio (%) 1.79 0.16 0.01 0.49 0.17
LeverageOperating leverage 1.16 1.11 1.05 1.21 1.07
Financial leverage 1.00 1.00 1.00 1.00 1.00
Analysis of differences over 20% for the last two years:1. The decrease in debt ratio and the increase in current ratio, quick ratio and cash flow ratio were mainly due to decrease of current
tax liabilities.2. The increase in times interest earned, property, plant and equipment turnover, total assets turnover, return on total assets, return
on total equity, pre-tax income to paid-in capital ratio, profit ratio and earnings per share were mainly due to increase of operating revenues.
3. The decrease in cash reinvestment ratio was mainly due to decrease of net cash flows from operating activities.
82
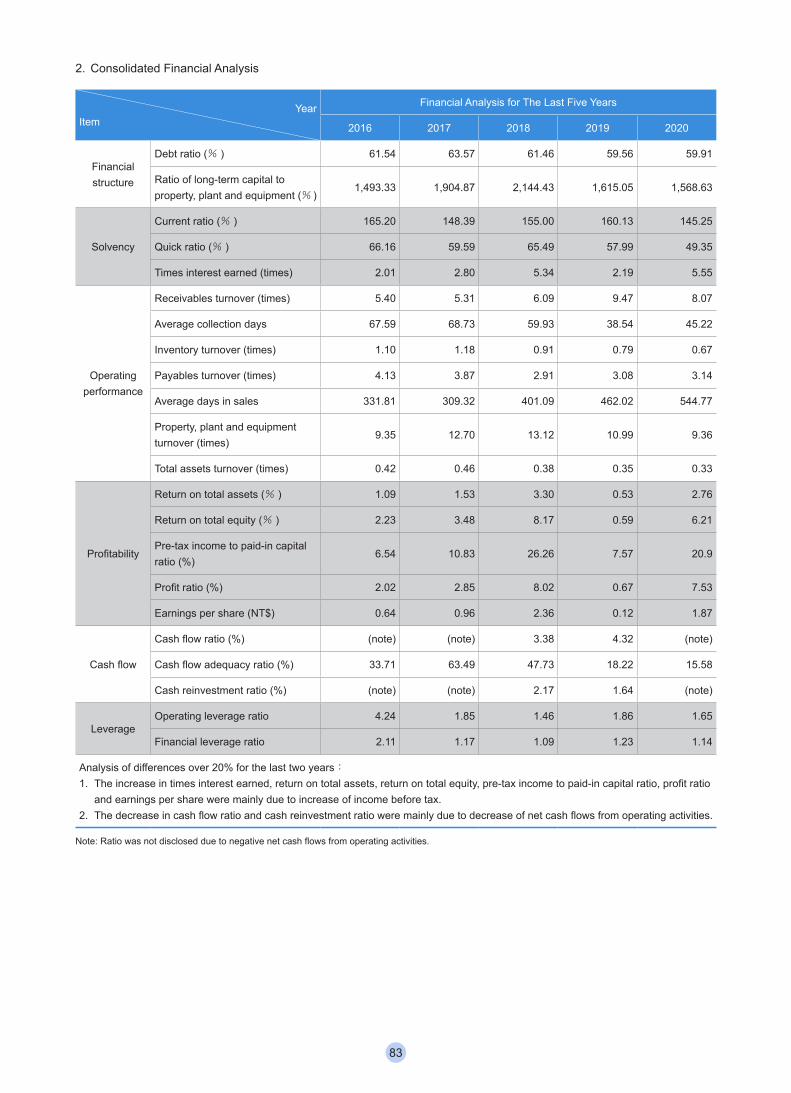
2. Consolidated Financial Analysis
YearItem
Financial Analysis for The Last Five Years
2016 2017 2018 2019 2020
Financial structure
Debt ratio (% ) 61.54 63.57 61.46 59.56 59.91
Ratio of long-term capital to property, plant and equipment (% )
1,493.33 1,904.87 2,144.43 1,615.05 1,568.63
Solvency
Current ratio (% ) 165.20 148.39 155.00 160.13 145.25
Quick ratio (% ) 66.16 59.59 65.49 57.99 49.35
Times interest earned (times) 2.01 2.80 5.34 2.19 5.55
Operating performance
Receivables turnover (times) 5.40 5.31 6.09 9.47 8.07
Average collection days 67.59 68.73 59.93 38.54 45.22
Inventory turnover (times) 1.10 1.18 0.91 0.79 0.67
Payables turnover (times) 4.13 3.87 2.91 3.08 3.14
Average days in sales 331.81 309.32 401.09 462.02 544.77
Property, plant and equipment turnover (times)
9.35 12.70 13.12 10.99 9.36
Total assets turnover (times) 0.42 0.46 0.38 0.35 0.33
Profitability
Return on total assets (% ) 1.09 1.53 3.30 0.53 2.76
Return on total equity (% ) 2.23 3.48 8.17 0.59 6.21
Pre-tax income to paid-in capital ratio (%)
6.54 10.83 26.26 7.57 20.9
Profit ratio (%) 2.02 2.85 8.02 0.67 7.53
Earnings per share (NT$) 0.64 0.96 2.36 0.12 1.87
Cash flow
Cash flow ratio (%) (note) (note) 3.38 4.32 (note)
Cash flow adequacy ratio (%) 33.71 63.49 47.73 18.22 15.58
Cash reinvestment ratio (%) (note) (note) 2.17 1.64 (note)
LeverageOperating leverage ratio 4.24 1.85 1.46 1.86 1.65
Financial leverage ratio 2.11 1.17 1.09 1.23 1.14
Analysis of differences over 20% for the last two years:1. The increase in times interest earned, return on total assets, return on total equity, pre-tax income to paid-in capital ratio, profit ratio
and earnings per share were mainly due to increase of income before tax.2. The decrease in cash flow ratio and cash reinvestment ratio were mainly due to decrease of net cash flows from operating activities.
Note: Ratio was not disclosed due to negative net cash flows from operating activities.
83
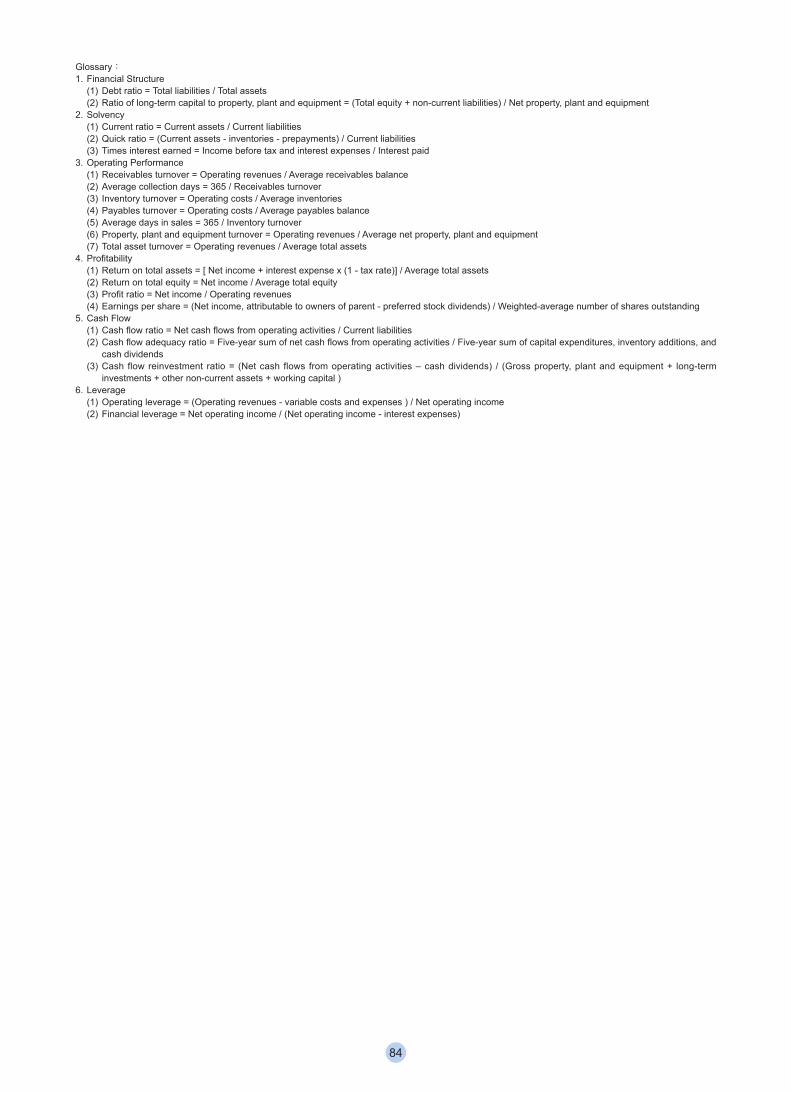
Glossary:1. Financial Structure
(1) Debt ratio = Total liabilities / Total assets(2) Ratio of long-term capital to property, plant and equipment = (Total equity + non-current liabilities) / Net property, plant and equipment
2. Solvency(1) Current ratio = Current assets / Current liabilities(2) Quick ratio = (Current assets - inventories - prepayments) / Current liabilities(3) Times interest earned = Income before tax and interest expenses / Interest paid
3. Operating Performance(1) Receivables turnover = Operating revenues / Average receivables balance(2) Average collection days = 365 / Receivables turnover(3) Inventory turnover = Operating costs / Average inventories(4) Payables turnover = Operating costs / Average payables balance(5) Average days in sales = 365 / Inventory turnover(6) Property, plant and equipment turnover = Operating revenues / Average net property, plant and equipment(7) Total asset turnover = Operating revenues / Average total assets
4. Profitability(1) Return on total assets = [ Net income + interest expense x (1 - tax rate)] / Average total assets(2) Return on total equity = Net income / Average total equity(3) Profit ratio = Net income / Operating revenues(4) Earnings per share = (Net income, attributable to owners of parent - preferred stock dividends) / Weighted-average number of shares outstanding
5. Cash Flow(1) Cash flow ratio = Net cash flows from operating activities / Current liabilities(2) Cash flow adequacy ratio = Five-year sum of net cash flows from operating activities / Five-year sum of capital expenditures, inventory additions, and
cash dividends(3) Cash flow reinvestment ratio = (Net cash flows from operating activities – cash dividends) / (Gross property, plant and equipment + long-term
investments + other non-current assets + working capital )6. Leverage
(1) Operating leverage = (Operating revenues - variable costs and expenses ) / Net operating income(2) Financial leverage = Net operating income / (Net operating income - interest expenses)
84
Audit Committee’s Review Report
The Board of Directors has prepared the Company’s 2020 Business Report, Financial Statements, and proposal for allocation of profits. The CPA firm of KPMG Taiwan was retained to audit Continental Holdings Corporation's Financial Statements and has issued an audit report relating to the Financial Statements. The Business Report , Financial Statements, and profits allocation proposal have been reviewed and determined to be correct and accurate by the Audit Committee members of Continental Holdings Corporation. According to Article 14-4 of the Securities and Exchange Act and Article 219 of the Company Law, we hereby submit this Repor.
Continental Holdings Corporation
Chairman of the Audit Committee: Donny Kao
Dated March 16, 2021
85
Consolidated Financial Statements
Representation Letter
The entities that are required to be included in the combined financial statements of CONTINENTAL HOLDINGS CORPORATION as of and for the year ended December 31, 2020 under the Criteria Governing the Preparation of Affiliation Reports, Consolidated Business Reports, and Consolidated Financial Statements of Affiliated Enterprises are the same as those included in the consolidated financial statements prepared in conformity with International Financial Reporting Standards No. 10 by the Financial Supervisory Commission, "Consolidated Financial Statements." In addition, the information required to be disclosed in the combined financial statements is included in the consolidated financial statements. Consequently, CONTINENTAL HOLDINGS CORPORATION and Subsidiaries do not prepare a separate set of combined financial statements.
Company name: CONTINENTAL HOLDINGS CORPORATIONChairman: Nita Ing Date: March 16, 2021
86
Independent Auditors’ Report
To the Board of Directors of CONTINENTAL HOLDINGS CORPORATION:
Opinion
We have audited the consolidated financial statements of Continental Holdings Corporation and its subsidiaries (“the Group”), which comprise the statement of consolidated financial position as of December 31, 2020 and 2019, the consolidated statements of comprehensive income, changes in equity and cash flows for the years then ended, and notes to the consolidated financial statements, including a summary of significant accounting policies.In our opinion, based on our audits and the report of other auditors (please refer to Other Matter paragraph), the accompanying consolidated financial statements present fairly, in all material respects, the consolidated financial position of the Group as at December 31, 2020 and 2019, and its consolidated financial performance and its consolidated cash flows for the years then ended in accordance with the Regulations Governing the Preparation of Financial Reports by Securities Issuers and with the International Financial Reporting Standards (“IFRSs”), International Accounting Standards (“IASs”), Interpretations developed by the International Financial Reporting Interpretations Committee (“IFRIC”) or the former Standing Interpretations Committee (“SIC”) endorsed and issued into effect by the Financial Supervisory Commission of the Republic of China.
Basis for Opinion
We conducted our audit in accordance with the Regulations Governing Auditing and Certification of Financial Statements by Certified Public Accountants and the auditing standards generally accepted in the Republic of China. Our responsibilities under those standards are further described in the Auditors' Responsibilities for the Audit of the Consolidated Financial Statements section of our report. We are independent of the Group in accordance with the Certified Public Accountants Code of Professional Ethics in Republic of China (“the Code”), and we have fulfilled our other ethical responsibilities in accordance with the Code. Based on our audits and the reports of other auditors, we believe that the audit evidence we have obtained, is sufficient and appropriate to provide a basis of our opinion.
Key Audit Matters
Key audit matters are those matters that, in our professional judgment, were of most significance in our audit of the consolidated financial statements of the current period. These matters were addressed in the context of our audit of the consolidated financial statements as a whole, and in forming our opinion thereon, and we do not provide a separate opinion on these matters. We have determined the matters described below to be the key audit matters to be communicated in our report.1. Revenue recognition of construction contracts
Please refer to Note 4(r) for revenue from contracts with customers; Note 5 for recognition of revenue and measurement for the completed percentage of construction contracts; and Note 6(z) for construction contracts.How the matter was addressed in our audit: As the budgets of construction contracts are highly related to the subjectively judgments of the managements, inaccuracy estimations for construction budgets may lead to significant changes in profit or loss of the financial reports. Therefore, there is a significant risk involved in the revenue recognition of construction contracts.Our principal audit procedures included: selecting construction contracts that have significant impact on the presentation of the financial report; and for those construction budgets, assessing the managements’ budget preparation process, acquired relevant materials in preparing the assumptions within the current period (including construction contract modification, design modification, and other documents with owners), and confirming whether the preparation of construction budget corresponds with the Group’s internal authorization. In addition, selecting the valuation materials and checking their accuracy by recalculating the completed percentage of the construction cases, as well as executing the balance sheet cut-off test.
2. Inventory evaluationPlease refer to Note 4(h) for accounting policy about inventory evaluation, Note 5 for estimation of inventory evaluation and Note 6(g) for inventory.
87
How the matter was addressed in our audit: The Group’s inventories shall be stated at the lower of cost and net realizable value. At present, the real estate industry is affected by tax reformation and economic circumstances. There is a risk that the inventory cost may turn out to be higher than its net realization value. Our principal audit procedures included: For construction cases in progress and real estate for sale, which is in accordance to the contract price for presale and the selling price of actual registering, assessing the differences between their booked value and fair value, and any possibility of their significant impact on the financial report, comparing with the investment analysis provided by the management, and reassessing according to the actual situation, there is no impairment.
Other Matter
In the Group’s consolidated financial statements, we did not audit the financial statements of certain subsidiaries. Those statements audited by other auditors has been furnished to us, and our opinion, insofar as it relates to the amounts included for those subsidiaries, is based solely on the report of the other auditors. The financial statements of these subsidiaries reflect the total assets constituting 11.70% of the consolidated total assets at December 31, 2019, and the total revenues constituting 0.78% of the consolidated total revenues for the year ended December 31, 2019.In addition, in the Group’s consolidated financial statements, which include certain investee companies accounted for under the equity method, were audited by other auditors, and our opinion, insofar as it relates to the amounts included for those investee companies, is based solely on the report of the other auditors. As of December 31, 2019, using the equity method, Group’s investment in these investee companies constituted 0.95% of the Group’s total asset; the losses resulted from the Group’s investment in the associates and joint ventures represented 124.35% of the Group’s income before tax for the year ended December 31, 2019.Continental Holdings Corporation has prepared its parent-company-only financial statements for the years ended December 31, 2020 and 2019, and we have issued an unqualified opinion and an unqualified opinion with other matter thereon, respectively.
Responsibilities of Management and Those Charged with Governance for the Consolidated Financial Statements
Management is responsible for the preparation and fair presentation of the consolidated financial statements in accordance with Regulations Governing the Preparation of Financial Reports by Securities Issuers and IFRSs, IASs, IFRC, SIC endorsed and issued into effect by the FSC, and for such internal control as management determines is necessary to enable the preparation of consolidated financial statements that are free from material misstatement, whether due to fraud or error.In preparing the consolidated financial statements, management is responsible for assessing the Group’s ability to continue as a going concern, disclosing, as applicable, matters related to going concern and using the going concern basis of accounting unless management either intends to liquidate the Group or to cease operations, or has no realistic alternative but to do so.Those charged with governance (including the Audit Committee) are responsible for overseeing the Group’s financial reporting process.
Auditor’s Responsibilities for the Audit of the Consolidated Financial Statements
Our objectives are to obtain reasonable assurance about whether the consolidated financial statements as a whole are free from material misstatement, whether due to fraud or error, and to issue an auditor’s report that includes our opinion. Reasonable assurance is a high level of assurance, but is not a guarantee that an audit conducted in accordance with the auditing standards generally accepted in the Republic of China will always detect a material misstatement when it exists. Misstatements can arise from fraud or error and are considered material if, individually or in the aggregate, they could reasonably be expected to influence the economic decisions of users taken on the basis of these consolidated financial statements.As part of an audit in accordance with auditing standards generally accepted in the Republic of China, we exercise professional judgment and maintain professional skepticism throughout the audit. We also:1. Identify and assess the risks of material misstatement of the consolidated financial statements, whether due to fraud
or error, design and perform audit procedures responsive to those risks, and obtain audit evidence that is sufficient and appropriate to provide a basis for our opinion. The risk of not detecting a material misstatement resulting from fraud is higher than for one resulting from error, as fraud may involve collusion, forgery, intentional omissions, misrepresentations, or the override of internal control.
88
2. Obtain an understanding of internal control relevant to the audit in order to design audit procedures that are appropriate in the circumstances, but not for the purpose of expressing an opinion on the effectiveness of the Group’s internal control.
3. Evaluate the appropriateness of accounting policies used and the reasonableness of accounting estimates and related disclosures made by management.
4. Conclude on the appropriateness of management’s use of the going concern basis of accounting and, based on the audit evidence obtained, whether a material uncertainty exists related to events or conditions that may cast significant doubt on the Group’s ability to continue as a going concern. If we conclude that a material uncertainty exists, we are required to draw attention in our auditor’s report to the related disclosures in the consolidated financial statements or, if such disclosures are inadequate, to modify our opinion. Our conclusions are based on the audit evidence obtained up to the date of our auditor’s report. However, future events or conditions may cause the Group to cease to continue as a going concern.
5. Evaluate the overall presentation, structure and content of the consolidated financial statements, including the disclosures, and whether the consolidated financial statements represent the underlying transactions and events in a manner that achieves fair presentation.
6. Obtain sufficient and appropriate audit evidence regarding the financial information of the entities or business activities within the Group to express an opinion on the consolidated financial statements. We are responsible for the direction, supervision and performance of the group audit. We remain solely responsible for our audit opinion.
We communicate with those charged with governance regarding, among other matters, the planned scope and timing of the audit and significant audit findings, including any significant deficiencies in internal control that we identify during our audit.We also provide those charged with governance with a statement that we have complied with relevant ethical requirements regarding independence, and to communicate with them all relationships and other matters that may reasonably be thought to bear on our independence, and where applicable, related safeguards.From the matters communicated with those charged with governance, we determine those matters that were of most significance in the audit of the consolidated financial statements of the current period and are therefore the key audit matters. We describe these matters in our auditor’s report unless law or regulation precludes public disclosure about the matter or when, in extremely rare circumstances, we determine that a matter should not be communicated in our report because the adverse consequences of doing so would reasonably be expected to outweigh the public interest benefits of such communication.The engagement partners on the audit resulting in this independent auditors’ report are Chung-Che Chen and Ti-Nuan Chien.
KPMGTaipei, Taiwan (Republic of China)March 16, 2021Chung-Che Chen and Ti-Nuan Chien
89
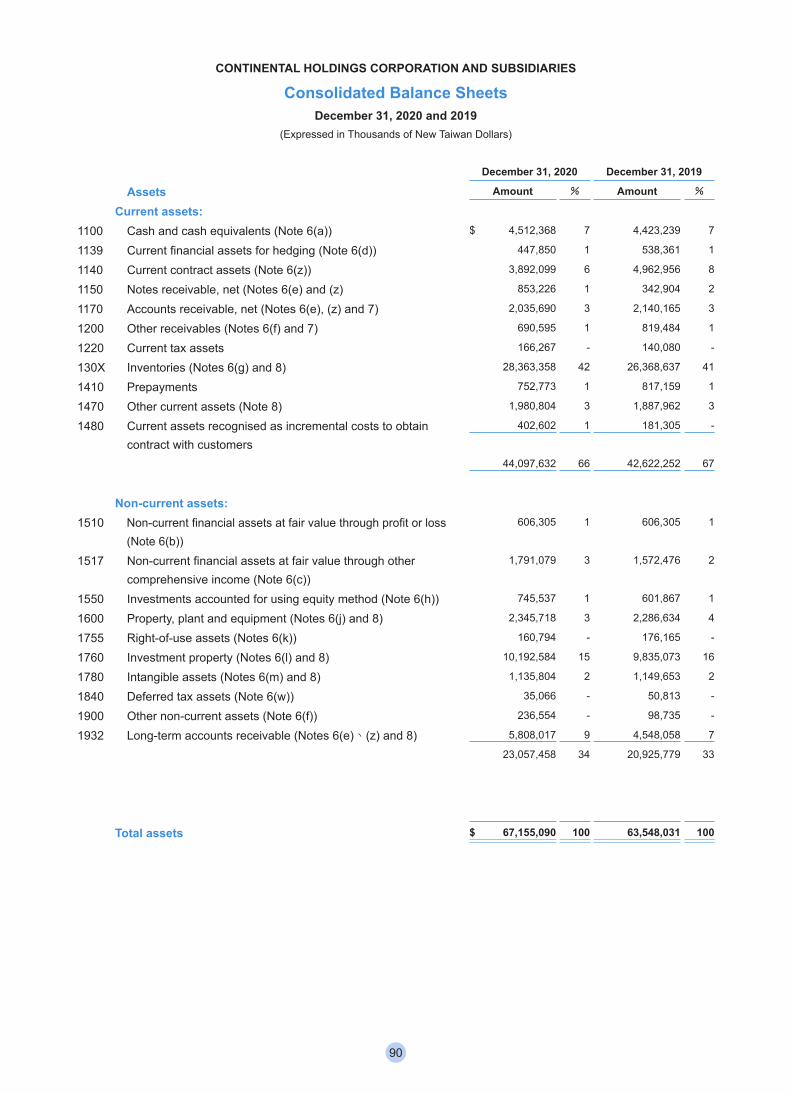
CONTINENTAL HOLDINGS CORPORATION AND SUBSIDIARIES
Consolidated Balance SheetsDecember 31, 2020 and 2019
(Expressed in Thousands of New Taiwan Dollars)
December 31, 2020 December 31, 2019
Assets Amount % Amount %
Current assets:1100 Cash and cash equivalents (Note 6(a)) $ 4,512,368 7 4,423,239 7
1139 Current financial assets for hedging (Note 6(d)) 447,850 1 538,361 1
1140 Current contract assets (Note 6(z)) 3,892,099 6 4,962,956 8
1150 Notes receivable, net (Notes 6(e) and (z) 853,226 1 342,904 2
1170 Accounts receivable, net (Notes 6(e), (z) and 7) 2,035,690 3 2,140,165 3
1200 Other receivables (Notes 6(f) and 7) 690,595 1 819,484 1
1220 Current tax assets 166,267 - 140,080 -
130X Inventories (Notes 6(g) and 8) 28,363,358 42 26,368,637 41
1410 Prepayments 752,773 1 817,159 1
1470 Other current assets (Note 8) 1,980,804 3 1,887,962 3
1480 Current assets recognised as incremental costs to obtain contract with customers
402,602 1 181,305 -
44,097,632 66 42,622,252 67
Non-current assets:1510 Non-current financial assets at fair value through profit or loss
(Note 6(b))606,305 1 606,305 1
1517 Non-current financial assets at fair value through other comprehensive income (Note 6(c))
1,791,079 3 1,572,476 2
1550 Investments accounted for using equity method (Note 6(h)) 745,537 1 601,867 1
1600 Property, plant and equipment (Notes 6(j) and 8) 2,345,718 3 2,286,634 4
1755 Right-of-use assets (Notes 6(k)) 160,794 - 176,165 -
1760 Investment property (Notes 6(l) and 8) 10,192,584 15 9,835,073 16
1780 Intangible assets (Notes 6(m) and 8) 1,135,804 2 1,149,653 2
1840 Deferred tax assets (Note 6(w)) 35,066 - 50,813 -
1900 Other non-current assets (Note 6(f)) 236,554 - 98,735 -
1932 Long-term accounts receivable (Notes 6(e)、(z) and 8) 5,808,017 9 4,548,058 7
23,057,458 34 20,925,779 33
Total assets $ 67,155,090 100 63,548,031 100
90
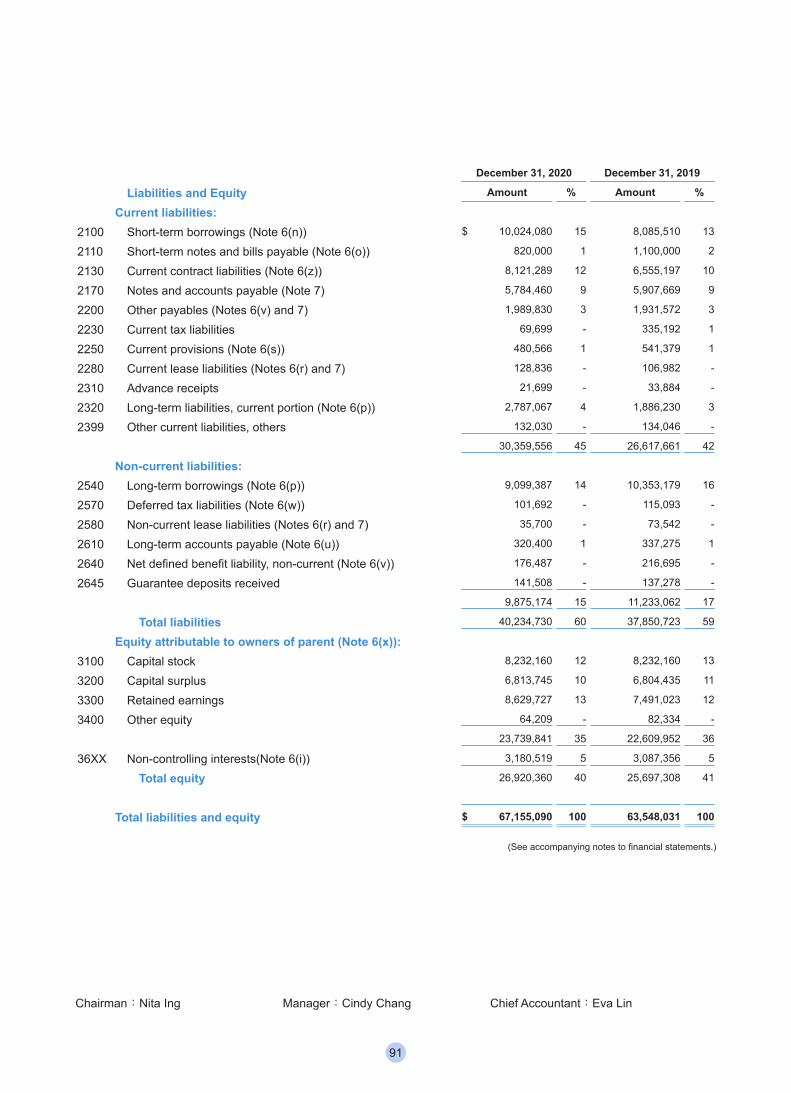
December 31, 2020 December 31, 2019
Liabilities and Equity Amount % Amount %
Current liabilities:2100 Short-term borrowings (Note 6(n)) $ 10,024,080 15 8,085,510 13
2110 Short-term notes and bills payable (Note 6(o)) 820,000 1 1,100,000 2
2130 Current contract liabilities (Note 6(z)) 8,121,289 12 6,555,197 10
2170 Notes and accounts payable (Note 7) 5,784,460 9 5,907,669 9
2200 Other payables (Notes 6(v) and 7) 1,989,830 3 1,931,572 3
2230 Current tax liabilities 69,699 - 335,192 1
2250 Current provisions (Note 6(s)) 480,566 1 541,379 1
2280 Current lease liabilities (Notes 6(r) and 7) 128,836 - 106,982 -
2310 Advance receipts 21,699 - 33,884 -
2320 Long-term liabilities, current portion (Note 6(p)) 2,787,067 4 1,886,230 3
2399 Other current liabilities, others 132,030 - 134,046 -
30,359,556 45 26,617,661 42
Non-current liabilities:2540 Long-term borrowings (Note 6(p)) 9,099,387 14 10,353,179 16
2570 Deferred tax liabilities (Note 6(w)) 101,692 - 115,093 -
2580 Non-current lease liabilities (Notes 6(r) and 7) 35,700 - 73,542 -
2610 Long-term accounts payable (Note 6(u)) 320,400 1 337,275 1
2640 Net defined benefit liability, non-current (Note 6(v)) 176,487 - 216,695 -
2645 Guarantee deposits received 141,508 - 137,278 -
9,875,174 15 11,233,062 17
Total liabilities 40,234,730 60 37,850,723 59
Equity attributable to owners of parent (Note 6(x)):3100 Capital stock 8,232,160 12 8,232,160 13
3200 Capital surplus 6,813,745 10 6,804,435 11
3300 Retained earnings 8,629,727 13 7,491,023 12
3400 Other equity 64,209 - 82,334 -
23,739,841 35 22,609,952 36
36XX Non-controlling interests(Note 6(i)) 3,180,519 5 3,087,356 5
Total equity 26,920,360 40 25,697,308 41
Total liabilities and equity $ 67,155,090 100 63,548,031 100
(See accompanying notes to financial statements.)
Chairman:Nita Ing Manager:Cindy Chang Chief Accountant:Eva Lin
91
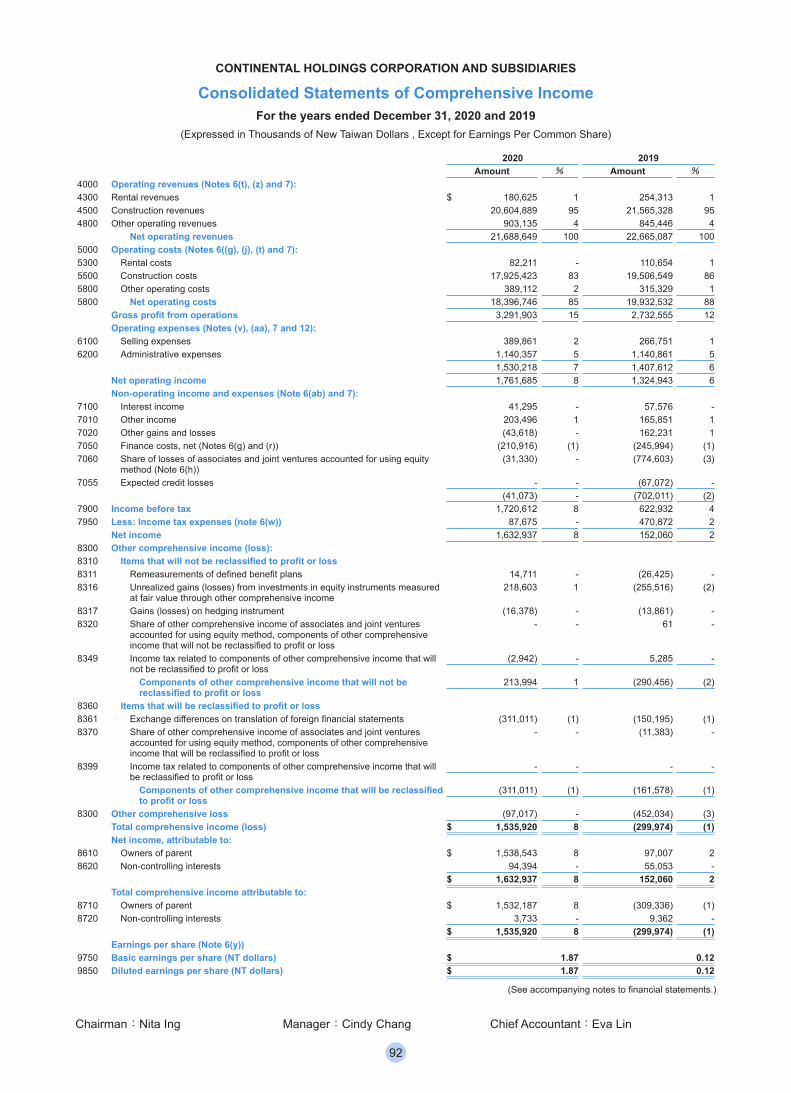
CONTINENTAL HOLDINGS CORPORATION AND SUBSIDIARIES
Consolidated Statements of Comprehensive IncomeFor the years ended December 31, 2020 and 2019
(Expressed in Thousands of New Taiwan Dollars , Except for Earnings Per Common Share)
2020 2019Amount % Amount %
4000 Operating revenues (Notes 6(t), (z) and 7):4300 Rental revenues $ 180,625 1 254,313 14500 Construction revenues 20,604,889 95 21,565,328 954800 Other operating revenues 903,135 4 845,446 4
Net operating revenues 21,688,649 100 22,665,087 1005000 Operating costs (Notes 6((g), (j), (t) and 7):5300 Rental costs 82,211 - 110,654 15500 Construction costs 17,925,423 83 19,506,549 865800 Other operating costs 389,112 2 315,329 15800 Net operating costs 18,396,746 85 19,932,532 88
Gross profit from operations 3,291,903 15 2,732,555 12Operating expenses (Notes (v), (aa), 7 and 12):
6100 Selling expenses 389,861 2 266,751 16200 Administrative expenses 1,140,357 5 1,140,861 5
1,530,218 7 1,407,612 6Net operating income 1,761,685 8 1,324,943 6Non-operating income and expenses (Note 6(ab) and 7):
7100 Interest income 41,295 - 57,576 -7010 Other income 203,496 1 165,851 17020 Other gains and losses (43,618) - 162,231 17050 Finance costs, net (Notes 6(g) and (r)) (210,916) (1) (245,994) (1)7060 Share of losses of associates and joint ventures accounted for using equity
method (Note 6(h))(31,330) - (774,603) (3)
7055 Expected credit losses - - (67,072) -(41,073) - (702,011) (2)
7900 Income before tax 1,720,612 8 622,932 47950 Less: Income tax expenses (note 6(w)) 87,675 - 470,872 2
Net income 1,632,937 8 152,060 28300 Other comprehensive income (loss): 8310 Items that will not be reclassified to profit or loss8311 Remeasurements of defined benefit plans 14,711 - (26,425) -8316 Unrealized gains (losses) from investments in equity instruments measured
at fair value through other comprehensive income218,603 1 (255,516) (2)
8317 Gains (losses) on hedging instrument (16,378) - (13,861) -8320 Share of other comprehensive income of associates and joint ventures
accounted for using equity method, components of other comprehensive income that will not be reclassified to profit or loss
- - 61 -
8349 Income tax related to components of other comprehensive income that will not be reclassified to profit or loss
(2,942) - 5,285 -
Components of other comprehensive income that will not be reclassified to profit or loss
213,994 1 (290,456) (2)
8360 Items that will be reclassified to profit or loss8361 Exchange differences on translation of foreign financial statements (311,011) (1) (150,195) (1)8370 Share of other comprehensive income of associates and joint ventures
accounted for using equity method, components of other comprehensive income that will be reclassified to profit or loss
- - (11,383) -
8399 Income tax related to components of other comprehensive income that will be reclassified to profit or loss
- - - -
Components of other comprehensive income that will be reclassified to profit or loss
(311,011) (1) (161,578) (1)
8300 Other comprehensive loss (97,017) - (452,034) (3)Total comprehensive income (loss) $ 1,535,920 8 (299,974) (1)Net income, attributable to:
8610 Owners of parent $ 1,538,543 8 97,007 28620 Non-controlling interests 94,394 - 55,053 -
$ 1,632,937 8 152,060 2Total comprehensive income attributable to:
8710 Owners of parent $ 1,532,187 8 (309,336) (1)8720 Non-controlling interests 3,733 - 9,362 -
$ 1,535,920 8 (299,974) (1)Earnings per share (Note 6(y))
9750 Basic earnings per share (NT dollars) $ 1.87 0.129850 Diluted earnings per share (NT dollars) $ 1.87 0.12
(See accompanying notes to financial statements.)
Chairman:Nita Ing Manager:Cindy Chang Chief Accountant:Eva Lin
92
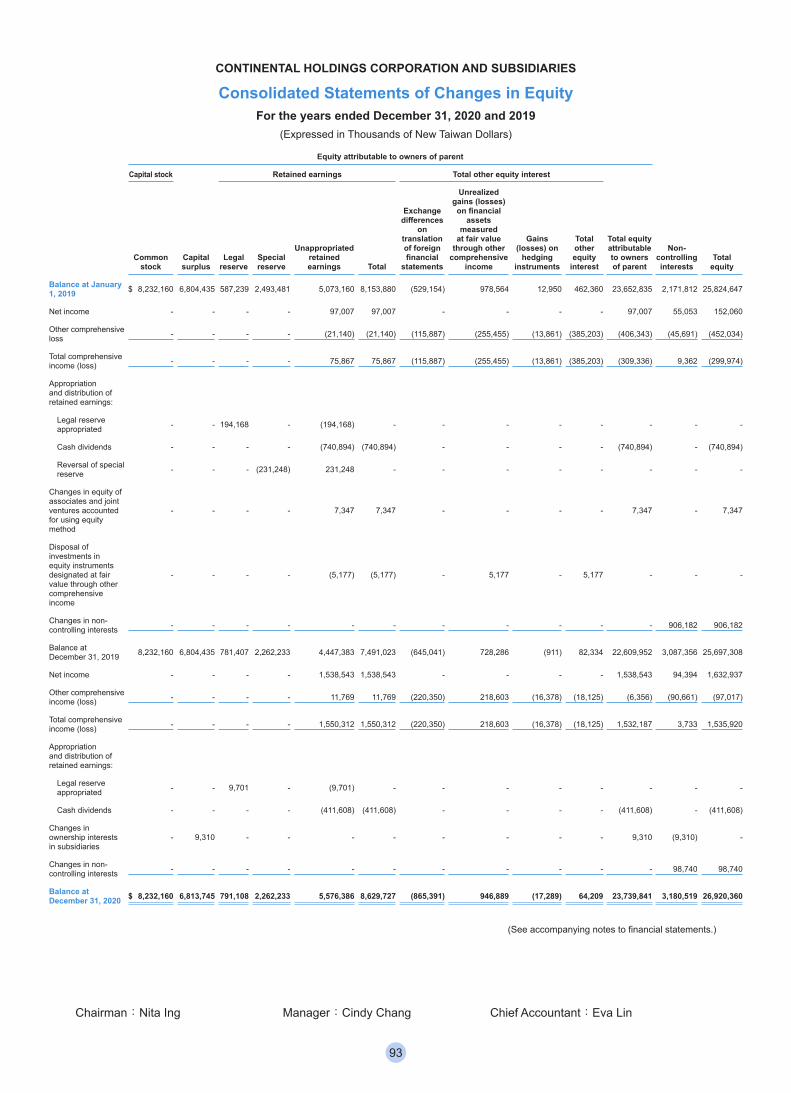
CONTINENTAL HOLDINGS CORPORATION AND SUBSIDIARIES
Consolidated Statements of Changes in EquityFor the years ended December 31, 2020 and 2019
(Expressed in Thousands of New Taiwan Dollars)
Equity attributable to owners of parent
Capital stock Retained earnings Total other equity interest
Common stock
Capital surplus
Legal reserve
Special reserve
Unappropriated retained earnings Total
Exchange differences
on translation of foreign financial
statements
Unrealized gains (losses)
on financial assets
measured at fair value
through other comprehensive
income
Gains (losses) on
hedging instruments
Total other equity
interest
Total equity attributable to owners of parent
Non-controlling interests
Total equity
Balance at January 1, 2019 $ 8,232,160 6,804,435 587,239 2,493,481 5,073,160 8,153,880 (529,154) 978,564 12,950 462,360 23,652,835 2,171,812 25,824,647
Net income - - - - 97,007 97,007 - - - - 97,007 55,053 152,060
Other comprehensive loss - - - - (21,140) (21,140) (115,887) (255,455) (13,861) (385,203) (406,343) (45,691) (452,034)
Total comprehensive income (loss) - - - - 75,867 75,867 (115,887) (255,455) (13,861) (385,203) (309,336) 9,362 (299,974)
Appropriation and distribution of retained earnings:
Legal reserve appropriated - - 194,168 - (194,168) - - - - - - - -
Cash dividends - - - - (740,894) (740,894) - - - - (740,894) - (740,894)
Reversal of special reserve - - - (231,248) 231,248 - - - - - - - -
Changes in equity of associates and joint ventures accounted for using equity method
- - - - 7,347 7,347 - - - - 7,347 - 7,347
Disposal of investments in equity instruments designated at fair value through other comprehensive income
- - - - (5,177) (5,177) - 5,177 - 5,177 - - -
Changes in non-controlling interests - - - - - - - - - - - 906,182 906,182
Balance at December 31, 2019 8,232,160 6,804,435 781,407 2,262,233 4,447,383 7,491,023 (645,041) 728,286 (911) 82,334 22,609,952 3,087,356 25,697,308
Net income - - - - 1,538,543 1,538,543 - - - - 1,538,543 94,394 1,632,937
Other comprehensive income (loss) - - - - 11,769 11,769 (220,350) 218,603 (16,378) (18,125) (6,356) (90,661) (97,017)
Total comprehensive income (loss) - - - - 1,550,312 1,550,312 (220,350) 218,603 (16,378) (18,125) 1,532,187 3,733 1,535,920
Appropriation and distribution of retained earnings:
Legal reserve appropriated - - 9,701 - (9,701) - - - - - - - -
Cash dividends - - - - (411,608) (411,608) - - - - (411,608) - (411,608)
Changes in ownership interests in subsidiaries
- 9,310 - - - - - - - - 9,310 (9,310) -
Changes in non-controlling interests - - - - - - - - - - - 98,740 98,740
Balance at December 31, 2020 $ 8,232,160 6,813,745 791,108 2,262,233 5,576,386 8,629,727 (865,391) 946,889 (17,289) 64,209 23,739,841 3,180,519 26,920,360
(See accompanying notes to financial statements.)
Chairman:Nita Ing Manager:Cindy Chang Chief Accountant:Eva Lin
93
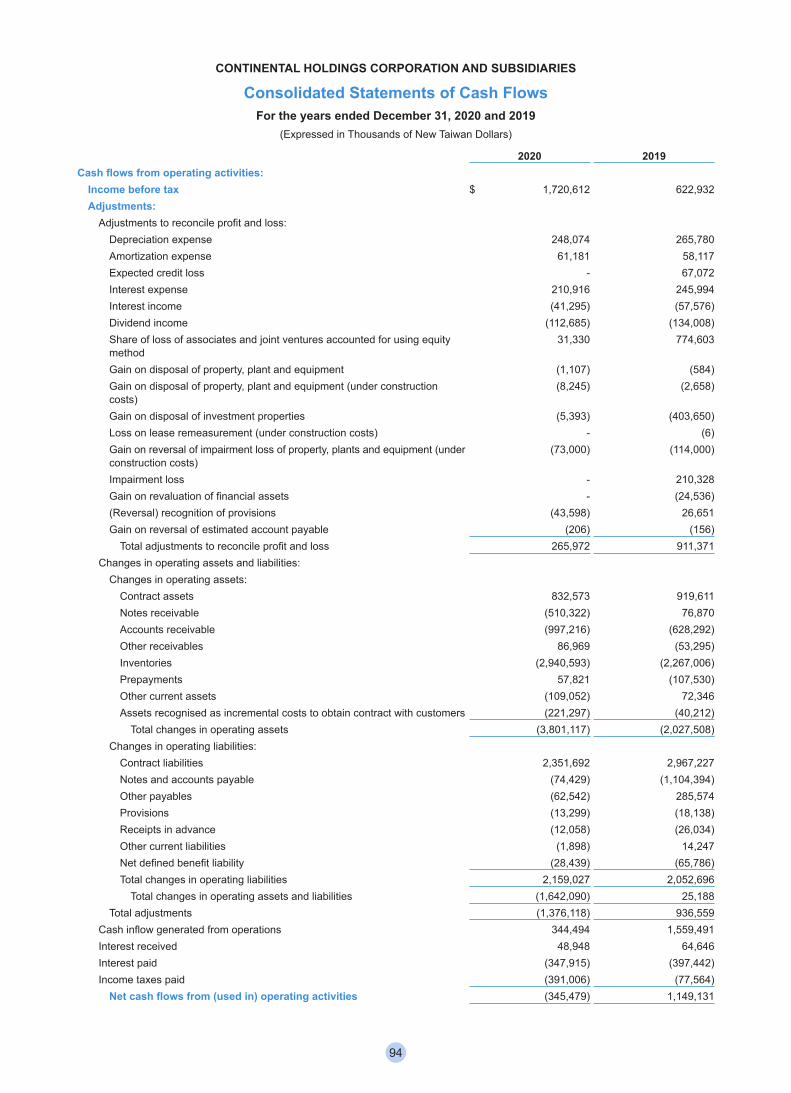
CONTINENTAL HOLDINGS CORPORATION AND SUBSIDIARIES
Consolidated Statements of Cash FlowsFor the years ended December 31, 2020 and 2019
(Expressed in Thousands of New Taiwan Dollars)
2020 2019Cash flows from operating activities: Income before tax $ 1,720,612 622,932 Adjustments: Adjustments to reconcile profit and loss: Depreciation expense 248,074 265,780 Amortization expense 61,181 58,117 Expected credit loss - 67,072 Interest expense 210,916 245,994 Interest income (41,295) (57,576) Dividend income (112,685) (134,008) Share of loss of associates and joint ventures accounted for using equity
method31,330 774,603
Gain on disposal of property, plant and equipment (1,107) (584) Gain on disposal of property, plant and equipment (under construction
costs)(8,245) (2,658)
Gain on disposal of investment properties (5,393) (403,650) Loss on lease remeasurement (under construction costs) - (6) Gain on reversal of impairment loss of property, plants and equipment (under
construction costs)(73,000) (114,000)
Impairment loss - 210,328 Gain on revaluation of financial assets - (24,536) (Reversal) recognition of provisions (43,598) 26,651 Gain on reversal of estimated account payable (206) (156) Total adjustments to reconcile profit and loss 265,972 911,371 Changes in operating assets and liabilities: Changes in operating assets: Contract assets 832,573 919,611 Notes receivable (510,322) 76,870 Accounts receivable (997,216) (628,292) Other receivables 86,969 (53,295) Inventories (2,940,593) (2,267,006) Prepayments 57,821 (107,530) Other current assets (109,052) 72,346 Assets recognised as incremental costs to obtain contract with customers (221,297) (40,212) Total changes in operating assets (3,801,117) (2,027,508) Changes in operating liabilities: Contract liabilities 2,351,692 2,967,227 Notes and accounts payable (74,429) (1,104,394) Other payables (62,542) 285,574 Provisions (13,299) (18,138) Receipts in advance (12,058) (26,034) Other current liabilities (1,898) 14,247 Net defined benefit liability (28,439) (65,786) Total changes in operating liabilities 2,159,027 2,052,696 Total changes in operating assets and liabilities (1,642,090) 25,188 Total adjustments (1,376,118) 936,559 Cash inflow generated from operations 344,494 1,559,491 Interest received 48,948 64,646 Interest paid (347,915) (397,442) Income taxes paid (391,006) (77,564) Net cash flows from (used in) operating activities (345,479) 1,149,131
94
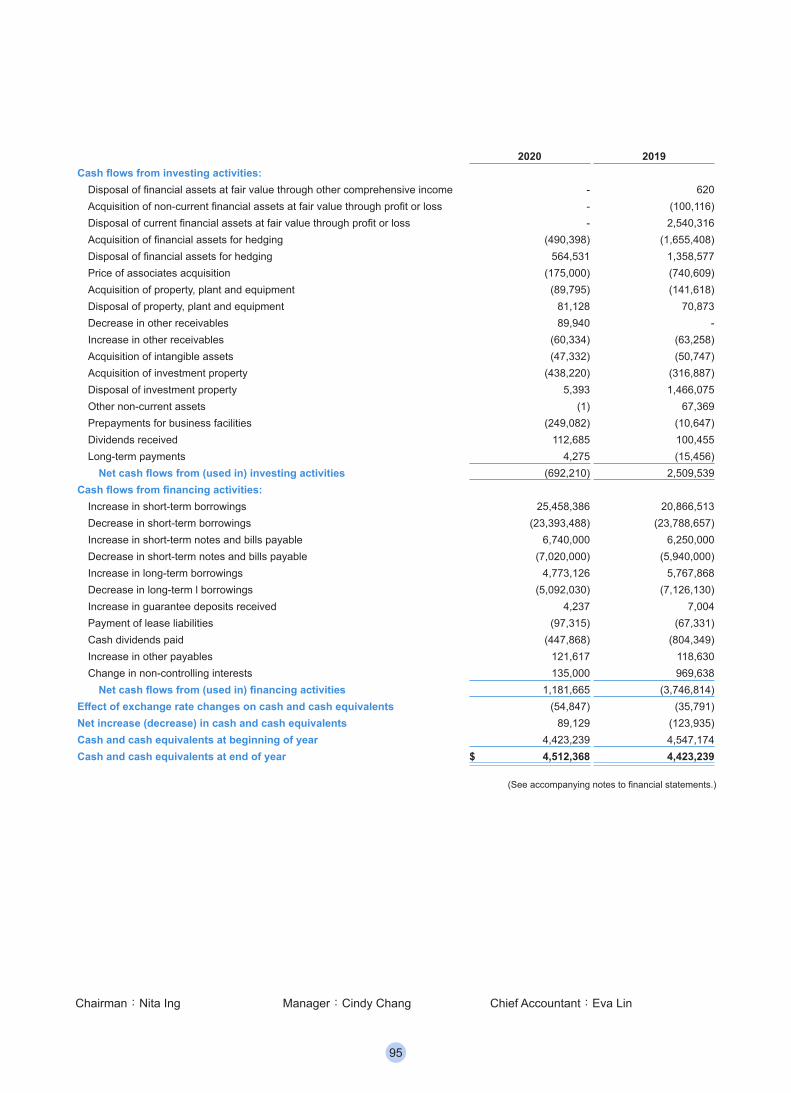
2020 2019Cash flows from investing activities: Disposal of financial assets at fair value through other comprehensive income - 620 Acquisition of non-current financial assets at fair value through profit or loss - (100,116) Disposal of current financial assets at fair value through profit or loss - 2,540,316 Acquisition of financial assets for hedging (490,398) (1,655,408) Disposal of financial assets for hedging 564,531 1,358,577 Price of associates acquisition (175,000) (740,609) Acquisition of property, plant and equipment (89,795) (141,618) Disposal of property, plant and equipment 81,128 70,873 Decrease in other receivables 89,940 - Increase in other receivables (60,334) (63,258) Acquisition of intangible assets (47,332) (50,747) Acquisition of investment property (438,220) (316,887) Disposal of investment property 5,393 1,466,075 Other non-current assets (1) 67,369 Prepayments for business facilities (249,082) (10,647) Dividends received 112,685 100,455 Long-term payments 4,275 (15,456) Net cash flows from (used in) investing activities (692,210) 2,509,539Cash flows from financing activities: Increase in short-term borrowings 25,458,386 20,866,513 Decrease in short-term borrowings (23,393,488) (23,788,657) Increase in short-term notes and bills payable 6,740,000 6,250,000 Decrease in short-term notes and bills payable (7,020,000) (5,940,000) Increase in long-term borrowings 4,773,126 5,767,868 Decrease in long-term l borrowings (5,092,030) (7,126,130) Increase in guarantee deposits received 4,237 7,004 Payment of lease liabilities (97,315) (67,331) Cash dividends paid (447,868) (804,349) Increase in other payables 121,617 118,630 Change in non-controlling interests 135,000 969,638 Net cash flows from (used in) financing activities 1,181,665 (3,746,814)Effect of exchange rate changes on cash and cash equivalents (54,847) (35,791)Net increase (decrease) in cash and cash equivalents 89,129 (123,935)Cash and cash equivalents at beginning of year 4,423,239 4,547,174Cash and cash equivalents at end of year $ 4,512,368 4,423,239
(See accompanying notes to financial statements.)
Chairman:Nita Ing Manager:Cindy Chang Chief Accountant:Eva Lin
95
CONTINENTAL HOLDINGS CORPORATION AND SUBSIDIARIES
Notes to the Consolidated Financial StatementsFor the years ended December 31, 2020 and 2019
(Expressed in Thousands of New Taiwan Dollars, Unless Otherwise Specified)
(1) Company historyCONTINENTAL HOLDINGS CORPORATION (“CHC” or “the Company”) was established through shares exchange with Continental Engineering Corp. (“CEC”) on April 8, 2010 and CEC became 100%-owned by the Company. On the same day, the Company was approved to be a listed Company by the FSC. The consolidated financial statements as of December 31, 2020 consist of the Company and all of its subsidiaries (“the Group”), and the interests in a jointly controlled entities and associates. Please refer to Note 14 for the Group’s main businesses.
(2) Approval date and procedures of the consolidated financial statements: The consolidated financial statements were approved and authorized for issue by the Board of Directors on March 16, 2021.
(3) New standards, amendments and interpretations adopted:(a) The impact of the International Financial Reporting Standards (“IFRSs”) endorsed by the Financial Supervisory Commission,
R.O.C. (“FSC”) which have already been adopted.The Group has initially adopted the following new amendments, which do not have a significant impact on its consolidated financial statements, from January 1, 2020:‧ Amendments to IFRS 3 “Definition of a Business”‧ Amendments to IFRS 9, IAS39 and IFRS7 “Interest Rate Benchmark Reform”‧ Amendments to IAS 1 and IAS 8 “Definition of Material”‧ Amendments to IFRS 16 “COVID-19-Related Rent Concessions”
(b) The impact of IFRS issued by the FSC but not yet effectiveThe Group assesses that the adoption of the following new amendments, effective for annual period beginning on January 1, 2021, would not have a significant impact on its consolidated financial statements:‧ Amendments to IFRS 4 “Extension of the Temporary Exemption from Applying IFRS 9”‧ Amendments to IFRS 9, IAS39, IFRS7, IFRS 4 and IFRS 16 “Interest Rate Benchmark Reform- Phase 2”
(c) The impact of IFRS issued by IASB but not yet endorsed by the FSCThe Group does not expect the following new and amended standards, which have yet to be endorsed by the FSC, to have a significant impact on its consolidated financial statements:‧ Amendments to IFRS 10 and IAS 28 “Sale or Contribution of Assets Between an Investor and Its Associate or Joint
Venture”‧ IFRS 17 “ Insurance Contracts” and amendments to IFRS 17 “ Insurance Contracts”‧ Amendments to IAS 1 “Classification of Liabilities as Current or Non-current”‧ Amendments to IAS 16 “Property, Plant and Equipment- Proceeds before Intended Use”‧ Amendments to IAS 37 “Onerous Contracts- Cost of Fulfilling a Contract”‧ Annual Improvements to IFRS Standards 2018-2020‧ Amendments to IFRS 3 “Reference to the Conceptual Framework”‧ Amendments to IAS 1 “Disclosure of Accounting Policies”‧ Amendments to IAS 8 “Definition of Accounting Estimates”
(4) Summary of significant accounting policies:The significant accounting policies presented in the consolidated financial statements are summarized follows. The following accounting policies were applied consistently throughout the periods presented in the consolidated financial statements.(a) Statement of compliance
These consolidated financial statements have been prepared in accordance with the Regulations Governing the Preparation of Financial Reports by Securities Issuers (hereinafter referred to as “the Regulations”) and the IFRSs, IASs, IFRIC Interpretations, and the SIC Interpretations endorsed and issued into effect by the FSC.
(b) Basis of preparation(i) Basis of measurement
Except for the following significant accounts, the consolidated financial statements have been prepared on a historical cost basis:
96
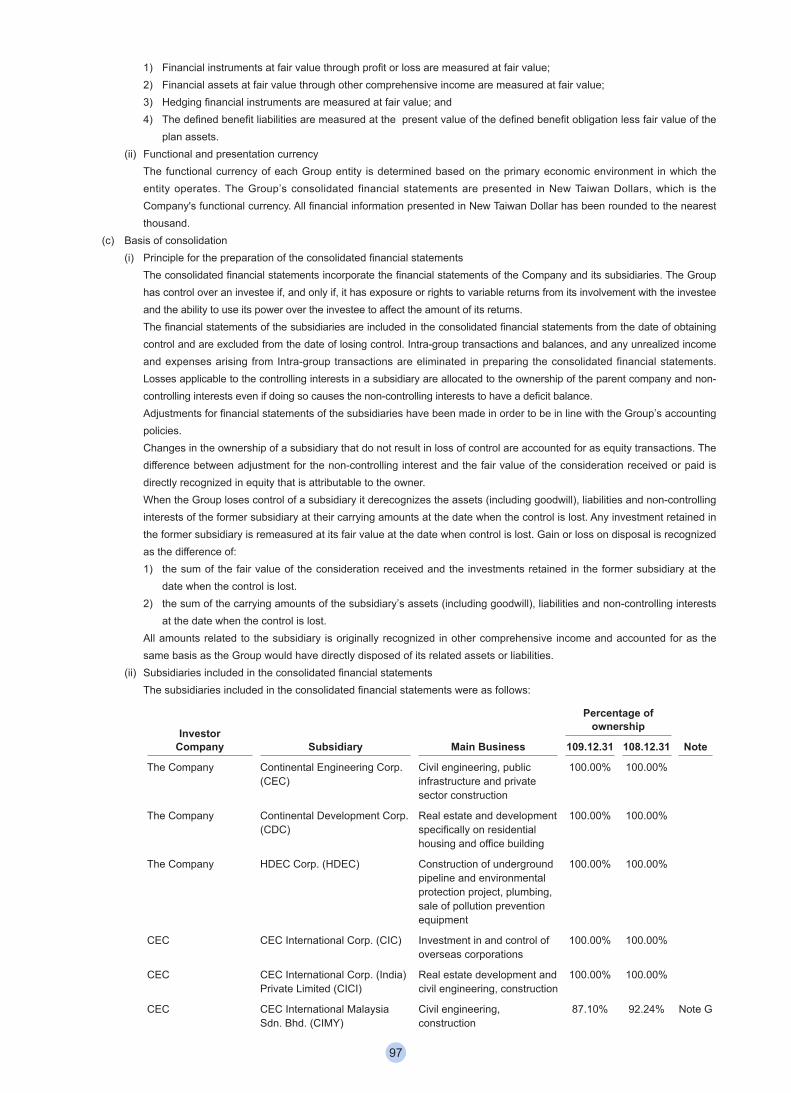
1) Financial instruments at fair value through profit or loss are measured at fair value;2) Financial assets at fair value through other comprehensive income are measured at fair value;3) Hedging financial instruments are measured at fair value; and4) The defined benefit liabilities are measured at the present value of the defined benefit obligation less fair value of the
plan assets.(ii) Functional and presentation currency
The functional currency of each Group entity is determined based on the primary economic environment in which the entity operates. The Group’s consolidated financial statements are presented in New Taiwan Dollars, which is the Company's functional currency. All financial information presented in New Taiwan Dollar has been rounded to the nearest thousand.
(c) Basis of consolidation (i) Principle for the preparation of the consolidated financial statements
The consolidated financial statements incorporate the financial statements of the Company and its subsidiaries. The Group has control over an investee if, and only if, it has exposure or rights to variable returns from its involvement with the investee and the ability to use its power over the investee to affect the amount of its returns.The financial statements of the subsidiaries are included in the consolidated financial statements from the date of obtaining control and are excluded from the date of losing control. Intra-group transactions and balances, and any unrealized income and expenses arising from Intra-group transactions are eliminated in preparing the consolidated financial statements. Losses applicable to the controlling interests in a subsidiary are allocated to the ownership of the parent company and non-controlling interests even if doing so causes the non-controlling interests to have a deficit balance.Adjustments for financial statements of the subsidiaries have been made in order to be in line with the Group’s accounting policies.Changes in the ownership of a subsidiary that do not result in loss of control are accounted for as equity transactions. The difference between adjustment for the non-controlling interest and the fair value of the consideration received or paid is directly recognized in equity that is attributable to the owner.When the Group loses control of a subsidiary it derecognizes the assets (including goodwill), liabilities and non-controlling interests of the former subsidiary at their carrying amounts at the date when the control is lost. Any investment retained in the former subsidiary is remeasured at its fair value at the date when control is lost. Gain or loss on disposal is recognized as the difference of:1) the sum of the fair value of the consideration received and the investments retained in the former subsidiary at the
date when the control is lost.2) the sum of the carrying amounts of the subsidiary’s assets (including goodwill), liabilities and non-controlling interests
at the date when the control is lost.All amounts related to the subsidiary is originally recognized in other comprehensive income and accounted for as the same basis as the Group would have directly disposed of its related assets or liabilities.
(ii) Subsidiaries included in the consolidated financial statementsThe subsidiaries included in the consolidated financial statements were as follows:
Investor Company Subsidiary Main Business
Percentage of ownership
Note109.12.31 108.12.31
The Company Continental Engineering Corp. (CEC)
Civil engineering, public infrastructure and private sector construction
100.00% 100.00%
The Company Continental Development Corp. (CDC)
Real estate and development specifically on residential housing and office building
100.00% 100.00%
The Company HDEC Corp. (HDEC) Construction of underground pipeline and environmental protection project, plumbing, sale of pollution prevention equipment
100.00% 100.00%
CEC CEC International Corp. (CIC) Investment in and control of overseas corporations
100.00% 100.00%
CEC CEC International Corp. (India) Private Limited (CICI)
Real estate development and civil engineering, construction
100.00% 100.00%
CEC CEC International Malaysia Sdn. Bhd. (CIMY)
Civil engineering, construction
87.10% 92.24% Note G
97
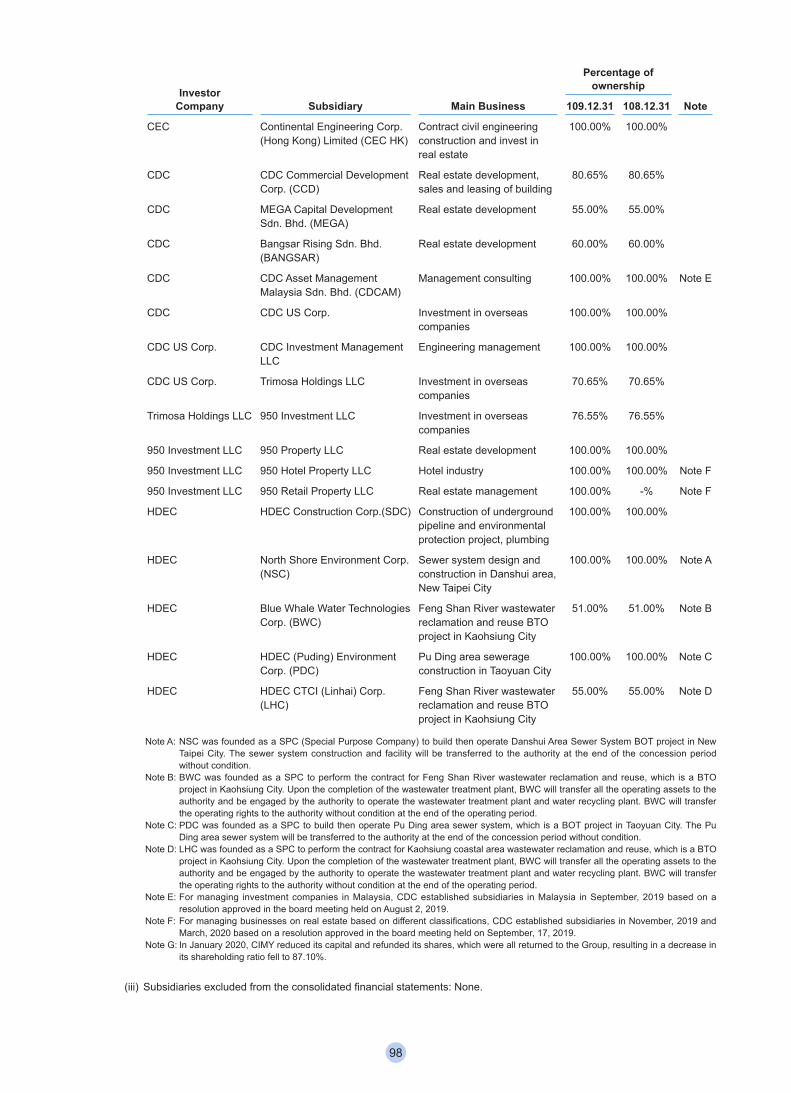
Investor Company Subsidiary Main Business
Percentage of ownership
Note109.12.31 108.12.31
CEC Continental Engineering Corp.(Hong Kong) Limited (CEC HK)
Contract civil engineering construction and invest in real estate
100.00% 100.00%
CDC CDC Commercial Development Corp. (CCD)
Real estate development, sales and leasing of building
80.65% 80.65%
CDC MEGA Capital Development Sdn. Bhd. (MEGA)
Real estate development 55.00% 55.00%
CDC Bangsar Rising Sdn. Bhd. (BANGSAR)
Real estate development 60.00% 60.00%
CDC CDC Asset Management Malaysia Sdn. Bhd. (CDCAM)
Management consulting 100.00% 100.00% Note E
CDC CDC US Corp. Investment in overseas companies
100.00% 100.00%
CDC US Corp. CDC Investment Management LLC
Engineering management 100.00% 100.00%
CDC US Corp. Trimosa Holdings LLC Investment in overseas companies
70.65% 70.65%
Trimosa Holdings LLC 950 Investment LLC Investment in overseas companies
76.55% 76.55%
950 Investment LLC 950 Property LLC Real estate development 100.00% 100.00%
950 Investment LLC 950 Hotel Property LLC Hotel industry 100.00% 100.00% Note F
950 Investment LLC 950 Retail Property LLC Real estate management 100.00% -% Note F
HDEC HDEC Construction Corp.(SDC) Construction of underground pipeline and environmental protection project, plumbing
100.00% 100.00%
HDEC North Shore Environment Corp.(NSC)
Sewer system design and construction in Danshui area, New Taipei City
100.00% 100.00% Note A
HDEC Blue Whale Water Technologies Corp. (BWC)
Feng Shan River wastewater reclamation and reuse BTO project in Kaohsiung City
51.00% 51.00% Note B
HDEC HDEC (Puding) Environment Corp. (PDC)
Pu Ding area sewerage construction in Taoyuan City
100.00% 100.00% Note C
HDEC HDEC CTCI (Linhai) Corp. (LHC)
Feng Shan River wastewater reclamation and reuse BTO project in Kaohsiung City
55.00% 55.00% Note D
Note A: NSC was founded as a SPC (Special Purpose Company) to build then operate Danshui Area Sewer System BOT project in New Taipei City. The sewer system construction and facility will be transferred to the authority at the end of the concession period without condition.
Note B: BWC was founded as a SPC to perform the contract for Feng Shan River wastewater reclamation and reuse, which is a BTO project in Kaohsiung City. Upon the completion of the wastewater treatment plant, BWC will transfer all the operating assets to the authority and be engaged by the authority to operate the wastewater treatment plant and water recycling plant. BWC will transfer the operating rights to the authority without condition at the end of the operating period.
Note C: PDC was founded as a SPC to build then operate Pu Ding area sewer system, which is a BOT project in Taoyuan City. The Pu Ding area sewer system will be transferred to the authority at the end of the concession period without condition.
Note D: LHC was founded as a SPC to perform the contract for Kaohsiung coastal area wastewater reclamation and reuse, which is a BTO project in Kaohsiung City. Upon the completion of the wastewater treatment plant, BWC will transfer all the operating assets to the authority and be engaged by the authority to operate the wastewater treatment plant and water recycling plant. BWC will transfer the operating rights to the authority without condition at the end of the operating period.
Note E: For managing investment companies in Malaysia, CDC established subsidiaries in Malaysia in September, 2019 based on a resolution approved in the board meeting held on August 2, 2019.
Note F: For managing businesses on real estate based on different classifications, CDC established subsidiaries in November, 2019 and March, 2020 based on a resolution approved in the board meeting held on September, 17, 2019.
Note G: In January 2020, CIMY reduced its capital and refunded its shares, which were all returned to the Group, resulting in a decrease in its shareholding ratio fell to 87.10%.
(iii) Subsidiaries excluded from the consolidated financial statements: None.
98
(d) Foreign currencies(i) Foreign currency transactions
Foreign currency transactions are recorded at the spot exchange rate on the date of the transaction. At the end of each subsequent reporting period (the reporting date), monetary items denominated in foreign currencies are translated into the functional currencies using the exchange rate at that date. Non-monetary items denominated in foreign currencies that are measured based on historical cost are translated using the exchange rate at the date of the transaction.Exchange differences are generally recognized in profit or loss, except for those differences relating to the following, which are recognized in other comprehensive income:1) an investment in equity securities designated as at fair value through other comprehensive income;2) a financial liability designated as a hedge of the net investment in a foreign operation to the extent that the hedge is
effective; or3) qualifying cash flow hedges to the extent that the hedges are effective.
(ii) Foreign operationsThe assets and liabilities of foreign operations, including goodwill and fair value adjustments arising on acquisition, are translated to presentation currency at exchange rates at the reporting date. The income and expenses of foreign operations are translated to presentation currency at the average rate. Exchange differences are recognized in other comprehensive income.When the Group disposes its foreign operation, resulting in losing control, joint control, or significant influence, the cumulative amounts in the translation reserve related to that foreign operation is reclassified to profit or loss. When the Group disposes of any part of its interest in a subsidiary that includes a foreign operation while retaining control, the relevant proportion of the cumulative amount is reattributed to non-controlling interest. When the Group disposes of only part of investment in an associate or joint venture that includes a foreign operation while retaining significant or joint control, the relevant proportion of the cumulative amount is reclassified to profit or loss.When the settlement of a monetary item receivable from or payable to a foreign operation is neither planed nor likely settled in the foreseeable future, foreign currency gains and losses arising from such items are considered to form part of a net investment in the foreign operation and are recognized in other comprehensive income.
(e) Classification of current and non-current assets and liabilities An asset is classified as current under one of the following criteria, and all other assets are classified as non-current.(i) It expects to realize the asset, or intends to sell or consume it, in its normal operating cycle;(ii) It helds the asset primarily for the purpose of trading;(iii) It expects to be realize the asset within twelve months after the reporting period; or(iv) The asset is cash or cash equivalent unless the asset is restricted from being exchanged or used to settle a liability for at
least twelve months after the reporting period.A liability is classified as current under one of the following criteria, and all other liabilities are classified as non-current.(i) It expects to settle the liability in its normal operating cycle;(ii) It helds the liability primarily for the purpose of trading;(iii) The liability is due to settled within twelve months after the reporting period; or (iv) The Group does not have an unconditional right to defer settlement of the liability for at least twelve months after the
reporting period. Terms of a liability that could, at the option of the counterparty, result in its settlement by the issue of equity instruments do not affect its classification.
The Group’s primary businesses are civil & building construction, real estate development, and environmental project development. The normal operating cycle of the Group is three to five years at least. The balance sheet accounts related to construction business are classified either as current or non-current based on the Group’s operating cycle.
(f) Cash and cash equivalents Cash comprises cash on hand, and demand deposits. Cash equivalents are short-term, highly liquid investments that are readily convertible to known amounts of cash and are subject to an insignificant risk of changes in value. Time deposits which meet the above definition and are held for the purpose of meeting short-term cash commitments rather than for investment or other purposes that should be recognized as cash equivalents.
(g) Financial instruments Accounts receivable are initially recognized when they are originated. All other financial assets and financial liabilities are initially recognized when the Group becomes a party to the contractual provisions of the instrument. An accounts receivable without a significant financing component is initially measured at the transaction price.(i) Financial assets
All regular way purchases or sales of financial assets are recognized and derecognized on a trade date basis.
99
On initial recognition, a financial asset is classified as measured at: amortized cost; Fair value through other comprehensive income (FVOCI) – equity investment; or fair value through profit or loss (FVTPL). Financial assets are not reclassified subsequent to their initial recognition unless the Group changes its business model for managing financial assets, in which case all affected financial assets are reclassified on the first day of the first reporting period following the change in the business model. 1) Financial assets measured at amortized cost
A financial asset is measured at amortized cost if it meets both of the following conditions and is not designated as at FVTPL:‧ it is held within a business model whose objective is to hold assets to collect contractual cash flows; and‧ its contractual terms give rise on specified dates to cash flows that are solely payments of principal and interest on
the principal amount outstanding.These assets are subsequently measured at amortized cost, which is the amount at which the financial asset is measured at initial recognition, plus/minus, the cumulative amortization using the effective interest method, adjusted for any loss allowance. Interest income, foreign exchange gains and losses, as well as impairment, are recognized in profit or loss. Any gain or loss on derecognition is recognized in profit or loss.
2) Fair value through other comprehensive income (FVOCI )On initial recognition of an equity investment that is not held for trading, the Group may irrevocably elect to present subsequent changes in the investment’s fair value in other comprehensive income. This election is made on an instrument-by-instrument basis.Equity investments at FVOCI are subsequently measured at fair value. Dividends are recognized as income in profit or loss unless the dividend clearly represents a recovery of part of the cost of the investment. Other net gains and losses are recognized in other comprehensive income and are never reclassified to profit or loss.Dividend income is recognized in profit or loss on the date on which the Group’s right to receive payment is established.
3) Fair value through profit or loss (FVTPL)All financial assets not classified as amortized cost or FVOCI described as above are measured at FVTPL. On initial recognition, the Group may irrevocably designate a financial asset, which meets the requirements to be measured at amortized cost or at FVOCI, as at FVTPL if doing so eliminates or significantly reduces an accounting mismatch that would otherwise arise.These assets are subsequently measured at fair value. Net gains and losses, including any interest or dividend income, are recognized in profit or loss.
4) Business model assessmentThe Group makes an assessment of the objective of the business model in which a financial asset is held at portfolio level because this best reflects the way the business is managed and information is provided to management. The information considered includes:‧ the stated policies and objectives for the portfolio and the operation of those policies in practice. These include
whether management’s strategy focuses on earning contractual interest income, maintaining a particular interest rate profile, matching the duration of the financial assets to the duration of any related liabilities or expected cash outflows or realizing cash flows through the sale of the assets;
‧ how the performance of the portfolio is evaluated and reported to the Group’s management;‧ the risks that affect the performance of the business model (and the financial assets held within that business
model) and how those risks are managed;‧ how managers of the business are compensated ― e.g. whether compensation is based on the fair value of the
assets managed or the contractual cash flows collected; and‧ the frequency, volume and timing of sales of financial assets in prior periods, the reasons for such sales and
expectations about future sales activity.Transfers of financial assets to third parties in transactions that do not qualify for derecognition are not considered sales for this purpose, and are consistent with the Group’s continuing recognition of the assets.Financial assets that are held for trading or are managed and whose performance is evaluated on a fair value basis are measured at FVTPL.
5) Assessment whether contractual cash flows are solely payments of principal and interestFor the purposes of this assessment, ‘principal’ is defined as the fair value of the financial assets on initial recognition. ‘Interest’ is defined as consideration for the time value of money and for the credit risk associated with the principal amount outstanding during a particular period of time and for other basic lending risks and costs, as well as a profit margin.
100
In assessing whether the contractual cash flows are solely payments of principal and interest, the Group considers the contractual terms of the instrument. This includes assessing whether the financial asset contains a contractual term that could change the timing or amount of contractual cash flows such that it would not meet this condition. In making this assessment, the Group considers:‧ contingent events that would change the amount or timing of cash flows;‧ terms that may adjust the contractual coupon rate, including variable rate features;‧ prepayment and extension features; and‧ terms that limit the Group’s claim to cash flows from specified assets (e.g. non-recourse features)
6) Impairment of financial assetsThe Group recognizes loss allowances for expected credit losses (ECL) on financial assets measured at amortized cost (including cash and cash equivalents, notes and accounts receivable, other receivables), and contract assets.The Group measures loss allowances at an amount equal to lifetime ECL, except for the following which are measured as 12-month ECL:‧ debt securities that are determined to have low credit risk at the reporting date; and‧ other debt securities and bank balances for which credit risk (i.e. the risk of default occurring over the expected life
of the financial instrument) has not increased significantly since initial recognition.Loss allowance for accounts receivable and contract assets are always measured at an amount equal to lifetime ECL.When determining whether the credit risk of a financial asset has increased significantly since initial recognition and when estimating ECL, the Group considers reasonable and supportable information that is relevant and available without undue cost or effort. This includes both quantitative and qualitative information and analysis based on the Group’s historical experience and informed credit assessment as well as forwardlooking information.The Group assumes that the credit risk on a financial asset has increased significantly if it is more than 30 days past due.The Group considers a debt security to have low credit risk when its credit risk rating is equivalent to the globally understood definition of ‘investment grade which is considered to be BBB- or higher per Standard & Poor’s, Baa3 or higher per Moody’s or twA or higher per Taiwan Ratings’.Lifetime ECLs are the ECLs that result from all possible default events over the expected life of a financial instrument.12-month ECLs are the portion of ECLs that result from default events that are possible within the 12 month after the reporting date (or a shorter period if the expected life of the instrument is less than 12 months).The maximum period considered when estimating ECLs is the maximum contractual period over which the Group is exposed to credit risk.ECLs are a probability-weighted estimate of credit losses. Credit losses are measured as the present value of all cash shortfalls (i.e the difference between the cash flows due to the Group in accordance with the contract and the cash flows that the Group expects to receive). ECLs are discounted at the effective interest rate of the financial asset.At each reporting date, the Group assesses whether financial assets carried at amortized cost are credit-impaired. A financial asset is ‘credit-impaired’ when one or more events that have a detrimental impact on the estimated future cash flows of the financial asset have occurred. Evidence that a financial asset is credit-impaired includes the following observable data:‧ significant financial difficulty of the borrower or issuer;‧ a breach of contract such as a default or being more than 90 days past due;‧ the lender of the borrower, for economic or contractual reasons relating to the borrower’s financial difficulty, having
granted to the borrower a concession that the lender would not otherwise consider;‧ it is probable that the borrower will enter bankruptcy or other financial reorganization; or‧ the disappearance of an active market for a security because of financial difficulties.Loss allowances for financial assets measured at amortized cost are deducted from the gross carrying amount of the assets. The gross carrying amount of a financial asset is written off when the Group has no reasonable expectations of recovering a financial asset in its entirety or a portion thereof. The Group individually makes an assessment with respect to the timing and amount of write-off based on whether there is a reasonable expectation of recovery. The Group expects no significant recovery from the amount written off. However, financial assets that are written off could still be subject to enforcement activities in order to comply with the Group’s procedures for recovery of amounts due.
7) Derecognition of financial assetsThe Group derecognizes a financial asset when the contractual rights to the cash flows from the financial asset expire, or it transfers the rights to receive the contractual cash flows in a transaction in which substantially all of the risks and rewards of ownership of the financial asset are transferred or in which the Group neither transfers nor retains substantially all of the risks and rewards of ownership and it does not retain control of the financial asset.
101

The Group enters into transactions whereby it transfers assets recognized in its statement of balance sheet, but retains either all or substantially all of the risks and rewards of the transferred assets. In these cases, the transferred assets are not derecognized.
(ii) Financial liabilities1) Financial liabilities
Financial liabilities are classified as measured at amortized cost.Other financial liabilities are subsequently measured at amortized cost using the effective interest method. Interest expense and foreign exchange gains and losses are recognized in profit or loss. Any gain or loss on derecognition is also recognized in profit or loss.
2) Derecognition of financial liabilitiesThe Group derecognizes a financial liability when its contractual obligation has been discharged, cancelled, or expire. The Group also derecognizes a financial liability when its terms are modified and the cash flows of the modified liability are substantially different, in which case a new financial liability based on the modified terms is recognized at fair value.On derecognition of a financial liability, the difference between the carrying amount of a financial liability extinguished and the consideration paid (including any non-cash assets transferred or liabilities assumed) is recognized in profit or loss.
(iii) Hedge accountingThe Group holds derivative financial instruments to hedge its foreign currency and interest rate exposures. Derivatives are initially measured at fair value. Subsequent to initial recognition, derivatives are measured at fair value, and changes therein are recognized in profit or loss.The Group designates certain hedging instruments (which include non-derivatives in respect inception of a foreign currency risk) as cash flow hedges.At initial designated hedging relationships, the Group documents the risk management objectives and strategy for undertaking the hedge. The Group also documents the economic relationship between the hedged item and the hedging instrument, including whether the changes in cash flows of the hedged items and hedging instrument are expected to offset each other.1) Cash flow hedges
The effective portion of changes in the fair value of derivatives that are designated and qualify as cash flow hedges is recognized in other comprehensive income and accumulated under ‘other equity - gains (losses) on hedging instruments’, limited to the cumulative change in fair value of the hedged item from inception of the hedge. The gain or loss relating to the ineffective portion is recognized immediately in profit or loss.Amounts previously recognized in other comprehensive income and accumulated in equity are reclassified to profit or loss in the periods when the hedged item affects profit or loss, in the same line as the recognized hedged item. However, when the hedged forecast transaction results in the recognition of a non-financial asset or a non-financial liability, the gains and losses previously recognized in other comprehensive income and accumulated in equity are removed from equity and included in the initial measurement of the cost of the non-financial asset or non-financial liability. Furthermore, if the Group expects that some or all of the loss accumulated in other equity will not be recovered in the future, that amount is immediately reclassified to profit or loss.If the hedge no longer meets the criteria for hedge accounting or the hedging instrument is sold, expires, is terminated or is exercised, then hedge accounting is discontinued prospectively. The discontinuation is accounted for prospectively. When hedge accounting for cash flow hedges is discontinued, the amount that has been accumulated in other equity remains in equity until, for a hedge of a transaction resulting in the recognition of a non-financial item, it is included in the non-financial item’s cost on its initial recognition or, for other cash flow hedges, it is reclassified to profit or loss in the same period or periods as the hedged expected future cash flows affect profit or loss. If the hedged future cash flows are no longer expected to occur, then the amounts that have been accumulated in other equity are immediately reclassified to profit or loss.
(h) Inventories Inventories are measured at the lower of cost and net realizable value. The cost shall comprise all costs of purchase, costs of conversion, costs incurred in bringing the inventories to their present location and condition, and borrowings. Net realizable value is the balance that estimates the selling price, less, estimated costs of completion and the estimated costs of selling. The measurement of net realizable value is as follows:(i) Land held for development: the net realizable value is the replacement cost or estimated price (based on the market
condition), less, the estimated selling expenses at the end of the period.(ii) Building construction in progress: the net realizable value is the estimated price (based on the market condition), less, the
estimated costs of completion and selling expenses at the end of the period.
102
(iii) Real estate held for sale: the net realizable value is the estimated price (based on the market condition), less, the estimated selling expenses at the end of the period.
(i) Service Concession Agreements (i) Recognition and measurement
The Group (the Operator) is required to comply with IFRIC 12 ‘Service Concession Arrangement’ upon entering into an agreement with the government (the Grantor), under the conditions of ‘public-to-private’ arrangement as follows:1) The Grantor decides and regulates on the price and the kind of services the Operator should render or provide to the
users of the infrastructures.2) The Grantor, through its ownership, acquires all the beneficial entitlements and any interests incurred from the
infrastructure at the end of the term of the arrangement. The Operator provides construction or upgrade services to the Grantor. The payment from the Grantor received or receivable by the Operator incurred from the construction or upgrade services shall be recognized as financial asset or intangible asset. According to IFRIC 12, a financial asset should be recognized to the extent that the Operator has an unconditional present right to receive cash from the Grantor for its construction services. The accounting policy of financial assets please refer to note 4(g) ‘Financial instruments’.The Operator shall recognize an intangible asset to the extent that the Operator receives a right (a license) to charge its users of its public service. A right to charge the users of the public service is not an unconditional right to receive cash because the amounts are contingent on the extent that the public uses the service. For the accounting policy of intangible assets (service concession arrangement), please refer to note 4(o) ‘Intangible assets’. If the Operator received the payment from the Grantor for its construction services (partly by a financial asset and partly by an intangible asset), it is necessary to separately account for each component by using the fair value of the financial asset and intangible asset. The payment received or receivable from the Grantor for both components shall be recognized initially in the allocation amount calculated by using the standalone fair value.
(ii) Construction or upgrade servicesThe accounting policy of construction services or upgrade services to the Grantor shall be in accordance with IFRS 15. Please refer to note 4(r) ‘Revenue’.
(iii) Operating servicesThe accounting policy of operation services to the government shall be in accordance with IFRS 15. Please refer to note 4(r) ‘Revenue’.
(j) Investment in associates Associates are those entities in which the Group has significant influence, but no control, over the financial and operating policies. Investments in associates are accounted for using equity method and are recognized initially at cost. The cost of the investment includes transaction costs. The carrying amount of the investment in associates includes goodwill arising from the acquisition, minus any accumulated impairment losses.The consolidated financial statements include the Group’s share of the profit or loss and other comprehensive income of those associates, after adjustments to align the accounting policies with those of the Group, from the date that significant influence commences until the date that significant influence ceases. When changes in an associate’s equity are not recognized in profit or loss or other comprehensive income of the associate, and such changes do not affect the Group’s ownership percentage of the associate, the Group recognizes the Group’s share of change in equity of the associate in capital surplus in proportion to its ownership.Unrealized gains and losses resulting from the transactions between the Group and an associate are recognized only to the extent of the Group’s interest in the associate.When the Group’s share of losses of an associate equals or exceeds its interest in associates, it discontinues recognizing its share of further losses. After the recognized interest is reduced to zero, additional losses are provided for, and a liability is recognized, only to the extent that the Group has incurred legal or constructive obligations or made payments on behalf of the associate.
(k) Joint arrangements A joint arrangement is an arrangement of which two or more parties have joint control. The IFRS classifies joint arrangements into two types — joint operations and joint ventures, which have the following characteristics:(i) the parties are bound by a contractual arrangement; and(ii) the contractual arrangement gives two or more of those parties joint control of the arrangement.IFRS 11 ‘Joint arrangements' defines Joint control as the contractually agreed sharing of control of an arrangement, which exists only when decisions about the relevant activities (i.e. activities that significantly affect the returns of the arrangement) require the unanimous consent of the parties sharing control.
103
A joint operation is a joint arrangement whereby the parties that have joint control of the arrangement (i.e. joint operations party) have rights to the assets, and obligations for the liabilities, relating to the arrangement. A joint operator recognizes and measures the assets, liabilities, revenues and expenses in relation to its interest in a joint arrangement in accordance with the relevant IFRSs applicable to the particular assets, liabilities, revenues and expenses. When assessing whether a joint arrangement is a joint operation or a joint venture, the Group considers the structure and legal form of the arrangement, the terms agreed by the parties in the contractual arrangement and, when relevant, other facts and circumstances.
(l) Investment property Investment property is the property held either to earn rental income or for capital appreciation or for both, but not for sale in the ordinary course of business, use in the production or supply of goods or services or for administrative purposes. Investment property is measured at cost on initial recognition and subsequently at cost, less accumulated depreciation and accumulated impairment losses. Depreciation expense is calculated based on the depreciation method, useful lives, and residual value which are the same as those adopted for property, plant and equipment.Any gain or loss on disposal of an investment property (calculated as the difference between the net proceeds from disposal and the carrying amount) is recognized in profit or loss.Rental income from investment property is recognized as rental revenue on a straight-line basis over the term of the lease. Lease incentives granted are recognized as an integral part of the total rental income, over the term of the lease.
(m) Property, plant and equipment (i) Recognition and measurement
Items of property, plant and equipment are measured at cost, which includes capitalized borrowing costs, less accumulated depreciation and any accumulated impairment losses. If significant parts of an item of property, plant and equipment have different useful lives, they are accounted for as separate items (major components) of property, plant and equipment.Any gain or loss on disposal of an item of property, plant and equipment is recognized in profit or loss.
(ii) Subsequent costSubsequent expenditure is capitalized only if it is probable that future economic benefits associated with the expenditure will flow to the Group.
(iii) DepreciationDepreciation is calculated on the cost of an asset less its residual value and is recognized in profit or loss on a straight-line basis over the estimated useful lives of each component of an item of property, plant and equipment. Depreciation methods, useful lives and residual values are reviewed at each reporting date and adjusted if appropriate.Land is not depreciated.The estimated useful lives of property, plant and equipment are as follows:
Buildings 4~ 50 years
Machinery and equipment 2~ 12 years
Transportation equipment 1~ 10 years
Office and computer equipment 3~ 8 years
(iv) Reclassification to investment propertyA property is reclassified to investment property at its carrying amount when the use of the property changes from owner occupied to investment property.
(n) Leases (i) Identifying a lease
At inception of a contract, the Group assesses whether a contract is, or contains, a lease. A contract is, or contains, a lease if the contract conveys the right to control the use of an identified asset for a period of time in exchange for consideration. To assess whether a contract conveys the right to control the use of an identified asset, the Group assesses whether:1) the contract involves the use of an identified asset – this may be specified explicitly or implicitly, and should be
physically distinct or represent substantially all of the capacity of a physically distinct asset. If the supplier has a substantive substitution right, then the asset is not identified; and
2) the customer has the right to obtain substantially all of the economic benefits from use of the asset throughout the period of use; and
3) the customer has the right to direct the use of the asset throughout the period of use only if either:‧ the customer has the right to direct how and for what purpose the asset is used throughout the period of use; or‧ the relevant decisions about how and for what purpose the asset is used are predetermined and:
104
- the customer has the right to operate the asset throughout the period of use, without the supplier having the right to change those operating instructions; or
- the customer designed the asset in a way that predetermines how and for what purpose it will be used throughout the period of use.
When the lease is established or the contract is re-evaluated to determine whether the lease is included in the contract, the Group allocates the consideration in the contract to each lease component on the basis of their relative stand-alone prices.
(ii) As a lesseeThe Group recognizes a right-of-use asset and a lease liability at the lease commencement date. The right-of-use asset is initially measured at cost, which comprises the initial amount of the lease liability adjusted for any lease payments made at or before the commencement date, plus any initial direct costs incurred and an estimate of costs to dismantle and remove the underlying asset or to restore the underlying asset or the site on which it is located, less any lease incentives received.The right-of-use asset is subsequently depreciated using the straight-line method from the commencement date to the earlier of the end of the useful life of the right-of-use asset or the end of the lease term. In addition, the right-of-use asset is periodically reduced by impairment losses, if any, and adjusted for certain remeasurements of the lease liability.The lease liability is initially measured at the present value of the lease payments that are not paid at the commencement date, discounted using the interest rate implicit in the lease or, if that rate cannot be reliably determined, the Group’s incremental borrowing rate. Generally, the Group uses its incremental borrowing rate as the discount rate.Lease payments included in the measurement of the lease liability comprise the following:1) fixed payments, including in-substance fixed payments;2) variable lease payments that depend on an index or a rate, initially measured using the index or rate as at the
commencement date;3) amounts expected to be payable under a residual value guarantee; and4) payments for purchase or termination options that are reasonably certain to be exercised.The lease liability is measured at amortized cost using the effective interest method. It is remeasured when:1) there is a change in future lease payments arising from the change in an index or rate; or2) there is a change in the Group’s estimate of the amount expected to be payable under a residual value guarantee; or3) there is a change in the lease term resulting from a change of its assessment on whether it will exercise an option to
purchase the underlying asset, or4) there is a change of its assessment on whether it will exercise a purchase, extension or termination option; or5) there is any lease modificationsWhen the lease liability is remeasured, other than lease modifications, a corresponding adjustment is made to the carrying amount of the right-of-use asset, or in profit and loss if the carrying amount of the right-of-use asset has been reduced to zero.When the lease liability is remeasured to reflect the partial or full termination of the lease for lease modifications that decrease the scope of the lease, the Group accounts for the remeasurement of the lease liability by decreasing the carrying amount of the right-of-use asset to reflect the partial or full termination of the lease, and recognize in profit or loss any gain or loss relating to the partial or full termination of the lease.The Group presents right-of-use assets that do not meet the definition of investment and lease liabilities as a separate line item respectively in the statement of financial position.The Group has elected not to recognize right-of-use assets and lease liabilities for short-term leases of building and machinery that have a lease term of 12 months or less or leases of low-value assets. The Group recognizes the lease payments associated with these leases as an expense on a straight-line basis over the lease term.In addition, the Group leases land and buildings by applying IFRIC 12 ‘Service Concession Agreements’ and recognizes the lease payments associated with these leases as an expense on a straight-line basis over the lease term.As a practical expedient, the Group elects not to assess whether all rent concessions that meets all the following conditions are lease modifications or not: 1) the rent concessions occurring as a direct consequence of the COVID-19 pandemic;2) the change in lease payments that resulted in revised consideration for the lease that is substantially the same as, or
less than, the consideration for the lease immediately preceding the change;3) any reduction in lease payments that affects only those payments originally due on, or before, June 30, 2021; and4) there is no substantive change in other terms and conditions of the lease.In accordance with the practical expedient, the effect of the change in the lease liability is reflected in profit or loss in the period in which the event or condition that triggers the rent concession occurs.
105
(iii) As a lessorWhen the Group acts as a lessor, it determines at lease commencement whether each lease is a finance lease or an operating lease. To classify each lease, the Group makes an overall assessment of whether the lease transfers to the lessee substantially all of the risks and rewards of ownership incidental to ownership of the underlying asset. If this is the case, then the lease is a finance lease; if not, then the lease is an operating lease. As part of this assessment, the Group considers certain indicators such as whether the lease is for the major part of the economic life of the asset.When the Group is an intermediate lessor, it accounts for its interests in the head lease and the sub-lease separately. It assesses the lease classification of a sub-lease with reference to the right-of-use asset arising from the head lease, not with reference to the underlying asset. If a head lease is a short-term lease to which the Group applies the exemption described above, then it classifies the sub-lease as an operating lease.If an arrangement contains lease and non-lease components, the Group applies IFRS15 to allocate the consideration in the contract.
(o) Intangible Assets(i) Service Concession Agreements
The Group shall recognize an intangible asset arising from service concession agreements when the Group a right to charge the public for the use of the infrastructure. The intangible assets resulted from construction or service upgraded in accordance with the service concession agreements are measured at the fair value on initial recognition. Subsequently, intangible assets are measured at cost, including borrowing costs that are eligible for capitalization, minus accumulated amortization and accumulated impairment losses.
(ii) AmortizationThe amortized amount of intangible assets with definite lives is determined after deducting its residual value.Amortization is recognized in profit or loss on a straight-line basis over the estimated useful lives of intangible assets from the date that they are available for use. For the estimated useful lives for the current and comparative years of significant item of intangible assets are as follows:Service Concession Agreements 17~35 yearsThe useful life of intangibles arising from the service concession agreements begins on a day when the Group has a right to charge the public for the use of the infrastructure and ends on the expiry of the service concession agreements. Amortization methods, useful lives, and residual values are reviewed at the end of each financial period, and adjusted if needed.
(p) Impairment of non-financial assets At each reporting date, the Group reviews the carrying amounts of its non-financial assets (other than inventories, contract assets and deferred tax assets) to determine whether there is any indication of impairment. If any such indication exists, then the asset’s recoverable amount is estimated.For impairment testing, assets are grouped together into the smallest group of assets that generates cash inflows from continuing use that are largely independent of the cash inflows of other assets or cash-generating units (CGUs).The recoverable amount of an asset or CGU is the greater of its value in use and its fair value less costs to sell and its value in use. Value in use is based on the estimated future cash flows, discounted to their present value using a pre-tax discount rate that reflects current market assessments of the time value of money and the risks specific to the asset or CGU.An impairment loss is recognized if the carrying amount of an asset or CGU exceeds its recoverable amount.Impairment losses are recognized in profit or loss. They are allocated first to reduce the carrying amount of the other assets in the CGU on a pro rata basis.An impairment loss in respect of goodwill is not reversed. For other assets, an impairment loss is reversed only to the extent that the asset’s carrying amount does not exceed the carrying amount that would have been determined, net of depreciation or amortization, if no impairment loss had been recognized.
(q) Provisions A provision is recognized if, as a result of a past event, the Group has a present obligation that can be estimated reliably, and it is probable that an outflow of economic benefits will be required to settle the obligation. (i) Warranties
A provision for warranties is recognized when the underlying constructions are completed. The provision is based on historical warranty data and a weighting of all possible outcomes against their associated probabilities.
(ii) Onerous contractsA provision for onerous contracts is recognized when the expected benefits to be derived by the Group from a contract are lower than the unavoidable cost of meeting its obligations under the contract. The provision is measured at the present value of the lower of the expected cost of terminating the contract and the expected net cost of continuing with the contract. Before a provision is established, the Group recognizes any impairment loss on the assets associated with that contract.
106
(iii) After-sales serviceA provision for warranties is recognized when products are sold or services are provided. The provision is based on historical warranty data and a weighting of all possible outcomes against their associated probabilities.
(r) Revenue (i) Revenue from contracts with customers
Revenue is measured based on the consideration to which the Group expects to be entitled in exchange for transferring goods or services to a customer. The Group recognizes revenue when it satisfies a performance obligation by transferring control of a good or a service to a customer. The accounting policies for the Group’s main types of revenue are explained below.1) Construction contracts
The Group enters into contracts to build residential properties, commercial buildings and public constructions. Because its customer controls the asset as it is constructed, the Group recognizes revenue over time on the basis of the construction costs incurred to date as a proportion of the total estimated costs of the contract or the surveys of work performed / completion of a physical proportion of the contract work. The consideration promised in the contract includes fixed and variable amounts. The customer pays the fixed amount based on a payment schedule. For some variable considerations (for example, a penalty payment calculated based on delay days and price-adjusted subsidy), accumulated experience is used to estimate the amount of variable consideration, using the expected value method. For other variable considerations (for example, completion bonus if a construction is completed by a specified date), the Group estimates the amount of variable consideration using the most likely amount. Considering the progress of a public construction is highly susceptible to factors outside the Group’s control and, therefore, completion bonus is usually constrained, the Group recognizes revenue only to the extent that it is highly probable that a significant reversal in the amount of cumulative revenue recognized will not occur. If the Group has recognized revenue, but not issued a bill, then the entitlement to consideration is recognized as a contract asset. The contract asset is transferred to receivables when the entitlement to payment becomes unconditional.If the Group cannot reasonably measure its progress towards complete satisfaction of the performance obligation of a construction contract, the Group shall recognize revenue only to the extent of the costs expected to be recovered.A provision for onerous contracts is recognized when the Group expects the unavoidable costs of performing the obligations under a construction contract exceed the economic benefits expected to be received under the contract. Estimates of revenues, costs or extent of progress toward completion are revised if circumstances change. Any resulting increases or decreases in estimated revenues or costs are reflected in profit or loss in the period in which the circumstances that give rise to the revision become known by management.For residential properties, commercial buildings and public constructions, the Group offers a standard warranty to provide assurance that they comply with agreed upon specifications and has recognized warranty provisions for this obligation; please refer to note 6(s).
2) Land development and sale of real estateThe Group develops and sells residential properties and usually sales properties in advance during construction or before construction begins. Revenue is recognized when control over the properties has been transferred to the customer. The properties have generally no alternative use for the Group due to contractual restrictions. However, an enforceable right to payment does not arise until legal title of a property has passed to the customer. Therefore, revenue is recognized at a point in time when the legal title has passed to the customer.The revenue is measured at the transaction price agreed under the contract. For sale of readily available house, in most cases, the consideration is due when legal title of a property has been transferred. While deferred payment terms may be agreed in rare circumstances, the deferral never exceeds twelve months. The transaction price is therefore not adjusted for the effects of a significant financing component. For pre selling properties, the consideration is usually received by installment during the period from contract inception until the transfer of properties to the customer. If the contract includes a significant financing component, the transaction price will be adjusted for the effects of the time value of money during the period, using the specific borrowing rate of the construction project. Receipt of a prepayment from a customer is recognized as contract liability. Interest expense and contract liability are recognized when adjusting the effects of the time value of money. Accumulated amount of contract liability is recognized as revenue when control over the property has been transferred to the customer.Certain contracts include multiple deliverables, such as sale of residential properties and a decoration service. The Group accounts for the decoration service as a single performance obligation, and the transaction price is allocated to the decoration service on a relative stand alone selling price basis. If a stand alone selling price is not directly observable, it is estimated based on expected cost plus margin. Revenue from providing the decoration service is recognized in the accounting period in which the services are rendered and is determined based on the costs incurred to date as a proportion of the total estimated costs of the contract.
107
(ii) Labor service revenueThe Group provides the operation and maintenance of sewage treatment plant for the government and recognizes the revenue based on the number of times of completion.
(iii) Rental revenueRental income from investment property is recognized on a straight-line basis over the term of the lease. Lease incentives granted are recognized as an integral part of the total rental income and are recognized as the reduction of rental revenue, over the term of the lease. Income generated from leased real estate is recognized as rental revenue under operating revenue.
(iv) Contract costs1) Incremental costs of obtaining a contract
The Group recognizes as an asset the incremental costs of obtaining a contract with a customer if the Group expects to recover those costs. The incremental costs of obtaining a contract are those costs that the Group incurs to obtain a contract with a customer that it would not have incurred if the contract had not been obtained. Costs to obtain a contract that would have been incurred regardless of whether the contract was obtained shall be recognized as an expense when incurred, unless those costs are explicitly chargeable to the customer regardless of whether the contract is obtained. The Group applies the practical expedient to recognize the incremental costs of obtaining a contract as an expense when incurred if the amortization period of the asset that the entity otherwise would have recognized is one year or less.
2) Costs to fulfil a contractIf the costs incurred in fulfilling a contract with a customer are not within the scope of another Standard (for example, IAS 2 Inventories, IAS 16 Property, Plant and Equipment or IAS 38 Intangible Assets), the Group recognizes an asset from the costs incurred to fulfil a contract only if those costs meet all of the following criteria:General and administrative costs, costs of wasted materials, labor or other resources to fulfil the contract that were not reflected in the price of the contract, costs that relate to satisfied performance obligations (or partially satisfied performance obligations), and costs for which the Group cannot distinguish whether the costs relate to unsatisfied performance obligations or to satisfied performance obligations(or partially satisfied performance obligations), the Group recognizes these costs as expenses when incurred.
(s) Government grants Grants that compensate the Group for expenses or losses incurred are recognized in profit or loss on a systematic basis in the periods in which the expenses are recognized.
(t) Employee benefits (i) Defined contribution plans
Obligations for contributions to defined contribution plans are expensed as the related service is provided.(ii) Defined benefit plans
The Group’s net obligation in respect of defined benefit plans is calculated separately for each the plan by estimating the amount of future benefit that employees have earned in the current and prior periods, discounting that amount and deducting the fair value of any plan assets.The calculation of defined benefit obligations is performed annually by a qualified actuary using the projected unit credit method. When the calculation results in a potential asset for the Group, the recognized asset is limited to the present value of economic benefits available in the form of any future refunds from the plan or reductions in future contributions to the plan. To calculate the present value of economic benefits, consideration is given to any applicable minimum funding requirements.Remeasurements of the net defined benefit liability, which comprise actuarial gains and losses, the return on plan assets (excluding interest) and the effect of the asset ceiling (if any, excluding interest), are recognized immediately in other comprehensive income, and accumulated in retained earnings within equity. The Group determines the net interest expense (income) on the net defined benefit liability (asset) for the period by applying the discount rate used to measure the defined benefit obligation at the beginning of the annual period to the then-net defined benefit liability (asset). Net interest expense and other expenses related to defined benefit plans are recognized in profit or loss.When the benefits of a plan are changed or when a plan is curtailed, the resulting change in benefit that relates to past service or the gain or loss on curtailment is recognized immediately in profit or loss. The Group recognizes gains and losses on the settlement of a defined benefit plan when the settlement occurs.
(iii) Termination benefitsTermination benefits are expensed at the earlier of when the Group can no longer withdraw the offer of those benefits and when the Group recognizes costs for a restructuring. If benefits are not expected to be settled wholly within 12 months of the reporting date, then they are discounted.
108
(iv) Short-term employee benefitsShort-term employee benefits are expensed as the related service is provided. A liability is recognized for the amount expected to be paid if the Group has a present legal or constructive obligation to pay this amount as a result of past service provided by the employee, and the obligation can be estimated reliably.
(u) Income Taxes Income taxes comprise current taxes and deferred taxes. Except for expenses related to business combinations or recognized directly in equity or other comprehensive income, all current and deferred taxes are recognized in profit or loss.Current taxes comprise the expected tax payables or receivables on the taxable profits (losses) for the year and any adjustment to the tax payable or receivable in respect of previous years. The amount of current tax payables or receivables are the best estimate of the tax amount expected to be paid or received. It is measured using tax rates enacted or substantively enacted at the reporting date.Deferred taxes arise due to temporary differences between the carrying amounts of assets and liabilities for financial reporting purposes and their respective tax bases. Deferred taxes are recognized except for the following: (i) temporary differences on the initial recognition of assets and liabilities in a transaction that is not a business combination
and that affects neither accounting nor taxable profits (losses) at the time of the transaction;(ii) temporary differences related to investments in subsidiaries, associates and joint arrangements to the extent that the
Group is able to control the timing of the reversal of the temporary differences and it is probable that they will not reverse in the foreseeable future; and
(iii) taxable temporary differences arising on the initial recognition of goodwill.Deferred taxes are measured at tax rates that are expected to be applied to temporary differences when they reserve, using tax rates enacted or substantively enacted at the reporting date.Deferred tax assets and liabilities are offset if the following criteria are met:(i) the Group has a legally enforceable right to set off current tax assets against current tax liabilities; and(ii) the deferred tax assets and the deferred tax liabilities relate to income taxes levied by the same taxation authority on
either:1) the same taxable entity; or2) different taxable entities which intend to settle current tax assets and liabilities on a net basis, or to realize the assets
and liabilities simultaneously, in each future period in which significant amounts of deferred tax liabilities or assets are expected to be settled or recovered.
Deferred tax assets are recognized for the carry forward of unused tax losses, unused tax credits, and deductible temporary differences to the extent that it is probable that future taxable profits will be available against which they can be utilized. Deferred tax assets are reviewed at each reporting date and are reduced to the extent that it is no longer probable that the related tax benefits will be realized; such reductions are reversed when the probability of future taxable profits improves. Despite CHC, CEC and CDC adopted a tax consolidated regime, income tax should be calculated in accordance with the abovementioned accounting principles. Based on the consolidated income tax reported by CHC, it needs to adjust the current tax assets or liabilities for CHC.
(v) Earnings per share Disclosures are made of basic and diluted earnings per share attributable to ordinary equity holders of the Group. The basic earnings per share are calculated based on the profit attributable to the ordinary shareholders of the Group divided by weighted-average number of ordinary shares outstanding. The diluted earnings per share are calculated based on the profit attributable to the ordinary shareholders of the Group, divided by weighted-average number of ordinary shares outstanding after adjustment for the effects of all potential dilutive ordinary shares, such as employee remuneration.
(w) Operating Segments An operating segment is a component of the Group that engages in business activities from which it may earn revenues and incur expenses (including revenues and expenses relating to transactions with other components of the Group). The segment’s operating results are reviewed regularly by the Group’s chief operating decision maker to make decisions pertaining to the allocation of the resources to the segment and to assess its performance. In addition, discrete financial information is available from the interval reporting system.
(5) Significant accounting assumptions and judgments, and major sources of estimation uncertainty:The preparation of the consolidated financial statements in conformity with the Regulations and the IFRSs endorsed by the FSC requires the management to make judgments, estimates, and assumptions that affect the application of the accounting policies and the reported amount of assets, liabilities, income, and expenses. Actual results may differ from these estimates.The management continues to monitor the accounting estimates and assumptions. The management recognizes any changes in accounting estimates during the period and the impact of those changes in accounting estimates in the next period.
109
Information about judgments made in applying accounting policies that have the most significant effects on the amounts recognized in the consolidated financial statements is as follows:(a) The adoption of IFRIC 12 ‘Service concession arrangements’ and the classification of receivables or intangible assets
The Group (the Operator) is required to comply with IFRIC 12 ‘Service Concession Arrangement’ when entering into an agreement with the government (the Grantor), under the conditions of ‘public-to-private’ arrangement as follows:(i) The Grantor decides and regulates on the price and the kind of services the Operator should render or provide to the
users of the infrastructures.(ii) The Grantor, through its ownership, acquires all the beneficial entitlements and any interests incurred from the
infrastructure at the end of the term of the arrangement.On the adoption of IFRIC 12 ‘Service concession arrangements’, the payment from the Grantor received or receivable by the Operator incurred from the construction or upgrade services shall be recognized in a financial asset or an intangible asset according to the treaties of agreements. Please refer to note 6(e) and 6(m).
Information about assumptions and estimation uncertainties that have a significant risk of resulting in a material adjustment to the carrying amounts of assets and liabilities within the next financial year is as follows. Those assumptions and estimation have been updated to reflect the impact of COVID-19 pandemic:(a) Valuation of inventories
As inventories are stated at the lower of cost or net realizable value, the Group estimates the net realizable value of inventories for obsolescence and unmarketable items at the end of the reporting period and then writes down the cost of inventories to net realizable value. The net realizable value of the inventory is mainly determined based on assumptions as to future demand within a specific time horizon. Due to the rapid industrial transformation, there may be significant changes in the net realizable value of inventories. Refer to Note 6(g) for further description of the valuation of inventories.
(b) Revenue recognitionContract revenue and costs are recognized by reference to the stage of completion of each contract. The stage of completion of a contract is measured based on the proportion of contract costs incurred for work performed to date relative to the estimated total contract costs; or the completion of a physical proportion of the contract work. Estimated total contract costs of contracted items are assessed and determined by the management based on the nature of activities, expected subcontracting charges, construction periods, processes, methods, etc., for each construction contract. Changes in these estimates might affect the calculation of the percentage of completion and related profits from construction contracts.
The Group’s accounting policies include measuring of financial and non-financial assets and liabilities at FVTPL. For the fair value valuation, the Group has established its internal control system, that is, the Group established its financial instrument valuation group which is responsible for reviewing the significant fair value valuation and reporting the results to the Chief Financial Officer. The financial instrument valuation group conducts independent verification on fair value by using data sources that are independent, reliable, and representative of exercise prices; in addition, the valuation group also periodically adjusts valuation models, conducts back testing, renews input data for valuation models, and makes all other necessary fair value adjustments to assure that the classification of fair value levels is complied with the IFRSs. Any significant valuation issue will be reported to the Audit Committee by the valuation group. The valuation of investment properties were either appraised by external qualified appraisers or measured by the Group’s Financial Department (in accordance with the measurement methods and parametric hypothesis which announced by the FSC).The Group strives to use market observable inputs when measuring assets and liabilities. Different levels of the fair value hierarchy to be used in determining the fair value of financial instruments are as follows:(a) Level 1: quoted prices (unadjusted) in active markets for identifiable assets or liabilities.(b) Level 2: inputs other than quoted prices included within Level 1 that are observable for the asset or liability, either directly (i.e.
as prices) or indirectly (i.e. derived from prices).(c) Level 3: inputs for the assets or liability that are not based on observable market data.For any transfer within the fair value hierarchy, the impact of the transfer is recognized on the reporting date. Please refer to notes listed as below for assumptions used in measuring fair value.(a) Note 6(l) , Investment property(b) Note 6(ac), Financial instruments
(6) Explanation of significant accounts: (a) Cash and cash equivalents
December 31, 2020 December 31, 2019Cash $ 18,317 18,147Cash in banks 3,865,469 3,353,176Time deposits 578,582 942,153Cash equivalents 50,000 109,763 Cash and cash equivalents $ 4,512,368 4,423,239
110
(i) The aforesaid cash and cash equivalents were not pledged as collateral.(ii) Please refer to Note 8 for time deposits in pledge reclassified to other current assets.(iii) Please refer to Note 6(ac) for sensitivity analysis and interest rate risk on financial assets and liabilities of the Group.
(b) Financial assets at fair value through profit or loss
December 31, 2020 December 31, 2019Mandatorily measured at fair value through profit or loss: Non-derivative financial assets Stocks of unlisted company $ 606,305 606,305
(i) Please refer to note 6(ab) for the amount of remeasurement at fair value that are recognized in profit or loss.(ii) Please refer to note 6(ac) for credit risk and market risk.(iii) The aforesaid financial assets were not pledged as collateral.(iv) On May 23, 2018, the board meeting passed a resolution to purchase 18,188 preferred stocks issued by American Bridge
Holding Company (ABHC) which is a subsidiary of New Continental Corp. The unit price is 1,000 USD. On December 17, 2019, a resolution was approved during the board meeting to recognize the net value of ABHC, which was less than the book value of preferred stocks due to the loss of the infrastructure works contracted by ABHC. In consideration of its financial difficulties and solvency, the Group assessed that the investment of preferred stocks and the accumulated dividends receivable will be highly unrecoverable. Therefore, the book amount of $512,067 thousand and the dividend receivable of $67,072 thousand were fully recognized as losses, resulting in the above dividend receivable related to income tax liabilities of $20,121 thousand to be reversed. Hence, the Group ceased to apply the original third level valuation method as of December 31, 2019.In September 2020, the preferred stocks had been cancelled, resulting in the Group to derecognize all the book amounts, dividends receivable, and allowance for losses.
(v) For the year ended December 31, 2019, the Group recognized the dividend income of $33,553 thousand related to the abovementioned investments in preferred stocks. Please refer to Note 6(ab).
(c) Financial assets at fair value through other comprehensive income
December 31, 2020 December 31, 2019Equity investments at fair value through other comprehensive income:Listed common share- Evergreen Steel Corp. $ 1,181,250 -Unlisted common share- Evergreen Steel Corp. - 983,982Unlisted common share- Xinrong Enterprise 607,523 586,246Unlisted common share- Metro Consulting Service Ltd. 2,306 2,248Total $ 1,791,079 1,572,476
(i) The Group designated the investments shown above as equity securities as at fair value through other comprehensive income because these equity securities represent those investments that the Group intends to hold for long-term for strategic purposes.
(ii) For the years ended December 31, 2020 and 2019, the dividends of $112,685 thousand and $100,455 thousand, respectively, related to equity investments at fair value through other comprehensive income, were recognized, please refer to Note (ab).
(iii) In October, 2019, the Group has sold its financial assets at fair value through other comprehensive income. The shares sold had a fair value of $620 thousand, and the Group realized a loss of $5,177 thousand, which has been transferred to retained earnings.
(iv) No strategic investments were disposed as of December 31, 2020, and there were no transfers of any cumulative gain or loss within equity relating to these investments.
(v) Please refer to note 6(ac) for credit risk and market risk.(vi) As of December 31, 2020 and 2019 the aforesaid financial assets were not pledged as collateral.
(d) Financial instruments used for hedging The components of financial assets were as follows:
December 31, 2020 December 31, 2019Cash flow hedge:Financial instruments used for hedging $ 447,850 538,361
(i) The Group is exposed to certain foreign exchange risk arising from the payments made to overseas companies for the purchase of facilities, preparation of overseas related investment and some construction projects involving foreign consultant design fees, etc. The foreign exchange risk is estimated to be high, therefore, the Group decided to use derivative financial instruments for hedging purposes.
111
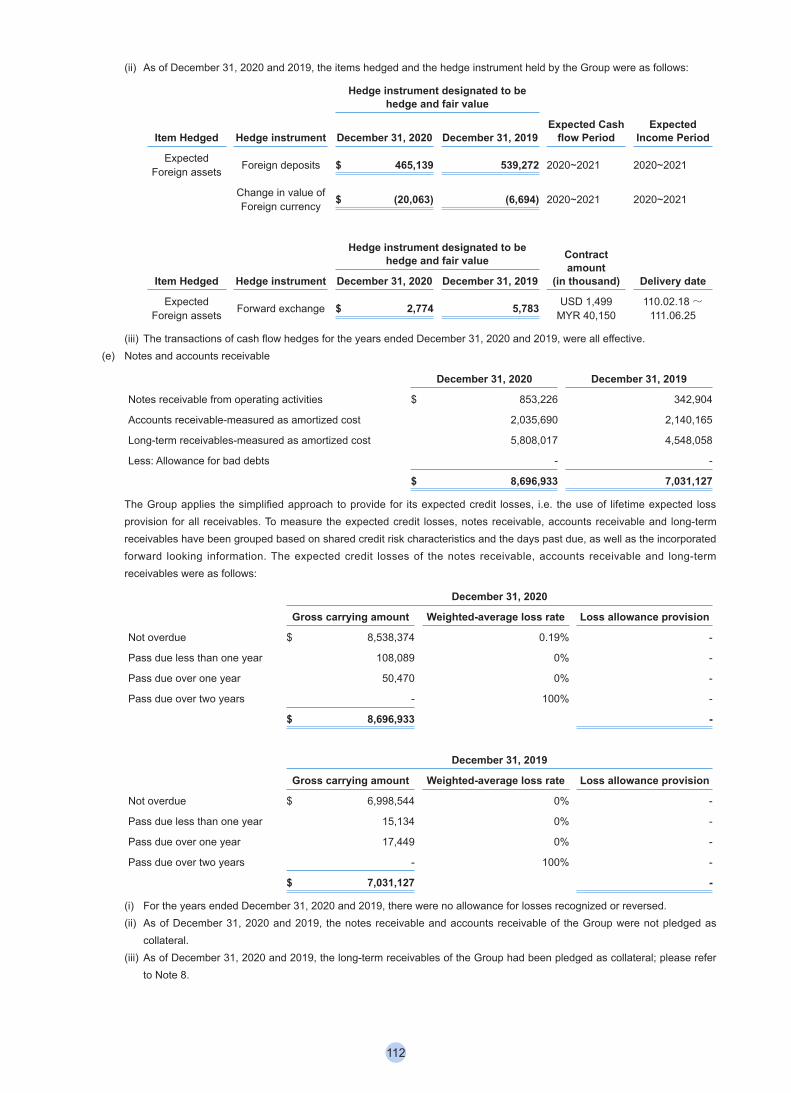
(ii) As of December 31, 2020 and 2019, the items hedged and the hedge instrument held by the Group were as follows:
Hedge instrument designated to be hedge and fair value
Item Hedged Hedge instrument December 31, 2020 December 31, 2019Expected Cash
flow PeriodExpected
Income Period
Expected Foreign assets Foreign deposits $ 465,139 539,272 2020~2021 2020~2021
Change in value of Foreign currency $ (20,063) (6,694) 2020~2021 2020~2021
Item Hedged Hedge instrument
Hedge instrument designated to be hedge and fair value Contract
amount (in thousand) Delivery dateDecember 31, 2020 December 31, 2019
Expected Foreign assets Forward exchange $ 2,774 5,783 USD 1,499
MYR 40,150 110.02.18~
111.06.25
(iii) The transactions of cash flow hedges for the years ended December 31, 2020 and 2019, were all effective.(e) Notes and accounts receivable
December 31, 2020 December 31, 2019
Notes receivable from operating activities $ 853,226 342,904
Accounts receivable-measured as amortized cost 2,035,690 2,140,165
Long-term receivables-measured as amortized cost 5,808,017 4,548,058
Less: Allowance for bad debts - -
$ 8,696,933 7,031,127
The Group applies the simplified approach to provide for its expected credit losses, i.e. the use of lifetime expected loss provision for all receivables. To measure the expected credit losses, notes receivable, accounts receivable and long-term receivables have been grouped based on shared credit risk characteristics and the days past due, as well as the incorporated forward looking information. The expected credit losses of the notes receivable, accounts receivable and long-term receivables were as follows:
December 31, 2020
Gross carrying amount Weighted-average loss rate Loss allowance provision
Not overdue $ 8,538,374 0.19% -
Pass due less than one year 108,089 0% -
Pass due over one year 50,470 0% -
Pass due over two years - 100% -
$ 8,696,933 -
December 31, 2019
Gross carrying amount Weighted-average loss rate Loss allowance provision
Not overdue $ 6,998,544 0% -
Pass due less than one year 15,134 0% -
Pass due over one year 17,449 0% -
Pass due over two years - 100% -
$ 7,031,127 -
(i) For the years ended December 31, 2020 and 2019, there were no allowance for losses recognized or reversed.(ii) As of December 31, 2020 and 2019, the notes receivable and accounts receivable of the Group were not pledged as
collateral.(iii) As of December 31, 2020 and 2019, the long-term receivables of the Group had been pledged as collateral; please refer
to Note 8.
112
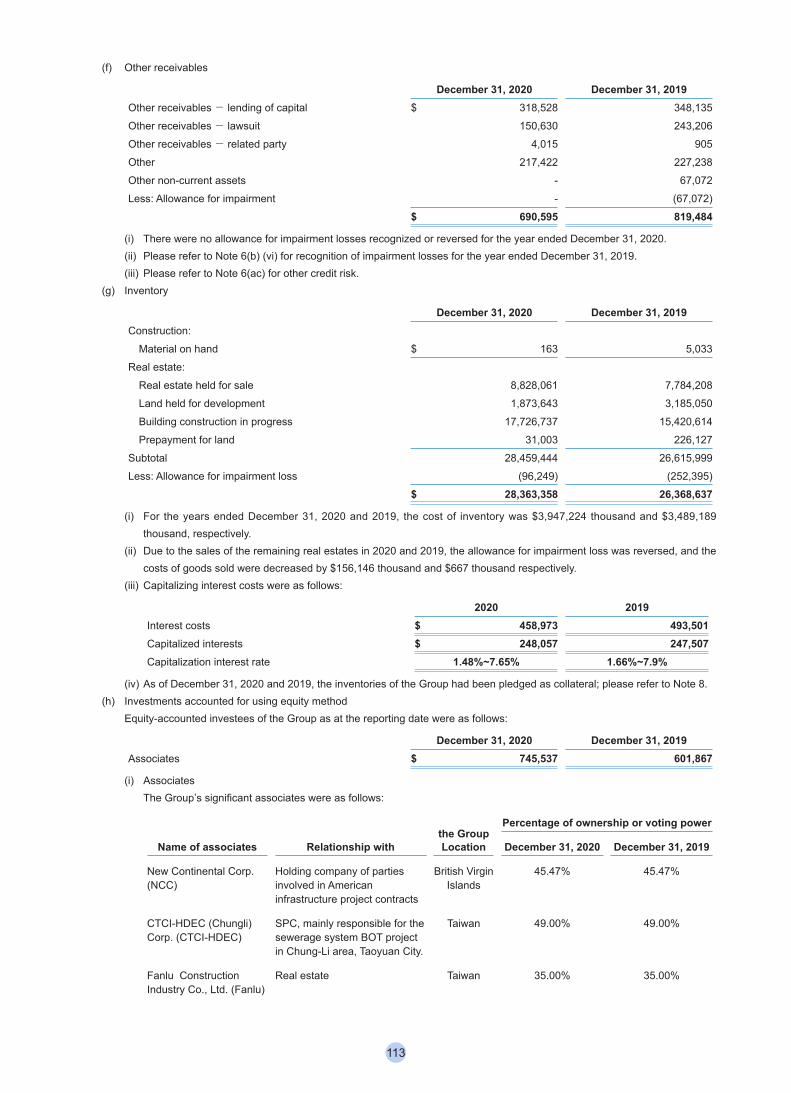
(f) Other receivables
December 31, 2020 December 31, 2019Other receivables- lending of capital $ 318,528 348,135
Other receivables- lawsuit 150,630 243,206
Other receivables- related party 4,015 905
Other 217,422 227,238
Other non-current assets - 67,072
Less: Allowance for impairment - (67,072)
$ 690,595 819,484
(i) There were no allowance for impairment losses recognized or reversed for the year ended December 31, 2020.(ii) Please refer to Note 6(b) (vi) for recognition of impairment losses for the year ended December 31, 2019.(iii) Please refer to Note 6(ac) for other credit risk.
(g) Inventory
December 31, 2020 December 31, 2019Construction: Material on hand $ 163 5,033
Real estate: Real estate held for sale 8,828,061 7,784,208 Land held for development 1,873,643 3,185,050 Building construction in progress 17,726,737 15,420,614 Prepayment for land 31,003 226,127
Subtotal 28,459,444 26,615,999
Less: Allowance for impairment loss (96,249) (252,395)
$ 28,363,358 26,368,637
(i) For the years ended December 31, 2020 and 2019, the cost of inventory was $3,947,224 thousand and $3,489,189 thousand, respectively.
(ii) Due to the sales of the remaining real estates in 2020 and 2019, the allowance for impairment loss was reversed, and the costs of goods sold were decreased by $156,146 thousand and $667 thousand respectively.
(iii) Capitalizing interest costs were as follows:
2020 2019Interest costs $ 458,973 493,501Capitalized interests $ 248,057 247,507Capitalization interest rate 1.48%~7.65% 1.66%~7.9%
(iv) As of December 31, 2020 and 2019, the inventories of the Group had been pledged as collateral; please refer to Note 8.(h) Investments accounted for using equity method
Equity-accounted investees of the Group as at the reporting date were as follows:
December 31, 2020 December 31, 2019Associates $ 745,537 601,867
(i) AssociatesThe Group’s significant associates were as follows:
Name of associates Relationship withthe Group Location
Percentage of ownership or voting power
December 31, 2020 December 31, 2019
New Continental Corp.(NCC)
Holding company of parties involved in American infrastructure project contracts
British Virgin Islands
45.47% 45.47%
CTCI-HDEC (Chungli) Corp. (CTCI-HDEC)
SPC, mainly responsible for the sewerage system BOT project in Chung-Li area, Taoyuan City.
Taiwan 49.00% 49.00%
Fanlu Construction Industry Co., Ltd. (Fanlu)
Real estate Taiwan 35.00% 35.00%
113
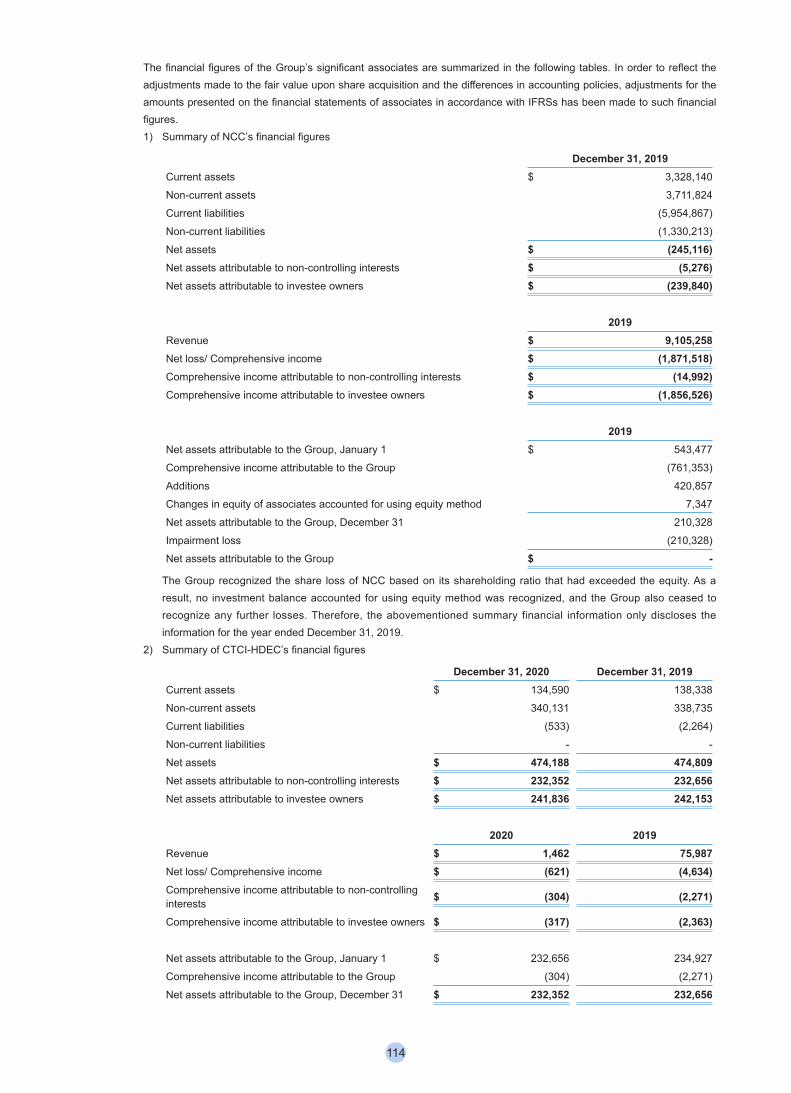
The financial figures of the Group’s significant associates are summarized in the following tables. In order to reflect the adjustments made to the fair value upon share acquisition and the differences in accounting policies, adjustments for the amounts presented on the financial statements of associates in accordance with IFRSs has been made to such financial figures.1) Summary of NCC’s financial figures
December 31, 2019Current assets $ 3,328,140
Non-current assets 3,711,824
Current liabilities (5,954,867)
Non-current liabilities (1,330,213)
Net assets $ (245,116)Net assets attributable to non-controlling interests $ (5,276)Net assets attributable to investee owners $ (239,840)
2019Revenue $ 9,105,258Net loss/ Comprehensive income $ (1,871,518)Comprehensive income attributable to non-controlling interests $ (14,992)Comprehensive income attributable to investee owners $ (1,856,526)
2019Net assets attributable to the Group, January 1 $ 543,477
Comprehensive income attributable to the Group (761,353)
Additions 420,857
Changes in equity of associates accounted for using equity method 7,347
Net assets attributable to the Group, December 31 210,328
Impairment loss (210,328)
Net assets attributable to the Group $ -
The Group recognized the share loss of NCC based on its shareholding ratio that had exceeded the equity. As a result, no investment balance accounted for using equity method was recognized, and the Group also ceased to recognize any further losses. Therefore, the abovementioned summary financial information only discloses the information for the year ended December 31, 2019.
2) Summary of CTCI-HDEC’s financial figures
December 31, 2020 December 31, 2019Current assets $ 134,590 138,338
Non-current assets 340,131 338,735
Current liabilities (533) (2,264)
Non-current liabilities - -
Net assets $ 474,188 474,809Net assets attributable to non-controlling interests $ 232,352 232,656Net assets attributable to investee owners $ 241,836 242,153
2020 2019Revenue $ 1,462 75,987Net loss/ Comprehensive income $ (621) (4,634)Comprehensive income attributable to non-controlling interests $ (304) (2,271)
Comprehensive income attributable to investee owners $ (317) (2,363)
Net assets attributable to the Group, January 1 $ 232,656 234,927
Comprehensive income attributable to the Group (304) (2,271)
Net assets attributable to the Group, December 31 $ 232,352 232,656
114
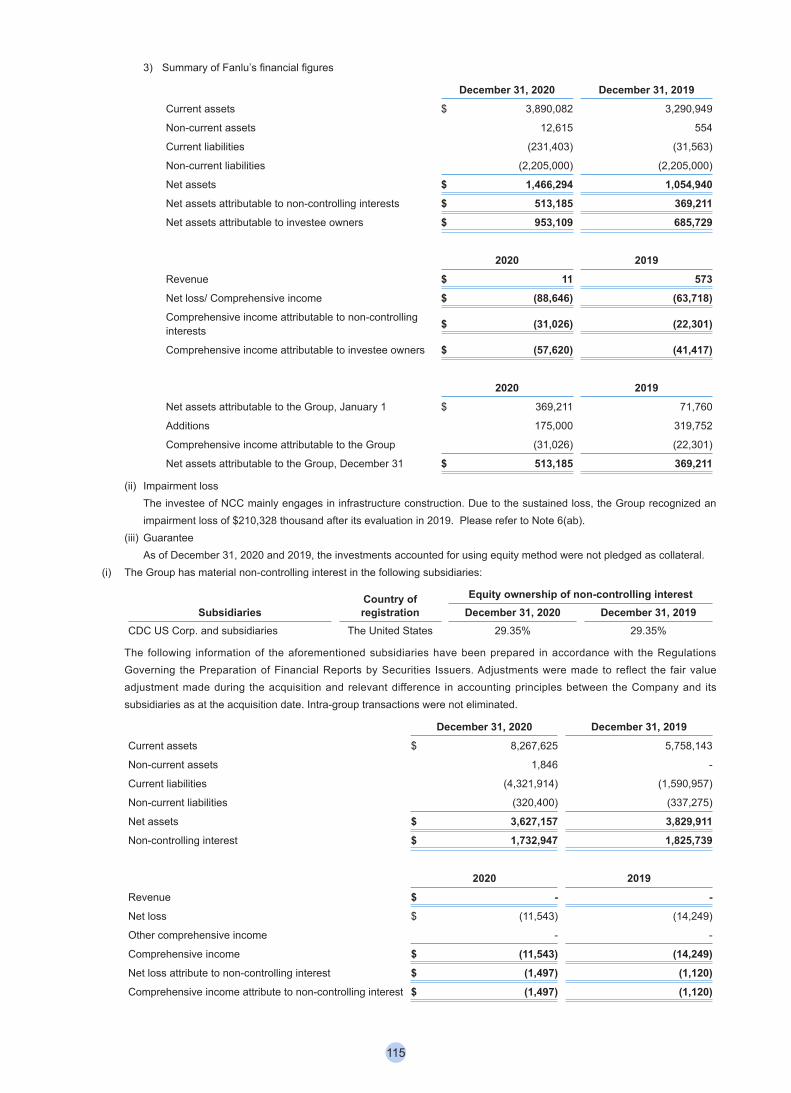
3) Summary of Fanlu’s financial figures
December 31, 2020 December 31, 2019Current assets $ 3,890,082 3,290,949
Non-current assets 12,615 554
Current liabilities (231,403) (31,563)
Non-current liabilities (2,205,000) (2,205,000)
Net assets $ 1,466,294 1,054,940Net assets attributable to non-controlling interests $ 513,185 369,211Net assets attributable to investee owners $ 953,109 685,729
2020 2019Revenue $ 11 573Net loss/ Comprehensive income $ (88,646) (63,718)Comprehensive income attributable to non-controlling interests $ (31,026) (22,301)
Comprehensive income attributable to investee owners $ (57,620) (41,417)
2020 2019Net assets attributable to the Group, January 1 $ 369,211 71,760
Additions 175,000 319,752
Comprehensive income attributable to the Group (31,026) (22,301)
Net assets attributable to the Group, December 31 $ 513,185 369,211
(ii) Impairment lossThe investee of NCC mainly engages in infrastructure construction. Due to the sustained loss, the Group recognized an impairment loss of $210,328 thousand after its evaluation in 2019. Please refer to Note 6(ab).
(iii) GuaranteeAs of December 31, 2020 and 2019, the investments accounted for using equity method were not pledged as collateral.
(i) The Group has material non-controlling interest in the following subsidiaries:
SubsidiariesCountry of registration
Equity ownership of non-controlling interestDecember 31, 2020 December 31, 2019
CDC US Corp. and subsidiaries The United States 29.35% 29.35%
The following information of the aforementioned subsidiaries have been prepared in accordance with the Regulations Governing the Preparation of Financial Reports by Securities Issuers. Adjustments were made to reflect the fair value adjustment made during the acquisition and relevant difference in accounting principles between the Company and its subsidiaries as at the acquisition date. Intra-group transactions were not eliminated.
December 31, 2020 December 31, 2019Current assets $ 8,267,625 5,758,143
Non-current assets 1,846 -
Current liabilities (4,321,914) (1,590,957)
Non-current liabilities (320,400) (337,275)
Net assets $ 3,627,157 3,829,911Non-controlling interest $ 1,732,947 1,825,739
2020 2019Revenue $ - -Net loss $ (11,543) (14,249)
Other comprehensive income - -
Comprehensive income $ (11,543) (14,249)Net loss attribute to non-controlling interest $ (1,497) (1,120)Comprehensive income attribute to non-controlling interest $ (1,497) (1,120)
115
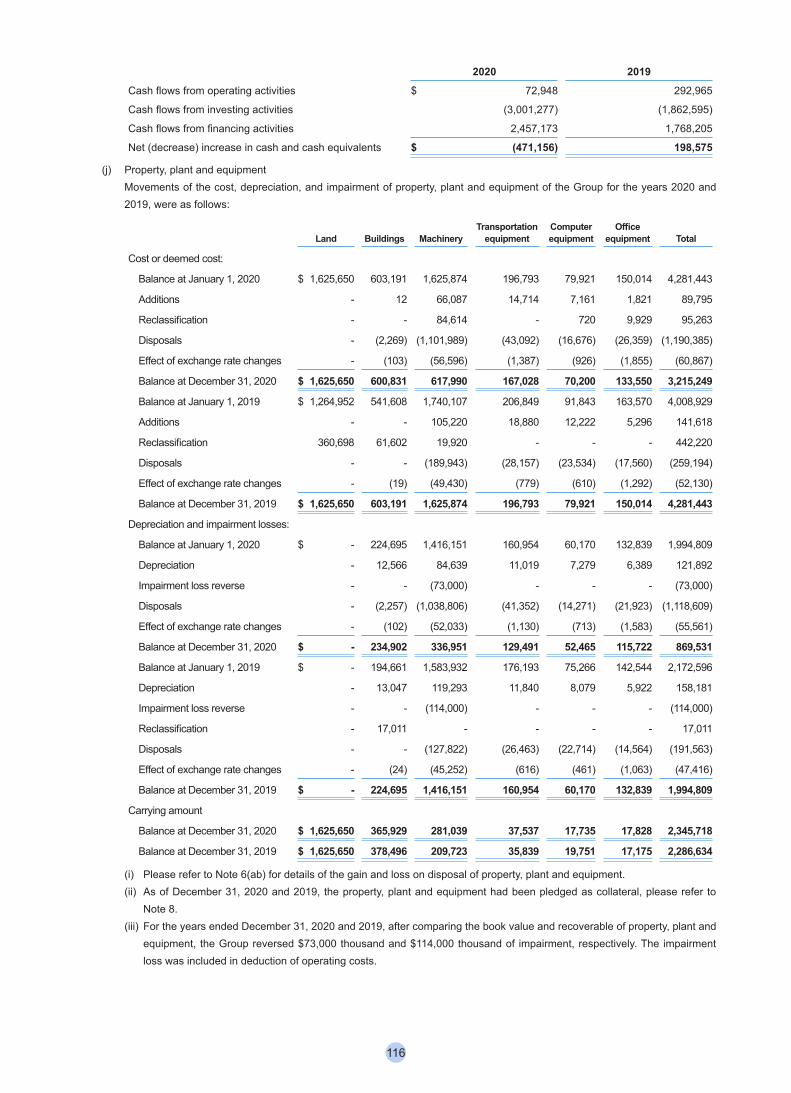
2020 2019Cash flows from operating activities $ 72,948 292,965
Cash flows from investing activities (3,001,277) (1,862,595)
Cash flows from financing activities 2,457,173 1,768,205
Net (decrease) increase in cash and cash equivalents $ (471,156) 198,575
(j) Property, plant and equipment Movements of the cost, depreciation, and impairment of property, plant and equipment of the Group for the years 2020 and 2019, were as follows:
Land Buildings MachineryTransportation
equipmentComputer equipment
Office equipment Total
Cost or deemed cost:
Balance at January 1, 2020 $ 1,625,650 603,191 1,625,874 196,793 79,921 150,014 4,281,443
Additions - 12 66,087 14,714 7,161 1,821 89,795
Reclassification - - 84,614 - 720 9,929 95,263
Disposals - (2,269) (1,101,989) (43,092) (16,676) (26,359) (1,190,385)
Effect of exchange rate changes - (103) (56,596) (1,387) (926) (1,855) (60,867)
Balance at December 31, 2020 $ 1,625,650 600,831 617,990 167,028 70,200 133,550 3,215,249
Balance at January 1, 2019 $ 1,264,952 541,608 1,740,107 206,849 91,843 163,570 4,008,929
Additions - - 105,220 18,880 12,222 5,296 141,618
Reclassification 360,698 61,602 19,920 - - - 442,220
Disposals - - (189,943) (28,157) (23,534) (17,560) (259,194)
Effect of exchange rate changes - (19) (49,430) (779) (610) (1,292) (52,130)
Balance at December 31, 2019 $ 1,625,650 603,191 1,625,874 196,793 79,921 150,014 4,281,443
Depreciation and impairment losses:
Balance at January 1, 2020 $ - 224,695 1,416,151 160,954 60,170 132,839 1,994,809
Depreciation - 12,566 84,639 11,019 7,279 6,389 121,892
Impairment loss reverse - - (73,000) - - - (73,000)
Disposals - (2,257) (1,038,806) (41,352) (14,271) (21,923) (1,118,609)
Effect of exchange rate changes - (102) (52,033) (1,130) (713) (1,583) (55,561)
Balance at December 31, 2020 $ - 234,902 336,951 129,491 52,465 115,722 869,531
Balance at January 1, 2019 $ - 194,661 1,583,932 176,193 75,266 142,544 2,172,596
Depreciation - 13,047 119,293 11,840 8,079 5,922 158,181
Impairment loss reverse - - (114,000) - - - (114,000)
Reclassification - 17,011 - - - - 17,011
Disposals - - (127,822) (26,463) (22,714) (14,564) (191,563)
Effect of exchange rate changes - (24) (45,252) (616) (461) (1,063) (47,416)
Balance at December 31, 2019 $ - 224,695 1,416,151 160,954 60,170 132,839 1,994,809
Carrying amount
Balance at December 31, 2020 $ 1,625,650 365,929 281,039 37,537 17,735 17,828 2,345,718
Balance at December 31, 2019 $ 1,625,650 378,496 209,723 35,839 19,751 17,175 2,286,634
(i) Please refer to Note 6(ab) for details of the gain and loss on disposal of property, plant and equipment.(ii) As of December 31, 2020 and 2019, the property, plant and equipment had been pledged as collateral, please refer to
Note 8.(iii) For the years ended December 31, 2020 and 2019, after comparing the book value and recoverable of property, plant and
equipment, the Group reversed $73,000 thousand and $114,000 thousand of impairment, respectively. The impairment loss was included in deduction of operating costs.
116
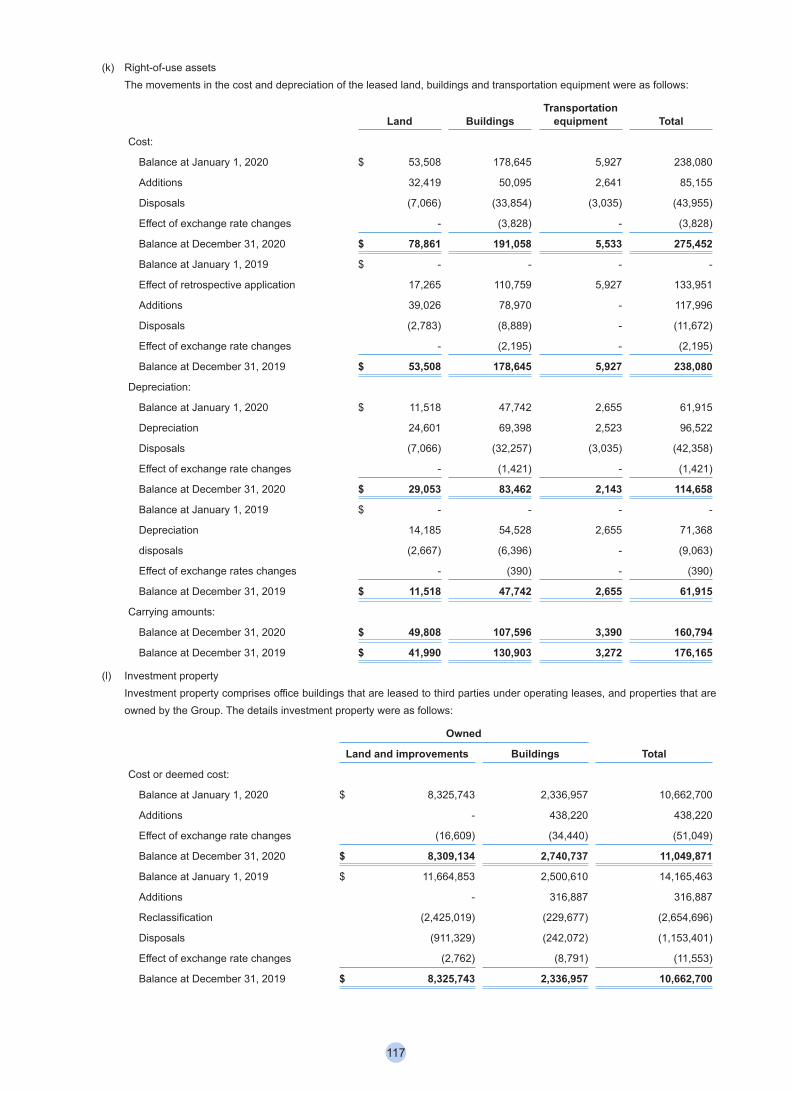
(k) Right-of-use assets The movements in the cost and depreciation of the leased land, buildings and transportation equipment were as follows:
Land BuildingsTransportation
equipment Total
Cost:
Balance at January 1, 2020 $ 53,508 178,645 5,927 238,080
Additions 32,419 50,095 2,641 85,155
Disposals (7,066) (33,854) (3,035) (43,955)
Effect of exchange rate changes - (3,828) - (3,828)
Balance at December 31, 2020 $ 78,861 191,058 5,533 275,452
Balance at January 1, 2019 $ - - - -
Effect of retrospective application 17,265 110,759 5,927 133,951
Additions 39,026 78,970 - 117,996
Disposals (2,783) (8,889) - (11,672)
Effect of exchange rate changes - (2,195) - (2,195)
Balance at December 31, 2019 $ 53,508 178,645 5,927 238,080
Depreciation:
Balance at January 1, 2020 $ 11,518 47,742 2,655 61,915
Depreciation 24,601 69,398 2,523 96,522
Disposals (7,066) (32,257) (3,035) (42,358)
Effect of exchange rate changes - (1,421) - (1,421)
Balance at December 31, 2020 $ 29,053 83,462 2,143 114,658
Balance at January 1, 2019 $ - - - -
Depreciation 14,185 54,528 2,655 71,368
disposals (2,667) (6,396) - (9,063)
Effect of exchange rates changes - (390) - (390)
Balance at December 31, 2019 $ 11,518 47,742 2,655 61,915
Carrying amounts:
Balance at December 31, 2020 $ 49,808 107,596 3,390 160,794
Balance at December 31, 2019 $ 41,990 130,903 3,272 176,165
(l) Investment property Investment property comprises office buildings that are leased to third parties under operating leases, and properties that are owned by the Group. The details investment property were as follows:
Owned
Land and improvements Buildings Total
Cost or deemed cost:
Balance at January 1, 2020 $ 8,325,743 2,336,957 10,662,700
Additions - 438,220 438,220
Effect of exchange rate changes (16,609) (34,440) (51,049)
Balance at December 31, 2020 $ 8,309,134 2,740,737 11,049,871
Balance at January 1, 2019 $ 11,664,853 2,500,610 14,165,463
Additions - 316,887 316,887
Reclassification (2,425,019) (229,677) (2,654,696)
Disposals (911,329) (242,072) (1,153,401)
Effect of exchange rate changes (2,762) (8,791) (11,553)
Balance at December 31, 2019 $ 8,325,743 2,336,957 10,662,700
117
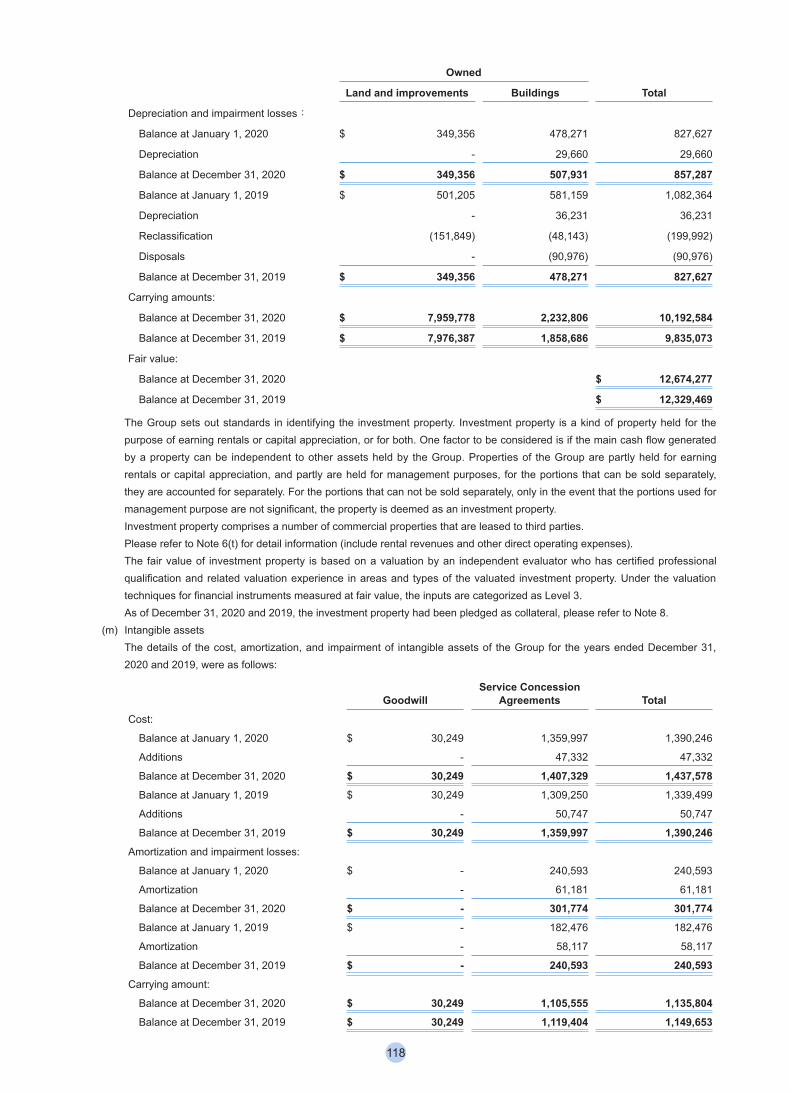
Owned
Land and improvements Buildings Total
Depreciation and impairment losses:
Balance at January 1, 2020 $ 349,356 478,271 827,627
Depreciation - 29,660 29,660
Balance at December 31, 2020 $ 349,356 507,931 857,287
Balance at January 1, 2019 $ 501,205 581,159 1,082,364
Depreciation - 36,231 36,231
Reclassification (151,849) (48,143) (199,992)
Disposals - (90,976) (90,976)
Balance at December 31, 2019 $ 349,356 478,271 827,627
Carrying amounts:
Balance at December 31, 2020 $ 7,959,778 2,232,806 10,192,584
Balance at December 31, 2019 $ 7,976,387 1,858,686 9,835,073
Fair value:
Balance at December 31, 2020 $ 12,674,277
Balance at December 31, 2019 $ 12,329,469
The Group sets out standards in identifying the investment property. Investment property is a kind of property held for the purpose of earning rentals or capital appreciation, or for both. One factor to be considered is if the main cash flow generated by a property can be independent to other assets held by the Group. Properties of the Group are partly held for earning rentals or capital appreciation, and partly are held for management purposes, for the portions that can be sold separately, they are accounted for separately. For the portions that can not be sold separately, only in the event that the portions used for management purpose are not significant, the property is deemed as an investment property.Investment property comprises a number of commercial properties that are leased to third parties.Please refer to Note 6(t) for detail information (include rental revenues and other direct operating expenses).The fair value of investment property is based on a valuation by an independent evaluator who has certified professional qualification and related valuation experience in areas and types of the valuated investment property. Under the valuation techniques for financial instruments measured at fair value, the inputs are categorized as Level 3.As of December 31, 2020 and 2019, the investment property had been pledged as collateral, please refer to Note 8.
(m) Intangible assets The details of the cost, amortization, and impairment of intangible assets of the Group for the years ended December 31, 2020 and 2019, were as follows:
GoodwillService Concession
Agreements TotalCost:
Balance at January 1, 2020 $ 30,249 1,359,997 1,390,246
Additions - 47,332 47,332
Balance at December 31, 2020 $ 30,249 1,407,329 1,437,578 Balance at January 1, 2019 $ 30,249 1,309,250 1,339,499
Additions - 50,747 50,747
Balance at December 31, 2019 $ 30,249 1,359,997 1,390,246Amortization and impairment losses:
Balance at January 1, 2020 $ - 240,593 240,593
Amortization - 61,181 61,181
Balance at December 31, 2020 $ - 301,774 301,774 Balance at January 1, 2019 $ - 182,476 182,476
Amortization - 58,117 58,117
Balance at December 31, 2019 $ - 240,593 240,593Carrying amount:
Balance at December 31, 2020 $ 30,249 1,105,555 1,135,804 Balance at December 31, 2019 $ 30,249 1,119,404 1,149,653
118
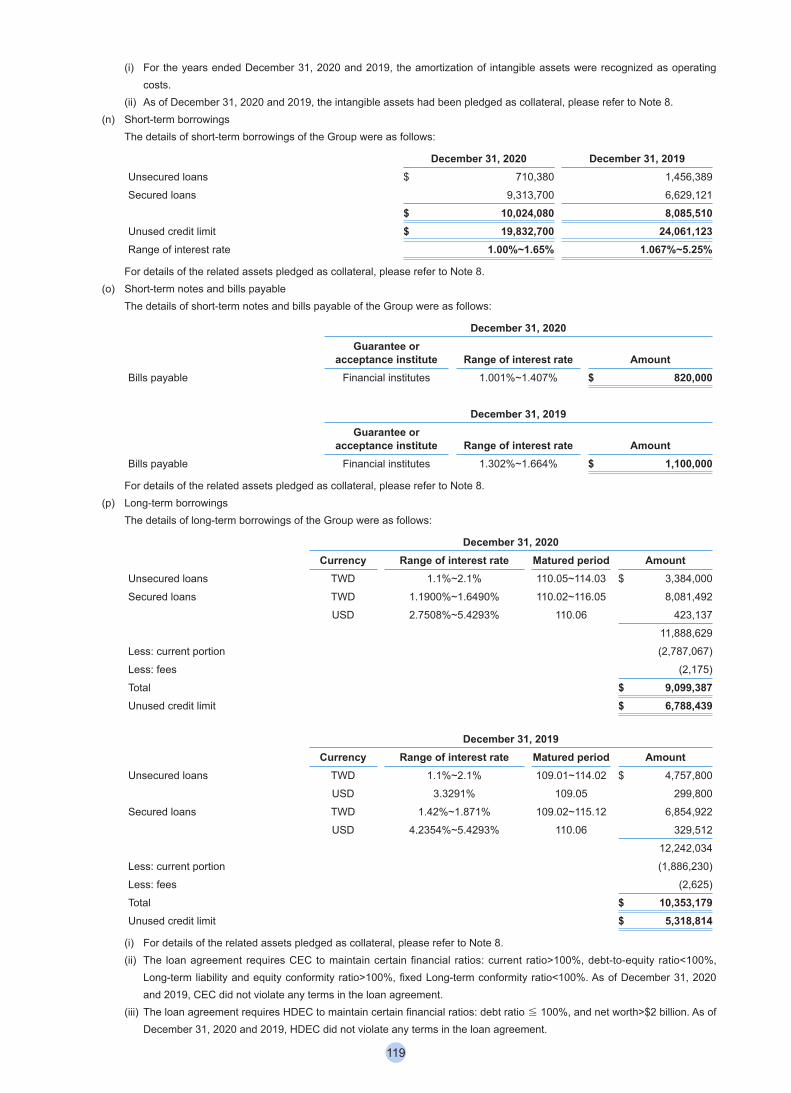
(i) For the years ended December 31, 2020 and 2019, the amortization of intangible assets were recognized as operating costs.
(ii) As of December 31, 2020 and 2019, the intangible assets had been pledged as collateral, please refer to Note 8.(n) Short-term borrowings
The details of short-term borrowings of the Group were as follows:
December 31, 2020 December 31, 2019Unsecured loans $ 710,380 1,456,389
Secured loans 9,313,700 6,629,121
$ 10,024,080 8,085,510Unused credit limit $ 19,832,700 24,061,123Range of interest rate 1.00%~1.65% 1.067%~5.25%
For details of the related assets pledged as collateral, please refer to Note 8.(o) Short-term notes and bills payable
The details of short-term notes and bills payable of the Group were as follows:
December 31, 2020Guarantee or
acceptance institute Range of interest rate AmountBills payable Financial institutes 1.001%~1.407% $ 820,000
December 31, 2019Guarantee or
acceptance institute Range of interest rate AmountBills payable Financial institutes 1.302%~1.664% $ 1,100,000
For details of the related assets pledged as collateral, please refer to Note 8.(p) Long-term borrowings
The details of long-term borrowings of the Group were as follows:
December 31, 2020Currency Range of interest rate Matured period Amount
Unsecured loans TWD 1.1%~2.1% 110.05~114.03 $ 3,384,000
Secured loans TWD 1.1900%~1.6490% 110.02~116.05 8,081,492
USD 2.7508%~5.4293% 110.06 423,137
11,888,629
Less: current portion (2,787,067)
Less: fees (2,175)
Total $ 9,099,387Unused credit limit $ 6,788,439
December 31, 2019Currency Range of interest rate Matured period Amount
Unsecured loans TWD 1.1%~2.1% 109.01~114.02 $ 4,757,800
USD 3.3291% 109.05 299,800
Secured loans TWD 1.42%~1.871% 109.02~115.12 6,854,922
USD 4.2354%~5.4293% 110.06 329,512
12,242,034
Less: current portion (1,886,230)
Less: fees (2,625)
Total $ 10,353,179Unused credit limit $ 5,318,814
(i) For details of the related assets pledged as collateral, please refer to Note 8.(ii) The loan agreement requires CEC to maintain certain financial ratios: current ratio>100%, debt-to-equity ratio<100%,
Long-term liability and equity conformity ratio>100%, fixed Long-term conformity ratio<100%. As of December 31, 2020 and 2019, CEC did not violate any terms in the loan agreement.
(iii) The loan agreement requires HDEC to maintain certain financial ratios: debt ratio≦ 100%, and net worth>$2 billion. As of December 31, 2020 and 2019, HDEC did not violate any terms in the loan agreement.
119
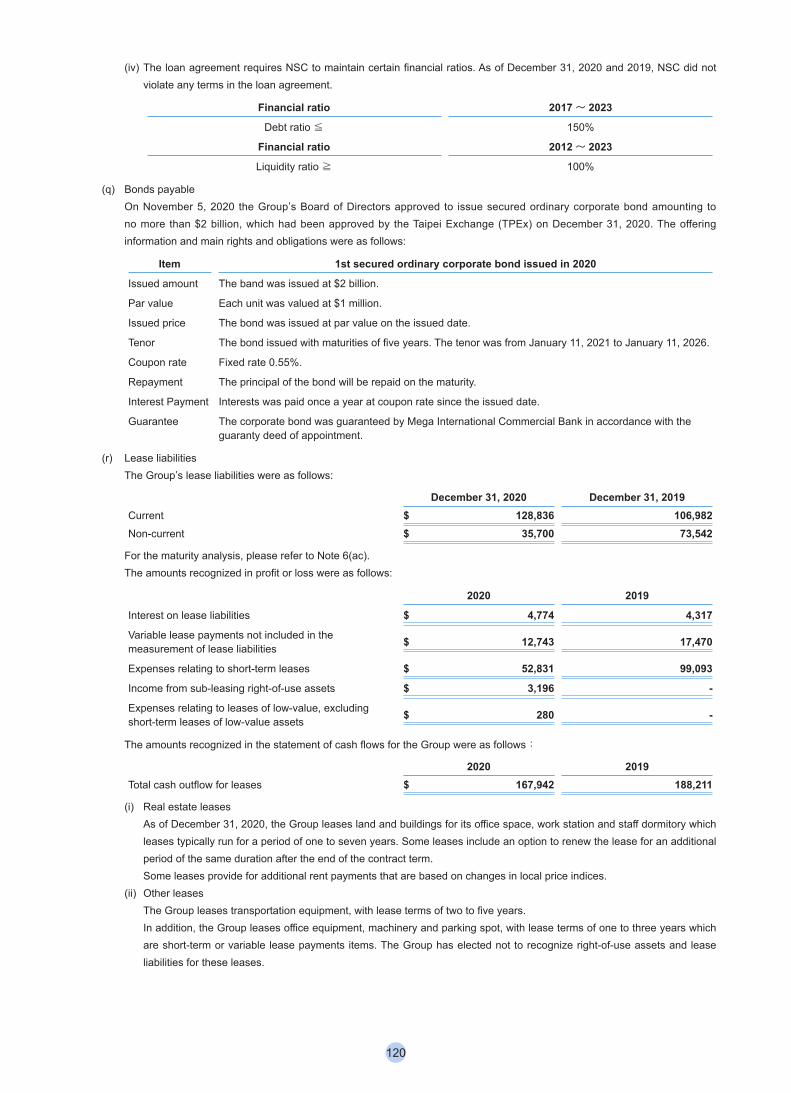
(iv) The loan agreement requires NSC to maintain certain financial ratios. As of December 31, 2020 and 2019, NSC did not violate any terms in the loan agreement.
Financial ratio 2017~ 2023
Debt ratio≦ 150%
Financial ratio 2012~ 2023
Liquidity ratio≧ 100%
(q) Bonds payableOn November 5, 2020 the Group’s Board of Directors approved to issue secured ordinary corporate bond amounting to no more than $2 billion, which had been approved by the Taipei Exchange (TPEx) on December 31, 2020. The offering information and main rights and obligations were as follows:
Item 1st secured ordinary corporate bond issued in 2020
Issued amount The band was issued at $2 billion.
Par value Each unit was valued at $1 million.
Issued price The bond was issued at par value on the issued date.
Tenor The bond issued with maturities of five years. The tenor was from January 11, 2021 to January 11, 2026.
Coupon rate Fixed rate 0.55%.
Repayment The principal of the bond will be repaid on the maturity.
Interest Payment Interests was paid once a year at coupon rate since the issued date.
Guarantee The corporate bond was guaranteed by Mega International Commercial Bank in accordance with the guaranty deed of appointment.
(r) Lease liabilities The Group’s lease liabilities were as follows:
December 31, 2020 December 31, 2019Current $ 128,836 106,982Non-current $ 35,700 73,542
For the maturity analysis, please refer to Note 6(ac).The amounts recognized in profit or loss were as follows:
2020 2019
Interest on lease liabilities $ 4,774 4,317
Variable lease payments not included in the measurement of lease liabilities $ 12,743 17,470
Expenses relating to short-term leases $ 52,831 99,093
Income from sub-leasing right-of-use assets $ 3,196 -
Expenses relating to leases of low-value, excluding short-term leases of low-value assets $ 280 -
The amounts recognized in the statement of cash flows for the Group were as follows:
2020 2019Total cash outflow for leases $ 167,942 188,211
(i) Real estate leasesAs of December 31, 2020, the Group leases land and buildings for its office space, work station and staff dormitory which leases typically run for a period of one to seven years. Some leases include an option to renew the lease for an additional period of the same duration after the end of the contract term. Some leases provide for additional rent payments that are based on changes in local price indices.
(ii) Other leasesThe Group leases transportation equipment, with lease terms of two to five years.In addition, the Group leases office equipment, machinery and parking spot, with lease terms of one to three years which are short-term or variable lease payments items. The Group has elected not to recognize right-of-use assets and lease liabilities for these leases.
120
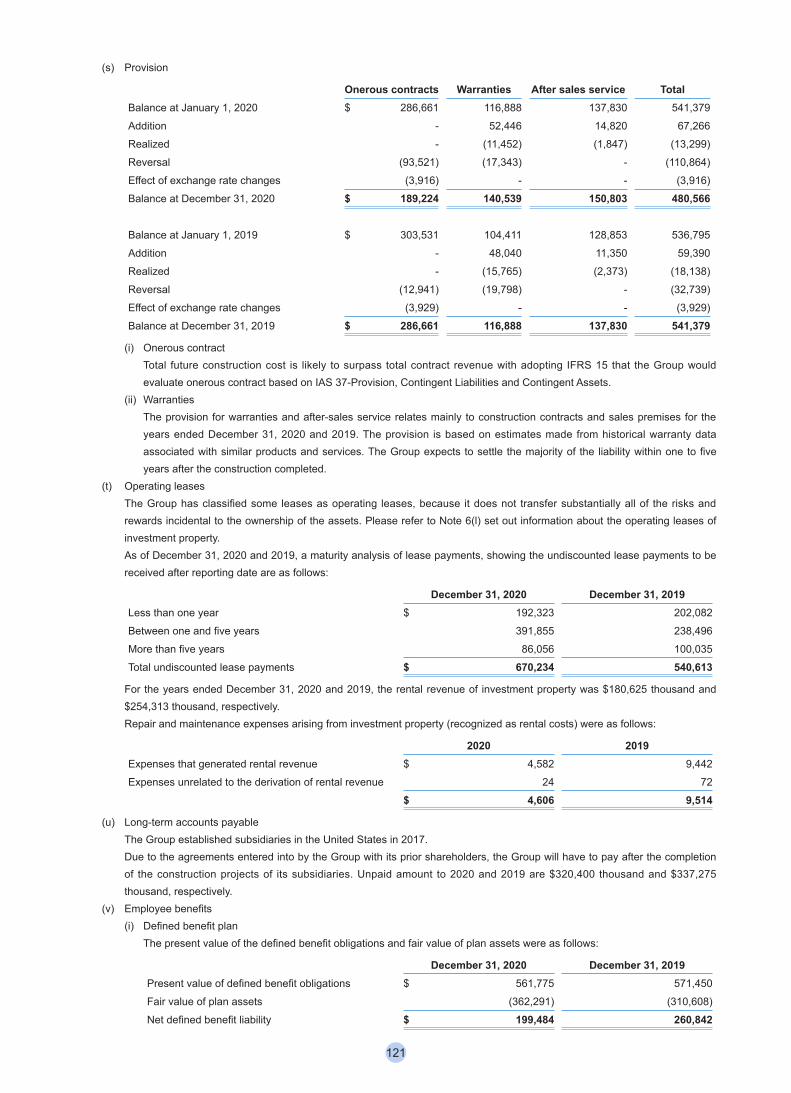
(s) Provision
Onerous contracts Warranties After sales service TotalBalance at January 1, 2020 $ 286,661 116,888 137,830 541,379
Addition - 52,446 14,820 67,266
Realized - (11,452) (1,847) (13,299)
Reversal (93,521) (17,343) - (110,864)
Effect of exchange rate changes (3,916) - - (3,916)
Balance at December 31, 2020 $ 189,224 140,539 150,803 480,566
Balance at January 1, 2019 $ 303,531 104,411 128,853 536,795
Addition - 48,040 11,350 59,390
Realized - (15,765) (2,373) (18,138)
Reversal (12,941) (19,798) - (32,739)
Effect of exchange rate changes (3,929) - - (3,929)
Balance at December 31, 2019 $ 286,661 116,888 137,830 541,379
(i) Onerous contractTotal future construction cost is likely to surpass total contract revenue with adopting IFRS 15 that the Group would evaluate onerous contract based on IAS 37-Provision, Contingent Liabilities and Contingent Assets.
(ii) WarrantiesThe provision for warranties and after-sales service relates mainly to construction contracts and sales premises for the years ended December 31, 2020 and 2019. The provision is based on estimates made from historical warranty data associated with similar products and services. The Group expects to settle the majority of the liability within one to five years after the construction completed.
(t) Operating leases The Group has classified some leases as operating leases, because it does not transfer substantially all of the risks and rewards incidental to the ownership of the assets. Please refer to Note 6(l) set out information about the operating leases of investment property.As of December 31, 2020 and 2019, a maturity analysis of lease payments, showing the undiscounted lease payments to be received after reporting date are as follows:
December 31, 2020 December 31, 2019Less than one year $ 192,323 202,082
Between one and five years 391,855 238,496
More than five years 86,056 100,035
Total undiscounted lease payments $ 670,234 540,613
For the years ended December 31, 2020 and 2019, the rental revenue of investment property was $180,625 thousand and $254,313 thousand, respectively.Repair and maintenance expenses arising from investment property (recognized as rental costs) were as follows:
2020 2019Expenses that generated rental revenue $ 4,582 9,442
Expenses unrelated to the derivation of rental revenue 24 72
$ 4,606 9,514
(u) Long-term accounts payable The Group established subsidiaries in the United States in 2017. Due to the agreements entered into by the Group with its prior shareholders, the Group will have to pay after the completion of the construction projects of its subsidiaries. Unpaid amount to 2020 and 2019 are $320,400 thousand and $337,275 thousand, respectively.
(v) Employee benefits (i) Defined benefit plan
The present value of the defined benefit obligations and fair value of plan assets were as follows:
December 31, 2020 December 31, 2019Present value of defined benefit obligations $ 561,775 571,450
Fair value of plan assets (362,291) (310,608)
Net defined benefit liability $ 199,484 260,842
121
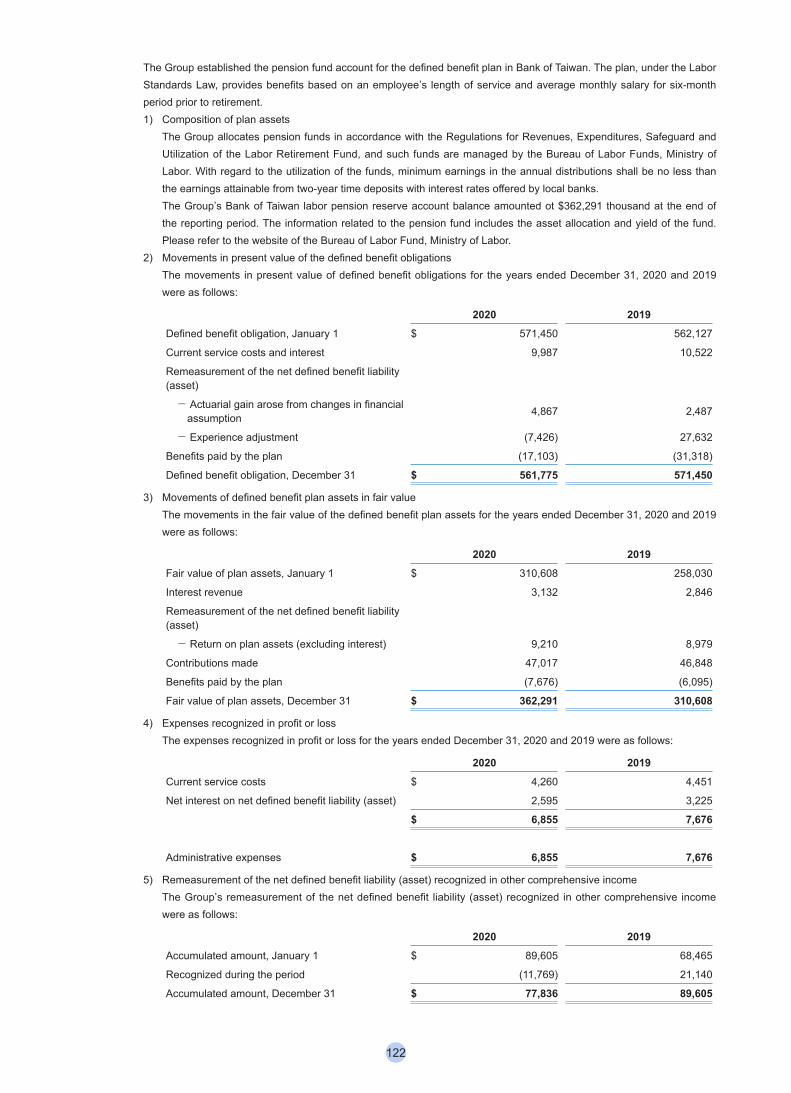
The Group established the pension fund account for the defined benefit plan in Bank of Taiwan. The plan, under the Labor Standards Law, provides benefits based on an employee’s length of service and average monthly salary for six-month period prior to retirement. 1) Composition of plan assets
The Group allocates pension funds in accordance with the Regulations for Revenues, Expenditures, Safeguard and Utilization of the Labor Retirement Fund, and such funds are managed by the Bureau of Labor Funds, Ministry of Labor. With regard to the utilization of the funds, minimum earnings in the annual distributions shall be no less than the earnings attainable from two-year time deposits with interest rates offered by local banks.The Group’s Bank of Taiwan labor pension reserve account balance amounted ot $362,291 thousand at the end of the reporting period. The information related to the pension fund includes the asset allocation and yield of the fund. Please refer to the website of the Bureau of Labor Fund, Ministry of Labor.
2) Movements in present value of the defined benefit obligationsThe movements in present value of defined benefit obligations for the years ended December 31, 2020 and 2019 were as follows:
2020 2019Defined benefit obligation, January 1 $ 571,450 562,127
Current service costs and interest 9,987 10,522
Remeasurement of the net defined benefit liability (asset)
- Actuarial gain arose from changes in financial assumption 4,867 2,487
- Experience adjustment (7,426) 27,632
Benefits paid by the plan (17,103) (31,318)
Defined benefit obligation, December 31 $ 561,775 571,450
3) Movements of defined benefit plan assets in fair valueThe movements in the fair value of the defined benefit plan assets for the years ended December 31, 2020 and 2019 were as follows:
2020 2019Fair value of plan assets, January 1 $ 310,608 258,030
Interest revenue 3,132 2,846
Remeasurement of the net defined benefit liability (asset)
- Return on plan assets (excluding interest) 9,210 8,979
Contributions made 47,017 46,848
Benefits paid by the plan (7,676) (6,095)
Fair value of plan assets, December 31 $ 362,291 310,608
4) Expenses recognized in profit or lossThe expenses recognized in profit or loss for the years ended December 31, 2020 and 2019 were as follows:
2020 2019Current service costs $ 4,260 4,451
Net interest on net defined benefit liability (asset) 2,595 3,225
$ 6,855 7,676
Administrative expenses $ 6,855 7,676
5) Remeasurement of the net defined benefit liability (asset) recognized in other comprehensive incomeThe Group’s remeasurement of the net defined benefit liability (asset) recognized in other comprehensive income were as follows:
2020 2019Accumulated amount, January 1 $ 89,605 68,465
Recognized during the period (11,769) 21,140
Accumulated amount, December 31 $ 77,836 89,605
122
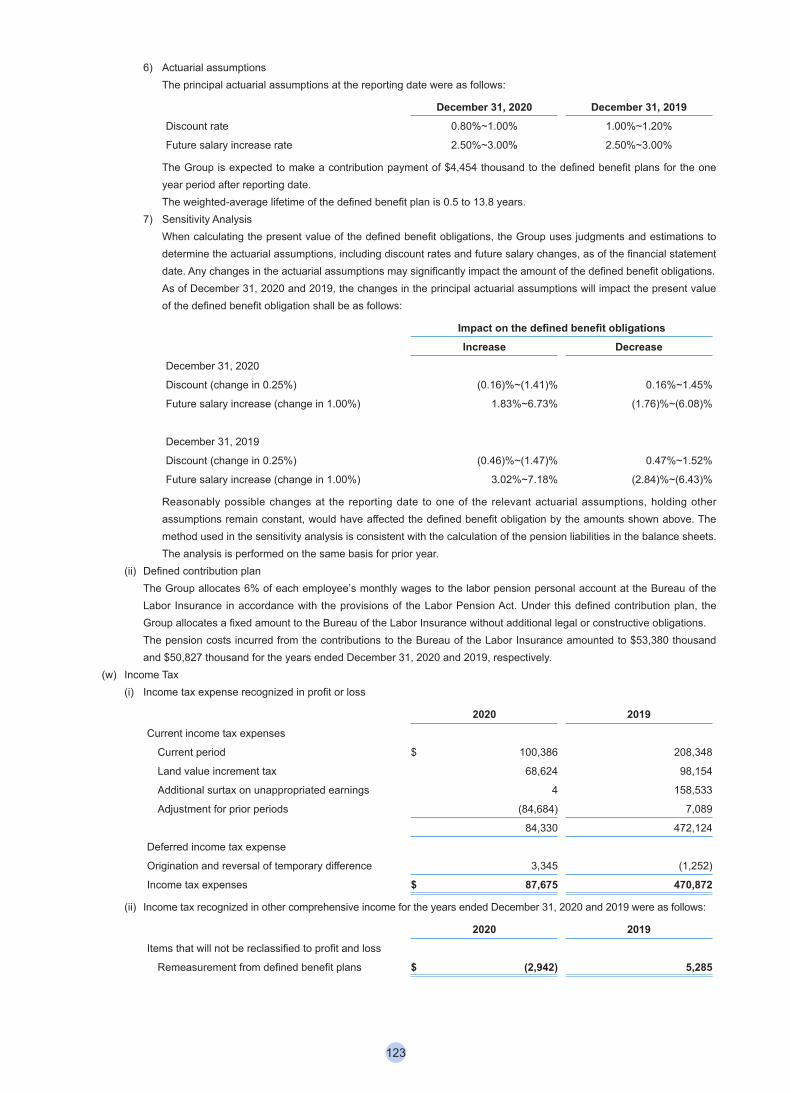
6) Actuarial assumptionsThe principal actuarial assumptions at the reporting date were as follows:
December 31, 2020 December 31, 2019Discount rate 0.80%~1.00% 1.00%~1.20%
Future salary increase rate 2.50%~3.00% 2.50%~3.00%
The Group is expected to make a contribution payment of $4,454 thousand to the defined benefit plans for the one year period after reporting date.The weighted-average lifetime of the defined benefit plan is 0.5 to 13.8 years.
7) Sensitivity AnalysisWhen calculating the present value of the defined benefit obligations, the Group uses judgments and estimations to determine the actuarial assumptions, including discount rates and future salary changes, as of the financial statement date. Any changes in the actuarial assumptions may significantly impact the amount of the defined benefit obligations.As of December 31, 2020 and 2019, the changes in the principal actuarial assumptions will impact the present value of the defined benefit obligation shall be as follows:
Impact on the defined benefit obligationsIncrease Decrease
December 31, 2020
Discount (change in 0.25%) (0.16)%~(1.41)% 0.16%~1.45%
Future salary increase (change in 1.00%) 1.83%~6.73% (1.76)%~(6.08)%
December 31, 2019
Discount (change in 0.25%) (0.46)%~(1.47)% 0.47%~1.52%
Future salary increase (change in 1.00%) 3.02%~7.18% (2.84)%~(6.43)%
Reasonably possible changes at the reporting date to one of the relevant actuarial assumptions, holding other assumptions remain constant, would have affected the defined benefit obligation by the amounts shown above. The method used in the sensitivity analysis is consistent with the calculation of the pension liabilities in the balance sheets.The analysis is performed on the same basis for prior year.
(ii) Defined contribution planThe Group allocates 6% of each employee’s monthly wages to the labor pension personal account at the Bureau of the Labor Insurance in accordance with the provisions of the Labor Pension Act. Under this defined contribution plan, the Group allocates a fixed amount to the Bureau of the Labor Insurance without additional legal or constructive obligations.The pension costs incurred from the contributions to the Bureau of the Labor Insurance amounted to $53,380 thousand and $50,827 thousand for the years ended December 31, 2020 and 2019, respectively.
(w) Income Tax (i) Income tax expense recognized in profit or loss
2020 2019Current income tax expenses
Current period $ 100,386 208,348
Land value increment tax 68,624 98,154
Additional surtax on unappropriated earnings 4 158,533
Adjustment for prior periods (84,684) 7,089
84,330 472,124
Deferred income tax expense
Origination and reversal of temporary difference 3,345 (1,252)
Income tax expenses $ 87,675 470,872
(ii) Income tax recognized in other comprehensive income for the years ended December 31, 2020 and 2019 were as follows:
2020 2019Items that will not be reclassified to profit and loss
Remeasurement from defined benefit plans $ (2,942) 5,285
123
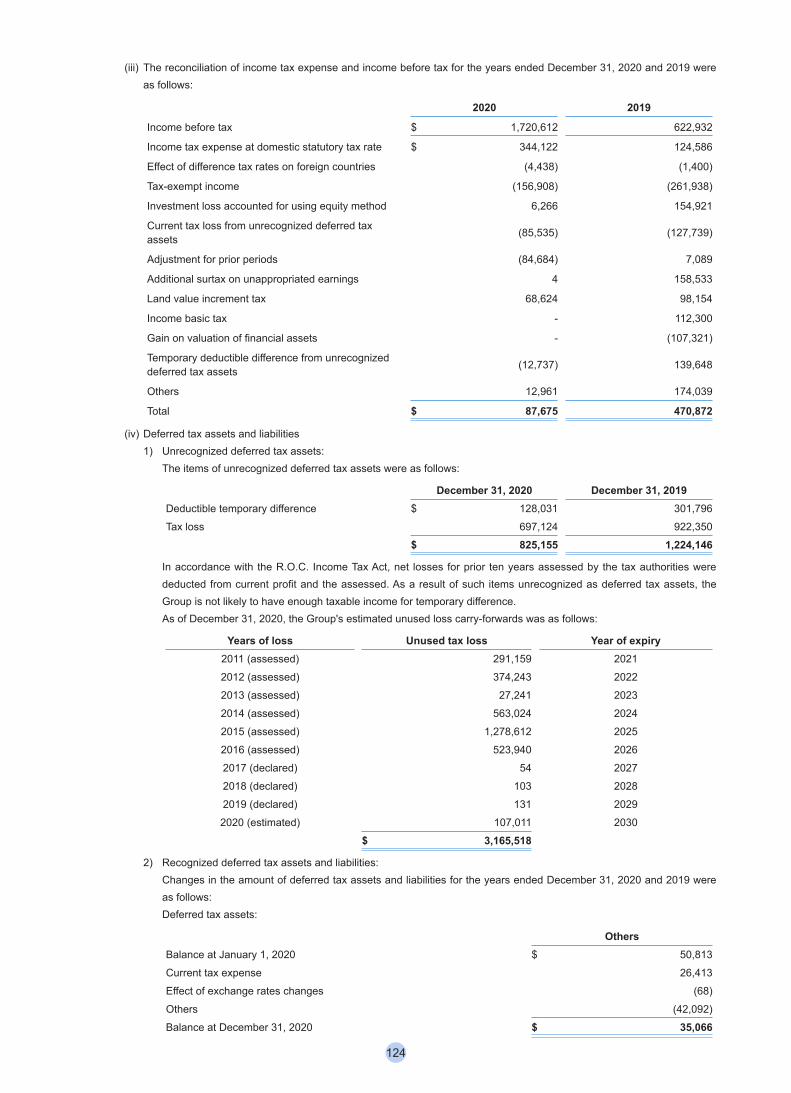
(iii) The reconciliation of income tax expense and income before tax for the years ended December 31, 2020 and 2019 were as follows:
2020 2019
Income before tax $ 1,720,612 622,932
Income tax expense at domestic statutory tax rate $ 344,122 124,586
Effect of difference tax rates on foreign countries (4,438) (1,400)
Tax-exempt income (156,908) (261,938)
Investment loss accounted for using equity method 6,266 154,921
Current tax loss from unrecognized deferred tax assets (85,535) (127,739)
Adjustment for prior periods (84,684) 7,089
Additional surtax on unappropriated earnings 4 158,533
Land value increment tax 68,624 98,154
Income basic tax - 112,300
Gain on valuation of financial assets - (107,321)
Temporary deductible difference from unrecognized deferred tax assets (12,737) 139,648
Others 12,961 174,039
Total $ 87,675 470,872
(iv) Deferred tax assets and liabilities1) Unrecognized deferred tax assets:
The items of unrecognized deferred tax assets were as follows:
December 31, 2020 December 31, 2019Deductible temporary difference $ 128,031 301,796
Tax loss 697,124 922,350
$ 825,155 1,224,146
In accordance with the R.O.C. Income Tax Act, net losses for prior ten years assessed by the tax authorities were deducted from current profit and the assessed. As a result of such items unrecognized as deferred tax assets, the Group is not likely to have enough taxable income for temporary difference.As of December 31, 2020, the Group's estimated unused loss carry-forwards was as follows:
Years of loss Unused tax loss Year of expiry2011 (assessed) 291,159 2021
2012 (assessed) 374,243 2022
2013 (assessed) 27,241 2023
2014 (assessed) 563,024 2024
2015 (assessed) 1,278,612 2025
2016 (assessed) 523,940 2026
2017 (declared) 54 2027
2018 (declared) 103 2028
2019 (declared) 131 2029
2020 (estimated) 107,011 2030
$ 3,165,518
2) Recognized deferred tax assets and liabilities:Changes in the amount of deferred tax assets and liabilities for the years ended December 31, 2020 and 2019 were as follows:Deferred tax assets:
OthersBalance at January 1, 2020 $ 50,813
Current tax expense 26,413
Effect of exchange rates changes (68)
Others (42,092)
Balance at December 31, 2020 $ 35,066
124
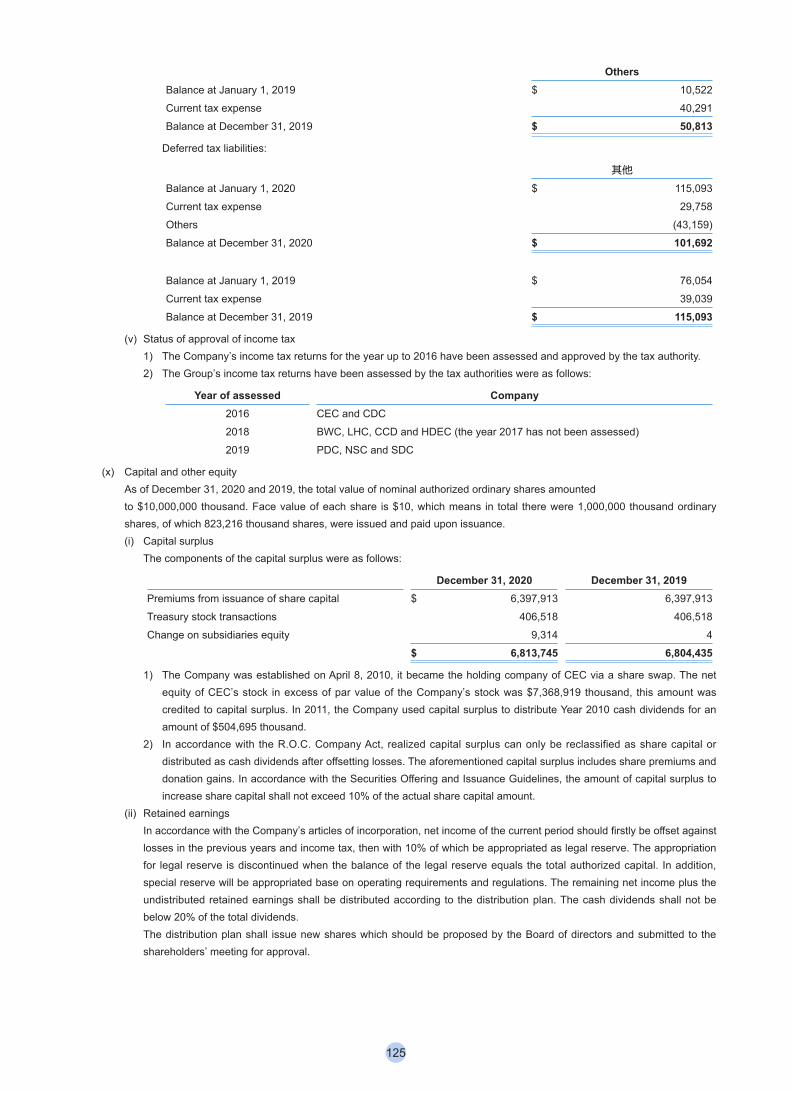
OthersBalance at January 1, 2019 $ 10,522
Current tax expense 40,291
Balance at December 31, 2019 $ 50,813
Deferred tax liabilities:
其他
Balance at January 1, 2020 $ 115,093
Current tax expense 29,758
Others (43,159)
Balance at December 31, 2020 $ 101,692
Balance at January 1, 2019 $ 76,054
Current tax expense 39,039
Balance at December 31, 2019 $ 115,093
(v) Status of approval of income tax1) The Company’s income tax returns for the year up to 2016 have been assessed and approved by the tax authority. 2) The Group’s income tax returns have been assessed by the tax authorities were as follows:
Year of assessed Company2016 CEC and CDC
2018 BWC, LHC, CCD and HDEC (the year 2017 has not been assessed)
2019 PDC, NSC and SDC
(x) Capital and other equity As of December 31, 2020 and 2019, the total value of nominal authorized ordinary shares amountedto $10,000,000 thousand. Face value of each share is $10, which means in total there were 1,000,000 thousand ordinary shares, of which 823,216 thousand shares, were issued and paid upon issuance.(i) Capital surplus
The components of the capital surplus were as follows:
December 31, 2020 December 31, 2019Premiums from issuance of share capital $ 6,397,913 6,397,913
Treasury stock transactions 406,518 406,518
Change on subsidiaries equity 9,314 4
$ 6,813,745 6,804,435
1) The Company was established on April 8, 2010, it became the holding company of CEC via a share swap. The net equity of CEC’s stock in excess of par value of the Company’s stock was $7,368,919 thousand, this amount was credited to capital surplus. In 2011, the Company used capital surplus to distribute Year 2010 cash dividends for an amount of $504,695 thousand.
2) In accordance with the R.O.C. Company Act, realized capital surplus can only be reclassified as share capital or distributed as cash dividends after offsetting losses. The aforementioned capital surplus includes share premiums and donation gains. In accordance with the Securities Offering and Issuance Guidelines, the amount of capital surplus to increase share capital shall not exceed 10% of the actual share capital amount.
(ii) Retained earningsIn accordance with the Company’s articles of incorporation, net income of the current period should firstly be offset against losses in the previous years and income tax, then with 10% of which be appropriated as legal reserve. The appropriation for legal reserve is discontinued when the balance of the legal reserve equals the total authorized capital. In addition, special reserve will be appropriated base on operating requirements and regulations. The remaining net income plus the undistributed retained earnings shall be distributed according to the distribution plan. The cash dividends shall not be below 20% of the total dividends. The distribution plan shall issue new shares which should be proposed by the Board of directors and submitted to the shareholders’ meeting for approval.
125
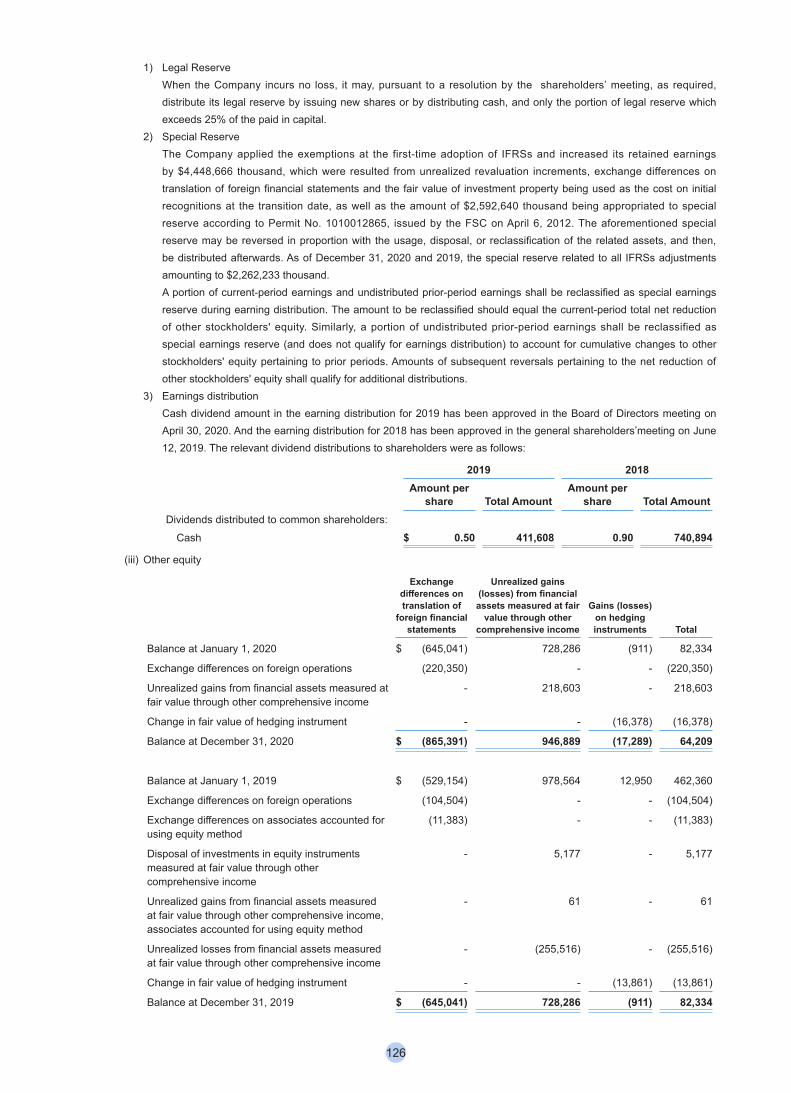
1) Legal ReserveWhen the Company incurs no loss, it may, pursuant to a resolution by the shareholders’ meeting, as required, distribute its legal reserve by issuing new shares or by distributing cash, and only the portion of legal reserve which exceeds 25% of the paid in capital.
2) Special ReserveThe Company applied the exemptions at the first-time adoption of IFRSs and increased its retained earnings by $4,448,666 thousand, which were resulted from unrealized revaluation increments, exchange differences on translation of foreign financial statements and the fair value of investment property being used as the cost on initial recognitions at the transition date, as well as the amount of $2,592,640 thousand being appropriated to special reserve according to Permit No. 1010012865, issued by the FSC on April 6, 2012. The aforementioned special reserve may be reversed in proportion with the usage, disposal, or reclassification of the related assets, and then, be distributed afterwards. As of December 31, 2020 and 2019, the special reserve related to all IFRSs adjustments amounting to $2,262,233 thousand.A portion of current-period earnings and undistributed prior-period earnings shall be reclassified as special earnings reserve during earning distribution. The amount to be reclassified should equal the current-period total net reduction of other stockholders' equity. Similarly, a portion of undistributed prior-period earnings shall be reclassified as special earnings reserve (and does not qualify for earnings distribution) to account for cumulative changes to other stockholders' equity pertaining to prior periods. Amounts of subsequent reversals pertaining to the net reduction of other stockholders' equity shall qualify for additional distributions.
3) Earnings distributionCash dividend amount in the earning distribution for 2019 has been approved in the Board of Directors meeting on April 30, 2020. And the earning distribution for 2018 has been approved in the general shareholders’meeting on June 12, 2019. The relevant dividend distributions to shareholders were as follows:
2019 2018Amount per
share Total AmountAmount per
share Total AmountDividends distributed to common shareholders: Cash $ 0.50 411,608 0.90 740,894
(iii) Other equity
Exchange differences on translation of
foreign financial statements
Unrealized gains (losses) from financial assets measured at fair
value through other comprehensive income
Gains (losses) on hedging instruments Total
Balance at January 1, 2020 $ (645,041) 728,286 (911) 82,334
Exchange differences on foreign operations (220,350) - - (220,350)
Unrealized gains from financial assets measured at fair value through other comprehensive income
- 218,603 - 218,603
Change in fair value of hedging instrument - - (16,378) (16,378)
Balance at December 31, 2020 $ (865,391) 946,889 (17,289) 64,209
Balance at January 1, 2019 $ (529,154) 978,564 12,950 462,360
Exchange differences on foreign operations (104,504) - - (104,504)
Exchange differences on associates accounted for using equity method
(11,383) - - (11,383)
Disposal of investments in equity instruments measured at fair value through other comprehensive income
- 5,177 - 5,177
Unrealized gains from financial assets measured at fair value through other comprehensive income, associates accounted for using equity method
- 61 - 61
Unrealized losses from financial assets measured at fair value through other comprehensive income
- (255,516) - (255,516)
Change in fair value of hedging instrument - - (13,861) (13,861)
Balance at December 31, 2019 $ (645,041) 728,286 (911) 82,334
126
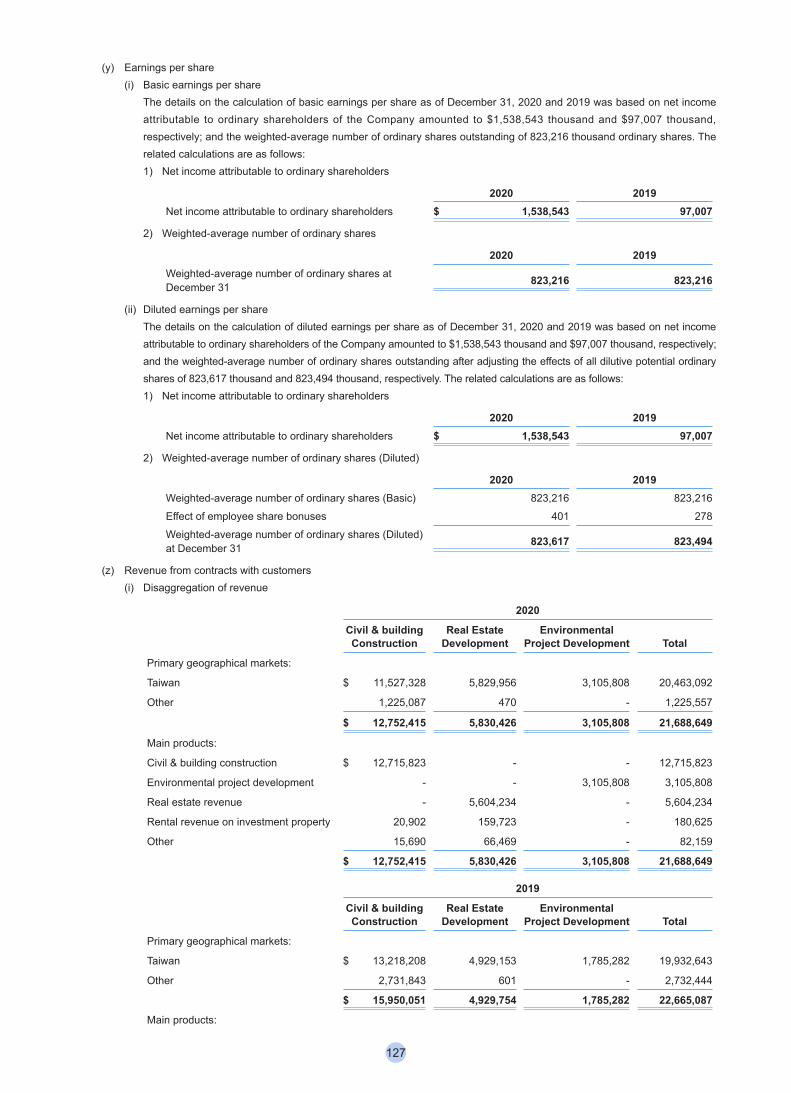
(y) Earnings per share(i) Basic earnings per share
The details on the calculation of basic earnings per share as of December 31, 2020 and 2019 was based on net income attributable to ordinary shareholders of the Company amounted to $1,538,543 thousand and $97,007 thousand, respectively; and the weighted-average number of ordinary shares outstanding of 823,216 thousand ordinary shares. The related calculations are as follows:1) Net income attributable to ordinary shareholders
2020 2019Net income attributable to ordinary shareholders $ 1,538,543 97,007
2) Weighted-average number of ordinary shares
2020 2019Weighted-average number of ordinary shares at December 31 823,216 823,216
(ii) Diluted earnings per share The details on the calculation of diluted earnings per share as of December 31, 2020 and 2019 was based on net income attributable to ordinary shareholders of the Company amounted to $1,538,543 thousand and $97,007 thousand, respectively; and the weighted-average number of ordinary shares outstanding after adjusting the effects of all dilutive potential ordinary shares of 823,617 thousand and 823,494 thousand, respectively. The related calculations are as follows:1) Net income attributable to ordinary shareholders
2020 2019Net income attributable to ordinary shareholders $ 1,538,543 97,007
2) Weighted-average number of ordinary shares (Diluted)
2020 2019Weighted-average number of ordinary shares (Basic) 823,216 823,216
Effect of employee share bonuses 401 278
Weighted-average number of ordinary shares (Diluted)at December 31 823,617 823,494
(z) Revenue from contracts with customers(i) Disaggregation of revenue
2020
Civil & building Construction
Real Estate Development
Environmental Project Development Total
Primary geographical markets:
Taiwan $ 11,527,328 5,829,956 3,105,808 20,463,092
Other 1,225,087 470 - 1,225,557
$ 12,752,415 5,830,426 3,105,808 21,688,649
Main products:
Civil & building construction $ 12,715,823 - - 12,715,823
Environmental project development - - 3,105,808 3,105,808
Real estate revenue - 5,604,234 - 5,604,234
Rental revenue on investment property 20,902 159,723 - 180,625
Other 15,690 66,469 - 82,159
$ 12,752,415 5,830,426 3,105,808 21,688,649
2019
Civil & building Construction
Real Estate Development
Environmental Project Development Total
Primary geographical markets:
Taiwan $ 13,218,208 4,929,153 1,785,282 19,932,643
Other 2,731,843 601 - 2,732,444
$ 15,950,051 4,929,754 1,785,282 22,665,087
Main products:
127
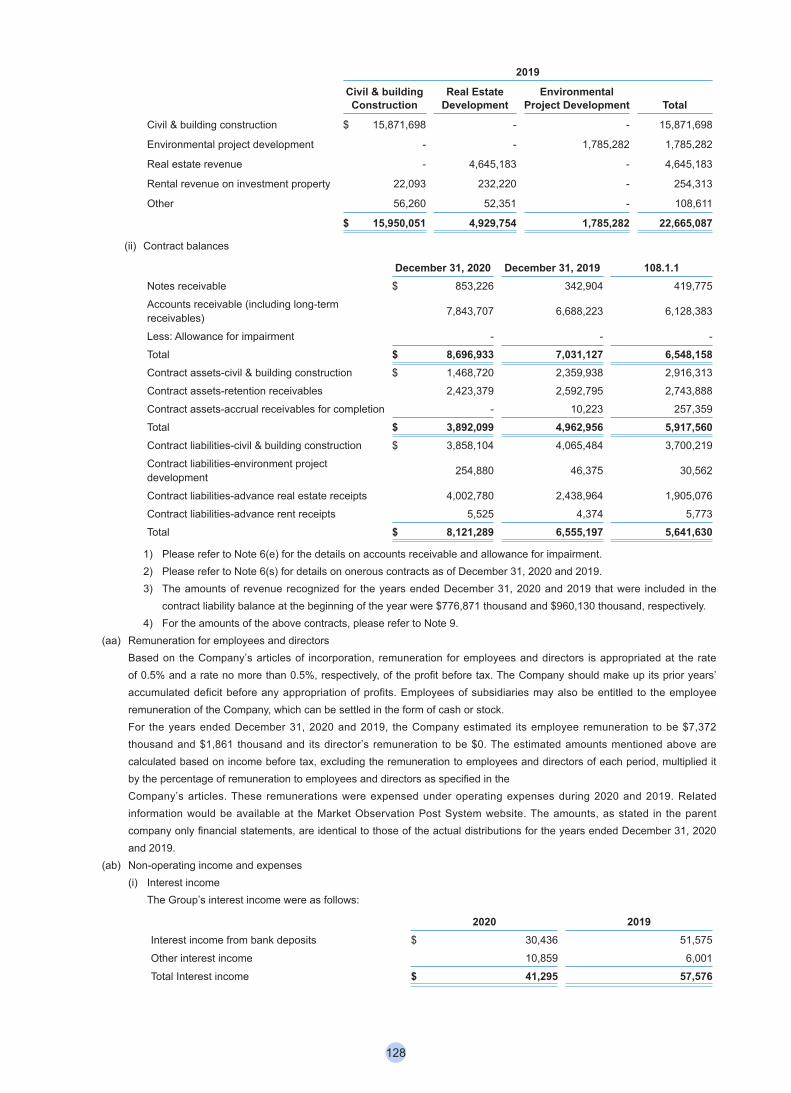
2019
Civil & building Construction
Real Estate Development
Environmental Project Development Total
Civil & building construction $ 15,871,698 - - 15,871,698
Environmental project development - - 1,785,282 1,785,282
Real estate revenue - 4,645,183 - 4,645,183
Rental revenue on investment property 22,093 232,220 - 254,313
Other 56,260 52,351 - 108,611
$ 15,950,051 4,929,754 1,785,282 22,665,087
(ii) Contract balances
December 31, 2020 December 31, 2019 108.1.1Notes receivable $ 853,226 342,904 419,775
Accounts receivable (including long-term receivables) 7,843,707 6,688,223 6,128,383
Less: Allowance for impairment - - -
Total $ 8,696,933 7,031,127 6,548,158Contract assets-civil & building construction $ 1,468,720 2,359,938 2,916,313
Contract assets-retention receivables 2,423,379 2,592,795 2,743,888
Contract assets-accrual receivables for completion - 10,223 257,359
Total $ 3,892,099 4,962,956 5,917,560Contract liabilities-civil & building construction $ 3,858,104 4,065,484 3,700,219
Contract liabilities-environment project development 254,880 46,375 30,562
Contract liabilities-advance real estate receipts 4,002,780 2,438,964 1,905,076
Contract liabilities-advance rent receipts 5,525 4,374 5,773
Total $ 8,121,289 6,555,197 5,641,630
1) Please refer to Note 6(e) for the details on accounts receivable and allowance for impairment. 2) Please refer to Note 6(s) for details on onerous contracts as of December 31, 2020 and 2019.3) The amounts of revenue recognized for the years ended December 31, 2020 and 2019 that were included in the
contract liability balance at the beginning of the year were $776,871 thousand and $960,130 thousand, respectively. 4) For the amounts of the above contracts, please refer to Note 9.
(aa) Remuneration for employees and directorsBased on the Company’s articles of incorporation, remuneration for employees and directors is appropriated at the rate of 0.5% and a rate no more than 0.5%, respectively, of the profit before tax. The Company should make up its prior years’ accumulated deficit before any appropriation of profits. Employees of subsidiaries may also be entitled to the employee remuneration of the Company, which can be settled in the form of cash or stock.For the years ended December 31, 2020 and 2019, the Company estimated its employee remuneration to be $7,372 thousand and $1,861 thousand and its director’s remuneration to be $0. The estimated amounts mentioned above are calculated based on income before tax, excluding the remuneration to employees and directors of each period, multiplied it by the percentage of remuneration to employees and directors as specified in theCompany’s articles. These remunerations were expensed under operating expenses during 2020 and 2019. Related information would be available at the Market Observation Post System website. The amounts, as stated in the parent company only financial statements, are identical to those of the actual distributions for the years ended December 31, 2020 and 2019.
(ab) Non-operating income and expenses (i) Interest income
The Group’s interest income were as follows:
2020 2019Interest income from bank deposits $ 30,436 51,575
Other interest income 10,859 6,001
Total Interest income $ 41,295 57,576
128
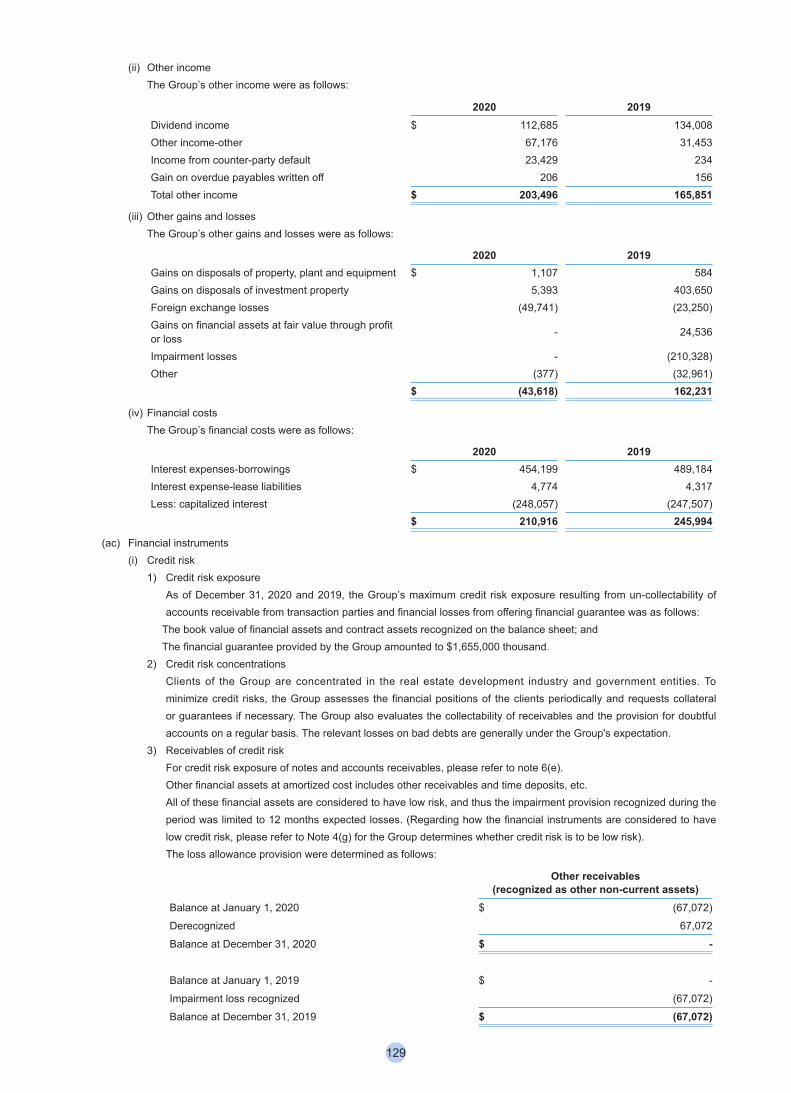
(ii) Other incomeThe Group’s other income were as follows:
2020 2019Dividend income $ 112,685 134,008Other income-other 67,176 31,453Income from counter-party default 23,429 234Gain on overdue payables written off 206 156Total other income $ 203,496 165,851
(iii) Other gains and lossesThe Group’s other gains and losses were as follows:
2020 2019Gains on disposals of property, plant and equipment $ 1,107 584Gains on disposals of investment property 5,393 403,650Foreign exchange losses (49,741) (23,250)Gains on financial assets at fair value through profit or loss - 24,536
Impairment losses - (210,328)Other (377) (32,961)
$ (43,618) 162,231
(iv) Financial costsThe Group’s financial costs were as follows:
2020 2019Interest expenses-borrowings $ 454,199 489,184Interest expense-lease liabilities 4,774 4,317Less: capitalized interest (248,057) (247,507)
$ 210,916 245,994
(ac) Financial instruments (i) Credit risk
1) Credit risk exposureAs of December 31, 2020 and 2019, the Group’s maximum credit risk exposure resulting from un-collectability of accounts receivable from transaction parties and financial losses from offering financial guarantee was as follows:
The book value of financial assets and contract assets recognized on the balance sheet; andThe financial guarantee provided by the Group amounted to $1,655,000 thousand.
2) Credit risk concentrationsClients of the Group are concentrated in the real estate development industry and government entities. To minimize credit risks, the Group assesses the financial positions of the clients periodically and requests collateral or guarantees if necessary. The Group also evaluates the collectability of receivables and the provision for doubtful accounts on a regular basis. The relevant losses on bad debts are generally under the Group's expectation.
3) Receivables of credit riskFor credit risk exposure of notes and accounts receivables, please refer to note 6(e).Other financial assets at amortized cost includes other receivables and time deposits, etc.All of these financial assets are considered to have low risk, and thus the impairment provision recognized during the period was limited to 12 months expected losses. (Regarding how the financial instruments are considered to have low credit risk, please refer to Note 4(g) for the Group determines whether credit risk is to be low risk). The loss allowance provision were determined as follows:
Other receivables (recognized as other non-current assets)
Balance at January 1, 2020 $ (67,072)
Derecognized 67,072
Balance at December 31, 2020 $ -
Balance at January 1, 2019 $ -
Impairment loss recognized (67,072)
Balance at December 31, 2019 $ (67,072)
129
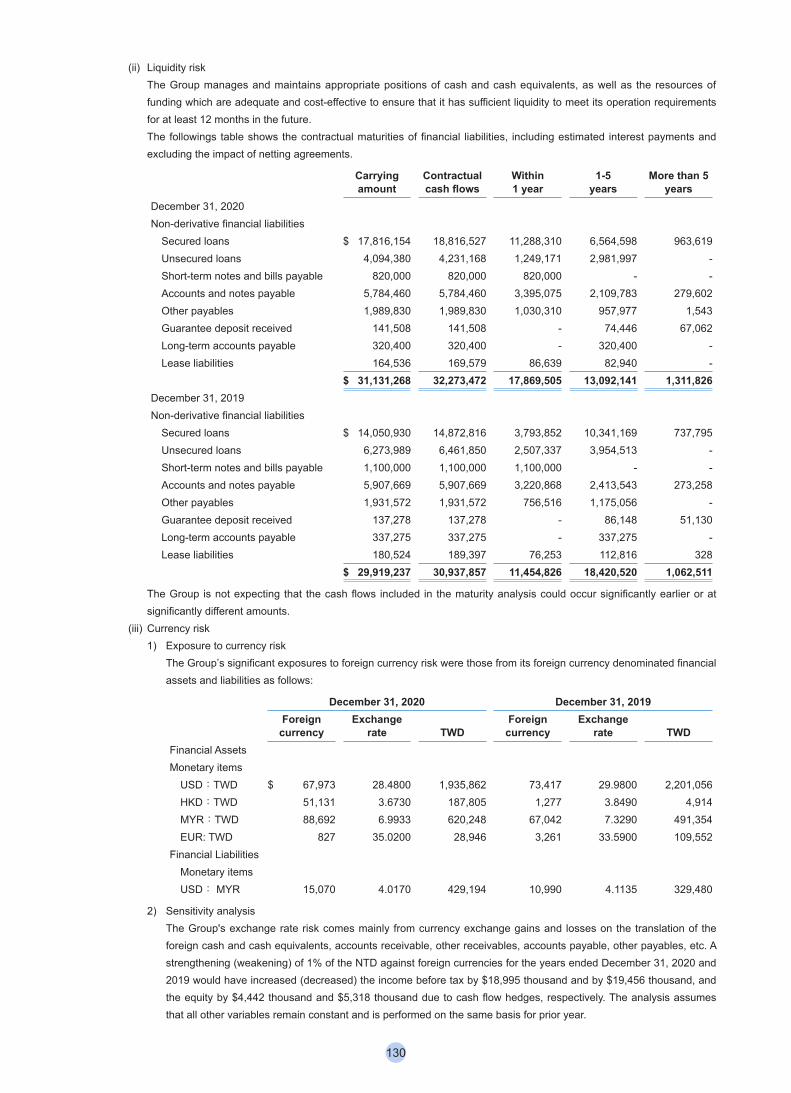
(ii) Liquidity riskThe Group manages and maintains appropriate positions of cash and cash equivalents, as well as the resources of funding which are adequate and cost-effective to ensure that it has sufficient liquidity to meet its operation requirements for at least 12 months in the future.The followings table shows the contractual maturities of financial liabilities, including estimated interest payments and excluding the impact of netting agreements.
Carrying amount
Contractual cash flows
Within 1 year
1-5 years
More than 5 years
December 31, 2020Non-derivative financial liabilities Secured loans $ 17,816,154 18,816,527 11,288,310 6,564,598 963,619 Unsecured loans 4,094,380 4,231,168 1,249,171 2,981,997 - Short-term notes and bills payable 820,000 820,000 820,000 - - Accounts and notes payable 5,784,460 5,784,460 3,395,075 2,109,783 279,602 Other payables 1,989,830 1,989,830 1,030,310 957,977 1,543 Guarantee deposit received 141,508 141,508 - 74,446 67,062 Long-term accounts payable 320,400 320,400 - 320,400 - Lease liabilities 164,536 169,579 86,639 82,940 -
$ 31,131,268 32,273,472 17,869,505 13,092,141 1,311,826December 31, 2019Non-derivative financial liabilities Secured loans $ 14,050,930 14,872,816 3,793,852 10,341,169 737,795 Unsecured loans 6,273,989 6,461,850 2,507,337 3,954,513 - Short-term notes and bills payable 1,100,000 1,100,000 1,100,000 - - Accounts and notes payable 5,907,669 5,907,669 3,220,868 2,413,543 273,258 Other payables 1,931,572 1,931,572 756,516 1,175,056 - Guarantee deposit received 137,278 137,278 - 86,148 51,130 Long-term accounts payable 337,275 337,275 - 337,275 - Lease liabilities 180,524 189,397 76,253 112,816 328
$ 29,919,237 30,937,857 11,454,826 18,420,520 1,062,511
The Group is not expecting that the cash flows included in the maturity analysis could occur significantly earlier or at significantly different amounts.
(iii) Currency risk1) Exposure to currency risk
The Group’s significant exposures to foreign currency risk were those from its foreign currency denominated financial assets and liabilities as follows:
December 31, 2020 December 31, 2019Foreign
currencyExchange
rate TWDForeign
currencyExchange
rate TWDFinancial AssetsMonetary items USD:TWD $ 67,973 28.4800 1,935,862 73,417 29.9800 2,201,056 HKD:TWD 51,131 3.6730 187,805 1,277 3.8490 4,914 MYR:TWD 88,692 6.9933 620,248 67,042 7.3290 491,354 EUR: TWD 827 35.0200 28,946 3,261 33.5900 109,552Financial Liabilities Monetary items USD: MYR 15,070 4.0170 429,194 10,990 4.1135 329,480
2) Sensitivity analysisThe Group's exchange rate risk comes mainly from currency exchange gains and losses on the translation of the foreign cash and cash equivalents, accounts receivable, other receivables, accounts payable, other payables, etc. A strengthening (weakening) of 1% of the NTD against foreign currencies for the years ended December 31, 2020 and 2019 would have increased (decreased) the income before tax by $18,995 thousand and by $19,456 thousand, and the equity by $4,442 thousand and $5,318 thousand due to cash flow hedges, respectively. The analysis assumes that all other variables remain constant and is performed on the same basis for prior year.
130
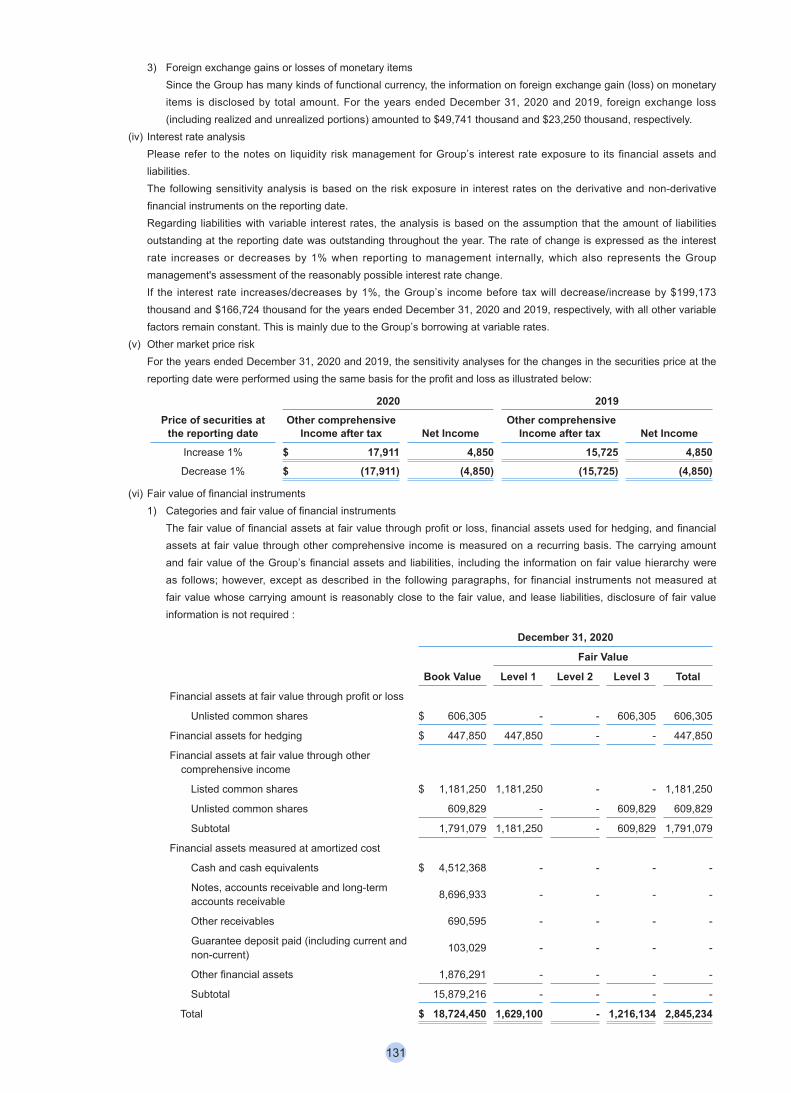
3) Foreign exchange gains or losses of monetary itemsSince the Group has many kinds of functional currency, the information on foreign exchange gain (loss) on monetary items is disclosed by total amount. For the years ended December 31, 2020 and 2019, foreign exchange loss (including realized and unrealized portions) amounted to $49,741 thousand and $23,250 thousand, respectively.
(iv) Interest rate analysisPlease refer to the notes on liquidity risk management for Group’s interest rate exposure to its financial assets and liabilities.The following sensitivity analysis is based on the risk exposure in interest rates on the derivative and non-derivative financial instruments on the reporting date.Regarding liabilities with variable interest rates, the analysis is based on the assumption that the amount of liabilities outstanding at the reporting date was outstanding throughout the year. The rate of change is expressed as the interest rate increases or decreases by 1% when reporting to management internally, which also represents the Group management's assessment of the reasonably possible interest rate change.If the interest rate increases/decreases by 1%, the Group’s income before tax will decrease/increase by $199,173 thousand and $166,724 thousand for the years ended December 31, 2020 and 2019, respectively, with all other variable factors remain constant. This is mainly due to the Group’s borrowing at variable rates.
(v) Other market price riskFor the years ended December 31, 2020 and 2019, the sensitivity analyses for the changes in the securities price at the reporting date were performed using the same basis for the profit and loss as illustrated below:
Price of securities at the reporting date
2020 2019Other comprehensive
Income after tax Net Income Other comprehensive
Income after tax Net Income Increase 1% $ 17,911 4,850 15,725 4,850Decrease 1% $ (17,911) (4,850) (15,725) (4,850)
(vi) Fair value of financial instruments1) Categories and fair value of financial instruments
The fair value of financial assets at fair value through profit or loss, financial assets used for hedging, and financial assets at fair value through other comprehensive income is measured on a recurring basis. The carrying amount and fair value of the Group’s financial assets and liabilities, including the information on fair value hierarchy were as follows; however, except as described in the following paragraphs, for financial instruments not measured at fair value whose carrying amount is reasonably close to the fair value, and lease liabilities, disclosure of fair value information is not required :
December 31, 2020
Fair Value
Book Value Level 1 Level 2 Level 3 Total
Financial assets at fair value through profit or loss
Unlisted common shares $ 606,305 - - 606,305 606,305
Financial assets for hedging $ 447,850 447,850 - - 447,850
Financial assets at fair value through other comprehensive income
Listed common shares $ 1,181,250 1,181,250 - - 1,181,250
Unlisted common shares 609,829 - - 609,829 609,829
Subtotal 1,791,079 1,181,250 - 609,829 1,791,079
Financial assets measured at amortized cost
Cash and cash equivalents $ 4,512,368 - - - -
Notes, accounts receivable and long-term accounts receivable 8,696,933 - - - -
Other receivables 690,595 - - - -
Guarantee deposit paid (including current and non-current) 103,029 - - - -
Other financial assets 1,876,291 - - - -
Subtotal 15,879,216 - - - -
Total $ 18,724,450 1,629,100 - 1,216,134 2,845,234
131
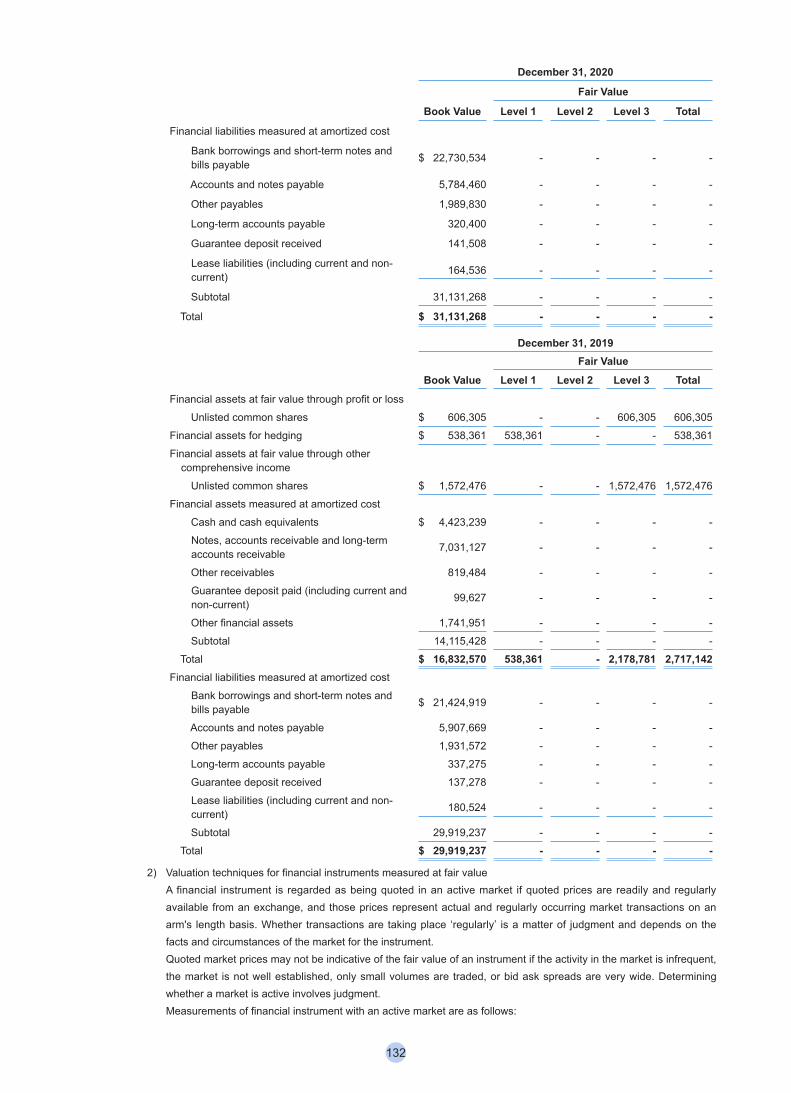
December 31, 2020
Fair Value
Book Value Level 1 Level 2 Level 3 Total
Financial liabilities measured at amortized cost
Bank borrowings and short-term notes and bills payable $ 22,730,534 - - - -
Accounts and notes payable 5,784,460 - - - -
Other payables 1,989,830 - - - -
Long-term accounts payable 320,400 - - - -
Guarantee deposit received 141,508 - - - -
Lease liabilities (including current and non-current) 164,536 - - - -
Subtotal 31,131,268 - - - -
Total $ 31,131,268 - - - -
December 31, 2019Fair Value
Book Value Level 1 Level 2 Level 3 TotalFinancial assets at fair value through profit or loss
Unlisted common shares $ 606,305 - - 606,305 606,305
Financial assets for hedging $ 538,361 538,361 - - 538,361
Financial assets at fair value through other comprehensive income
Unlisted common shares $ 1,572,476 - - 1,572,476 1,572,476
Financial assets measured at amortized cost
Cash and cash equivalents $ 4,423,239 - - - -
Notes, accounts receivable and long-term accounts receivable 7,031,127 - - - -
Other receivables 819,484 - - - -
Guarantee deposit paid (including current and non-current) 99,627 - - - -
Other financial assets 1,741,951 - - - - Subtotal 14,115,428 - - - - Total $ 16,832,570 538,361 - 2,178,781 2,717,142Financial liabilities measured at amortized cost
Bank borrowings and short-term notes and bills payable $ 21,424,919 - - - -
Accounts and notes payable 5,907,669 - - - -
Other payables 1,931,572 - - - -
Long-term accounts payable 337,275 - - - -
Guarantee deposit received 137,278 - - - -
Lease liabilities (including current and non-current) 180,524 - - - -
Subtotal 29,919,237 - - - - Total $ 29,919,237 - - - -
2) Valuation techniques for financial instruments measured at fair valueA financial instrument is regarded as being quoted in an active market if quoted prices are readily and regularly available from an exchange, and those prices represent actual and regularly occurring market transactions on an arm's length basis. Whether transactions are taking place ‘regularly’ is a matter of judgment and depends on the facts and circumstances of the market for the instrument.Quoted market prices may not be indicative of the fair value of an instrument if the activity in the market is infrequent, the market is not well established, only small volumes are traded, or bid ask spreads are very wide. Determining whether a market is active involves judgment.Measurements of financial instrument with an active market are as follows:
132
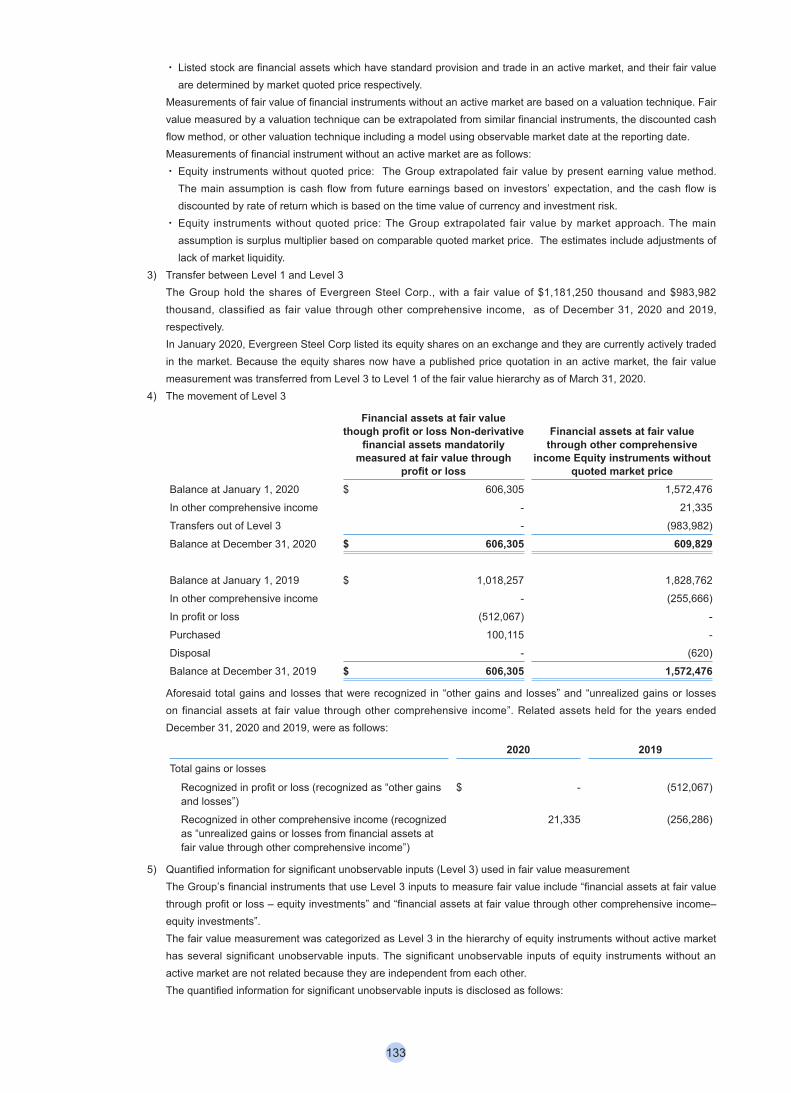
‧ Listed stock are financial assets which have standard provision and trade in an active market, and their fair value are determined by market quoted price respectively.
Measurements of fair value of financial instruments without an active market are based on a valuation technique. Fair value measured by a valuation technique can be extrapolated from similar financial instruments, the discounted cash flow method, or other valuation technique including a model using observable market date at the reporting date.Measurements of financial instrument without an active market are as follows:‧ Equity instruments without quoted price: The Group extrapolated fair value by present earning value method.
The main assumption is cash flow from future earnings based on investors’ expectation, and the cash flow is discounted by rate of return which is based on the time value of currency and investment risk.
‧ Equity instruments without quoted price: The Group extrapolated fair value by market approach. The main assumption is surplus multiplier based on comparable quoted market price. The estimates include adjustments of lack of market liquidity.
3) Transfer between Level 1 and Level 3The Group hold the shares of Evergreen Steel Corp., with a fair value of $1,181,250 thousand and $983,982 thousand, classified as fair value through other comprehensive income, as of December 31, 2020 and 2019, respectively.In January 2020, Evergreen Steel Corp listed its equity shares on an exchange and they are currently actively traded in the market. Because the equity shares now have a published price quotation in an active market, the fair value measurement was transferred from Level 3 to Level 1 of the fair value hierarchy as of March 31, 2020.
4) The movement of Level 3
Financial assets at fair value though profit or loss Non-derivative
financial assets mandatorily measured at fair value through
profit or loss
Financial assets at fair value through other comprehensive
income Equity instruments without quoted market price
Balance at January 1, 2020 $ 606,305 1,572,476
In other comprehensive income - 21,335
Transfers out of Level 3 - (983,982)
Balance at December 31, 2020 $ 606,305 609,829
Balance at January 1, 2019 $ 1,018,257 1,828,762
In other comprehensive income - (255,666)
In profit or loss (512,067) -
Purchased 100,115 -
Disposal - (620)
Balance at December 31, 2019 $ 606,305 1,572,476
Aforesaid total gains and losses that were recognized in “other gains and losses” and “unrealized gains or losses on financial assets at fair value through other comprehensive income”. Related assets held for the years ended December 31, 2020 and 2019, were as follows:
2020 2019Total gains or losses
Recognized in profit or loss (recognized as “other gains and losses”)
$ - (512,067)
Recognized in other comprehensive income (recognized as “unrealized gains or losses from financial assets at fair value through other comprehensive income”)
21,335 (256,286)
5) Quantified information for significant unobservable inputs (Level 3) used in fair value measurementThe Group’s financial instruments that use Level 3 inputs to measure fair value include “financial assets at fair value through profit or loss – equity investments” and “financial assets at fair value through other comprehensive income– equity investments”. The fair value measurement was categorized as Level 3 in the hierarchy of equity instruments without active market has several significant unobservable inputs. The significant unobservable inputs of equity instruments without an active market are not related because they are independent from each other.The quantified information for significant unobservable inputs is disclosed as follows:
133
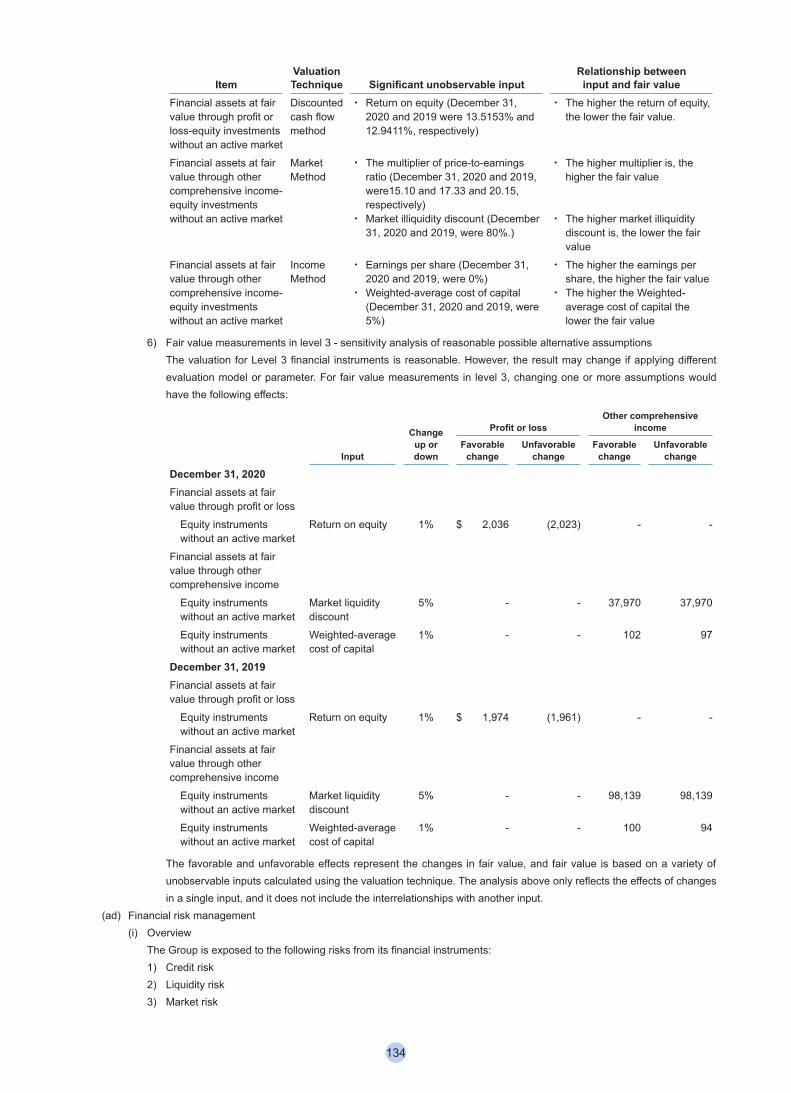
ItemValuation Technique Significant unobservable input
Relationship between input and fair value
Financial assets at fair value through profit or loss-equity investments without an active market
Discounted cash flow method
‧ Return on equity (December 31, 2020 and 2019 were 13.5153% and 12.9411%, respectively)
‧ The higher the return of equity, the lower the fair value.
Financial assets at fair value through other comprehensive income-equity investments without an active market
Market Method
‧ The multiplier of price-to-earnings ratio (December 31, 2020 and 2019, were15.10 and 17.33 and 20.15, respectively)
‧ Market illiquidity discount (December 31, 2020 and 2019, were 80%.)
‧ The higher multiplier is, the higher the fair value
‧ The higher market illiquidity discount is, the lower the fair value
Financial assets at fair value through other comprehensive income-equity investments without an active market
Income Method
‧ Earnings per share (December 31, 2020 and 2019, were 0%)
‧ Weighted-average cost of capital (December 31, 2020 and 2019, were 5%)
‧ The higher the earnings per share, the higher the fair value
‧ The higher the Weighted-average cost of capital the lower the fair value
6) Fair value measurements in level 3 - sensitivity analysis of reasonable possible alternative assumptionsThe valuation for Level 3 financial instruments is reasonable. However, the result may change if applying different evaluation model or parameter. For fair value measurements in level 3, changing one or more assumptions would have the following effects:
Input
Change up or down
Profit or lossOther comprehensive
income
Favorable change
Unfavorable change
Favorable change
Unfavorable change
December 31, 2020Financial assets at fair value through profit or loss Equity instruments
without an active marketReturn on equity 1% $ 2,036 (2,023) - -
Financial assets at fair value through other comprehensive income Equity instruments
without an active marketMarket liquidity discount
5% - - 37,970 37,970
Equity instruments without an active market
Weighted-average cost of capital
1% - - 102 97
December 31, 2019Financial assets at fair value through profit or loss Equity instruments
without an active marketReturn on equity 1% $ 1,974 (1,961) - -
Financial assets at fair value through other comprehensive income Equity instruments
without an active marketMarket liquidity discount
5% - - 98,139 98,139
Equity instruments without an active market
Weighted-average cost of capital
1% - - 100 94
The favorable and unfavorable effects represent the changes in fair value, and fair value is based on a variety of unobservable inputs calculated using the valuation technique. The analysis above only reflects the effects of changes in a single input, and it does not include the interrelationships with another input.
(ad) Financial risk management(i) Overview
The Group is exposed to the following risks from its financial instruments:1) Credit risk2) Liquidity risk3) Market risk
134
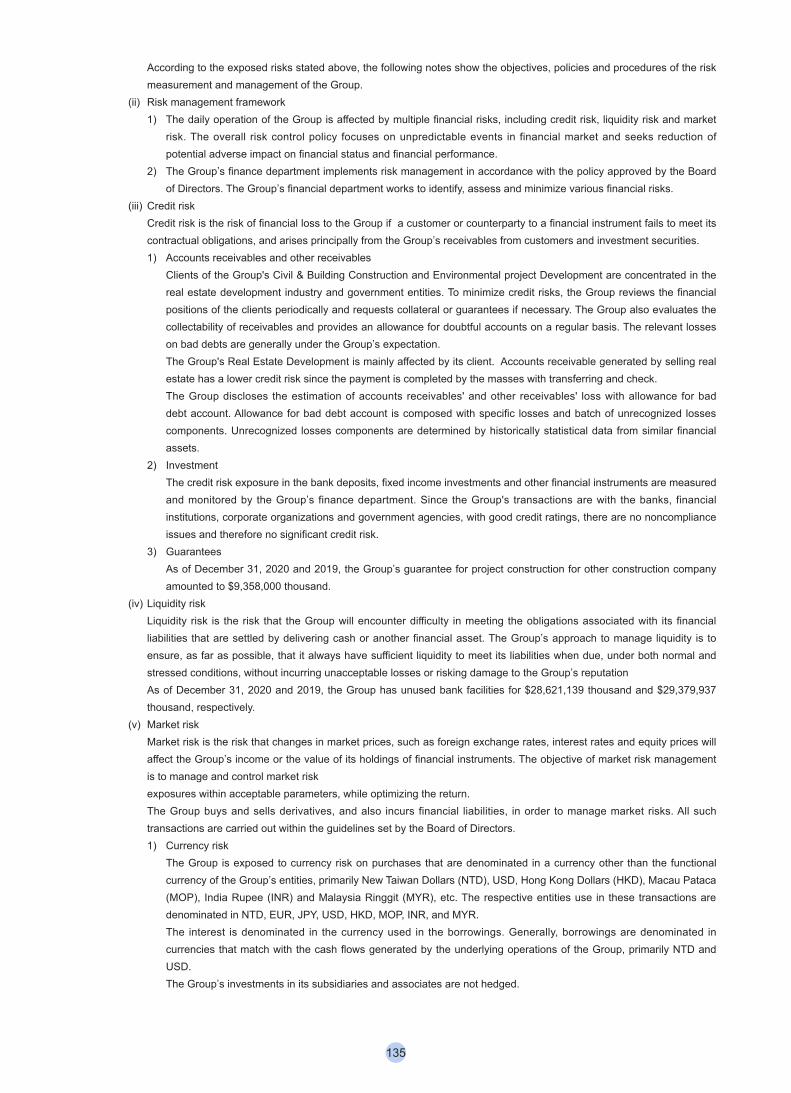
According to the exposed risks stated above, the following notes show the objectives, policies and procedures of the risk measurement and management of the Group.
(ii) Risk management framework1) The daily operation of the Group is affected by multiple financial risks, including credit risk, liquidity risk and market
risk. The overall risk control policy focuses on unpredictable events in financial market and seeks reduction of potential adverse impact on financial status and financial performance.
2) The Group’s finance department implements risk management in accordance with the policy approved by the Board of Directors. The Group’s financial department works to identify, assess and minimize various financial risks.
(iii) Credit riskCredit risk is the risk of financial loss to the Group if a customer or counterparty to a financial instrument fails to meet its contractual obligations, and arises principally from the Group’s receivables from customers and investment securities.1) Accounts receivables and other receivables
Clients of the Group's Civil & Building Construction and Environmental project Development are concentrated in the real estate development industry and government entities. To minimize credit risks, the Group reviews the financial positions of the clients periodically and requests collateral or guarantees if necessary. The Group also evaluates the collectability of receivables and provides an allowance for doubtful accounts on a regular basis. The relevant losses on bad debts are generally under the Group’s expectation. The Group's Real Estate Development is mainly affected by its client. Accounts receivable generated by selling real estate has a lower credit risk since the payment is completed by the masses with transferring and check.The Group discloses the estimation of accounts receivables' and other receivables' loss with allowance for bad debt account. Allowance for bad debt account is composed with specific losses and batch of unrecognized losses components. Unrecognized losses components are determined by historically statistical data from similar financial assets.
2) InvestmentThe credit risk exposure in the bank deposits, fixed income investments and other financial instruments are measured and monitored by the Group’s finance department. Since the Group's transactions are with the banks, financial institutions, corporate organizations and government agencies, with good credit ratings, there are no noncompliance issues and therefore no significant credit risk.
3) GuaranteesAs of December 31, 2020 and 2019, the Group’s guarantee for project construction for other construction company amounted to $9,358,000 thousand.
(iv) Liquidity riskLiquidity risk is the risk that the Group will encounter difficulty in meeting the obligations associated with its financial liabilities that are settled by delivering cash or another financial asset. The Group’s approach to manage liquidity is to ensure, as far as possible, that it always have sufficient liquidity to meet its liabilities when due, under both normal and stressed conditions, without incurring unacceptable losses or risking damage to the Group’s reputationAs of December 31, 2020 and 2019, the Group has unused bank facilities for $28,621,139 thousand and $29,379,937 thousand, respectively.
(v) Market riskMarket risk is the risk that changes in market prices, such as foreign exchange rates, interest rates and equity prices will affect the Group’s income or the value of its holdings of financial instruments. The objective of market risk management is to manage and control market riskexposures within acceptable parameters, while optimizing the return.The Group buys and sells derivatives, and also incurs financial liabilities, in order to manage market risks. All such transactions are carried out within the guidelines set by the Board of Directors.1) Currency risk
The Group is exposed to currency risk on purchases that are denominated in a currency other than the functional currency of the Group’s entities, primarily New Taiwan Dollars (NTD), USD, Hong Kong Dollars (HKD), Macau Pataca (MOP), India Rupee (INR) and Malaysia Ringgit (MYR), etc. The respective entities use in these transactions are denominated in NTD, EUR, JPY, USD, HKD, MOP, INR, and MYR. The interest is denominated in the currency used in the borrowings. Generally, borrowings are denominated in currencies that match with the cash flows generated by the underlying operations of the Group, primarily NTD and USD. The Group’s investments in its subsidiaries and associates are not hedged.
135
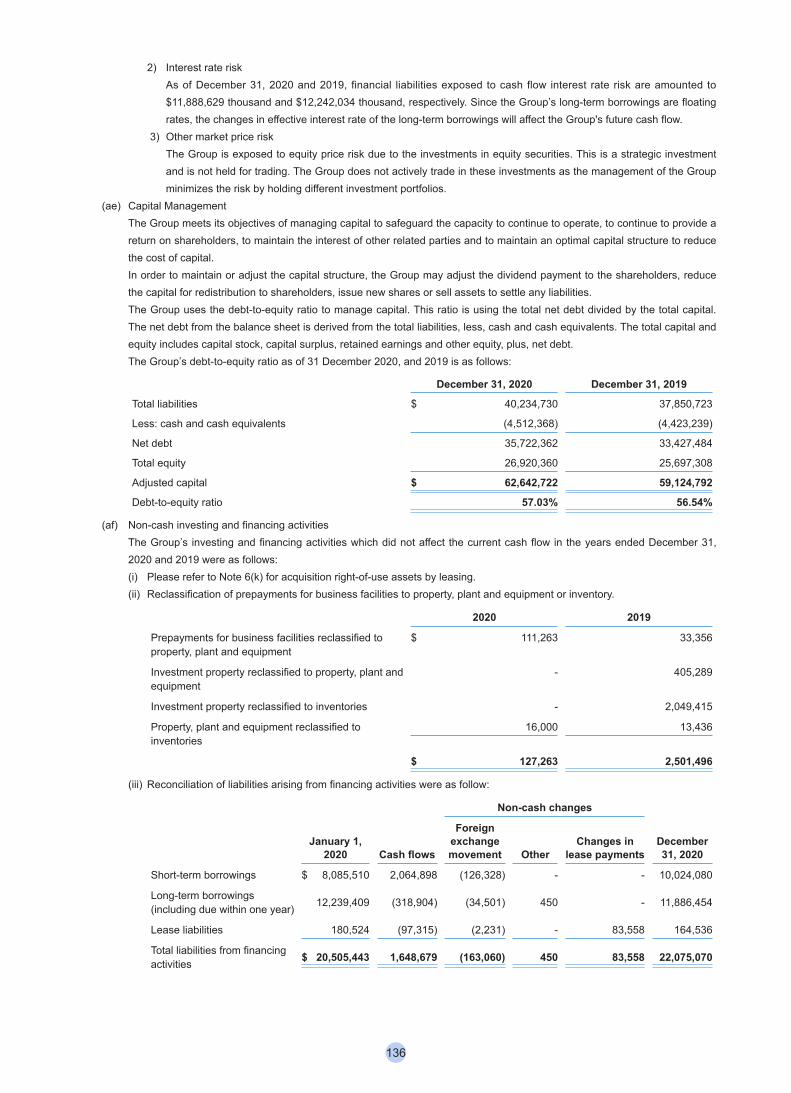
2) Interest rate riskAs of December 31, 2020 and 2019, financial liabilities exposed to cash flow interest rate risk are amounted to $11,888,629 thousand and $12,242,034 thousand, respectively. Since the Group’s long-term borrowings are floating rates, the changes in effective interest rate of the long-term borrowings will affect the Group's future cash flow.
3) Other market price riskThe Group is exposed to equity price risk due to the investments in equity securities. This is a strategic investment and is not held for trading. The Group does not actively trade in these investments as the management of the Group minimizes the risk by holding different investment portfolios.
(ae) Capital Management The Group meets its objectives of managing capital to safeguard the capacity to continue to operate, to continue to provide a return on shareholders, to maintain the interest of other related parties and to maintain an optimal capital structure to reduce the cost of capital. In order to maintain or adjust the capital structure, the Group may adjust the dividend payment to the shareholders, reduce the capital for redistribution to shareholders, issue new shares or sell assets to settle any liabilities. The Group uses the debt-to-equity ratio to manage capital. This ratio is using the total net debt divided by the total capital. The net debt from the balance sheet is derived from the total liabilities, less, cash and cash equivalents. The total capital and equity includes capital stock, capital surplus, retained earnings and other equity, plus, net debt.The Group’s debt-to-equity ratio as of 31 December 2020, and 2019 is as follows:
December 31, 2020 December 31, 2019
Total liabilities $ 40,234,730 37,850,723
Less: cash and cash equivalents (4,512,368) (4,423,239)
Net debt 35,722,362 33,427,484
Total equity 26,920,360 25,697,308
Adjusted capital $ 62,642,722 59,124,792
Debt-to-equity ratio 57.03% 56.54%
(af) Non-cash investing and financing activitiesThe Group’s investing and financing activities which did not affect the current cash flow in the years ended December 31, 2020 and 2019 were as follows:(i) Please refer to Note 6(k) for acquisition right-of-use assets by leasing.(ii) Reclassification of prepayments for business facilities to property, plant and equipment or inventory.
2020 2019
Prepayments for business facilities reclassified to property, plant and equipment
$ 111,263 33,356
Investment property reclassified to property, plant and equipment
- 405,289
Investment property reclassified to inventories - 2,049,415
Property, plant and equipment reclassified to inventories
16,000 13,436
$ 127,263 2,501,496
(iii) Reconciliation of liabilities arising from financing activities were as follow:
Non-cash changes
January 1, 2020 Cash flows
Foreign exchange movement Other
Changes in lease payments
December 31, 2020
Short-term borrowings $ 8,085,510 2,064,898 (126,328) - - 10,024,080
Long-term borrowings (including due within one year) 12,239,409 (318,904) (34,501) 450 - 11,886,454
Lease liabilities 180,524 (97,315) (2,231) - 83,558 164,536
Total liabilities from financing activities $ 20,505,443 1,648,679 (163,060) 450 83,558 22,075,070
136
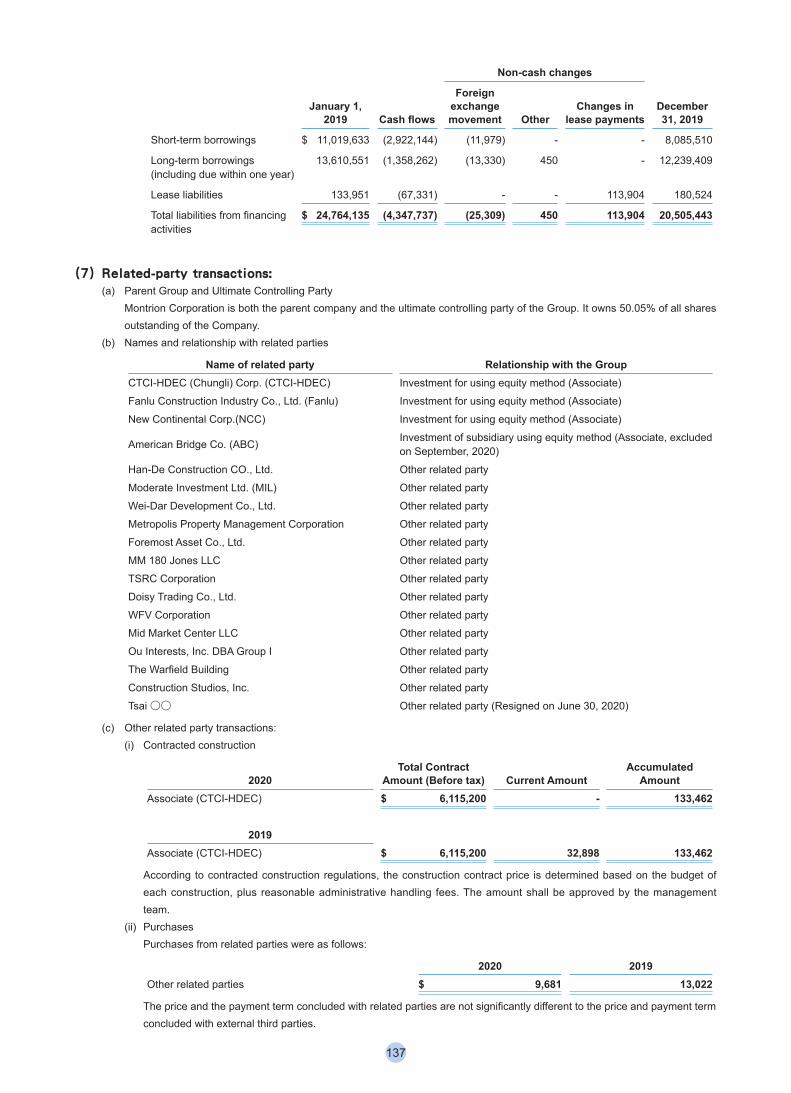
Non-cash changes
January 1, 2019 Cash flows
Foreign exchange movement Other
Changes in lease payments
December 31, 2019
Short-term borrowings $ 11,019,633 (2,922,144) (11,979) - - 8,085,510
Long-term borrowings (including due within one year)
13,610,551 (1,358,262) (13,330) 450 - 12,239,409
Lease liabilities 133,951 (67,331) - - 113,904 180,524
Total liabilities from financing activities
$ 24,764,135 (4,347,737) (25,309) 450 113,904 20,505,443
(7) Related-party transactions:(a) Parent Group and Ultimate Controlling Party
Montrion Corporation is both the parent company and the ultimate controlling party of the Group. It owns 50.05% of all shares outstanding of the Company.
(b) Names and relationship with related parties
Name of related party Relationship with the GroupCTCI-HDEC (Chungli) Corp. (CTCI-HDEC) Investment for using equity method (Associate)
Fanlu Construction Industry Co., Ltd. (Fanlu) Investment for using equity method (Associate)
New Continental Corp.(NCC) Investment for using equity method (Associate)
American Bridge Co. (ABC) Investment of subsidiary using equity method (Associate, excluded on September, 2020)
Han-De Construction CO., Ltd. Other related party
Moderate Investment Ltd. (MIL) Other related party
Wei-Dar Development Co., Ltd. Other related party
Metropolis Property Management Corporation Other related party
Foremost Asset Co., Ltd. Other related party
MM 180 Jones LLC Other related party
TSRC Corporation Other related party
Doisy Trading Co., Ltd. Other related party
WFV Corporation Other related party
Mid Market Center LLC Other related party
Ou Interests, Inc. DBA Group I Other related party
The Warfield Building Other related party
Construction Studios, Inc. Other related party
Tsai ○○ Other related party (Resigned on June 30, 2020)
(c) Other related party transactions: (i) Contracted construction
2020Total Contract
Amount (Before tax) Current AmountAccumulated
AmountAssociate (CTCI-HDEC) $ 6,115,200 - 133,462
2019Associate (CTCI-HDEC) $ 6,115,200 32,898 133,462
According to contracted construction regulations, the construction contract price is determined based on the budget of each construction, plus reasonable administrative handling fees. The amount shall be approved by the management team.
(ii) PurchasesPurchases from related parties were as follows:
2020 2019Other related parties $ 9,681 13,022
The price and the payment term concluded with related parties are not significantly different to the price and payment term concluded with external third parties.
137
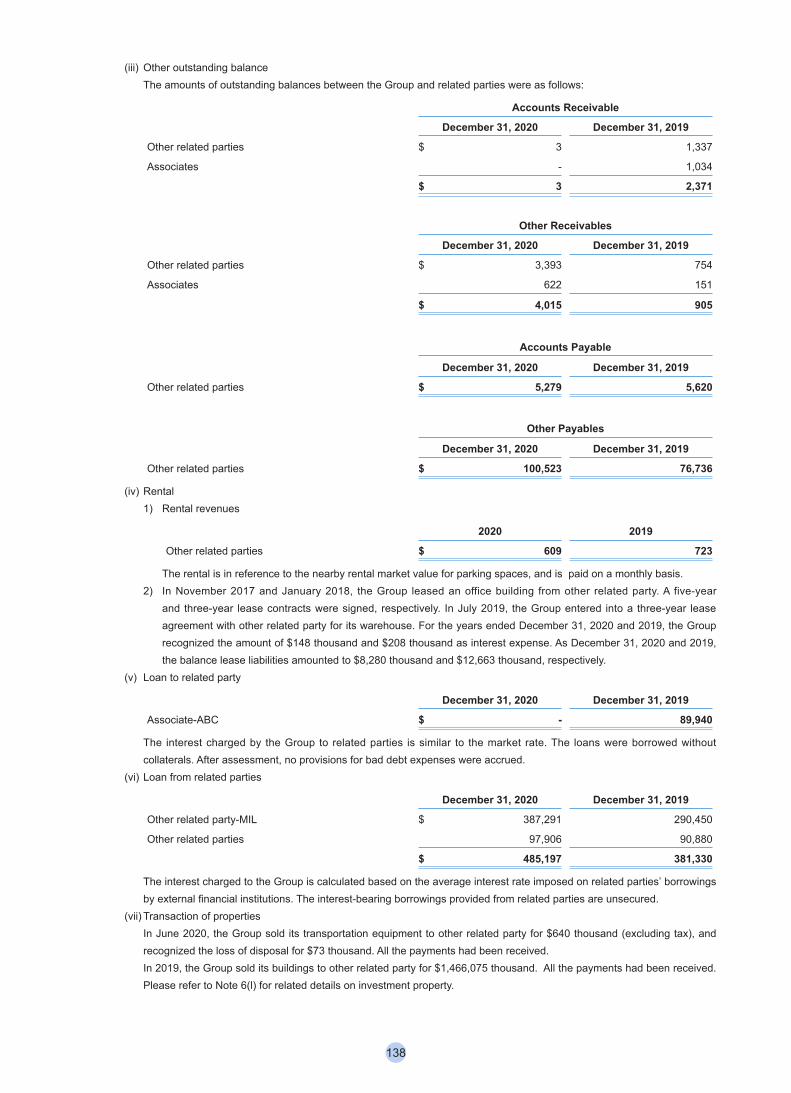
(iii) Other outstanding balanceThe amounts of outstanding balances between the Group and related parties were as follows:
Accounts Receivable
December 31, 2020 December 31, 2019
Other related parties $ 3 1,337
Associates - 1,034
$ 3 2,371
Other Receivables
December 31, 2020 December 31, 2019
Other related parties $ 3,393 754
Associates 622 151
$ 4,015 905
Accounts Payable
December 31, 2020 December 31, 2019
Other related parties $ 5,279 5,620
Other Payables
December 31, 2020 December 31, 2019
Other related parties $ 100,523 76,736
(iv) Rental1) Rental revenues
2020 2019
Other related parties $ 609 723
The rental is in reference to the nearby rental market value for parking spaces, and is paid on a monthly basis.2) In November 2017 and January 2018, the Group leased an office building from other related party. A five-year
and three-year lease contracts were signed, respectively. In July 2019, the Group entered into a three-year lease agreement with other related party for its warehouse. For the years ended December 31, 2020 and 2019, the Group recognized the amount of $148 thousand and $208 thousand as interest expense. As December 31, 2020 and 2019, the balance lease liabilities amounted to $8,280 thousand and $12,663 thousand, respectively.
(v) Loan to related party
December 31, 2020 December 31, 2019
Associate-ABC $ - 89,940
The interest charged by the Group to related parties is similar to the market rate. The loans were borrowed without collaterals. After assessment, no provisions for bad debt expenses were accrued.
(vi) Loan from related parties
December 31, 2020 December 31, 2019
Other related party-MIL $ 387,291 290,450
Other related parties 97,906 90,880
$ 485,197 381,330
The interest charged to the Group is calculated based on the average interest rate imposed on related parties’ borrowings by external financial institutions. The interest-bearing borrowings provided from related parties are unsecured.
(vii) Transaction of propertiesIn June 2020, the Group sold its transportation equipment to other related party for $640 thousand (excluding tax), and recognized the loss of disposal for $73 thousand. All the payments had been received.In 2019, the Group sold its buildings to other related party for $1,466,075 thousand. All the payments had been received. Please refer to Note 6(l) for related details on investment property.
138
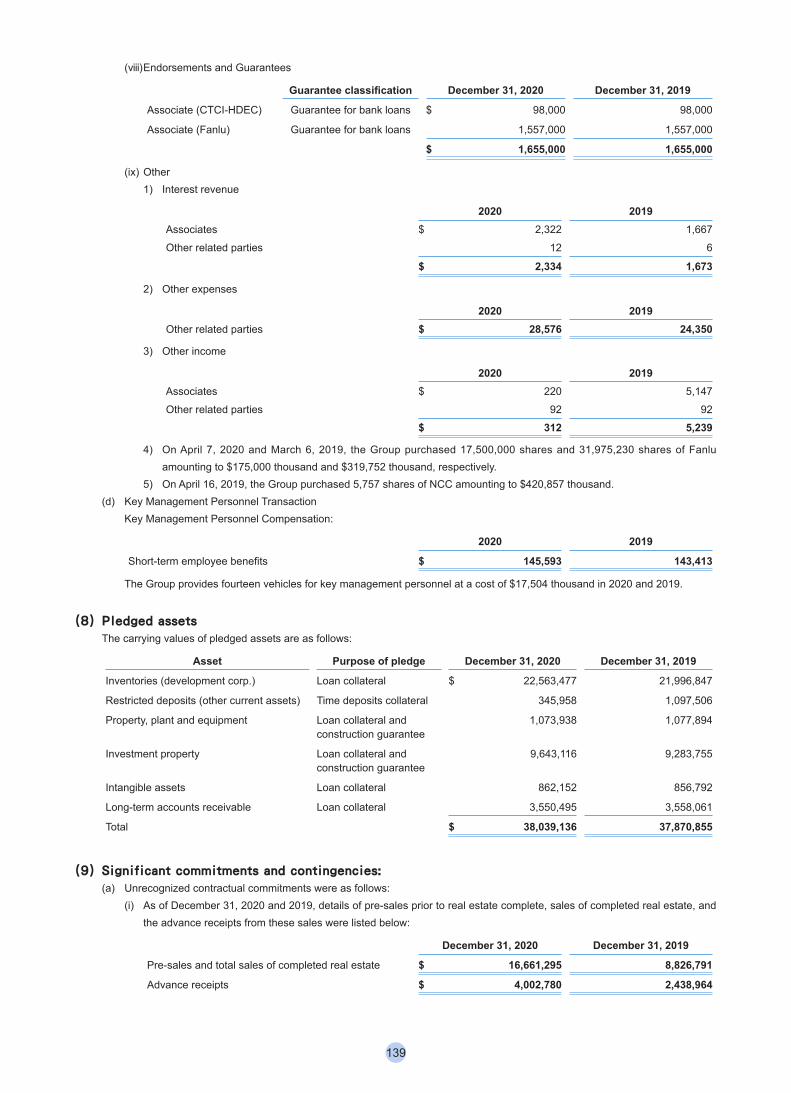
(viii) Endorsements and Guarantees
Guarantee classification December 31, 2020 December 31, 2019
Associate (CTCI-HDEC) Guarantee for bank loans $ 98,000 98,000
Associate (Fanlu) Guarantee for bank loans 1,557,000 1,557,000
$ 1,655,000 1,655,000
(ix) Other1) Interest revenue
2020 2019Associates $ 2,322 1,667
Other related parties 12 6
$ 2,334 1,673
2) Other expenses
2020 2019Other related parties $ 28,576 24,350
3) Other income
2020 2019Associates $ 220 5,147
Other related parties 92 92
$ 312 5,239
4) On April 7, 2020 and March 6, 2019, the Group purchased 17,500,000 shares and 31,975,230 shares of Fanlu amounting to $175,000 thousand and $319,752 thousand, respectively.
5) On April 16, 2019, the Group purchased 5,757 shares of NCC amounting to $420,857 thousand.(d) Key Management Personnel Transaction
Key Management Personnel Compensation:
2020 2019
Short-term employee benefits $ 145,593 143,413
The Group provides fourteen vehicles for key management personnel at a cost of $17,504 thousand in 2020 and 2019.
(8) Pledged assetsThe carrying values of pledged assets are as follows:
Asset Purpose of pledge December 31, 2020 December 31, 2019
Inventories (development corp.) Loan collateral $ 22,563,477 21,996,847
Restricted deposits (other current assets) Time deposits collateral 345,958 1,097,506
Property, plant and equipment Loan collateral and construction guarantee
1,073,938 1,077,894
Investment property Loan collateral and construction guarantee
9,643,116 9,283,755
Intangible assets Loan collateral 862,152 856,792
Long-term accounts receivable Loan collateral 3,550,495 3,558,061
Total $ 38,039,136 37,870,855
(9) Significant commitments and contingencies: (a) Unrecognized contractual commitments were as follows:
(i) As of December 31, 2020 and 2019, details of pre-sales prior to real estate complete, sales of completed real estate, and the advance receipts from these sales were listed below:
December 31, 2020 December 31, 2019
Pre-sales and total sales of completed real estate $ 16,661,295 8,826,791
Advance receipts $ 4,002,780 2,438,964
139
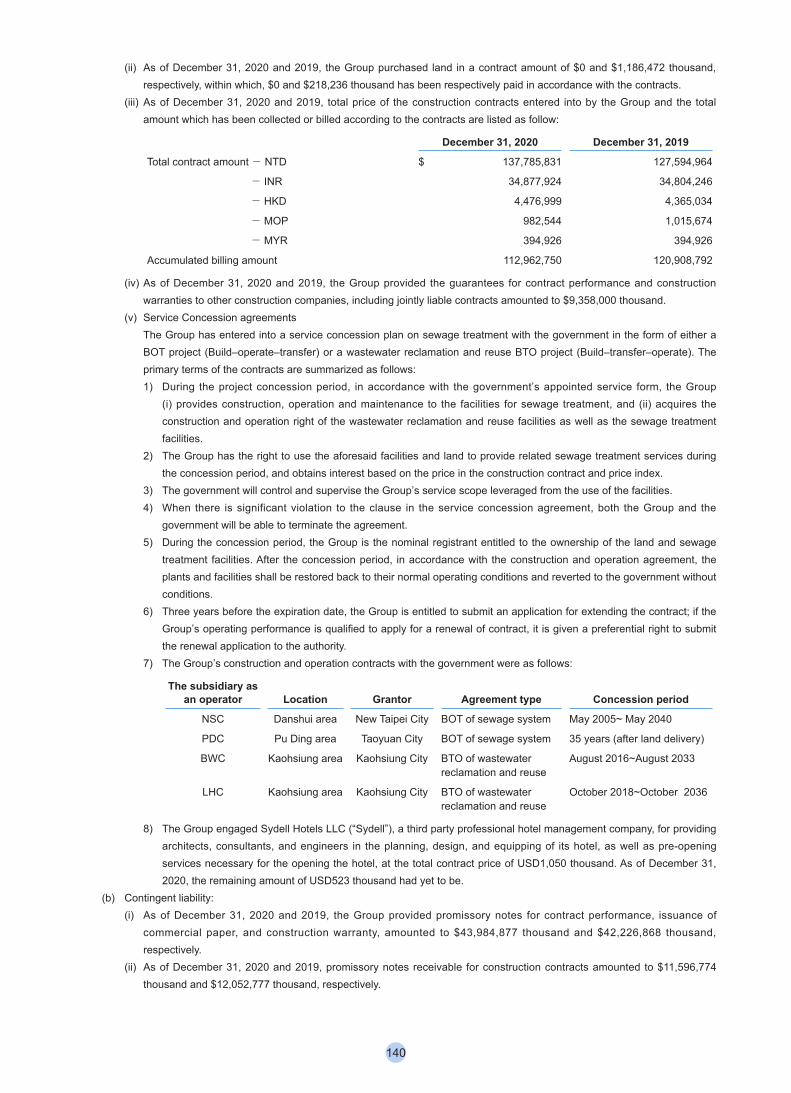
(ii) As of December 31, 2020 and 2019, the Group purchased land in a contract amount of $0 and $1,186,472 thousand, respectively, within which, $0 and $218,236 thousand has been respectively paid in accordance with the contracts.
(iii) As of December 31, 2020 and 2019, total price of the construction contracts entered into by the Group and the total amount which has been collected or billed according to the contracts are listed as follow:
December 31, 2020 December 31, 2019
Total contract amount- NTD $ 137,785,831 127,594,964
- INR 34,877,924 34,804,246
- HKD 4,476,999 4,365,034
- MOP 982,544 1,015,674
- MYR 394,926 394,926
Accumulated billing amount 112,962,750 120,908,792
(iv) As of December 31, 2020 and 2019, the Group provided the guarantees for contract performance and construction warranties to other construction companies, including jointly liable contracts amounted to $9,358,000 thousand.
(v) Service Concession agreementsThe Group has entered into a service concession plan on sewage treatment with the government in the form of either a BOT project (Build–operate–transfer) or a wastewater reclamation and reuse BTO project (Build–transfer–operate). The primary terms of the contracts are summarized as follows:1) During the project concession period, in accordance with the government’s appointed service form, the Group
(i) provides construction, operation and maintenance to the facilities for sewage treatment, and (ii) acquires the construction and operation right of the wastewater reclamation and reuse facilities as well as the sewage treatment facilities.
2) The Group has the right to use the aforesaid facilities and land to provide related sewage treatment services during the concession period, and obtains interest based on the price in the construction contract and price index.
3) The government will control and supervise the Group’s service scope leveraged from the use of the facilities.4) When there is significant violation to the clause in the service concession agreement, both the Group and the
government will be able to terminate the agreement.5) During the concession period, the Group is the nominal registrant entitled to the ownership of the land and sewage
treatment facilities. After the concession period, in accordance with the construction and operation agreement, the plants and facilities shall be restored back to their normal operating conditions and reverted to the government without conditions.
6) Three years before the expiration date, the Group is entitled to submit an application for extending the contract; if the Group’s operating performance is qualified to apply for a renewal of contract, it is given a preferential right to submit the renewal application to the authority.
7) The Group’s construction and operation contracts with the government were as follows:
The subsidiary as an operator Location Grantor Agreement type Concession period
NSC Danshui area New Taipei City BOT of sewage system May 2005~ May 2040
PDC Pu Ding area Taoyuan City BOT of sewage system 35 years (after land delivery)
BWC Kaohsiung area Kaohsiung City BTO of wastewater reclamation and reuse
August 2016~August 2033
LHC Kaohsiung area Kaohsiung City BTO of wastewater reclamation and reuse
October 2018~October 2036
8) The Group engaged Sydell Hotels LLC (“Sydell”), a third party professional hotel management company, for providing architects, consultants, and engineers in the planning, design, and equipping of its hotel, as well as pre-opening services necessary for the opening the hotel, at the total contract price of USD1,050 thousand. As of December 31, 2020, the remaining amount of USD523 thousand had yet to be.
(b) Contingent liability:(i) As of December 31, 2020 and 2019, the Group provided promissory notes for contract performance, issuance of
commercial paper, and construction warranty, amounted to $43,984,877 thousand and $42,226,868 thousand, respectively.
(ii) As of December 31, 2020 and 2019, promissory notes receivable for construction contracts amounted to $11,596,774 thousand and $12,052,777 thousand, respectively.
140
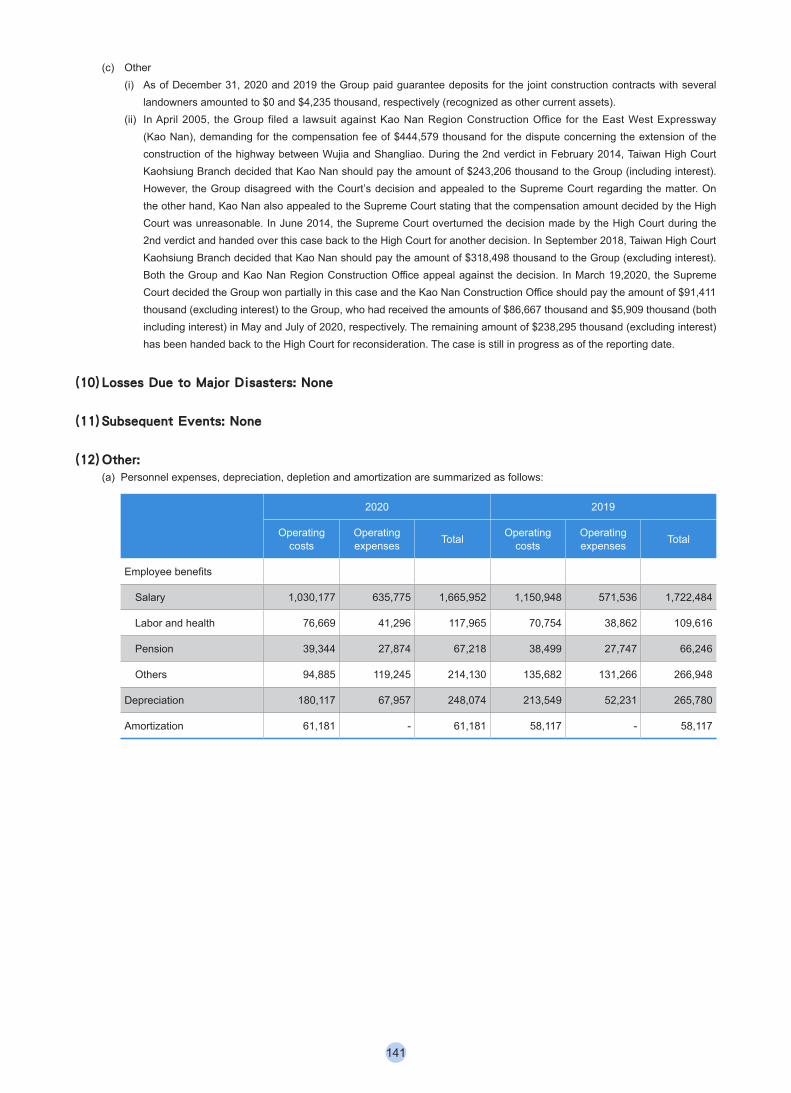
(c) Other(i) As of December 31, 2020 and 2019 the Group paid guarantee deposits for the joint construction contracts with several
landowners amounted to $0 and $4,235 thousand, respectively (recognized as other current assets).(ii) In April 2005, the Group filed a lawsuit against Kao Nan Region Construction Office for the East West Expressway
(Kao Nan), demanding for the compensation fee of $444,579 thousand for the dispute concerning the extension of the construction of the highway between Wujia and Shangliao. During the 2nd verdict in February 2014, Taiwan High Court Kaohsiung Branch decided that Kao Nan should pay the amount of $243,206 thousand to the Group (including interest). However, the Group disagreed with the Court’s decision and appealed to the Supreme Court regarding the matter. On the other hand, Kao Nan also appealed to the Supreme Court stating that the compensation amount decided by the High Court was unreasonable. In June 2014, the Supreme Court overturned the decision made by the High Court during the 2nd verdict and handed over this case back to the High Court for another decision. In September 2018, Taiwan High Court Kaohsiung Branch decided that Kao Nan should pay the amount of $318,498 thousand to the Group (excluding interest). Both the Group and Kao Nan Region Construction Office appeal against the decision. In March 19,2020, the Supreme Court decided the Group won partially in this case and the Kao Nan Construction Office should pay the amount of $91,411 thousand (excluding interest) to the Group, who had received the amounts of $86,667 thousand and $5,909 thousand (both including interest) in May and July of 2020, respectively. The remaining amount of $238,295 thousand (excluding interest) has been handed back to the High Court for reconsideration. The case is still in progress as of the reporting date.
(10) Losses Due to Major Disasters: None
(11) Subsequent Events: None
(12) Other: (a) Personnel expenses, depreciation, depletion and amortization are summarized as follows:
2020 2019
Operating costs
Operating expenses Total Operating
costsOperating expenses Total
Employee benefits
Salary 1,030,177 635,775 1,665,952 1,150,948 571,536 1,722,484
Labor and health 76,669 41,296 117,965 70,754 38,862 109,616
Pension 39,344 27,874 67,218 38,499 27,747 66,246
Others 94,885 119,245 214,130 135,682 131,266 266,948
Depreciation 180,117 67,957 248,074 213,549 52,231 265,780
Amortization 61,181 - 61,181 58,117 - 58,117
141
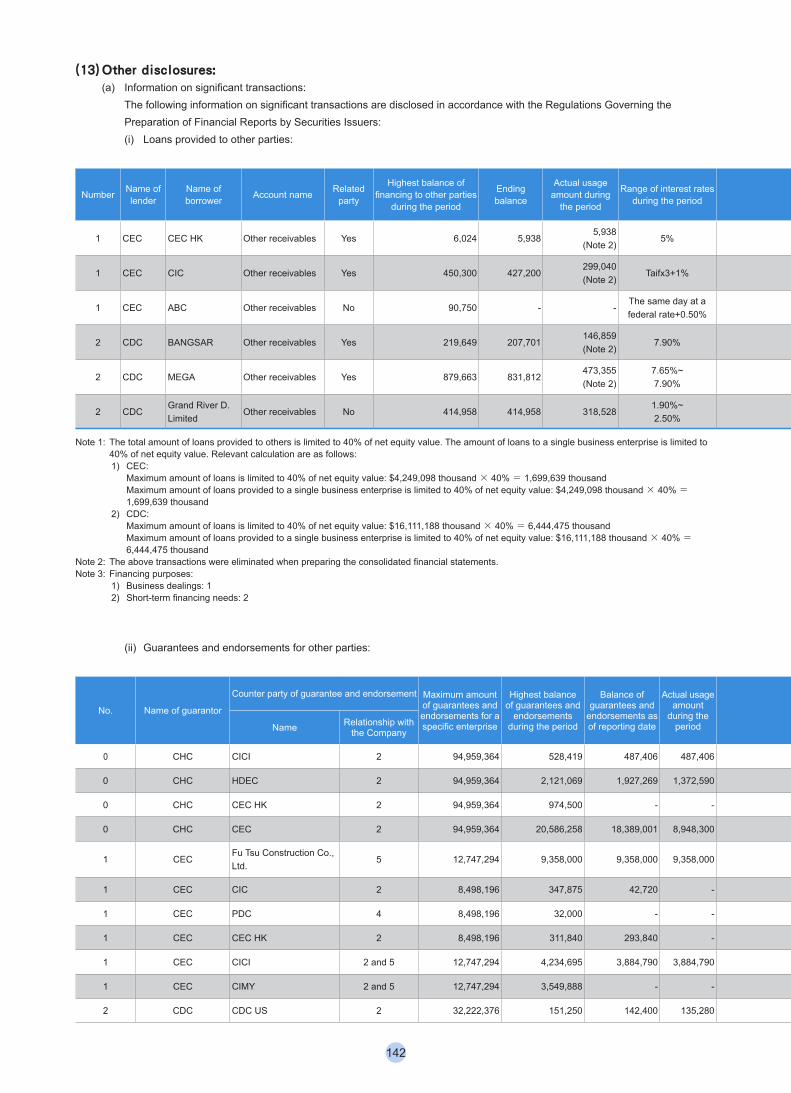
(13) Other disclosures: (a) Information on significant transactions:
The following information on significant transactions are disclosed in accordance with the Regulations Governing the Preparation of Financial Reports by Securities Issuers:(i) Loans provided to other parties:
(In Thousands of New Taiwan Dollars)
Number Name of lender
Name of borrower Account name Related
party
Highest balance of financing to other parties
during the period
Ending balance
Actual usage amount during
the period
Range of interest rates during the period
Purposes of fund financing for the
borrower
Transactionamount for businesses
between two parties
Reasons forShort-term financing
Allowance for bad
debt
Collateral Maximum amount of loans provided to a
single enterprise
Maximum amount of loans
Item Value
1 CEC CEC HK Other receivables Yes 6,024 5,9385,938
(Note 2)5% 2 - Operation requirements - - 1,699,639 1,699,639
1 CEC CIC Other receivables Yes 450,300 427,200299,040(Note 2)
Taifx3+1% 2 - Operation requirements - - - 1,699,639 1,699,639
1 CEC ABC Other receivables No 90,750 - -The same day at a federal rate+0.50%
2 - Operation requirements - Buildings 70,202 1,699,639 1,699,639
2 CDC BANGSAR Other receivables Yes 219,649 207,701146,859(Note 2)
7.90% 2 -Land purchases and operation requirements
- - 6,444,475 6,444,475
2 CDC MEGA Other receivables Yes 879,663 831,812473,355(Note 2)
7.65%~7.90%
2 -Land purchases and operation requirements
- - 6,444,475 6,444,475
2 CDCGrand River D. Limited
Other receivables No 414,958 414,958 318,5281.90%~2.50%
2 -Land purchases and operation requirements
- - 6,444,475 6,444,475
Note 1: The total amount of loans provided to others is limited to 40% of net equity value. The amount of loans to a single business enterprise is limited to 40% of net equity value. Relevant calculation are as follows: 1) CEC: Maximum amount of loans is limited to 40% of net equity value: $4,249,098 thousand × 40% = 1,699,639 thousand Maximum amount of loans provided to a single business enterprise is limited to 40% of net equity value: $4,249,098 thousand × 40% =
1,699,639 thousand2) CDC: Maximum amount of loans is limited to 40% of net equity value: $16,111,188 thousand × 40% = 6,444,475 thousand Maximum amount of loans provided to a single business enterprise is limited to 40% of net equity value: $16,111,188 thousand × 40% =
6,444,475 thousandNote 2: The above transactions were eliminated when preparing the consolidated financial statements.Note 3: Financing purposes:
1) Business dealings: 12) Short-term financing needs: 2
(ii) Guarantees and endorsements for other parties: (In Thousands of New Taiwan Dollars)
No. Name of guarantor
Counter party of guarantee and endorsement Maximum amount of guarantees and endorsements for a specific enterprise
Highest balance of guarantees and
endorsements during the period
Balance of guarantees and
endorsements as of reporting date
Actual usage amount
during the period
Property pledged for guarantees
and endorsements (Amount)
Ratio of accumulated amounts of guarantees and endorsements
over net worth in the latest financial statements
Maximum amount of guarantees and
endorsements
Parent company's endorsements/
guarantees to third parties on behalf of
subsidiary
Subsidiary's endorsements/
guarantees to third parties on behalf of
parent company
Endorsements/guarantees to third parties on behalf of
companies in Mainland ChinaName Relationship with
the Company
0 CHC CICI 2 94,959,364 528,419 487,406 487,406 - 2.05% 94,959,364 Y N N
0 CHC HDEC 2 94,959,364 2,121,069 1,927,269 1,372,590 - 8.12% 94,959,364 Y N N
0 CHC CEC HK 2 94,959,364 974,500 - - - -% 94,959,364 Y N N
0 CHC CEC 2 94,959,364 20,586,258 18,389,001 8,948,300 - 77.46% 94,959,364 Y N N
1 CECFu Tsu Construction Co., Ltd.
5 12,747,294 9,358,000 9,358,000 9,358,000 - 220.23% 25,494,588 N N N
1 CEC CIC 2 8,498,196 347,875 42,720 - - 1.01% 8,498,196 N N N
1 CEC PDC 4 8,498,196 32,000 - - - -% 8,498,196 N N N
1 CEC CEC HK 2 8,498,196 311,840 293,840 - - 6.92% 8,498,196 N N N
1 CEC CICI 2 and 5 12,747,294 4,234,695 3,884,790 3,884,790 - 91.43% 25,494,588 N N N
1 CEC CIMY 2 and 5 12,747,294 3,549,888 - - - -% 25,494,588 N N N
2 CDC CDC US 2 32,222,376 151,250 142,400 135,280 - 0.88% 32,222,376 N N N
142
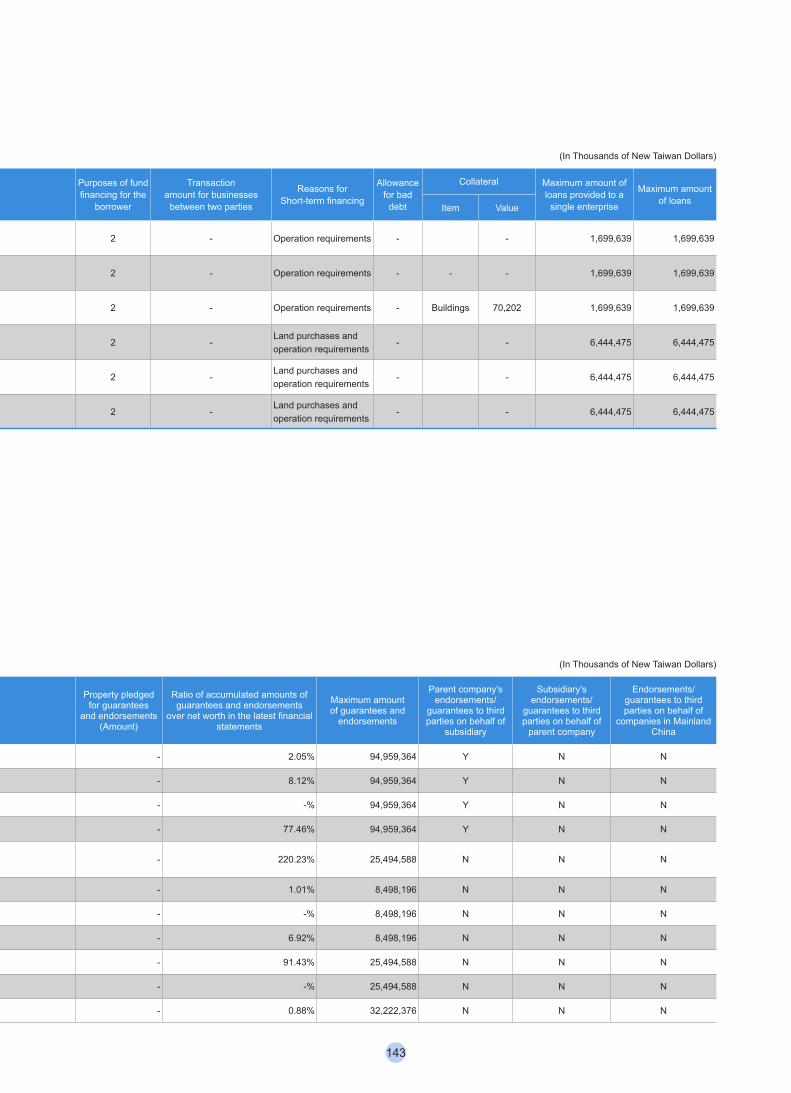
(13) Other disclosures: (a) Information on significant transactions:
The following information on significant transactions are disclosed in accordance with the Regulations Governing the Preparation of Financial Reports by Securities Issuers:(i) Loans provided to other parties:
(In Thousands of New Taiwan Dollars)
Number Name of lender
Name of borrower Account name Related
party
Highest balance of financing to other parties
during the period
Ending balance
Actual usage amount during
the period
Range of interest rates during the period
Purposes of fund financing for the
borrower
Transactionamount for businesses
between two parties
Reasons forShort-term financing
Allowance for bad
debt
Collateral Maximum amount of loans provided to a
single enterprise
Maximum amount of loans
Item Value
1 CEC CEC HK Other receivables Yes 6,024 5,9385,938
(Note 2)5% 2 - Operation requirements - - 1,699,639 1,699,639
1 CEC CIC Other receivables Yes 450,300 427,200299,040(Note 2)
Taifx3+1% 2 - Operation requirements - - - 1,699,639 1,699,639
1 CEC ABC Other receivables No 90,750 - -The same day at a federal rate+0.50%
2 - Operation requirements - Buildings 70,202 1,699,639 1,699,639
2 CDC BANGSAR Other receivables Yes 219,649 207,701146,859(Note 2)
7.90% 2 -Land purchases and operation requirements
- - 6,444,475 6,444,475
2 CDC MEGA Other receivables Yes 879,663 831,812473,355(Note 2)
7.65%~7.90%
2 -Land purchases and operation requirements
- - 6,444,475 6,444,475
2 CDCGrand River D. Limited
Other receivables No 414,958 414,958 318,5281.90%~2.50%
2 -Land purchases and operation requirements
- - 6,444,475 6,444,475
Note 1: The total amount of loans provided to others is limited to 40% of net equity value. The amount of loans to a single business enterprise is limited to 40% of net equity value. Relevant calculation are as follows: 1) CEC: Maximum amount of loans is limited to 40% of net equity value: $4,249,098 thousand × 40% = 1,699,639 thousand Maximum amount of loans provided to a single business enterprise is limited to 40% of net equity value: $4,249,098 thousand × 40% =
1,699,639 thousand2) CDC: Maximum amount of loans is limited to 40% of net equity value: $16,111,188 thousand × 40% = 6,444,475 thousand Maximum amount of loans provided to a single business enterprise is limited to 40% of net equity value: $16,111,188 thousand × 40% =
6,444,475 thousandNote 2: The above transactions were eliminated when preparing the consolidated financial statements.Note 3: Financing purposes:
1) Business dealings: 12) Short-term financing needs: 2
(ii) Guarantees and endorsements for other parties: (In Thousands of New Taiwan Dollars)
No. Name of guarantor
Counter party of guarantee and endorsement Maximum amount of guarantees and endorsements for a specific enterprise
Highest balance of guarantees and
endorsements during the period
Balance of guarantees and
endorsements as of reporting date
Actual usage amount
during the period
Property pledged for guarantees
and endorsements (Amount)
Ratio of accumulated amounts of guarantees and endorsements
over net worth in the latest financial statements
Maximum amount of guarantees and
endorsements
Parent company's endorsements/
guarantees to third parties on behalf of
subsidiary
Subsidiary's endorsements/
guarantees to third parties on behalf of
parent company
Endorsements/guarantees to third parties on behalf of
companies in Mainland ChinaName Relationship with
the Company
0 CHC CICI 2 94,959,364 528,419 487,406 487,406 - 2.05% 94,959,364 Y N N
0 CHC HDEC 2 94,959,364 2,121,069 1,927,269 1,372,590 - 8.12% 94,959,364 Y N N
0 CHC CEC HK 2 94,959,364 974,500 - - - -% 94,959,364 Y N N
0 CHC CEC 2 94,959,364 20,586,258 18,389,001 8,948,300 - 77.46% 94,959,364 Y N N
1 CECFu Tsu Construction Co., Ltd.
5 12,747,294 9,358,000 9,358,000 9,358,000 - 220.23% 25,494,588 N N N
1 CEC CIC 2 8,498,196 347,875 42,720 - - 1.01% 8,498,196 N N N
1 CEC PDC 4 8,498,196 32,000 - - - -% 8,498,196 N N N
1 CEC CEC HK 2 8,498,196 311,840 293,840 - - 6.92% 8,498,196 N N N
1 CEC CICI 2 and 5 12,747,294 4,234,695 3,884,790 3,884,790 - 91.43% 25,494,588 N N N
1 CEC CIMY 2 and 5 12,747,294 3,549,888 - - - -% 25,494,588 N N N
2 CDC CDC US 2 32,222,376 151,250 142,400 135,280 - 0.88% 32,222,376 N N N
143
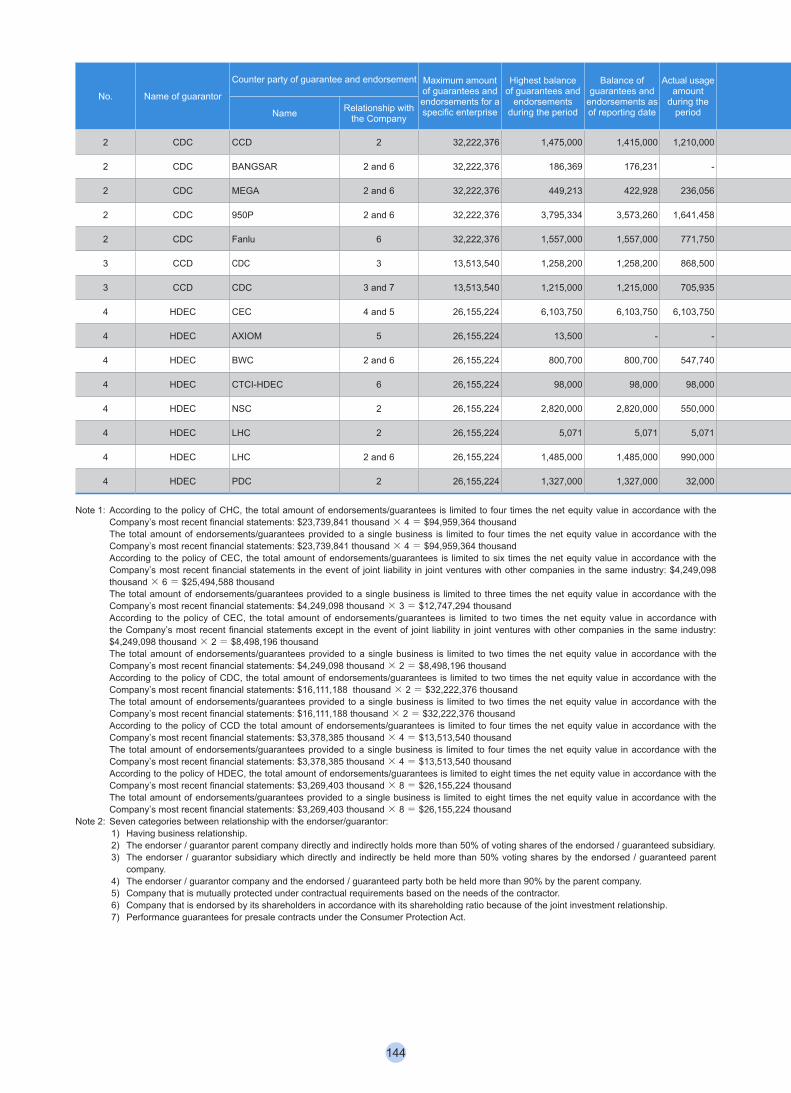
No. Name of guarantor
Counter party of guarantee and endorsement Maximum amount of guarantees and endorsements for a specific enterprise
Highest balance of guarantees and
endorsements during the period
Balance of guarantees and
endorsements as of reporting date
Actual usage amount
during the period
Property pledged for guarantees
and endorsements (Amount)
Ratio of accumulated amounts of guarantees and endorsements
over net worth in the latest financial statements
Maximum amount of guarantees and
endorsements
Parent company's endorsements/
guarantees to third parties on behalf of
subsidiary
Subsidiary's endorsements/
guarantees to third parties on behalf of
parent company
Endorsements/guarantees to third parties on behalf of
companies in Mainland ChinaName Relationship with
the Company
2 CDC CCD 2 32,222,376 1,475,000 1,415,000 1,210,000 - 8.78% 32,222,376 N N N
2 CDC BANGSAR 2 and 6 32,222,376 186,369 176,231 - - 1.09% 32,222,376 N N N
2 CDC MEGA 2 and 6 32,222,376 449,213 422,928 236,056 - 2.63% 32,222,376 N N N
2 CDC 950P 2 and 6 32,222,376 3,795,334 3,573,260 1,641,458 - 22.18% 32,222,376 N N N
2 CDC Fanlu 6 32,222,376 1,557,000 1,557,000 771,750 - 9.66% 32,222,376 N N N
3 CCD CDC 3 13,513,540 1,258,200 1,258,200 868,500 1,258,200 37.24% 13,513,540 N N N
3 CCD CDC 3 and 7 13,513,540 1,215,000 1,215,000 705,935 - 35.96% 13,513,540 N N N
4 HDEC CEC 4 and 5 26,155,224 6,103,750 6,103,750 6,103,750 - 186.69% 26,155,224 N N N
4 HDEC AXIOM 5 26,155,224 13,500 - - - -% 26,155,224 N N N
4 HDEC BWC 2 and 6 26,155,224 800,700 800,700 547,740 - 24.49% 26,155,224 N N N
4 HDEC CTCI-HDEC 6 26,155,224 98,000 98,000 98,000 - 3.00% 26,155,224 N N N
4 HDEC NSC 2 26,155,224 2,820,000 2,820,000 550,000 - 86.25% 26,155,224 N N N
4 HDEC LHC 2 26,155,224 5,071 5,071 5,071 - 0.16% 26,155,224 N N N
4 HDEC LHC 2 and 6 26,155,224 1,485,000 1,485,000 990,000 - 45.42% 26,155,224 N N N
4 HDEC PDC 2 26,155,224 1,327,000 1,327,000 32,000 - 40.59% 26,155,224 N N N
Note 1: According to the policy of CHC, the total amount of endorsements/guarantees is limited to four times the net equity value in accordance with the Company’s most recent financial statements: $23,739,841 thousand × 4 = $94,959,364 thousand
The total amount of endorsements/guarantees provided to a single business is limited to four times the net equity value in accordance with the Company’s most recent financial statements: $23,739,841 thousand × 4 = $94,959,364 thousand
According to the policy of CEC, the total amount of endorsements/guarantees is limited to six times the net equity value in accordance with the Company’s most recent financial statements in the event of joint liability in joint ventures with other companies in the same industry: $4,249,098 thousand × 6 = $25,494,588 thousand
The total amount of endorsements/guarantees provided to a single business is limited to three times the net equity value in accordance with the Company’s most recent financial statements: $4,249,098 thousand × 3 = $12,747,294 thousand
According to the policy of CEC, the total amount of endorsements/guarantees is limited to two times the net equity value in accordance with the Company’s most recent financial statements except in the event of joint liability in joint ventures with other companies in the same industry: $4,249,098 thousand × 2 = $8,498,196 thousand
The total amount of endorsements/guarantees provided to a single business is limited to two times the net equity value in accordance with the Company’s most recent financial statements: $4,249,098 thousand × 2 = $8,498,196 thousand
According to the policy of CDC, the total amount of endorsements/guarantees is limited to two times the net equity value in accordance with the Company’s most recent financial statements: $16,111,188 thousand × 2 = $32,222,376 thousand
The total amount of endorsements/guarantees provided to a single business is limited to two times the net equity value in accordance with the Company’s most recent financial statements: $16,111,188 thousand × 2 = $32,222,376 thousand
According to the policy of CCD the total amount of endorsements/guarantees is limited to four times the net equity value in accordance with the Company’s most recent financial statements: $3,378,385 thousand × 4 = $13,513,540 thousand
The total amount of endorsements/guarantees provided to a single business is limited to four times the net equity value in accordance with the Company’s most recent financial statements: $3,378,385 thousand × 4 = $13,513,540 thousand
According to the policy of HDEC, the total amount of endorsements/guarantees is limited to eight times the net equity value in accordance with the Company’s most recent financial statements: $3,269,403 thousand × 8 = $26,155,224 thousand
The total amount of endorsements/guarantees provided to a single business is limited to eight times the net equity value in accordance with the Company’s most recent financial statements: $3,269,403 thousand × 8 = $26,155,224 thousand
Note 2: Seven categories between relationship with the endorser/guarantor:1) Having business relationship.2) The endorser / guarantor parent company directly and indirectly holds more than 50% of voting shares of the endorsed / guaranteed subsidiary.3) The endorser / guarantor subsidiary which directly and indirectly be held more than 50% voting shares by the endorsed / guaranteed parent
company.4) The endorser / guarantor company and the endorsed / guaranteed party both be held more than 90% by the parent company.5) Company that is mutually protected under contractual requirements based on the needs of the contractor.6) Company that is endorsed by its shareholders in accordance with its shareholding ratio because of the joint investment relationship.7) Performance guarantees for presale contracts under the Consumer Protection Act.
144
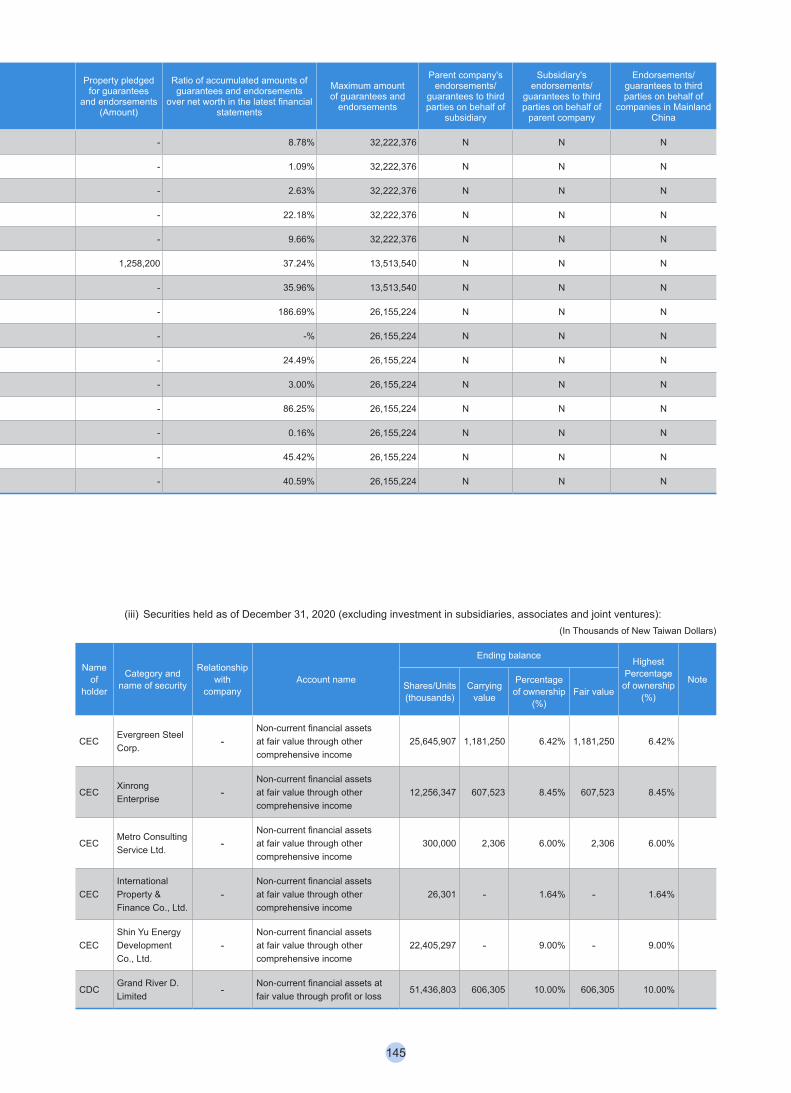
No. Name of guarantor
Counter party of guarantee and endorsement Maximum amount of guarantees and endorsements for a specific enterprise
Highest balance of guarantees and
endorsements during the period
Balance of guarantees and
endorsements as of reporting date
Actual usage amount
during the period
Property pledged for guarantees
and endorsements (Amount)
Ratio of accumulated amounts of guarantees and endorsements
over net worth in the latest financial statements
Maximum amount of guarantees and
endorsements
Parent company's endorsements/
guarantees to third parties on behalf of
subsidiary
Subsidiary's endorsements/
guarantees to third parties on behalf of
parent company
Endorsements/guarantees to third parties on behalf of
companies in Mainland ChinaName Relationship with
the Company
2 CDC CCD 2 32,222,376 1,475,000 1,415,000 1,210,000 - 8.78% 32,222,376 N N N
2 CDC BANGSAR 2 and 6 32,222,376 186,369 176,231 - - 1.09% 32,222,376 N N N
2 CDC MEGA 2 and 6 32,222,376 449,213 422,928 236,056 - 2.63% 32,222,376 N N N
2 CDC 950P 2 and 6 32,222,376 3,795,334 3,573,260 1,641,458 - 22.18% 32,222,376 N N N
2 CDC Fanlu 6 32,222,376 1,557,000 1,557,000 771,750 - 9.66% 32,222,376 N N N
3 CCD CDC 3 13,513,540 1,258,200 1,258,200 868,500 1,258,200 37.24% 13,513,540 N N N
3 CCD CDC 3 and 7 13,513,540 1,215,000 1,215,000 705,935 - 35.96% 13,513,540 N N N
4 HDEC CEC 4 and 5 26,155,224 6,103,750 6,103,750 6,103,750 - 186.69% 26,155,224 N N N
4 HDEC AXIOM 5 26,155,224 13,500 - - - -% 26,155,224 N N N
4 HDEC BWC 2 and 6 26,155,224 800,700 800,700 547,740 - 24.49% 26,155,224 N N N
4 HDEC CTCI-HDEC 6 26,155,224 98,000 98,000 98,000 - 3.00% 26,155,224 N N N
4 HDEC NSC 2 26,155,224 2,820,000 2,820,000 550,000 - 86.25% 26,155,224 N N N
4 HDEC LHC 2 26,155,224 5,071 5,071 5,071 - 0.16% 26,155,224 N N N
4 HDEC LHC 2 and 6 26,155,224 1,485,000 1,485,000 990,000 - 45.42% 26,155,224 N N N
4 HDEC PDC 2 26,155,224 1,327,000 1,327,000 32,000 - 40.59% 26,155,224 N N N
Note 1: According to the policy of CHC, the total amount of endorsements/guarantees is limited to four times the net equity value in accordance with the Company’s most recent financial statements: $23,739,841 thousand × 4 = $94,959,364 thousand
The total amount of endorsements/guarantees provided to a single business is limited to four times the net equity value in accordance with the Company’s most recent financial statements: $23,739,841 thousand × 4 = $94,959,364 thousand
According to the policy of CEC, the total amount of endorsements/guarantees is limited to six times the net equity value in accordance with the Company’s most recent financial statements in the event of joint liability in joint ventures with other companies in the same industry: $4,249,098 thousand × 6 = $25,494,588 thousand
The total amount of endorsements/guarantees provided to a single business is limited to three times the net equity value in accordance with the Company’s most recent financial statements: $4,249,098 thousand × 3 = $12,747,294 thousand
According to the policy of CEC, the total amount of endorsements/guarantees is limited to two times the net equity value in accordance with the Company’s most recent financial statements except in the event of joint liability in joint ventures with other companies in the same industry: $4,249,098 thousand × 2 = $8,498,196 thousand
The total amount of endorsements/guarantees provided to a single business is limited to two times the net equity value in accordance with the Company’s most recent financial statements: $4,249,098 thousand × 2 = $8,498,196 thousand
According to the policy of CDC, the total amount of endorsements/guarantees is limited to two times the net equity value in accordance with the Company’s most recent financial statements: $16,111,188 thousand × 2 = $32,222,376 thousand
The total amount of endorsements/guarantees provided to a single business is limited to two times the net equity value in accordance with the Company’s most recent financial statements: $16,111,188 thousand × 2 = $32,222,376 thousand
According to the policy of CCD the total amount of endorsements/guarantees is limited to four times the net equity value in accordance with the Company’s most recent financial statements: $3,378,385 thousand × 4 = $13,513,540 thousand
The total amount of endorsements/guarantees provided to a single business is limited to four times the net equity value in accordance with the Company’s most recent financial statements: $3,378,385 thousand × 4 = $13,513,540 thousand
According to the policy of HDEC, the total amount of endorsements/guarantees is limited to eight times the net equity value in accordance with the Company’s most recent financial statements: $3,269,403 thousand × 8 = $26,155,224 thousand
The total amount of endorsements/guarantees provided to a single business is limited to eight times the net equity value in accordance with the Company’s most recent financial statements: $3,269,403 thousand × 8 = $26,155,224 thousand
Note 2: Seven categories between relationship with the endorser/guarantor:1) Having business relationship.2) The endorser / guarantor parent company directly and indirectly holds more than 50% of voting shares of the endorsed / guaranteed subsidiary.3) The endorser / guarantor subsidiary which directly and indirectly be held more than 50% voting shares by the endorsed / guaranteed parent
company.4) The endorser / guarantor company and the endorsed / guaranteed party both be held more than 90% by the parent company.5) Company that is mutually protected under contractual requirements based on the needs of the contractor.6) Company that is endorsed by its shareholders in accordance with its shareholding ratio because of the joint investment relationship.7) Performance guarantees for presale contracts under the Consumer Protection Act.
(iii) Securities held as of December 31, 2020 (excluding investment in subsidiaries, associates and joint ventures):(In Thousands of New Taiwan Dollars)
Name of
holder
Category and name of security
Relationship with
companyAccount name
Ending balance Highest Percentage of ownership
(%)
NoteShares/Units (thousands)
Carrying value
Percentage of ownership
(%)Fair value
CECEvergreen Steel Corp. -
Non-current financial assets at fair value through other comprehensive income
25,645,907 1,181,250 6.42% 1,181,250 6.42%
CECXinrong Enterprise -
Non-current financial assets at fair value through other comprehensive income
12,256,347 607,523 8.45% 607,523 8.45%
CECMetro Consulting Service Ltd. -
Non-current financial assets at fair value through other comprehensive income
300,000 2,306 6.00% 2,306 6.00%
CECInternational Property & Finance Co., Ltd.
-Non-current financial assets at fair value through other comprehensive income
26,301 - 1.64% - 1.64%
CECShin Yu Energy Development Co., Ltd.
-Non-current financial assets at fair value through other comprehensive income
22,405,297 - 9.00% - 9.00%
CDCGrand River D. Limited - Non-current financial assets at
fair value through profit or loss51,436,803 606,305 10.00% 606,305 10.00%
145
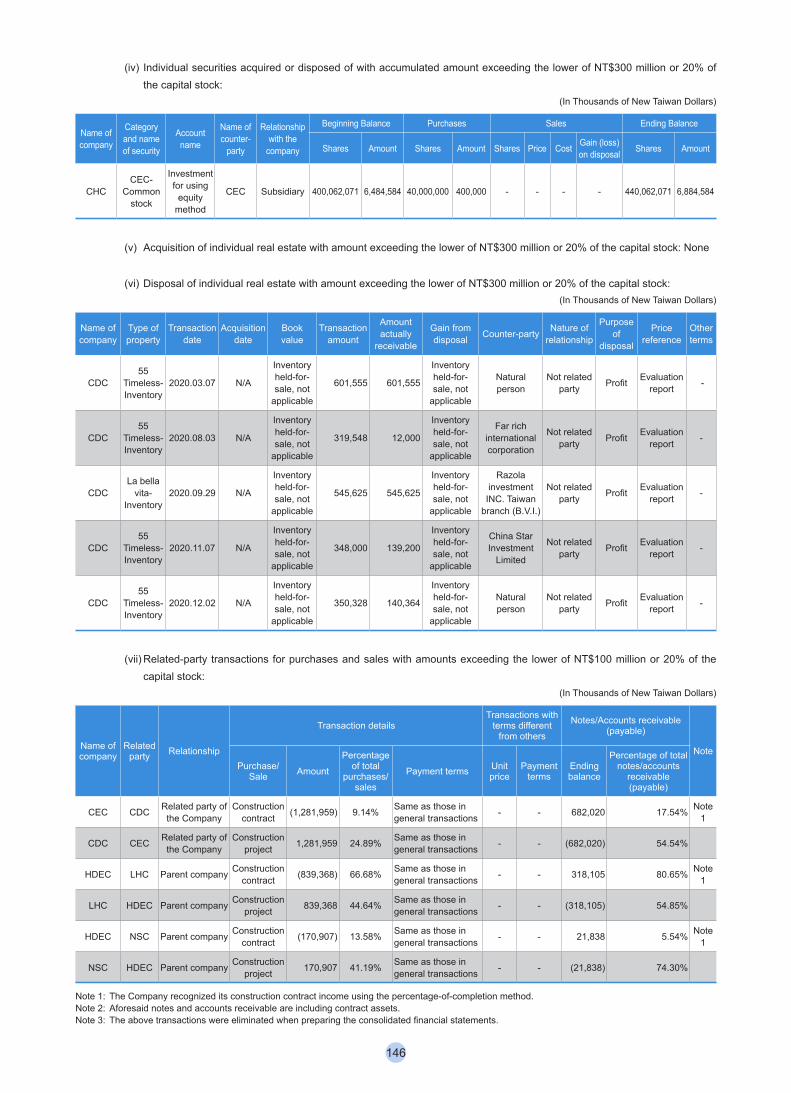
(iv) Individual securities acquired or disposed of with accumulated amount exceeding the lower of NT$300 million or 20% of the capital stock:
(In Thousands of New Taiwan Dollars)
Name of company
Category and name of security
Account name
Name of counter-
party
Relationship with the
company
Beginning Balance Purchases Sales Ending Balance
Shares Amount Shares Amount Shares Price Cost Gain (loss) on disposal Shares Amount
CHCCEC-
Common stock
Investment for using
equity method
CEC Subsidiary 400,062,071 6,484,584 40,000,000 400,000 - - - - 440,062,071 6,884,584
(v) Acquisition of individual real estate with amount exceeding the lower of NT$300 million or 20% of the capital stock: None
(vi) Disposal of individual real estate with amount exceeding the lower of NT$300 million or 20% of the capital stock:(In Thousands of New Taiwan Dollars)
Name of company
Type of property
Transaction date
Acquisition date
Book value
Transaction amount
Amount actually
receivable
Gain from disposal Counter-party Nature of
relationship
Purpose of
disposal
Price reference
Other terms
CDC55
Timeless-Inventory
2020.03.07 N/A
Inventory held-for-sale, not
applicable
601,555 601,555
Inventory held-for-sale, not
applicable
Natural person
Not related party Profit Evaluation
report -
CDC55
Timeless-Inventory
2020.08.03 N/A
Inventory held-for-sale, not
applicable
319,548 12,000
Inventory held-for-sale, not
applicable
Far rich international corporation
Not related party Profit Evaluation
report -
CDCLa bella
vita-Inventory
2020.09.29 N/A
Inventory held-for-sale, not
applicable
545,625 545,625
Inventory held-for-sale, not
applicable
Razola investment INC. Taiwan
branch (B.V.I.)
Not related party Profit Evaluation
report -
CDC55
Timeless-Inventory
2020.11.07 N/A
Inventory held-for-sale, not
applicable
348,000 139,200
Inventory held-for-sale, not
applicable
China Star Investment
Limited
Not related party Profit Evaluation
report -
CDC55
Timeless-Inventory
2020.12.02 N/A
Inventory held-for-sale, not
applicable
350,328 140,364
Inventory held-for-sale, not
applicable
Natural person
Not related party Profit Evaluation
report -
(vii) Related-party transactions for purchases and sales with amounts exceeding the lower of NT$100 million or 20% of the capital stock:
(In Thousands of New Taiwan Dollars)
Name of company
Related party Relationship
Transaction detailsTransactions with
terms different from others
Notes/Accounts receivable (payable)
NotePurchase/
Sale Amount
Percentage of total
purchases/sales
Payment terms Unit price
Payment terms
Ending balance
Percentage of total notes/accounts
receivable (payable)
CEC CDC Related party of the Company
Construction contract (1,281,959) 9.14% Same as those in
general transactions - - 682,020 17.54% Note 1
CDC CEC Related party of the Company
Construction project 1,281,959 24.89% Same as those in
general transactions - - (682,020) 54.54%
HDEC LHC Parent company Construction contract (839,368) 66.68% Same as those in
general transactions - - 318,105 80.65% Note 1
LHC HDEC Parent company Construction project 839,368 44.64% Same as those in
general transactions - - (318,105) 54.85%
HDEC NSC Parent company Construction contract (170,907) 13.58% Same as those in
general transactions - - 21,838 5.54% Note 1
NSC HDEC Parent company Construction project 170,907 41.19% Same as those in
general transactions - - (21,838) 74.30%
Note 1: The Company recognized its construction contract income using the percentage-of-completion method.Note 2: Aforesaid notes and accounts receivable are including contract assets.Note 3: The above transactions were eliminated when preparing the consolidated financial statements.
146
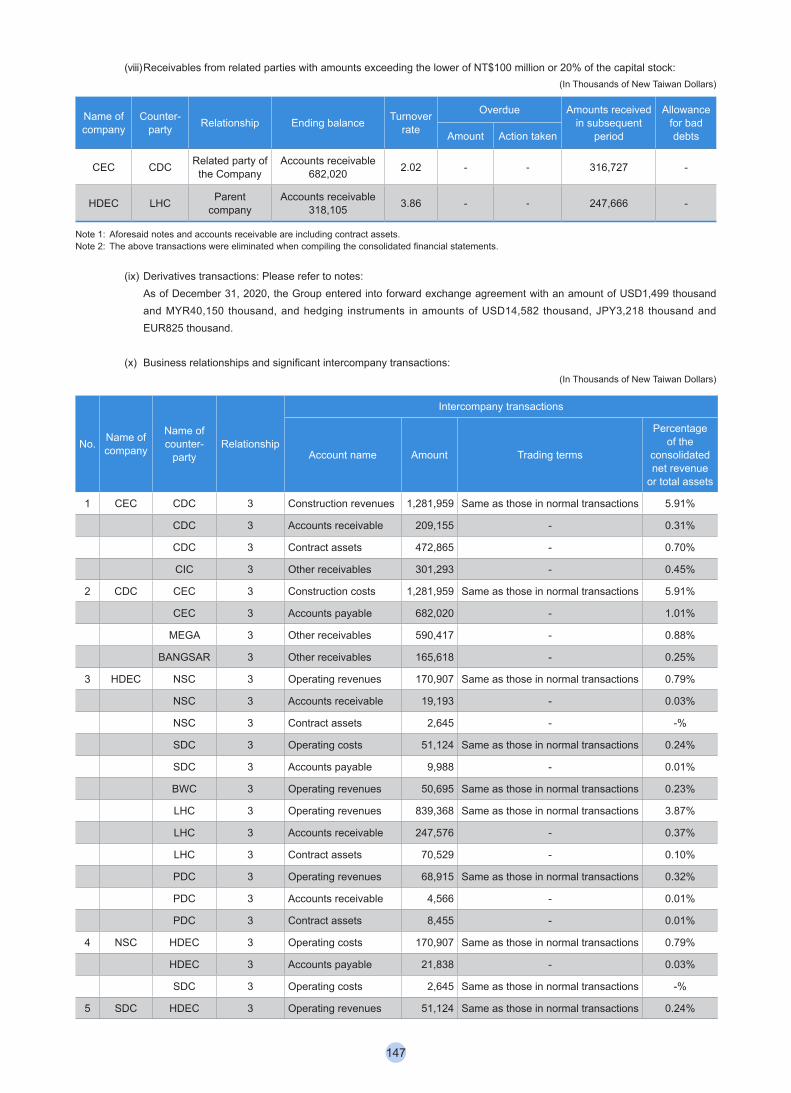
(viii) Receivables from related parties with amounts exceeding the lower of NT$100 million or 20% of the capital stock:(In Thousands of New Taiwan Dollars)
Name of company
Counter-party Relationship Ending balance Turnover
rate
Overdue Amounts received in subsequent
period
Allowance for bad debtsAmount Action taken
CEC CDC Related party of the Company
Accounts receivable 682,020 2.02 - - 316,727 -
HDEC LHC Parent company
Accounts receivable 318,105 3.86 - - 247,666 -
Note 1: Aforesaid notes and accounts receivable are including contract assets.Note 2: The above transactions were eliminated when compiling the consolidated financial statements.
(ix) Derivatives transactions: Please refer to notes: As of December 31, 2020, the Group entered into forward exchange agreement with an amount of USD1,499 thousand and MYR40,150 thousand, and hedging instruments in amounts of USD14,582 thousand, JPY3,218 thousand and EUR825 thousand.
(x) Business relationships and significant intercompany transactions: (In Thousands of New Taiwan Dollars)
No. Name of company
Name of counter-
partyRelationship
Intercompany transactions
Account name Amount Trading terms
Percentage of the
consolidated net revenue
or total assets
1 CEC CDC 3 Construction revenues 1,281,959 Same as those in normal transactions 5.91%
CDC 3 Accounts receivable 209,155 - 0.31%
CDC 3 Contract assets 472,865 - 0.70%
CIC 3 Other receivables 301,293 - 0.45%
2 CDC CEC 3 Construction costs 1,281,959 Same as those in normal transactions 5.91%
CEC 3 Accounts payable 682,020 - 1.01%
MEGA 3 Other receivables 590,417 - 0.88%
BANGSAR 3 Other receivables 165,618 - 0.25%
3 HDEC NSC 3 Operating revenues 170,907 Same as those in normal transactions 0.79%
NSC 3 Accounts receivable 19,193 - 0.03%
NSC 3 Contract assets 2,645 - -%
SDC 3 Operating costs 51,124 Same as those in normal transactions 0.24%
SDC 3 Accounts payable 9,988 - 0.01%
BWC 3 Operating revenues 50,695 Same as those in normal transactions 0.23%
LHC 3 Operating revenues 839,368 Same as those in normal transactions 3.87%
LHC 3 Accounts receivable 247,576 - 0.37%
LHC 3 Contract assets 70,529 - 0.10%
PDC 3 Operating revenues 68,915 Same as those in normal transactions 0.32%
PDC 3 Accounts receivable 4,566 - 0.01%
PDC 3 Contract assets 8,455 - 0.01%
4 NSC HDEC 3 Operating costs 170,907 Same as those in normal transactions 0.79%
HDEC 3 Accounts payable 21,838 - 0.03%
SDC 3 Operating costs 2,645 Same as those in normal transactions -%
5 SDC HDEC 3 Operating revenues 51,124 Same as those in normal transactions 0.24%
147
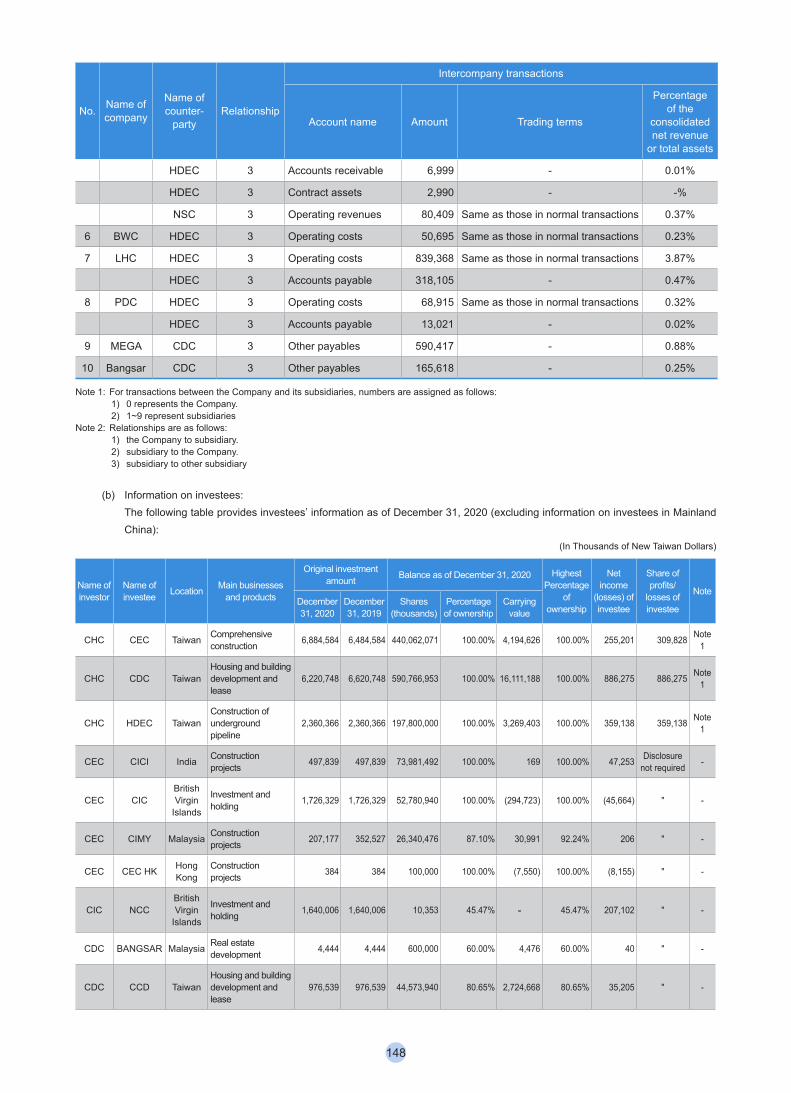
No. Name of company
Name of counter-
partyRelationship
Intercompany transactions
Account name Amount Trading terms
Percentage of the
consolidated net revenue
or total assets
HDEC 3 Accounts receivable 6,999 - 0.01%
HDEC 3 Contract assets 2,990 - -%
NSC 3 Operating revenues 80,409 Same as those in normal transactions 0.37%
6 BWC HDEC 3 Operating costs 50,695 Same as those in normal transactions 0.23%
7 LHC HDEC 3 Operating costs 839,368 Same as those in normal transactions 3.87%
HDEC 3 Accounts payable 318,105 - 0.47%
8 PDC HDEC 3 Operating costs 68,915 Same as those in normal transactions 0.32%
HDEC 3 Accounts payable 13,021 - 0.02%
9 MEGA CDC 3 Other payables 590,417 - 0.88%
10 Bangsar CDC 3 Other payables 165,618 - 0.25%
Note 1: For transactions between the Company and its subsidiaries, numbers are assigned as follows: 1) 0 represents the Company.2) 1~9 represent subsidiaries
Note 2: Relationships are as follows:1) the Company to subsidiary.2) subsidiary to the Company.3) subsidiary to other subsidiary
(b) Information on investees: The following table provides investees’ information as of December 31, 2020 (excluding information on investees in Mainland China):
(In Thousands of New Taiwan Dollars)
Name of investor
Name of investee Location Main businesses
and products
Original investment amount Balance as of December 31, 2020 Highest
Percentage of
ownership
Net income
(losses) of investee
Share of profits/
losses of investee
NoteDecember 31, 2020
December 31, 2019
Shares (thousands)
Percentage of ownership
Carrying value
CHC CEC Taiwan Comprehensive construction 6,884,584 6,484,584 440,062,071 100.00% 4,194,626 100.00% 255,201 309,828 Note
1
CHC CDC TaiwanHousing and building development and lease
6,220,748 6,620,748 590,766,953 100.00% 16,111,188 100.00% 886,275 886,275 Note 1
CHC HDEC TaiwanConstruction of underground pipeline
2,360,366 2,360,366 197,800,000 100.00% 3,269,403 100.00% 359,138 359,138 Note 1
CEC CICI India Construction projects 497,839 497,839 73,981,492 100.00% 169 100.00% 47,253 Disclosure
not required -
CEC CICBritish Virgin
Islands
Investment and holding 1,726,329 1,726,329 52,780,940 100.00% (294,723) 100.00% (45,664) " -
CEC CIMY Malaysia Construction projects 207,177 352,527 26,340,476 87.10% 30,991 92.24% 206 " -
CEC CEC HK Hong Kong
Construction projects 384 384 100,000 100.00% (7,550) 100.00% (8,155) " -
CIC NCCBritish Virgin
Islands
Investment and holding 1,640,006 1,640,006 10,353 45.47% - 45.47% 207,102 " -
CDC BANGSAR Malaysia Real estate development 4,444 4,444 600,000 60.00% 4,476 60.00% 40 " -
CDC CCD TaiwanHousing and building development and lease
976,539 976,539 44,573,940 80.65% 2,724,668 80.65% 35,205 " -
148
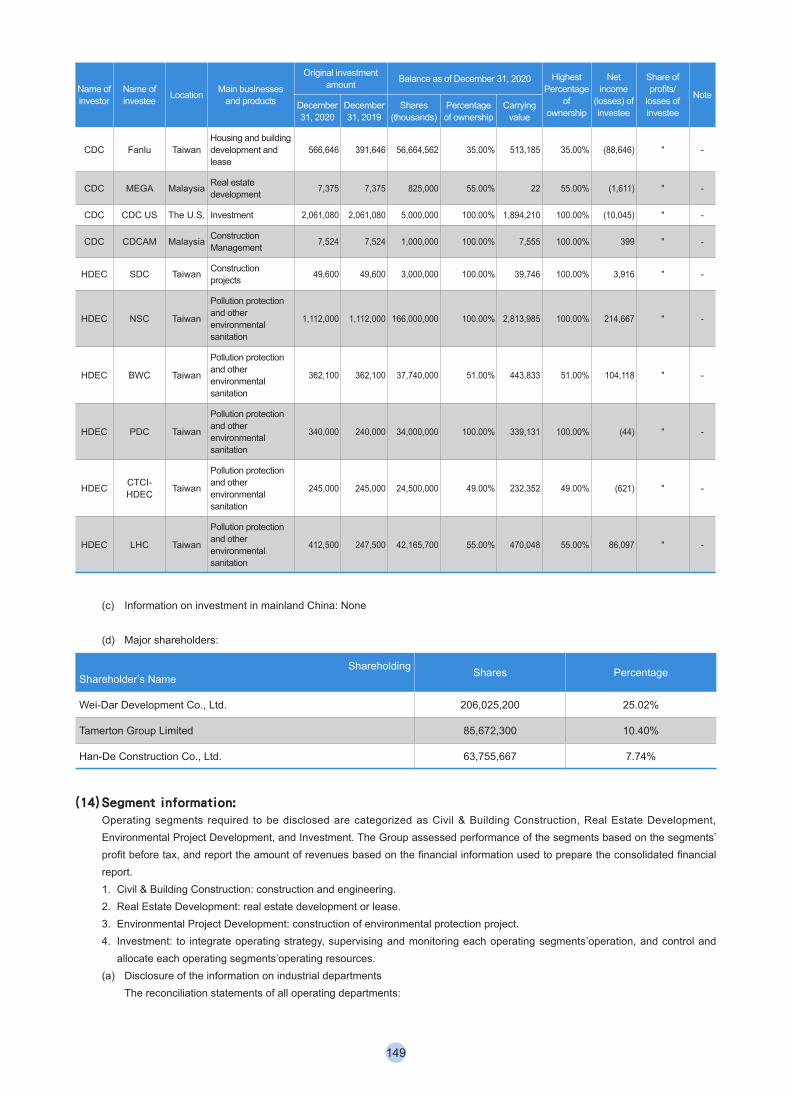
Name of investor
Name of investee Location Main businesses
and products
Original investment amount Balance as of December 31, 2020 Highest
Percentage of
ownership
Net income
(losses) of investee
Share of profits/
losses of investee
NoteDecember 31, 2020
December 31, 2019
Shares (thousands)
Percentage of ownership
Carrying value
CDC Fanlu TaiwanHousing and building development and lease
566,646 391,646 56,664,562 35.00% 513,185 35.00% (88,646) " -
CDC MEGA Malaysia Real estate development 7,375 7,375 825,000 55.00% 22 55.00% (1,611) " -
CDC CDC US The U.S. Investment 2,061,080 2,061,080 5,000,000 100.00% 1,894,210 100.00% (10,045) " -
CDC CDCAM Malaysia Construction Management 7,524 7,524 1,000,000 100.00% 7,555 100.00% 399 " -
HDEC SDC Taiwan Construction projects 49,600 49,600 3,000,000 100.00% 39,746 100.00% 3,916 " -
HDEC NSC Taiwan
Pollution protection and other environmental sanitation
1,112,000 1,112,000 166,000,000 100.00% 2,813,985 100.00% 214,667 " -
HDEC BWC Taiwan
Pollution protection and other environmental sanitation
362,100 362,100 37,740,000 51.00% 443,833 51.00% 104,118 " -
HDEC PDC Taiwan
Pollution protection and other environmental sanitation
340,000 240,000 34,000,000 100.00% 339,131 100.00% (44) " -
HDEC CTCI-HDEC Taiwan
Pollution protection and other environmental sanitation
245,000 245,000 24,500,000 49.00% 232,352 49.00% (621) " -
HDEC LHC Taiwan
Pollution protection and other environmental sanitation
412,500 247,500 42,165,700 55.00% 470,048 55.00% 86,097 " -
(c) Information on investment in mainland China: None
(d) Major shareholders:
ShareholdingShareholder’s Name Shares Percentage
Wei-Dar Development Co., Ltd. 206,025,200 25.02%
Tamerton Group Limited 85,672,300 10.40%
Han-De Construction Co., Ltd. 63,755,667 7.74%
(14) Segment information: Operating segments required to be disclosed are categorized as Civil & Building Construction, Real Estate Development, Environmental Project Development, and Investment. The Group assessed performance of the segments based on the segments’ profit before tax, and report the amount of revenues based on the financial information used to prepare the consolidated financial report.1. Civil & Building Construction: construction and engineering.2. Real Estate Development: real estate development or lease.3. Environmental Project Development: construction of environmental protection project.4. Investment: to integrate operating strategy, supervising and monitoring each operating segments’operation, and control and
allocate each operating segments’operating resources.(a) Disclosure of the information on industrial departments
The reconciliation statements of all operating departments:
149
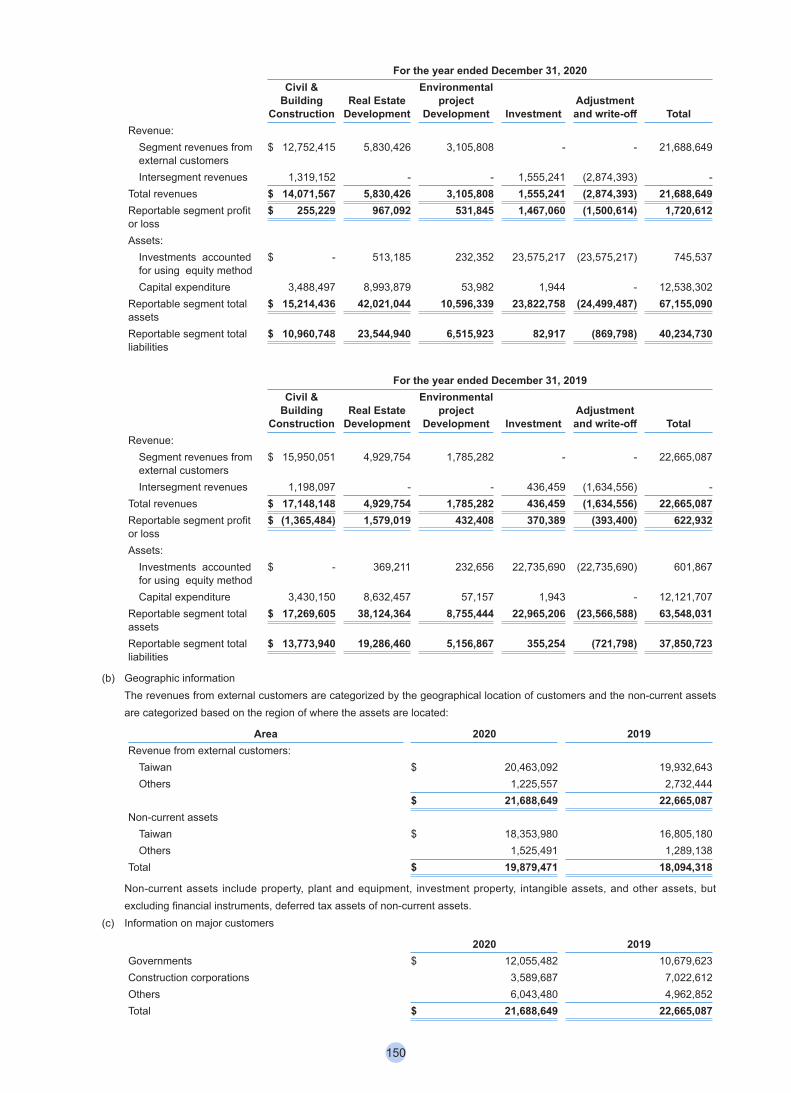
For the year ended December 31, 2020Civil &
Building Construction
Real Estate Development
Environmental project
Development InvestmentAdjustment and write-off Total
Revenue: Segment revenues from
external customers$ 12,752,415 5,830,426 3,105,808 - - 21,688,649
Intersegment revenues 1,319,152 - - 1,555,241 (2,874,393) -Total revenues $ 14,071,567 5,830,426 3,105,808 1,555,241 (2,874,393) 21,688,649Reportable segment profit or loss
$ 255,229 967,092 531,845 1,467,060 (1,500,614) 1,720,612
Assets: Investments accounted
for using equity method$ - 513,185 232,352 23,575,217 (23,575,217) 745,537
Capital expenditure 3,488,497 8,993,879 53,982 1,944 - 12,538,302Reportable segment total assets
$ 15,214,436 42,021,044 10,596,339 23,822,758 (24,499,487) 67,155,090
Reportable segment total liabilities
$ 10,960,748 23,544,940 6,515,923 82,917 (869,798) 40,234,730
For the year ended December 31, 2019Civil &
Building Construction
Real Estate Development
Environmental project
Development InvestmentAdjustment and write-off Total
Revenue: Segment revenues from
external customers$ 15,950,051 4,929,754 1,785,282 - - 22,665,087
Intersegment revenues 1,198,097 - - 436,459 (1,634,556) -Total revenues $ 17,148,148 4,929,754 1,785,282 436,459 (1,634,556) 22,665,087Reportable segment profit or loss
$ (1,365,484) 1,579,019 432,408 370,389 (393,400) 622,932
Assets: Investments accounted
for using equity method$ - 369,211 232,656 22,735,690 (22,735,690) 601,867
Capital expenditure 3,430,150 8,632,457 57,157 1,943 - 12,121,707Reportable segment total assets
$ 17,269,605 38,124,364 8,755,444 22,965,206 (23,566,588) 63,548,031
Reportable segment total liabilities
$ 13,773,940 19,286,460 5,156,867 355,254 (721,798) 37,850,723
(b) Geographic information The revenues from external customers are categorized by the geographical location of customers and the non-current assets are categorized based on the region of where the assets are located:
Area 2020 2019Revenue from external customers: Taiwan $ 20,463,092 19,932,643 Others 1,225,557 2,732,444
$ 21,688,649 22,665,087Non-current assets Taiwan $ 18,353,980 16,805,180 Others 1,525,491 1,289,138Total $ 19,879,471 18,094,318
Non-current assets include property, plant and equipment, investment property, intangible assets, and other assets, but excluding financial instruments, deferred tax assets of non-current assets.
(c) Information on major customers
2020 2019Governments $ 12,055,482 10,679,623Construction corporations 3,589,687 7,022,612Others 6,043,480 4,962,852Total $ 21,688,649 22,665,087
150
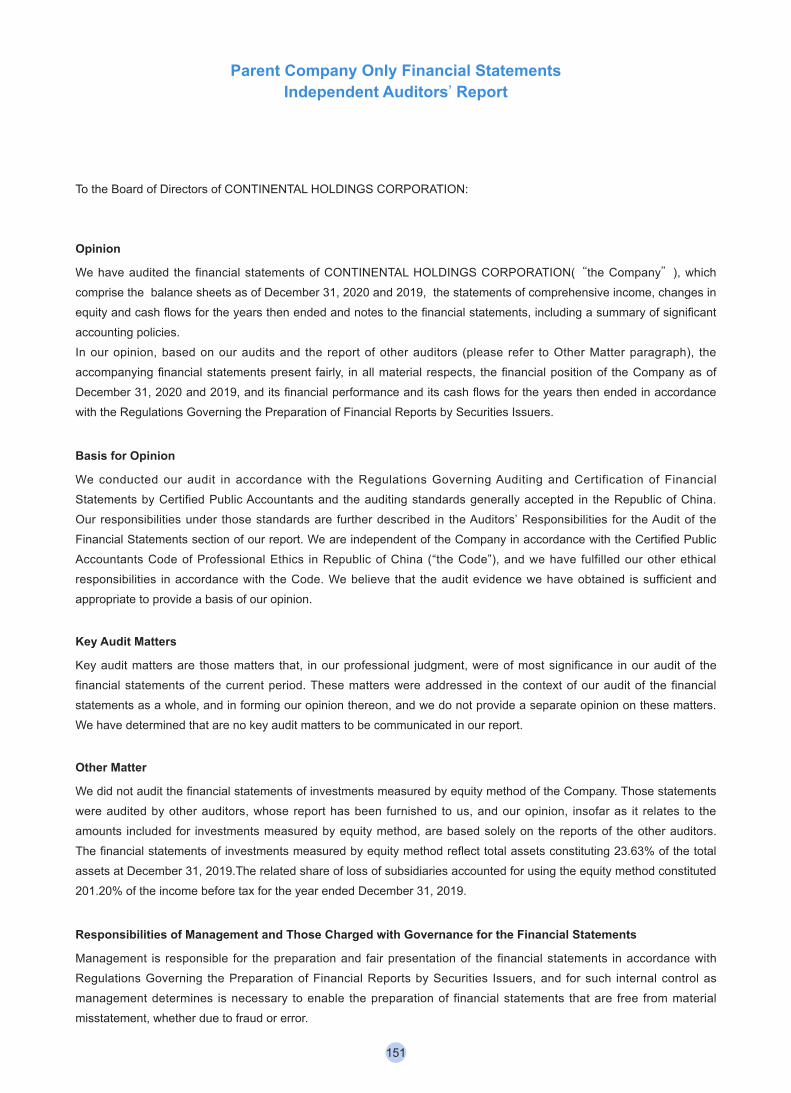
Parent Company Only Financial Statements Independent Auditors’ Report
To the Board of Directors of CONTINENTAL HOLDINGS CORPORATION:
Opinion
We have audited the financial statements of CONTINENTAL HOLDINGS CORPORATION(“the Company"), which comprise the balance sheets as of December 31, 2020 and 2019, the statements of comprehensive income, changes in equity and cash flows for the years then ended and notes to the financial statements, including a summary of significant accounting policies.In our opinion, based on our audits and the report of other auditors (please refer to Other Matter paragraph), the accompanying financial statements present fairly, in all material respects, the financial position of the Company as of December 31, 2020 and 2019, and its financial performance and its cash flows for the years then ended in accordance with the Regulations Governing the Preparation of Financial Reports by Securities Issuers.
Basis for Opinion
We conducted our audit in accordance with the Regulations Governing Auditing and Certification of Financial Statements by Certified Public Accountants and the auditing standards generally accepted in the Republic of China. Our responsibilities under those standards are further described in the Auditors’ Responsibilities for the Audit of the Financial Statements section of our report. We are independent of the Company in accordance with the Certified Public Accountants Code of Professional Ethics in Republic of China (“the Code”), and we have fulfilled our other ethical responsibilities in accordance with the Code. We believe that the audit evidence we have obtained is sufficient and appropriate to provide a basis of our opinion.
Key Audit Matters
Key audit matters are those matters that, in our professional judgment, were of most significance in our audit of the financial statements of the current period. These matters were addressed in the context of our audit of the financial statements as a whole, and in forming our opinion thereon, and we do not provide a separate opinion on these matters. We have determined that are no key audit matters to be communicated in our report.
Other Matter
We did not audit the financial statements of investments measured by equity method of the Company. Those statements were audited by other auditors, whose report has been furnished to us, and our opinion, insofar as it relates to the amounts included for investments measured by equity method, are based solely on the reports of the other auditors. The financial statements of investments measured by equity method reflect total assets constituting 23.63% of the total assets at December 31, 2019.The related share of loss of subsidiaries accounted for using the equity method constituted 201.20% of the income before tax for the year ended December 31, 2019.
Responsibilities of Management and Those Charged with Governance for the Financial Statements
Management is responsible for the preparation and fair presentation of the financial statements in accordance with Regulations Governing the Preparation of Financial Reports by Securities Issuers, and for such internal control as management determines is necessary to enable the preparation of financial statements that are free from material misstatement, whether due to fraud or error.
151
In preparing the financial statements, management is responsible for assessing the Company’s ability to continue as a going concern, disclosing, as applicable, matters related to going concern and using the going concern basis of accounting unless management either intends to liquidate the Company or to cease operations, or has no realistic alternative but to do so.
Those charged with governance (including the Audit Committee) are responsible for overseeing the Company’s financial reporting process.
Auditors’ Responsibilities for the Audit of the Financial Statements
Our objectives are to obtain reasonable assurance about whether the financial statements as a whole are free from material misstatement, whether due to fraud or error, and to issue an auditors’ report that includes our opinion. Reasonable assurance is a high level of assurance, but is not a guarantee that an audit conducted in accordance with the auditing standards generally accepted in the Republic of China will always detect a material misstatement when it exists. Misstatements can arise from fraud or error and are considered material if, individually or in the aggregate, they could reasonably be expected to influence the economic decisions of users taken on the basis of these financial statements.
As part of an audit in accordance with auditing standards generally accepted in the Republic of China, we exercise professional judgment and maintain professional skepticism throughout the audit. We also:
1. Identify and assess the risks of material misstatement of the financial statements, whether due to fraud or error, design and perform audit procedures responsive to those risks, and obtain audit evidence that is sufficient and appropriate to provide a basis for our opinion. The risk of not detecting a material misstatement resulting from fraud is higher than for one resulting from error, as fraud may involve collusion, forgery, intentional omissions, misrepresentations, or the override of internal control.
2. Obtain an understanding of internal control relevant to the audit in order to design audit procedures that are appropriate in the circumstances, but not for the purpose of expressing an opinion on the effectiveness of the Company’s internal control.
3. Evaluate the appropriateness of accounting policies used and the reasonableness of accounting estimates and related disclosures made by management.
4. Conclude on the appropriateness of management’s use of the going concern basis of accounting and, based on the audit evidence obtained, whether a material uncertainty exists related to events or conditions that may cast significant doubt on the Company’s ability to continue as a going concern. If we conclude that a material uncertainty exists, we are required to draw attention in our auditors’ report to the related disclosures in the financial statements or, if such disclosures are inadequate, to modify our opinion. Our conclusions are based on the audit evidence obtained up to the date of our auditors’ report. However, future events or conditions may cause the Company to cease to continue as a going concern.
5. Evaluate the overall presentation, structure and content of the financial statements, including the disclosures, and whether the financial statements represent the underlying transactions and events in a manner that achieves fair presentation.
6. Obtain sufficient and appropriate audit evidence regarding the financial information of the investment in other entities accounted for using the equity method to express an opinion on this financial statements. We are responsible for the direction, supervision and performance of the audit. We remain solely responsible for our audit opinion.
152
We communicate with those charged with governance regarding, among other matters, the planned scope and timing of the audit and significant audit findings, including any significant deficiencies in internal control that we identify during our audit.
We also provide those charged with governance with a statement that we have complied with relevant ethical requirements regarding independence, and to communicate with them all relationships and other matters that may reasonably be thought to bear on our independence, and where applicable, related safeguards.
From the matters communicated with those charged with governance, we determine those matters that were of most significance in the audit of the financial statements of the current period and are therefore the key audit matters. We describe these matters in our auditors’ report unless law or regulation precludes public disclosure about the matter or when, in extremely rare circumstances, we determine that a matter should not be communicated in our report because the adverse consequences of doing so would reasonably be expected to outweigh the public interest benefits of such communication.
The engagement partners on the audit resulting in this independent auditors’ report are Chung-Che Chen and Ti-Nuan Chien.
KPMGTaipei, Taiwan (Republic of China)March 16, 2021Chung-Che Chen and Ti-Nuan Chien
153
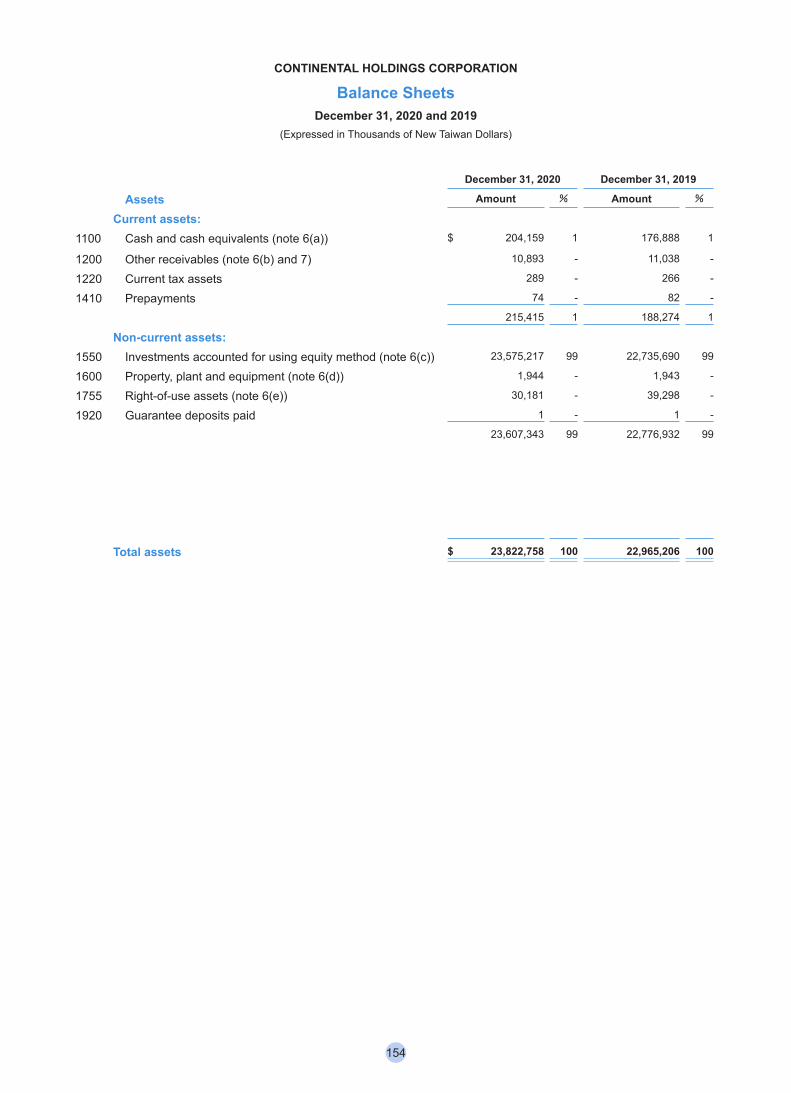
CONTINENTAL HOLDINGS CORPORATION
Balance SheetsDecember 31, 2020 and 2019
(Expressed in Thousands of New Taiwan Dollars)
December 31, 2020 December 31, 2019
Assets Amount % Amount %
Current assets:1100 Cash and cash equivalents (note 6(a)) $ 204,159 1 176,888 1
1200 Other receivables (note 6(b) and 7) 10,893 - 11,038 -
1220 Current tax assets 289 - 266 -
1410 Prepayments 74 - 82 -
215,415 1 188,274 1
Non-current assets:1550 Investments accounted for using equity method (note 6(c)) 23,575,217 99 22,735,690 99
1600 Property, plant and equipment (note 6(d)) 1,944 - 1,943 -
1755 Right-of-use assets (note 6(e)) 30,181 - 39,298 -
1920 Guarantee deposits paid 1 - 1 -
23,607,343 99 22,776,932 99
Total assets $ 23,822,758 100 22,965,206 100
154
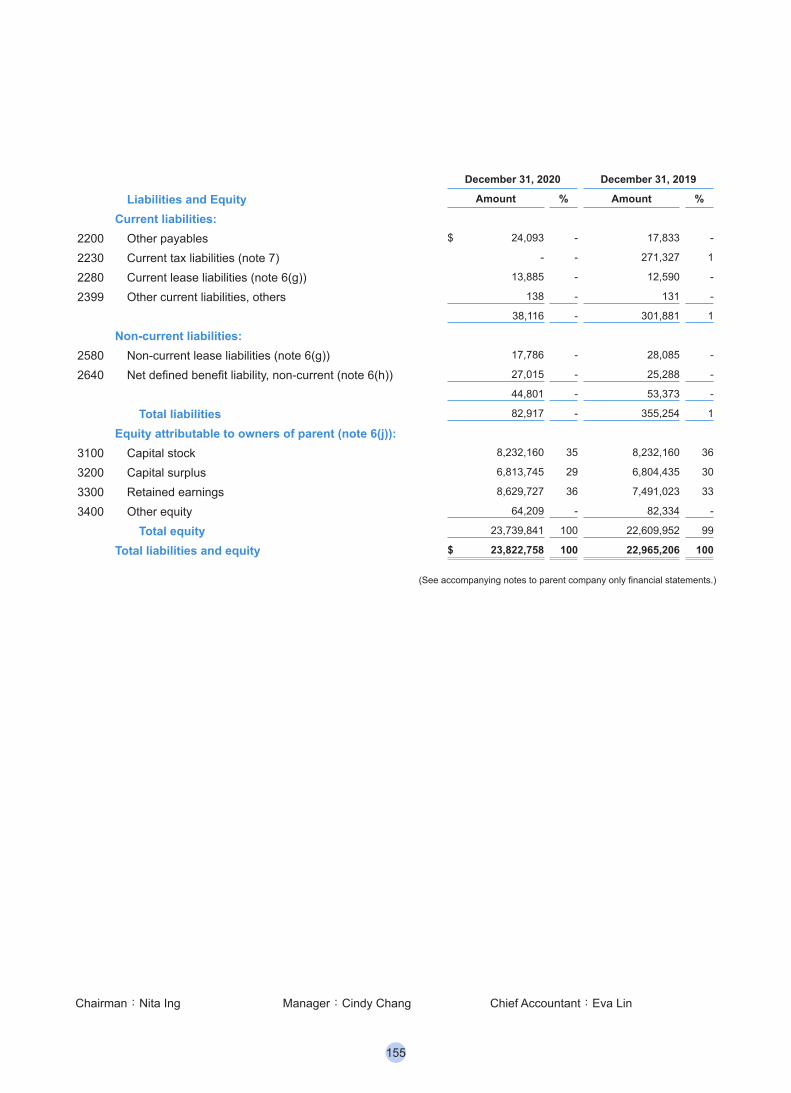
December 31, 2020 December 31, 2019
Liabilities and Equity Amount % Amount %
Current liabilities:2200 Other payables $ 24,093 - 17,833 -
2230 Current tax liabilities (note 7) - - 271,327 1
2280 Current lease liabilities (note 6(g)) 13,885 - 12,590 -
2399 Other current liabilities, others 138 - 131 -
38,116 - 301,881 1
Non-current liabilities:2580 Non-current lease liabilities (note 6(g)) 17,786 - 28,085 -
2640 Net defined benefit liability, non-current (note 6(h)) 27,015 - 25,288 -
44,801 - 53,373 -
Total liabilities 82,917 - 355,254 1
Equity attributable to owners of parent (note 6(j)):3100 Capital stock 8,232,160 35 8,232,160 36
3200 Capital surplus 6,813,745 29 6,804,435 30
3300 Retained earnings 8,629,727 36 7,491,023 33
3400 Other equity 64,209 - 82,334 -
Total equity 23,739,841 100 22,609,952 99
Total liabilities and equity $ 23,822,758 100 22,965,206 100
(See accompanying notes to parent company only financial statements.)
Chairman:Nita Ing Manager:Cindy Chang Chief Accountant:Eva Lin
155
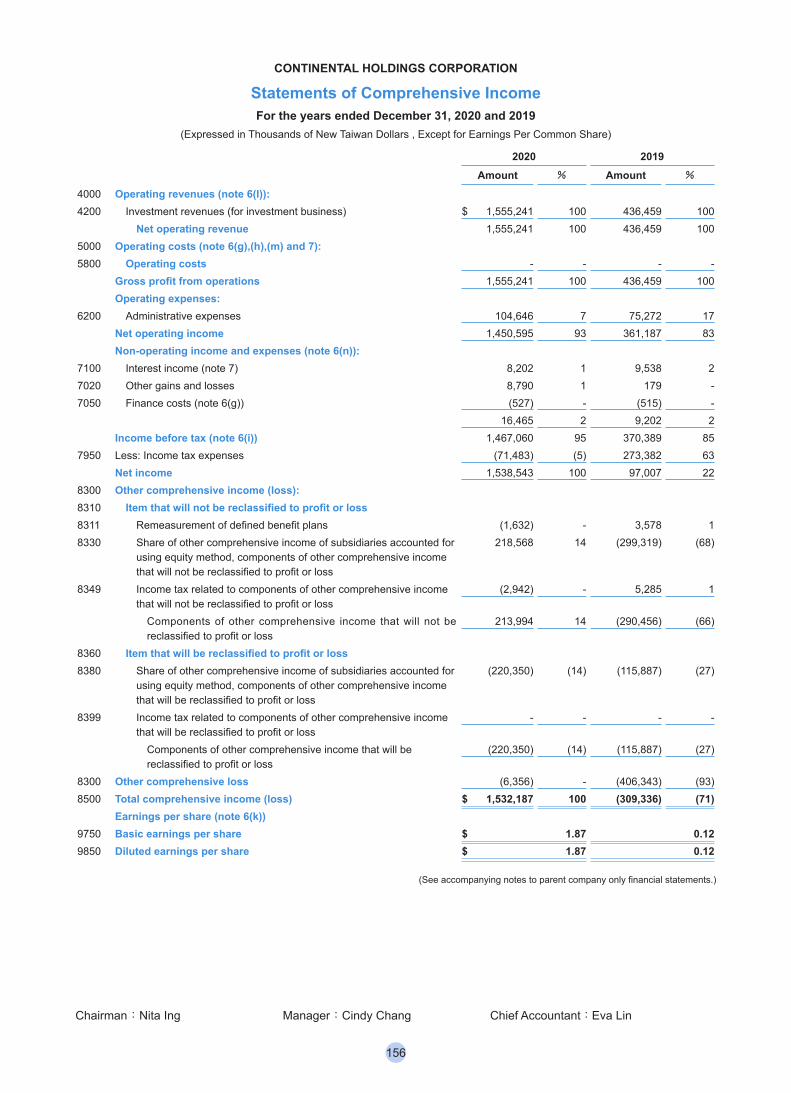
CONTINENTAL HOLDINGS CORPORATION
Statements of Comprehensive IncomeFor the years ended December 31, 2020 and 2019
(Expressed in Thousands of New Taiwan Dollars , Except for Earnings Per Common Share)
2020 2019Amount % Amount %
4000 Operating revenues (note 6(l)):4200 Investment revenues (for investment business) $ 1,555,241 100 436,459 100
Net operating revenue 1,555,241 100 436,459 1005000 Operating costs (note 6(g),(h),(m) and 7):5800 Operating costs - - - -
Gross profit from operations 1,555,241 100 436,459 100Operating expenses:
6200 Administrative expenses 104,646 7 75,272 17Net operating income 1,450,595 93 361,187 83Non-operating income and expenses (note 6(n)):
7100 Interest income (note 7) 8,202 1 9,538 27020 Other gains and losses 8,790 1 179 -7050 Finance costs (note 6(g)) (527) - (515) -
16,465 2 9,202 2Income before tax (note 6(i)) 1,467,060 95 370,389 85
7950 Less: Income tax expenses (71,483) (5) 273,382 63Net income 1,538,543 100 97,007 22
8300 Other comprehensive income (loss): 8310 Item that will not be reclassified to profit or loss8311 Remeasurement of defined benefit plans (1,632) - 3,578 18330 Share of other comprehensive income of subsidiaries accounted for
using equity method, components of other comprehensive income that will not be reclassified to profit or loss
218,568 14 (299,319) (68)
8349 Income tax related to components of other comprehensive income that will not be reclassified to profit or loss
(2,942) - 5,285 1
Components of other comprehensive income that will not be reclassified to profit or loss
213,994 14 (290,456) (66)
8360 Item that will be reclassified to profit or loss8380 Share of other comprehensive income of subsidiaries accounted for
using equity method, components of other comprehensive income that will be reclassified to profit or loss
(220,350) (14) (115,887) (27)
8399 Income tax related to components of other comprehensive income that will be reclassified to profit or loss
- - - -
Components of other comprehensive income that will be reclassified to profit or loss
(220,350) (14) (115,887) (27)
8300 Other comprehensive loss (6,356) - (406,343) (93)8500 Total comprehensive income (loss) $ 1,532,187 100 (309,336) (71)
Earnings per share (note 6(k))9750 Basic earnings per share $ 1.87 0.129850 Diluted earnings per share $ 1.87 0.12
(See accompanying notes to parent company only financial statements.)
Chairman:Nita Ing Manager:Cindy Chang Chief Accountant:Eva Lin
156
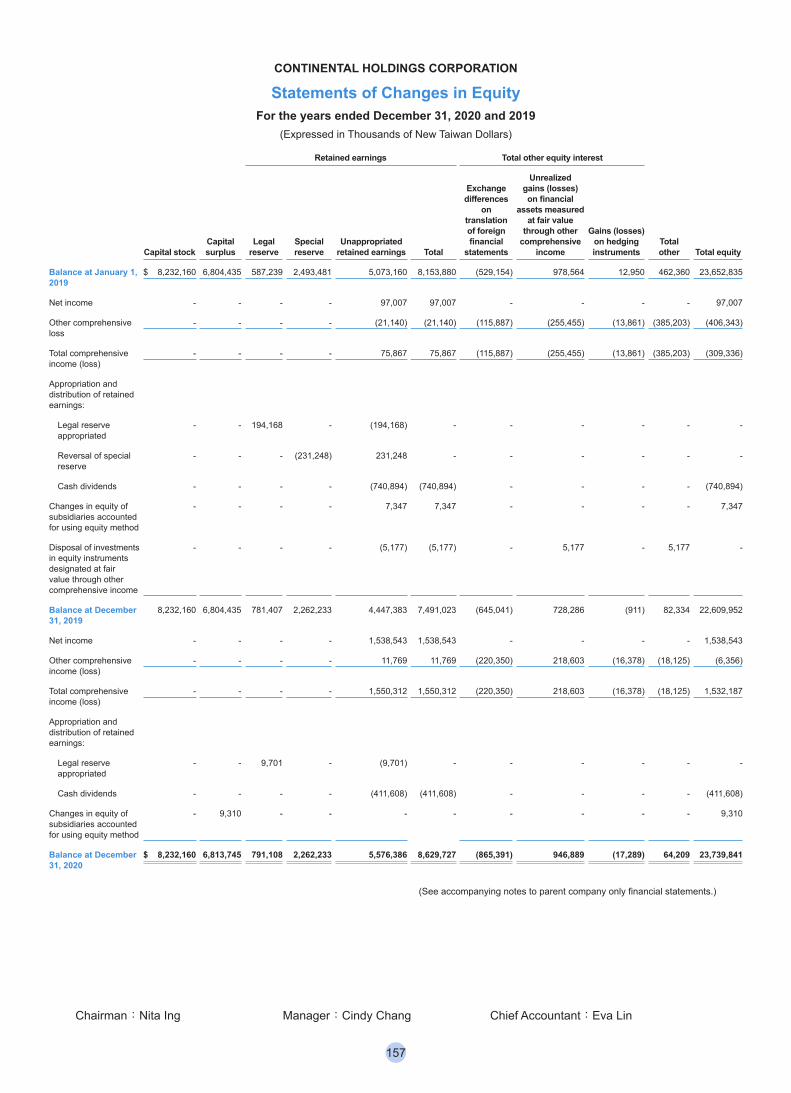
CONTINENTAL HOLDINGS CORPORATION
Statements of Changes in EquityFor the years ended December 31, 2020 and 2019
(Expressed in Thousands of New Taiwan Dollars)
Retained earnings Total other equity interest
Capital stockCapital surplus
Legal reserve
Special reserve
Unappropriated retained earnings Total
Exchange differences
on translation of foreign financial
statements
Unrealized gains (losses) on financial
assets measured at fair value
through other comprehensive
income
Gains (losses) on hedging instruments
Total other Total equity
Balance at January 1, 2019
$ 8,232,160 6,804,435 587,239 2,493,481 5,073,160 8,153,880 (529,154) 978,564 12,950 462,360 23,652,835
Net income - - - - 97,007 97,007 - - - - 97,007
Other comprehensive loss
- - - - (21,140) (21,140) (115,887) (255,455) (13,861) (385,203) (406,343)
Total comprehensive income (loss)
- - - - 75,867 75,867 (115,887) (255,455) (13,861) (385,203) (309,336)
Appropriation and distribution of retained earnings:
Legal reserve appropriated
- - 194,168 - (194,168) - - - - - -
Reversal of special reserve
- - - (231,248) 231,248 - - - - - -
Cash dividends - - - - (740,894) (740,894) - - - - (740,894)
Changes in equity of subsidiaries accounted for using equity method
- - - - 7,347 7,347 - - - - 7,347
Disposal of investments in equity instruments designated at fair value through other comprehensive income
-
-
-
-
(5,177)
(5,177)
-
5,177
-
5,177
-
Balance at December 31, 2019
8,232,160 6,804,435 781,407 2,262,233 4,447,383 7,491,023 (645,041) 728,286 (911) 82,334 22,609,952
Net income - - - - 1,538,543 1,538,543 - - - - 1,538,543
Other comprehensive income (loss)
- - - - 11,769 11,769 (220,350) 218,603 (16,378) (18,125) (6,356)
Total comprehensive income (loss)
- - - - 1,550,312 1,550,312 (220,350) 218,603 (16,378) (18,125) 1,532,187
Appropriation and distribution of retained earnings:
Legal reserve appropriated
- - 9,701 - (9,701) - - - - - -
Cash dividends - - - - (411,608) (411,608) - - - - (411,608)
Changes in equity of subsidiaries accounted for using equity method
-
9,310
-
-
-
- -
-
-
-
9,310
Balance at December 31, 2020
$ 8,232,160 6,813,745 791,108 2,262,233 5,576,386 8,629,727 (865,391) 946,889 (17,289) 64,209 23,739,841
(See accompanying notes to parent company only financial statements.)
Chairman:Nita Ing Manager:Cindy Chang Chief Accountant:Eva Lin
157
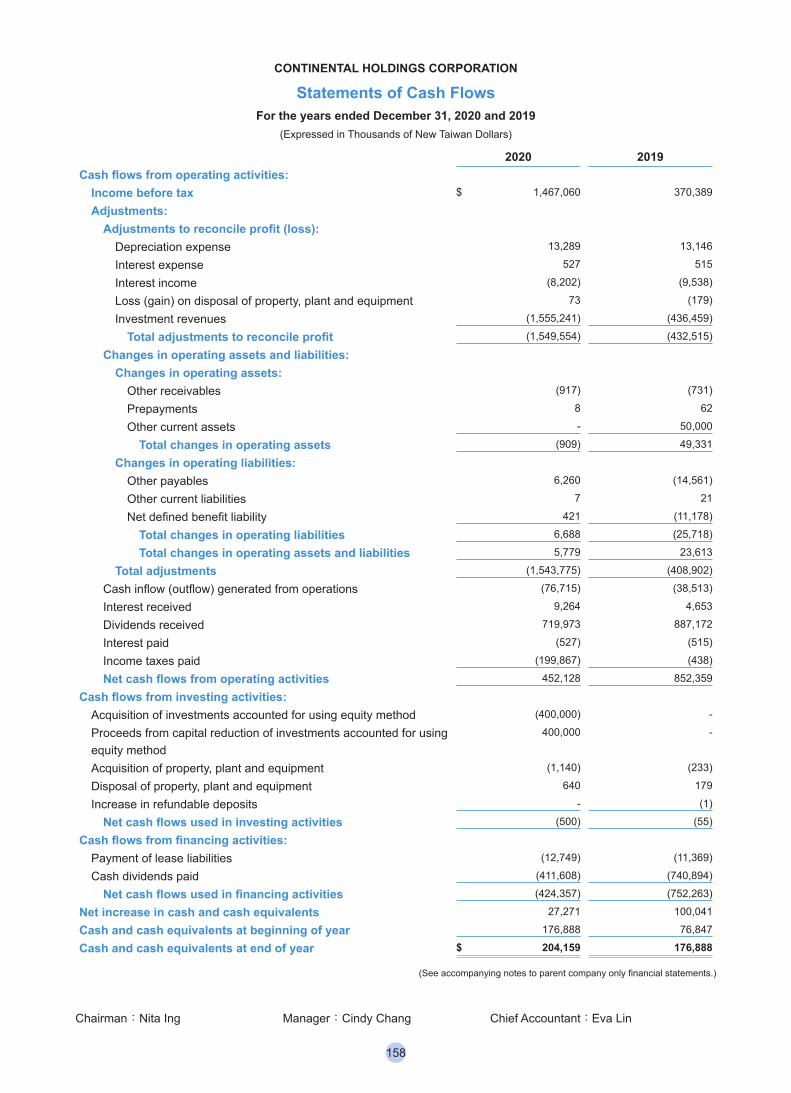
CONTINENTAL HOLDINGS CORPORATION
Statements of Cash FlowsFor the years ended December 31, 2020 and 2019
(Expressed in Thousands of New Taiwan Dollars)
2020 2019Cash flows from operating activities: Income before tax $ 1,467,060 370,389
Adjustments: Adjustments to reconcile profit (loss): Depreciation expense 13,289 13,146
Interest expense 527 515
Interest income (8,202) (9,538)
Loss (gain) on disposal of property, plant and equipment 73 (179)
Investment revenues (1,555,241) (436,459)
Total adjustments to reconcile profit (1,549,554) (432,515)
Changes in operating assets and liabilities: Changes in operating assets: Other receivables (917) (731)
Prepayments 8 62
Other current assets - 50,000
Total changes in operating assets (909) 49,331
Changes in operating liabilities: Other payables 6,260 (14,561)
Other current liabilities 7 21
Net defined benefit liability 421 (11,178)
Total changes in operating liabilities 6,688 (25,718)
Total changes in operating assets and liabilities 5,779 23,613
Total adjustments (1,543,775) (408,902)
Cash inflow (outflow) generated from operations (76,715) (38,513)
Interest received 9,264 4,653
Dividends received 719,973 887,172
Interest paid (527) (515)
Income taxes paid (199,867) (438)
Net cash flows from operating activities 452,128 852,359
Cash flows from investing activities: Acquisition of investments accounted for using equity method (400,000) -
Proceeds from capital reduction of investments accounted for using equity method
400,000 -
Acquisition of property, plant and equipment (1,140) (233)
Disposal of property, plant and equipment 640 179
Increase in refundable deposits - (1)
Net cash flows used in investing activities (500) (55)
Cash flows from financing activities: Payment of lease liabilities (12,749) (11,369)
Cash dividends paid (411,608) (740,894)
Net cash flows used in financing activities (424,357) (752,263)
Net increase in cash and cash equivalents 27,271 100,041
Cash and cash equivalents at beginning of year 176,888 76,847
Cash and cash equivalents at end of year $ 204,159 176,888
(See accompanying notes to parent company only financial statements.)
Chairman:Nita Ing Manager:Cindy Chang Chief Accountant:Eva Lin
158
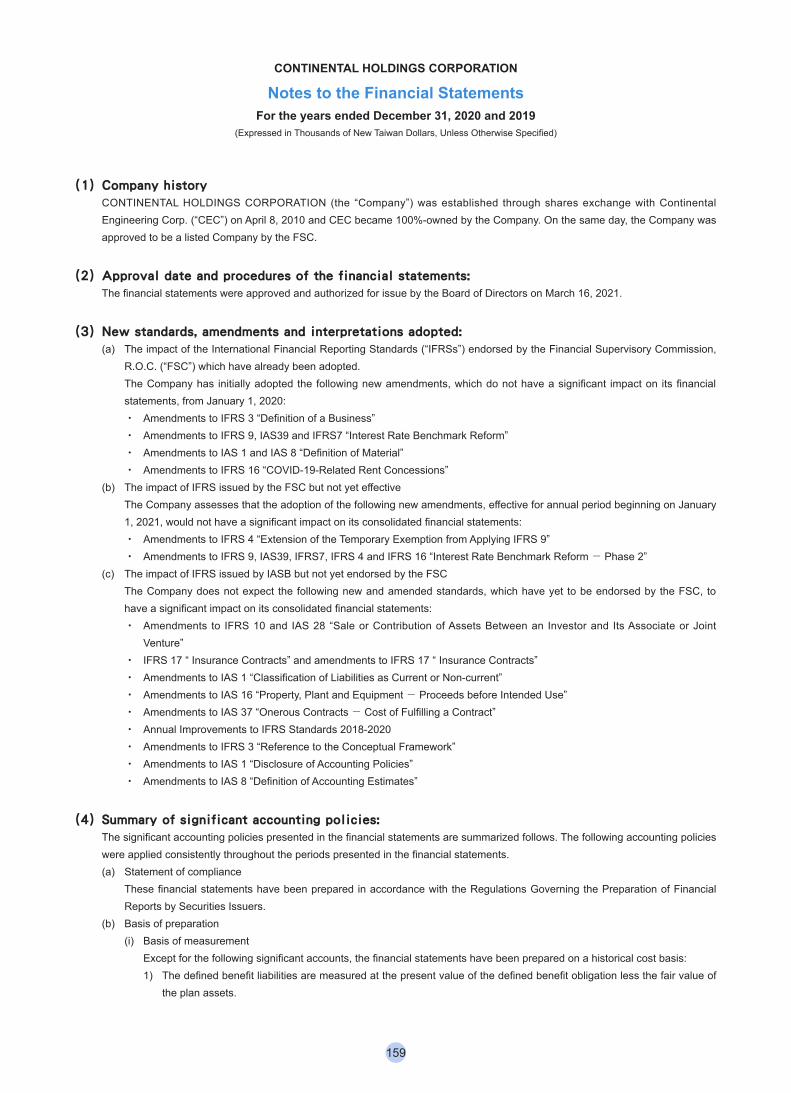
CONTINENTAL HOLDINGS CORPORATION
Notes to the Financial StatementsFor the years ended December 31, 2020 and 2019
(Expressed in Thousands of New Taiwan Dollars, Unless Otherwise Specified)
(1) Company historyCONTINENTAL HOLDINGS CORPORATION (the “Company”) was established through shares exchange with Continental Engineering Corp. (“CEC”) on April 8, 2010 and CEC became 100%-owned by the Company. On the same day, the Company was approved to be a listed Company by the FSC.
(2) Approval date and procedures of the financial statements: The financial statements were approved and authorized for issue by the Board of Directors on March 16, 2021.
(3) New standards, amendments and interpretations adopted: (a) The impact of the International Financial Reporting Standards (“IFRSs”) endorsed by the Financial Supervisory Commission,
R.O.C. (“FSC”) which have already been adopted.The Company has initially adopted the following new amendments, which do not have a significant impact on its financial statements, from January 1, 2020:‧ Amendments to IFRS 3 “Definition of a Business”‧ Amendments to IFRS 9, IAS39 and IFRS7 “Interest Rate Benchmark Reform”‧ Amendments to IAS 1 and IAS 8 “Definition of Material”‧ Amendments to IFRS 16 “COVID-19-Related Rent Concessions”
(b) The impact of IFRS issued by the FSC but not yet effectiveThe Company assesses that the adoption of the following new amendments, effective for annual period beginning on January 1, 2021, would not have a significant impact on its consolidated financial statements:‧ Amendments to IFRS 4 “Extension of the Temporary Exemption from Applying IFRS 9”‧ Amendments to IFRS 9, IAS39, IFRS7, IFRS 4 and IFRS 16 “Interest Rate Benchmark Reform- Phase 2”
(c) The impact of IFRS issued by IASB but not yet endorsed by the FSCThe Company does not expect the following new and amended standards, which have yet to be endorsed by the FSC, to have a significant impact on its consolidated financial statements:‧ Amendments to IFRS 10 and IAS 28 “Sale or Contribution of Assets Between an Investor and Its Associate or Joint
Venture”‧ IFRS 17 “ Insurance Contracts” and amendments to IFRS 17 “ Insurance Contracts”‧ Amendments to IAS 1 “Classification of Liabilities as Current or Non-current”‧ Amendments to IAS 16 “Property, Plant and Equipment- Proceeds before Intended Use”‧ Amendments to IAS 37 “Onerous Contracts- Cost of Fulfilling a Contract”‧ Annual Improvements to IFRS Standards 2018-2020‧ Amendments to IFRS 3 “Reference to the Conceptual Framework”‧ Amendments to IAS 1 “Disclosure of Accounting Policies”‧ Amendments to IAS 8 “Definition of Accounting Estimates”
(4) Summary of significant accounting policies: The significant accounting policies presented in the financial statements are summarized follows. The following accounting policies were applied consistently throughout the periods presented in the financial statements.(a) Statement of compliance
These financial statements have been prepared in accordance with the Regulations Governing the Preparation of Financial Reports by Securities Issuers.
(b) Basis of preparation (i) Basis of measurement
Except for the following significant accounts, the financial statements have been prepared on a historical cost basis:1) The defined benefit liabilities are measured at the present value of the defined benefit obligation less the fair value of
the plan assets.
159
(ii) Functional and presentation currencyThe functional currency of the Company is determined based on the primary economic environment in which the Company operates. The Company’s financial statements are presented in New Taiwan Dollars, which is the Company’s functional currency. All financial information presented in New Taiwan Dollar has been rounded to the nearest thousand.
(c) Classification of current and non-current assets and liabilities An asset is classified as current under one of the following criteria, and all other assets are classified as non-current.(i) It expects to realize the asset, or intends to sell or consume it, in its normal operating cycle;(ii) It holds the asset primarily for the purpose of trading;(iii) It expects to realize the asset within twelve months after the reporting period; or (iv) The asset is cash and cash equivalent unless the asset is restricted from being exchanged or used to settle a liability for
at least twelve months after the reporting period.A liability is classified as current under one of the following criteria, and all other liabilities are classified as non-current.(i) It expects to settle the liability in its normal operating cycle;(ii) It holds the liability primarily for the purpose of trading;(iii) The liability is due to be settled within twelve months after the reporting period; or (iv) The Company does not have an unconditional right to defer settlement of the liability for at least twelve months after the
reporting period. Terms of a liability that could, at the option of the counterparty, result in its settlement by the issue of equity instruments do not affect its classification.
(d) Cash and cash equivalents Cash comprises cash on hand, and demand deposits. Cash equivalents are short-term, highly liquid investments that are readily convertible to known amounts of cash and are subject to an insignificant risk of changes in value. Time deposits which meet the above definition and are held for the purpose of meeting short-term cash commitments rather than for investment or other purposes that should be recognized as cash equivalents.
(e) Financial instruments Account receivables and debt securities issued are initially recognized when they are originated. All other financial assets and financial liabilities are initially recognized when the Company becomes a party to the contractual provisions of the instrument. An accounts receivable without a significant financing component is initially measured at the transaction price.(i) Financial assets
A financial asset is classified as measured at amortized cost. Financial assets are not reclassified subsequent to their initial recognition unless the Company changes its business model for managing financial assets, in which case all affected financial assets are reclassified on the first day of the first reporting period following the change in the business model. 1) Financial assets measured at amortized cost
A financial asset is measured at amortized cost if it meets both of the following conditions and is not designated as at FVTPL:‧ it is held within a business model whose objective is to hold assets to collect contractual cash flows; and‧ its contractual terms give rise on specified dates to cash flows that are solely payments of principal and interest on
the principal amount outstanding.These assets are subsequently measured at amortized cost, which is the amount at which the financial asset is measured at initial recognition, plus/minus, the cumulative amortization using the effective interest method, adjusted for any loss allowance. Interest income and impairment are recognized in profit or loss. Any gain or loss on derecognition is recognized in profit or loss.
2) Assessment whether contractual cash flows are solely payments of principal and interestFor the purposes of this assessment, ‘principal’ is defined as the fair value of the financial assets on initial recognition. ‘Interest’ is defined as consideration for the time value of money and for the credit risk associated with the principal amount outstanding during a particular period of time and for other basic lending risks and costs, as well as a profit margin.In assessing whether the contractual cash flows are solely payments of principal and interest, the Company considers the contractual terms of the instrument. This includes assessing whether the financial asset contains a contractual term that could change the timing or amount of contractual cash flows such that it would not meet this condition. In making this assessment, the Company considers:‧ contingent events that would change the amount or timing of cash flows;‧ terms that may adjust the contractual coupon rate, including variable rate features;‧ prepayment and extension features; and‧ terms that limit the Company’s claim to cash flows from specified assets (e.g. non-recourse features)
160
3) Impairment of financial assetsThe Company recognizes loss allowances for expected credit losses (ECL) on financial assets measured at amortized cost (including cash and cash equivalents, and other receivables).The Company measures loss allowances at an amount equal to lifetime ECL, except for the following which are measured as 12-month ECL:‧ Bank balances for which credit risk (i.e. the risk of default occurring over the expected life of the financial
instrument) has not increased significantly since initial recognition.Loss allowance for accounts receivable are always measured at an amount equal to lifetime ECL.When determining whether the credit risk of a financial asset has increased significantly since initial recognition and when estimating ECL, the Company considers reasonable and supportable information that is relevant and available without undue cost or effort. This includes both quantitative and qualitative information and analysis based on the Company’s historical experience and informed credit assessment as well as forwardlooking information.Lifetime ECLs are the ECLs that result from all possible default events over the expected life of a financial instrument.12-month ECLs are the portion of ECLs that result from default events that are possible within the 12 months after the reporting date (or a shorter period if the expected life of the instrument is less than 12 months).The maximum period considered when estimating ECLs is the maximum contractual period over which the Company is exposed to credit risk.ECLs are a probability-weighted estimate of credit losses. Credit losses are measured as the present value of all cash shortfalls (i.e the difference between the cash flows due to the Company in accordance with the contract and the cash flows that the Company expects to receive). ECLs are discounted at the effective interest rate of the financial asset.At each reporting date, the Company assesses whether financial asset carried at amortized cost are credit-impaired. A financial asset is ‘credit-impaired’ when one or more events that have a detrimental impact on the estimated future cash flows of the financial asset have occurred. Evidence that a financial assets is credit-impaired includes the following observable data:‧ significant financial difficulty of the borrower or issuer;‧ a breach of contract such as a default or being more than 90 days past due;‧ the lender of the borrower, for economic or contractual reasons relating to the borrower’s financial difficulty, having
granted to the borrower a concession that the lender would not otherwise consider;‧ it is probable that the borrower will enter bankruptcy or other financial reorganization; or‧ the disappearance of an active market for a security because of financial difficulties.Loss allowances for financial assets measured at amortized cost are deducted from the gross carrying amount of the assets.The gross carrying amount of a financial asset is written off when the Company has no reasonable expectations of recovering a financial asset in its entirety or a portion thereof. The Company individually makes an assessment with respect to the timing and amount of write-off based on whether there is a reasonable expectation of recovery. The Company expects no significant recovery from the amount written-off.However, financial assets that are written off could still be subject to enforcement activities in order to comply with the Company’s procedures for recovery of amounts due.
4) Derecognition of financial assetsThe Company derecognizes a financial asset when the contractual rights to the cash flows from the financial asset expire, or it transfers the rights to receive the contractual cash flows in a transaction in which substantially all of the risks and rewards of ownership of the financial asset are transferred or in which the Company neither transfers nor retains substantially all of the risks and rewards of ownership and it does not retain control of the financial asset. The Company enters into transactions whereby it transfers assets recognized in its statement of balance sheet, but retains either all or substantially all of the risks and rewards of the transferred assets. In these cases, the transferred assets are not derecognized.
(ii) Financial liabilities1) Financial liabilities
Financial liabilities are classified as measured at amortized cost.Other financial liabilities are subsequently measured at amortized cost using the effective interest method. Interest expense and foreign exchange gains and losses are recognized in profit or loss. Any gain or loss on derecognition is also recognized in profit or loss.
2) Derecognition of financial liabilitiesThe Company derecognizes a financial liability when its contractual obligations has been discharged, cancelled, or expired. The Company also derecognizes a financial liability when its terms are modified and the cash flows of the modified liability are substantially different, in which case a new financial liability based on the modified terms is recognized at fair value.
161
On derecognition of a financial liability, the difference between the carrying amount of a financial liability extinguished and the consideration paid (including any non-cash assets transferred or liabilities assumed) is recognized in profit or loss.
(f) Subsidiaries The subsidiaries in which the Company holds controlling interest are accounted for under equity method in the financial statements. Under equity method, the net income, other comprehensive income and equity in the financial statement are the same as those attributable to the owners of parent in the consolidated financial statements. The changes of equity not losing controlling are regarded as the trading of equity between the Company and the owners.
(g) Property, plant and equipment (i) Recognition and measurement
Items of property, plant and equipment are measured at cost, which includes capitalized borrowing costs, less accumulated depreciation and any accumulated impairment losses. If significant parts of an item of property, plant and equipment have different useful lives, they are accounted for as separate items (major components) of property, plant and equipment.Any gain or loss on disposal of an item of property, plant and equipment is recognized in profit or loss.
(ii) Subsequent expenditureSubsequent expenditure is capitalized only if it is probable that the future economic benefits associated with the expenditure will flow to the Company.
(iii) DepreciationDepreciation is calculated on the cost of an asset less its residual value and is recognized in profit or loss on a straight-line basis over the estimated useful lives of each component of an item of property, plant and equipment. Depreciation methods, useful lives and residual values are reviewed at each reporting date and adjusted if appropriate.The estimated useful lives of property, plant and equipment are as follows:
Transportation equipment 5 yearsComputer equipment 3 yearsOffice equipment 3-5 years
(h) Leases (i) Identifying a lease
At inception of a contract, the Company assesses whether a contract is, or contains, a lease. A contract is, or contains, a lease if the contract conveys the right to control the use of an identified asset for a period of time in exchange for consideration. To assess whether a contract conveys the right to control the use of an identified asset, the Company assesses whether:1) the contract involves the use of an identified asset – this may be specified explicitly or implicitly, and should be
physically distinct or represent substantially all of the capacity of a physically distinct asset. If the supplier has a substantive substitution right, then the asset is not identified; and
2) the Company has the right to obtain substantially all of the economic benefits from use of the asset throughout the period of use; and
3) the Company has the right to direct the use of the asset throughout the period of use only if either:‧ the Company has the right to direct how and for what purpose the asset is used throughout the period of use; or‧ the relevant decisions about how and for what purpose the asset is used are predetermined and:- the Company has the right to operate the asset throughout the period of use, without the supplier having the
right to change those operating instructions; or- the Company designed the asset in a way that predetermines how and for what purpose it will be used
throughout the period of use.When the lease is established or the contract is re-evaluated to determine whether the lease is included in the contract, the Company will allocate the consideration in the contract to individual lease components on a relative individual price basis.
(ii) As a leaseeThe Company recognizes a right-of-use asset and a lease liability at the lease commencement date. The right-of-use asset is initially measured at cost, which comprises the initial amount of the lease liability adjusted for any lease payments made at or before the commencement date, plus any initial direct costs incurred and an estimate of costs to dismantle and remove the underlying asset or to restore the underlying asset or the site on which it is located, less any lease incentives received.The right-of-use asset is subsequently depreciated using the straight-line method from the commencement date to the earlier of the end of the useful life of the right-of-use asset or the end of the lease term. In addition, the right-of-use asset is periodically reduced by impairment losses, if any, and adjusted for certain remeasurements of the lease liability.
162
The lease liability is initially measured at the present value of the lease payments that are not paid at the commencement date, discounted using the interest rate implicit in the lease or, if that rate cannot be reliably determined, the Company’s incremental borrowing rate.Lease payments included in the measurement of the lease liability comprise the following:- fixed payments;- variable lease payments that depend on an index or a rate, initially measured using the index or rate as at the
commencement date;- amounts expected to be payable under a residual value guarantee; and- payments for purchase or termination options that are reasonably certain to be exercised.The lease liability is measured at amortized cost using the effective interest method. It is remeasured when:- there is a change in future lease payments arising from the change in an index or rate; or- there is a change in the Company’s estimate of the amount expected to be payable under a residual value guarantee;
or- there is a change in the lease term resulting from a change of its assessment on whether it will exercise an option to
purchase the underlying asset, or- there is a change of its assessment on whether it will exercise a purchase, extension or termination option; or- there is any lease modificationsWhen the lease liability is remeasured, other than lease modifications, a corresponding adjustment is made to the carrying amount of the right-of-use asset, or in profit and loss if the carrying amount of the right-of-use asset has been reduced to zero.When the lease liability is remeasured to reflect the partial or full termination of the lease for lease modifications that decrease the scope of the lease, the Company accounts for the remeasurement of the lease liability by decreasing the carrying amount of the right-of-use asset to reflect the partial or full termination of the lease, and recognize in profit or loss any gain or loss relating to the partial or full termination of the lease.The Company has elected not to recognize right-of-use assets and lease liabilities for short-term leases of building and machinery that have a lease term of 12 months or less and leases of low-value assets. The Company recognizes the lease payments associated with these leases as an expense on a straight-line basis over the lease term.As a practical expedient, the Company elects not to assess all rent concessions that meets all the conditions as follows are lease modifications or not:1) the rent concessions occurring as a direct con sequence of the COVID-19 pandemic;2) the change in lease payments results in revised consideration for the lease that is substantially the same as, or less
than, the consideration for the lease immediately preceding the change;3) any reduction in lease payments affects only payments originally due on or before 30 June 2021; and4) there is no substantive change to other terms and conditions of the lease.In accordance with the practical expedient, the effect of the change in the lease liability is reflected in profit or loss in the period in which the event or condition that triggers the rent concession occurs.
(i) Impairment of non-derivative financial assets At each reporting date, the Company reviews the carrying amounts of its non-financial assets to determine whether there is any indication of impairment. If any such indication exists, then the asset’s recoverable amount is estimated.For impairment testing, assets are grouped together into the smallest group of assets that generates cash inflows from continuing use that are largely independent of the cash inflows of other assets or cash generating units (CGUs).The recoverable amount of an asset or CGU is the greater of its value in use and its fair value less costs to sell.An impairment loss is recognized if the carrying amount of an asset or CGU exceeds its recoverable amount. Impairment losses are recognized in profit or loss.An impairment loss in respect of goodwill is not reversed. For other assets, an impairment loss is reversed only to the extent that the asset’s carrying amount does not exceed the carrying amount that would have been determined, net of depreciation or amortization, if no impairment loss had been recognized.
(j) Employee benefits (i) Defined contribution plans
Obligations for contributions to defined contribution plans are expensed as the related service is provided. (ii) Defined benefit plans
The Company’s net obligation in respect of defined benefit plans is calculated separately for each the plan by estimating the amount of future benefit that employees have earned in the current and prior periods, discounting that amount and deducting the fair value of any plan assets.
163
The calculation of defined benefit obligations is performed annually by a qualified actuary using the projected unit credit method. When the calculation results in a potential asset for the Company, the recognized asset is limited to the present value of economic benefits available in the form of any future refunds from the plan or reductions in future contributions to the plan. To calculate the present value of economic benefits, consideration is given to any applicable minimum funding requirements.Remeasurements of the net defined benefit liability, which comprise actuarial gains and losses, the return on plan assets (excluding interest) and the effect of the asset ceiling (if any, excluding interest), are recognized immediately in other comprehensive income, and accumulated in retained earnings within equity. The Company determines the net interest expense (income) on the net defined benefit liability (asset) for the period by applying the discount rate used to measure the defined benefit obligation at the beginning of the annual period to the then-net defined benefit liability (asset). Net interest expense and other expenses related to defined benefit plans are recognized in profit or loss.When the benefits of a plan are changed or when a plan is curtailed, the resulting change in benefit that relates to past service or the gain or loss on curtailment is recognized immediately in profit or loss. The Company recognizes gains and losses on the settlement of a defined benefit plan when the settlement occurs.
(iii) Termination benefitsTermination benefits are expensed at the earlier of when the Company can no longer withdraw the offer of those benefits and when the Company recognizes costs for a restructuring. If benefits are not expected to be settled wholly within 12 months of the reporting date, then they are discounted.
(iv) Short-term employee benefitsShort-term employee benefits are expensed as the related service is provided.A liability is recognized for the amount expected to be paid if the Company has a present legal or constructive obligation to pay this amount as a result of past service provided by the employee and the obligation can be estimated reliably.
(k) Income Taxes Income taxes comprise current taxes and deferred taxes. Except for expenses related to business combinations or recognized directly in equity or other comprehensive income, all current and deferred taxes are recognized in profit or loss.Current taxes comprise the expected tax payables or receivables on the taxable profits (losses) for the year and any adjustment to the tax payable or receivable in respect of previous years. The amount of current tax payables or receivables are the best estimate of the tax amount expected to be paid or received. It is measured using tax rates enacted or substantively enacted at the reporting date.Deferred taxes arise due to temporary differences between the carrying amounts of assets and liabilities for financial reporting purposes and their respective tax bases. Deferred taxes are recognized except for the following: (i) temporary differences on the initial recognition of assets and liabilities in a transaction that is not a business combination
and that affects neither accounting nor taxable profits (losses) at the time of the transaction;(ii) temporary differences related to investments in subsidiaries, associates and joint arrangements to the extent that the
Company is able to control the timing of the reversal of the temporary differences and it is probable that they will not reverse in the foreseeable future; and
(iii) taxable temporary differences arising on the initial recognition of goodwill.Deferred taxes are measured at tax rates that are expected to be applied to temporary differences when they reserve, using tax rates enacted or substantively enacted at the reporting date.Deferred tax assets and liabilities are offset if the following criteria are met:(i) the Company has a legally enforceable right to set off current tax assets against current tax liabilities; and(ii) the deferred tax assets and the deferred tax liabilities relate to income taxes levied by the same taxation authority on
either:1) the same taxable entity; or2) different taxable entities which intend to settle current tax assets and liabilities on a net basis, or to realize the assets
and liabilities simultaneously, in each future period in which significant amounts of deferred tax liabilities or assets are expected to be settled or recovered.
Deferred tax assets are recognized for the carry forward of unused tax losses, unused tax credits, and deductible temporary differences to the extent that it is probable that future taxable profits will be available against which they can be utilized. Deferred tax assets are reviewed at each reporting date and are reduced to the extent that it is no longer probable that the related tax benefits will be realized; such reductions are reversed when the probability of future taxable profits improves. Although the adoption of consolidated tax return system by the Company, calculation for income tax still abide by the abovementioned accounting principles. Based on the consolidated income tax reported by the Company, it needs to adjust the current tax assets or liabilities for the Company.
164
(l) Earnings per share Disclosures are made of basic and diluted earnings per share attributable to ordinary equity holders of the Company. The basic earnings per share are calculated based on the profit attributable to the ordinary shareholders of the Company divided by weighted-average number of ordinary shares outstanding. The diluted earnings per share are calculated based on the profit attributable to the ordinary shareholders of the Company, divided by weighted-average number of ordinary shares outstanding after adjustment for the effects of all potential dilutive ordinary shares, such as employee remuneration.
(m) Operating Segments Please refer to the consolidated financial report.
(5) Significant accounting assumptions and judgments, and major sources of estimation uncertainty:The preparation of the financial statements in conformity with the Regulations Governing the Preparation of Financial Reports by Securities Issuers requires management to make judgments, estimates, and assumptions that affect the application of the accounting policies and the reported amount of assets, liabilities, income, and expenses. Actual results may differ from these estimates.The management continues to monitor the accounting estimates and assumptions. The management recognizes any changes in accounting estimates during the period and the impact of those changes in accounting estimates in the following period.
(6) Explanation of significant accounts:(a) Cash and cash equivalents
December 31, 2020 December 31, 2019
Cash $ 20 70
Cash in banks 204,139 67,055
Cash equivalents - 109,763
Cash and cash equivalents $ 204,159 176,888
(i) The aforesaid cash and cash equivalents were not pledged as collateral.(ii) Time deposits were reclassified to other current assets.(iii) Please refer to Note 6(o) for sensitivity analysis and interest rate risk of financial assets and liabilities of the Company.
(b) Other receivables
December 31, 2020 December 31, 2019
Other receivables-related party $ 10,893 11,038
Less: Allowance for impairment - -
$ 10,893 11,038
Please refer to Note 6(o) for other credit risk information.(c) Investments accounted for using equity method
Equity-accounted investees of the Company as at the reporting date were as follows:
December 31, 2020 December 31, 2019
Subsidiaries $ 23,575,217 22,735,690
(i) SubsidiariesPlease refer to the consolidated financial statement.
(ii) GuaranteeAs of December 31, 2020 and 2019, the investments accounted for using equity method were not pledged as collateral.
(d) Property, plant and equipment Movements of the cost, depreciation, and impairment of property, plant and equipment of the Company for the years ended December 31, 2020 and 2019, were as follows:
165
Transportation equipment Office equipment
Computer equipment Total
Cost or deemed cost: Balance at January 1, 2020 $ 2,252 233 167 2,652 Additions 1,140 - - 1,140 Disposals (1,140) - (167) (1,307) Balance at December 31, 2020 $ 2,252 233 - 2,485 Balance at January 1, 2019 $ 4,432 - 167 4,599 Additions - 233 - 233 Disposals (2,180) - - (2,180) Balance at December 31, 2019 $ 2,252 233 167 2,652Depreciation and impairment losses: Balance at January 1, 2020 $ 517 25 167 709 Depreciation 375 51 - 426 Disposals (427) - (167) (594) Balance at December 31, 2020 $ 465 76 - 541 Balance at January 1, 2019 $ 2,322 - 167 2,489 Depreciation 375 25 - 400 Disposals (2,180) - - (2,180) Balance at December 31, 2019 $ 517 25 167 709Carrying amount Balance at December 31, 2020 $ 1,787 157 - 1,944 Balance at December 31, 2019 $ 1,735 208 - 1,943
As of December 31, 2020 and 2019, the property, plant and equipment were not pledged as collateral.(e) Right-of-use assets
The movements in the cost and depreciation of the leased buildings and transportation equipment were as follows:
BuildingsTransportation
equipment TotalCost: Balance at January 1, 2020 $ 50,672 1,372 52,044 Additions 2,232 1,514 3,746 Disposals - (1,372) (1,372) Balance at December 31, 2020 $ 52,904 1,514 54,418 Balance at of January 1, 2019 $ - - - Effects of retrospective application 50,672 1,372 52,044 Balance at December 31, 2019 $ 50,672 1,372 52,044Depreciation and impairment losses: Balance at January 1, 2020 $ 11,923 823 12,746 Depreciation 12,146 717 12,863 Disposals - (1,372) (1,372) Balance at December 31, 2020 $ 24,069 168 24,237 Balance at of January 1, 2019 $ - - - Depreciation 11,923 823 12,746 Balance at December 31, 2019 $ 11,923 823 12,746Carrying amounts: Balance at December 31, 2020 $ 28,835 1,346 30,181 Balance at December 31, 2019 $ 38,749 549 39,298
(f) Bonds payable On November 5, 2020, the Company’s Board of Directors decided to issue the secured ordinary corporate bond amounting to no more than $2 billion, which had been approved by the Taipei Exchange (TPEx) on December 31, 2020. The offering information and main rights and obligations were as follows:
166
Item 1st secured ordinary corporate bond issued in 2020Issued amount The bond was issued at $2 billion.Par value Each unit was valued at $1 million.Issued price The bond was issued at par value on the issued date.Tenor The bond issued with maturities of 5 years. The tenor was from January 11, 2021 to January 11, 2026.Coupon rate Fixed rate 0.55%.Repayment The principal of the bond will be repaid on the maturity.Interest Payment Interests was paid once a year at coupon rate since the issued date.Guarantee The corporate bond was guaranteed by Mega International Commercial Bank in accordance with the
counter indemnity agreements.
(g) Lease liabilities The Company’s lease liabilities were as follows:
December 31, 2020 December 31, 2019Current $ 13,885 12,590Non-current $ 17,786 28,085
For the maturity analysis, please refer to Note 6(o).The amounts recognized in profit or loss were as follows:
2020 2019Interest on lease liabilities $ 377 494Variable lease payments not included in the measurement of lease liabilities $ 836 766
The amounts recognized in the statement of cash flows for the Company was as follows:
2020 2019Total cash outflow for leases $ 13,962 12,629
(i) Real estate leasesAs of December 31, 2020, the Company leases buildings for its office space, with lease terms of five years. Some leases include an option to renew the lease for an additional period of the same duration after the end of the contract term.
(ii) Other leasesThe Company leases transportation equipment, with lease terms of three years.In addition, the Company leases office equipment and machinery, with lease terms of one to three years which are short-term or leases of low-value items. The Company has elected not to recognize right-of-use assets and leases liabilities for these leases.
(h) Employee benefits (i) Defined benefit plan
The present value of the defined benefit obligations and fair value of plan assets were as follows:
December 31, 2020 December 31, 2019Present value of defined benefit obligations $ 27,015 25,288Fair value of plan assets - -Net defined benefit liability $ 27,015 25,288
1) Composition of plan assetThe Company failed to comply with the Labor Standards Act. to compensate retirement funds.
2) Movements in present value of the defined benefit obligationsThe movements in present value of defined benefit obligations for the years ended December 31, 2020 and 2019 were as follows:
2020 2019Defined benefit obligation, January 1 $ 25,288 39,328Current service costs and interest 421 719Remeasurement of the net defined benefit liability (asset)- Actuarial gains arose from changes in financial
assumption 131 -
- Experience adjustments 1,175 (2,862)Benefits paid by the plan - (11,897)Defined benefit obligation, December 31 $ 27,015 25,288
167
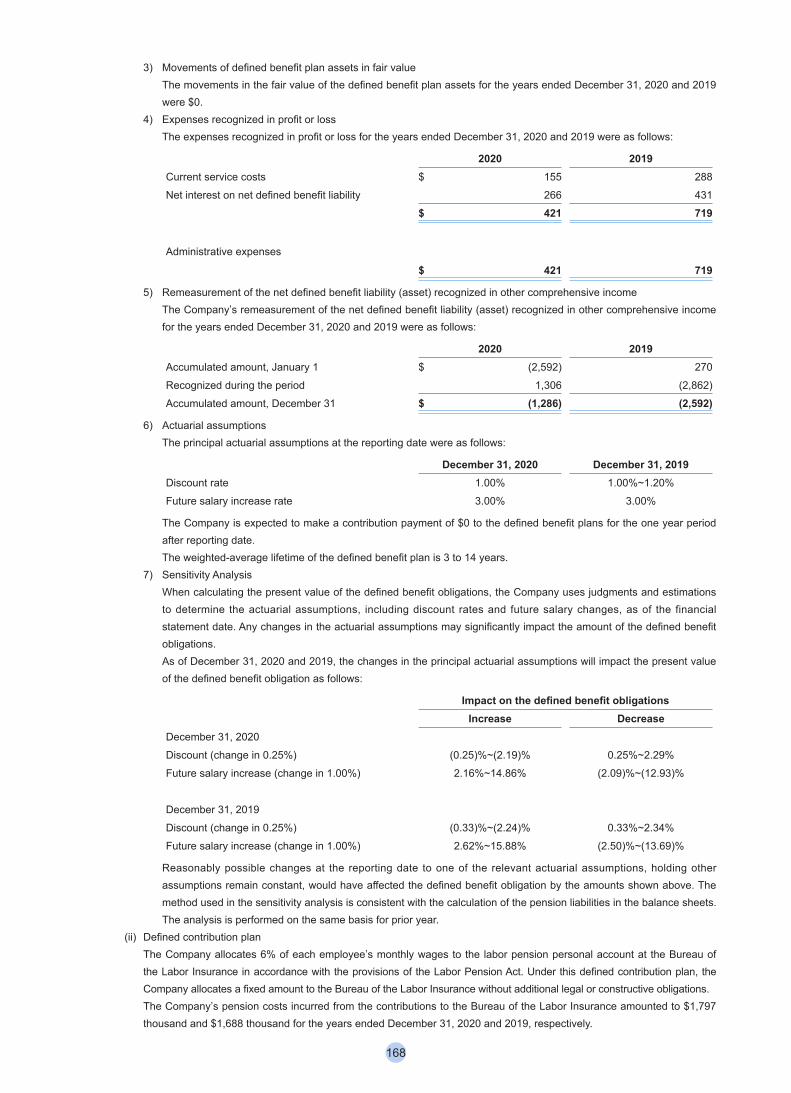
3) Movements of defined benefit plan assets in fair valueThe movements in the fair value of the defined benefit plan assets for the years ended December 31, 2020 and 2019 were $0.
4) Expenses recognized in profit or lossThe expenses recognized in profit or loss for the years ended December 31, 2020 and 2019 were as follows:
2020 2019Current service costs $ 155 288
Net interest on net defined benefit liability 266 431
$ 421 719
Administrative expenses
$ 421 719
5) Remeasurement of the net defined benefit liability (asset) recognized in other comprehensive incomeThe Company’s remeasurement of the net defined benefit liability (asset) recognized in other comprehensive income for the years ended December 31, 2020 and 2019 were as follows:
2020 2019Accumulated amount, January 1 $ (2,592) 270
Recognized during the period 1,306 (2,862)
Accumulated amount, December 31 $ (1,286) (2,592)
6) Actuarial assumptionsThe principal actuarial assumptions at the reporting date were as follows:
December 31, 2020 December 31, 2019Discount rate 1.00% 1.00%~1.20%
Future salary increase rate 3.00% 3.00%
The Company is expected to make a contribution payment of $0 to the defined benefit plans for the one year period after reporting date.The weighted-average lifetime of the defined benefit plan is 3 to 14 years.
7) Sensitivity AnalysisWhen calculating the present value of the defined benefit obligations, the Company uses judgments and estimations to determine the actuarial assumptions, including discount rates and future salary changes, as of the financial statement date. Any changes in the actuarial assumptions may significantly impact the amount of the defined benefit obligations.As of December 31, 2020 and 2019, the changes in the principal actuarial assumptions will impact the present value of the defined benefit obligation as follows:
Impact on the defined benefit obligationsIncrease Decrease
December 31, 2020
Discount (change in 0.25%) (0.25)%~(2.19)% 0.25%~2.29%
Future salary increase (change in 1.00%) 2.16%~14.86% (2.09)%~(12.93)%
December 31, 2019
Discount (change in 0.25%) (0.33)%~(2.24)% 0.33%~2.34%
Future salary increase (change in 1.00%) 2.62%~15.88% (2.50)%~(13.69)%
Reasonably possible changes at the reporting date to one of the relevant actuarial assumptions, holding other assumptions remain constant, would have affected the defined benefit obligation by the amounts shown above. The method used in the sensitivity analysis is consistent with the calculation of the pension liabilities in the balance sheets.The analysis is performed on the same basis for prior year.
(ii) Defined contribution planThe Company allocates 6% of each employee’s monthly wages to the labor pension personal account at the Bureau of the Labor Insurance in accordance with the provisions of the Labor Pension Act. Under this defined contribution plan, the Company allocates a fixed amount to the Bureau of the Labor Insurance without additional legal or constructive obligations.The Company’s pension costs incurred from the contributions to the Bureau of the Labor Insurance amounted to $1,797 thousand and $1,688 thousand for the years ended December 31, 2020 and 2019, respectively.
168
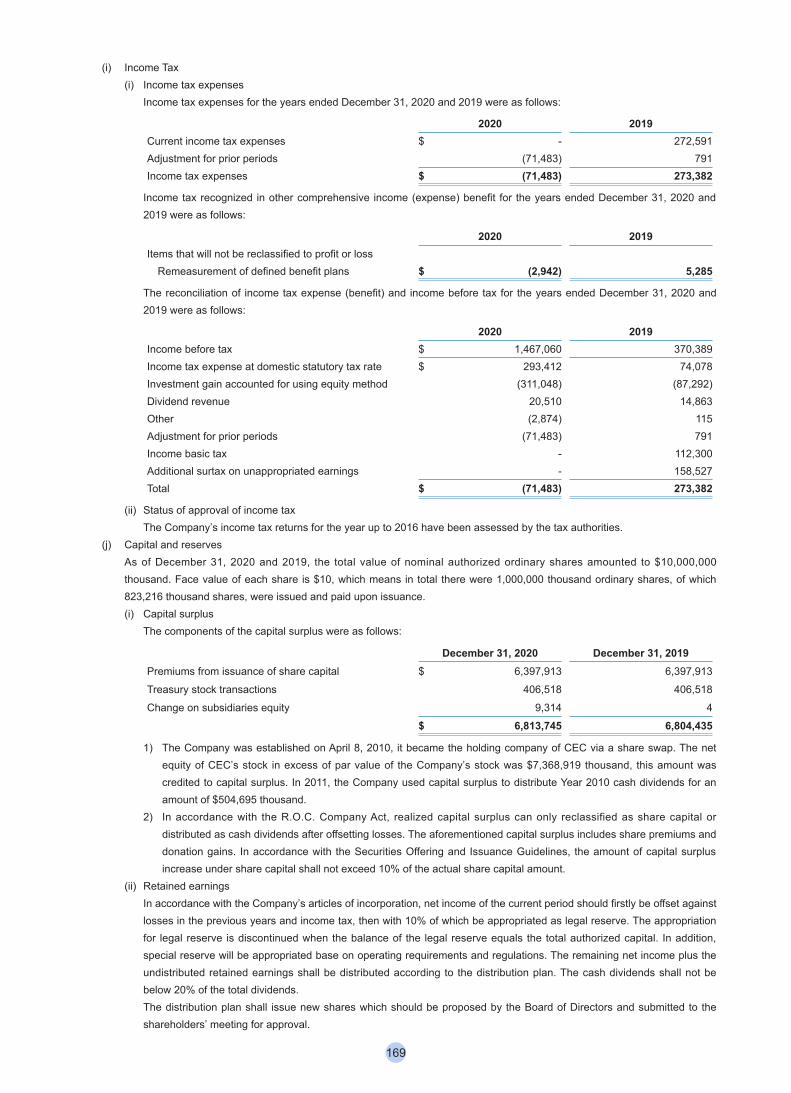
(i) Income Tax (i) Income tax expenses
Income tax expenses for the years ended December 31, 2020 and 2019 were as follows:
2020 2019Current income tax expenses $ - 272,591Adjustment for prior periods (71,483) 791Income tax expenses $ (71,483) 273,382
Income tax recognized in other comprehensive income (expense) benefit for the years ended December 31, 2020 and 2019 were as follows:
2020 2019Items that will not be reclassified to profit or loss Remeasurement of defined benefit plans $ (2,942) 5,285
The reconciliation of income tax expense (benefit) and income before tax for the years ended December 31, 2020 and 2019 were as follows:
2020 2019Income before tax $ 1,467,060 370,389Income tax expense at domestic statutory tax rate $ 293,412 74,078Investment gain accounted for using equity method (311,048) (87,292)Dividend revenue 20,510 14,863Other (2,874) 115Adjustment for prior periods (71,483) 791Income basic tax - 112,300Additional surtax on unappropriated earnings - 158,527Total $ (71,483) 273,382
(ii) Status of approval of income taxThe Company’s income tax returns for the year up to 2016 have been assessed by the tax authorities.
(j) Capital and reserves As of December 31, 2020 and 2019, the total value of nominal authorized ordinary shares amounted to $10,000,000 thousand. Face value of each share is $10, which means in total there were 1,000,000 thousand ordinary shares, of which 823,216 thousand shares, were issued and paid upon issuance.(i) Capital surplus
The components of the capital surplus were as follows:
December 31, 2020 December 31, 2019Premiums from issuance of share capital $ 6,397,913 6,397,913
Treasury stock transactions 406,518 406,518
Change on subsidiaries equity 9,314 4
$ 6,813,745 6,804,435
1) The Company was established on April 8, 2010, it became the holding company of CEC via a share swap. The net equity of CEC’s stock in excess of par value of the Company’s stock was $7,368,919 thousand, this amount was credited to capital surplus. In 2011, the Company used capital surplus to distribute Year 2010 cash dividends for an amount of $504,695 thousand.
2) In accordance with the R.O.C. Company Act, realized capital surplus can only reclassified as share capital or distributed as cash dividends after offsetting losses. The aforementioned capital surplus includes share premiums and donation gains. In accordance with the Securities Offering and Issuance Guidelines, the amount of capital surplus increase under share capital shall not exceed 10% of the actual share capital amount.
(ii) Retained earningsIn accordance with the Company’s articles of incorporation, net income of the current period should firstly be offset against losses in the previous years and income tax, then with 10% of which be appropriated as legal reserve. The appropriation for legal reserve is discontinued when the balance of the legal reserve equals the total authorized capital. In addition, special reserve will be appropriated base on operating requirements and regulations. The remaining net income plus the undistributed retained earnings shall be distributed according to the distribution plan. The cash dividends shall not be below 20% of the total dividends. The distribution plan shall issue new shares which should be proposed by the Board of Directors and submitted to the shareholders’ meeting for approval.
169
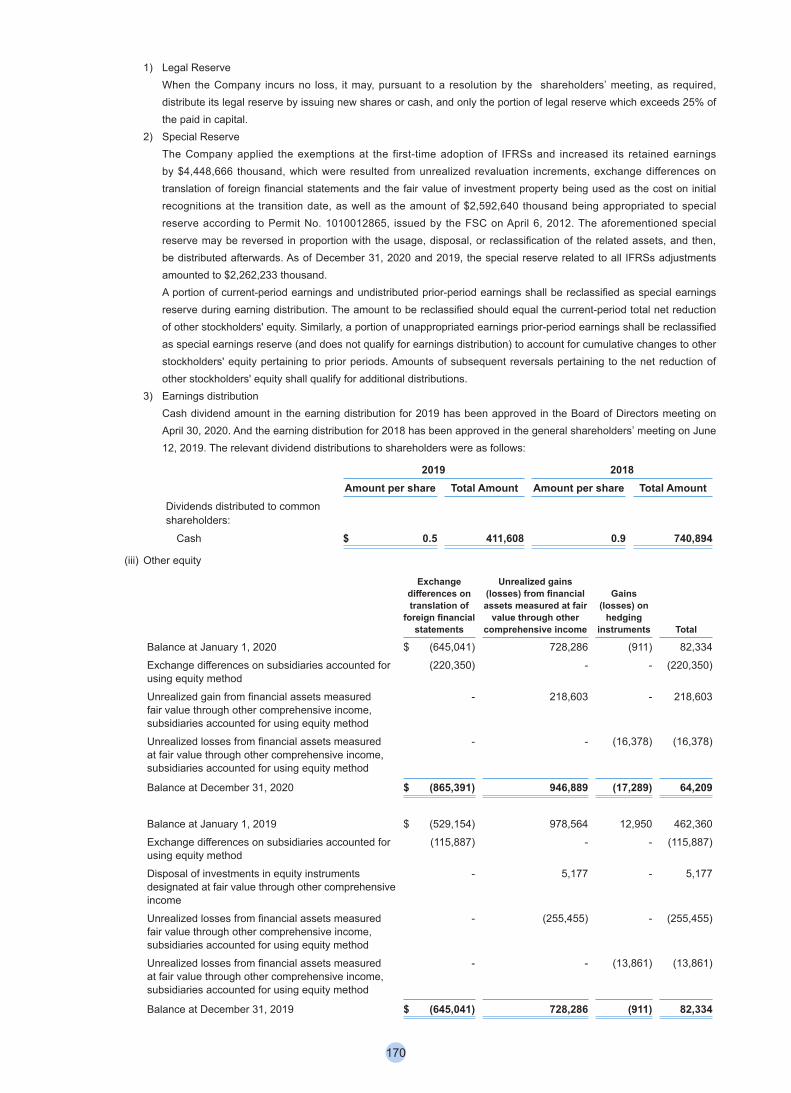
1) Legal ReserveWhen the Company incurs no loss, it may, pursuant to a resolution by the shareholders’ meeting, as required, distribute its legal reserve by issuing new shares or cash, and only the portion of legal reserve which exceeds 25% of the paid in capital.
2) Special ReserveThe Company applied the exemptions at the first-time adoption of IFRSs and increased its retained earnings by $4,448,666 thousand, which were resulted from unrealized revaluation increments, exchange differences on translation of foreign financial statements and the fair value of investment property being used as the cost on initial recognitions at the transition date, as well as the amount of $2,592,640 thousand being appropriated to special reserve according to Permit No. 1010012865, issued by the FSC on April 6, 2012. The aforementioned special reserve may be reversed in proportion with the usage, disposal, or reclassification of the related assets, and then, be distributed afterwards. As of December 31, 2020 and 2019, the special reserve related to all IFRSs adjustments amounted to $2,262,233 thousand.A portion of current-period earnings and undistributed prior-period earnings shall be reclassified as special earnings reserve during earning distribution. The amount to be reclassified should equal the current-period total net reduction of other stockholders' equity. Similarly, a portion of unappropriated earnings prior-period earnings shall be reclassified as special earnings reserve (and does not qualify for earnings distribution) to account for cumulative changes to other stockholders' equity pertaining to prior periods. Amounts of subsequent reversals pertaining to the net reduction of other stockholders' equity shall qualify for additional distributions.
3) Earnings distributionCash dividend amount in the earning distribution for 2019 has been approved in the Board of Directors meeting on April 30, 2020. And the earning distribution for 2018 has been approved in the general shareholders’ meeting on June 12, 2019. The relevant dividend distributions to shareholders were as follows:
2019 2018Amount per share Total Amount Amount per share Total Amount
Dividends distributed to common shareholders: Cash $ 0.5 411,608 0.9 740,894
(iii) Other equity
Exchange differences on translation of
foreign financial statements
Unrealized gains (losses) from financial assets measured at fair
value through other comprehensive income
Gains (losses) on
hedging instruments Total
Balance at January 1, 2020 $ (645,041) 728,286 (911) 82,334
Exchange differences on subsidiaries accounted for using equity method
(220,350) - - (220,350)
Unrealized gain from financial assets measured fair value through other comprehensive income, subsidiaries accounted for using equity method
- 218,603 - 218,603
Unrealized losses from financial assets measured at fair value through other comprehensive income, subsidiaries accounted for using equity method
-
-
(16,378)
(16,378)
Balance at December 31, 2020 $ (865,391) 946,889 (17,289) 64,209
Balance at January 1, 2019 $ (529,154) 978,564 12,950 462,360
Exchange differences on subsidiaries accounted for using equity method
(115,887) - - (115,887)
Disposal of investments in equity instruments designated at fair value through other comprehensive income
- 5,177 - 5,177
Unrealized losses from financial assets measured fair value through other comprehensive income, subsidiaries accounted for using equity method
- (255,455) - (255,455)
Unrealized losses from financial assets measured at fair value through other comprehensive income, subsidiaries accounted for using equity method
-
-
(13,861)
(13,861)
Balance at December 31, 2019 $ (645,041) 728,286 (911) 82,334
170
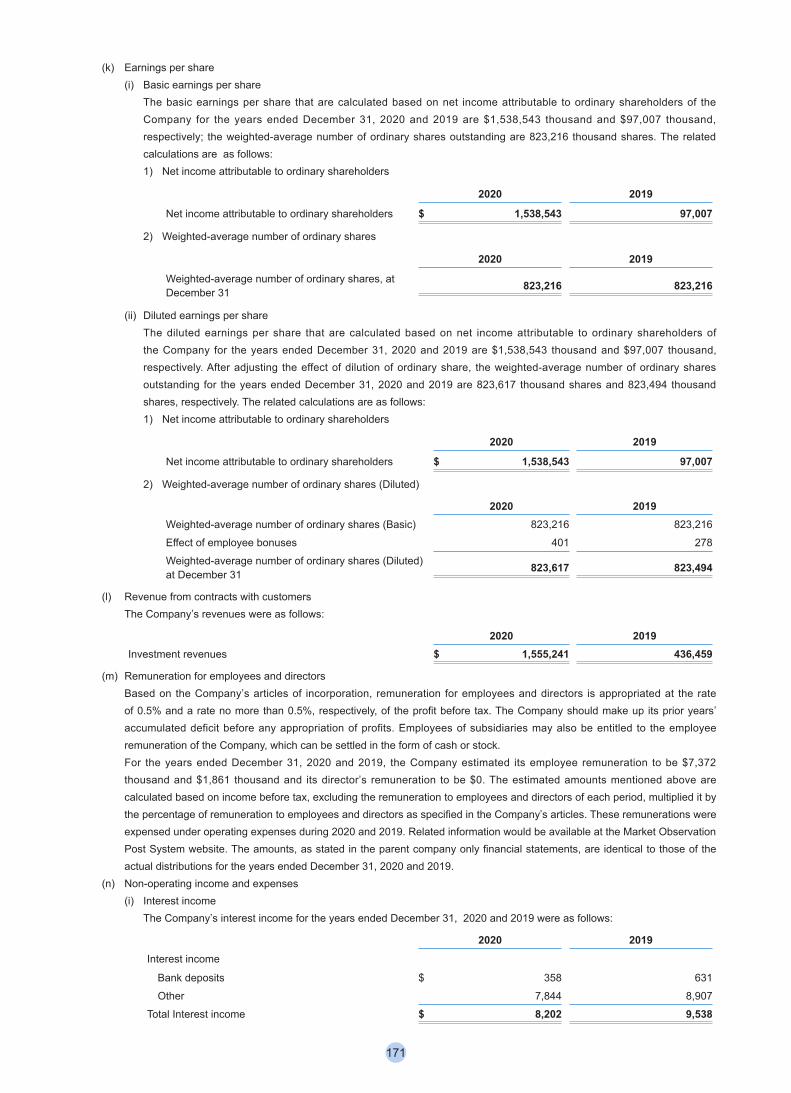
(k) Earnings per share (i) Basic earnings per share
The basic earnings per share that are calculated based on net income attributable to ordinary shareholders of the Company for the years ended December 31, 2020 and 2019 are $1,538,543 thousand and $97,007 thousand, respectively; the weighted-average number of ordinary shares outstanding are 823,216 thousand shares. The related calculations are as follows:1) Net income attributable to ordinary shareholders
2020 2019
Net income attributable to ordinary shareholders $ 1,538,543 97,007
2) Weighted-average number of ordinary shares
2020 2019
Weighted-average number of ordinary shares, at December 31 823,216 823,216
(ii) Diluted earnings per share The diluted earnings per share that are calculated based on net income attributable to ordinary shareholders of the Company for the years ended December 31, 2020 and 2019 are $1,538,543 thousand and $97,007 thousand, respectively. After adjusting the effect of dilution of ordinary share, the weighted-average number of ordinary shares outstanding for the years ended December 31, 2020 and 2019 are 823,617 thousand shares and 823,494 thousand shares, respectively. The related calculations are as follows:1) Net income attributable to ordinary shareholders
2020 2019
Net income attributable to ordinary shareholders $ 1,538,543 97,007
2) Weighted-average number of ordinary shares (Diluted)
2020 2019Weighted-average number of ordinary shares (Basic) 823,216 823,216
Effect of employee bonuses 401 278
Weighted-average number of ordinary shares (Diluted) at December 31 823,617 823,494
(l) Revenue from contracts with customers The Company’s revenues were as follows:
2020 2019Investment revenues $ 1,555,241 436,459
(m) Remuneration for employees and directors Based on the Company’s articles of incorporation, remuneration for employees and directors is appropriated at the rate of 0.5% and a rate no more than 0.5%, respectively, of the profit before tax. The Company should make up its prior years’ accumulated deficit before any appropriation of profits. Employees of subsidiaries may also be entitled to the employee remuneration of the Company, which can be settled in the form of cash or stock.For the years ended December 31, 2020 and 2019, the Company estimated its employee remuneration to be $7,372 thousand and $1,861 thousand and its director’s remuneration to be $0. The estimated amounts mentioned above are calculated based on income before tax, excluding the remuneration to employees and directors of each period, multiplied it by the percentage of remuneration to employees and directors as specified in the Company’s articles. These remunerations were expensed under operating expenses during 2020 and 2019. Related information would be available at the Market Observation Post System website. The amounts, as stated in the parent company only financial statements, are identical to those of the actual distributions for the years ended December 31, 2020 and 2019.
(n) Non-operating income and expenses (i) Interest income
The Company’s interest income for the years ended December 31, 2020 and 2019 were as follows:
2020 2019Interest income Bank deposits $ 358 631 Other 7,844 8,907
Total Interest income $ 8,202 9,538
171
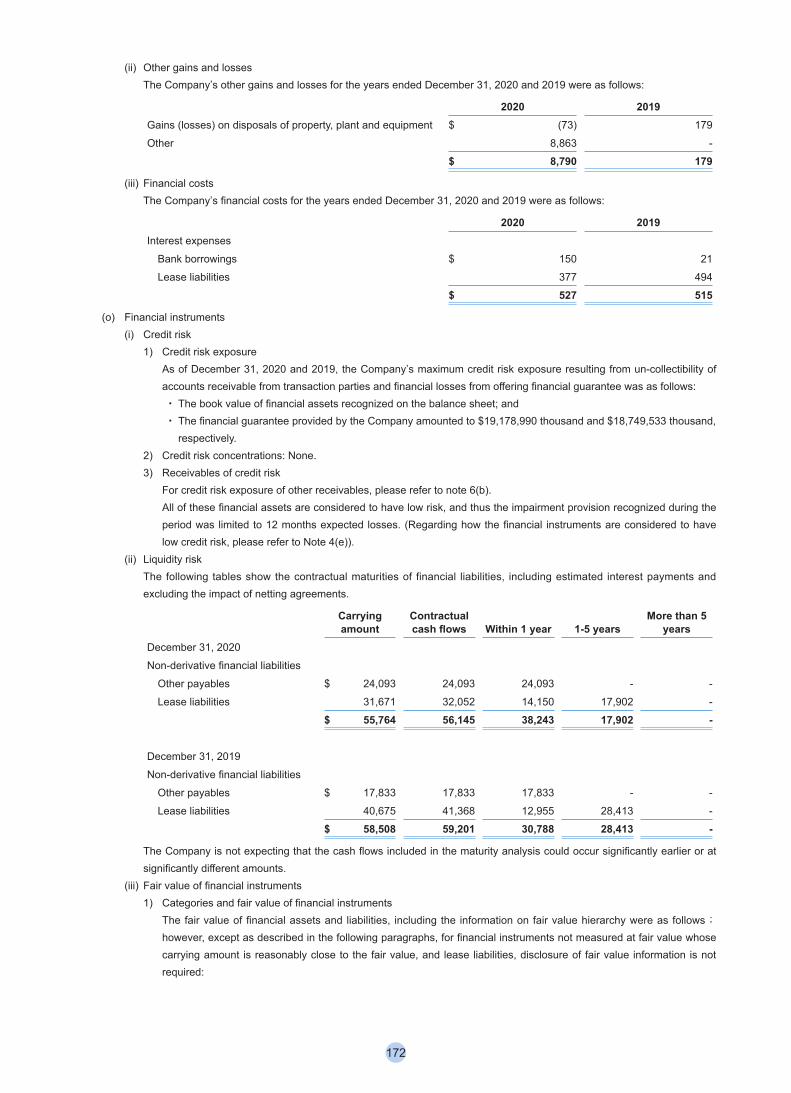
(ii) Other gains and lossesThe Company’s other gains and losses for the years ended December 31, 2020 and 2019 were as follows:
2020 2019Gains (losses) on disposals of property, plant and equipment $ (73) 179
Other 8,863 -
$ 8,790 179
(iii) Financial costsThe Company’s financial costs for the years ended December 31, 2020 and 2019 were as follows:
2020 2019Interest expenses Bank borrowings $ 150 21 Lease liabilities 377 494
$ 527 515
(o) Financial instruments (i) Credit risk
1) Credit risk exposureAs of December 31, 2020 and 2019, the Company’s maximum credit risk exposure resulting from un-collectibility of accounts receivable from transaction parties and financial losses from offering financial guarantee was as follows:‧ The book value of financial assets recognized on the balance sheet; and‧ The financial guarantee provided by the Company amounted to $19,178,990 thousand and $18,749,533 thousand,
respectively.2) Credit risk concentrations: None.3) Receivables of credit risk
For credit risk exposure of other receivables, please refer to note 6(b).All of these financial assets are considered to have low risk, and thus the impairment provision recognized during the period was limited to 12 months expected losses. (Regarding how the financial instruments are considered to have low credit risk, please refer to Note 4(e)).
(ii) Liquidity riskThe following tables show the contractual maturities of financial liabilities, including estimated interest payments and excluding the impact of netting agreements.
Carrying amount
Contractual cash flows Within 1 year 1-5 years
More than 5 years
December 31, 2020
Non-derivative financial liabilities Other payables $ 24,093 24,093 24,093 - - Lease liabilities 31,671 32,052 14,150 17,902 -
$ 55,764 56,145 38,243 17,902 -
December 31, 2019
Non-derivative financial liabilities Other payables $ 17,833 17,833 17,833 - - Lease liabilities 40,675 41,368 12,955 28,413 -
$ 58,508 59,201 30,788 28,413 -
The Company is not expecting that the cash flows included in the maturity analysis could occur significantly earlier or at significantly different amounts.
(iii) Fair value of financial instruments1) Categories and fair value of financial instruments
The fair value of financial assets and liabilities, including the information on fair value hierarchy were as follows; however, except as described in the following paragraphs, for financial instruments not measured at fair value whose carrying amount is reasonably close to the fair value, and lease liabilities, disclosure of fair value information is not required:
172
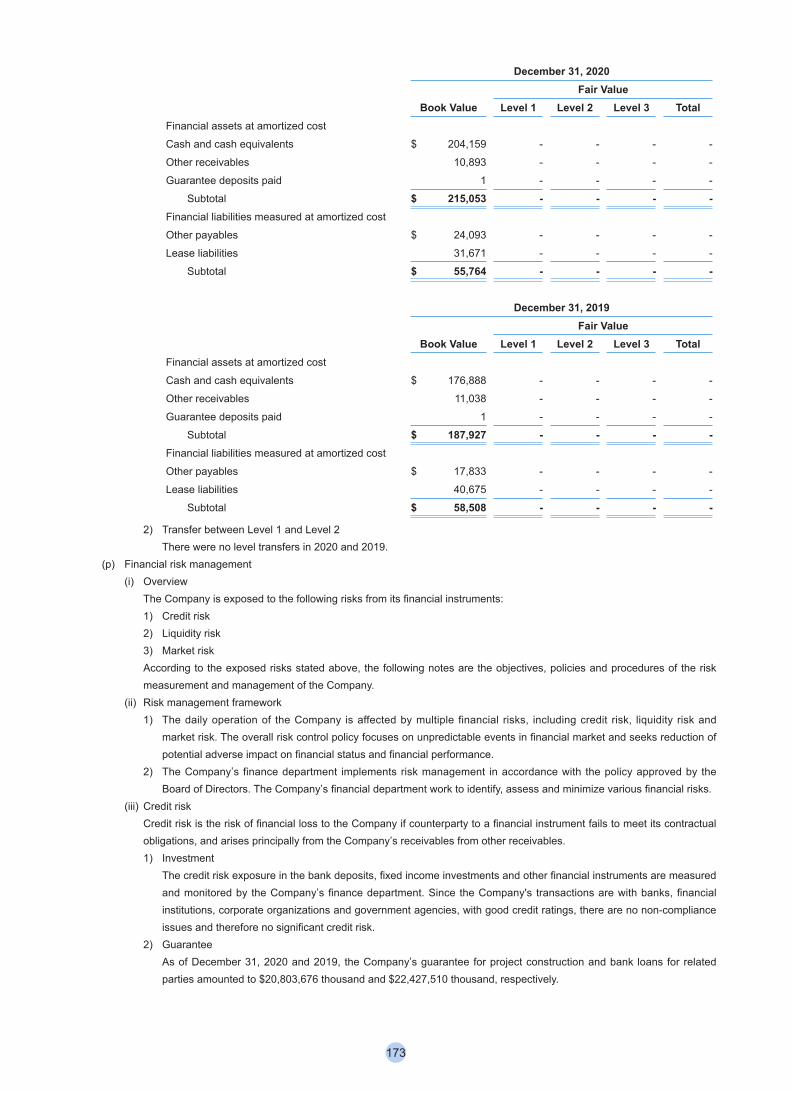
December 31, 2020Fair Value
Book Value Level 1 Level 2 Level 3 TotalFinancial assets at amortized cost
Cash and cash equivalents $ 204,159 - - - -
Other receivables 10,893 - - - -
Guarantee deposits paid 1 - - - - Subtotal $ 215,053 - - - -Financial liabilities measured at amortized cost
Other payables $ 24,093 - - - -
Lease liabilities 31,671 - - - - Subtotal $ 55,764 - - - -
December 31, 2019Fair Value
Book Value Level 1 Level 2 Level 3 TotalFinancial assets at amortized cost
Cash and cash equivalents $ 176,888 - - - -
Other receivables 11,038 - - - -
Guarantee deposits paid 1 - - - - Subtotal $ 187,927 - - - -Financial liabilities measured at amortized cost
Other payables $ 17,833 - - - -
Lease liabilities 40,675 - - - - Subtotal $ 58,508 - - - -
2) Transfer between Level 1 and Level 2There were no level transfers in 2020 and 2019.
(p) Financial risk management (i) Overview
The Company is exposed to the following risks from its financial instruments:1) Credit risk2) Liquidity risk3) Market riskAccording to the exposed risks stated above, the following notes are the objectives, policies and procedures of the risk measurement and management of the Company.
(ii) Risk management framework1) The daily operation of the Company is affected by multiple financial risks, including credit risk, liquidity risk and
market risk. The overall risk control policy focuses on unpredictable events in financial market and seeks reduction of potential adverse impact on financial status and financial performance.
2) The Company’s finance department implements risk management in accordance with the policy approved by the Board of Directors. The Company’s financial department work to identify, assess and minimize various financial risks.
(iii) Credit riskCredit risk is the risk of financial loss to the Company if counterparty to a financial instrument fails to meet its contractual obligations, and arises principally from the Company’s receivables from other receivables.1) Investment
The credit risk exposure in the bank deposits, fixed income investments and other financial instruments are measured and monitored by the Company’s finance department. Since the Company's transactions are with banks, financial institutions, corporate organizations and government agencies, with good credit ratings, there are no non-compliance issues and therefore no significant credit risk.
2) GuaranteeAs of December 31, 2020 and 2019, the Company’s guarantee for project construction and bank loans for related parties amounted to $20,803,676 thousand and $22,427,510 thousand, respectively.
173
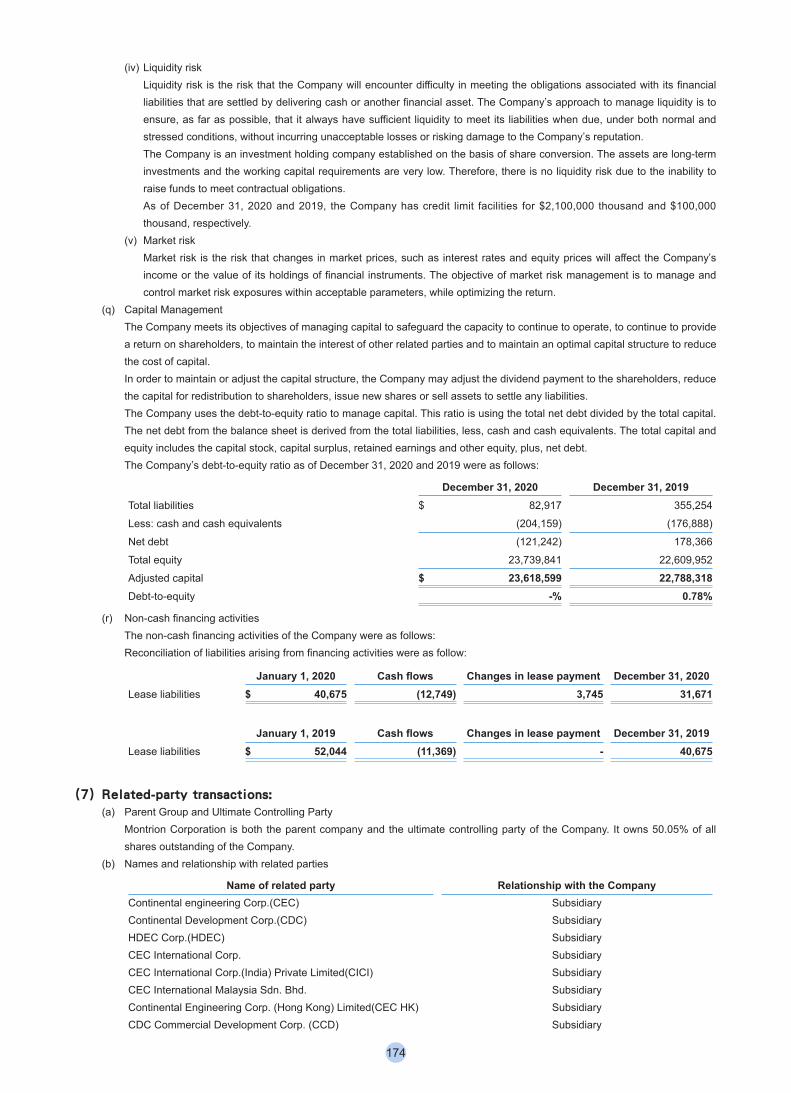
(iv) Liquidity riskLiquidity risk is the risk that the Company will encounter difficulty in meeting the obligations associated with its financial liabilities that are settled by delivering cash or another financial asset. The Company’s approach to manage liquidity is to ensure, as far as possible, that it always have sufficient liquidity to meet its liabilities when due, under both normal and stressed conditions, without incurring unacceptable losses or risking damage to the Company’s reputation.The Company is an investment holding company established on the basis of share conversion. The assets are long-term investments and the working capital requirements are very low. Therefore, there is no liquidity risk due to the inability to raise funds to meet contractual obligations.As of December 31, 2020 and 2019, the Company has credit limit facilities for $2,100,000 thousand and $100,000 thousand, respectively.
(v) Market riskMarket risk is the risk that changes in market prices, such as interest rates and equity prices will affect the Company’s income or the value of its holdings of financial instruments. The objective of market risk management is to manage and control market risk exposures within acceptable parameters, while optimizing the return.
(q) Capital Management The Company meets its objectives of managing capital to safeguard the capacity to continue to operate, to continue to provide a return on shareholders, to maintain the interest of other related parties and to maintain an optimal capital structure to reduce the cost of capital. In order to maintain or adjust the capital structure, the Company may adjust the dividend payment to the shareholders, reduce the capital for redistribution to shareholders, issue new shares or sell assets to settle any liabilities. The Company uses the debt-to-equity ratio to manage capital. This ratio is using the total net debt divided by the total capital. The net debt from the balance sheet is derived from the total liabilities, less, cash and cash equivalents. The total capital and equity includes the capital stock, capital surplus, retained earnings and other equity, plus, net debt.The Company’s debt-to-equity ratio as of December 31, 2020 and 2019 were as follows:
December 31, 2020 December 31, 2019Total liabilities $ 82,917 355,254
Less: cash and cash equivalents (204,159) (176,888)
Net debt (121,242) 178,366
Total equity 23,739,841 22,609,952
Adjusted capital $ 23,618,599 22,788,318Debt-to-equity -% 0.78%
(r) Non-cash financing activities The non-cash financing activities of the Company were as follows:Reconciliation of liabilities arising from financing activities were as follow:
January 1, 2020 Cash flows Changes in lease payment December 31, 2020Lease liabilities $ 40,675 (12,749) 3,745 31,671
January 1, 2019 Cash flows Changes in lease payment December 31, 2019Lease liabilities $ 52,044 (11,369) - 40,675
(7) Related-party transactions: (a) Parent Group and Ultimate Controlling Party
Montrion Corporation is both the parent company and the ultimate controlling party of the Company. It owns 50.05% of all shares outstanding of the Company.
(b) Names and relationship with related parties
Name of related party Relationship with the CompanyContinental engineering Corp.(CEC) SubsidiaryContinental Development Corp.(CDC) SubsidiaryHDEC Corp.(HDEC) SubsidiaryCEC International Corp. SubsidiaryCEC International Corp.(India) Private Limited(CICI) SubsidiaryCEC International Malaysia Sdn. Bhd. SubsidiaryContinental Engineering Corp. (Hong Kong) Limited(CEC HK) SubsidiaryCDC Commercial Development Corp. (CCD) Subsidiary
174
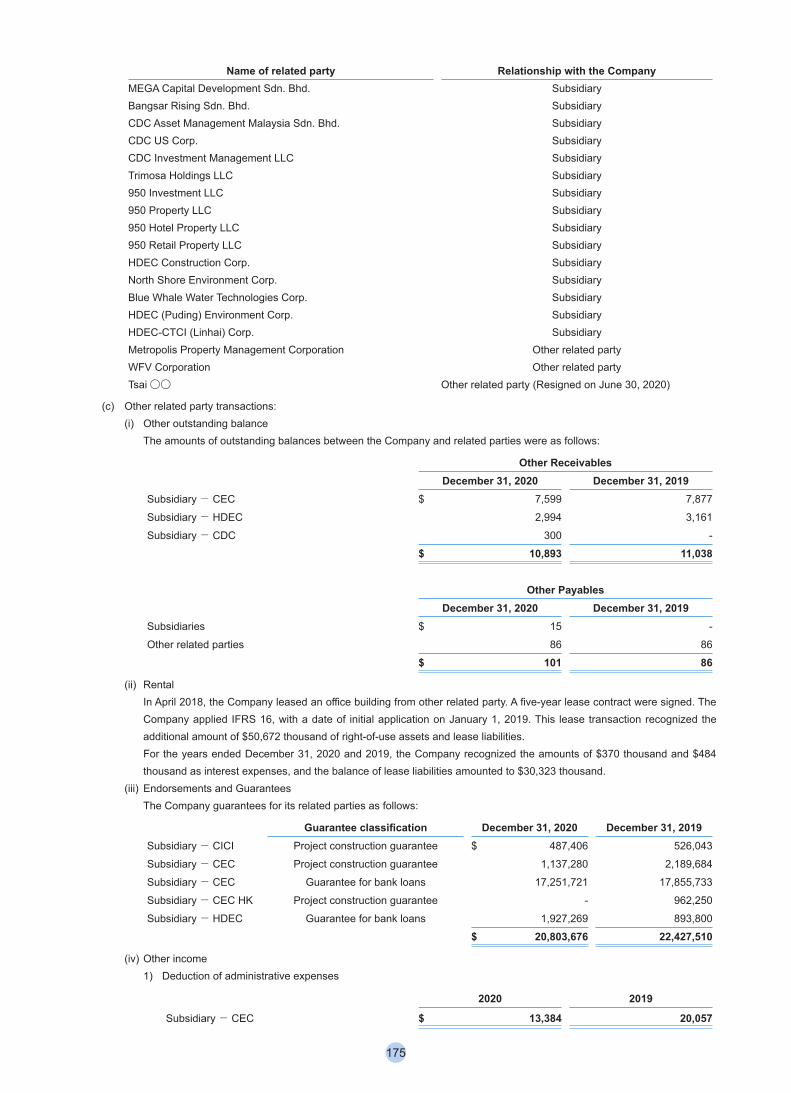
Name of related party Relationship with the CompanyMEGA Capital Development Sdn. Bhd. SubsidiaryBangsar Rising Sdn. Bhd. SubsidiaryCDC Asset Management Malaysia Sdn. Bhd. SubsidiaryCDC US Corp. SubsidiaryCDC Investment Management LLC SubsidiaryTrimosa Holdings LLC Subsidiary950 Investment LLC Subsidiary950 Property LLC Subsidiary950 Hotel Property LLC Subsidiary950 Retail Property LLC SubsidiaryHDEC Construction Corp. SubsidiaryNorth Shore Environment Corp. SubsidiaryBlue Whale Water Technologies Corp. SubsidiaryHDEC (Puding) Environment Corp. SubsidiaryHDEC-CTCI (Linhai) Corp. SubsidiaryMetropolis Property Management Corporation Other related partyWFV Corporation Other related partyTsai○○ Other related party (Resigned on June 30, 2020)
(c) Other related party transactions: (i) Other outstanding balance
The amounts of outstanding balances between the Company and related parties were as follows:
Other Receivables December 31, 2020 December 31, 2019Subsidiary- CEC $ 7,599 7,877
Subsidiary- HDEC 2,994 3,161
Subsidiary- CDC 300 -
$ 10,893 11,038
Other Payables December 31, 2020 December 31, 2019Subsidiaries $ 15 -
Other related parties 86 86
$ 101 86
(ii) RentalIn April 2018, the Company leased an office building from other related party. A five-year lease contract were signed. The Company applied IFRS 16, with a date of initial application on January 1, 2019. This lease transaction recognized the additional amount of $50,672 thousand of right-of-use assets and lease liabilities. For the years ended December 31, 2020 and 2019, the Company recognized the amounts of $370 thousand and $484 thousand as interest expenses, and the balance of lease liabilities amounted to $30,323 thousand.
(iii) Endorsements and Guarantees The Company guarantees for its related parties as follows:
Guarantee classification December 31, 2020 December 31, 2019Subsidiary- CICI Project construction guarantee $ 487,406 526,043
Subsidiary- CEC Project construction guarantee 1,137,280 2,189,684
Subsidiary- CEC Guarantee for bank loans 17,251,721 17,855,733
Subsidiary- CEC HK Project construction guarantee - 962,250
Subsidiary- HDEC Guarantee for bank loans 1,927,269 893,800
$ 20,803,676 22,427,510
(iv) Other income1) Deduction of administrative expenses
2020 2019
Subsidiary- CEC $ 13,384 20,057
175
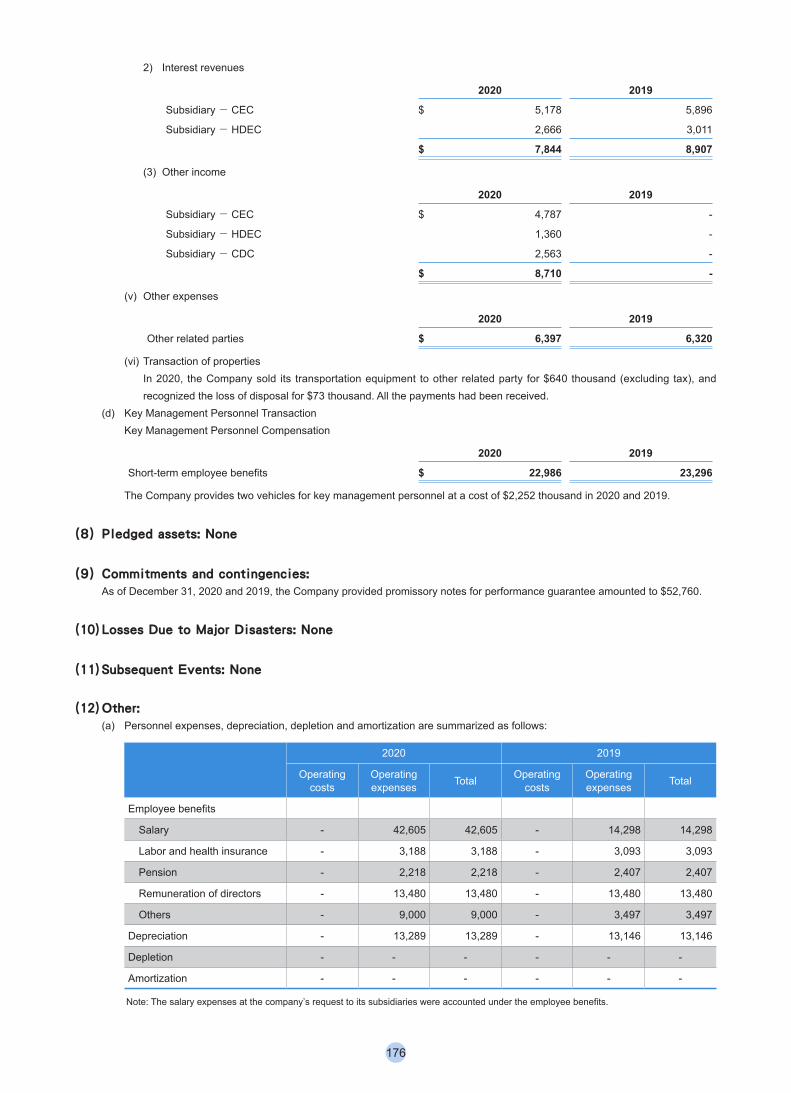
2) Interest revenues
2020 2019
Subsidiary- CEC $ 5,178 5,896
Subsidiary- HDEC 2,666 3,011
$ 7,844 8,907
(3) Other income
2020 2019
Subsidiary- CEC $ 4,787 -
Subsidiary- HDEC 1,360 -
Subsidiary- CDC 2,563 -
$ 8,710 -
(v) Other expenses
2020 2019
Other related parties $ 6,397 6,320
(vi) Transaction of properties In 2020, the Company sold its transportation equipment to other related party for $640 thousand (excluding tax), and recognized the loss of disposal for $73 thousand. All the payments had been received.
(d) Key Management Personnel Transaction Key Management Personnel Compensation
2020 2019
Short-term employee benefits $ 22,986 23,296
The Company provides two vehicles for key management personnel at a cost of $2,252 thousand in 2020 and 2019.
(8) Pledged assets: None
(9) Commitments and contingencies: As of December 31, 2020 and 2019, the Company provided promissory notes for performance guarantee amounted to $52,760.
(10) Losses Due to Major Disasters: None
(11) Subsequent Events: None
(12) Other:(a) Personnel expenses, depreciation, depletion and amortization are summarized as follows:
2020 2019
Operatingcosts
Operating expenses Total Operating
costsOperating expenses Total
Employee benefits
Salary - 42,605 42,605 - 14,298 14,298
Labor and health insurance - 3,188 3,188 - 3,093 3,093
Pension - 2,218 2,218 - 2,407 2,407
Remuneration of directors - 13,480 13,480 - 13,480 13,480
Others - 9,000 9,000 - 3,497 3,497
Depreciation - 13,289 13,289 - 13,146 13,146
Depletion - - - - - -
Amortization - - - - - -
Note: The salary expenses at the company’s request to its subsidiaries were accounted under the employee benefits.
176
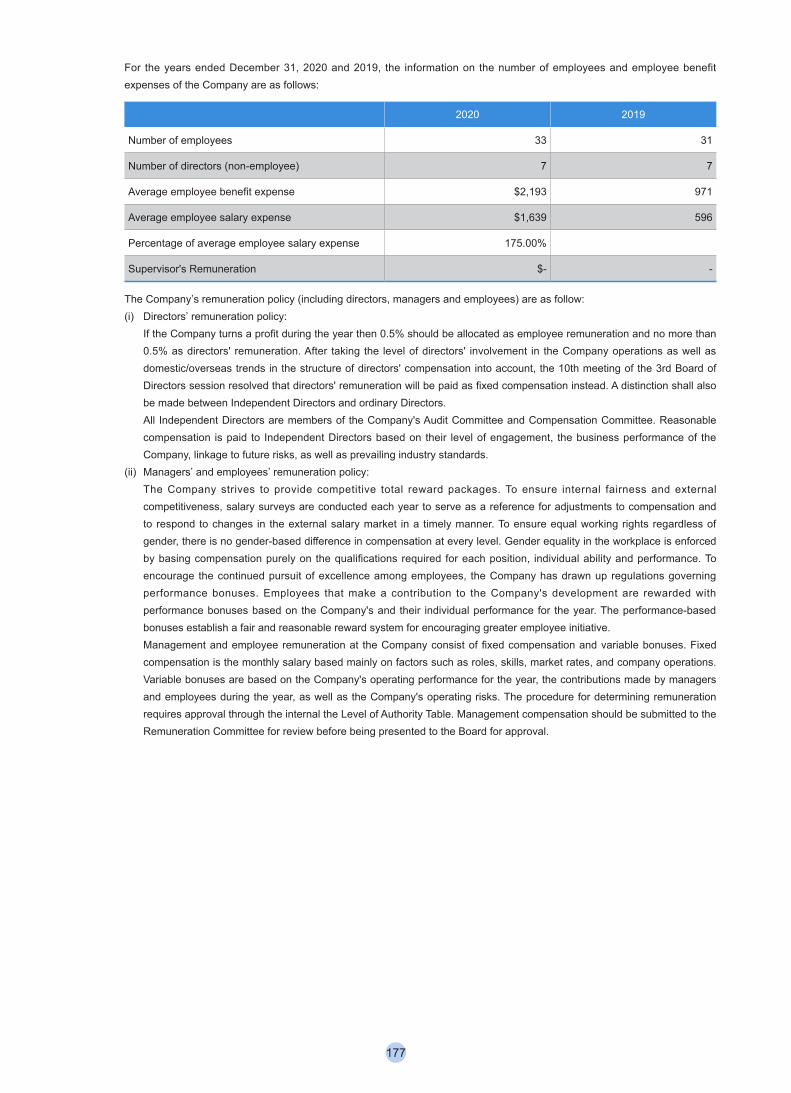
For the years ended December 31, 2020 and 2019, the information on the number of employees and employee benefit expenses of the Company are as follows:
2020 2019
Number of employees 33 31
Number of directors (non-employee) 7 7
Average employee benefit expense $2,193 971
Average employee salary expense $1,639 596
Percentage of average employee salary expense 175.00%
Supervisor's Remuneration $- -
The Company’s remuneration policy (including directors, managers and employees) are as follow: (i) Directors’ remuneration policy:
If the Company turns a profit during the year then 0.5% should be allocated as employee remuneration and no more than 0.5% as directors' remuneration. After taking the level of directors' involvement in the Company operations as well as domestic/overseas trends in the structure of directors' compensation into account, the 10th meeting of the 3rd Board of Directors session resolved that directors' remuneration will be paid as fixed compensation instead. A distinction shall also be made between Independent Directors and ordinary Directors.All Independent Directors are members of the Company's Audit Committee and Compensation Committee. Reasonable compensation is paid to Independent Directors based on their level of engagement, the business performance of the Company, linkage to future risks, as well as prevailing industry standards.
(ii) Managers’ and employees’ remuneration policy: The Company strives to provide competitive total reward packages. To ensure internal fairness and external competitiveness, salary surveys are conducted each year to serve as a reference for adjustments to compensation and to respond to changes in the external salary market in a timely manner. To ensure equal working rights regardless of gender, there is no gender-based difference in compensation at every level. Gender equality in the workplace is enforced by basing compensation purely on the qualifications required for each position, individual ability and performance. To encourage the continued pursuit of excellence among employees, the Company has drawn up regulations governing performance bonuses. Employees that make a contribution to the Company's development are rewarded with performance bonuses based on the Company's and their individual performance for the year. The performance-based bonuses establish a fair and reasonable reward system for encouraging greater employee initiative.Management and employee remuneration at the Company consist of fixed compensation and variable bonuses. Fixed compensation is the monthly salary based mainly on factors such as roles, skills, market rates, and company operations. Variable bonuses are based on the Company's operating performance for the year, the contributions made by managers and employees during the year, as well as the Company's operating risks. The procedure for determining remuneration requires approval through the internal the Level of Authority Table. Management compensation should be submitted to the Remuneration Committee for review before being presented to the Board for approval.
177
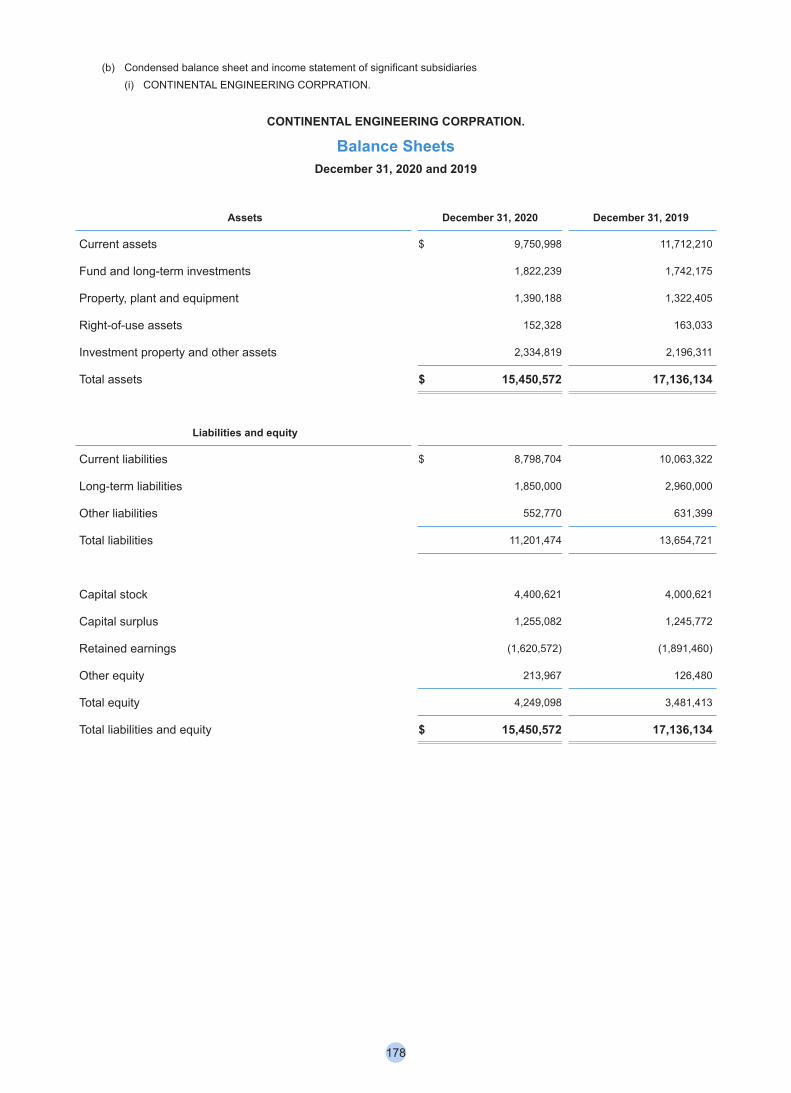
(b) Condensed balance sheet and income statement of significant subsidiaries(i) CONTINENTAL ENGINEERING CORPRATION.
CONTINENTAL ENGINEERING CORPRATION.
Balance SheetsDecember 31, 2020 and 2019
Assets December 31, 2020 December 31, 2019
Current assets $ 9,750,998 11,712,210
Fund and long-term investments 1,822,239 1,742,175
Property, plant and equipment 1,390,188 1,322,405
Right-of-use assets 152,328 163,033
Investment property and other assets 2,334,819 2,196,311
Total assets $ 15,450,572 17,136,134
Liabilities and equity
Current liabilities $ 8,798,704 10,063,322
Long-term liabilities 1,850,000 2,960,000
Other liabilities 552,770 631,399
Total liabilities 11,201,474 13,654,721
Capital stock 4,400,621 4,000,621
Capital surplus 1,255,082 1,245,772
Retained earnings (1,620,572) (1,891,460)
Other equity 213,967 126,480
Total equity 4,249,098 3,481,413
Total liabilities and equity $ 15,450,572 17,136,134
178
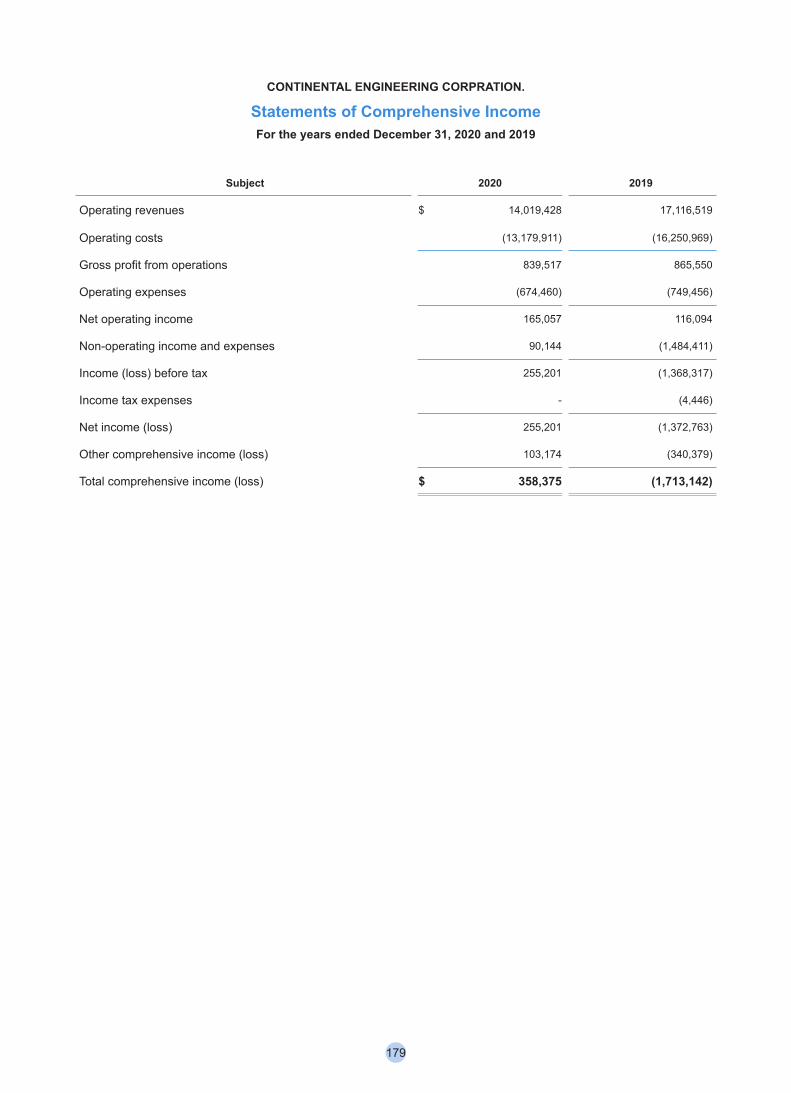
CONTINENTAL ENGINEERING CORPRATION.
Statements of Comprehensive IncomeFor the years ended December 31, 2020 and 2019
Subject 2020 2019
Operating revenues $ 14,019,428 17,116,519
Operating costs (13,179,911) (16,250,969)
Gross profit from operations 839,517 865,550
Operating expenses (674,460) (749,456)
Net operating income 165,057 116,094
Non-operating income and expenses 90,144 (1,484,411)
Income (loss) before tax 255,201 (1,368,317)
Income tax expenses - (4,446)
Net income (loss) 255,201 (1,372,763)
Other comprehensive income (loss) 103,174 (340,379)
Total comprehensive income (loss) $ 358,375 (1,713,142)
179
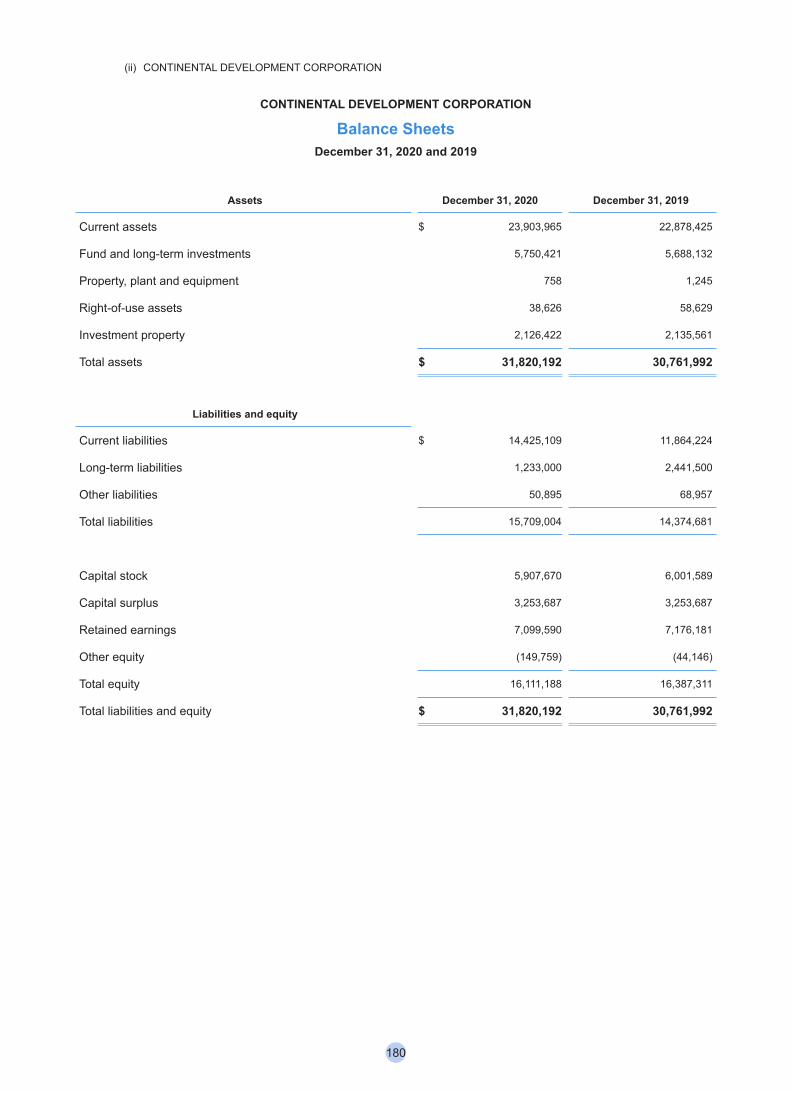
(ii) CONTINENTAL DEVELOPMENT CORPORATION
CONTINENTAL DEVELOPMENT CORPORATION
Balance SheetsDecember 31, 2020 and 2019
Assets December 31, 2020 December 31, 2019
Current assets $ 23,903,965 22,878,425
Fund and long-term investments 5,750,421 5,688,132
Property, plant and equipment 758 1,245
Right-of-use assets 38,626 58,629
Investment property 2,126,422 2,135,561
Total assets $ 31,820,192 30,761,992
Liabilities and equity
Current liabilities $ 14,425,109 11,864,224
Long-term liabilities 1,233,000 2,441,500
Other liabilities 50,895 68,957
Total liabilities 15,709,004 14,374,681
Capital stock 5,907,670 6,001,589
Capital surplus 3,253,687 3,253,687
Retained earnings 7,099,590 7,176,181
Other equity (149,759) (44,146)
Total equity 16,111,188 16,387,311
Total liabilities and equity $ 31,820,192 30,761,992
180
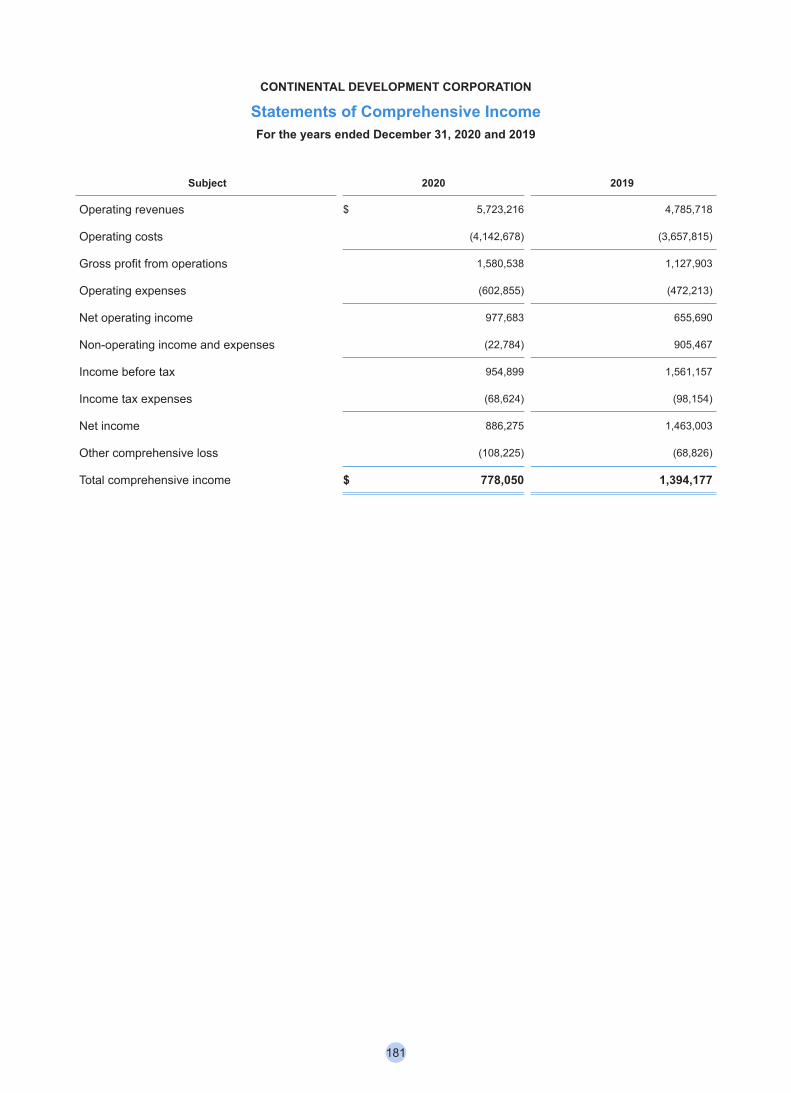
CONTINENTAL DEVELOPMENT CORPORATION
Statements of Comprehensive IncomeFor the years ended December 31, 2020 and 2019
Subject 2020 2019
Operating revenues $ 5,723,216 4,785,718
Operating costs (4,142,678) (3,657,815)
Gross profit from operations 1,580,538 1,127,903
Operating expenses (602,855) (472,213)
Net operating income 977,683 655,690
Non-operating income and expenses (22,784) 905,467
Income before tax 954,899 1,561,157
Income tax expenses (68,624) (98,154)
Net income 886,275 1,463,003
Other comprehensive loss (108,225) (68,826)
Total comprehensive income $ 778,050 1,394,177
181
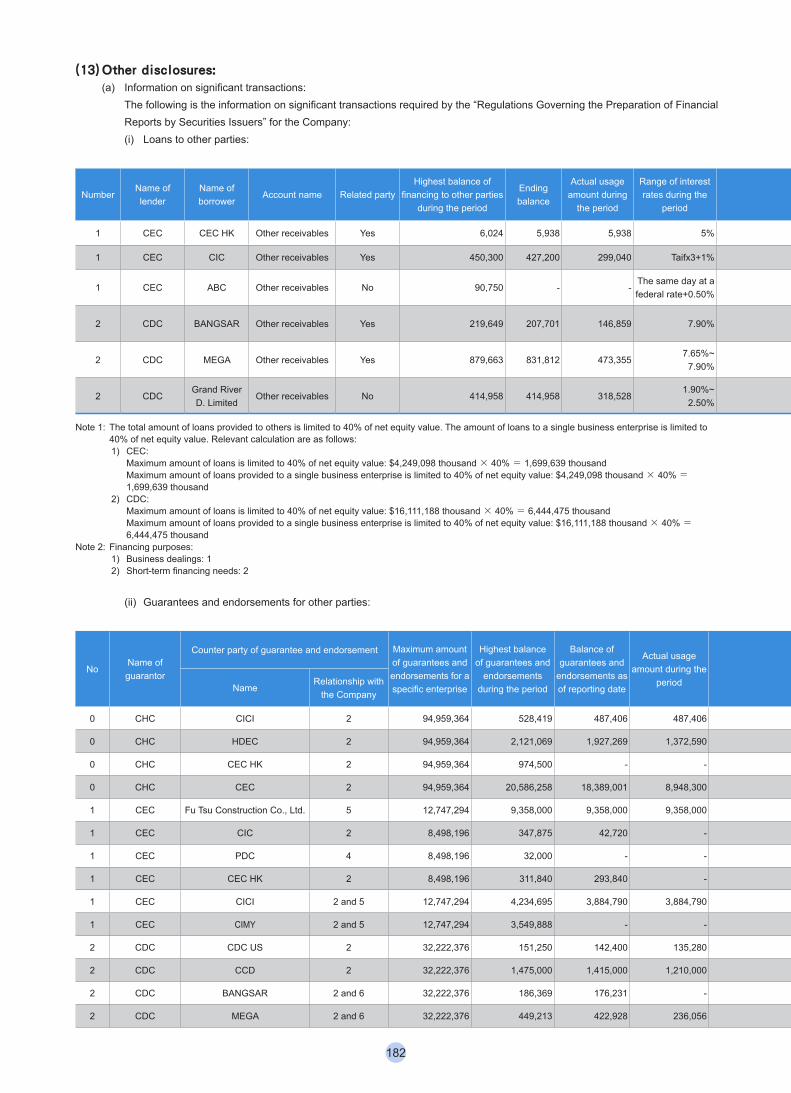
(13) Other disclosures:(a) Information on significant transactions:
The following is the information on significant transactions required by the “Regulations Governing the Preparation of Financial Reports by Securities Issuers” for the Company:(i) Loans to other parties:
(In Thousands of New Taiwan Dollars)
NumberName of lender
Name of borrower
Account name Related partyHighest balance of
financing to other parties during the period
Ending balance
Actual usage amount during
the period
Range of interest rates during the
period
Purposes of fund financing for the
borrower
Transaction amount for businesses
between two parties
Reasons for short-term financing
Allowance for bad debt
Collateral Maximum amount of loans provided to a
single enterprise
Maximum amount of loans
Item Value
1 CEC CEC HK Other receivables Yes 6,024 5,938 5,938 5% 2 - Operation requirements - - - 1,699,639 1,699,639
1 CEC CIC Other receivables Yes 450,300 427,200 299,040 Taifx3+1% 2 - Operation requirements - - - 1,699,639 1,699,639
1 CEC ABC Other receivables No 90,750 - -The same day at a federal rate+0.50%
2 - Operation requirements - Buildings 70,202 1,699,639 1,699,639
2 CDC BANGSAR Other receivables Yes 219,649 207,701 146,859 7.90% 2 -Land purchases and operation requirements
- - - 6,444,475 6,444,475
2 CDC MEGA Other receivables Yes 879,663 831,812 473,3557.65%~
7.90%2 -
Land purchases and operation requirements
- - - 6,444,475 6,444,475
2 CDCGrand River D. Limited
Other receivables No 414,958 414,958 318,5281.90%~
2.50%2 -
Land purchases and operation requirements
- - - 6,444,475 6,444,475
Note 1: The total amount of loans provided to others is limited to 40% of net equity value. The amount of loans to a single business enterprise is limited to 40% of net equity value. Relevant calculation are as follows: 1) CEC: Maximum amount of loans is limited to 40% of net equity value: $4,249,098 thousand × 40% = 1,699,639 thousand Maximum amount of loans provided to a single business enterprise is limited to 40% of net equity value: $4,249,098 thousand × 40% =
1,699,639 thousand2) CDC: Maximum amount of loans is limited to 40% of net equity value: $16,111,188 thousand × 40% = 6,444,475 thousand Maximum amount of loans provided to a single business enterprise is limited to 40% of net equity value: $16,111,188 thousand × 40% =
6,444,475 thousandNote 2: Financing purposes:
1) Business dealings: 12) Short-term financing needs: 2
(ii) Guarantees and endorsements for other parties: (In Thousands of New Taiwan Dollars)
NoName of guarantor
Counter party of guarantee and endorsement Maximum amount of guarantees and endorsements for a specific enterprise
Highest balance of guarantees and
endorsements during the period
Balance of guarantees and
endorsements as of reporting date
Actual usage amount during the
period
Property pledged for guarantees
and endorsements (Amount)
Ratio of accumulated amounts of guarantees and
endorsements over net worth in the latest
financial statements
Maximum amount of guarantees and
endorsements
Parent company's endorsements/
guarantees to third parties on behalf of
subsidiary
Subsidiary's endorsements/
guarantees to third parties on behalf of
parent company
Endorsements/ guarantees to third parties on behalf of
companies in Mainland China
NameRelationship with
the Company
0 CHC CICI 2 94,959,364 528,419 487,406 487,406 - 2.05% 94,959,364 Y N N
0 CHC HDEC 2 94,959,364 2,121,069 1,927,269 1,372,590 - 8.12% 94,959,364 Y N N
0 CHC CEC HK 2 94,959,364 974,500 - - - -% 94,959,364 Y N N
0 CHC CEC 2 94,959,364 20,586,258 18,389,001 8,948,300 - 77.46% 94,959,364 Y N N
1 CEC Fu Tsu Construction Co., Ltd. 5 12,747,294 9,358,000 9,358,000 9,358,000 - 200.23% 25,494,588 N N N
1 CEC CIC 2 8,498,196 347,875 42,720 - - 1.01% 8,498,196 N N N
1 CEC PDC 4 8,498,196 32,000 - - - -% 8,498,196 N N N
1 CEC CEC HK 2 8,498,196 311,840 293,840 - - 6.92% 8,498,196 N N N
1 CEC CICI 2 and 5 12,747,294 4,234,695 3,884,790 3,884,790 - 91.43% 25,494,588 N N N
1 CEC CIMY 2 and 5 12,747,294 3,549,888 - - - -% 25,494,588 N N N
2 CDC CDC US 2 32,222,376 151,250 142,400 135,280 - 0.88% 32,222,376 N N N
2 CDC CCD 2 32,222,376 1,475,000 1,415,000 1,210,000 - 8.78% 32,222,376 N N N
2 CDC BANGSAR 2 and 6 32,222,376 186,369 176,231 - - 1.09% 32,222,376 N N N
2 CDC MEGA 2 and 6 32,222,376 449,213 422,928 236,056 - 2.63% 32,222,376 N N N
182
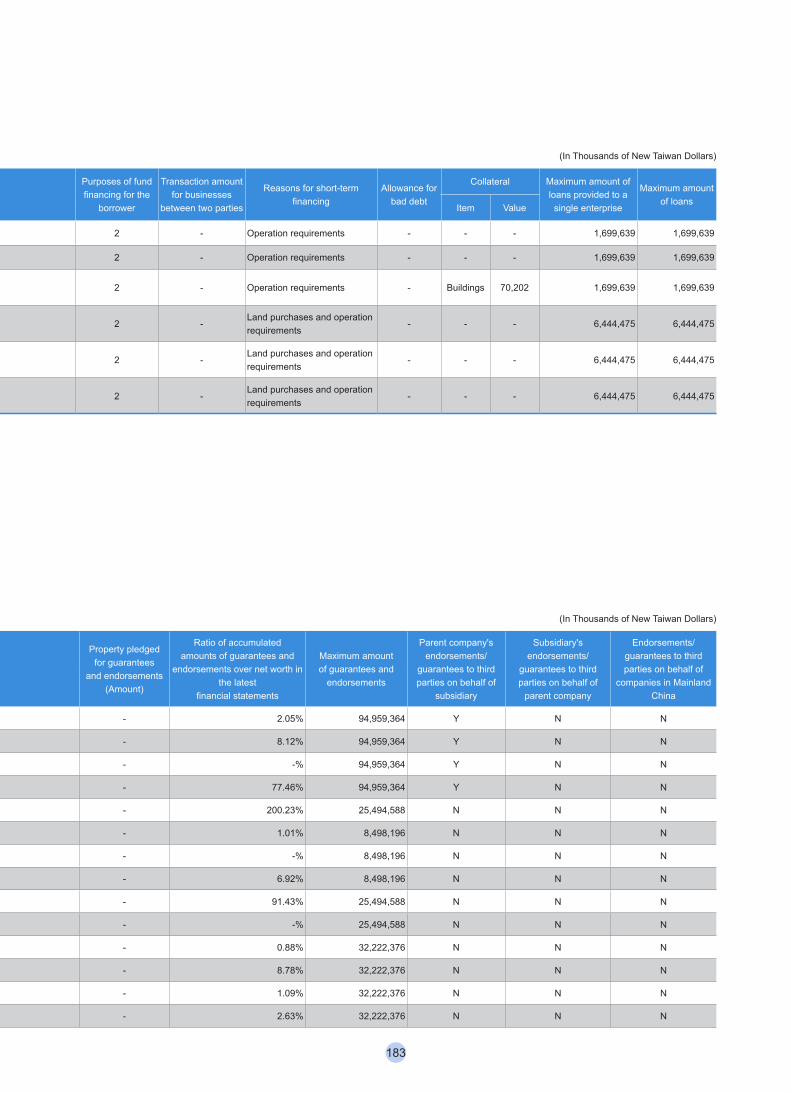
(13) Other disclosures:(a) Information on significant transactions:
The following is the information on significant transactions required by the “Regulations Governing the Preparation of Financial Reports by Securities Issuers” for the Company:(i) Loans to other parties:
(In Thousands of New Taiwan Dollars)
NumberName of lender
Name of borrower
Account name Related partyHighest balance of
financing to other parties during the period
Ending balance
Actual usage amount during
the period
Range of interest rates during the
period
Purposes of fund financing for the
borrower
Transaction amount for businesses
between two parties
Reasons for short-term financing
Allowance for bad debt
Collateral Maximum amount of loans provided to a
single enterprise
Maximum amount of loans
Item Value
1 CEC CEC HK Other receivables Yes 6,024 5,938 5,938 5% 2 - Operation requirements - - - 1,699,639 1,699,639
1 CEC CIC Other receivables Yes 450,300 427,200 299,040 Taifx3+1% 2 - Operation requirements - - - 1,699,639 1,699,639
1 CEC ABC Other receivables No 90,750 - -The same day at a federal rate+0.50%
2 - Operation requirements - Buildings 70,202 1,699,639 1,699,639
2 CDC BANGSAR Other receivables Yes 219,649 207,701 146,859 7.90% 2 -Land purchases and operation requirements
- - - 6,444,475 6,444,475
2 CDC MEGA Other receivables Yes 879,663 831,812 473,3557.65%~
7.90%2 -
Land purchases and operation requirements
- - - 6,444,475 6,444,475
2 CDCGrand River D. Limited
Other receivables No 414,958 414,958 318,5281.90%~
2.50%2 -
Land purchases and operation requirements
- - - 6,444,475 6,444,475
Note 1: The total amount of loans provided to others is limited to 40% of net equity value. The amount of loans to a single business enterprise is limited to 40% of net equity value. Relevant calculation are as follows: 1) CEC: Maximum amount of loans is limited to 40% of net equity value: $4,249,098 thousand × 40% = 1,699,639 thousand Maximum amount of loans provided to a single business enterprise is limited to 40% of net equity value: $4,249,098 thousand × 40% =
1,699,639 thousand2) CDC: Maximum amount of loans is limited to 40% of net equity value: $16,111,188 thousand × 40% = 6,444,475 thousand Maximum amount of loans provided to a single business enterprise is limited to 40% of net equity value: $16,111,188 thousand × 40% =
6,444,475 thousandNote 2: Financing purposes:
1) Business dealings: 12) Short-term financing needs: 2
(ii) Guarantees and endorsements for other parties: (In Thousands of New Taiwan Dollars)
NoName of guarantor
Counter party of guarantee and endorsement Maximum amount of guarantees and endorsements for a specific enterprise
Highest balance of guarantees and
endorsements during the period
Balance of guarantees and
endorsements as of reporting date
Actual usage amount during the
period
Property pledged for guarantees
and endorsements (Amount)
Ratio of accumulated amounts of guarantees and
endorsements over net worth in the latest
financial statements
Maximum amount of guarantees and
endorsements
Parent company's endorsements/
guarantees to third parties on behalf of
subsidiary
Subsidiary's endorsements/
guarantees to third parties on behalf of
parent company
Endorsements/ guarantees to third parties on behalf of
companies in Mainland China
NameRelationship with
the Company
0 CHC CICI 2 94,959,364 528,419 487,406 487,406 - 2.05% 94,959,364 Y N N
0 CHC HDEC 2 94,959,364 2,121,069 1,927,269 1,372,590 - 8.12% 94,959,364 Y N N
0 CHC CEC HK 2 94,959,364 974,500 - - - -% 94,959,364 Y N N
0 CHC CEC 2 94,959,364 20,586,258 18,389,001 8,948,300 - 77.46% 94,959,364 Y N N
1 CEC Fu Tsu Construction Co., Ltd. 5 12,747,294 9,358,000 9,358,000 9,358,000 - 200.23% 25,494,588 N N N
1 CEC CIC 2 8,498,196 347,875 42,720 - - 1.01% 8,498,196 N N N
1 CEC PDC 4 8,498,196 32,000 - - - -% 8,498,196 N N N
1 CEC CEC HK 2 8,498,196 311,840 293,840 - - 6.92% 8,498,196 N N N
1 CEC CICI 2 and 5 12,747,294 4,234,695 3,884,790 3,884,790 - 91.43% 25,494,588 N N N
1 CEC CIMY 2 and 5 12,747,294 3,549,888 - - - -% 25,494,588 N N N
2 CDC CDC US 2 32,222,376 151,250 142,400 135,280 - 0.88% 32,222,376 N N N
2 CDC CCD 2 32,222,376 1,475,000 1,415,000 1,210,000 - 8.78% 32,222,376 N N N
2 CDC BANGSAR 2 and 6 32,222,376 186,369 176,231 - - 1.09% 32,222,376 N N N
2 CDC MEGA 2 and 6 32,222,376 449,213 422,928 236,056 - 2.63% 32,222,376 N N N
183
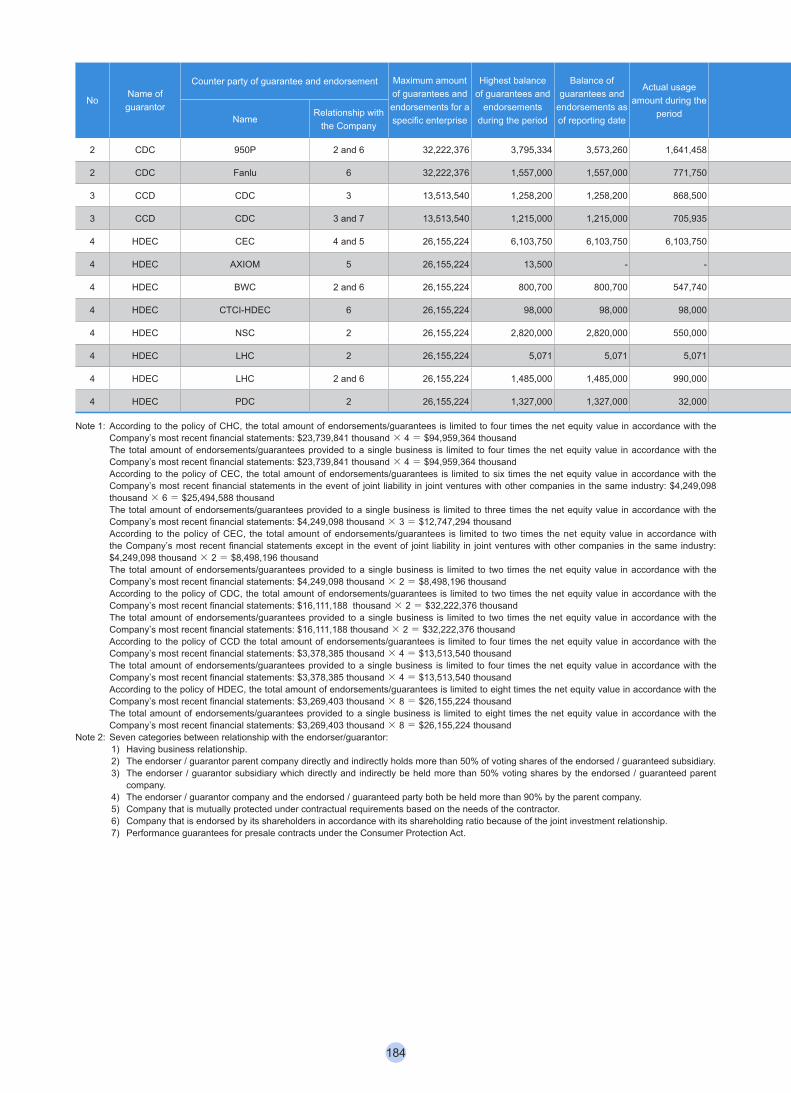
NoName of guarantor
Counter party of guarantee and endorsement Maximum amount of guarantees and endorsements for a specific enterprise
Highest balance of guarantees and
endorsements during the period
Balance of guarantees and
endorsements as of reporting date
Actual usage amount during the
period
Property pledged for guarantees
and endorsements (Amount)
Ratio of accumulated amounts of guarantees and
endorsements over net worth in the latest
financial statements
Maximum amount of guarantees and
endorsements
Parent company's endorsements/
guarantees to third parties on behalf of
subsidiary
Subsidiary's endorsements/
guarantees to third parties on behalf of
parent company
Endorsements/ guarantees to third parties on behalf of
companies in Mainland China
NameRelationship with
the Company
2 CDC 950P 2 and 6 32,222,376 3,795,334 3,573,260 1,641,458 - 22.18% 32,222,376 N N N
2 CDC Fanlu 6 32,222,376 1,557,000 1,557,000 771,750 - 9.66% 32,222,376 N N N
3 CCD CDC 3 13,513,540 1,258,200 1,258,200 868,500 1,258,200 37.24% 13,513,540 N N N
3 CCD CDC 3 and 7 13,513,540 1,215,000 1,215,000 705,935 - 35.96% 13,513,540 N N N
4 HDEC CEC 4 and 5 26,155,224 6,103,750 6,103,750 6,103,750 - 186.69% 26,155,224 N N N
4 HDEC AXIOM 5 26,155,224 13,500 - - - -% 26,155,224 N N N
4 HDEC BWC 2 and 6 26,155,224 800,700 800,700 547,740 - 24.49% 26,155,224 N N N
4 HDEC CTCI-HDEC 6 26,155,224 98,000 98,000 98,000 - 3.00% 26,155,224 N N N
4 HDEC NSC 2 26,155,224 2,820,000 2,820,000 550,000 - 86.25% 26,155,224 N N N
4 HDEC LHC 2 26,155,224 5,071 5,071 5,071 - 0.16% 26,155,224 N N N
4 HDEC LHC 2 and 6 26,155,224 1,485,000 1,485,000 990,000 - 45.42% 26,155,224 N N N
4 HDEC PDC 2 26,155,224 1,327,000 1,327,000 32,000 - 40.59% 26,155,224 N N N
Note 1: According to the policy of CHC, the total amount of endorsements/guarantees is limited to four times the net equity value in accordance with the Company’s most recent financial statements: $23,739,841 thousand × 4 = $94,959,364 thousand
The total amount of endorsements/guarantees provided to a single business is limited to four times the net equity value in accordance with the Company’s most recent financial statements: $23,739,841 thousand × 4 = $94,959,364 thousand
According to the policy of CEC, the total amount of endorsements/guarantees is limited to six times the net equity value in accordance with the Company’s most recent financial statements in the event of joint liability in joint ventures with other companies in the same industry: $4,249,098 thousand × 6 = $25,494,588 thousand
The total amount of endorsements/guarantees provided to a single business is limited to three times the net equity value in accordance with the Company’s most recent financial statements: $4,249,098 thousand × 3 = $12,747,294 thousand
According to the policy of CEC, the total amount of endorsements/guarantees is limited to two times the net equity value in accordance with the Company’s most recent financial statements except in the event of joint liability in joint ventures with other companies in the same industry: $4,249,098 thousand × 2 = $8,498,196 thousand
The total amount of endorsements/guarantees provided to a single business is limited to two times the net equity value in accordance with the Company’s most recent financial statements: $4,249,098 thousand × 2 = $8,498,196 thousand
According to the policy of CDC, the total amount of endorsements/guarantees is limited to two times the net equity value in accordance with the Company’s most recent financial statements: $16,111,188 thousand × 2 = $32,222,376 thousand
The total amount of endorsements/guarantees provided to a single business is limited to two times the net equity value in accordance with the Company’s most recent financial statements: $16,111,188 thousand × 2 = $32,222,376 thousand
According to the policy of CCD the total amount of endorsements/guarantees is limited to four times the net equity value in accordance with the Company’s most recent financial statements: $3,378,385 thousand × 4 = $13,513,540 thousand
The total amount of endorsements/guarantees provided to a single business is limited to four times the net equity value in accordance with the Company’s most recent financial statements: $3,378,385 thousand × 4 = $13,513,540 thousand
According to the policy of HDEC, the total amount of endorsements/guarantees is limited to eight times the net equity value in accordance with the Company’s most recent financial statements: $3,269,403 thousand × 8 = $26,155,224 thousand
The total amount of endorsements/guarantees provided to a single business is limited to eight times the net equity value in accordance with the Company’s most recent financial statements: $3,269,403 thousand × 8 = $26,155,224 thousand
Note 2: Seven categories between relationship with the endorser/guarantor:1) Having business relationship.2) The endorser / guarantor parent company directly and indirectly holds more than 50% of voting shares of the endorsed / guaranteed subsidiary.3) The endorser / guarantor subsidiary which directly and indirectly be held more than 50% voting shares by the endorsed / guaranteed parent
company.4) The endorser / guarantor company and the endorsed / guaranteed party both be held more than 90% by the parent company.5) Company that is mutually protected under contractual requirements based on the needs of the contractor.6) Company that is endorsed by its shareholders in accordance with its shareholding ratio because of the joint investment relationship.7) Performance guarantees for presale contracts under the Consumer Protection Act.
184
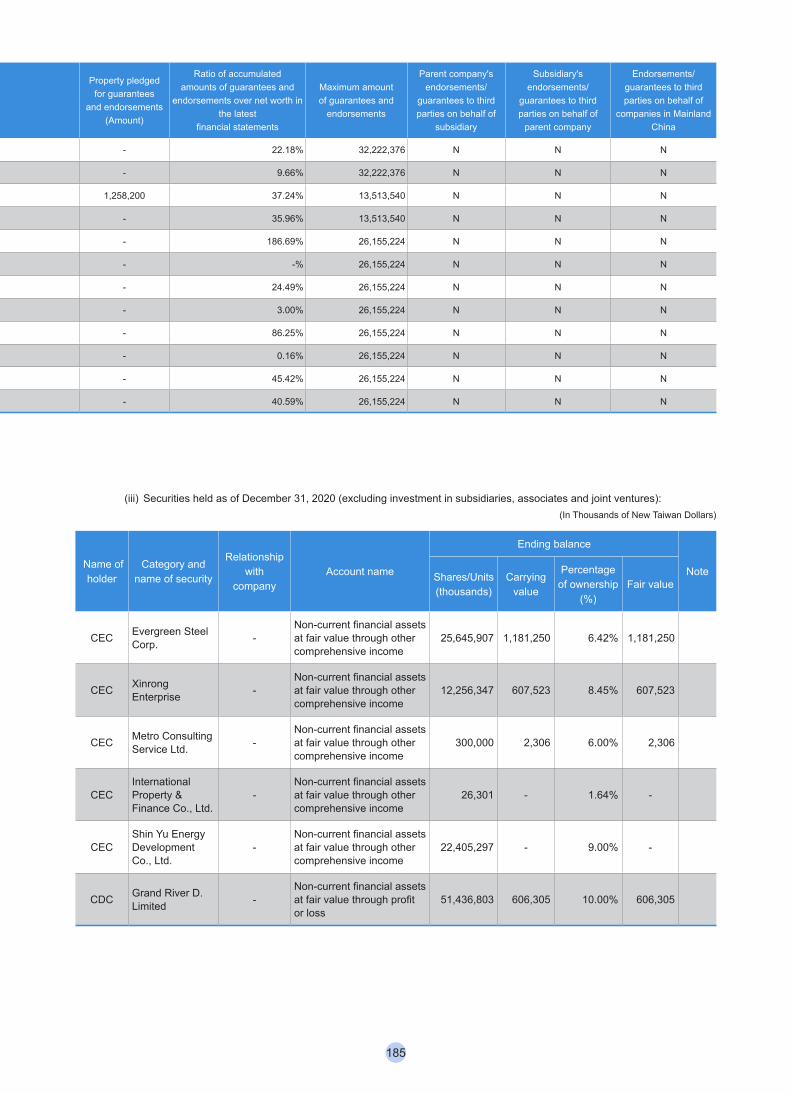
NoName of guarantor
Counter party of guarantee and endorsement Maximum amount of guarantees and endorsements for a specific enterprise
Highest balance of guarantees and
endorsements during the period
Balance of guarantees and
endorsements as of reporting date
Actual usage amount during the
period
Property pledged for guarantees
and endorsements (Amount)
Ratio of accumulated amounts of guarantees and
endorsements over net worth in the latest
financial statements
Maximum amount of guarantees and
endorsements
Parent company's endorsements/
guarantees to third parties on behalf of
subsidiary
Subsidiary's endorsements/
guarantees to third parties on behalf of
parent company
Endorsements/ guarantees to third parties on behalf of
companies in Mainland China
NameRelationship with
the Company
2 CDC 950P 2 and 6 32,222,376 3,795,334 3,573,260 1,641,458 - 22.18% 32,222,376 N N N
2 CDC Fanlu 6 32,222,376 1,557,000 1,557,000 771,750 - 9.66% 32,222,376 N N N
3 CCD CDC 3 13,513,540 1,258,200 1,258,200 868,500 1,258,200 37.24% 13,513,540 N N N
3 CCD CDC 3 and 7 13,513,540 1,215,000 1,215,000 705,935 - 35.96% 13,513,540 N N N
4 HDEC CEC 4 and 5 26,155,224 6,103,750 6,103,750 6,103,750 - 186.69% 26,155,224 N N N
4 HDEC AXIOM 5 26,155,224 13,500 - - - -% 26,155,224 N N N
4 HDEC BWC 2 and 6 26,155,224 800,700 800,700 547,740 - 24.49% 26,155,224 N N N
4 HDEC CTCI-HDEC 6 26,155,224 98,000 98,000 98,000 - 3.00% 26,155,224 N N N
4 HDEC NSC 2 26,155,224 2,820,000 2,820,000 550,000 - 86.25% 26,155,224 N N N
4 HDEC LHC 2 26,155,224 5,071 5,071 5,071 - 0.16% 26,155,224 N N N
4 HDEC LHC 2 and 6 26,155,224 1,485,000 1,485,000 990,000 - 45.42% 26,155,224 N N N
4 HDEC PDC 2 26,155,224 1,327,000 1,327,000 32,000 - 40.59% 26,155,224 N N N
Note 1: According to the policy of CHC, the total amount of endorsements/guarantees is limited to four times the net equity value in accordance with the Company’s most recent financial statements: $23,739,841 thousand × 4 = $94,959,364 thousand
The total amount of endorsements/guarantees provided to a single business is limited to four times the net equity value in accordance with the Company’s most recent financial statements: $23,739,841 thousand × 4 = $94,959,364 thousand
According to the policy of CEC, the total amount of endorsements/guarantees is limited to six times the net equity value in accordance with the Company’s most recent financial statements in the event of joint liability in joint ventures with other companies in the same industry: $4,249,098 thousand × 6 = $25,494,588 thousand
The total amount of endorsements/guarantees provided to a single business is limited to three times the net equity value in accordance with the Company’s most recent financial statements: $4,249,098 thousand × 3 = $12,747,294 thousand
According to the policy of CEC, the total amount of endorsements/guarantees is limited to two times the net equity value in accordance with the Company’s most recent financial statements except in the event of joint liability in joint ventures with other companies in the same industry: $4,249,098 thousand × 2 = $8,498,196 thousand
The total amount of endorsements/guarantees provided to a single business is limited to two times the net equity value in accordance with the Company’s most recent financial statements: $4,249,098 thousand × 2 = $8,498,196 thousand
According to the policy of CDC, the total amount of endorsements/guarantees is limited to two times the net equity value in accordance with the Company’s most recent financial statements: $16,111,188 thousand × 2 = $32,222,376 thousand
The total amount of endorsements/guarantees provided to a single business is limited to two times the net equity value in accordance with the Company’s most recent financial statements: $16,111,188 thousand × 2 = $32,222,376 thousand
According to the policy of CCD the total amount of endorsements/guarantees is limited to four times the net equity value in accordance with the Company’s most recent financial statements: $3,378,385 thousand × 4 = $13,513,540 thousand
The total amount of endorsements/guarantees provided to a single business is limited to four times the net equity value in accordance with the Company’s most recent financial statements: $3,378,385 thousand × 4 = $13,513,540 thousand
According to the policy of HDEC, the total amount of endorsements/guarantees is limited to eight times the net equity value in accordance with the Company’s most recent financial statements: $3,269,403 thousand × 8 = $26,155,224 thousand
The total amount of endorsements/guarantees provided to a single business is limited to eight times the net equity value in accordance with the Company’s most recent financial statements: $3,269,403 thousand × 8 = $26,155,224 thousand
Note 2: Seven categories between relationship with the endorser/guarantor:1) Having business relationship.2) The endorser / guarantor parent company directly and indirectly holds more than 50% of voting shares of the endorsed / guaranteed subsidiary.3) The endorser / guarantor subsidiary which directly and indirectly be held more than 50% voting shares by the endorsed / guaranteed parent
company.4) The endorser / guarantor company and the endorsed / guaranteed party both be held more than 90% by the parent company.5) Company that is mutually protected under contractual requirements based on the needs of the contractor.6) Company that is endorsed by its shareholders in accordance with its shareholding ratio because of the joint investment relationship.7) Performance guarantees for presale contracts under the Consumer Protection Act.
(iii) Securities held as of December 31, 2020 (excluding investment in subsidiaries, associates and joint ventures):(In Thousands of New Taiwan Dollars)
Name of holder
Category and name of security
Relationshipwith
companyAccount name
Ending balance
NoteShares/Units (thousands)
Carrying value
Percentage of ownership
(%)Fair value
CEC Evergreen Steel Corp. -
Non-current financial assets at fair value through other comprehensive income
25,645,907 1,181,250 6.42% 1,181,250
CEC Xinrong Enterprise -
Non-current financial assets at fair value through other comprehensive income
12,256,347 607,523 8.45% 607,523
CEC Metro Consulting Service Ltd. -
Non-current financial assets at fair value through other comprehensive income
300,000 2,306 6.00% 2,306
CECInternational Property & Finance Co., Ltd.
-Non-current financial assets at fair value through other comprehensive income
26,301 - 1.64% -
CECShin Yu Energy Development Co., Ltd.
-Non-current financial assets at fair value through other comprehensive income
22,405,297 - 9.00% -
CDC Grand River D. Limited -
Non-current financial assets at fair value through profit or loss
51,436,803 606,305 10.00% 606,305
185
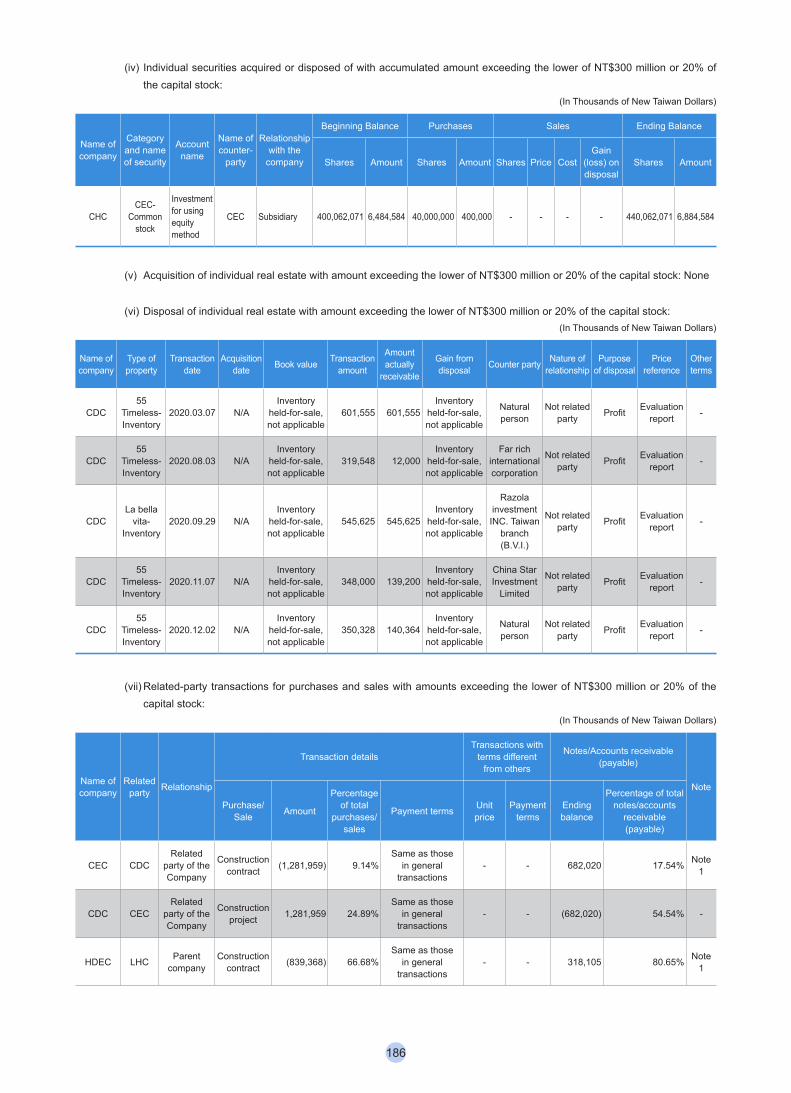
(iv) Individual securities acquired or disposed of with accumulated amount exceeding the lower of NT$300 million or 20% of the capital stock:
(In Thousands of New Taiwan Dollars)
Name of company
Category and name of security
Account name
Name of counter-
party
Relationship with the
company
Beginning Balance Purchases Sales Ending Balance
Shares Amount Shares Amount Shares Price CostGain
(loss) on disposal
Shares Amount
CHCCEC-
Common stock
Investment for using equity method
CEC Subsidiary 400,062,071 6,484,584 40,000,000 400,000 - - - - 440,062,071 6,884,584
(v) Acquisition of individual real estate with amount exceeding the lower of NT$300 million or 20% of the capital stock: None
(vi) Disposal of individual real estate with amount exceeding the lower of NT$300 million or 20% of the capital stock:(In Thousands of New Taiwan Dollars)
Name of company
Type of property
Transaction date
Acquisition date Book value Transaction
amount
Amount actually
receivable
Gain from disposal Counter party Nature of
relationshipPurpose
of disposalPrice
referenceOther terms
CDC55
Timeless-Inventory
2020.03.07 N/AInventory
held-for-sale, not applicable
601,555 601,555Inventory
held-for-sale, not applicable
Natural person
Not related party Profit Evaluation
report -
CDC55
Timeless-Inventory
2020.08.03 N/AInventory
held-for-sale, not applicable
319,548 12,000Inventory
held-for-sale, not applicable
Far rich international corporation
Not related party Profit Evaluation
report -
CDCLa bella
vita-Inventory
2020.09.29 N/AInventory
held-for-sale, not applicable
545,625 545,625Inventory
held-for-sale, not applicable
Razola investment INC. Taiwan
branch (B.V.I.)
Not related party Profit Evaluation
report -
CDC55
Timeless-Inventory
2020.11.07 N/AInventory
held-for-sale, not applicable
348,000 139,200Inventory
held-for-sale, not applicable
China Star Investment
Limited
Not related party Profit Evaluation
report -
CDC55
Timeless-Inventory
2020.12.02 N/AInventory
held-for-sale, not applicable
350,328 140,364Inventory
held-for-sale, not applicable
Natural person
Not related party Profit Evaluation
report -
(vii) Related-party transactions for purchases and sales with amounts exceeding the lower of NT$300 million or 20% of the capital stock:
(In Thousands of New Taiwan Dollars)
Name of company
Related party Relationship
Transaction detailsTransactions with
terms different from others
Notes/Accounts receivable (payable)
Note
Purchase/Sale Amount
Percentage of total
purchases/sales
Payment terms Unit price
Payment terms
Ending balance
Percentage of total notes/accounts
receivable (payable)
CEC CDCRelated
party of the Company
Construction contract (1,281,959) 9.14%
Same as those in general
transactions- - 682,020 17.54% Note
1
CDC CECRelated
party of the Company
Construction project 1,281,959 24.89%
Same as those in general
transactions- - (682,020) 54.54% -
HDEC LHC Parent company
Construction contract (839,368) 66.68%
Same as those in general
transactions- - 318,105 80.65% Note
1
186
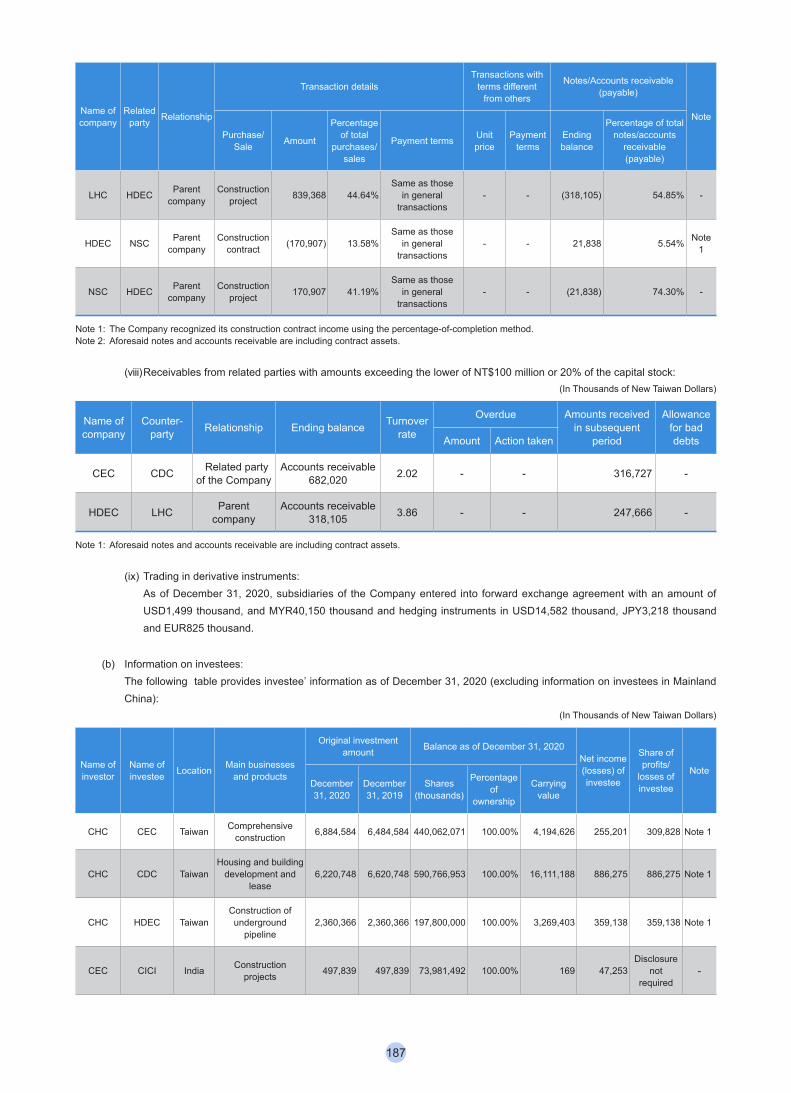
Name of company
Related party Relationship
Transaction detailsTransactions with
terms different from others
Notes/Accounts receivable (payable)
Note
Purchase/Sale Amount
Percentage of total
purchases/sales
Payment terms Unit price
Payment terms
Ending balance
Percentage of total notes/accounts
receivable (payable)
LHC HDEC Parent company
Construction project 839,368 44.64%
Same as those in general
transactions- - (318,105) 54.85% -
HDEC NSC Parent company
Construction contract (170,907) 13.58%
Same as those in general
transactions- - 21,838 5.54% Note
1
NSC HDEC Parent company
Construction project 170,907 41.19%
Same as those in general
transactions- - (21,838) 74.30% -
Note 1: The Company recognized its construction contract income using the percentage-of-completion method.Note 2: Aforesaid notes and accounts receivable are including contract assets.
(viii) Receivables from related parties with amounts exceeding the lower of NT$100 million or 20% of the capital stock:(In Thousands of New Taiwan Dollars)
Name of company
Counter-party Relationship Ending balance Turnover
rate
Overdue Amounts received in subsequent
period
Allowance for bad debtsAmount Action taken
CEC CDC Related party of the Company
Accounts receivable 682,020 2.02 - - 316,727 -
HDEC LHC Parent company
Accounts receivable 318,105 3.86 - - 247,666 -
Note 1: Aforesaid notes and accounts receivable are including contract assets.
(ix) Trading in derivative instruments: As of December 31, 2020, subsidiaries of the Company entered into forward exchange agreement with an amount of USD1,499 thousand, and MYR40,150 thousand and hedging instruments in USD14,582 thousand, JPY3,218 thousand and EUR825 thousand.
(b) Information on investees: The following table provides investee’ information as of December 31, 2020 (excluding information on investees in Mainland China):
(In Thousands of New Taiwan Dollars)
Name of investor
Name of investee Location Main businesses
and products
Original investment amount Balance as of December 31, 2020
Net income (losses) of investee
Share of profits/
losses of investee
NoteDecember 31, 2020
December 31, 2019
Shares (thousands)
Percentage of
ownership
Carrying value
CHC CEC Taiwan Comprehensive construction 6,884,584 6,484,584 440,062,071 100.00% 4,194,626 255,201 309,828 Note 1
CHC CDC TaiwanHousing and building
development and lease
6,220,748 6,620,748 590,766,953 100.00% 16,111,188 886,275 886,275 Note 1
CHC HDEC TaiwanConstruction of underground
pipeline2,360,366 2,360,366 197,800,000 100.00% 3,269,403 359,138 359,138 Note 1
CEC CICI India Construction projects 497,839 497,839 73,981,492 100.00% 169 47,253
Disclosure not
required-
187
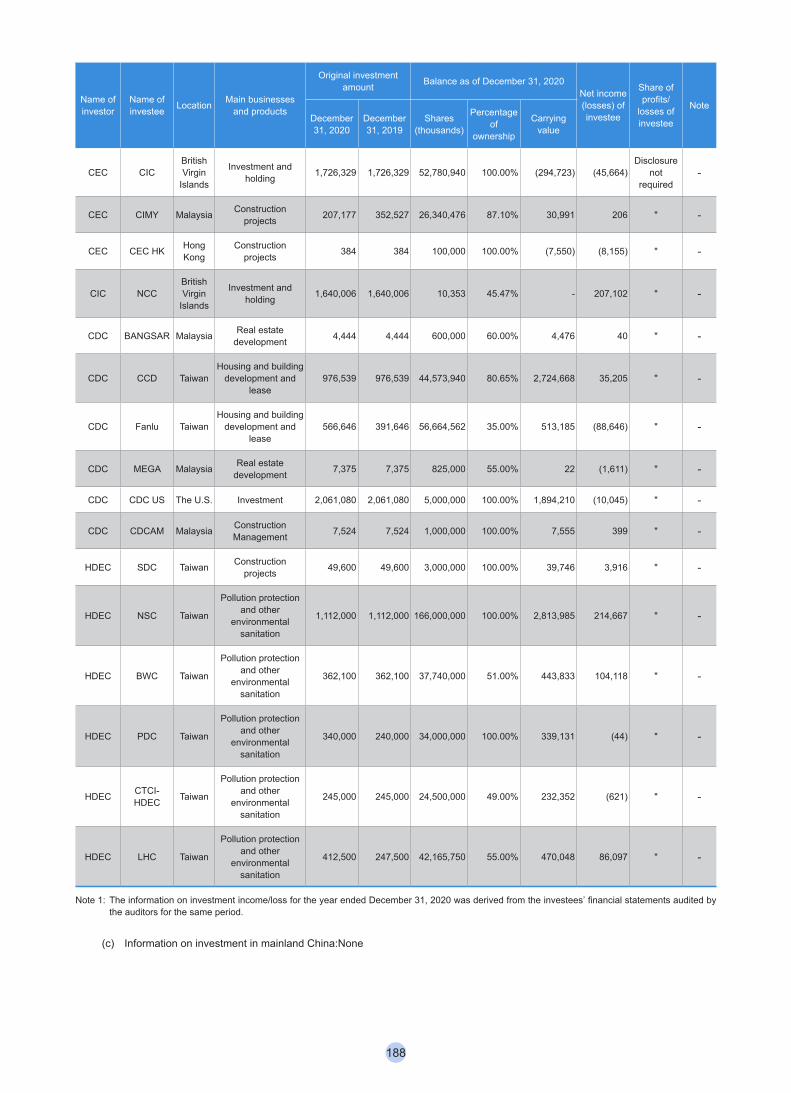
Name of investor
Name of investee Location Main businesses
and products
Original investment amount Balance as of December 31, 2020
Net income (losses) of investee
Share of profits/
losses of investee
NoteDecember 31, 2020
December 31, 2019
Shares (thousands)
Percentage of
ownership
Carrying value
CEC CICBritish Virgin
Islands
Investment and holding 1,726,329 1,726,329 52,780,940 100.00% (294,723) (45,664)
Disclosure not
required-
CEC CIMY Malaysia Construction projects 207,177 352,527 26,340,476 87.10% 30,991 206 " -
CEC CEC HK Hong Kong
Construction projects 384 384 100,000 100.00% (7,550) (8,155) " -
CIC NCCBritish Virgin
Islands
Investment and holding 1,640,006 1,640,006 10,353 45.47% - 207,102 " -
CDC BANGSAR Malaysia Real estate development 4,444 4,444 600,000 60.00% 4,476 40 " -
CDC CCD TaiwanHousing and building
development and lease
976,539 976,539 44,573,940 80.65% 2,724,668 35,205 " -
CDC Fanlu TaiwanHousing and building
development and lease
566,646 391,646 56,664,562 35.00% 513,185 (88,646) " -
CDC MEGA Malaysia Real estate development 7,375 7,375 825,000 55.00% 22 (1,611) " -
CDC CDC US The U.S. Investment 2,061,080 2,061,080 5,000,000 100.00% 1,894,210 (10,045) " -
CDC CDCAM Malaysia Construction Management 7,524 7,524 1,000,000 100.00% 7,555 399 " -
HDEC SDC Taiwan Construction projects 49,600 49,600 3,000,000 100.00% 39,746 3,916 " -
HDEC NSC Taiwan
Pollution protection and other
environmental sanitation
1,112,000 1,112,000 166,000,000 100.00% 2,813,985 214,667 " -
HDEC BWC Taiwan
Pollution protection and other
environmental sanitation
362,100 362,100 37,740,000 51.00% 443,833 104,118 " -
HDEC PDC Taiwan
Pollution protection and other
environmental sanitation
340,000 240,000 34,000,000 100.00% 339,131 (44) " -
HDEC CTCI-HDEC Taiwan
Pollution protection and other
environmental sanitation
245,000 245,000 24,500,000 49.00% 232,352 (621) " -
HDEC LHC Taiwan
Pollution protection and other
environmental sanitation
412,500 247,500 42,165,750 55.00% 470,048 86,097 " -
Note 1: The information on investment income/loss for the year ended December 31, 2020 was derived from the investees’ financial statements audited by the auditors for the same period.
(c) Information on investment in mainland China:None
188
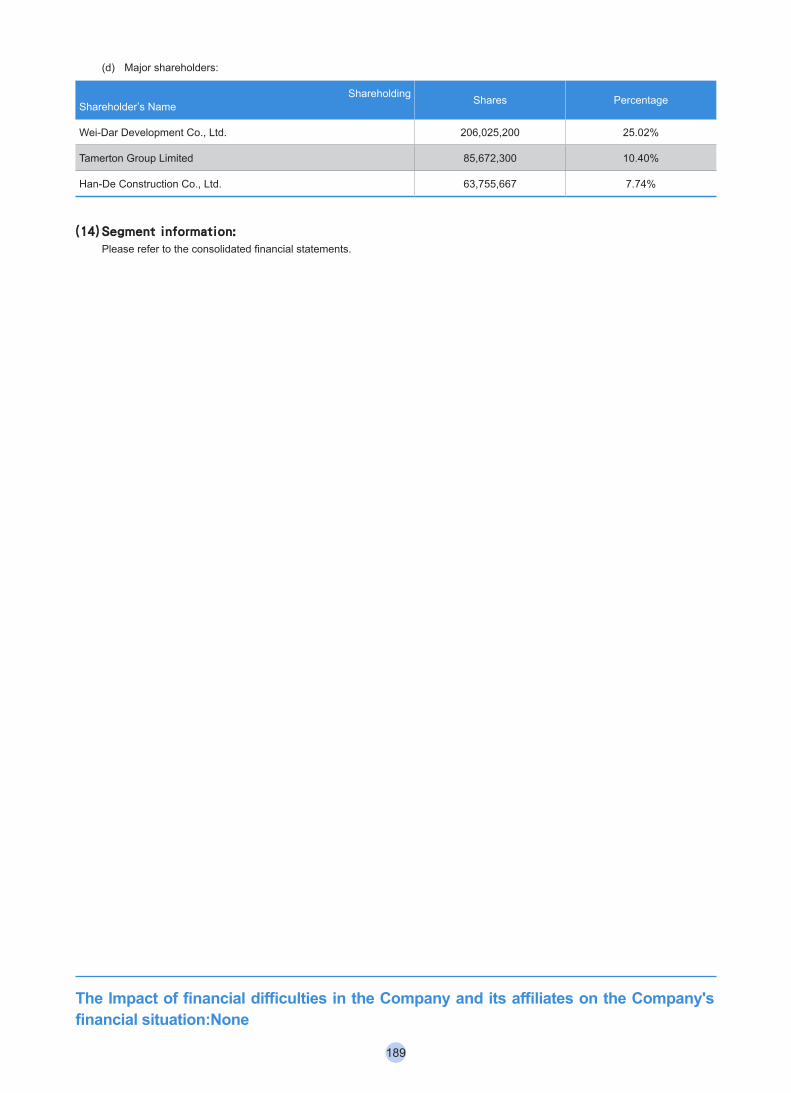
(d) Major shareholders:
ShareholdingShareholder’s Name Shares Percentage
Wei-Dar Development Co., Ltd. 206,025,200 25.02%
Tamerton Group Limited 85,672,300 10.40%
Han-De Construction Co., Ltd. 63,755,667 7.74%
(14) Segment information:Please refer to the consolidated financial statements.
The Impact of financial difficulties in the Company and its affiliates on the Company's financial situation:None
189
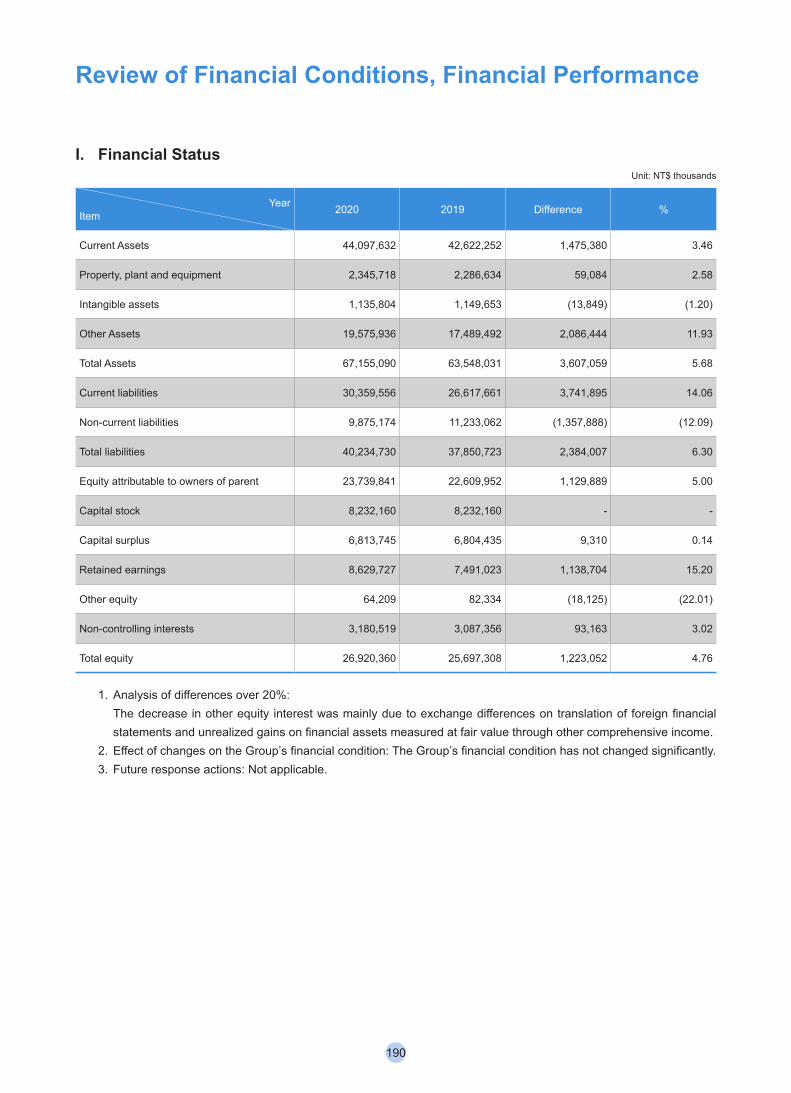
Review of Financial Conditions, Financial Performance
I. Financial StatusUnit: NT$ thousands
YearItem 2020 2019 Difference %
Current Assets 44,097,632 42,622,252 1,475,380 3.46
Property, plant and equipment 2,345,718 2,286,634 59,084 2.58
Intangible assets 1,135,804 1,149,653 (13,849) (1.20)
Other Assets 19,575,936 17,489,492 2,086,444 11.93
Total Assets 67,155,090 63,548,031 3,607,059 5.68
Current liabilities 30,359,556 26,617,661 3,741,895 14.06
Non-current liabilities 9,875,174 11,233,062 (1,357,888) (12.09)
Total liabilities 40,234,730 37,850,723 2,384,007 6.30
Equity attributable to owners of parent 23,739,841 22,609,952 1,129,889 5.00
Capital stock 8,232,160 8,232,160 - -
Capital surplus 6,813,745 6,804,435 9,310 0.14
Retained earnings 8,629,727 7,491,023 1,138,704 15.20
Other equity 64,209 82,334 (18,125) (22.01)
Non-controlling interests 3,180,519 3,087,356 93,163 3.02
Total equity 26,920,360 25,697,308 1,223,052 4.76
1. Analysis of differences over 20%: The decrease in other equity interest was mainly due to exchange differences on translation of foreign financial
statements and unrealized gains on financial assets measured at fair value through other comprehensive income.2. Effect of changes on the Group’s financial condition: The Group’s financial condition has not changed significantly.3. Future response actions: Not applicable.
190
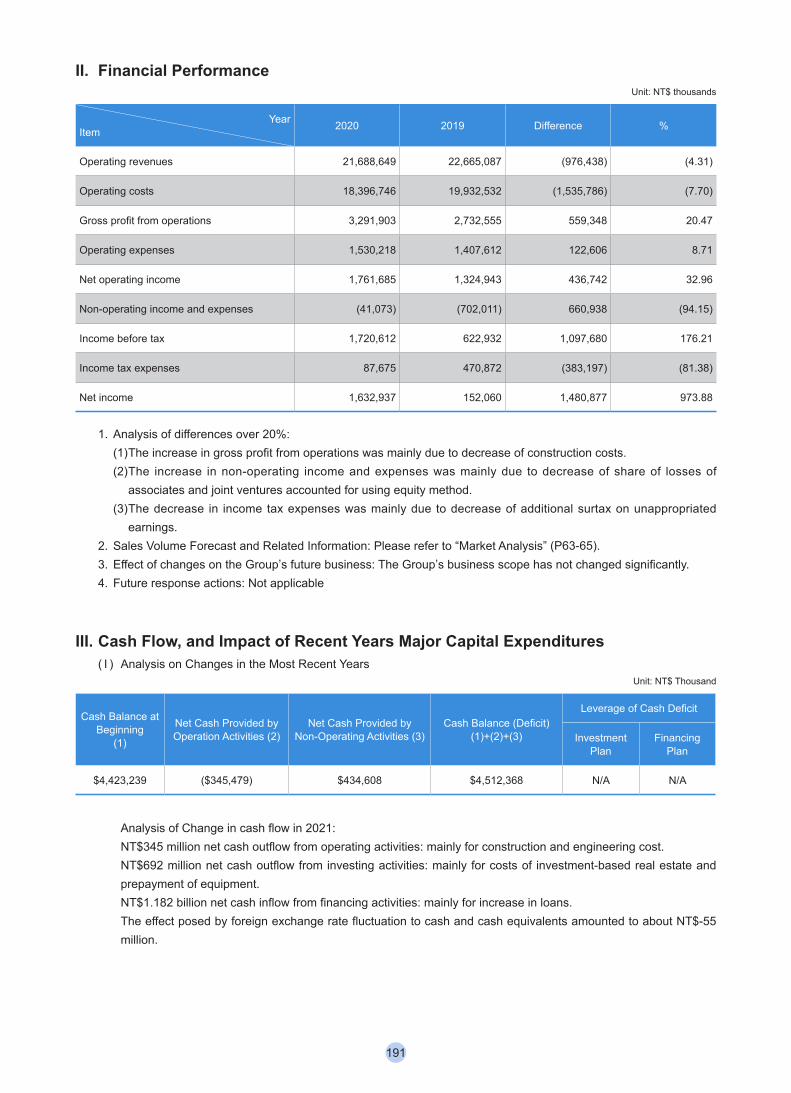
II. Financial PerformanceUnit: NT$ thousands
YearItem 2020 2019 Difference %
Operating revenues 21,688,649 22,665,087 (976,438) (4.31)
Operating costs 18,396,746 19,932,532 (1,535,786) (7.70)
Gross profit from operations 3,291,903 2,732,555 559,348 20.47
Operating expenses 1,530,218 1,407,612 122,606 8.71
Net operating income 1,761,685 1,324,943 436,742 32.96
Non-operating income and expenses (41,073) (702,011) 660,938 (94.15)
Income before tax 1,720,612 622,932 1,097,680 176.21
Income tax expenses 87,675 470,872 (383,197) (81.38)
Net income 1,632,937 152,060 1,480,877 973.88
1. Analysis of differences over 20%:(1) The increase in gross profit from operations was mainly due to decrease of construction costs.(2) The increase in non-operating income and expenses was mainly due to decrease of share of losses of
associates and joint ventures accounted for using equity method.(3) The decrease in income tax expenses was mainly due to decrease of additional surtax on unappropriated
earnings.2. Sales Volume Forecast and Related Information: Please refer to “Market Analysis” (P63-65).3. Effect of changes on the Group’s future business: The Group’s business scope has not changed significantly.4. Future response actions: Not applicable
III. Cash Flow, and Impact of Recent Years Major Capital Expenditures( I ) Analysis on Changes in the Most Recent Years
Unit: NT$ Thousand
Cash Balance at Beginning
(1)
Net Cash Provided by Operation Activities (2)
Net Cash Provided by Non-Operating Activities (3)
Cash Balance (Deficit)(1)+(2)+(3)
Leverage of Cash Deficit
Investment Plan
Financing Plan
$4,423,239 ($345,479) $434,608 $4,512,368 N/A N/A
Analysis of Change in cash flow in 2021: NT$345 million net cash outflow from operating activities: mainly for construction and engineering cost. NT$692 million net cash outflow from investing activities: mainly for costs of investment-based real estate and prepayment of equipment. NT$1.182 billion net cash inflow from financing activities: mainly for increase in loans. The effect posed by foreign exchange rate fluctuation to cash and cash equivalents amounted to about NT$-55 million.
191
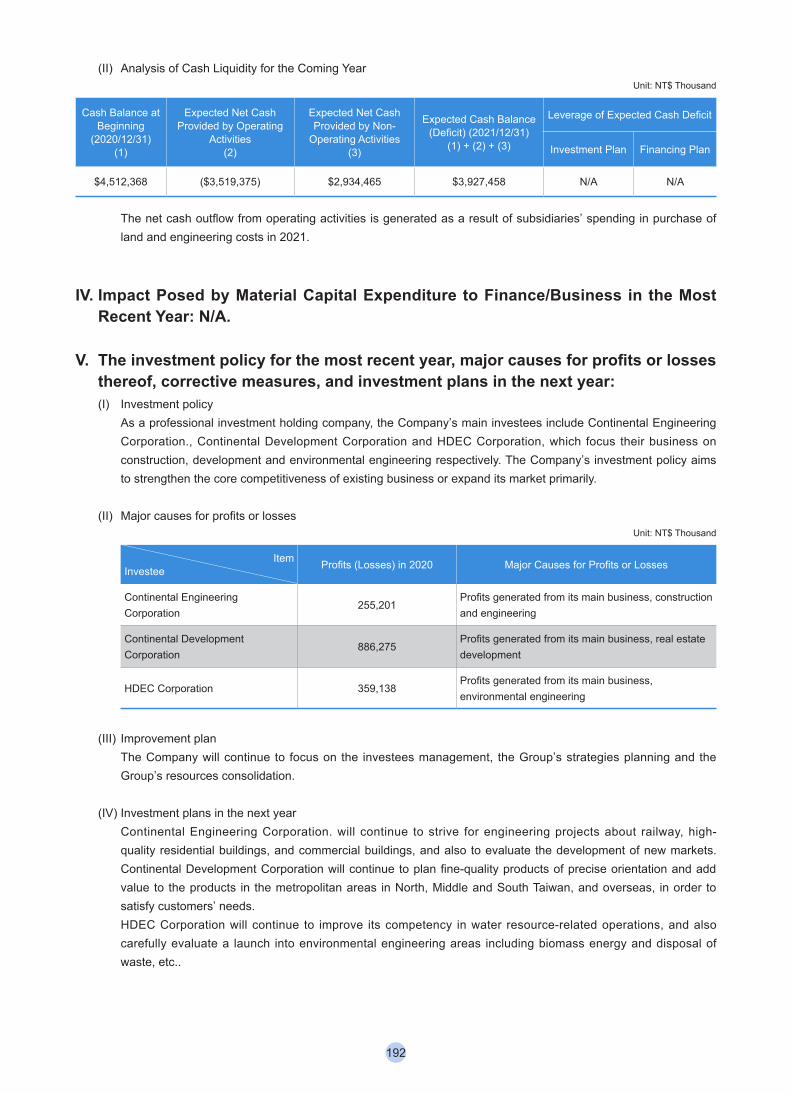
(II) Analysis of Cash Liquidity for the Coming YearUnit: NT$ Thousand
Cash Balance at Beginning
(2020/12/31)(1)
Expected Net Cash Provided by Operating
Activities(2)
Expected Net Cash Provided by Non-
Operating Activities(3)
Expected Cash Balance (Deficit) (2021/12/31)
(1) + (2) + (3)
Leverage of Expected Cash Deficit
Investment Plan Financing Plan
$4,512,368 ($3,519,375) $2,934,465 $3,927,458 N/A N/A
The net cash outflow from operating activities is generated as a result of subsidiaries’ spending in purchase of land and engineering costs in 2021.
IV. Impact Posed by Material Capital Expenditure to Finance/Business in the Most Recent Year: N/A.
V. The investment policy for the most recent year, major causes for profits or losses thereof, corrective measures, and investment plans in the next year:(I) Investment policy
As a professional investment holding company, the Company’s main investees include Continental Engineering Corporation., Continental Development Corporation and HDEC Corporation, which focus their business on construction, development and environmental engineering respectively. The Company’s investment policy aims to strengthen the core competitiveness of existing business or expand its market primarily.
(II) Major causes for profits or lossesUnit: NT$ Thousand
ItemInvestee Profits (Losses) in 2020 Major Causes for Profits or Losses
Continental Engineering Corporation
255,201Profits generated from its main business, construction and engineering
Continental Development Corporation
886,275Profits generated from its main business, real estate development
HDEC Corporation 359,138Profits generated from its main business, environmental engineering
(III) Improvement planThe Company will continue to focus on the investees management, the Group’s strategies planning and the Group’s resources consolidation.
(IV) Investment plans in the next yearContinental Engineering Corporation. will continue to strive for engineering projects about railway, high-quality residential buildings, and commercial buildings, and also to evaluate the development of new markets. Continental Development Corporation will continue to plan fine-quality products of precise orientation and add value to the products in the metropolitan areas in North, Middle and South Taiwan, and overseas, in order to satisfy customers’ needs.HDEC Corporation will continue to improve its competency in water resource-related operations, and also carefully evaluate a launch into environmental engineering areas including biomass energy and disposal of waste, etc..
192
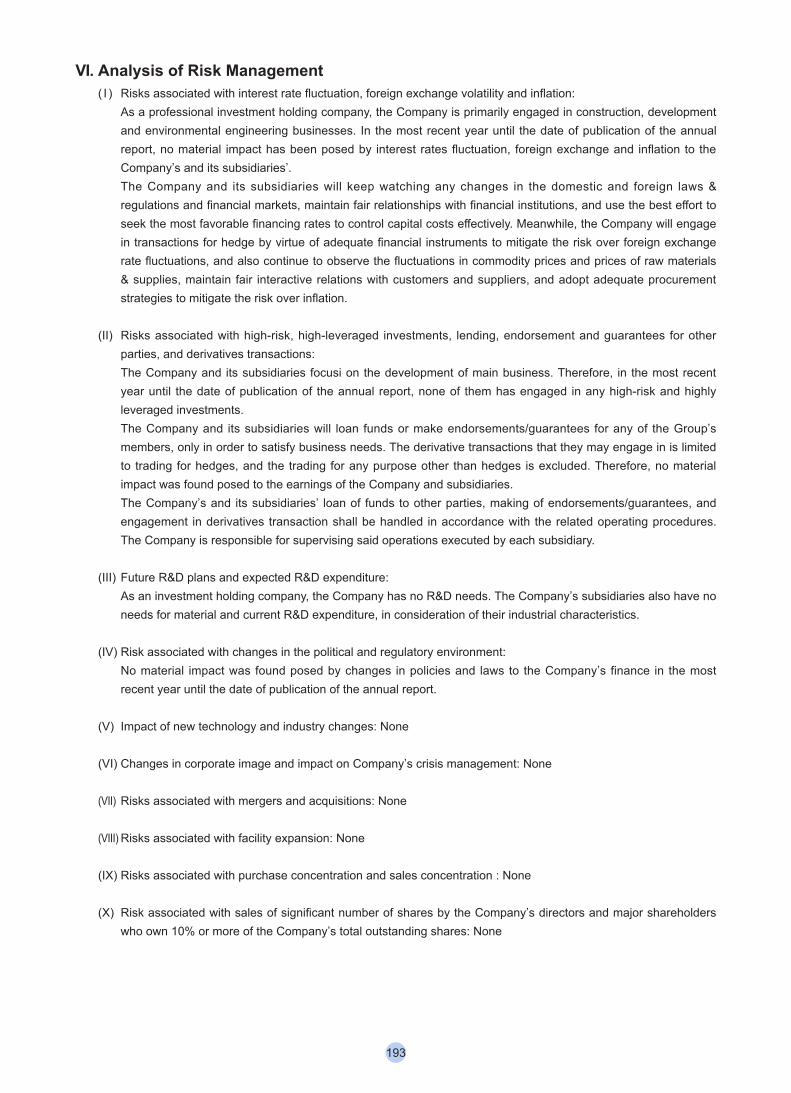
VI. Analysis of Risk Management( I ) Risks associated with interest rate fluctuation, foreign exchange volatility and inflation:
As a professional investment holding company, the Company is primarily engaged in construction, development and environmental engineering businesses. In the most recent year until the date of publication of the annual report, no material impact has been posed by interest rates fluctuation, foreign exchange and inflation to the Company’s and its subsidiaries’.The Company and its subsidiaries will keep watching any changes in the domestic and foreign laws & regulations and financial markets, maintain fair relationships with financial institutions, and use the best effort to seek the most favorable financing rates to control capital costs effectively. Meanwhile, the Company will engage in transactions for hedge by virtue of adequate financial instruments to mitigate the risk over foreign exchange rate fluctuations, and also continue to observe the fluctuations in commodity prices and prices of raw materials & supplies, maintain fair interactive relations with customers and suppliers, and adopt adequate procurement strategies to mitigate the risk over inflation.
(II) Risks associated with high-risk, high-leveraged investments, lending, endorsement and guarantees for other parties, and derivatives transactions:The Company and its subsidiaries focusi on the development of main business. Therefore, in the most recent year until the date of publication of the annual report, none of them has engaged in any high-risk and highly leveraged investments.The Company and its subsidiaries will loan funds or make endorsements/guarantees for any of the Group’s members, only in order to satisfy business needs. The derivative transactions that they may engage in is limited to trading for hedges, and the trading for any purpose other than hedges is excluded. Therefore, no material impact was found posed to the earnings of the Company and subsidiaries.The Company’s and its subsidiaries’ loan of funds to other parties, making of endorsements/guarantees, and engagement in derivatives transaction shall be handled in accordance with the related operating procedures. The Company is responsible for supervising said operations executed by each subsidiary.
(III) Future R&D plans and expected R&D expenditure:As an investment holding company, the Company has no R&D needs. The Company’s subsidiaries also have no needs for material and current R&D expenditure, in consideration of their industrial characteristics.
(IV) Risk associated with changes in the political and regulatory environment:No material impact was found posed by changes in policies and laws to the Company’s finance in the most recent year until the date of publication of the annual report.
(V) Impact of new technology and industry changes: None
(VI) Changes in corporate image and impact on Company’s crisis management: None
(VII) Risks associated with mergers and acquisitions: None
(VIII) Risks associated with facility expansion: None
(IX) Risks associated with purchase concentration and sales concentration : None
(X) Risk associated with sales of significant number of shares by the Company’s directors and major shareholders who own 10% or more of the Company’s total outstanding shares: None
193
(XI) Risks associated with the change in management: None
(XII) Major litigations and non-contentious cases: The Company: N/A.Important Subsidiary – Continental Engineering Corporation:A. Continental Engineering Corp. was awarded by the Kao-Nan Region Construction Office for the East-
West Expressway, Directorate General of Highways, MOTC (hereinafter referred to as the “Employer”) a total of six contracts concerning the E802~E806 East-West Expressway Kaohsiung Chaozhou Line 0K+500~8K+950 Wujia~Shang Liao Section Project (hereinafter referred to as the “Permanent Work”) and E802~E806 East-West Expressway Kaohsiung Chaozhou Line 0K+500~8K+950 Wujia~Shang Liao Section Project (for telecommunications, TPC pipelines, TPC electrical engineering, water pipeline at Guopi Rd., and water supply works, hereinafter referred to as the “Commissioned Work”). Notwithstanding, due to the increase in sand and gravel prices, extension of construction period, change of design, and other changes of circumstances, which are not attributed to Continental Engineering Corp., Continental Engineering Corp. initiated an action to claim an adjustment on the contract amount for the Permanent Work and Commissioned Work on September 8, 2006. The claimed value amounted to NT$466,670,704, plus the default interest accruable at the annual interest rate of 5% from April 6, 2005. According to the judgment rendered by Taiwan High Court, Kaohsiung Branch in the second instance, the Employer shall pay Continental Engineering Corp. NT$169,247,213 plus the default interest accruing at the annual interest rate of 5%. Continental Engineering Corp. and the Employer filed appeals in the third instance in January 2014. The court of the third instance rendered judgment revoking the judgment rendered in the second instance, on June 3, 2014, and remanded the case to Taiwan High Court, Kaohsiung Branch for another judgment. Kaohsiung Branch rendered another judgment on September 26, 2018, requiring that the Employer pay Continental Engineering Corp. NT$318,498,306, including the principal, NT$238,863,790, on which default interest shall accrue at an annual interest rate of 5% from April 6, 2005, and the principal, NT$79,634,516, on which the default interest shall accrue at the annual interest rate of 5% from the date when the judgment becomes final and irrevocable. Both parties have filed appeals in the third instance. The Supreme Court rendered its judgment on March 19, 2020. As a result, the judgment with respect to the principal, NT$85,833,083 (interest accruing thereon payable separately), out of the Company’s claimed value became final and irrevocable, while the other parts were remanded. Now, the case is pending before the Taiwan High Court, Kaohsiung Branch in the second instance again.
B. Continental Engineering Corp. signed an engineering contract with Huayi Development Co., Ltd. (hereinafter referred to as the “Huayi”) in December 2011, in order to undertake the new construction project at Yuan Di, Banqiao (Building No. 99 under the new construction project 99-Ban-Jian-Zi No. 0491). Huayi initially worked with the land owner in the Project. However, Huayi failed to make the progress payment as scheduled, and notified the suspension of work in August 2021. Then, East Asia Real Estate Management Co., Ltd. (hereinafter referred to as “East Asia Real”) replaced Huayi to continue executing the Project. In August 2014, it signed the engineering contract with Continental Engineering Corp. to continue the Project. In October 2014, East Asia Real and Continental Engineering Corp. signed a tri-party agreement with original purchasers successively, agreeing to complete the Project on May 30, 2017. Notwithstanding, East Asia Real applied for changes of the design in order to enhance the structural safety and in response to laws & regulations and thereby caused the construction period to be delayed. Then, the occupation license was granted and the inspection & acceptance and property settlement were completed too on April 28, 2019. East Asia Real confirmed with Continental Engineering Corp. that the project was completed and approved to without any delay. However, the 18 purchasers initiated an action with Taiwan Taipei District Court in January 2020, claiming that (1) the land owner and Huayi should pay the default interest, and (2) East Asia Real and Continental Engineering Corp. should pay the default interest amounting to more than NT$80 million. The purchasers claimed that East Asia Real and Continental Engineering Corp. should bear the liability of default for 697 days and, therefore, should pay the default interest equivalent to 0.0005% of the house price already paid by them, according to tri-party agreement and the “Matters to be Noted in Pre-Sale Housing Contract” promulgated by the Ministry of the Interior. For this, the Company has retained external attorneys-at-law to respond to the action on behalf of the Company proactively. The case is now pending trial by Taiwan Taipei District Court in the first instance.
194
(XIII) Other material risks and responsive measures:A. The Company resolved to formulate a “Group Risk Management Policy” on November 5, 2020. The Policy
was enacted in order to construct the Group’s risk management system and culture, risk management procedure and scope, risk management organization and responsibilities, and related execution and supervision. The 2020 risk management implementation status was reported to the Board of Directors at the end of the year.
B. In response to COVID-19, the Company established the Group’s emergency response team pursuant to the emergency management guidelines at the beginning of 2020. The team is responsible for implementing the relevant epidemic prevention measures (including inventory-checking and preparation of prevention equipment, environmental cleaning and access control, epidemic prevention leave, travel log, travel history, notification mechanism, provision of information and health guidance, and enterprise’s group insurance) and business contingency programs (online meetings, work in rotation by groups, inventory-checking of computer equipment and assurance of cyber security, and work from home drill and feedback review).There are two major goals for company to achieve. One is to protect employees physically and mentally and another one is to maintain business continuity.
VII. Other important Matters: None
195
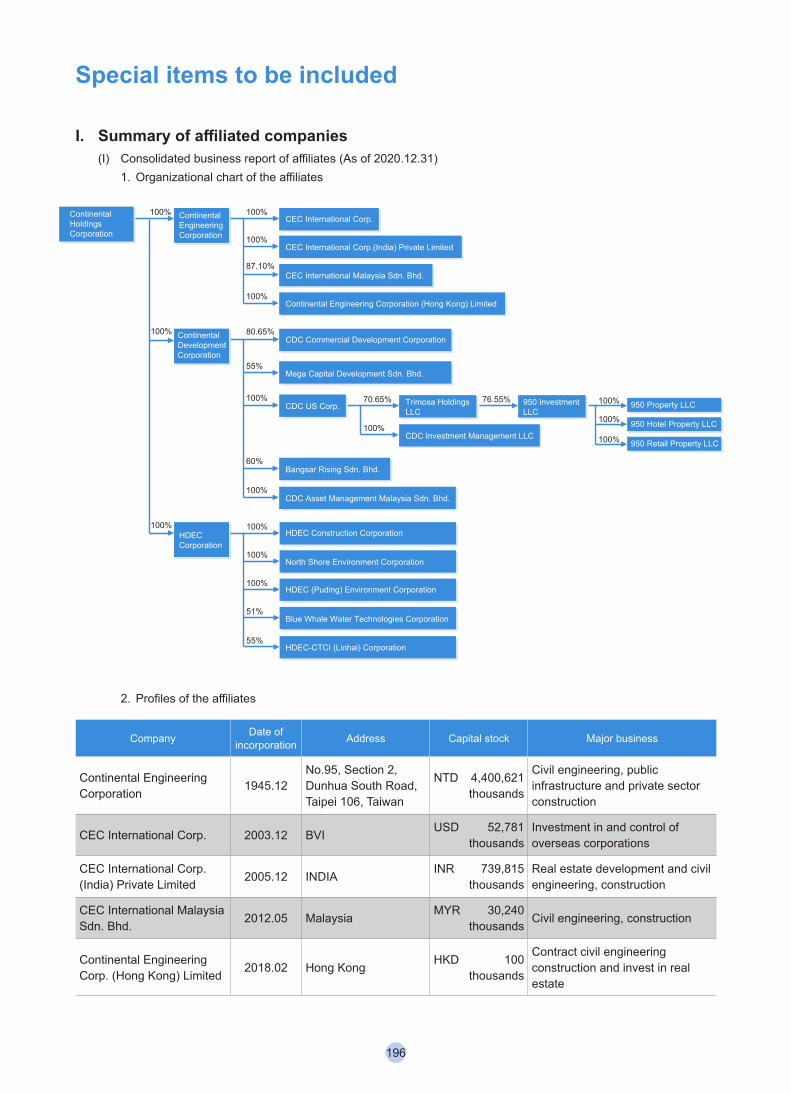
Special items to be included
I. Summary of affiliated companies (I) Consolidated business report of affiliates (As of 2020.12.31)
1. Organizational chart of the affiliates
Mega Capital Development Sdn. Bhd.
CDC US Corp.
100%
CEC International Malaysia Sdn. Bhd.
100%
100%
55%
100%
Bangsar Rising Sdn. Bhd.60%
CDC Asset Management Malaysia Sdn. Bhd.
HDEC Construction Corporation
North Shore Environment Corporation
HDEC (Puding) Environment Corporation
Blue Whale Water Technologies Corporation
100%
80.65%
CDC Investment Management LLC
Trimosa HoldingsLLC
100%
70.65% 950 InvestmentLLC
76.55% 950 Property LLC
950 Hotel Property LLC
950 Retail Property LLC
100%
100%
100%
100%
100%
100%
87.10%
100%
100%
100%
55%
51%
CEC International Corp.ContinentalHoldingsCorporation
ContinentalEngineeringCorporation
ContinentalDevelopmentCorporation
HDECCorporation
CEC International Corp.(India) Private Limited
Continental Engineering Corporation (Hong Kong) Limited
CDC Commercial Development Corporation
HDEC-CTCI (Linhai) Corporation
2. Profiles of the affiliates
Company Date of incorporation Address Capital stock Major business
Continental Engineering Corporation 1945.12
No.95, Section 2, Dunhua South Road, Taipei 106, Taiwan
NTD 4,400,621 thousands
Civil engineering, public infrastructure and private sector construction
CEC International Corp. 2003.12 BVI USD 52,781 thousands
Investment in and control of overseas corporations
CEC International Corp. (India) Private Limited 2005.12 INDIA INR 739,815
thousandsReal estate development and civil engineering, construction
CEC International Malaysia Sdn. Bhd. 2012.05 Malaysia MYR 30,240
thousands Civil engineering, construction
Continental Engineering Corp. (Hong Kong) Limited 2018.02 Hong Kong HKD 100
thousands
Contract civil engineering construction and invest in real estate
196
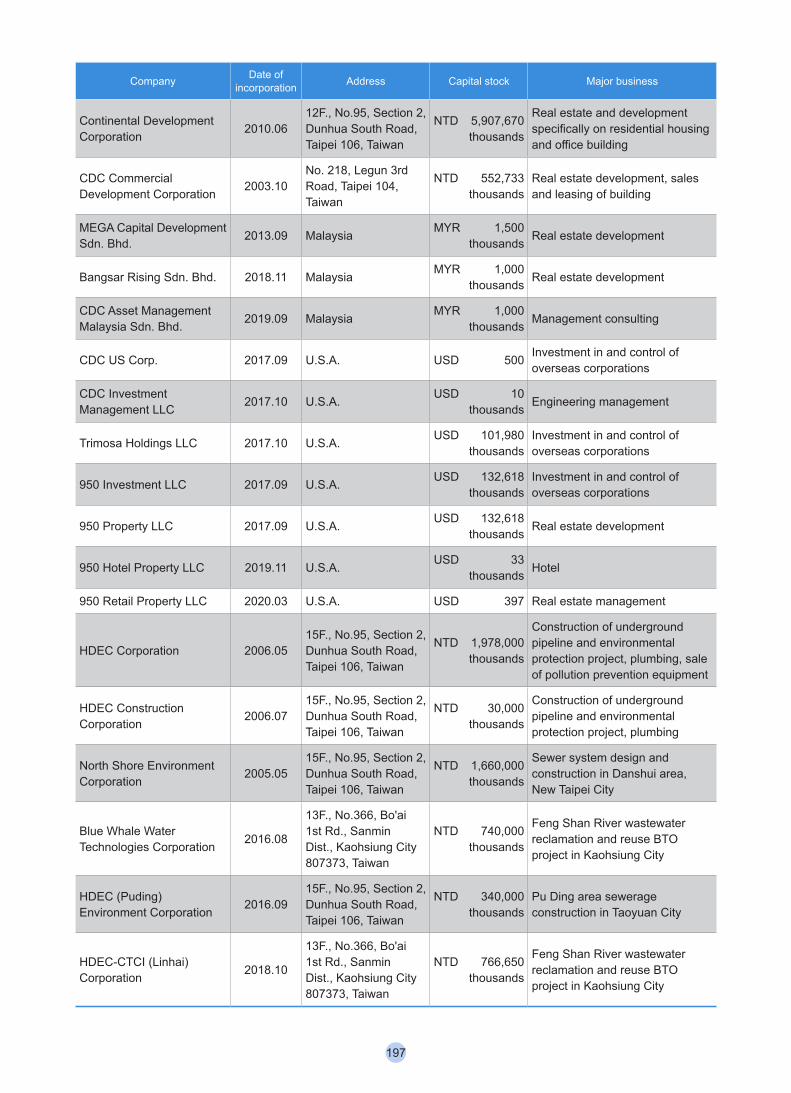
Company Date of incorporation Address Capital stock Major business
Continental Development Corporation 2010.06
12F., No.95, Section 2, Dunhua South Road, Taipei 106, Taiwan
NTD 5,907,670 thousands
Real estate and development specifically on residential housing and office building
CDC Commercial Development Corporation 2003.10
No. 218, Legun 3rd Road, Taipei 104, Taiwan
NTD 552,733 thousands
Real estate development, sales and leasing of building
MEGA Capital Development Sdn. Bhd. 2013.09 Malaysia MYR 1,500
thousands Real estate development
Bangsar Rising Sdn. Bhd. 2018.11 Malaysia MYR 1,000 thousands Real estate development
CDC Asset Management Malaysia Sdn. Bhd. 2019.09 Malaysia MYR 1,000
thousands Management consulting
CDC US Corp. 2017.09 U.S.A. USD 500 Investment in and control of overseas corporations
CDC Investment Management LLC 2017.10 U.S.A. USD 10
thousands Engineering management
Trimosa Holdings LLC 2017.10 U.S.A. USD 101,980 thousands
Investment in and control of overseas corporations
950 Investment LLC 2017.09 U.S.A. USD 132,618 thousands
Investment in and control of overseas corporations
950 Property LLC 2017.09 U.S.A. USD 132,618 thousands Real estate development
950 Hotel Property LLC 2019.11 U.S.A. USD 33 thousands Hotel
950 Retail Property LLC 2020.03 U.S.A. USD 397 Real estate management
HDEC Corporation 2006.0515F., No.95, Section 2, Dunhua South Road, Taipei 106, Taiwan
NTD 1,978,000 thousands
Construction of underground pipeline and environmental protection project, plumbing, sale of pollution prevention equipment
HDEC Construction Corporation 2006.07
15F., No.95, Section 2, Dunhua South Road, Taipei 106, Taiwan
NTD 30,000 thousands
Construction of underground pipeline and environmental protection project, plumbing
North Shore Environment Corporation 2005.05
15F., No.95, Section 2, Dunhua South Road, Taipei 106, Taiwan
NTD 1,660,000 thousands
Sewer system design and construction in Danshui area, New Taipei City
Blue Whale Water Technologies Corporation 2016.08
13F., No.366, Bo'ai 1st Rd., Sanmin Dist., Kaohsiung City 807373, Taiwan
NTD 740,000 thousands
Feng Shan River wastewater reclamation and reuse BTO project in Kaohsiung City
HDEC (Puding) Environment Corporation 2016.09
15F., No.95, Section 2, Dunhua South Road, Taipei 106, Taiwan
NTD 340,000 thousands
Pu Ding area sewerage construction in Taoyuan City
HDEC-CTCI (Linhai) Corporation 2018.10
13F., No.366, Bo'ai 1st Rd., Sanmin Dist., Kaohsiung City 807373, Taiwan
NTD 766,650 thousands
Feng Shan River wastewater reclamation and reuse BTO project in Kaohsiung City
197
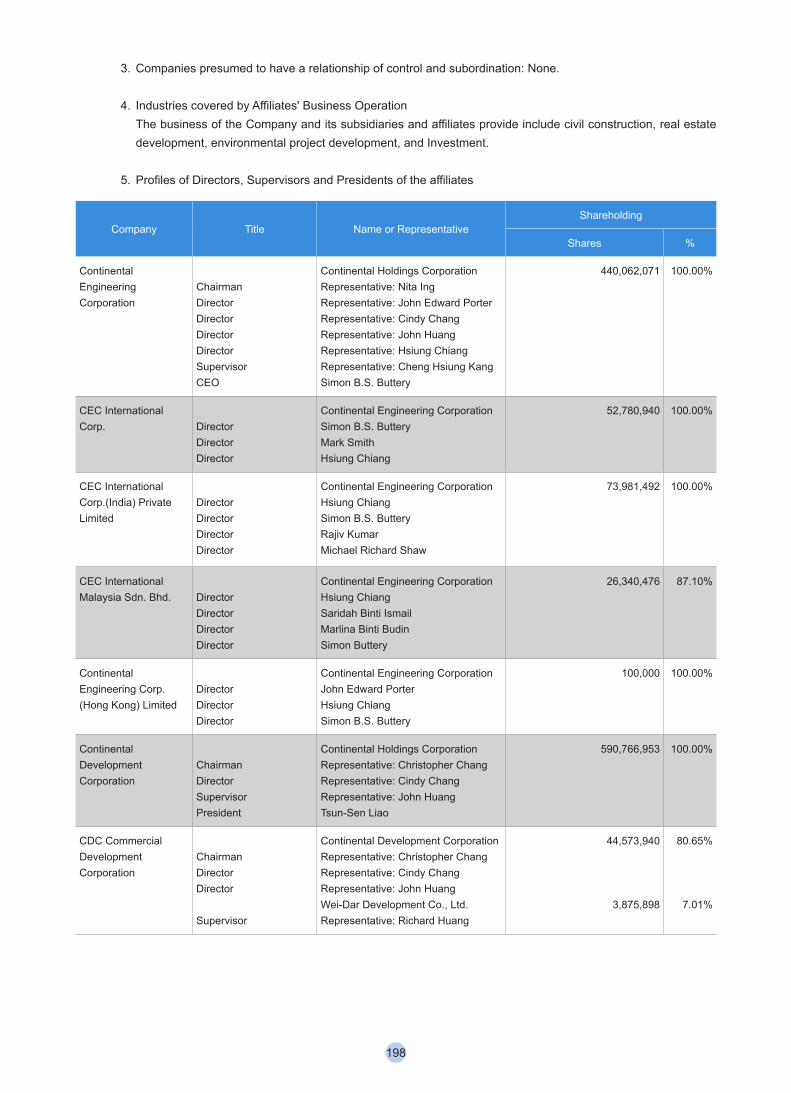
3. Companies presumed to have a relationship of control and subordination: None.
4. Industries covered by Affiliates' Business OperationThe business of the Company and its subsidiaries and affiliates provide include civil construction, real estate development, environmental project development, and Investment.
5. Profiles of Directors, Supervisors and Presidents of the affiliates
Company Title Name or RepresentativeShareholding
Shares %
Continental Engineering Corporation
ChairmanDirectorDirectorDirectorDirectorSupervisorCEO
Continental Holdings CorporationRepresentative: Nita IngRepresentative: John Edward PorterRepresentative: Cindy ChangRepresentative: John HuangRepresentative: Hsiung ChiangRepresentative: Cheng Hsiung KangSimon B.S. Buttery
440,062,071 100.00%
CEC International Corp. Director
DirectorDirector
Continental Engineering CorporationSimon B.S. ButteryMark SmithHsiung Chiang
52,780,940 100.00%
CEC International Corp.(India) Private Limited
DirectorDirectorDirectorDirector
Continental Engineering CorporationHsiung ChiangSimon B.S. ButteryRajiv KumarMichael Richard Shaw
73,981,492 100.00%
CEC International Malaysia Sdn. Bhd. Director
DirectorDirectorDirector
Continental Engineering CorporationHsiung ChiangSaridah Binti IsmailMarlina Binti BudinSimon Buttery
26,340,476 87.10%
Continental Engineering Corp.(Hong Kong) Limited
DirectorDirectorDirector
Continental Engineering CorporationJohn Edward PorterHsiung ChiangSimon B.S. Buttery
100,000 100.00%
Continental Development Corporation
ChairmanDirectorSupervisorPresident
Continental Holdings CorporationRepresentative: Christopher ChangRepresentative: Cindy ChangRepresentative: John HuangTsun-Sen Liao
590,766,953 100.00%
CDC Commercial Development Corporation
ChairmanDirectorDirector
Supervisor
Continental Development CorporationRepresentative: Christopher ChangRepresentative: Cindy ChangRepresentative: John HuangWei-Dar Development Co., Ltd.Representative: Richard Huang
44,573,940
3,875,898
80.65%
7.01%
198
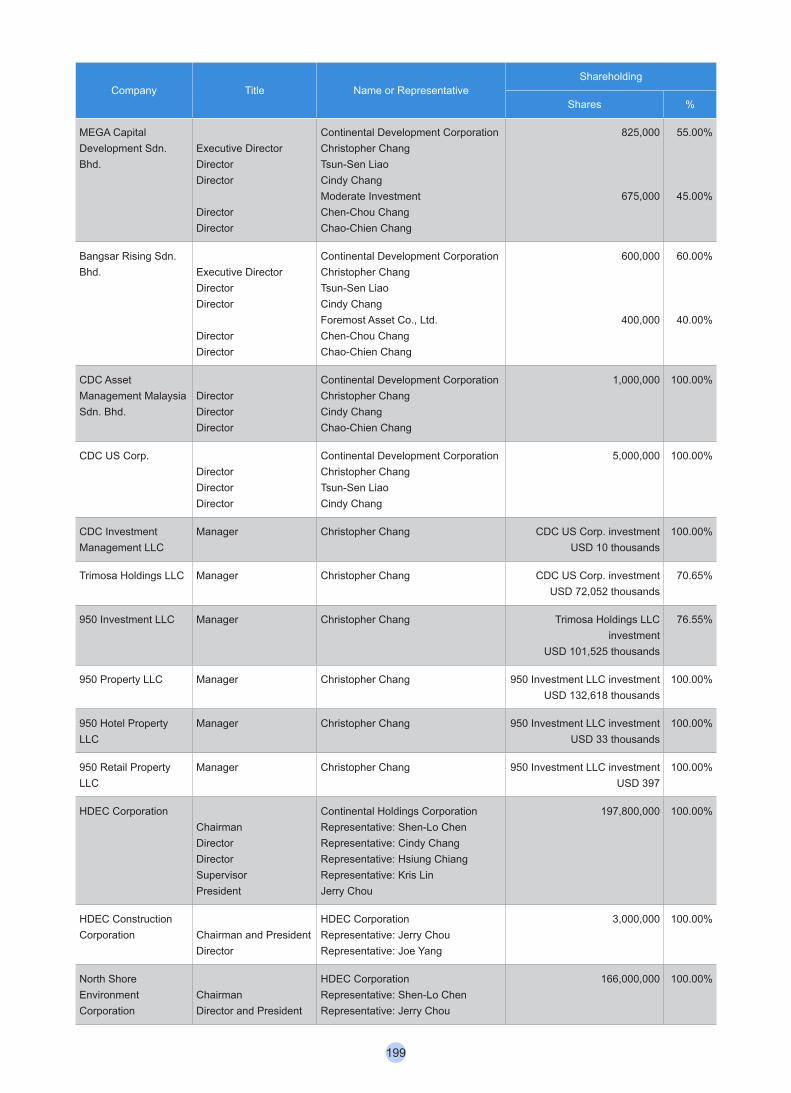
Company Title Name or RepresentativeShareholding
Shares %
MEGA Capital Development Sdn. Bhd.
Executive DirectorDirectorDirector
DirectorDirector
Continental Development CorporationChristopher ChangTsun-Sen LiaoCindy ChangModerate InvestmentChen-Chou ChangChao-Chien Chang
825,000
675,000
55.00%
45.00%
Bangsar Rising Sdn. Bhd. Executive Director
DirectorDirector
DirectorDirector
Continental Development CorporationChristopher ChangTsun-Sen LiaoCindy ChangForemost Asset Co., Ltd.Chen-Chou ChangChao-Chien Chang
600,000
400,000
60.00%
40.00%
CDC Asset Management Malaysia Sdn. Bhd.
DirectorDirectorDirector
Continental Development CorporationChristopher ChangCindy ChangChao-Chien Chang
1,000,000 100.00%
CDC US Corp.DirectorDirectorDirector
Continental Development CorporationChristopher ChangTsun-Sen LiaoCindy Chang
5,000,000 100.00%
CDC Investment Management LLC
Manager Christopher Chang CDC US Corp. investmentUSD 10 thousands
100.00%
Trimosa Holdings LLC Manager Christopher Chang CDC US Corp. investmentUSD 72,052 thousands
70.65%
950 Investment LLC Manager Christopher Chang Trimosa Holdings LLC investment
USD 101,525 thousands
76.55%
950 Property LLC Manager Christopher Chang 950 Investment LLC investmentUSD 132,618 thousands
100.00%
950 Hotel Property LLC
Manager Christopher Chang 950 Investment LLC investmentUSD 33 thousands
100.00%
950 Retail Property LLC
Manager Christopher Chang 950 Investment LLC investment USD 397
100.00%
HDEC CorporationChairmanDirectorDirectorSupervisorPresident
Continental Holdings CorporationRepresentative: Shen-Lo ChenRepresentative: Cindy ChangRepresentative: Hsiung ChiangRepresentative: Kris LinJerry Chou
197,800,000 100.00%
HDEC Construction Corporation Chairman and President
Director
HDEC CorporationRepresentative: Jerry ChouRepresentative: Joe Yang
3,000,000 100.00%
North Shore Environment Corporation
ChairmanDirector and President
HDEC CorporationRepresentative: Shen-Lo ChenRepresentative: Jerry Chou
166,000,000 100.00%
199
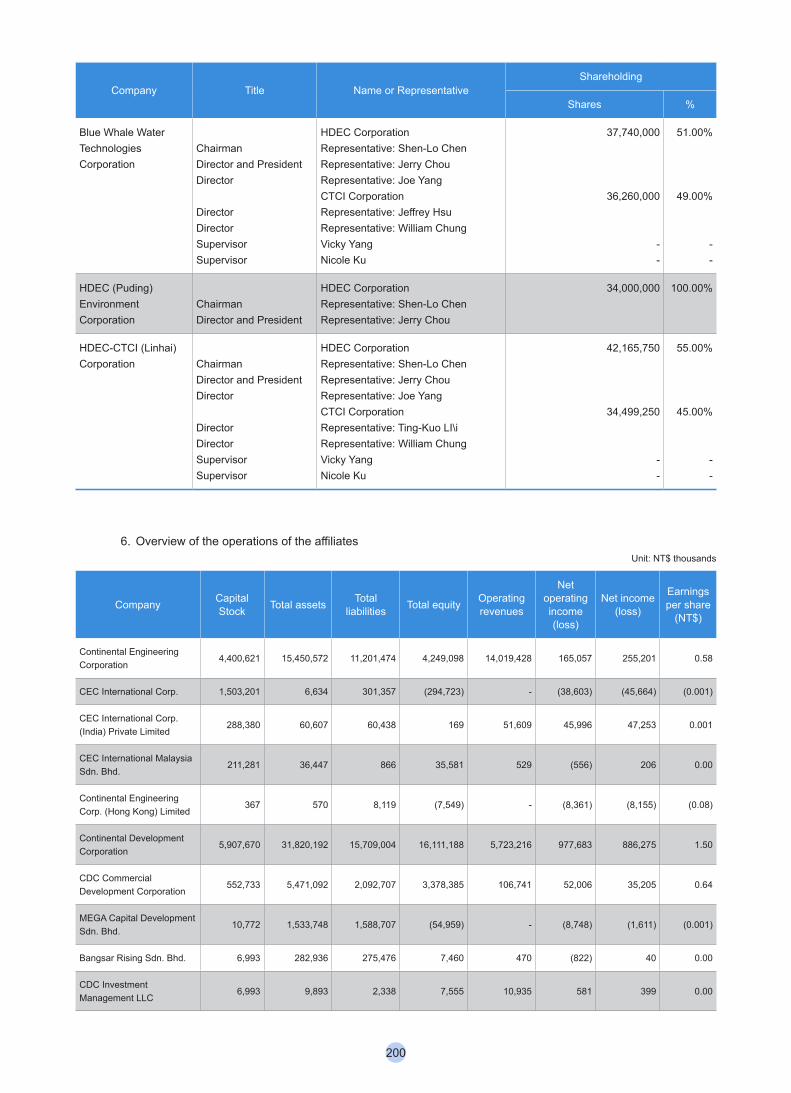
Company Title Name or RepresentativeShareholding
Shares %
Blue Whale Water Technologies Corporation
ChairmanDirector and PresidentDirector
DirectorDirectorSupervisorSupervisor
HDEC CorporationRepresentative: Shen-Lo ChenRepresentative: Jerry ChouRepresentative: Joe YangCTCI CorporationRepresentative: Jeffrey HsuRepresentative: William ChungVicky YangNicole Ku
37,740,000
36,260,000
--
51.00%
49.00%
--
HDEC (Puding) Environment Corporation
ChairmanDirector and President
HDEC CorporationRepresentative: Shen-Lo ChenRepresentative: Jerry Chou
34,000,000 100.00%
HDEC-CTCI (Linhai) Corporation Chairman
Director and PresidentDirector
DirectorDirectorSupervisorSupervisor
HDEC CorporationRepresentative: Shen-Lo ChenRepresentative: Jerry ChouRepresentative: Joe YangCTCI CorporationRepresentative: Ting-Kuo LI\iRepresentative: William ChungVicky YangNicole Ku
42,165,750
34,499,250
--
55.00%
45.00%
--
6. Overview of the operations of the affiliatesUnit: NT$ thousands
Company Capital Stock Total assets Total
liabilities Total equity Operating revenues
Net operating income (loss)
Net income (loss)
Earnings per share
(NT$)
Continental Engineering Corporation
4,400,621 15,450,572 11,201,474 4,249,098 14,019,428 165,057 255,201 0.58
CEC International Corp. 1,503,201 6,634 301,357 (294,723) - (38,603) (45,664) (0.001)
CEC International Corp. (India) Private Limited
288,380 60,607 60,438 169 51,609 45,996 47,253 0.001
CEC International Malaysia Sdn. Bhd.
211,281 36,447 866 35,581 529 (556) 206 0.00
Continental Engineering Corp. (Hong Kong) Limited
367 570 8,119 (7,549) - (8,361) (8,155) (0.08)
Continental Development Corporation
5,907,670 31,820,192 15,709,004 16,111,188 5,723,216 977,683 886,275 1.50
CDC Commercial Development Corporation
552,733 5,471,092 2,092,707 3,378,385 106,741 52,006 35,205 0.64
MEGA Capital Development Sdn. Bhd.
10,772 1,533,748 1,588,707 (54,959) - (8,748) (1,611) (0.001)
Bangsar Rising Sdn. Bhd. 6,993 282,936 275,476 7,460 470 (822) 40 0.00
CDC Investment Management LLC
6,993 9,893 2,338 7,555 10,935 581 399 0.00
200
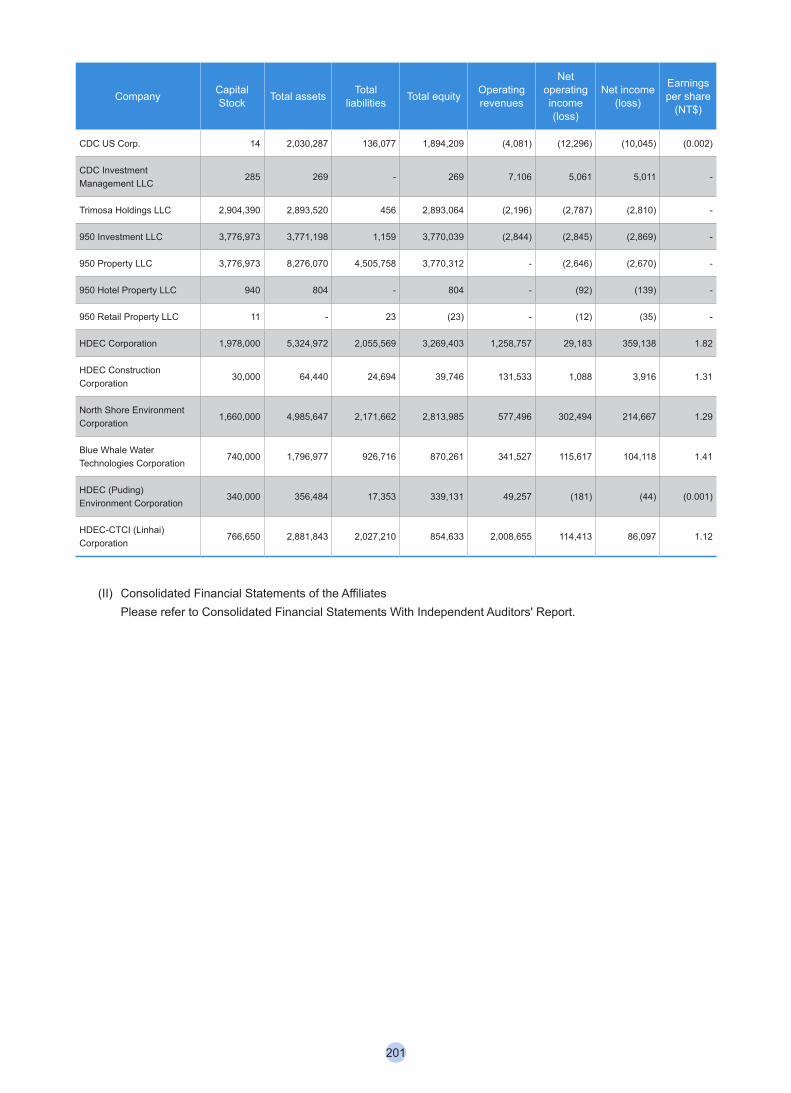
Company Capital Stock Total assets Total
liabilities Total equity Operating revenues
Net operating income (loss)
Net income (loss)
Earnings per share
(NT$)
CDC US Corp. 14 2,030,287 136,077 1,894,209 (4,081) (12,296) (10,045) (0.002)
CDC Investment Management LLC
285 269 - 269 7,106 5,061 5,011 -
Trimosa Holdings LLC 2,904,390 2,893,520 456 2,893,064 (2,196) (2,787) (2,810) -
950 Investment LLC 3,776,973 3,771,198 1,159 3,770,039 (2,844) (2,845) (2,869) -
950 Property LLC 3,776,973 8,276,070 4,505,758 3,770,312 - (2,646) (2,670) -
950 Hotel Property LLC 940 804 - 804 - (92) (139) -
950 Retail Property LLC 11 - 23 (23) - (12) (35) -
HDEC Corporation 1,978,000 5,324,972 2,055,569 3,269,403 1,258,757 29,183 359,138 1.82
HDEC Construction Corporation
30,000 64,440 24,694 39,746 131,533 1,088 3,916 1.31
North Shore Environment Corporation
1,660,000 4,985,647 2,171,662 2,813,985 577,496 302,494 214,667 1.29
Blue Whale Water Technologies Corporation
740,000 1,796,977 926,716 870,261 341,527 115,617 104,118 1.41
HDEC (Puding) Environment Corporation
340,000 356,484 17,353 339,131 49,257 (181) (44) (0.001)
HDEC-CTCI (Linhai) Corporation
766,650 2,881,843 2,027,210 854,633 2,008,655 114,413 86,097 1.12
(II) Consolidated Financial Statements of the Affiliates Please refer to Consolidated Financial Statements With Independent Auditors' Report.
201
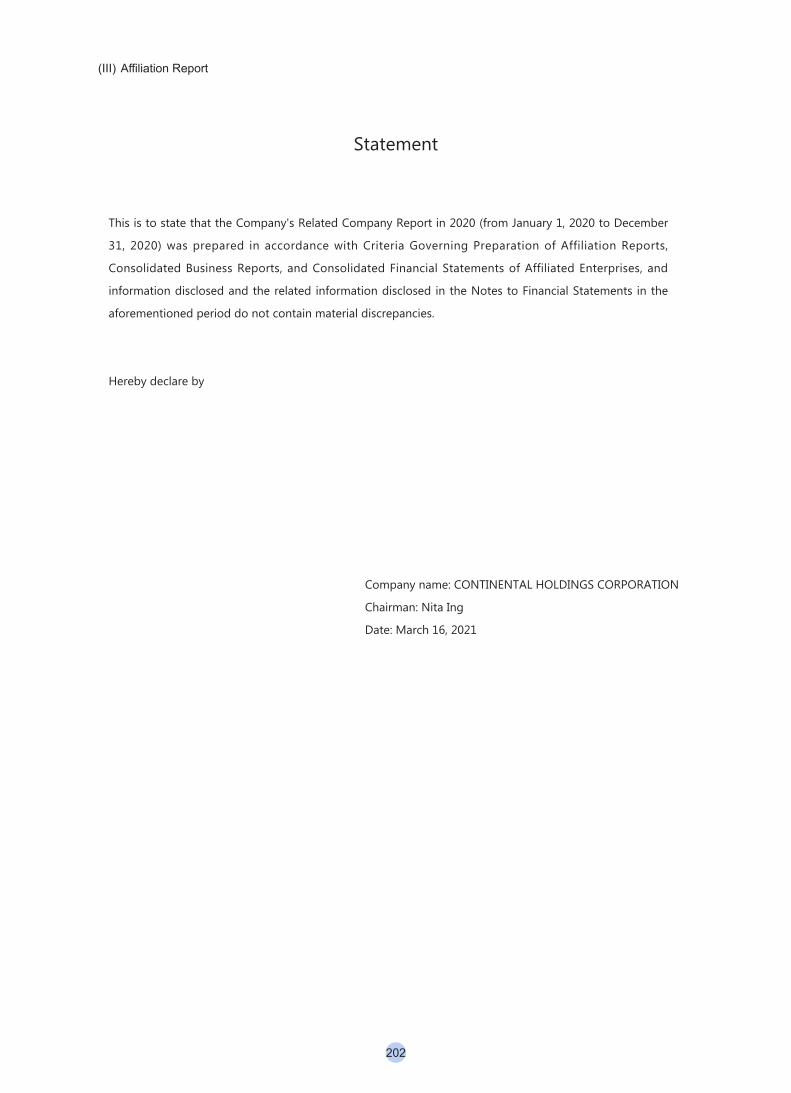
(III) Affiliation Report
Statement
This is to state that the Company's Related Company Report in 2020 (from January 1, 2020 to December
31, 2020) was prepared in accordance with Criteria Governing Preparation of Affiliation Reports,
Consolidated Business Reports, and Consolidated Financial Statements of Affiliated Enterprises, and
information disclosed and the related information disclosed in the Notes to Financial Statements in the
aforementioned period do not contain material discrepancies.
Hereby declare by
Company name: CONTINENTAL HOLDINGS CORPORATION
Chairman: Nita Ing
Date: March 16, 2021
202
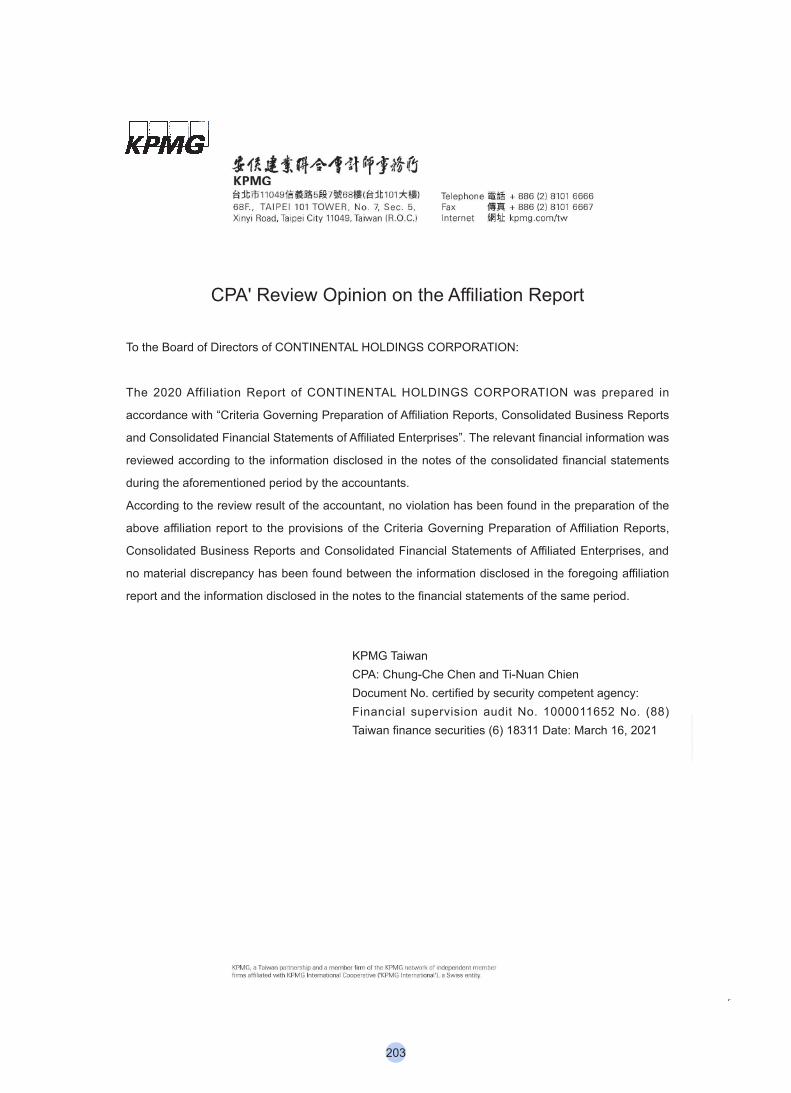
CPA' Review Opinion on the Affiliation Report
To the Board of Directors of CONTINENTAL HOLDINGS CORPORATION:
The 2020 Affiliation Report of CONTINENTAL HOLDINGS CORPORATION was prepared in
accordance with “Criteria Governing Preparation of Affiliation Reports, Consolidated Business Reports
and Consolidated Financial Statements of Affiliated Enterprises”. The relevant financial information was
reviewed according to the information disclosed in the notes of the consolidated financial statements
during the aforementioned period by the accountants.
According to the review result of the accountant, no violation has been found in the preparation of the
above affiliation report to the provisions of the Criteria Governing Preparation of Affiliation Reports,
Consolidated Business Reports and Consolidated Financial Statements of Affiliated Enterprises, and
no material discrepancy has been found between the information disclosed in the foregoing affiliation
report and the information disclosed in the notes to the financial statements of the same period.
KPMG TaiwanCPA: Chung-Che Chen and Ti-Nuan ChienDocument No. certified by security competent agency:Financial supervision audit No. 1000011652 No. (88) Taiwan finance securities (6) 18311 Date: March 16, 2021
203
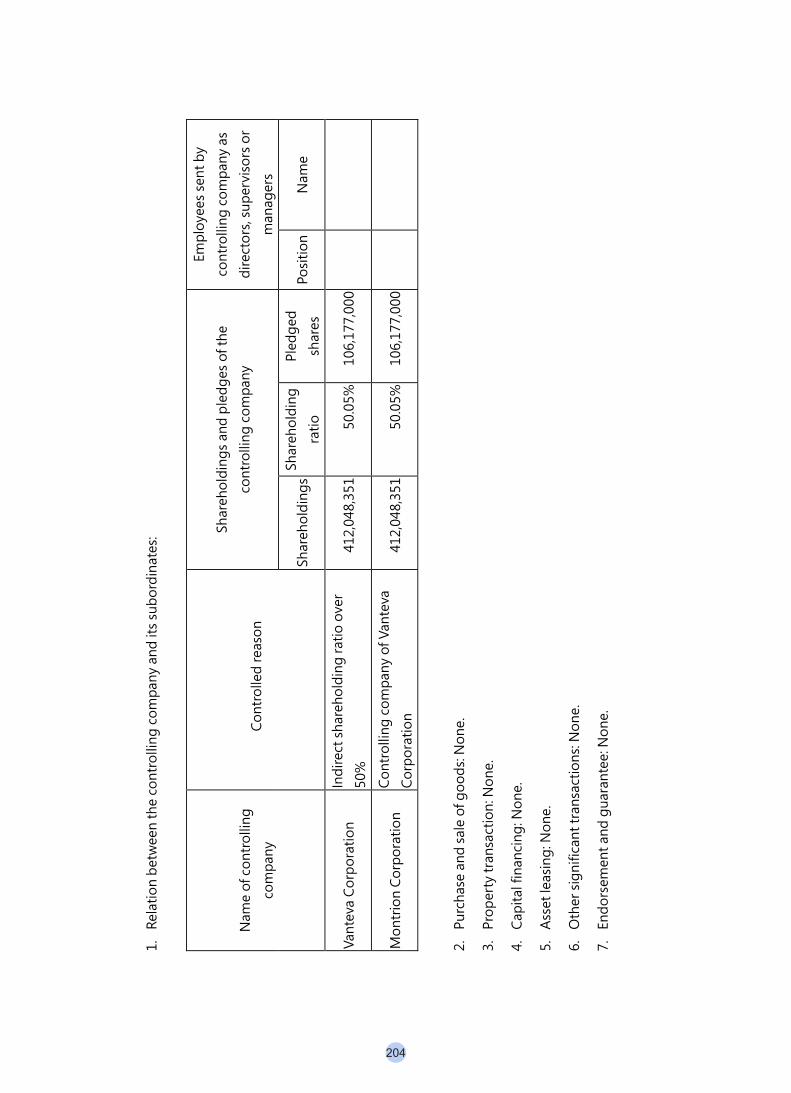
1.
Rela
tion
bet
wee
n th
e co
ntro
lling
co
mpa
ny a
nd it
s su
bo
rdin
ates
:
Nam
e of
co
ntro
lling
com
pany
C
ont
rolle
d re
aso
n
Shar
eho
ldin
gs
and
ple
dg
es o
f the
cont
rolli
ng c
om
pany
Emp
loye
es s
ent b
y
cont
rolli
ng c
om
pany
as
dire
cto
rs, s
uper
viso
rs o
r
man
ager
s
Shar
eho
ldin
gs
Shar
eho
ldin
g
ratio
Pled
ged
shar
es
Posi
tion
Nam
e
Vant
eva
Co
rpo
ratio
n In
dire
ct s
hare
hold
ing
ratio
ove
r
50%
41
2,04
8,35
1 50
.05%
106,
177,
000
Mo
ntri
on
Co
rpo
ratio
n C
ont
rolli
ng c
om
pany
of V
ante
va
Co
rpo
ratio
n 41
2,04
8,35
1 50
.05%
106,
177,
000
2.
Purc
hase
and
sal
e of
go
od
s: N
one
.
3.
Pro
per
ty tr
ansa
ctio
n: N
one
.
4.
Cap
ital f
inan
cing
: No
ne.
5.
Ass
et le
asin
g: N
one
.
6.
Oth
er s
igni
fican
t tra
nsac
tions
: No
ne.
7.
End
ors
emen
t and
gua
rant
ee: N
one
.
204
II. Private Placement Securities in 2020 and as of the Date of this Annual Report: None.
III. Information on Shares Held or Sold by Subsidiaries in 2020 and the Date of this Annual Report: None
IV. the Necessary Supplement: None
Any Events in 2020 and as of the Date of this Annual Report that Had Material Impacts on Shareholders’ Interests or Securities Prices as Stated in Item 3 Paragraph 2 of Article 36 of Securities and Exchange Law of Taiwan: None
CONTINENTAL HOLDINGS CORPORATION
Chairman: Nita Ing
205

Continental Holdings23F, No. 95 Dun Hua S. Road, Sec. 2 Taipei 106, TaiwanTel: 886-2-3701-2000 Ext 6572Fax:886-2-3701-2999www.continental-holdings.com