Contents - datawand.info€¦ · Web viewCertain ethnic populations have been shown to have a...
97
Wandsworth PCT Department of Public Health Diabetes Health Needs Assessment 2010 Diabetes Health Needs Assessment 2010 NHS Wandsworth Department of Public Health Anupam Garrib and Melissa Cottington Page 1 of 97
Transcript of Contents - datawand.info€¦ · Web viewCertain ethnic populations have been shown to have a...

Wandsworth PCT Department of Public Health
Diabetes Health Needs Assessment 2010
Diabetes Health Needs Assessment 2010NHS Wandsworth
Department of Public HealthAnupam Garrib and Melissa Cottington
Page 1 of 77

Wandsworth PCT Department of Public Health
Diabetes Health Needs Assessment 2010
Contributors to this report:Nigel BainNeil BamfordGary BradleyLucy ChadderMelissa CottingtonNigel CrawfordVanessa FlaggJosephine Ruwende
Page 2 of 77

Wandsworth PCT Department of Public Health
Diabetes Health Needs Assessment 2010
Contents1. Executive summary 72. Introduction and background 8
2.1 Aim of a health needs assessment 82.2 Approach to health needs assessment 82.3 What is diabetes? 82.4 Diabetes incidence and prevalence in England 102.5 UK policies on diabetes 102.6 Risk factors for developing diabetes 12
3. Understanding our population 133.1 Prevalence of non-modifiable risk factors for diabetes in Wandsworth 13
3.1.1 Age 133.1.2 Ethnicity 14
3.2 Prevalence of modifiable risk factors for diabetes in Wandsworth 153.2.1 Deprivation 153.2.2 Obesity 153.2.3 Gestational diabetes 163.2.4 Impaired glucose tolerance 16
3.3 Expected prevalence of diabetes in Wandsworth 173.4 Actual prevalence of types 1 and 2 diabetes mellitus in Wandsworth 193.5 Comparison of expected and recorded prevalence of diabetes 213.6 Diabetes in children and young people 22
3.6.1 Type 1 diabetes 223.6.2 Type 2 diabetes 23
3.7 Diabetes prevention 233.8 Complications of diabetes 24
4. Provision of Service and Care 254.1 Description of service delivery in Wandsworth 254.1.1 Primary care 254.1.2 Community diabetes specialist nursing service 254.1.3 Secondary care 264.2 Monitoring of diabetic control 264.3 Lower limb amputation 284.4 Renal disease 304.5 Cardiovascular disease 324.6 Diabetic retinopathy 354.7 Diabetic ketoacidosis and coma 374.8 Deaths from diabetes 38
Page 3 of 77

Wandsworth PCT Department of Public Health
Diabetes Health Needs Assessment 2010
4.9 Hospital admissions 404.10 Prescriptions for people with diabetes 414.11 Programme budgeting 444.12 Stakeholder analysis 464.13 Diabetes E 48
5. Discussion and recommendations 496. Appendix 1: Details of trends in drug prescriptions and costs 507. Appendix 2: Detailed DiabetesE results 528. Appendix 3: Diabetic Retinal Screening equity audit for NHS Wandsworth 60
Page 4 of 77

Wandsworth PCT Department of Public Health
Diabetes Health Needs Assessment 2010
Table of FiguresFigure 1: Age breakdown for Wandsworth population showing % in each age group for males and females............................................................................................................................14Figure 2: Map of percentage of Asian or Asian British in Wandsworth wards........................15Figure 3: Map of percentage of Black or Black British in Wandsworth Wards........................15Figure 4: Map showing deprivation in Wandsworth PCT........................................................16Figure 5: Estimated growth in diabetes prevalence in Wandsworth, 2010-2025....................19Figure 6: Estimated prevalence of Type 1 and 2 diabetes by ethnic group, 2005..................20Figure 7: Diabetes prevalence by practice and ratio of actual to expected numbers of diabetic patients...................................................................................................................................21Figure 8: Diabetes prevalence by ward based on QOF data for 2008/09..............................21Figure 9: The percentage of patients with diabetes in whom the last HbA1c is 7.5% or less in the previous 15 months, QOF 2008/9.....................................................................................27Figure 10: The percentage of patients with diabetes in whom the last HbA1c is 10% or less in the previous 15 months, QOF 2008/9.....................................................................................28Figure 11: Lower limb amputation in people with diabetes.....................................................29Figure 12: The percentage of patients with diabetes with a record of the presence or absence of peripheral pulses in the previous 15 months, QOF 2008/9................................................30Figure 13: The percentage of patients with diabetes with a record of neuropathy testing in the previous 15 months, QOF 2008/9...........................................................................................30Figure 14: The percentage of patients with diabetes who have a record of micro-albuminuria testing in the previous 15 months, QOF 2008/9.....................................................................32Figure 15: The percentage of patients with diabetes who have a record of estimated glomerular filtration rate (eGFR) or serum creatinine testing in the previous 15 months, QOF 2008/9.....................................................................................................................................32Figure 16: Proportion of diabetic patients with a last blood pressure reading of 145/85 or less by GP practice, QOF 2008/09.................................................................................................34Figure 17: The percentage of patients with diabetes who have a record of total cholesterol in the previous 15 months, QOF 2008/09...................................................................................34Figure 18: The percentage of patients with diabetes whose last measured total cholesterol within previous 15 months is 5 mmol/l or less, QOF 2008/09.................................................35Figure 19: The percentage of patients with diabetes whose notes record BMI in the previous 15 months, QOF 2008/09.......................................................................................................36Figure 20: The percentage of patients who have a record of retinal screening in the previous 15 months, QOF 2008/09.......................................................................................................37Figure 21: Admission rates for DKA and coma.......................................................................39Figure 22: Trends in diabetes mortality in Wandsworth, MFP All Ages, 1993-2007...............40Figure 23: Mortality from Diabetes, Persons, <75, 2005-2007...............................................41Figure 24: Directly age standardised emergency hospital admission rates for Diabetes, 2006/7.....................................................................................................................................41Figure 25: Total costs and number of items prescribed for diabetes in primary care.............43Figure 26: Number of prescriptions and total costs of oral anti-diabetic drugs.......................44Figure 27: Mean spend on diabetes drugs in Wandsworth PCT per person..........................44Figure 28: Spend per person on diabetes register by practice versus average spend for all practices..................................................................................................................................45Figure 29: Programme budgeting data relating to endocrine dysfunction, Wandsworth 2007/8................................................................................................................................................46Figure 30: Time trends............................................................................................................60Figure 31: Target percentages time trend..............................................................................60
Page 5 of 77

Wandsworth PCT Department of Public Health
Diabetes Health Needs Assessment 2010
Table of TablesTable 1: National Service Framework Standards for Diabetes...............................................11Table 2: Estimated numbers of obese or overweight population in Wandsworth aged 16 or over, 2010...............................................................................................................................17Table 3: Estimated prevalence of diabetes 2005....................................................................19Table 4: Estimated number of people with type 1 and type 2 diabetes in Wandsworth by age group in 2010..........................................................................................................................23Table 5: Summary of numbers of people in Wandsworth with modifiable risk factors for developing diabetes................................................................................................................23Table 6: Caseload of paediatric diabetic patients, 2002-2009................................................24Table 7: Blind registrations in England, London and South West London boroughs, 2006-2008........................................................................................................................................37Table 8: Diabetes Standardised Mortality Ratios, <75, 2005-2007, MFP...............................40Table 9: Average LoS, total number of bed days, total number of admissions for Diabetes, 2006/7.....................................................................................................................................42Table 10: Expenditure and outcomes in the endocrine category............................................47Table 11: Diabetes E Results Dashboard for PCT.................................................................49Table 12: Number of prescriptions and costs for top ten insulin types used in Wandsworth. 51Table 13: Number of prescriptions and costs for top ten oral antidiabetic drugs used in Wandsworth in primary care...................................................................................................52Table 14: Early identification categories.................................................................................53Table 15: Psychological support categories...........................................................................53Table 16: Education Categories.............................................................................................54Table 17: Care for Children Categories..................................................................................54Table 18: Telephone Support Categories...............................................................................55Table 19: Agreed Shared Care Plan Categories....................................................................55Table 20: Healthy eating and physical activity categories......................................................56Table 21: Policies and systems for appropriate options for diabetes management...............56Table 22: Provision of care in different settings......................................................................57Table 23: Support for pregnancy and conception...................................................................57Table 24: Commissioning diabetes services..........................................................................58Table 25: Involving people with diabetes................................................................................58Table 26: Key annual processes for diabetes care.................................................................59Table 27: All care processes recorded (%) by PCTs in the SHA............................................59
Page 6 of 77

Wandsworth PCT Department of Public Health
Diabetes Health Needs Assessment 2010
1. Executive summaryDiabetes is a significant cause of morbidity and premature mortality. In Wandsworth we conservatively estimate that there are just over 11,000 people known to have diabetes at present. A 15% increase in diabetes prevalence is expected over the next 15 years. This will be fuelled by an ageing population and a growing obesity epidemic as well as increasing numbers of paediatric diabetics. This will contribute significantly to the burden diabetes presents on population health, on the health system, and to health inequalities in the borough.
The age and ethnicity profile of the Wandsworth population show that we have concentrations of people at high risk of developing diabetes resident in the borough, in particular in Wandsworth South and in Battersea (Figures 2 & 3). This corresponds closely with estimates that show high prevalence of diabetes in those areas as well as in wards in West Wandsworth (Figure 8). Diabetes should therefore be a health priority in these areas based on its prevalence and its contribution to the burden of disease.
The 23% difference between the expected prevalence of 3.69% based on the PBS diabetes model and the 3% prevalence from our Quality and Outcomes Framework (QOF) data, indicate that there are a number of undiagnosed diabetics in Wandsworth. In addition, we estimate that there are at least 28,000 people in Wandsworth with potentially modifiable risk factors for developing diabetes in the future. These include patients that are overweight or obese, patients with gestational diabetes and those with impaired glucose tolerance. The newly implemented NHS health checks programme provides an opportunity for both early identification of undiagnosed diabetics and those with modifiable risk factors. A PCT strategy to address obesity also exists however there is a lack of an integrated diabetes prevention strategy to ensure that a comprehensive approach to the prevention of diabetes exists within NHS Wandsworth and is focussed on areas of high prevalence and groups at high risk of developing diabetes. This is a key gap and needs to be addressed.
Over the last five years considerable work has gone into improving primary and secondary care diabetes services in line with the National Service Framework (NSF) for diabetes. Progress against the NSF in Wandsworth has been good and Wandsworth is host to some innovative work in terms of diabetes care. There has been success in the retinal screening programme and the needs assessment shows that there have been no increases in blind registrations in Wandsworth. In order to build on this success however it is important to address the findings of a recent equity audit that:
- uptake of retinal screening is particularly low amongst type 1 diabetics and younger patients,- there is variation in screening uptake by primary care provider which is particularly important
as primary care providers have been shown to have a positive impact on influencing uptake of screening,
- ethnicity data are not adequately recorded so it is not possible to assess the impact of language or other barriers on screening uptake. Certain ethnic populations have been shown to have a higher prevalence of diabetic retinopathy.
An important finding of this needs assessment is that variation in the care provided to diabetics in primary care continues to exist. Our analysis of QOF data shows that while many practices are performing well on indicators of care provided to diabetic patients, some practices perform consistently poorly. Although Wandsworth has low diabetes related mortality we do not perform as well in the incidence of diabetes related complications. In Wandsworth 58.7% of diabetic patients
Page 7 of 77

Wandsworth PCT Department of Public Health
Diabetes Health Needs Assessment 2010
have good diabetes control (an HbA1c level of <7.5%) compared to the England average of 66.3%. We also find that Wandsworth has higher incidence rates of some types of diabetes related complications including minor and major lower limb amputations, and emergency admissions for diabetic ketoacidosis (Table 8). QOF data show that in Wandsworth we have lower proportions of patients being checked for indicators of these complications than the England average. Further work with commissioners needs to occur to understand the reasons for this variation and to address these as this is likely to have a direct impact on patient outcomes.
Although most diabetes related care occurs in the community, hospitals provide essential management of paediatric diabetics, complex cases and diabetes related emergencies and complications. We find that Wandsworth patients have relatively low emergency hospital admission rates compared to other PCTs in the sector and to London and England levels, however patients that are admitted stay in hospital significantly longer than in other PCTs or the London and England average. This highlights a potential area for clinical audit to further understand the reasons for this difference.
The costs of treating diabetes is increasing year on year and a recent analysis has shown that despite the high levels of expenditure, outcomes for diabetics in Wandsworth are not as good as those of our peers. Some of this will be related to the issues discussed above. Major changes in the way care is to be provided to diabetics in Wandsworth are underway, including a shift of care from secondary into primary care services. This provides an opportunity to improve quality of care by creating a more seamless patient pathway and by maximise links with other prevention programmes, however the variations in care discussed above need to be addressed and the impact of the shift of care needs to be prospectively evaluated to assess its effect on patient outcomes.
Although significant improvement has been made in the care of diabetics in Wandsworth, the challenge of managing increasing numbers of patients within a resource constrained environment remains. The core of the approach to addressing this problem should be prevention and at present there is no overall strategy for the prevention of diabetes in Wandsworth.
Page 8 of 77

Wandsworth PCT Department of Public Health
Diabetes Health Needs Assessment 2010
2. Introduction and background2.1 Aim of a health needs assessmentHealth needs assessment is a systematic method for reviewing the health issues facing a population, leading to agreed priorities and resource allocation that will improve health and reduce inequalities. Comprehensive health and social needs assessment is an essential starting point for the development of any intervention strategy, service development or health improvement programme.1
Health needs assessment provides a tool that can help meet policy objectives through targeting populations most in need of support. Health needs assessment also provides an opportunity for different agencies to work in partnership to reconfigure services.2
2.2 Approach to health needs assessmentThe health needs assessment combines epidemiological, corporate and comparative approaches in assessing need. The epidemiological approach to health needs assessment provides an understanding of the make-up of the population in question, risk factors for disease they are likely to encounter, examination of the incidence of disease within a community and how these factors relate to the demand on services. The corporate approach in health needs assessment looks at the perceived major health and healthcare issues from the perspective of professionals and stakeholders. The comparative approach to the needs assessment benchmarks services in question against those for a different provider.
For the health needs assessment of diabetes in Wandsworth epidemiological data were collated from a range of national and local sources. Comparative analysis was undertaken using available national and local data, latest evidence and targets. Semi-structured interviews were undertaken with a range of stakeholders to obtain corporate views.
2.3 What is diabetes?Diabetes is a chronic condition that occurs when the pancreas does not produce enough insulin or when the body cannot effectively use the insulin it produces. Hyperglycaemia and other related disturbances in the body’s metabolism can lead to serious damage to many of the body’s systems, especially the nerves and blood vessels.3
Diabetes is the leading cause of blindness in people of working age, the largest single cause of end stage renal failure, and, excluding accidents, the biggest cause of lower limb amputation. Compared with other European countries, Britain has a poor record of blood glucose control and blood pressure control: we have higher rates of heart attacks and strokes, foot ulcers, renal failure and nerve damage.4
There are different types of diabetes mellitus, including: Type 1: an autoimmune condition whereby insulin-producing cells in the pancreas are
destroyed by the body leading to a complete deficiency of insulin.
1 Rawaf S, Marshall F, Drug misuse: the ten steps for needs assessment, Public Health Medicine 1999; 1:21-262 Health needs assessment: a practical guide, National Institute for Health and Clinical Excellence, 2005 3 World Health Organisation www.who.int, 2005 4 National Service framework for diabetes: standards. DH 2001
Page 9 of 77

Wandsworth PCT Department of Public Health
Diabetes Health Needs Assessment 2010
Type 2: caused by a shortage of insulin or a fault in the way the body responds to insulin. Gestational diabetes: affects women during pregnancy though often disappears after delivery.
Women who have had gestational diabetes are at higher risk of developing diabetes later in life than women who have not had gestational diabetes.5
Type 1 diabetes is most often diagnosed in children and young people under 15, although it can occur at any age. It is the least common of the two types and accounts for around 10% of all people with diabetes.6 Symptoms are often marked and diagnosis usually follows quickly.
Type 2 diabetes mainly affects people over the age of 40. The symptoms of Type 2 diabetes are less marked than those for Type 1, with the result that Type 2 diabetes may go undetected for many years. The onset of Type 2 diabetes occurs on average between nine and 12 years before a diagnosis is made, by which time between one-third to around 50 per cent will already have signs of complications.7 This is the more common of the two types and accounts for 90% of cases of diabetes.
Diabetes is a life-long condition and consequently can have a profound impact on lifestyle, relationships, work, income, health, well-being and life expectancy.8 Box 1 below shows some facts and figures about diabetes.
Box 1: Diabetes facts
Source: National Service framework for diabetes: standards. DH 2001 & Diabetes in England. Yorkshire and Humber Public Health Observatory and the National Diabetes Support Team, November 2008.
2.4 Diabetes incidence and prevalence in EnglandThe number of people developing diabetes is increasing around the world. In England, the estimated prevalence of diabetes (diagnosed and undiagnosed) in 2008 was 4.67% of the population or
5 Definition, diagnosis and classification of diabetes mellitus and its complications : report of a WHO consultation. Part 1:
Diagnosis and classification of diabetes mellitus. World Health Organization, Department of Noncommunicable Disease
Surveillance. 1999. Geneva: WHO (WHO/NCD/NCS/99.2) 6 Diabetes in the UK 2009: Key statistics on diabetes. Diabetes UK, 2009.7 Diabetes UK factsheet No 2- Diabetes: the figures. Updated September 2000.8 National Service framework for diabetes: standards. DH 2001
Life expectancy is reduced, on average, by more than 20 years in people with Type 1 diabetes and by up to 10 years in people with Type 2 diabetes
Mortality rates from heart disease in adults with diabetes are between two to four times higher than in adults without diabetes, while the risk of stroke is also two to four times higher
Diabetes is the leading cause of renal failure, accounting for more than one in six people starting renal replacement therapy; the second commonest cause of lower limb amputation; and the leading cause of blindness in people of working age
Diabetes leads to additional risks in pregnancy: women with diabetes have an increased chance of losing the baby during pregnancy, or at birth; of the baby having a congenital malformation, or of the baby dying in infancy
Type 2 diabetes incurs significant direct personal costs, for people with diabetes, including costs associated with managing their diabetes. The costs of diabetes are not restricted to health care expenditure, approximately 5,960,000 working days were lost to type 2 diabetes in 1998, valued at £ 256,131,000
Page 10 of 77

Wandsworth PCT Department of Public Health
Diabetes Health Needs Assessment 2010
approximately 2.5 million persons. By 2025 it is forecast that 6.48% of the population or approximately 3.6 million people will have diabetes. This rise will be fuelled both by the ageing population and the increasing prevalence of obesity.9
In England we know that The incidence of Type 1 diabetes is increasing in all age groups but the rise is particularly
steep among children under five years old The prevalence of Type 2 diabetes is increasing across all age groups and is being
diagnosed in children as well; it is likely that this is due to the increase in childhood obesity.10
Diabetes prevalence has been increasing in both men and women, and prevalence is higher in men in all adult age groups than women.11
2.5 UK policies on diabetesThe Department of Health published the Diabetes National Service Framework in 2001 which set out 12 national standards for the care of people with diabetes (Table 1).12 This was followed in 2003 with a Delivery Strategy which set out how the Diabetes NSF could be achieved.13 In 2010, a six year update on performance on the Diabetes NSF standards was published, which highlighted progress made on each of the 12 standards.14
Table 1: National Service Framework Standards for Diabetes
Preventing and identifying diabetes
Standard 1 The NHS will develop, implement and monitor strategies to reduce the risk of developing type 2 diabetes in the population as a whole and to reduce the inequalities in the risk of developing type 2 diabetes.
Standard 2 The NHS will develop, implement and monitor strategies to identify people who do not know they have diabetes.
Partnership in decision-making
Standard 3 All children, young people and adults with diabetes will receive a service which encourages partnership in decision-making, supports them in managing their diabetes and helps them to adopt and maintain a healthy lifestyle. This will be reflected in an agreed and shared care plan in an appropriate format and language. Where appropriate, parents and carers should be fully engaged in this process.
Clinical care of adults with diabetes
Standard 4 All adults with diabetes will receive high-quality care throughout their lifetime, including support to optimise the control of their blood glucose, blood pressure and other risk factors for developing the complications of diabetes.
Clinical care of children and young people with diabetes
Standard 5 All children and young people with diabetes will receive consistently high-quality care and they, with their families and others involved in their day-to-day care, will be supported to optimise the control of their blood glucose and their physical, psychological, intellectual, educational and social development.
Standard 6 All young people with diabetes will experience a smooth
9 Diabetes in England . Yorkshire and Humber Public Health Observatory and the National Diabetes Support Team , November
2008. 10 Diabetes Key Facts, Supplement 2007. Yorkshire and Humber Public Health Observatory, 2007. 11 Diabetes in the UK 2009: Key statistics on diabetes. Diabetes UK, 2009.12 National Service framework for diabetes: standards. DH 200113 National Service Framework for Diabetes: Delivery strategy. DH 200314 Six years on. Delivering the Diabetes National Service Framework. Department of Health, 2010.
Page 11 of 77

Wandsworth PCT Department of Public Health
Diabetes Health Needs Assessment 2010
transition of care from paediatric diabetes services, whether hospital or community-based, either directly or via a young people’s clinic. The transition will be organised in partnership with each individual and at an age appropriate to and agreed with them.
Diabetic emergencies and inpatient care
Standard 7 The NHS will develop, implement and monitor agreed protocols for rapid and effective treatment of diabetic emergencies by appropriately trained healthcare professionals. Protocols will include the management of acute complications and procedures to minimise the risk of recurrence.
Standard 8 All children, young people and adults with diabetes admitted to hospital, for whatever reason, will receive effective care of their diabetes. Whenever possible, they will continue to be involved in decisions concerning the management of their diabetes.
Diabetes and pregnancy
Standard 9 The NHS will develop, implement and monitor policies that seek to empower and support women with pre-existing diabetes and those who develop diabetes during pregnancy to optimise the outcomes of their pregnancy.
Detection and management of long-term complications
Standard 10 All young people and adults with diabetes will receive regular surveillance for the long-term complications of diabetes.
Standard 11 The NHS will develop, implement and monitor agreed protocols and systems of care to ensure that all people who develop long-term complications of diabetes receive timely, appropriate and effective investigation and treatment to reduce their risk of disability and premature death.
Standard 12 All people with diabetes requiring multi-agency support will receive integrated health and social care.
In 2007, Healthcare for London: A Framework for Action was published which set out plans to improve the health and healthcare of Londoners. Within the Healthcare for London (HfL) programme, diabetes was selected as the focus of the first long-term conditions project. The case for focussing on diabetes includes the significant inequalities in the way diabetes is prevented, diagnosed and treated across London; prevalence of diabetes is predicted to increase, spending on diabetes now accounts for an estimated 10% of the NHS budget, the standards of service offered in the capital are poor compared with the rest of the country. 15 This is important as poor quality routine care will lead to greater use of the emergency services, poorer outcomes for patients and greater cost to the NHS. A further Diabetes Guide for London was published, which outlined a model of care for London as well as made commissioning recommendations.
NICE has developed guidance on various aspects of the management of diabetes including:- The management of Type 1 diabetes, an update of which is currently in preparation- The management of Type 2 diabetes- Diabetes in pregnancy- Technology appraisals have been completed on inhaled insulin, long acting insulin analogues,
patient education models and insulin pump therapy- Interventional procedure guidance has been published on allogenic pancreatic islet cell
transplantation for Type 1 diabetes, autologous pancreatic islet cell transplantation for improved glycaemic control after pancreatectomy and pancreatic islet cell transplantation.
15 Diabetes guide for London. Health care for London.
Page 12 of 77

Wandsworth PCT Department of Public Health
Diabetes Health Needs Assessment 2010
There is NICE public health guidance currently in development on preventing pre-diabetes in adults and on preventing the progression from pre-diabetes.
Guidance on commissioning services for children and young people with diabetes was provided in Making Every Young Person with Diabetes Matter: Report of the Children and Young People with Diabetes Working Group which was published by the Department of Health Diabetes Policy Team in 2007. This document puts forward a number of standards to guide the delivery of care to young people.
2.6 Risk factors for developing diabetes
The risk factors are different for Type 1 and Type 2 diabetes. Whilst the risk of developing diabetes increases with age, anyone can get it. The following groups are identified as being at increased risk of developing diabetes:
Type 1 diabetes People with a strong family history of type 1 diabetes Although the onset of type 1 diabetes is typically in childhood it also occurs in adults
Type 2 diabetes People with a family history of diabetes Ethnicity: higher rates of Type 2 diabetes are reported in people of South Asian and African
origin, and in indigenous peoples of the Americas and Australasia. Adults and children who are overweight or obese and are physically inactive Deprivation is strongly linked with higher levels of obesity, physical inactivity, unhealthy diet,
smoking and poor blood pressure control, all factors which are linked to the development of diabetes or which increase the risk of developing complications in those who already have the disease16. Those in the most deprived fifth of the population are one-and-a-half times more likely than average to have diabetes at any given age. Both mortality and morbidity are increased by socio-economic deprivation.17
People with impaired glucose tolerance Women who have had gestational diabetes mellitus
Risk factors for type 1 diabetes are not thought to be modifiable whereas overweight/obesity and physical inactivity are modifiable risk factors for type 2 diabetes.
16 Diabetes in the UK 2009: Key statistics on diabetes. Diabetes UK, 2009.17 National Service framework for diabetes: standards. DH 2001
Page 13 of 77

Wandsworth PCT Department of Public Health
Diabetes Health Needs Assessment 2010
3. Understanding our population 3.1 Prevalence of non-modifiable risk factors for diabetes in
WandsworthThe following sections of this report describe Wandsworth’s population in terms of non-modifiable risk factors for diabetes. Non-modifiable risk factors cannot be changed however understanding the distribution of these will highlight groups of the population that are at high risk.
3.1.1 AgeType 1 diabetes is most often diagnosed in children and young people under 15, although it can occur at any age. Type 2 diabetes mainly affects people over 40. Increasing prevalence of type 2 diabetes is now seen in younger people as a result of changing lifestyle factors such as higher levels of inactivity and the increasing prevalence of overweight and obesity.
Figure 1: Age breakdown for Wandsworth population showing % in each age group for males and females
Source: GLA Round 2008 Population Projections Low
The population of Wandsworth is young with 40% of the total population falling into the 25-39 year age group. This is a large pool of people at risk of developing type 2 diabetes, who we anticipate will remain in Wandsworth in their 40’s, when they are at risk of developing diabetes.
27% of the population are aged between 0-24 years and this group are at risk of developing diabetes at an earlier age than previous generations due to changes in lifestyle. This group are also likely to still be living in Wandsworth when they develop diabetes.
0-45-9
10-1415-1920-2425-2930-3435-3940-4445-4950-5455-5960-6465-6970-7475-7980-8485-89
90+
-20 -15 -10 -5 0 5 10 15 20
Males Females
Page 14 of 77

Wandsworth PCT Department of Public Health
Diabetes Health Needs Assessment 2010
3.1.2 EthnicityPrevalence of Type 2 diabetes is up to 6 times higher in people of South Asian decent and up to 3 times higher in African and African-Carribean populations in the UK. There is also increasing evidence of higher incidence of Type 2 diabetes in South Asian children.
Figure 2: Map of percentage of Asian or Asian British in Wandsworth wards
Figure 3: Map of percentage of Black or Black British in Wandsworth Wards
Figure 2 and Figure 3 above show that large parts of Wandsworth - particularly Wandsworth South and Battersea localities have high numbers of people at increased risk of developing diabetes as a result of their ethnicity.
Page 15 of 77

Wandsworth PCT Department of Public Health
Diabetes Health Needs Assessment 2010
3.2 Prevalence of modifiable risk factors for diabetes in Wandsworth
Modifiable risk factors for diabetes can be reduced or prevented through lifestyle interventions and active management.
3.2.1 DeprivationStrong links exist between income, attained level of education and poverty. Deprivation is strongly linked with higher levels of obesity, physical inactivity, unhealthy diet, smoking and poor blood pressure control, all factors which are linked to the development of diabetes or which increase the risk of developing complications in those who already have the disease. We would therefore expect to see higher prevalence of diabetes and its risk factors in the wards with highest levels of deprivation. Mortality rates from diabetes for those living in the poorest postcodes are 2.3 times the national average, compared to 1.3 times the national average in wealthier areas.18
Figure 4: Map showing deprivation in Wandsworth PCT
Source: IMD 2007
Figure 4 above shows that all localities in Wandsworth have wards of high deprivation with an increased risk of developing ill-health including diabetes.
3.2.2 ObesityThe risk of developing Type 2 diabetes increases by up to ten times in people with a BMI of more than 30.19 In Wandsworth, the number of patients aged 16 or over who are registered as obese is 15,462
18 Diabetes in the UK 2004, A report from Diabates UK October 200419 Diabetes in the UK 2004, A report from Diabetes UK October 2004
Page 16 of 77

Wandsworth PCT Department of Public Health
Diabetes Health Needs Assessment 2010
(QOF 2008/9). These numbers provided from QOF are likely to be an underestimate of the prevalence of obesity in Wandsworth.
The Health Survey for England (HSE) report “Forecasting Obesity to 2010” was revised to include data from the 2003 HSE and showed that in England 43% of males and 33% of females aged 16 and over were overweight. For the same age group, 22% of males and 23% of females were obese. Applying these figures to the Wandsworth population for 2010, we have estimated the numbers of our population who might be overweight or obese (table 2).
Table 2: Estimated numbers of obese or overweight population in Wandsworth aged 16 or over, 2010
Individuals aged 16 or over Males FemalesOverweight 49,765 40,622Obese 25,461 28,312Source: Forecasting Obesity to 2010, DOH & GLA 2008 Population Projections
Based on these figures there are between 15,000 and 50,000 obese people in Wandsworth who are at increased risk of developing diabetes.
3.2.3 Gestational diabetesGestational diabetes affects up to 5% of all pregnancies, and women who are overweight or obese are at increased risk of developing it. A study conducted in inner-city London in 1995 revealed an overall prevalence of gestational diabetes of 2%.20 A higher prevalence of gestational diabetes is seen in women from ethnic minority groups: 2.9% in ethnic groups; 0.4% in the white population.21
Type 1 diabetes is more common than type 2 diabetes during the reproductive years, although with increasing levels of obesity and associated increases in type 2 diabetes, this is likely to change. A recent BMA report suggests that 10% of diabetes in pregnancy is pre-gestational and 90% is gestational. The same report estimates a prevalence of gestational diabetes as between 2-5% of all pregnancies.22 In white Europeans, 20-40% of gestational diabetes will develop in to diabetes type 2 within 20 years.23
We estimate that we can expect 93 pregnant women to get gestational diabetes in a year in Wandsworth. Of this group, we can expect between 19 and 37 of these women to go on to develop diabetes within 20 years.
3.2.4 Impaired glucose toleranceImpaired glucose tolerance is defined as a fasting plasma glucose concentration of less than 7.8 mmol/l and between 7.8 and 11.1 mmol/l two hours after a 75 g oral glucose load. Impaired glucose tolerance is common and is thought to affect 17% of those aged 40-65 years in Britain. Impaired glucose tolerance is a very strong risk factor for type 2 diabetes: between 4% and 9% of people with impaired glucose tolerance develop diabetes each year.24
20 Difference in prevalence of gestational diabetes and peri-natal outcome in an innercity mutli-ethnic London population.
Koukkou E, Taub N, Jackson P; Euro. J. Obs Gyn Repro Biol 1995 Apr; 59 (2): 153-721 Diabetes medicine 1992, Nov; 9 (9); 820-5. High prevalence of gestational diabetes mellitus in women from ethnic minority
groups. 22 Diabetes mellitus: an update for healthcare professionals. BMA, February 200423 BMJ 1997. Should we screen for gestational diabetes. The case for screening for gestational diabetes. Soares et al 315
(7110) 737.
Page 17 of 77

Wandsworth PCT Department of Public Health
Diabetes Health Needs Assessment 2010
In a 10 year follow up study, 15% of people with impaired glucose tolerance went on to develop non-insulin dependent diabetes, 22% remained glucose intolerant, and the majority (53%) improved. By the time they develop diabetes, 50% will already have established complications, 16% coronary artery disease, and 30% retinopathy.
Evidence shows that intensive courses aimed at modifying diet and increasing physical activity in people with impaired glucose tolerance over a few months followed by sustained, but less frequent reinforcing sessions, reduce the risk of developing type 2 diabetes compared with standard written and oral advice, in China, Finland and the United States. The effect was very strong – about a halving of the risk of diabetes – and consistent, despite the very different settings. This makes it likely that this magnitude of effect could be reproduced in other settings, such as Wandsworth.
If left unchecked, of the 75,000 people in Wandsworth currently aged 40-65 years we can expect that: in 10 years time 12,761 people in Wandsworth will have impaired glucose tolerance in 10 years time 1,972 people of these 12,761 will go on to develop type 2 diabetes by the time they develop diabetes 986 will have established complications
3.3 Expected prevalence of diabetes in Wandsworth The Health Survey for England 2006 found that the prevalence of diabetes in males was 5.6% and for females was 4.2%. Data from Quality and Outcomes Framework (QOF) for 2008 showed that 2,088,335 adults in England have been diagnosed with diabetes. However, not all diabetes is diagnosed. Studies which have examined the total prevalence of diabetes (both diagnosed and undiagnosed) suggest that as many as half of those with diabetes may go undiagnosed 25 although in more recent publications it has been estimated that 25% of diabetics in London are undiagnosed.26
The PBS diabetes model is a spreadsheet model that generates expected total numbers of persons with Type 1 and Type 2 diabetes mellitus (diagnosed plus undiagnosed combined) in England, Government Office Regions, Strategic Health Authorities, Local Authority Districts, Primary Care Trusts, electoral wards and user-defined populations including GP practices. The model applies age, sex and ethnic group-specific estimates of diabetes prevalence rates, derived from epidemiological population studies, to 2005 mid-year population estimates. The model allows forecasts of diabetes prevalence up to 2025 to be calculated for sub-national areas based on projected population change and current trends in obesity.
Using the PBS model, the following predictions (Table 3) are made for the numbers of people with Type 1 and Type 2 diabetes mellitus in Wandsworth based on 2005 population data.
24 Edelstein SL, Knowler WC, Bain RP, Andres R, Barrett-Connor EL, Dowse GK et al. Predictors of progression from impaired
glucose tolerance to NIDDM: an analysis of six prospective studies. Diabetes 1997;46:701-1025 Yudkin JS, Forrest RD, Jackson CA, Burnett SD, Gould MM (1993) The prevalence of diabetes
and impaired glucose tolerance in a British population. Diabetes Care 16:153026 Diabetes guide for London. Health care for London.
Page 18 of 77

Wandsworth PCT Department of Public Health
Diabetes Health Needs Assessment 2010
Table 3: Estimated prevalence of diabetes 2005
Persons Males Females
Number % rate Number % rate Number % rate
England 2,262,484 4.48 940,502 3.80 1,321,983 5.14
London 342,029 4.59 146,710 3.98 195,319 5.18
Wandsworth Borough 10,194 3.69 4,210 3.15 5,984 4.20
SW London Sector 54,860 4.15 23,170 3.58 31,690 4.70
Source: PBS model phase 3, April 2008
The model shows that Wandsworth has an overall expected prevalence rate of 3.69% for diabetes mellitus in 2005. This is a lower rate than for South West London, London and England, which have prevalence rates of 4.15%, 4.59% and 4.48% respectively. The diabetes prevalence rate is higher for women (4.20%) than men (3.15%) in Wandsworth.
Forecasts of diabetes prevalence are also presented for sub-national areas based on projected population change and trends in obesity. Figure 5 below illustrates how the diabetes prevalence is predicted to increase in Wandsworth from 2010–2025.
Source: PBS Model Phase 3, April 2008
Figure 6 below shows the estimated prevalence of Type 1 and type 2 diabetes by ethnic group for 2005. This shows that diabetes is most prevalent in the Asian population.
Figure 5: Estimated growth in diabetes prevalence in Wandsworth, 2010-2025
2010 2015 2020 20253.40%
3.50%
3.60%
3.70%
3.80%
3.90%
4.00%
4.10%
4.20%
4.30%
4.40%
Prev
alen
ce (%
)
→+15.4%
Page 19 of 77

Wandsworth PCT Department of Public Health
Diabetes Health Needs Assessment 2010
Source: PBS Model Phase 3, April 2008
3.4 Actual prevalence of types 1 and 2 diabetes mellitus in Wandsworth
There is now a requirement as part of the new GMS contract for all GPs to maintain disease registers for certain conditions including diabetes. Out of a total of 364,358 people registered with a GP practice in Wandsworth, 11,014 people are registered as having diabetes and are on a “diabetes register” within their practice. This represents a diabetes (Types 1 and 2) prevalence rate of 3% within Wandsworth PCT. These data relate to the financial year 2008/9. The local prevalence of diabetes based on the Quality and Outcomes Framework data is likely to be an underestimate as almost half of diabetes may go undiagnosed as well as due to under-reporting. In addition, the Quality and Outcomes Framework data are not age-standardised and so Wandsworth’s high proportion of residents aged below 40 years, is likely to “dilute” higher prevalence rates in the over 40’s age group.
Figure 7 shows the diabetes prevalence for the population aged 17+ by GP Practice based on QoF data for 2008/9 as well as the ratio of actual to expected numbers of diabetes patients by practice. This shows that practices that have a low prevalence of diabetes generally also have a ratio of actual to expected numbers of diabetic patients of <1, implying that fewer numbers of diabetics patients than expected are being identified in these practices. This should be interpreted with caution however as ethnicity and deprivation are not controlled for in the estimates of expected numbers of diabetic patients.
Figure 6: Estimated prevalence of Type 1 and 2 diabetes by ethnic group, 2005
White Black Asian Other0%
1%
2%
3%
4%
5%
6%
7%
8%
9%
2.96%
7.51%
8.40%
2.18%Prev
alen
ce (%
)
Page 20 of 77

Wandsworth PCT Department of Public Health
Diabetes Health Needs Assessment 2010
Figure 7: Diabetes prevalence by practice and ratio of actual to expected numbers of diabetic patients
H85012
H85004
H85114
H85061
H85049
H85659
H85664
H85009
H85045
H85002
H85003
H85051
H85056
H85041
H85650
H85111
H85695
H85637
H85011
H85039
H85688
H85067
H85075
H85107
H85691
0
0.2
0.4
0.6
0.8
1
1.2
1.4
1.6
1.8
0%
2%
4%
6%
8%
10%
12%
14%
16%
Ratio of actual to expected Diabetes Prevalence using 17+ population
Source: Diabetes prevalence by practice based on QOF 2008/9. Ratio of actual to expected numbers of diabetic patients is from NHS Comparators.
Using GP data we have been able to estimate diabetes prevalence at ward level. The diabetes register data at practice level has been applied to the ward breakdown of registered patients. For this reason, the figures should be treated with caution. Figure 8 shows that prevalence of diabetes is higher in the more deprived wards and wards with a higher proportion of Asian and Black residents.
Source: QMAS 2009, NSTS 2008
Figure 8: Diabetes prevalence by ward based on QOF data for 2008/09
Page 21 of 77

Wandsworth PCT Department of Public Health
Diabetes Health Needs Assessment 2010
The following figure shows prevalence by ward based on the PBS modelled estimates which shows largely a similar distribution of high prevalence areas.
3.5 Comparison of expected and recorded prevalence of diabetes
The 23% difference between the expected prevalence of 3.69% from the PBS model and the 3% prevalence from our 2008/9 QOF data, which is likely to be an underestimate, indicate that there are potentially a number of undiagnosed patients in Wandsworth, and this is in line with the 25% undiagnosed estimate suggested in the literature. The actual numbers of people predicted to have diabetes and those on the GP practice lists are however very close. In 2008/9 11,014 people were on a diabetes register within their general practice and the PBS model estimated that in 2010 in Wandsworth there are 10,700 diagnosed and undiagnosed people with Type 1 and Type 2 diabetes. 27 The potential reasons for this could include: inaccuracies in the GP practice lists, that the model has underestimated the number of diabetics in the area, or potentially that most cases of diabetes in Wandsworth have actually been diagnosed.
27 Calculated using PBS total diabetes model predictions
Page 22 of 77

Wandsworth PCT Department of Public Health
Diabetes Health Needs Assessment 2010
We estimate that the approximate age breakdown of people with diabetes by age in Wandsworth in 2010 is as shown below in Table 4.
Table 4: Estimated number of people with type 1 and type 2 diabetes in Wandsworth by age group in 2010
Age groupsType 1 and Type 2
Diabetes0-29 50630-59 4,36960+ 5,352Source: estimates use diabetes PBS prevalence model and GLA 2008 population projections for Wandsworth, 2010.
There are many people in Wandsworth who are at risk of developing diabetes in the future. Many risk factors for diabetes are modifiable i.e. the development of diabetes can be prevented or reduced. Table 5 below shows a summary of the number of people estimated to be at risk of developing diabetes in Wandsworth in the future.
Table 5: Summary of numbers of people in Wandsworth with modifiable risk factors for developing diabetes
Modifiable risk factor Estimated number of people with risk factors for developing diabetes in Wandsworth
Obesity 15,462Gestational diabetes 93Impaired glucose tolerance 12,761
This estimate shows that there are potentially at least 28,000 people in Wandsworth with modifiable risk factors for developing diabetes ie. with suitable interventions, we can influence and help prevent 28,000 people in Wandsworth from developing diabetes.
3.6 Diabetes in children and young peopleAs already discussed, the incidence of type 1 diabetes is known to be increasing in the UK and across Europe, particularly in the under 5 age group; and the incidence of type 2 diabetes is increasing in children as a result of the obesity epidemic.28 Much of the attention in the UK has been focused on the anticipated growth of Type 2 diabetes however, there is a significant increase in the number of children and young people diagnosed with all types of diabetes. These increases have significant implications for the development of services in order to meet the needs of this group of patients.
In the UK we have the both the highest number of children diagnosed with diabetes in Europe and the lowest number of children attaining good diabetes control.29
3.6.1 Type 1 diabetesRecent literature suggests that there will be a doubling of new cases of type 1 diabetes in European children young than 5 years between 2005 and 2020 and that prevalent cases will increase by 70%.30 The peak age for diagnosis of type 1 diabetes in the UK is 10-14 years but is becoming younger with a steep rise in under 5’s. The current estimate of prevalence of Type 1 diabetes in children in the UK is one per 700–1,000 children.
28 Diabetes in the UK 2004. Diabetes UK, October 2004. 29 Making every young person with Diabetes matter. DH Diabetes Policy Team, London 2007.30 Patterson CC, Dahlquist GG, Gyurus E et al. Incidence trends for childhood type 1 diabetes in Europe during 1989-2003 and predicted new cases 2005-2020: a multicentre prospective registration study. Lancet 2009; 373: 2027-33
Page 23 of 77

Wandsworth PCT Department of Public Health
Diabetes Health Needs Assessment 2010
3.6.2 Type 2 diabetesThe prevalence figures for children are limited but as many as 1,400 children may have Type 2 diabetes in the UK. In the last five years there has been a significant increase in the number of diagnosed cases. There is an ethnic component to this as well with children of South Asian origin found to be 13 times more likely to have Type 2 diabetes than white children. If the current trends of increased childhood obesity continue and follow the pattern seen in North America, the UK will develop similar rates of Type 2 diabetes in children over the next ten to 15 years.
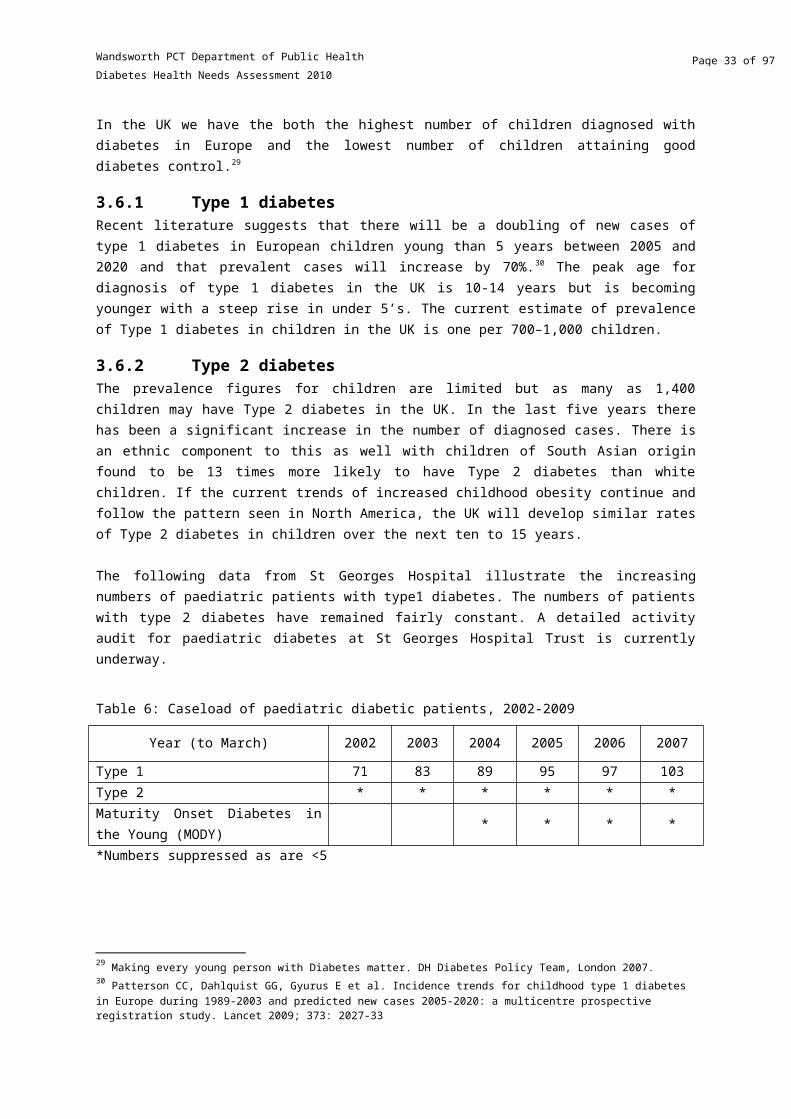
The following data from St Georges Hospital illustrate the increasing numbers of paediatric patients with type1 diabetes. The numbers of patients with type 2 diabetes have remained fairly constant. A detailed activity audit for paediatric diabetes at St Georges Hospital Trust is currently underway.
Table 6: Caseload of paediatric diabetic patients, 2002-2009
Year (to March) 2002 2003 2004 2005 2006 2007
Type 1 71 83 89 95 97 103Type 2 * * * * * *Maturity Onset Diabetes in the Young (MODY) * * * *
*Numbers suppressed as are <5
3.7 Diabetes preventionPrimary prevention of diabetes (the prevention of onset of diabetes) protects susceptible individuals i.e. those with risk factors as discussed above, from developing diabetes. It reduces or delays both the need for diabetes care and the need to treat diabetes complications.
Lifestyle modifications in several different settings: intensive courses over a few months followed by sustained but less frequent reinforcing sessions aimed at modifying diet and increasing physical activity in people with impaired glucose tolerance, reduce the risk of developing type 2 diabetes compared with standard written and verbal advice.31 This is an area that will be further addressed in the forthcoming NICE public health guidance on prevention of pre-diabetes.
The newly implemented NHS Health Check programme is a universal and systematic programme for everyone between the ages of 40 and 74 that will assess people’s risk of heart disease, stroke, kidney disease and type 2 diabetes, and will support people to reduce or manage that risk through individually tailored advice. This programme commenced in 2009 and it is anticipated that it will help identify those with modifiable risk factors in Wandsworth. There are in addition ongoing activities in the borough to address rising obesity and to improve physical activity of Wandsworth residents. The impact of these programmes however will only be realised in the long term.
Secondary prevention of diabetes includes early detection, prevention of disease progression, and appropriate treatment. Early identification of diabetes can be increased by:
Raising both public and professional awareness of the signs of diabetes Regular testing of anyone known to be at risk Targeted and opportunistic screening of individuals with multiple risk factors
31 Lifestyle interventions for preventing type 2 diabetes mellitus, Wandsworth PCT, Clinical Effectiveness Group Evidence
Review, March 2005
Page 24 of 77

Wandsworth PCT Department of Public Health
Diabetes Health Needs Assessment 2010
3.8 Complications of diabetesBy the time they are diagnosed with Type 2 diabetes, 50 per cent of people have evidence of complications. Complications from diabetes result in morbidity, hospital admissions, and in many cases premature death for many people with diabetes:
Between 50% and 80% of people with diabetes will die from cardiovascular disease people with diabetes are 2-3 times more likely to have a stroke compared to those without the
condition 1,000 people with diabetes start kidney dialysis every year in the UK diabetes is the leading cause of blindness in people of working age in the UK The rate of lower limb amputation in people with diabetes is 15 times higher in people with
diabetes than without diabetes. 32
Primary prevention of diabetes, prompt diagnosis and good control of diabetes can prevent and reduce the incidence of complications of diabetes, thus reducing hospital admissions and saving money.
32 Diabetes in the UK 2004, A report from Diabates UK October 2004
Page 25 of 77

Wandsworth PCT Department of Public Health
Diabetes Health Needs Assessment 2010
4. Provision of Service and CareSeveral indicators are used to monitor the quality of prevention, diagnostic and care services provided to diabetics in Wandsworth. National and local data are also available on diabetes related mortality, hospital admissions and prescribing practices and costs. GP’s record data relating to disease management using the QOF system. There are sixteen QOF indicators relating to the ongoing management of diabetes, which are a useful indicator of the quality of care provided to diabetic patients as well. There are however several caveats to acknowledge with respect to the use of QoF data. These include: there may be inconsistencies in the diagnosing and coding of diseases between clinicians, practice disease registers may be incomplete, the clinical indicators that relate to each chronic condition are measures of process rather than outcome for patients with chronic conditions, exception reporting may be used inappropriately to exclude patients from the denominator,
The following sections will discuss Wandsworth PCTs performance with respect to diabetes indicators related to screening for, preventing and treating complications of diabetes.
44.1 Description of service delivery in WandsworthThere are significant changes anticipated in the way services to diabetic patients are to be provided in Wandsworth. Key changes include the integration of community based services into the St Georges Hospital Trust and a redesign of the care pathway that will be associated with that change; and the proposal to shift some care for diabetic patients from secondary into primary care. As these developments are already underway any description of how services are currently provided is likely to be outdated in the near future.
4.1.1 Primary careThe majority of care to patients with diabetes is delivered in primary care, and much of this is done by practice nurses. The community diabetes specialist nurses are now in place to support practice nurses. There has been a gap in the past in the delivery of care to housebound patients or those in care homes, however this should now be covered by the community specialist nurses. Section 4.2 describes in greater detail some of the process measures that are used to monitor the quality of care delivered.
4.1.2 Community diabetes specialist nursing serviceThis service has been in place for approximately 6 months and is aimed at improving the quality and cost-effectiveness of community diabetes services, and improving the health outcomes of all diabetic patients through improving access to care. The nurses support diabetics to develop capacity for self-management; they are involved in identifying potential undiagnosed patients and also provide a service to those patients who through reduced mobility are unable to access care.
Patients are referred by either GPs, community nurses or from secondary care. When patients are referred to the service they are offered a comprehensive assessment and screening for their diabetes management needs. Patients are offered a programme of education and 1:1 support until the management of their diabetes is optimised. Access is then provided according to need and a further referral from primary care may be made if needed. The service is provided in various locations
Page 26 of 77

Wandsworth PCT Department of Public Health
Diabetes Health Needs Assessment 2010
according to patient need including GP practices, the patient’s home, community clinics, Wandsworth prison or Springfield hospital.
4.1.3 Secondary careSpecialist diabetes care is provided by various hospital trusts in SWL, predominantly St Georges Hospital for patients in Wandsworth. Paediatric patients, patients with gestational diabetes, management of complications and acute illnesses are all managed within secondary care, as is the provision of retinal screening.
A transition programme is available for paediatric to adult care however, at the main provider St Georges Hospital Trust; this is currently being revised in order to improve it. Paediatric diabetes nurse specialists works across health, social and educational boundaries to integrate diabetes care in to the patient's life; and care may be provided in the home (aim for 2 home visits per year), school, GP practices etc.
Measures of activity in secondary care are included in section 4.9.
4.2 Monitoring of diabetic controlThere are several indicators in QOF relating to the quality of diabetes control, which are focussed on the HbA1c level.33
Patients who have an HbA1c level of 7.5% or less have a good level of diabetes control (Figure 9). The Wandsworth average for this indicator was 59% compared to an England average of 66.3%. Under the current QOF 2009/10 guidance, three target levels for HbA1c (7%, 8% and 9%) are included to provide an incentive to improve glycaemic control across the distribution of HbA1c values, recognising however that the lower level may not be achievable for all patients.34
33 Following discussions with the diabetes community, the International Federation of Clinical Chemistry (IFCC) decided to introduce a new reference measurement for HbA1c. From June 2011 HbA1c will be reported in millimoles per mol (mmol/mol) instead of percentage (%). In this report the % values are used. 34 BMA and NHS Employers. Quality and Outcomes Framework Guidance for GMS contract 2009/10. Delivering investment in general practice. March 2009.
Page 27 of 77

Wandsworth PCT Department of Public Health
Diabetes Health Needs Assessment 2010
Figure 9: The percentage of patients with diabetes in whom the last HbA1c is 7.5% or less in the previous 15 months, QOF 2008/9
H85685
H85114
Y01132
H85659
H85100
H85061
H85104
H85052
H85045
H85051
H85049
H85012
H85041
H85087
H85047
H85048
H85008
H85082
H85111
H85039
H85056
H85077
H85088
H85695
H85636
Engla
nd
0
10
20
30
40
50
60
70
80
90
Perc
enta
ge (%
)
is the equivalent picture for patients who have an HbA1c level of 10% or less.
Figure 10: The percentage of patients with diabetes in whom the last HbA1c is 10% or less in the previous 15 months, QOF 2008/9
H85691
H85643
H85049
H85052
H85061
H85045
H85067
H85659
H85104
H85087
H85114
H85048
H85082
Y01132
H85006
H85039
H85002
H85111
H85680
H85637
H85005
H85650
H85107
H85695
H85636
Engla
nd0
10
20
30
40
50
60
70
80
90
100
Perc
enta
ge (%
)
Page 28 of 77

Wandsworth PCT Department of Public Health
Diabetes Health Needs Assessment 2010
4.3 Lower limb amputation In the UK, diabetes is the second most common cause of lower-limb amputation and the most common cause of non-traumatic amputation. The rate of lower limb amputation in diabetics is 15 times higher than in people without diabetes. Five percent of diabetics may develop a foot ulcer in one year, with 15% of foot ulcers resulting in amputation.35
The following graph (Figure 11) compares rates of lower limb amputation in people with diabetes per 100,000 population for London and England. The rates for London and England are very similar and have increased in 2007/8.
Source: NCHOD 2009
An analysis of Hospital Episode Statistics (HES) data by the YHPHO for 2007/8 and 2008/9 (provisional) has shown that NHS Wandsworth has higher incidence rates of minor and major lower limb amputations than a group of PCTs with similar diabetes related characteristics (including age profile, ethnicity, obesity prevalence and deprivation) and higher rates than England.36
In order to prevent the occurrence of this complication, diabetics are regularly checked for the presence of peripheral neuropathy and peripheral vascular disease. Figure 12 and present the QOF data for the indicators related to monitoring for these complications. For Wandsworth PCT overall 91.2% of patients had a record of the presence or absence of peripheral pulses in the previous 15 months the same figure for England. In 14% of Wandsworth practices 85% or less of patients had had a peripheral pulse check in the previous 15 months.
35 Diabetes in the UK 2004, A report from Diabetes UK October 200436 Yorkshire and Humber Public Health Observatory and Diabetes Health Intelligence, 2009. Diabetes Community Health Profile – An overview. Wandsworth PCT. Accessed March 2010 at http://yhpho.york.ac.uk/diabetesprofiles/default.aspx
Figure 11: Lower limb amputation in people with diabetes
2005/6 2006/7 2007/88
9
9
10
10
England London
Ind
ire
ctly
age
sta
nd
ard
ise
d r
ate
pe
r 1
00
,00
0
Page 29 of 77

Wandsworth PCT Department of Public Health
Diabetes Health Needs Assessment 2010
Figure 12: The percentage of patients with diabetes with a record of the presence or absence of peripheral pulses in the previous 15 months, QOF 2008/9
H85
691
H85
049
H85
685
H85
636
H85
100
H85
045
H85
065
H85
051
H85
682
H85
077
H85
104
H85
659
H85
061
H85
007
H85
006
H85
011
H85
680
H85
111
H85
114
H85
056
H85
637
H85
008
H85
650
H85
688
H85
695
Engl
and
0
10
20
30
40
50
60
70
80
90
100
Perc
enta
ge (%
)
Figure 13: The percentage of patients with diabetes with a record of neuropathy testing in the previous 15 months, QOF 2008/9
H85691
H85049
H85685
H85636
H85003
H85067
H85065
H85012
H85051
H85069
H85077
H85039
H85643
H85066
H85001
H85680
H85111
H85114
H85664
H85056
H85637
H85008
H85107
H85688
H85695
Engla
nd0
10
20
30
40
50
60
70
80
90
100
Perc
enta
ge (%
)
4.4 Renal diseaseNephropathy is one of the most serious microvascular complications of diabetes and is a major cause of kidney failure and death. Diabetic nephropathy is a clinical syndrome characterised by albuminuria on at least two occasions separated by 3–6 months, in people with diabetes. It can progress to end-stage renal failure.
Page 30 of 77

Wandsworth PCT Department of Public Health
Diabetes Health Needs Assessment 2010
Diabetic nephropathy develops in about one third of people with diabetes Diabetes is now the leading cause of end-stage renal failure in the UK accounting for 20% of
all cases Kidney disease accounts for 20% of deaths in Type 1 diabetes and 11% in Type 237
The risk of kidney damage increases with the duration of diabetes. 25 years following diagnosis the risk is 40-50% for both Type 1 and Type 2 diabetes.38
The NEOERICA39 study provides estimates of chronic kidney disease (CKD) stages 3-5 for the population aged 18+ at borough level. These estimates suggest that in Wandsworth there are 12,636 individuals with end stage CKD. The estimated prevalence is 5.4%. This is lower than the estimated prevalence for London (6.8%) and England (8.8%).
End-stage renal failure resulting from diabetes is more common in Black and Asian people than Caucasian. Prevalence of end-stage renal disease in the Thames region is estimated at 409 / 1,000,000 people (all causes of end-stage renal failure) with higher rates among black and Asian populations. 40
Tight control of hyperglycaemia and blood pressure can slow the progression to nephropathy, however once nephropathy is established blood glucose control is ineffective in reversing the process.
The average proportions of patients tested for microalbuminuria in the previous 15 months in Wandsworth primary care practices was 83.8% for 2008/09, compared to 87.1% for England. Approximately 45% of practices fall below the Wandsworth average (Figure 14). The average proportion of patients who have had an eGFR or serum creatinine test (Figure 15) was 94.8% for Wandsworth and 96.9% for England. Approximately 39% of Wandsworth practices achieved below the Wandsworth average for this indicator.
37 Diabetes in the UK 2009: Key statistics on diabetes. Diabetes UK, 2009.38 Diabetes in the UK 2004, A report from Diabates UK October 200439Stephens et al, Chronic Kidney disease management in the United Kingdom: NEOERICA project results. Kidney International (2007) 72, 92–9940 Population need for renal replacement therapy in Thames regions: ethnic dimension BMJ 1994;309:1111-1114, Roderick et
al
Page 31 of 77

Wandsworth PCT Department of Public Health
Diabetes Health Needs Assessment 2010
Figure 14: The percentage of patients with diabetes who have a record of micro-albuminuria testing in the previous 15 months, QOF 2008/9
H85636
H85643
H85685
H85104
H85067
H85100
H85682
H85003
H85691
H85009
H85057
H85075
H85051
H85052
H85065
Y01132
H85041
H85001
H85664
H85007
H85107
H85005
H85056
H85008
H85061
Engla
nd0
10
20
30
40
50
60
70
80
90
100
Perc
enta
ge (%
)
Figure 15: The percentage of patients with diabetes who have a record of estimated glomerular filtration rate (eGFR) or serum creatinine testing in the previous 15 months, QOF 2008/9
H85004
H85691
H85067
H85100
H85003
H85002
H85069
H85048
H85685
H85009
H85643
H85006
H85087
H85051
H85088
H85680
H85047
H85007
H85075
H85077
H85041
H85114
H85650
H85107
H85056
Engla
nd
0
10
20
30
40
50
60
70
80
90
100
Perc
enta
ge (%
)
Page 32 of 77
Wandsworth PCT Department of Public Health
Diabetes Health Needs Assessment 2010
4.5 Cardiovascular diseaseCardiovascular disease (CVD) includes both stroke and coronary heart disease (CHD) and is the most common microvascular complication of diabetes. 50% of type 2 diabetes will have evidence of CVD at diagnosis. Between 50% and 80% of people with diabetes will die from cardiovascular complications.
Diabetes substantially increases the risk of CHD.41 Men with Type 2 diabetes have a two to fourfold greater annual risk of CHD, with an even higher (three to fivefold) risk in women with Type 2 diabetes.42 Diabetes not only increases the risk of CHD but also magnifies the effect of other risk factors for CHD such as raised cholesterol levels, raised blood pressure, smoking and obesity.
Diabetics are also at two to three times increased risk of having a stroke compared to those without the condition. At least 15% of deaths in people with type 2 diabetes are the result of a stroke. African-Caribbean and South Asian men with diabetes have a 40% and 70% respectively, higher risk of stroke than the general population. 43
In Wandsworth 8,560 people with diabetes at the moment are likely to die from CVD complications in the future. Blood pressure lowering in people with diabetes reduces the risk of macrovascular and microvascular disease. Hypertension in people with diabetes should be treated aggressively with lifestyle modification and drug therapy. Monitoring of blood pressure (BP), cholesterol and BMI are covered in the QOF data. The most commonly identified target level for blood pressure in patients with diabetes is 140/80, which is the level that health professionals should aim for. A slightly higher level (145/85) is used as the audit standard in common with other indicators. Figure 16 shows the indicator of BP control. Overall in Wandsworth practices 78.8% of diabetic patients had a last blood pressure reading of 145/85 or less. The England average was 79.9%.
Overall in Wandsworth though, premature cardiovascular disease related mortality as reflected by directly age-standardised annual mortality rates in those aged under 75 years, has been decreasing year on year. The QOF indicators reported on in this section are referred to as process indicators in that they measure the number of patients checked for a variety of risk factors, however there is currently no outcome indicator on the incidence of cardiovascular related mortality amongst diabetics in Wandsworth.
41 British Heart Foundation, Coronary Heart Disease Statistics, 2004 42 Garcia MJ, McNamara PM, Gordon T, Kannell WB. Morbidity and mortality in the Framingham population. Sixteen year
follow-up. Diabetes 1974; 23:105-111.43 Diabetes in the UK 2004, A report from Diabetes UK October 2004
Page 33 of 77

Wandsworth PCT Department of Public Health
Diabetes Health Needs Assessment 2010
Figure 16: Proportion of diabetic patients with a last blood pressure reading of 145/85 or less by GP practice, QOF 2008/09
H85685
H85012
H85052
H85065
H85056
H85691
H85069
H85637
H85006
H85001
H85066
H85100
H85664
H85107
H85011
H85041
H85003
H85111
H85643
H85005
H85636Y01132
H85682
H85057
H85659Engla
nd
0
10
20
30
40
50
60
70
80
90
100
Perce
ntag
e (%)
Figure 17: The percentage of patients with diabetes who have a record of total cholesterol in the previous 15 months, QOF 2008/09
H85004
H85691
H85685
H85003
H85069
H85104
H85067
H85077
H85011
H85057
H85009
H85637
H85643
H85039
H85682
H85051
H85007
H85047
H85111
H85075
H85056
H85114
H85695
H85107
H85688
Englan
d0
10
20
30
40
50
60
70
80
90
100
Perc
enta
ge (%
)
In Wandsworth practices 94% have had their total cholesterol checked in the previous 15 months, compared to the England average of 96%. There are few practices (10%) where <90% of diabetic patients have had their cholesterol tested. A further indicator of how well cholesterol is controlled in diabetic patients is the proportion of patients whose last cholesterol measurement was 5 mmol/l or less (Figure 18). The average in Wandsworth practices was 77.6% for this indicator, compared to the
Page 34 of 77

Wandsworth PCT Department of Public Health
Diabetes Health Needs Assessment 2010
England average of 82.6%. 73% of Wandsworth practices fall below the England average for this indicator.
Figure 18: The percentage of patients with diabetes whose last measured total cholesterol within previous 15 months is 5 mmol/l or less, QOF 2008/09
H85685
H85052
H85104
H85067
H85643
H85004
H85009
H85002
H85088
H85066
H85056
H85006
H85007
H85051
H85039
H85011
H85680
H85012
H85111
H85075
H85049
H85008
Y01132
H85688
H85636
Engla
nd0
10
20
30
40
50
60
70
80
90
100
Perc
enta
ge (%
)
A further measure of cardiovascular risk is the BMI. In Wandsworth practices an average of 93.3% of patients had a record of BMI in the previous 15 months, compared to an England average of 94.8%. 45% of Wandsworth practices had ≥ 95% of patients with a record of BMI.
Page 35 of 77

Wandsworth PCT Department of Public Health
Diabetes Health Needs Assessment 2010
Figure 19: The percentage of patients with diabetes whose notes record BMI in the previous 15 months, QOF 2008/09
H85691
H85049
H85004
H85114
H85003
H85643
H85039
H85012
H85104
H85659
H85077
H85069
H85100
H85009
H85067
H85006
H85065
H85088
H85680
H85011
H85041
H85650
H85637
H85688
H85636
Engla
nd0
10
20
30
40
50
60
70
80
90
100
Perc
enta
ge (%
)
Page 36 of 77
Wandsworth PCT Department of Public Health
Diabetes Health Needs Assessment 2010
The figure below highlights some of the key aspects of the clinical management of diabetes related to cardiovascular disease, comparing NHS Wandsworth to a group of PCTs that have similar diabetes related characteristics (including age profile, ethnicity, deprivation and obesity levels) and to England. This shows that the care processes in Wandsworth are worse than that of peer PCTs and England averages.
Taken from Yorkshire and Humber Public Health Observatory and Diabetes Health Intelligence, 2009. Diabetes Community Health Profile – An overview. Wandsworth PCT.
Page 37 of 77

Wandsworth PCT Department of Public Health
Diabetes Health Needs Assessment 2010
4.6 Diabetic retinopathyProlonged exposure to raised blood glucose levels can result in visual impairment and blindness (diabetic retinopathy). The Diabetes National Service Framework Delivery Strategy set a challenging target that by the end of 2007, 100% of people with diabetes would be offered screening, and treatment if needed, of diabetic retinopathy as part of a systematic screening programme. The Department of Health has included this target in the Operating Framework 2008/9. The increasing numbers of people being identified as having diabetes makes this a particularly challenging target to meet.
Data for 2008/9 shows that in Wandsworth 86% of people with diabetes were offered screening for retinopathy in the previous 15 months. This compares favourably with 89.4% of people with Diabetes in England offered screening in the previous 12 months, based on data from April 2008.44 Figure 20 shows for each GP practice the proportion of patients on diabetes registers who have a record of retinal screening during the past 15 months. 53% of Wandsworth GP’s have screened 90% or more of patients who are on the diabetes register; however 18% have screened fewer than 80% of patients.
Figure 20: The percentage of patients who have a record of retinal screening in the previous 15 months, QOF 2008/09
H85636
H85691
H85082
H85685
H85100
H85003
H85008
H85007
H85039
H85048
H85045
H85067
H85009
Y01132
H85682
H85011
H85659
H85006
H85065
H85041
H85680
H85107
H85114
H85688
H85650
Englan
d
0
10
20
30
40
50
60
70
80
90
100
Perc
enta
ge (%
)
To illustrate the impact of diabetic retinopathy, shows the number of people registered as blind in England, London and South West London boroughs in 2006, 2008 and the percentage change calculated from these time periods. London has seen an increase in the number of people registered as blind over the past few years. This is not evident in the South West London boroughs where the number of blind registrations has either remained constant or decreased. The borough of Merton has seen a 22% decrease in blind registrations from 2006-2008. Wandsworth has seen no increase in the number of blind registrations, which potentially illustrates a positive impact of the screening programme.
44 Five years on. Delivering the Diabetes National Service Framework. Department of Health, 2008.
Page 38 of 77

Wandsworth PCT Department of Public Health
Diabetes Health Needs Assessment 2010
Table 7: Blind registrations in England, London and South West London boroughs, 2006-2008
2006 2008 % diffEngland 152,455 152,980 0.34London 20,835 21,650 +3.91Wandsworth 785 785 0Croydon 955 955 0Kingston 360 345 -4.17Merton 760 590 -22.37Richmond and Twickenham 420 370 -11.91Sutton 610 595 -2.46
Source: Information Centre 2009
The PCT has joined NHS Richmond in commissioning diabetic retinopathy screening from St Georges Hospital. A multidisciplinary board has been formed and is leading on the strategic development and quality improvement of the programme. An equity audit has been conducted to further understand the factors associated with uptake of retinal screening. This document is attached as appendix 3. Briefly the key findings were:
The uptake of screening was particularly low in the 18 to 29 year age group, and in type 1 diabetics. This is consistent with the findings of other studies.
Deprivation was not association with a lower uptake of screening in Wandsworth. There was poor data on ethnicity which did not allow an assessment of the impact of this on
screening uptake. There was also no clear pattern associated with duration of diagnosis. There was substantial variation in the uptake of screening by GP practice, although this was
not associated with the size of diabetic registers at each practice. There have been recent changes in the administration of the programme which should result
in better uptake as there is now a systematic call-recall system in operation from St Georges Hospital.
Recommendations from the equity audit included the following: Further qualitative work is required to explore the reasons behind low uptake amongst
younger patients and type 1 diabetics and to inform an intervention strategy. Data on ethnicity of diabetic patients is poor both in the primary care database and on the
database currently used at SGH. Ethnicity needs to be recorded by the retinal screening service provider so that it can be considered in subsequent analyses.
The variation in screening uptake by primary care provider is particularly worrying and a targeted intervention focussed on poorly performing practices is needed.
The prevalence of diabetes by ward needs to be taken into account in any decisions regarding siting of retinal screening services.
The provision of information on retinal screening for diabetes should be part of other general health promotion activities undertaken by NHS Wandsworth.
Other interventions that have been used across the country to increase uptake of retinal screening have included measures to improve accessibility including increased numbers of weekend and evening clinics, more screening locations and increasing transport options; improved communication and advertising of the screening programme, and the use of primary care providers to promote the uptake of screening.
Page 39 of 77
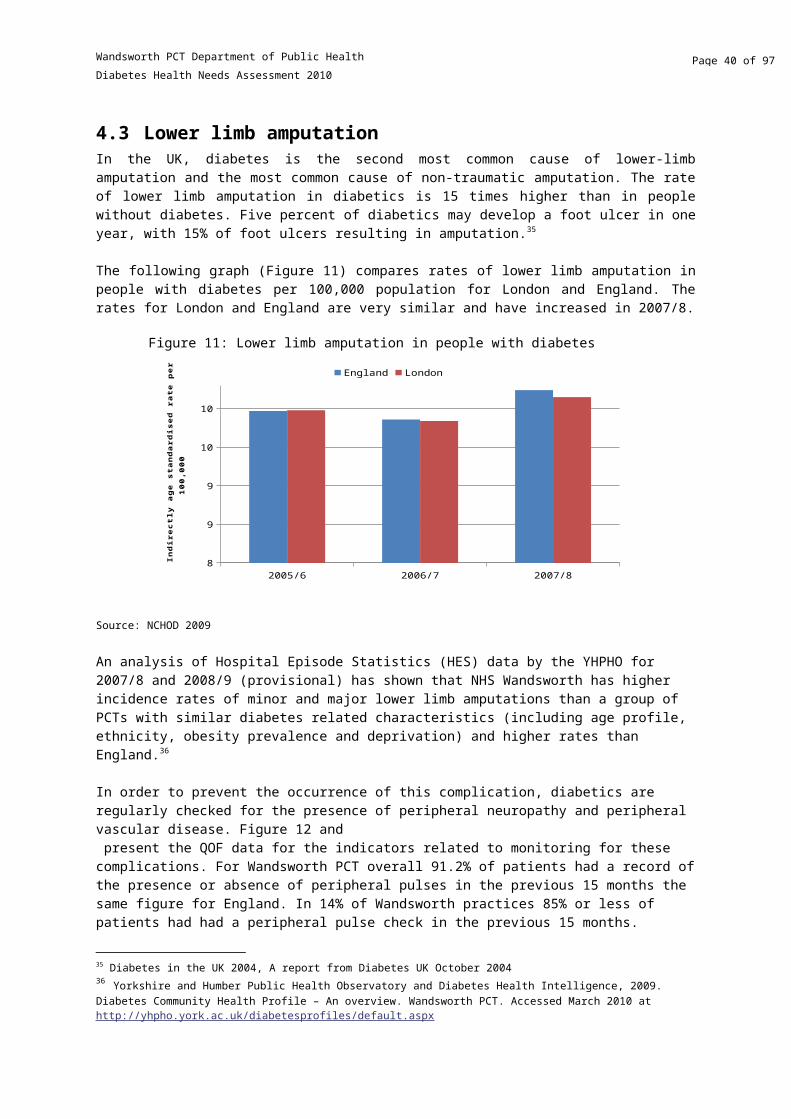
Wandsworth PCT Department of Public Health
Diabetes Health Needs Assessment 2010
4.7 Diabetic ketoacidosis and comaDiabetic ketoacidosis (DKA) occurs almost exclusively in Type I diabetes, and is stimulated by severe insulin deficiency coupled with absolute or relative increases in glucagon. The EURODIAB study found that 8.6% of 3250 insulin - dependent diabetic patients in Europe had been admitted to hospital with a DKA one or more times in the previous 12 months. Common causes of DKA are:
infections (30%) non-compliance with treatment (20%) newly diagnosed diabetes (25%)
The following graph (Figure 21 below) compares rates of admissions (per 100,000 people) in London Strategic Health Authority for DKA and coma compared to England. The graph shows that admission rates for DKA and coma during the period 2005/6 to 2007/8 have decreased in London but increased in England. 2007/8 was the first period in these 3 years where the London rate was lower than the rate for England.
Source: NCHOD 2009
Table 8: Incidence of diabetes related complications
Rate per 1000Wandsworth PCT Blue Group* England
Emergency admissions for ketoacidosis and coma 6.1 1.8 1.1Minor lower limb amputations 5.6 1.3 0.7Major lower limb amputations 5.1 1.5 1.0*A comparative group of PCTs that have similar diabetes related characteristics including age profile, ethnicity, deprivation and obesity levels.Source: Hospital Episode Statistics (HES) The NHS Information Centre for Health and Social Care, 2007/08 and 2008/09 (provisional). Taken from Yorkshire and Humber Public Health Observatory and Diabetes Health Intelligence, 2009. Diabetes Community Health Profile – An overview. Wandsworth PCT.
However Hospital Episode Statistics (HES) data from 2007/08 and 2008/09 (provisional) analysed by the YHPHO (Table 8), show that NHS Wandsworth has higher rates of emergency admissions for ketoacidosis and coma, than a group of PCTs that have similar diabetes related characteristics
Figure 21: Admission rates for DKA and coma
2005/6 2006/7 2007/822
23
24
25
26
27
28
29
England London
Indi
rect
ly a
ge st
anda
rdis
ed ra
te p
er 1
00,0
00
Page 40 of 77

Wandsworth PCT Department of Public Health
Diabetes Health Needs Assessment 2010
(including age profile, ethnicity, deprivation and obesity levels) and higher rates than England.45
4.8 Deaths from diabetesLife expectancy is reduced on average by more than 20 years in type 1 diabetes and up to 10 years in type 2 diabetes. Mortality rates are up to five times higher for people with diabetes compared to those without the disease. It is estimated that diabetes accounts for one in seven deaths in the UK from diabetes.46 Although diabetes is listed as an official cause of death for approximately 7000 people each year in the UK, death certificates often fail to take diabetes as an underlying cause into account.
Figure 22 shows that there have been significant fluctuations in deaths from diabetes during the past 15 years. Mortality rates for males peaked in 2002. Although they dropped to their lowest point in 2004, they have steadily increased since this point in time. Diabetes mortality for females has decreased steadily between 2004 and 2007. Diabetes mortality overall has decreased between 2001 and 2006, but increased between 2006 and 2007.
Source: NCHOD 2009
Table 9 shows that Wandsworth has low standardised mortality ratios compared to England and Wales, lower than in the South West London Sector and London; and in Figure 23 directly standardised mortality rates from diabetes in Wandsworth are lower than PCT’s in the South West London sector, London and England. Croydon PCT has the highest mortality rate from diabetes.
Table 9: Diabetes Standardised Mortality Ratios, <75, 2005-2007, MFP
Male Female PersonsEngland 100 100 100London 120 104 113Wandsworth 49 93 68
45 Yorkshire and Humber Public Health Observatory and Diabetes Health Intelligence, 2009. Diabetes Community Health Profile – An overview. Wandsworth PCT. Accessed March 2010 at http://yhpho.york.ac.uk/diabetesprofiles/default.aspx46 Diabetes in the UK 2004, A report from Diabetes UK October 2004
Figure 22: Trends in diabetes mortality in Wandsworth, MFP All Ages, 1993-2007
1993 1994 1995 1996 1997 1998 1999 2000 2001 2002 2003 2004 2005 2006 20070
2
4
6
8
10
12
14
16
18
Males Females Persons
DSR
/10
0,0
00
Page 41 of 77

Wandsworth PCT Department of Public Health
Diabetes Health Needs Assessment 2010
Croydon 131 138 134Kingston 72 81 75Richmond and Twickenham 96 66 83Sutton and Merton 97 110 102
Source: NCHOD 2009
Page 42 of 77

Wandsworth PCT Department of Public Health
Diabetes Health Needs Assessment 2010
Source: NCHOD 2009
In Wandsworth in 2007 there were 19 deaths due to diabetes. Between 2005 and 2007, 120 years of life were lost due to diabetes (crude rate of 1.53 years of life lost per 10,000 people).47
4.9 Hospital admissionsHospital admission rates show patterns of demand and of events. Figure 24 shows emergency hospital admission rates for diabetes across all South West London boroughs, compared with London and England. Data is only available at borough level as opposed to PCT level. The rate for South West London SHA is lower than the rate for London and England. Croydon has the highest rate for diabetes admissions, followed by Sutton.
47 Mortality from diabetes ICD10 E10-E14, Compendium of clinical health indicators
Figure 24: Directly age standardised emergency hospital admission rates for Diabetes, 2006/7
Croyd
on
Kings
ton upon Th
ames
Mer
ton
Richm
ond upon Thames
Sutton
Wandsw
orth
South
Wes
t London SH
A
London
Engla
nd0
20
40
60
80
100
120
95.7
71.0
65.252.8
80.3
69.2
74.4
92.1
109.9
Rate
per
100
,000
pop
ulati
onFigure 23: Directly standardised mortality rates from diabetes, persons, <75, 2005-2007
Page 43 of 77

Wandsworth PCT Department of Public Health
Diabetes Health Needs Assessment 2010
There are a number of length of stay (LoS) parameters that can be used to compare hospital activity – the commonest is the average LoS which uses the mean value of the interval between date of admission and date of discharge. Table 10 shows average LoS, total number of bed days and total number of admissions for diabetes. The average LoS is highest in Wandsworth, followed by Richmond and Twickenham PCT. The numbers of bed days due to diabetes admissions were highest in Croydon PCT, followed by Wandsworth PCT. The highest numbers of admissions for diabetes were in Croydon PCT. The data presented here were obtained from the Disease Management Information Toolkit which presents data at PCT level on conditions contributing to high numbers of emergency bed days.
Table 10: Average LoS, total number of bed days, total number of admissions for Diabetes, 2006/7
Average LoS
Bed days Admissions
Croydon PCT 7.5 1,988 267Kingston PCT 8.0 654 82Richmond and Twickenham PCT 9.1 483 63Sutton and Merton PCT 6.4 1,309 202NHS Wandsworth 10.6 1,443 141London 7.3 251,314 34,928England 7.5 37,727 5,116
Source: Disease Management Information Toolkit
4.10 Prescriptions for people with diabetesThe total number of items prescribed in primary care for diabetes management in NHS Wandsworth has increased by 18% over the last three financial years. In 2007/8 142,199 items were prescribed increasing to 168,362 in 2009/10. Figure 25 below shows the breakdown of items prescribed for diabetes management in Wandsworth over the last five years and the associated changed in cost. The graph reflects an upward trend in prescriptions of insulin and oral anti-diabetic drugs during this period. However, despite the relatively small increase in the number of prescriptions of insulin, the cost of insulin has increased substantially. Prescriptions of hypoglycaemia drugs (not reflected in the graph due to small numbers) have also increased but only marginally. Prescriptions for screening and monitoring agents have been decreasing, but have increased in the financial year 2009/10. Data from the 2005 Diabetes HNA showed that screening and monitoring agents were the most expensive items. Work has been undertaken with Wandsworth pharmacies to reduce the prescriptions for these items, thereby lowering the cost.
Page 44 of 77

Wandsworth PCT Department of Public Health
Diabetes Health Needs Assessment 2010
Figure 25: Total costs and number of items prescribed for diabetes in primary care
2005/06 2006/07 2007/08 2008/09 2009/10£0.00
£200,000.00
£400,000.00
£600,000.00
£800,000.00
£1,000,000.00
£1,200,000.00
£1,400,000.00
0
20,000
40,000
60,000
80,000
100,000
120,000
140,000
Total Cost, An-tidiabetic Drugs
Total Cost, Dia-betic Diagnostic & Monitoring Agents
Total Cost, Insulin
Total Items, Antidiabetic DrugsTotal Items, Di-abetic Diagnos-tic & Monitor-ing Agents
Total Items, Insulin
Tota
l cos
t
Tota
l num
ber o
f ite
ms p
resc
ribed
Source: EPACT May 2010
The total spend on items for the management of diabetes in primary care has increased over the last three years from just over £2.3 million in 2007/08 to over £2.6 million in 2009/10. Looking in further detail in where the spending has occurred, the costs of newer oral anti-diabetic agents has contributed significantly to the increased drug costs relative to the number of items prescribed (Figure26). Further detail on the breakdown of drugs and insulin types that have contributed to these costs are included in the tables in Appendix 1.
Page 45 of 77

Wandsworth PCT Department of Public Health
Diabetes Health Needs Assessment 2010
Figure 26: Number of prescriptions and total costs of oral anti-diabetic drugs
2005/06 2006/07 2007/08 2008/09 2009/10£0.00
£50,000.00
£100,000.00
£150,000.00
£200,000.00
£250,000.00
£300,000.00
£350,000.00
£400,000.00
0
10,000
20,000
30,000
40,000
50,000
60,000
70,000
80,000
Total Cost , Sulphonylureas
Total Cost, Biguanides
Total Cost, Other Antidiabetic Drugs
Total Items, Sulphonylureas
Total Items, Biguanides
Total Items, Other Antidi-abetic Drugs
Tota
l cos
t
Tota
l num
ber
of it
ems
The figures above do not take into account changes in the population in Wandsworth over the last three years. The mean spend on diabetes drugs per person registered with a GP in Wandsworth (with or without diabetes) has stabilised over recent years, as shown in Figure 27 below.
Source: EPACT 2009
Figure 27: Mean spend on diabetes drugs in Wandsworth PCT per person
2006/7 2007/8 2008/9£5.00
£5.50
£6.00
£6.50
£7.00
£7.50
Me
an
sp
en
d (
£)
Page 46 of 77

Wandsworth PCT Department of Public Health
Diabetes Health Needs Assessment 2010
Mean spend on diabetes drugs per person can be broken down further to look at mean spend by GP practice for each person with diabetes on a practice’s diabetes register. Figure 28 below compares drug spend per person on diabetes registers at each practice with an average for all GP practices in Wandsworth.
Source: EPACT 2009
Figure 28 highlights the variation in spend per person with diabetes at each practice (in 2008/9 range of spend per person was £121- £538). These data are not adjusted for the type of diabetes or the complexity of case management. The variation seen may therefore result from genuine differences in spend per person with diabetes which could be due to the complexity of individual cases, or may be due to inaccuracies in diabetes registers at practices. One of the outliers seen on the graph above is a practice that has now closed and this is therefore difficult to interpret. The mean spend per person on diabetes register (for all practices) for 2008/9 is approximately £227.
4.11 Programme budgetingNHS Wandsworth has in 2009 published a report on programme budgeting for the PCT. Programme budgeting is a retrospective appraisal of where money has been invested in health programmes and allows this expenditure to be compared with clinical outcomes achieved. Programme budgeting enables commissioners to look at activity and outcomes that have been generated in programmes, to monitor investments and to link expenditures with local and national objectives. It also allows commissioners to readjust investment to meet local need and to reduce health inequalities. This should lead to improvements in efficiency, effectiveness and equity.
Expenditure and outcomes for 2007/08 in Wandsworth were compared for 23 programme budgeting categories with six demographically similar PCTs in London (Tower Hamlets, Hammersmith and Fulham, Kensington and Chelsea, Camden, Islington and Westminster). Programme budgeting category 4 represents a group of illnesses relating to endocrine dysfunction (including diabetes, thyroid disease and disease of the adrenal glands), vitamin deficiencies, and metabolic disease (including cystic fibrosis). Diabetes accounts for 52% of the expenditure in this category.
Figure 28: Spend per person on diabetes register by practice versus average spend for all practices
0 5 10 15 20 25 30 35 40 45 50£0.00
£100.00
£200.00
£300.00
£400.00
£500.00
£600.00
Spend per patient on disease registerMean spend for all practices per patient on disease register
Practice ID
Spen
d pe
r per
son
(£)
Page 47 of 77

Wandsworth PCT Department of Public Health
Diabetes Health Needs Assessment 2010
A diagrammatic representation of outcomes and expenditures for the 23 categories is included below. This shows that a combination of high expenditure and poor outcomes is seen for endocrine disease. A further analysis by the Yorkshire and Humber Public Health Observatory, found a similar picture for Wandsworth.48
Figure 29: Programme budgeting data relating to endocrine dysfunction, Wandsworth 2007/8
BenchmarkingIn this category Wandsworth spends more than the other PCTs in its cluster, £38 per head, as opposed to £34 (a difference of 12%), and slightly less than the national average (£39). Expenditure in this area in 2007/2008 has risen by 0.17% compared to the previous year. Forty six per cent (46%) of the diabetes expenditure is spent within primary care through QoF payments for diabetes care and the prescribing costs.
48 Yorkshire and Humber Public Health Observatory and Diabetes Health Intelligence, 2009. Diabetes Community Health Profile – An overview. Wandsworth PCT. Accessed March 2010 at http://yhpho.york.ac.uk/diabetesprofiles/default.aspx
Page 48 of 77

Wandsworth PCT Department of Public Health
Diabetes Health Needs Assessment 2010
Table 11: Expenditure and outcomes in the endocrine category
Expenditure (£ per person)(2007/8)
Diabetes Prevalence (%)(2008/9)
Controlled blood glucose levels in patients with diabetes mellitus (%)(2007/8)
Emergency hospital admissions for diabetes (Rate per 1,000)(2008/9)
Percentage of diabetics screened for diabetic retinopathy (%)(2008/9)
Mortality from diabetes (2005-7)
ENGLAND 39.39 5.10 66.80 0.6 89.74 6.29
London 36.42 5.00 63.34 0.6 86.60 6.39
Cluster 34.25 4.71 63.57 0.5 83.67 6.11
Tower Hamlets 45.12 6.00 58.85 0.5 74.90 10.43Hammersmith and Fulham
32.21 3.82 65.66 0.5 83.40 7.23
Camden 23.79 3.64 64.90 0.5 79.60 6.27
Islington 30.13 4.40 67.91 0.6 84.40 7.47Kensington and Chelsea
25.05 3.29 64.25 0.5 89.20 4.13
Westminster 41.48 3.45 62.74 0.4 86.40 3.02
Wandsworth 38.30 3.63 60.67 0.7 87.806.53(95% CI:4.73-8.34)
The prevalence of diabetes in Wandsworth is lower than the national, London and cluster average. This is to be expected as a result of the younger age profile of the population. Clinical outcomes in Wandsworth are distributed around the cluster average. The coverage of retinal screening is higher than average. On the other hand, mortality from diabetes is just above the cluster average, the proportion of diabetic patients with controlled blood sugar levels is slightly lower than average and rates of emergency admissions to hospital with diabetic conditions are higher than average.
4.12 Stakeholder analysisDiscussions were held with a variety of stakeholders including hospital staff, commissioners, primary care staff, community-based specialist nurses and patient representatives. The following key messages have emerged from these discussions.
An integrated prevention strategy for diabetes was not developed in Wandsworth following recommendations from the last needs assessment and this is recognised as a gap in the response to diabetes.
o Education and health promotion work in the community has occurred in the past but not consistently. There is a need to have a more consistent way of identifying education or health promotion opportunities with high risk groups and educating those with modifiable risk factors for diabetes on how to avoid developing the disease.
o There is a need to develop more ways of identifying undiagnosed diabetics. Although there is much focus on the Health Checks vascular risk assessment programme as a
Page 49 of 77

Wandsworth PCT Department of Public Health
Diabetes Health Needs Assessment 2010
means for doing this, there is recognition that this may not reach all those at risk of developing diabetes.
The availability of a risk assessment tool for diabetes, as is available for vascular disease, would be useful and this will be looked into.
The Diabetes Reference Group has been an important mechanism for the delivery of the interventions to support the Diabetes NSF standards, and also provides a forum for those working in diabetes across community, primary and secondary care to meet and share experiences and discuss problems.
As the delivery of care to diabetic patients in primary care is very dependent on practice nurses, practices are vulnerable to staff turnover and this has an impact on care provided to patients.
A need was expressed for the availability of specialist skills in diabetes management in primary care for Wandsworth. Attempts to recruite a GP with a special interest in diabetes have however been unsuccessful and although the availability of a community diabetologist has been discussed, this not occurred as there are concerns around clinical governance.
There is a lot of support for moving more diabetes care from secondary into primary care however there are concerns that the impact of this shift on patient outcomes should be appropriately monitored.
There is a gap in the provision of psychological services to diabetic patients.
There is insufficient IT capability to support some of the work in the community; in particular community specialist nurses are not able to access EMIS remotely. The available systems also do not allow sufficient capture of data needed to be able to assess their effectiveness and monitor the operational aspects of their work.
In 2009, a series of focus groups were held under the title ‘What is it like being a patient with diabetes in Wandsworth?’ Seventeen people with diabetes participated in these discussions. All the patients except one had type II diabetes and ranged from being newly diagnosed to having had the disease for over twenty years.
The following key points emerged from the discussions held: A need was expressed for more information on diabetes to be made available to the general
public and to diabetes patients, including general information on the signs and symptoms of diabetes and contributory factors like family history etc.
There is also a need to improve awareness of services and their availability, including greater access to self management programmes and support with self management.
The quality of care experienced across the borough was variable. The patients would also like to have a support group based in Wandsworth, which is currently
being taken forward by PALS at NHS Wandsworth. Patients were very supportive of the idea of a handheld patient record (HHR). A previous
small audit of the HHR had suggested that this resource was not required.
Page 50 of 77

Wandsworth PCT Department of Public Health
Diabetes Health Needs Assessment 2010
4.13 Diabetes ENHS Wandsworth has participated in the Diabetes E a web-based, self-assessment, diabetes care performance improvement tool that supports the implementation of the Diabetes NSF. DiabetesE measures and benchmarks the performance of all aspects of a system of diabetes care and actively encourages continuous improvement to meet and surpass the Diabetes NSF standards. Results of the assessment are presented below.
The 3 areas in which the PCT performed worst in this assessment was footcare and lower limb complications, clinical information systems and policy and strategy.
Diabetes E Top 5 Priority Recommendations
1. The PCT should consider giving the diabetes service leaders (clinical and managerial) the authority to manage and control resources in such a way that the diabetes service/network can be organised to deliver the structured programme of care effectively and efficiently.
2. The PCT's structured programme of care should require that all staff involved in the diabetes service/network are trained in the assessment of individual patient learning needs.
3. The diabetes specialist team should work towards introducing patient held records.4. The PCT's structured programme of care should require that all staff involved in the diabetes
service/network are trained in the use of a variety of teaching techniques to meet the different needs personal choices and learning styles of people with diabetes.
5. The PCT should have guidelines that require the agreement of personal care plans with people with newly diagnosed diabetes.
The detailed results of the DiabetesE assessment for Wandsworth and peer PCT comparators are included in Appendix 2.
Table 12: Diabetes E Results Dashboard for PCTLeadership Policy and Strategy Staff
Score: 70% Score: 65% Score: 100%
Prevention of Type 2 Diabetes Identification of People with Diabetes Initial ManagementScore: 91% Score: 87% Score: 92%
Annual Review Metabolic Management Risk Factors for Cardiovascular DiseaseScore: 88% Score: 67% Score: 91%
Hospital Admissions Eye Screening Renal Screening and ManagementScore: 87% Score: 80% Score: 76%
Footcare and Lower Limb Complications Children and Young People with Diabetes PregnancyScore: 33% Score: 100% Score: 83%
Elderly Clinical Information SystemsScore: 95% Score: 63%
Page 51 of 77

Wandsworth PCT Department of Public Health
Diabetes Health Needs Assessment 2010
5. Discussion and recommendationsThe needs assessment highlights the rising diabetes prevalence in the borough and the cost implications of this, as well as inequalities in the way the disease is diagnosed and treated; as is seen across London. As expected ethnic minority populations are particularly affected, contributing to health inequalities in the borough.
The anticipated 15% increase in the prevalence of diabetes over the next 15 years, expected as a result of increases in the incidence of type 1 diabetes, population ageing, population growth and the obesity epidemic will create a substantial health burden for Wandsworth. Increases in the costs of diabetes to the PCT are already evident.
Recently a Diabetes Consensus Panel49 called for greater leadership in tackling obesity and advised that structural changes were needed to address the epidemic and produce radical lifestyle changes in those affected. While the PCT can certainly contribute to the structural changes, these are likely to need to occur at a national level. Locally however innovative approaches are needed to induce behaviour change in diabetics and those at risk of developing the disease.
The needs assessment has identified a large number of people with modifiable risk factors for the development of diabetes. There are a number of activities ongoing within the PCT that will address these risk factors including a strategy to address obesity, and the recent NHS health checks programme.
An integrated diabetes prevention strategy is required to ensure that a comprehensive approach to the prevention of diabetes is adopted within the PCT. This strategy should include education and awareness raising activities. (Diabetes NSF Standards 1 & 2)
As diabetes incidence is increasing and programmes like the NHS health checks begin to identify increasing numbers of people with diabetes, commissioners need to ensure that increased capacity within the health service to cater for these patients is available.
On a range of indicators related to diabetes control as well as the control of other risk factors including cholesterol and BP, Wandsworth performed consistently poorer than the England average as well as the average for a group of PCTs with similar diabetes related characteristics as identified by the YHPHO.50
The review of QoF data suggests that there is unacceptable variation in the quality of care provided to diabetic patients within Wandsworth, with some practices consistently performing worse than others. This is linked to other variations in for example the average spend on diabetes per practice.
49 BMJ 2010;340:c267050 Yorkshire and Humber Public Health Observatory and Diabetes Health Intelligence, 2009. Diabetes Community Health Profile – An overview. Wandsworth PCT. Accessed March 2010 at http://yhpho.york.ac.uk/diabetesprofiles/default.aspx
Page 52 of 77

Wandsworth PCT Department of Public Health
Diabetes Health Needs Assessment 2010
Patients have also highlighted the variability in the quality of care provided across the borough, and differences in the availability of services within primary care.
Further analysis of QoF data and other data sources is required to assess the reasons for this variation, and practices that are underperforming need to be performance managed via commissioning. (Diabetes NSF Standards 4 & 10)
The shift of care from secondary into primary care services is a major development in the delivery of health care to diabetic patients in the borough with the potential to significantly improve the quality of care provided.
To improve patient outcomes and to support the shift of care, access to and attendance at structured patient education programmes (DESMOND, DAFNE and BERTIE) should be improved. (NICE guidance)
Community specialist nurses should be given the necessary IT support to enable an assessment of their effectiveness and impact on patient outcomes. The development of this service is important to the expansion of care for diabetics in the community and the service may need to be expanded in the future to respond to increasing demand and changes in the service organisation.
The impact of these changes on patient outcomes needs to be prospectively evaluated within a monitoring and evaluation framework.
Page 53 of 77

Wandsworth PCT Department of Public Health
Diabetes Health Needs Assessment 2010
6. Appendix 1: Details of trends in drug prescriptions and costsTable 13: Number of prescriptions and costs for top ten insulin types used in Wandsworth
Total number of items* Total costDrug names 2005/06 2006/07 2007/2008 2008/09 2009/10 2005/06 2006/07 2007/2008 2008/09 2009/10Insulin Glargine 3,290 3,442 3,924 4,313 4,464 £175,125.71 £185,591.58 £213,440.78 £237,990.86 £249,996.59Insulin Aspart 2,514 3,230 3,857 4,444 4,915 £129,793.49 £166,605.07 £197,747.33 £226,200.78 £244,661.13Biphasic Protamine Insulin 2,615 3,572 3,916 4,445 4,981 £122,543.68 £170,164.03 £189,059.48 £217,125.41 £242,393.62Insulin Detemir 1,051 1,552 2,062 2,656 3,279 £58,807.89 £93,259.84 £120,577.95 £157,520.79 £197,439.78Biphasic Isophane Insulin 4,533 3,486 2,947 2,522 2,404 £159,684.03 £125,366.03 £113,259.66 £97,207.21 £88,472.28Insulin Lispro 1,404 1,474 1,438 1,466 1,688 £79,376.01 £83,948.04 £77,522.22 £79,279.84 £87,285.55Biphasic Insulin Lispro 1,065 1,048 1,026 958 1,049 £57,983.15 £55,305.87 £51,586.20 £46,007.73 £53,496.44Isophane Insulin 1,872 1,625 1,505 1,273 1,193 £58,787.98 £49,044.97 £47,950.87 £43,576.92 £38,448.60Soluble Insulin (Neutral Insulin) 710 396 334 295 249 £27,243.13 £13,902.37 £13,635.21 £12,055.05 £10,762.79Insulin Glulisine 1 25 129 180 253 £133.92 £1,438.58 £5,177.70 £7,166.97 £10,029.33
*The number of items is used as a measure of volume of prescriptions, and does not take into account the quantity or duration prescribed on prescriptions
Page 54 of 77
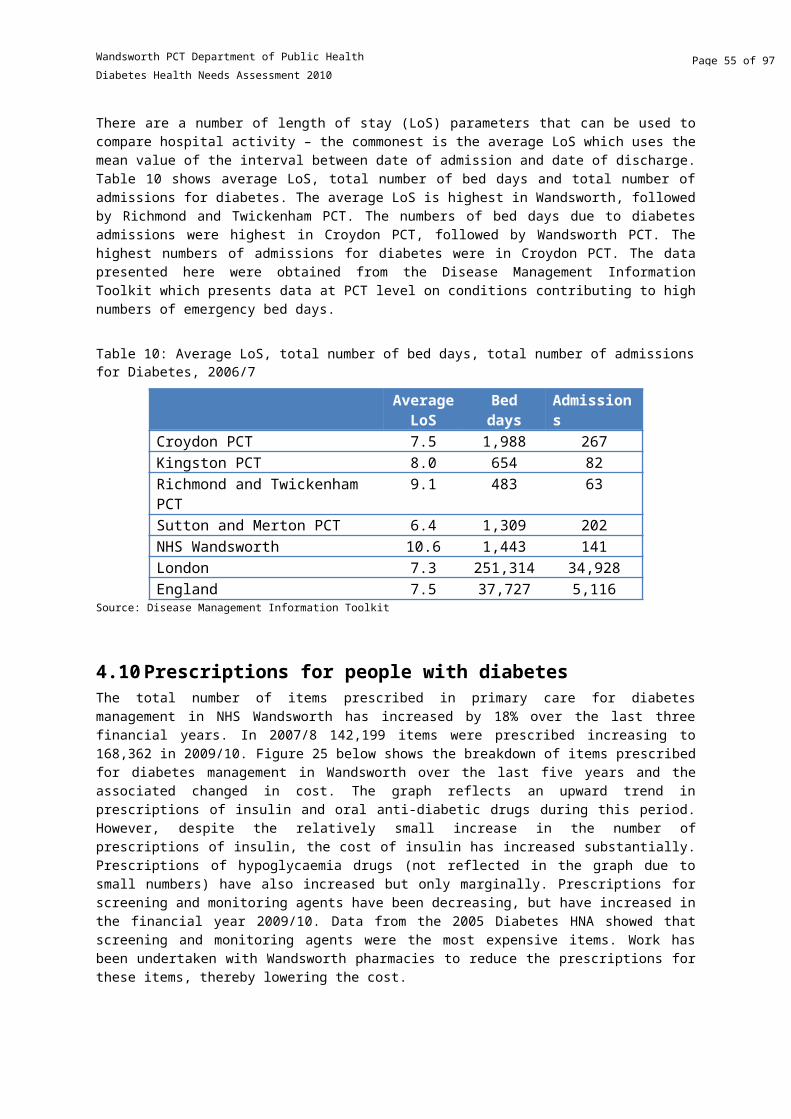
Wandsworth PCT Department of Public Health
Diabetes Health Needs Assessment 2010
Table 14: Number of prescriptions and costs for top ten oral antidiabetic drugs used in Wandsworth in primary care
Total number of items* Total costDrug names 2005/06 2006/07 2007/2008 2008/09 2009/10 2005/06 2006/07 2007/2008 2008/09 2009/10Metformin Hydrochloride 42,644 47,411 53,095 59,112 67,386 £165,800.21 £219,830.13 £210,091.80 £183,626.27 £269,907.02Pioglitazone Hydrochloride 1,527 1,827 2,097 2,616 3,514 £62,578.80 £70,989.92 £82,368.43 £102,696.80 £121,341.05Gliclazide 22,025 23,823 26,353 29,414 33,062 £75,705.24 £86,073.79 £75,235.97 £64,962.28 £83,091.29Sitagliptin 0 0 67 445 1,375 £0.00 £0.00 £3,352.88 £19,226.10 £57,835.13Exenatide 0 0 23 217 635 £0.00 £0.00 £2,125.18 £19,240.00 £56,757.60Rosiglitazone 3,598 4,203 3,701 2,817 1,852 £156,469.47 £181,051.97 £150,950.78 £88,283.64 £50,336.75Metformin Hydrochloride/Rosiglitazone 703 1,930 2,943 2,004 1,365 £25,810.80 £79,560.48 £116,395.45 £66,048.81 £39,862.79Metformin Hydrochloride/Pioglitazone 0 0 47 157 367 £0.00 £0.00 £1,908.60 £5,647.96 £10,969.40Liraglutide 0 0 0 0 79 £0.00 £0.00 £0.00 £0.00 £10,006.17Glimepiride 2,738 2,703 2,489 2,400 2,352 £34,334.23 £29,725.49 £19,477.60 £12,249.49 £8,063.88
*The number of items is used as a measure of volume of prescriptions, and does not take into account the quantity or duration prescribed on prescriptions
Page 55 of 77

Wandsworth PCT Department of Public Health
Diabetes Health Needs Assessment 2010
7. Appendix 2: Detailed DiabetesE results
Table 15: Early identification categories
Organisation Name
Does the PCT have a program for raising
awareness of the signs and symptoms of
diabetes amongst it's population?
Does the PCT have a plan to ensure that health and other
professionals most likely to come into contact with people with
undiagnosed diabetes are aware of the signs and symptoms of
diabetes?
Does the PCT have guidelines for follow-up and regular
testing of people who have previously been found to
have impaired glucose tolerance?
Does the PCT have guidelines for follow-up
and regular testing of women with a history of
gestational diabetes?
Does the PCT have a programme in place for
the early identification of type 2 diabetes?
Tower Hamlets PCT No No No No NoHammersmith and Fulham PCT Yes Yes No Yes YesCamden PCT No Yes Yes Yes YesIslington N/A N/A N/A N/A N/AKensington and Chelsea PCT Yes Yes Yes Yes YesWestminster PCT Yes Yes Yes Yes N/AWandsworth PCT No No Yes Yes N/A rganisation
Name
Table 16: Psychological support categories
Organisation Name
At diagnosis and whenever necessary does the PCT provide psychological support
services for people with diabetes?
Do children and young people with
diabetes have access to a
paediatric trained psychologist/couns
ellor if needed?
% of people who reported that they
needed to see a specialist for
psychological support to cope with their
diabetes in the last 12 months?
Does your local PCT provide psychological
support for adults over 16yrs?
Does your local PCT provide psychological support for children
and young people up to 16 yrs?
Does the PCT make available through
healthcare professionals a local list of support
organisations or voluntary groups for
people with diabetes? Tower Hamlets PCT Yes Yes 5 Yes Yes YesHammersmith and Fulham PCT No Yes 4 Yes Yes YesCamden PCT No Yes 3 No N/A N/AIslington N/A N/A 6 N/A N/A N/AKensington and Chelsea PCT Yes Yes 8 Yes Yes YesWestminster PCT Yes Yes 9 N/A N/A N/AWandsworth PCT Yes Yes N/A N/A N/A N/A
Page 56 of 77

Wandsworth PCT Department of Public Health
Diabetes Health Needs Assessment 2010
Table 17: Education Categories
Organisation Name
Does the PCT have guidelines that
require the initial education and
support of people with newly diagnosed
diabetes?
Does the diabetes
specialist team provide a structured education
programme for newly diagnosed
people with diabetes under
their care?
Is there a structured education
programme for newly diagnosed
children and young people
with diabetes and their families?
Is education adjusted to the development stage of the
child or young person and repeated regularly?
% of people who have ever
participated in an education or
training course on how to help
manage their diabetes? Healthcare
Commission
% of people who have ever wanted to attend an
education or training course about how to help
you manage your diabetes? (Those who
have not participated in a training course).
Healthcare Commission
Has the PCT provided education
over the last 12 months for Type 1
diabetes? Diabetes UK, PCT Progress
Survey
Tower Hamlets PCT Yes Yes Yes Yes 14.357397 27 YesHammersmith and Fulham PCT No Yes No Yes 7.910761 32 N/ACamden PCT Yes Yes Yes Yes 9.314522 39 YesIslington N/A N/A N/A N/A 15.71757 35 N/AKensington and Chelsea PCT Yes Yes Yes Yes 8.803185 39 YesWestminster PCT Yes Yes Yes Yes 16.730591 37 N/AWandsworth PCT Yes Yes Yes Yes N/A N/A N/A
Table 18: Care for Children Categories
Organisation Name
Does the PCT have guidelines for the management of
children and young people with diabetes?
Does the paediatric diabetes specialist team ensure there is planned and agreed (with the young person) transfer of the young person with
diabetes from the paediatric diabetes service to the adult
diabetes service?
Does the local adult diabetes specialist team run a young
persons clinic following transfer?
Do the paediatric diabetes team
members provide education for school staff regarding the identification and management of
children and young people with diabetes?
Do children and young people with
diabetes have access to a paediatric trained
diabetes specialist nurse?
Does the PCT have written protocols for the transfer of young people with diabetes
from paediatric services to adult
services?
Tower Hamlets PCT Yes Yes Yes Yes Yes YesHammersmith and Fulham PCT Yes Yes Yes Yes Yes YesCamden PCT No Yes Yes Yes Yes NoIslington N/A N/A N/A N/A N/A N/AKensington and Chelsea PCT Yes Yes Yes Yes Yes YesWestminster PCT Yes Yes Yes Yes Yes N/AWandsworth PCT Yes Yes Yes Yes Yes N/A
Page 57 of 77

Wandsworth PCT Department of Public Health
Diabetes Health Needs Assessment 2010
Table 19: Telephone Support Categories
Organisation Name
Do children, young people with diabetes
and their families have access to 24 hour
per day emergency telephone contact?
The percentage of people who
reported that telephone support
is available at night
The percentage of people who
reported that telephone support
is available at weekends
The percentage of people who reported
that telephone support is available in
the evenings
The percentage of people who
reported that telephone support
is not provided after hours
Tower Hamlets PCT Yes 7 7 11 69Hammersmith and Fulham PCT Yes 8 10 14 73Camden PCT Yes 7 6 10 76Islington N/A 3 5 12 71Kensington and Chelsea PCT Yes 7 8 12 71Westminster PCT Yes 9 10 20 64Wandsworth PCT Yes N/A N/A N/A N/A
Table 20: Agreed Shared Care Plan Categories
Organisation Name
Does the PCT have guidelines that require
the agreement of personal care plans with
people with newly diagnosed diabetes?
Does the diabetes specialist team agree
care plans with people with diabetes
under their care?
Do people with diabetes under the care of the
diabetes specialist team use a patient held
record?
% of people who rarely or not at all agreed a
plan to manage diabetes when they
received care for their diabetes over 12
months
% of people who sometimes agreed a
plan to manage diabetes when they
received care for their diabetes over 12
months
% of people who almost always agreed
a plan to manage diabetes when they
received care for their diabetes over
12 months
Tower Hamlets PCT Yes Yes No 29 28 43Hammersmith and Fulham PCT No Yes No 42 21 37Camden PCT Yes No No 38 19 42Islington N/A N/A N/A 40 26 34Kensington and Chelsea PCT Yes Yes No 31 29 40Westminster PCT Yes Yes Yes 33 23 44Wandsworth PCT No Yes No N/A N/A N/A
Page 58 of 77

Wandsworth PCT Department of Public Health
Diabetes Health Needs Assessment 2010
Table 21: Healthy eating and physical activity categories
Organisation Name
Does the PCT have guidelines that
require that people with newly
diagnosed diabetes receive dietary advice?
Does the annual review
include the following key components of diabetes
care: dietary management?
Does the annual review include the
following key components of diabetes care:
physical activity?
Where appropriate does the diabetes
specialist team provide advice for
people with diabetes on increasing
physical activity levels?
% of people who felt they knew enough about
healthy eating to help manage
their diabetes
% of people who felt they did not
know enough about healthy eating to help manage their
diabetes
% of people who felt they knew enough about the role
of physical activity to help manage their
diabetes
% of people who felt they did not
know enough about the role of
physical activity to help manage their
diabetes
Tower Hamlets PCT Yes Yes Yes Yes 76 24 60 40Hammersmith and Fulham PCT No Yes Yes Yes 68 32 62 38Camden PCT Yes Yes Yes Yes 71 29 57 43Islington N/A N/A N/A N/A 68 32 58 42Kensington and Chelsea PCT Yes Yes Yes Yes 70 30 61 39Westminster PCT Yes Yes Yes Yes 77 23 68 32Wandsworth PCT Yes Yes Yes Yes N/A N/A N/A N/A
Table 22: Policies and systems for appropriate options for diabetes management
Organisation Name
Is there a specialist multidisciplinary foot
care team to assess and manage limb
threatening diabetic foot disease?
Are people with diabetes who are identified as
having new limb threatening diabetic foot disease assessed within
24 hours?
Is there a policy in place for the
provision of insulin pumps?
Is there access to footcare specialist
within one working day of an
emergency?
Tower Hamlets PCT Yes Yes Yes YesHammersmith and Fulham PCT Yes Yes Yes YesCamden PCT Yes Yes No N/AIslington N/A N/A N/A N/AKensington and Chelsea PCT Yes Yes Yes YesWestminster PCT Yes Yes N/A N/AWandsworth PCT Yes Yes N/A N/A
Page 59 of 77

Wandsworth PCT Department of Public Health
Diabetes Health Needs Assessment 2010
Table 23: Provision of care in different settings
Organisation Name
Does the PCT-wide structured programme of
care include arrangements for the diagnosis and care of
people with diabetes who are housebound or who live in residential and
nursing homes?
Does the PCT have a policy/protocol in
place to ensure appropriate care is
provided in prisons?
Does the PCT have a
policy/protocol in place to ensure
appropriate care is provided in
elderly homes?
Does the PCT have a
policy/protocol in place to
ensure appropriate care for people with mental health
problems?
Does the PCT have a policy/protocol in
place to ensure appropriate care for people with learning
difficulties in residential care?
Does the PCT have a policy/protocol in
place to ensure appropriate care
for children in homes?
Tower Hamlets PCT No N/A No No No NoHammersmith and Fulham PCT Yes Yes No No No NoCamden PCT Yes N/A No No No NoIslington N/A N/A N/A N/A N/A N/AKensington and Chelsea PCT Yes N/A Yes Yes Yes YesWestminster PCT No N/A N/A N/A N/A N/AWandsworth PCT Yes N/A N/A N/A N/A N/A
Table 24: Support for pregnancy and conception
Organisation Name
Does the PCT have guidelines that
require the provision of pre-
conceptual advice for all women with
diabetes of child bearing age?
Does the PCT have guidelines on the
provision of contraceptive
advice and counselling for
younger women with diabetes on the problems of
teenage pregnancy?
Does the structured programme of care require that every pregnant woman with diabetes is offered frequent
medical and obstetric
consultation?
Does the diabetes
specialist team have guidelines
that require optimal
diabetes control during
pregnancy?
Does the diabetes specialist team have guidelines
that require screening for
acceleration of diabetic
complications during pregnancy?
Does the diabetes specialist
team/obstetric team have guidelines for the detection and management of
neonatal hypoglycaemia and
other neonatal complications in babies born to women with
diabetes?
Does the PCT have protocols
in place to support women
for ante-natal care?
Does the PCT have protocols
in place to support women
for preconception
care?
Tower Hamlets PCT No No Yes Yes Yes Yes Yes NoHammersmith and Fulham PCT No No Yes Yes Yes Yes Yes YesCamden PCT No No Yes Yes Yes Yes No NoIslington N/A N/A N/A N/A N/A N/A N/A N/AKensington and Chelsea PCT No No Yes Yes Yes Yes Yes NoWestminster PCT No No Yes Yes Yes Yes N/A N/AWandsworth PCT Yes No Yes Yes Yes Yes N/A N/A
Page 60 of 77

Wandsworth PCT Department of Public Health
Diabetes Health Needs Assessment 2010
Table 25: Commissioning diabetes services
Organisation Name
Has the PCT assessed the needs of all sections of the
population (ie adults, children & young people, elderly,
minority ethnic groups etc)?
Is the PCT's diabetes strategy based on the
needs assessment?
Do the PCT / service leaders have a
mechanism in place to obtain the views of
service users and the wider community about service development?
Has the PCT carried out a Local Needs
Assessment specifically for
Diabetes?
Has the PCT involved diabetes users and
carers in the commissioning
process?
Tower Hamlets PCT Yes Yes No Yes YesHammersmith and Fulham PCT No No Yes Yes N/ACamden PCT Yes Yes Yes Yes NoIslington N/A N/A N/A N/A N/AKensington and Chelsea PCT Yes Yes Yes Yes YesWestminster PCT Yes Yes Yes N/A N/AWandsworth PCT Yes Yes Yes N/A N/A
Table 26: Involving people with diabetes
Organisation NameDo the PCT/service
leaders measure patient satisfaction?
Does the PCT ask people with diabetes their
experiences, views and access to diabetes care?
Tower Hamlets PCT Yes YesHammersmith and Fulham PCT Yes YesCamden PCT Yes N/AIslington N/A N/AKensington and Chelsea PCT Yes YesWestminster PCT Yes N/AWandsworth PCT Yes N/A
Page 61 of 77

Wandsworth PCT Department of Public Health
Diabetes Health Needs Assessment 2010
Care Process and Treatment Target Achievement
Table 27: Key annual processes for diabetes care
Organisation Name HbA1cAll Care
Processes BMIBlood
Pressure Albumin Creatinine Cholesterol Eye exam Foot exam SmokingTower Hamlets PCT 90.57 33.19 90.42 95 51.91 91.81 90.99 61.29 83.25 88.99Hammersmith and Fulham PCT 88.38 40.87 86.88 92.67 68.76 89.13 88.54 67.1 75.62 78.83Camden PCT 90.84 44.55 89.41 94.78 69.39 91.9 91.69 66.98 79.87 85.73Islington 88.65 45.76 87.7 93.37 69.71 89.45 88.91 66.64 81.2 86.05Kensington and Chelsea PCT 90.87 42.99 91.64 94.48 61.83 89.69 89.5 74.43 84.46 83.37Westminster PCT 87.22 38.15 88.76 93.94 64.14 87.98 87.95 66.96 72.25 83.37Wandsworth PCT 90.23 52.33 89.07 94.26 73.13 89.85 89.07 73.71 81.98 84.63
Table 28: All care processes recorded (%) by PCTs in the SHA
Organisation Name% of registered
patientsTower Hamlets PCT 33.19
Hammersmith and Fulham PCT 40.87Camden PCT 44.55
Islington 45.76Kensington and Chelsea PCT 42.99
Westminster PCT 38.15Wandsworth PCT 52.33
Page 62 of 77

Wandsworth PCT Department of Public Health
Diabetes Health Needs Assessment 2010
Figure 31: Target percentages time trend
0
10
20
30
40
50
60
70
80
90
100
2004/2005 2005/2006 2006/2007 2007/2008
NICE Cholesterol < 5.0 mmol/l over time
NICE Diastolic < 100 and Systolic < 160 mm Hg
NICE Systolic < 160 mm Hg
NICE Diastolic < 100 mm Hg
NICE Diastolic <= 75 and Systolic < 135 mm Hg
NICE Systolic <= 135 mm Hg
NICE Diastolic <= 75 mm Hg
NICE HbA1c < 6.5%
NICE HbA1c <= 7.5%
Figure 30: Time trends
0
10
20
30
40
50
60
70
80
90
100
2004/2005 2005/2006 2006/2007 2007/2008
HbA1c
BMI
Blood Pressure
Albumin
Creatinine
Cholesterol
Eye exam
Foot exam
Smoking
All Care Processes
Page 63 of 77

8. Appendix 3: Diabetic Retinal Screening equity audit for NHS Wandsworth
1. Introduction
Type 2 diabetes is the leading cause of blindness in the United Kingdom among the working age population. However early detection of sight-threatening diabetic retinopathy and treatment (usually with laser therapy) halves the risk of sight loss. The diabetic retinal screening programme (DRS) aims to reduce the risk of sight loss amongst people with diabetes, by the prompt identification and effective treatment, if necessary, of sight threatening diabetic retinopathy, at the appropriate stage during the disease process. The National Retinal Screening Programme began in 2002.
The Priorities and Planning Framework 2003 – 2006 (PPF) and Diabetes NSF Delivery Strategy both include a target that “by 2006, a minimum of 80% of people with diabetes to be offered screening for the early detection (and treatment if needed) of diabetic retinopathy as part of a systematic programme that meets national clinical standards, rising to 100% coverage of those at risk of retinopathy by end of 2007.”
2. Delivery of retinal screening in WandsworthNHS Wandsworth and NHS Richmond currently jointly commission a diabetic retinal screening service from St Georges NHS Acute Trust, Moorfields Eye hospital and the Kingston Hospital NHS Trust (Royal Eye Unit).
The screening administration is currently based at St Georges Hospital (SGH) and all GPs in NHS Wandsworth and NHS Richmond refer patients into the SGH network. The administration was recently transferred to St Georges Hospital. Prior to this, patients could be screened at any service provider and there was no central data repository that allowed proper data collection and follow up of patients who had not attended screening. Operation of a call-recall system is the responsibility of the SGH Diabetic Retinopathy Screening Office.
Patients are then invited for screening at Queen Mary’s Roehampton, St John’s Therapy Centre, St Georges Hospital or Teddington Memorial Hospital. Patients with referable diabetic retinopathy and ungradable images are referred either to Moorfields Eye Hospital or Kingston Hospital Royal Eye Unit.
All patients aged eighteen years and older who have a diagnosis of diabetes will be identified primarily from GP diabetic registers. All patients with a diagnosis of diabetes aged between 12 and 17 are identified from searches of GP patient lists. SGH has also recently undertaken a list cleaning exercise to optimise the running of the programme. The population eligible for screening is as follows:
i. Inclusionsa. Every person with diabetes aged 12 years and over who is registered with a general
practice in Wandsworth and Richmond (approximately 15, 000 patients)b. To support inclusion and reduce inequalities among eligible patients those with learning
disabilities, from ethnic minorities, those with mental health problems and those that are homeless are supported to ensure attendance for screening
ii. Exclusionsa. A person with diabetes who has made his or her own informed choice that he or she no
longer wishes to be invited for screening.

b. A person with diabetes who is under the age of 12 years (in which case he or she should not have been referred to the programme until they have reached the eligible age)
c. A person with diabetes who does not have perception of light in either eye; d. A person with diabetes who is terminally ill; e. A person with diabetes has a physical or mental disability preventing either screening or
treatment; f. A person with diabetes who is currently under the care of an ophthalmologist for the
treatment and follow-up management of diabetic retinopathy, and then only for that period
3. What is an equity audit?Health equity audit is a process by which partners systematically review inequities in the causes of ill health, and access to effective services and their outcomes, for a defined population and ensure that further action is agreed and incorporated into policy, plans and practice. Actions taken are reviewed to assess whether inequities have been reduced. A health equity audit focuses on how fairly resources are distributed in relation to the health needs of different groups. The overall aim is not to distribute resources equally, but rather in relation to need. Changes in investment and services as a result of health equity audits would aim to reduce avoidable health inequalities.
There is an important distinction between health equity audit concerned with health issues and those focused on health care.
4. Why do an equity audit?This equity audit was conducted in order to determine if there were any differences in the uptake of retinal screening by the diabetic population of Wandsworth that may contribute to health inequalities in the borough. It will be used to identify groups that may not be taking up screening and to inform an intervention strategy to address poor uptake in these groups.
A brief literature review revealed that there are differences in the incidence of diabetic retinopathy by ethnicity and that there are variations in the quality of care provided to diabetic patients by deprivation. (Raymond, Varadhan, Reynold, & al, 2009) (Hippisley-Cox, O'Hanlon and Coupland 2004)
A primary care–based study showed that U.K. resident South Asians with diabetes had a significantly higher prevalence of any retinopathy and maculopathy than indigenous white Europeans. (Raymond, Varadhan, Reynold, & al, 2009) The South Asian group in this study was also younger at diagnosis and had a shorter duration of diabetes. This differential risk may be explained by different levels of the potentially modifiable risk factors hyperglycemia and hypertension, with varying diabetes duration possibly reflecting earlier disease onset in these population groups.
Studies have also shown that practices in areas of high deprivation and with high ethnic minority populations, have poorer achievement with respect to indicators of quality of diabetic care, including the proportion of patients who have been recorded as having retinal screening. (Hippisley-Cox, O'Hanlon and Coupland 2004)
Work done in other areas has shown that working age people and males may have more difficulty accessing screening and therefore have lower uptake. (Coates 2010)

5. MethodsIn further investigating the factors that may influence the uptake of retinal screening, the following were considered; age, sex, ethnicity, duration of diagnosis, type of diabetes, primary care provider and deprivation. Data were received from the SGH DRS administration office for the period 01/04/2009 to 31/03/2010 for all patients on primary care diabetic registers in Wandsworth. This included data on eligibility for screening, service providers, age, sex and place of residence represented by postcode. Additional data were extracted from EMIS on primary care provider, ethnicity, diabetes diagnosis and diabetes duration. Data were also added on ward and postcode level deprivation. These data were analysed in STATA 10. 6. Results of retinal screening equity auditThere were a total of 12073 patients from Wandsworth who were included on the retinal screening list during the period 01/04/2009 to 31/03/2010. There were 46 patients under the age of 12 who were excluded from the dataset leaving a total of 12,027 patients.
Table 29: Status of all Wandsworth patients on diabetes registers in primary care
Status Number %Active 10,438 86.8Diabetes 'resolved' 51 0.4Housebound 10 0.1Not suitable for screening (reason in patient notes) 9 0.1Patient opted out of screening 10 0.1Unable to contact 38 0.3Screened at another service provider 32 0.3Under care of another eye unit 1439 12.0Total 12,027 100.0
6.1 Demographic data of all patients on the listThe age distribution of the eligible patients (including those who had an active status, those who were screened at another service provider and those under the care of another eye unit) is shown in the figure below.
Figure 32: Age distribution of male and female patients eligible for retinal screening
12-17 18-29 30-39 40-49 50-59 60-69 70-79 80-89 >900
200
400
600
800
1000
1200
1400
1600
1800
MaleFemaleUnknown
Age group (years)
Num
bers
of p
atien
ts

Of the 10,438 patients who had an ‘active’ status, i.e. they should have been screened at St Georges Hospital Trust, 6,214 (59.5%) of patients were screened once, and 411 (3.9%) were screened between 2 and 4 times during the period. 3,813 patients were not screened at all. Of the 3,813 who were not screened at all, 2132 (55.9%) were not sent an appointment date. In 2010 all Wandsworth patients who were eligible for screening were transferred from other service providers to St Georges. These patients were added to the screening list in February and appointments had not yet been generated for them. Of those who had been screened at the other service providers not all this data was transferred to St Georges. As the inclusion of these 2132 patients will not accurately reflect the proportion o those who take up screening and those who don’t, for the remainder of the analysis they have been excluded.
Table 30: Number of screens conducted per eligible patient at St Georges
Number of screens conducted per patient N Percent0 3,813 36.531 6,214 59.532 351 3.363 55 0.534 5 0.05
Total 10,438 100
6.2 Age and sex
Data on sex were not available in 549 (4.6%) of patients. In both men and women, the proportion of patients screened increases with age to reach a peak in the 60-69 year age group and decreases thereafter. The lowest proportion of patients screened is in the 18-29 year age group.
Figure 33: Proportion of patients screened by age group and sex

12-17 18-29 30-39 40-49 50-59 60-69 70-79 80-89 >900
10
20
30
40
50
60
70
80
90
MalesFemales
Age groups (years)
Prop
ortio
n of
pati
ents
scre
ened
6.3 Screening by type of diabetes
Data were available on the type of diabetes diagnosed for 11,332/12,026 (94.2%) of all Wandsworth patients. The vast majority of patients are type 2 diabetics. For approximately 9% of patients the type of diabetes was not clearly specified.
Table 31: Type of diabetes in patients on diabetes registers in primary care in Wandsworth
TotalType 1 diabetes mellitus 848 (7.5%)Type 2 diabetes mellitus 9,502 (83.9%)Diabetes mellitus NOS 975 (8.6%)Secondary diabetes mellitus 7 (0.06%)Total 11,332 (100%)
Of the 7,884 patients eligible for screening at St Georges on whom the data on type of diabetes were available, 80.8% were screened within the year. A much lower proportion of patients with type 1 than type 2 diabetes were screened (66.7% vs. 81.8%).
Table 32: Proportions of patients screened by type of diabetes
Type of diabetes Not screened Screened TotalType 1 diabetes mellitus 157 (33.3%) 315 (66.7%) 472Type 2 diabetes mellitus 1,244 (18.2%) 5,585 (81.8%) 6,829Diabetes mellitus NOS 109 (18.8%) 470 (81.2%) 579Secondary diabetes mellitus 2 (50.0%) 2 (50.0%) 4Total 1512 (19.2%) 6,372 (80.8%) 7,884
The patterns of uptake of screening by age group were similar in those who had type 1 and type 2 diabetes with the 18-29 year age group still having the lowest uptake. For all types of diabetes, men have marginally higher uptake of screening than women (Figure 35).

Figure 34: Uptake of screening by age group and type of diabetes
12-1
718
-29
30-3
940
-49
50-5
960
-69
70-7
980
-89
>90
12-1
718
-29
30-3
940
-49
50-5
960
-69
70-7
980
-89
>90
12-1
718
-29
30-3
940
-49
50-5
960
-69
70-7
980
-89
>90
Type 1 diabetes mellitus Type 2 diabetes mellitus Diabetes NOS
0
10
20
30
40
50
60
70
80
90
100
Age group (years)
Prop
ortio
n of
pati
ents
scre
ened
Figure 35: Uptake of screening by sex and type of diabetes
Mal
e
Fem
ale
Unkn
own
Tota
l
Mal
e
Fem
ale
Unkn
own
Tota
l
Mal
e
Fem
ale
Unkn
own
Tota
l
Type 1 diabetes mellitus Type 2 diabetes mellitus Diabetes NOS
0102030405060708090
100
Sex and type of diabetes
Prop
ortio
n of
pati
ents
scre
ened
6.3 Duration of diabetes and uptake of screening by type of diabetes
Table 33 and Figure 36 show the numbers and proportions of patients who have been screened by the duration of their diabetes diagnosis and the type of diagnosis. Patients with type 1 diabetes have lower proportions of screening for all durations of diagnosis.

Table 33: Numbers of patients screened by type of diabetes and duration of diabetes diagnosis
Type 1 diabetes mellitus Type 2 diabetes mellitus Diabetes NOSNot screened Screened Total Not screened Screened Total Not screened Screened Total
<2 years 9 23 32 162 789 951 11 36 472-5 years 16 36 52 305 1,488 1,793 15 78 93
5-10 years 29 60 89 380 1,801 2,181 28 154 18210-20 years 51 94 145 207 889 1,096 40 150 190>20 years 52 102 154 190 618 808 15 52 67
Total 157 315 472 1,244 5,585 6,829 109 470 579
Figure 36: Proportion of patients screened by type of diabetes and duration of diabetes diagnosis
<2 years 2-5 years 5-10 years
10-20 years
>20 years
Total0
10
20
30
40
50
60
70
80
90
Type 1 diabetes mellitusType 2 diabetes mellitusDiabetes NOS
Duration of diabetes diagnosis
Pro
po
rtio
n o
f p
atie
nts
scr
ee
ne
d

6.5 Screening by ethnicity
Data to determine ethnicity were extracted from EMIS for all patients included in the screening. Unfortunately for 86.2% of patients, data on ethnicity were not recorded. Therefore ethnicity was not used further in this analysis.
6.6 Screening by GP practice
There is substantial variation in the uptake of screening by GP practice with the proportion of patients screened ranging from 13% to 90%.
Figure 37: Proportion of patients screened by GP practice
The F
ranc
iscan
Surg
ery
Nigh
tinga
le Pr
actic
eDr
How
ard F
reem
an &
Pa
rtner
sM
itcha
m La
ne Su
rger
yBa
lham
Hill
Med
ical
Prac
tice
Bedf
ord H
ill Fa
mily
Pr
actic
eOp
en D
oor S
urge
ryFu
rzedo
wn Pr
imar
y Car
e Ce
ntre
Balh
am Pa
rk Su
rger
yTo
oting
Sout
h Med
ical
Cent
reSa
i Med
ical C
entre
The G
reys
wood
Prac
tice
Wat
erfal
l Hou
seTr
inity
Med
ical C
entre
Balh
am H
ealth
Cent
reTo
oting
Bec S
urge
rySt
reat
ham
Park
Surg
ery
Batte
rsea F
ields
Prac
tice
Lave
nder
Hill
Gro
up
Prac
tice
Brid
ge La
ne H
ealth
Cent
reFa
lcon R
oad M
edica
l Ce
ntre
Chatf
ield M
edica
l Cen
treTh
urlei
gh Ro
ad Pr
actic
eLa
vend
er H
ill Su
rger
yBa
tterse
a Rise
Gro
up
Prac
tice
Quee
nsto
wn Ro
ad Su
rger
yTh
e Her
itage
Med
ical
Cent
reDr
Begg
's Sur
gery
- St
John
'sW
ands
worth
Med
ical
Cent
reElb
orou
gh St
reet
Prac
tice
Broc
kleba
nk G
roup
Pr
actic
eTh
e Sur
gery
- St J
ohn's
Gran
ville
Road
Surg
ery
Trian
gle Su
rger
ySo
uthfi
elds G
roup
Pr
actic
eEa
rlsfie
ld Pr
actic
eCh
artfi
eld Su
rger
yDa
nebu
ry Av
enue
Surg
ery
St. P
aul's
Cotta
ge Su
rger
yHe
athb
ridge
Surg
ery
The A
lton P
racti
ceTu
dor L
odge
Hea
lth
Cent
rePu
tney
mea
d Med
ical
Cent
reIn
ner P
ark R
oad S
urge
ryTh
e Roe
ham
pton
Surg
ery
May
field
Surg
ery
Balm
uir G
arde
ns Su
rger
y
0102030405060708090
100

The uptake of screening was not influenced by the numbers of diabetic patients on diabetes registers at each practice. Figure 38 shows the proportion of patients screened with practices arranged in order of largest to smallest numbers of diabetic patients.
Figure 38: Proportions of patients screened at GP practices with largest (left) to smallest (right) numbers of diabetic patients

Dr Howard
Freem
an & Partners
Chatfield Medica
l Centre
Earlsfi
eld Prac
tice
The Greysw
ood Practice
Bedford Hill Fam
ily Prac
tice
Balham
Park Surge
ry
Putneymead
Medical Centre
Waterfal
l House
Chartfield
Surgery
The Herit
age Medica
l Centre
Mayfield Su
rgery
Mitcham
Lane Su
rgery
Tudor Lodge H
ealth Centre
Wandsworth Medical
Centre
Bridge L
ane Healt
h Centre
Furzedown Prim
ary Care C
entre
Inner Park
Road Surge
ry
St. Paul's C
ottage Su
rgery
Balham
Health Centre
Thurleigh Road Practice
Sai Medical
Centre
Dr Begg's Su
rgery -
St John's
Granvill
e Road Surgery
Nightingale
Practice
0102030405060708090
100
GP Practice with largest (left) to smallest (right) numbers of patients with diabetes
Prop
ortio
n of p
atien
ts scr
eene
d
6.7 Screening by ward
For those patients that live within Wandsworth, the proportion of patients screened by ward was examined with the wards ranked according to their deprivation score, i.e. Latchmere the most deprived ward to Thamesfield the least deprived ward. This shows that there is no clear pattern in the uptake of screening by deprivation in Wandsworth wards.

Figure 39: Uptake of retinal screening by ward in Wandsworth, with wards ranked according to deprivation score
Latc
hmer
e
Roeh
ampt
on
Quee
nsto
wn
Tooti
ng
Grav
eney
Furz
edow
n
St M
ary's
Par
k
Wes
t Hill
Shaft
esbu
ry
Bedf
ord
Earls
field
Wes
t Put
ney
Fairfi
eld
Nigh
tinga
le
Balh
am
East
Put
ney
Wan
dsw
orth
Com
mon
Sout
hfiel
ds
North
cote
Tham
esfie
ld
0102030405060708090
100
Wards ranked according to deprivation score
Prop
ortio
n of
pati
ents
scre
ened
There were an additional 357 patients who lived outside of Wandsworth. The 10 wards with the largest numbers of patients and the corresponding proportion of patients screened are listed in table 6 below, the remaining 49 wards had less than 6 patients in each and are not listed here.
Table 34: Proportions of patients screened in wards outside of Wandsworth
Ward Proportion of patients screenedFigge's Marsh 85.1Lavender Fields 83.7Colliers Wood 86.1Cricket Green 88.6Pollards Hill 85.0Longthornton 100.0Bensham Manor 72.7Ravensbury 90.0Broad Green 75.0St Helier 100.0

6.8 Uptake of screening by deprivation score
Deprivation scores by ward were divided into deciles and the proportions of patients in each decile who were screened was examined. Again this did not show any difference in uptake of retinal screening by deprivation score.
Figure 40: Uptake of retinal screening in deciles of wards ranked according to deprivation score
1 2 3 4 5 6 7 8 9 100
10
20
30
40
50
60
70
80
90
100
79.6 79.2 81.4 81.4 80.2 79.9 80.977.3 77.6 77.7
Decile
Prop
ortio
n of
pati
ents
scre
ened

7. Discussion
In this analysis of uptake of diabetic retinal screening, lower age in particular the 18 to 29 year age group, and a diagnosis of type 1 diabetes were associated with a reduced uptake of screening. This is consistent with the findings of other studies that have identified younger age and type 1 diabetes to be factors that have influenced the utpake of screening. (Millett and Dodhia 2006)
Deprivation was not association with a lower uptake of screening in Wandsowrth, despite being a factor associated with reduced uptake in other studies. (Millett and Dodhia 2006) (Leese, et al. 2008)
The lack of data on ethnicity did not allow us to assess the impact of this on screening uptake. There was also no clear pattern associated with duration of diagnosis.
There was substantial variation in the uptake of screening by GP practice, although this was not associated with the size of diabetic registers at each practice. There have been recent changes in the administration of the programme which should result in better uptake as there is now a systematic call-recall system in operation from St Georges Hospital.
8. Recommendations
In order to understand the reasons behind the low uptake amongst younger patietns and type 1 diabetics further qualitative work is required to explore the reasons behind low uptake and to inform an intervention strategy.
Data on ethnicity of diabetic patients is poor both in the primary care database and on the database currently used at SGH. Ethnicity needs to be recorded by the retinal screening service provider so that it can be considered in subsequent analyses. It is possible that language or other barriers related to ethnicity could be responsible for poor uptake among certain groups. This is particularly important to assess given the higher prevalence of diabetic retinopathy among ethnic populations.
The literature suggests that primary care providers can have a significant impact on the uptake of screening. (Dervan, et al. 2008) The variation in screening uptake by primary care provider is therefore particularly worrying and a targeted intervention focussed on poorly performing practices is needed.
Other interventions that have been used across the country have included measures to improve accessibility including increased numbers of weekend and evening clinics, more screening locations and increasing transport options; improved communication and advertising of the screening programme, and the use of primary care providers to promote the uptake of screening.
The prevalence of diabetes by ward needs to be taken into account in any decisions regarding siting of retinal screening services. The provision of information on retinal screening for diabetes should be part of other general health promotion activities undertaken by NHS Wandsworth.
9. References
Coates, RA. Diabetic retinopathy and equity audit. NHS Southampton. Southhampton: NHS Southampton, 2010.
Dervan, E., D. Ellis, L. Flynn, A. Staines, and D. O'Shea. “Factors that influence the patient uptake of diabetic retinopathy screening.” Ir J Med Sci 137 (2008): 303-309.

Hippisley-Cox, J., S. O'Hanlon, and C. Coupland. “Association of deprivation, ethnicity, and sex with quality indicators for diabetes: population based survey of 53 000 patients in primary care.” BMJ 329 (2004): 1267-70.
Leese, GP., P. Boyle, Z. Feng, A. Emslie-Smith, and JD. Ellis. “Screening Uptake in a Well-Established Diabetic Retinopathy Screening Program. The role of geographical access and deprivation.” Diabetes Care 31 (2008): 2131-2135.
Millett, C., and H. Dodhia. “Diabetes retinopathy screening: audit of equity in participation and selected outcomes in South East London.” J Med Screen 13 (2006): 152–155.
Raymond, NT., L. Varadhan, DR. Reynold, et al. “Higher Prevalence of Retinopathy in Diabetic Patients of South Asian Ethnicity Compared With White Europeans in the Community. A cross sectional study.” Diabetes Care, 2009: 410-415.