Contents Plant and Soil Science AGRICULTURAL AND FOOD SCIENCE
103
The Scientific Agricultural Society of Finland MTT Agrifood Research Finland www.mtt.fi/afs AGRICULTURAL AND FOOD SCIENCE Vol. 19, No. 1, 2010 Agricultural Economics Agricultural Engineering Animal Science Environmental Science Food Science Horticulture Plant and Soil Science
Transcript of Contents Plant and Soil Science AGRICULTURAL AND FOOD SCIENCE

Vol. 19, 1 (2010) 1-517AG
RIC
ULTU
RAL AN
D FO
OD
SC
IEN
CE
The Scientific Agricultural Society of Finland
MTT Agrifood Research Finland www.mt t .fi /a fs
AGRICULTURAL AND FOOD SCIENCE
A G R I C U L T U R A L A N D F O O D S C I E N C EVol. 19, No. 1, 2010
ContentsP l a n t a n d S o i l S c i e n c eLindqvist, I., Lindqvist, B., Tiilikkala, K., Hagner, M. and Penttinen, O.-P.
Birch tar oil is an effective mollusc repellent: field and laboratory experiments using Arianta arbustorum (Gastropoda: Helicidae) and Arion lusitanicus (Gastropoda: Arionidae)
1
Hagner, M., Pasanen, T., Lindqvist, B., Lindqvist, I., Tiilikkala, K., O.-P., Pent-tinen and Setälä, H.
Effects of birch tar oils on soil organisms and plants 13
Hagner, M., Penttinen, O.-P., Pasanen, T., Tiilikkala, K. and Setälä, H.
Acute toxicity of birch tar oil on aquatic organisms 24
Sooväli, P. and Koppel, M. Efficacy of fungicide tebuconazole in barley varieties with dif-ferent resistance level
34
Tamm, K., Võsa, T., Loko, V., Kadaja, J., Vettik, R. and Olt, J.
The impact of distance to the farm compound on the options for use of the cereal plot
43
Pradhan, S. K., Pitkänen, S. and Heinonen-Tanski, H.
Fertilizer value of urine in pumpkin (Cucurbita maxima L.) cultivation
57
Ochmian, I., Grajkowski, J. and Skupień, K.
Effect of substrate type on the field performance and chemical composition of highbush blueberry cv. Patriot
69
Väre, M., Pietola, K. and Weiss, C.R. The irrelevance of stated plans in predicting farm successions in Finland
81
Contents Vol. 18 (2009)
Aknowledgements of referees
96
98
ISSN e lec t ronic ed i t ion 1795-1895
V o l . 1 9 , N o . 1 , 2 0 1 0
A g r i c u l t u r a l E c o n o m i c s
A g r i c u l t u r a l E n g i n e e r i n g
A n i m a l S c i e n c e
E n v i r o n m e n t a l S c i e n c e
F o o d S c i e n c e
H o r t i c u l t u r e
P l a n t a n d S o i l S c i e n c e

AgriculturAl AND FOOD ScieNce
Agricultural and Food Science publishes original reports on agriculture and food research. The papers, which are of international interest but feature a northernperspective, cover a wide range of topics in basic and applied research. Submissionsare internationally refereed. Review articles and research notes will also be considered. Readers are welcome to send their comments to the journal (Letter to the Editor).
PublishersThe Scientific Agricultural Society of Finland
MTT Agrifood Research Finland
editorial boardJuha Helenius - Editor
Seppo AhvenjärviTapani Alatossava
Paula ElomaaMarita Laukkanen
Eila TurtolaKaisa Kuoppala - Associate editor
AddressAgricultural and Food Science
Editorial OfficeMTT Agrifood Research Finland
FI-31600 Jokioinen, Finlandhttp://www.mtt.fi/afs
From volume 19 the publication of Agricultural and Food Science is available as an Open Access journal, free of charge to the user. The issues and articles published since volume 11 have also been transferred to the Open Access mode. Publishing continues in electronic format only, available on the journal's web-pages (www.mtt.fi/afs), or via database links or where the journal is indexed. The printing of special issues will still be considered should the applicant offer to provide the resources.
Single printed issues up to volume 18 may be obtained from Bookstore Tiedekirja, Kirkkokatu 14, FI-00170 Helsinki, Finland, e-mail: [email protected]. The price of a single issue is 17 + VAT within the EU.
The journal is indexed by the following databases: AGRIS, BIOSIS, CAB Abstracts,Cambridge Scientific Abstracts, Current Awareness in Biological Sciences, Current
Contents, FSTA, Pascal, Scopus, Science Citation Index, ISI Web of Science and Ingenta.
Copyright: Agricultural and Food Science
Printed in Finland by Tampereen Yliopistopaino - Juvenes Print LTD
A G R I C U L T U R A L A N D F O O D S C I E N C E
Vol. 19(2010): 1–12.
1
© Agricultural and Food Science Manuscript received March 2009
Birch tar oil is an effective mollusc repellent: field and laboratory experiments using Arianta arbustorum
(Gastropoda: Helicidae) and Arion lusitanicus (Gastropoda: Arionidae)
Isa Lindqvist1*, Bengt Lindqvist1, Kari Tiilikkala1, Marleena Hagner2, Olli-Pekka Penttinen2, Tiina Pasanen2 and Heikki Setälä2
1MTT Agrifood Research Finland, Plant Production Research, Rillitie 1, FI-31600 Jokioinen, Finland,*e-mail: [email protected]
2Department of Ecological and Environmental Sciences, University of Helsinki, Niemenkatu 73, FI-15140 Lahti, Finland
Populations of two molluscs, the land snail Arianta arbustorum and the Iberian slug Arion lusitanicus, have increased substantially in many places in the northern Fennoscandia in recent years. This has resulted in considerable aesthetic and economic damage to plants in home gardens and commercial nurseries. Birch tar oil (BTO), is a new biological plant protection product, and was tested against these molluscs. In this study we examined whether 2 types of BTO, used either alone, mixed together, or mixed with Vaseline®, could be applied as 1) a biological plant protection product for the control of land snails by direct topical spray application, 2) as a repellent against snails when painted on a Perspex® fence, and 3) as a repellent against slugs when smeared on pots containing Brassica pekinensis seedlings. Both the fences and the pots with seedlings were placed in each field with a high population of the target organism.When applied as a spray on snails, BTO did not act as a toxic pesticide but rendered the snails inactive for a period of several months. The BTO barriers were effective in repelling both snails and slugs. However, the repellent effect of BTO alone against the molluscs was short-term. Repeated treatments were required to keep the slugs away from the plants and we found that the interval between treatments should not exceed two weeks. A collar fastened around the rim of the pots, combined with the BTO treatment, did not give any additional benefit in hindering slugs from invading the plants. Most noticeably, the BTO+Vaseline® mixture prevented the land snails from passing over the treated fences for up to several months. The results of these experiments provide evidence that BTO, especially when mixed with Vaseline®, serves as an excel-lent long-term repellent against molluscs.
Key-words: birch tar oil, biocontrol, biological plant protection product, Arianta arbustorum, Arion lusi-tanicus, land snail, Spanish slug, Iberian slug, repellent, mollusc.

A G R I C U L T U R A L A N D F O O D S C I E N C E
Lindqvist, I. et al. Birch tar oil as a repellent
2
A G R I C U L T U R A L A N D F O O D S C I E N C E
Vol. 19(2010): 1–12.
3
Introduction
Birch oil distillate or birch tar oil (BTO), is a by-product of processing birch (Betula sp.) wood to produce charcoal. Although anecdotal evidence in Finland suggests that BTO has been an effective repellent against burrowing rodents and moose, the use of BTO as a biological plant protection product or biocide is a new innovation. However, due to its novelty as a repellent and because of the chemical complexity of BTO, no comprehensive informa-tion on the active compounds of BTO is available. Preliminary analyses suggest phenols, comprising 20–30% of BTO (Czernik 2002), are among the most interesting compounds of BTO having a repellent effect on molluscs (Hagner 2005), but various other volatile compounds can also play a role. Among the phenolic compounds, cresols, allylphenol, guaiacol, 4-methyl- and 4-ethyl guaiacol, eugenol, isoeugenol, vanillin, and ethylvanillin have been identified in birch biomass pyrolysis (Murwanashyaka et al. 2002). Despite its potential value as a biological plant protection product, we are aware of only one publication in which the applicability of birch/pine oil has been tested as a repellent against mosquitoes (Thorsell et al. 1998).
This study focuses on two molluscs, the land snail Arianta arbustorum L. (Gastropoda: Helici-dae) and the Iberian slug Arion lusitanicus Mabille (Gastropoda: Arionidae). The species A. arbusto-rum belongs to the local snail fauna in Finland, but before 1990 its distribution was restricted to the southern coast of Finland with some sporadic establishments in fertile deciduous forests in the northern part of Finland (Terhivuo 1978, Valovirta and Heino 1994). In recent years the snail has in-creased its distribution dramatically in many urban/semi-urban areas in southern and central Finland. The species A. lusitanicus is a major pest of Euro-pean horticulture and a newcomer to Fennoscandia (Weidema 2006). Originally from the Iberian Pe-ninsula, A. lusitanicus reached the Åland Islands in Finland in 1990 and it is now widely distributed from the west coast to the south-eastern areas of the country (Valovirta 2001). The northernmost popu-lation was found in Oulu (65 02’ N; 25 31’ E) in
2005 (Valovirta personal communication). Despite its southern origin the slug has established itself in Finland’s northern climate and Fennoscandia (Hofsvang and Haukeland 2006), highlighting the ability of eggs and immature stages to acclimatize to the cold. The distribution of A. lusitanicus or other Arion slugs has not been studied in Finland, but the occurrence of A. circumscriptus (Johnston), A. fasciatus (Nilsson), and A. fuscus (O.F. Müller) [syn. Arion subfuscus (Drap.)] have been reported (Valovirta 1968).
Both A. arbustorum and A. lusitanicus are omnivorous, feeding on a wide range of living and dead plant material, mushrooms and dead fauna (Hägele and Rahier 2001, Valovirta 1964). As these molluscs are hermaphroditic, a popula-tion can begin from a single individual which can produce up to 400 eggs (A. lusitanicus). Although the distribution is still sporadic in Finland, it is not uncommon to find hundreds of individuals of A. arbustorum per square meter. Both species have spread with an alarming rate, often by the trade of produce and plants. As such, these molluscs have rapidly become an increasing problem with severe impacts, particularly in home gardens (Speiser and Rowell-Rahier 1991, Valovirta 2001). A. lusitani-cus also threatens larger professional horticultural operations and would have serious economic conse-quences in, for example, fields with perennial crops.
Control of A. arbustorum and A. lusitanicus has hitherto been tedious, usually collecting and killing being the most common methods in home gardens. To some extent, chemical control is useful but can be harmful to other organisms and ecosystems. Methiocarb (Mesurol), for example, is one of the two pesticides currently permitted for use as a mol-luscicide in Finland, is known to pose a threat to non-target biota (Purvis and Bannon 1992, Shore et al. 1997) and to ground waters (Garcia de Llasera and Bernal-Gonzáles 2001). Of the less harmful methods of chemical control, iron phosphate (Fer-ramol) has been effective against species of slugs and is relatively non toxic (Procop 2005). How-ever, high numbers of iron phosphate pellets may increase earthworm mortality (Langan and Shaw 2006). Biological control using the nematode Phas-marhabditis hermaphrodita Schneider (Nematoda:

A G R I C U L T U R A L A N D F O O D S C I E N C E
Lindqvist, I. et al. Birch tar oil as a repellent
2
A G R I C U L T U R A L A N D F O O D S C I E N C E
Vol. 19(2010): 1–12.
3
Rhabditidae), has been successfully used, not only against slugs (Grimm 2002), but also to some extent against snails (Coupland 1995). Grimm (2002) and Speiser et al. (2001) also reported that this nema-tode only killed immature stages of the slug A. lusi-tanicus. This is in agreement with the results from a small-scale experiment conducted at MTT Agrifood Research Finland. (MTT pesticide efficacy studies 2005, unpublished data). Consequently, the possi-ble repelling effect of BTO on A. arbustorum and A. lusitanicus warrants further investigations to complement the current methods of control used in horticultural operations and home gardens.
This study is part of a larger research programme in which the effects of BTO as a molluscicide (the current study) and their ecotoxicological effects on both terrestrial (Hagner et al. 2010a) and aquatic (Hagner et al. 2010b) organisms were investigated. Here we aimed at 1) studying the toxic effect of BTO on populations of A. arbustorum in the labo-ratory by direct spray application, 2) exploring the efficacy of the distillate to repel A. arbustorum outdoors when painted on a Perspex® fence, and 3) demonstrating the repelling effect (and duration) of a BTO barrier in a field with a high frequency of A. lusitanicus.
Material and methods
Birch tar oil (BTO)Two types of BTO from pyrolysed birch wood and bark were supplied by Charcoal Finland Ltd.: BTO1, a more soluble form resulting from the early phase of the distillation process i.e. at temperatures less than 380 oC, and a viscous form (BTO2) resulting at the end of the process when the temperature reaches 400 oC. A mixture (BTOm) of the two forms was also used in the experiments. Birch tar oil (BTO) has been assigned with a CAS number (8001-88-5) in the worldwide substance database (American Chemical Society 2007). Thus the same abbreviation, BTO, has been used for the closely related product in our studies.
Experiment 1: Toxic effect of BTOs on A. arbustorum – direct spray application
Experimental setupAn experiment using different ages (adults, eggs and the newly hatched young) of the snails was established as a laboratory study at the Department of Ecological and Environmental Sciences in summer 2003. Both BTO1 and BTO2 were tested. The snails were col-lected close to the Departmental building in the city of Lahti, Southern Finland. Adult snails were allowed to reproduce in 1.7 l glass jars (Ø 10 cm, height 19 cm) containing a soil monolith (4 cm thick), and covered with gauze. Fresh food consisting of carrot, lettuce and earthworms was given to the snails twice a week. Maturity of the adult snails was determined by the thickened outer lip framing the aperture of the shell (Baur and Raboud 1988, Raboud 1986, Terhivuo 1978). The jars were kept outdoors under natural light and temperature conditions. The eggs laid by the snails were removed daily, placed into glass jars with moist soils and kept in the fridge (+5 oC) before the start of the experiment. After two months there were sufficient numbers of eggs to conduct the experiment.
Toxicity bioassayThe experiment was performed in 1.7 l glass jars with a soil monolith (3 cm thick) growing Trifolium repens, Festuca pratensis and Taraxacum officinale. Four mature snails and about 55–65 eggs were placed on the soil in each jar. Three treatments, each with 5 replicates, were established: 1) jars sprayed once with BTO1 (0.5 dl m–2; the amount equalling 500 l ha–1), 2) jars sprayed with BTO2 (0.5 dl m–2) and 3) jars sprayed with equal amount of water (control). The containers were covered with gauze and kept at 20 oC under a 16:8 h light:dark cycle. During the experiment, the snails were fed twice a week with fresh carrots, lettuce and leaves of T. officinale and T. repens. Fresh water was sprayed weekly in the jars to maintain favourable moisture conditions for the snails. Hatching of the eggs and movement of the adult snails were observed weekly. After three months the snails were removed to clean jars with fresh plant material to activate and check the survival of the snails. The following day the number of surviving snails was recorded.
A G R I C U L T U R A L A N D F O O D S C I E N C E
Lindqvist, I. et al. Birch tar oil as a repellent
4
A G R I C U L T U R A L A N D F O O D S C I E N C E
Vol. 19(2010): 1–12.
5
Experiment 2: Repellent effect of BTO2 on A. arbustorum - Perspex® fence barrier
Experiment 2.1 – Snails inside the fencesTransparent Perspex® fences (height 40 cm, area 0.74 m2), partly buried in the soil (3 cm deep), were constructed in mid June 2005. The fences were established in five home yards containing grassy vegetation, in the city of Lahti. The fences received four treatments, each with three to five rep-licates, fenced areas: 1) without Vaseline® or BTO2 (control; n=4); 2) receiving Vaseline® only (n=3); 3) with BTO2 only (n=5); and 4) with a mixture of Vaseline® and BTO2 (n=5). The Vaseline®, the BTO2, and the mixture of BTO2+Vaseline® (40/60, v/v.), was spread using a brush on the outer upper side of the walls to form a 10 cm wide barrier. The upper 5 cm of the fence was bent so as to form “a rain shadow” for the area at which the repellent was applied. Spreading of the smears was done only once at the start of the study. The next day, 50 snails were placed into each fenced area. The study lasted for 38 days and within this time, the number of snails in the fenced areas were monitored at 1, 4, 6, 8, 11, 14, 18, 21, 28, 36 and 38 days after initiation of the study.
Experiment 2.2 – Snails outside the fencesThe set up of experiment was identical to the Experiment 2.1 described above except that no snails were added to the fenced areas. The experi-ment was conducted in the city of Lahti in a fertile fallow meadow growing tall herbs, grasses and some deciduous trees. The study was conducted from late July to early September in 2005. The A. arbustorum population in the area was >10 adults
m–2 (visual assessment). Naturally occurring snails were removed from the fenced areas at the start of the study. Three treatments, each with 2 to 4 rep-licates, were established: 1) fenced areas without Vaseline® or BTO2 (control; n=2); 2) Vaseline® only (n=2); and 3) a mixture of Vaseline®+BTO2 (n=4). Spreading of the smears on the outer upper side of the walls was carried out only once at the onset of the study. After removing all the snails, pieces of carrot were placed inside the fence to attract snails
into the fenced area. The study lasted for 42 days within which time the entrance of snails into the fenced area was monitored at 3, 6, 9, 18 and 42 days after initiation of the study. During the first month the snails were removed from the systems at every inspection, after which, the snails that entered the systems were left untouched. One control and one BTO2+Vaseline® treated fence were left in the meadow over winter. In the following summer, the entrance of snails into the fenced area was moni-tored five times.
The weather during Experiments 2.1 and 2.2 (mid June to early September) was variable with heavy rains (collective rainfall during the study 271 mm) to periods of dry and warm weather (average temperature 15 ºC; Finnish Meteorological Insti-tute).
Experiment 3: The repelling effect of a BTOm barrier against A. lusitanicus
Experimental set up The experiment was established at MTT Agrifood Research Finland, Jokioinen, in 2005. The field area (4.5 × 42 m) was surrounded by glasshouses on both long sides. One of the short ends was bounded by the storehouse and the other end was separated from the main field by a 50 cm high tin plate treated with BTO to prevent slugs from escaping. The field veg-etation consisted mainly of Elymus repens, Trifolium repens and Taraxacum officinale. The vegetation was left to grow wild except for a mowed strip (1.20 m wide) in the middle of the area to facilitate moving without crushing the slugs (Fig. 1).
Slug populationA. lusitanicus were originally collected in 2001 from Åland and transported to Jokioinen for the purpose of testing pesticides. The slugs were reared and contained outdoors in a secured grassy field area. Within four years the population had developed from a few individuals in the area into approximately 20–100 individuals m–2, the density varying in different parts of the field according to the weather and vegetation. Some naturally occurring

A G R I C U L T U R A L A N D F O O D S C I E N C E
Lindqvist, I. et al. Birch tar oil as a repellent
4
A G R I C U L T U R A L A N D F O O D S C I E N C E
Vol. 19(2010): 1–12.
5
A. fasciatus (Nilsson) slugs were also found in the experimental field and included in the experiment.
Test plantsChinese cabbage seedlings, Brassica pekinensis var. Yamiko, were produced in the glasshouse and grown in 1.5 l black plastic pots containing com-mercially available horticultural peat (Kekkilä: N-P-K 14-4-20). At the end of June the plants were placed outdoors in the experimental field. Strips of irrigation-mat (40 × 40 cm) were placed on the mowed strip of grass and the pots were centred on the mats at a distance of one meter from each other. Automatic drip irrigation was used to keep the irrigation mat constantly wet.
The experiment was designed on information and experiences from a preliminary field trial ar-ranged in the same way. The experiment was com-pletely randomized with four replicates. The use
of irrigation-mats prevented grass from reaching the pots and creating passage ways for the slugs to cross the BTO barrier. Splashing of rainwater with soil on the treated surface of the pots was also reduced, which minimized any further possibility of access to the potted plants.
TreatmentsThe experiment consisted of 24 pots, half of which were equipped with a plastic collar, 3 cm in breadth, fastened around the rim of the pots to prevent the washing effect by raindrops. A mixture (BTOm) of BTO1 and BTO2 (30/70, v/v) was painted evenly on the whole outer surface of the pots. The pots received six treatments (completely randomized design), each with four replicates: 1) pots without collar and repellent (control), 2) pots without collar but with repellent (BTOm × 2) applied twice (fort-nightly), 3) pots without collar and with repellent (BTOm × 4) applied four times (weekly), 4) pots with collar but no repellent, 5) pots with collar and with repellent (collar + BTOm × 2) applied twice (fortnightly), 6) pots with collar and with repellent (collar + BTOm × 4) applied four times (weekly). The weekly and fortnightly treatments with BTOm started on the first day of the experiment, which extended from 23 of June to 8 of August. A bird-net was put up over the entire field to prevent thrushes from eating the slugs.
Data collectionThe plants were checked in the morning on a daily basis for the duration of the study. The number of slugs entering the pots and accessing the plants were counted and then placed back into the field outside the grass strip of the experiment. At the same time, all old cabbage leaves hanging over the pot rims were removed. The damage to the plants caused by the slugs was estimated by visual assessment as a percentage of the damaged leaf area (Fig. 2). Ob-servations from the first 35 days covered the period of BTOm treatments. The second part of the study, the follow-up period, monitored the duration of the repellent effect of BTOm on the slugs after day 35. Observations were made until it could be verified that slugs had entered all treatments.Climate conditions during the study
Fig. 1. Experiment 3. The experimental area was situated in the middle of a small field with slugs and surround-ed by glasshouses.
A G R I C U L T U R A L A N D F O O D S C I E N C E
Lindqvist, I. et al. Birch tar oil as a repellent
6
A G R I C U L T U R A L A N D F O O D S C I E N C E
Vol. 19(2010): 1–12.
7
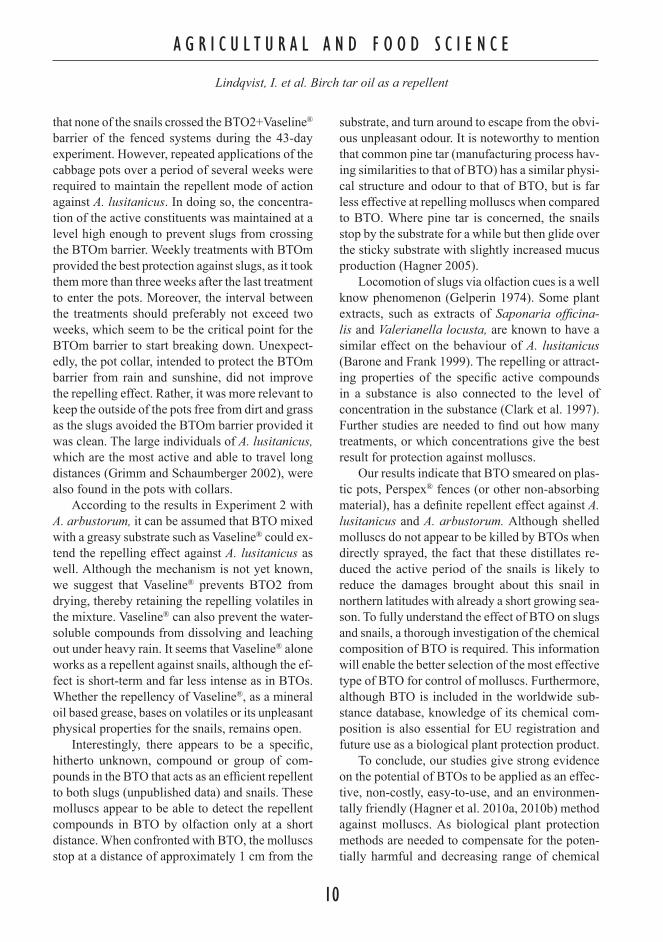
The experimental area was surrounded by green-house walls on two sides making the area less exposed to normal weather conditions than in an open field. Subsequently, the area received more rainfall due to runoff from the greenhouse roofs. Compared to data from the local weather station (Fig. 3) the total rainfall in the experimental area was approximately three times higher than in the open field. Temperature changes in the pots during the experiment were equivalent with those in an overturned black plastic pot on the ground where the temperature was monitored by a data-logger (CelciPick CK-39/+75 °C ).
Statistical analysis of all experimentsStatistical analyses were performed using the SPSS 10.0 statistical software (SPSS 1999). To examine the differences in the amount of adult and newly hatched young snails between the treatments in Experiment 1, analysis of variance (one-way ANOVA) was conducted. In Experiment 2.1 and Experiment 3, ANOVA for repeated measurements was used. Data from Experiment 2.2 was analyzed by non-parametric 2-way Kruskall-Wallis analysis (Ranta et al. 1989) with time and distillate treat-ment as factors. In Experiment 3, only data from observations in the period of BTO treatments were statistically analysed.
Results
Toxic effect of BTOs on A. arbustorum - direct spray application
The results of the laboratory study (Experiment 1) proved BTOs to be ineffective in eliminating snails; neither BTO1 nor BTO2 had a statistically signifi-cant effect on the survival of adult snails (ANOVA, F=1.68, p=0.226) (Fig. 4). The snails excreted extensive amounts of slime directly after spraying of BTOs and aimed at escaping from the jars. On day 2, all adult snails in the BTO1 and BTO2 treated jars were inactive and a slime plug excretion was observed in the front aperture of the shell. The eggs started to hatch one week after initiation (and spray-ing) of the study in all treatments with BTOs having no clear effects on the number of hatched eggs, the activity, or survival of the young snails. During the 3-month study period, most adult snails in the BTO1 and BTO2 treated systems remained passive while those in the control treatments were active. After being removed to jars with fresh food at the end of the study, almost all adults, irrespective of the treatment, were still alive. The data was not always normally distributed and the variances were some-times heterogenous, even after data transformation.
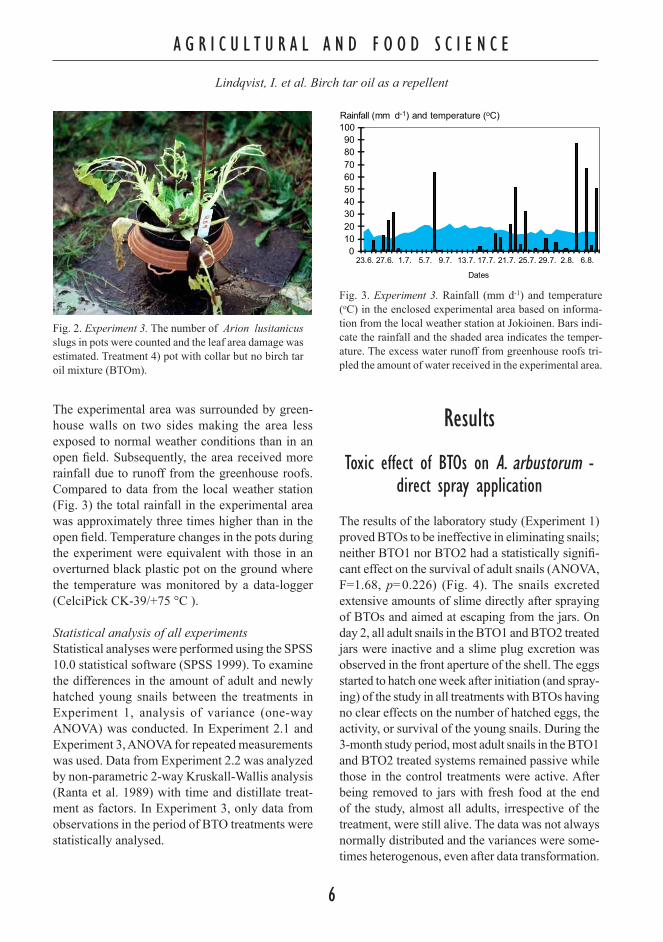
Fig. 2. Experiment 3. The number of Arion lusitanicus slugs in pots were counted and the leaf area damage was estimated. Treatment 4) pot with collar but no birch tar oil mixture (BTOm).
0102030405060708090
100
23.6. 27.6. 1.7. 5.7. 9.7. 13.7. 17.7. 21.7. 25.7. 29.7. 2.8. 6.8.
Dates
Rainfall (mm d-1) and temperature (oC)
Fig. 3. Experiment 3. Rainfall (mm d-1) and temperature (oC) in the enclosed experimental area based on informa-tion from the local weather station at Jokioinen. Bars indi-cate the rainfall and the shaded area indicates the temper-ature. The excess water runoff from greenhouse roofs tri-pled the amount of water received in the experimental area.

A G R I C U L T U R A L A N D F O O D S C I E N C E
Lindqvist, I. et al. Birch tar oil as a repellent
6
A G R I C U L T U R A L A N D F O O D S C I E N C E
Vol. 19(2010): 1–12.
7
Repellent effect of BTO2 on A. arbusto-rum - Perspex® fence barrier
In the field enclosure study (Experiment 2.1), BTO2 displayed a clear repelling influence on the A. arbustorum. The day after placing the snails in the fenced systems, it was found that only 20 % remained in the control systems, while all individu-als were still present in the systems painted with the Vaseline®+BTO2 - mixture. Both BTO2 and Vaseline® alone repelled the snails to some extent (repeated measures ANOVA, p=0.000), but these effects were short-term and less effective when com-pared to the results produced by the Vaseline®+BTO2 - mixture (repeated measures ANOVA, p=0.000) (Fig. 5). Data from Experiment 2.1 was not always normally distributed and the variances were some-times heterogeneous, even after data transformation. The data was log10-transformed due to the high variation of snail densities in the controls and in the treatment with Vaseline® only. Although this did not normalize the data completely, ANOVA for repeated measurements using log10-tansformed values was applied. We were interested in the BTO induced temporal patterns in the field studies. Therefore a repeated-measures (not available in non-parametric test packages) model was considered to be the most appropriate form of analysis. The fact that data
transformation did not improve the data, warrants caution when interpreting the data.
The results from Experiment 2.2 support those obtained from Experiment 2.1, i.e.that the Vaseline®+BTO2 - mixture was the most effective snail repellent (2-way Kruskal-Wallis, p<0.05) (Fig. 6). This mixture formed an effective barrier preventing all snails from entering the fenced sys-tems up to seven weeks after initiating the study, whereas in the control fences, between two and six snails were found at every inspection. As was seen in Experiment 2.1, Vaseline® alone also seemed to repel the snails in Experiment 2.2, although the effect was not statistically significant (2-way Krus-kall-Wallis, p>0.05). Unlike in the control and in the Vaseline® treated systems, the carrots remained intact and untouched in the Vaseline®+BTO2 treat-ed systems. Data from Experiment 2.2 was ana-lyzed by a non-parametric 2-way Kruskall-Wallis test (Ranta et al. 1989) with time and distillate treat-ment as factors. The data was not always normally distributed and the variances were sometimes het-erogeneous. Transformations had no effect on data.
The monitoring results (Experiment 2.2) from summer 2006 (one year after the initiation of study), showed that the repelling effect of the BTO2+Vaseline® -mixture remained over winter.
05
101520253035404550
CONTROL
Living snails/jar
BTO1 BTO2
Fig. 4. Experiment 1. The number of living adult and young Arianta arbustorum in the control and treated jars at the end of the study. Soluble (1) and viscous (2) forms of birch tar oil (BTO) were used. Black bars = adult snails, grey bars = young snails (<3mm). Mean values + SD, n=5.
Average number of Arianta arbustorumper treated area
05
101520253035404550
1 4 6 8 11 14 18 21 28 36 38Time after treatment
Fig. 5. Experiment 2.1. The number of Arianta arbusto-rum (mean values + SD) found inside the differently treat-ed fences at different times. At day zero, 50 adult snails were placed inside the fenced areas. Control (black line); Vaseline® (green line with squares); viscous birch tar oil (BTO2) (grey line with triangles); BTO2+Vaseline® (blue line with diamonds).

A G R I C U L T U R A L A N D F O O D S C I E N C E
Lindqvist, I. et al. Birch tar oil as a repellent
8
A G R I C U L T U R A L A N D F O O D S C I E N C E
Vol. 19(2010): 1–12.
9
At all five monitoring times during the year 2006, we found >3 snails inside the control fence but no snails from inside the BTO2+Vaseline® treated systems.
The repelling effect of a BTOm barrier against A. lusitanicus
It was found that BTOm effectively repelled A. lusi-tanicus from potted cabbage plants when applied as a protective barrier around plastic pots (Experiment 3). Upon reaching the BTOm barrier on the plastic pots, the slugs shrank away immediately before coming in contact with the smear. The slugs were strongly attracted to the cabbages and tried repeat-edly, but unsuccessfully, to find a way to cross the BTOm barrier.
The first part of the study clearly showed that treatment of pots with BTOm significantly reduced the amount of damage on the cabbage plants (re-peated measures ANOVA, p=0.000), which were almost left untouched (Fig. 7). The plants in the control pots were completely consumed 18 days after start of the experiment (Fig. 8). Figure 8 also shows that the collar alone did not have any hin-
dering effect on leaf damage caused to the plants (repeated measures ANOVA, p=0.527). This was further highlighted by the lack of interaction be-tween the collar and the BTOm treatments. Inter-estingly, there was no difference in the repelling effect between the weekly and fortnightly applica-tions. The data was normally distributed and the variances were homogenous.
The follow-up period revealed that 21 days af-ter the final BTOm treatment (36 days after start-ing), 12.5% of the leaf area of the plants in the pots treated with BTOm was damaged compared to the total damage in the control pots. As expected, the effect of BTOm in the fortnightly treated pots be-gan to decrease sooner than in the weekly treated pots (Fig. 9). At the end of the experiment, only 7.8% of the leaf area of the plants was damaged in the weekly treated pots with and without collar, compared to 30.1% in the fortnightly treatments. The species A. fasciatus was not found in the treat-
Average number of Arianta arbustorumper treated area
02468
101214161820
0 10 20 30 40Time after treatment
Fig. 6. Experiment 2.2. The number of Arianta arbus-torum (mean values + SD) found inside the different-ly treated fences at different times. Control (grey line); Vaseline® (black lines with squares); viscous birch tar oil (BTO2)+Vaseline® (blue lines with diamonds).
Fig. 7. Experiment 3. Birch tar oil mixture (BTOm) ef-ficiently prevents Arion lusitanicus from reaching the plants when applied as a protective barrier outside the pots (July 25). Treatment 2) no collar + BTOm fortnight-ly application. The photo was taken 19 days after paint-ing with the BTOm.

A G R I C U L T U R A L A N D F O O D S C I E N C E
Lindqvist, I. et al. Birch tar oil as a repellent
8
A G R I C U L T U R A L A N D F O O D S C I E N C E
Vol. 19(2010): 1–12.
9
indicates that the food source, also receiving BTO spray, of the snails remained repellant for a long time. It should be noted that the inactivating effect of BTOs on snails in the field would be shorter as the effect of BTOs is likely to be reduced by rain and UV. However, BTO could still be useful in IPM strategies, where the aim is not always to kill insect pests, but rather to prevent yield losses. Yield losses may be possible to be reduced by the inactivating effect of BTO on snails. Furthermore, a relatively long time of inactivity is bound to affect the fecundity and fertility of A. arbustorum which is likely to have a negative impact on the population densities of the snails.
Repellent effect of BTO against slugs and snails
The results clearly showed that BTO exhibited a repellent effect against A. arbustorum and A. lusi-tanicus in confined areas heavily infested with these molluscs. BTO2 indisputably showed high potential as a mollusc repellent against A. arbustorum given
0
20
40
60
80
100
0 7 11 13 14 15 18 19 21 27 28 29 30 31 32 33 34 35Days from start of experiment
Leaf damage (%)
Control BTOm x 2 BTOm x 4Collar Collar + BTOm x 2 Collar + BTOm x 4
Fig. 8. Experiment 3. Percent leaf damage (mean values ± SD) of potted Brassica pekinensis by Arion lusitani-cus in the control and birch tar oil mixture (BTOm) treat-ments during the first part of the study. Arrows with a triangle indicate the weekly treatments, and arrows with a circle, fortnightly treatments.
0
5
10
15
20
25
30
35
36 37 38 39 40 41 42 43 44 45 46
Days from start of experiment
Leaf damage (%)
Fig. 9. Experiment 3. Percent leaf damage (mean val-ues) of potted Brassica pekinensis by Arion lusitani-cus in birch tar oil mixture (BTOm) treatments during the follow-up phase. Treatments: weekly in pots with-out collar (triangles) and with collar (circles), fortnightly in pots without collar (squares) and with collar (crossed squares). Untreated control pots were not included in the graph because the plants were completely eaten and the leaf damage could not be estimated.
ed pots and thus the leaf damage was solely caused by A. lusitanicus.
Discussion
Toxic effect of BTOs on A. arbustorum Our preliminary studies (unpublished data) have clearly shown the negative influence of BTOs on the two slug species Deroceras agreste and A. lusitanicus: BTO1 sprayed over land areas grow-ing grasses and herbs resulted in the death of these molluscs soon after spraying. However, as was clearly shown in the current study, the mortality effect of BTOs against snails was low. Furthermore, the eggs and the newly hatched juveniles with a fragile shell also survived the spraying. The results suggest that shells of the snails, irrespective of their age, provide these organisms an efficient shelter against substances that are seemingly toxic to other molluscs. The slime plug excreted by the snails in the frontal aperture further enhances their survival under unfavourable, even hostile conditions. That the adult snails became temporarily inactive for a period of three months after the BTO treatments
A G R I C U L T U R A L A N D F O O D S C I E N C E
Lindqvist, I. et al. Birch tar oil as a repellent
10
A G R I C U L T U R A L A N D F O O D S C I E N C E
Vol. 19(2010): 1–12.
11
that none of the snails crossed the BTO2+Vaseline® barrier of the fenced systems during the 43-day experiment. However, repeated applications of the cabbage pots over a period of several weeks were required to maintain the repellent mode of action against A. lusitanicus. In doing so, the concentra-tion of the active constituents was maintained at a level high enough to prevent slugs from crossing the BTOm barrier. Weekly treatments with BTOm provided the best protection against slugs, as it took them more than three weeks after the last treatment to enter the pots. Moreover, the interval between the treatments should preferably not exceed two weeks, which seem to be the critical point for the BTOm barrier to start breaking down. Unexpect-edly, the pot collar, intended to protect the BTOm barrier from rain and sunshine, did not improve the repelling effect. Rather, it was more relevant to keep the outside of the pots free from dirt and grass as the slugs avoided the BTOm barrier provided it was clean. The large individuals of A. lusitanicus, which are the most active and able to travel long distances (Grimm and Schaumberger 2002), were also found in the pots with collars.
According to the results in Experiment 2 with A. arbustorum, it can be assumed that BTO mixed with a greasy substrate such as Vaseline® could ex-tend the repelling effect against A. lusitanicus as well. Although the mechanism is not yet known, we suggest that Vaseline® prevents BTO2 from drying, thereby retaining the repelling volatiles in the mixture. Vaseline® can also prevent the water-soluble compounds from dissolving and leaching out under heavy rain. It seems that Vaseline® alone works as a repellent against snails, although the ef-fect is short-term and far less intense as in BTOs. Whether the repellency of Vaseline®, as a mineral oil based grease, bases on volatiles or its unpleasant physical properties for the snails, remains open.
Interestingly, there appears to be a specific, hitherto unknown, compound or group of com-pounds in the BTO that acts as an efficient repellent to both slugs (unpublished data) and snails. These molluscs appear to be able to detect the repellent compounds in BTO by olfaction only at a short distance. When confronted with BTO, the molluscs stop at a distance of approximately 1 cm from the
substrate, and turn around to escape from the obvi-ous unpleasant odour. It is noteworthy to mention that common pine tar (manufacturing process hav-ing similarities to that of BTO) has a similar physi-cal structure and odour to that of BTO, but is far less effective at repelling molluscs when compared to BTO. Where pine tar is concerned, the snails stop by the substrate for a while but then glide over the sticky substrate with slightly increased mucus production (Hagner 2005).
Locomotion of slugs via olfaction cues is a well know phenomenon (Gelperin 1974). Some plant extracts, such as extracts of Saponaria officina-lis and Valerianella locusta, are known to have a similar effect on the behaviour of A. lusitanicus (Barone and Frank 1999). The repelling or attract-ing properties of the specific active compounds in a substance is also connected to the level of concentration in the substance (Clark et al. 1997). Further studies are needed to find out how many treatments, or which concentrations give the best result for protection against molluscs.
Our results indicate that BTO smeared on plas-tic pots, Perspex® fences (or other non-absorbing material), has a definite repellent effect against A. lusitanicus and A. arbustorum. Although shelled molluscs do not appear to be killed by BTOs when directly sprayed, the fact that these distillates re-duced the active period of the snails is likely to reduce the damages brought about this snail in northern latitudes with already a short growing sea-son. To fully understand the effect of BTO on slugs and snails, a thorough investigation of the chemical composition of BTO is required. This information will enable the better selection of the most effective type of BTO for control of molluscs. Furthermore, although BTO is included in the worldwide sub-stance database, knowledge of its chemical com-position is also essential for EU registration and future use as a biological plant protection product.
To conclude, our studies give strong evidence on the potential of BTOs to be applied as an effec-tive, non-costly, easy-to-use, and an environmen-tally friendly (Hagner et al. 2010a, 2010b) method against molluscs. As biological plant protection methods are needed to compensate for the poten-tially harmful and decreasing range of chemical

A G R I C U L T U R A L A N D F O O D S C I E N C E
Lindqvist, I. et al. Birch tar oil as a repellent
10
A G R I C U L T U R A L A N D F O O D S C I E N C E
Vol. 19(2010): 1–12.
11
molluscicides, this method could be a useful contri-bution as an alternative pest management strategy not only in home gardens, but also to some extent in organic farming practices and IPM strategies.
Acknowledgements. The authors are grateful to the Finnish Ministry of Agriculture and Forestry for the financial sup-port of our studies on renewable biomaterials. We also wish to thank Asko Riihelä from the Lahti Region Environmental Service for finding suitable snail study experimental sites. We warmly thank all the people who gave us permission to conduct experiments in their home yards.
ReferencesAmerican Chemical Society 2007. Homepage. Cited 29
June 2009. Updated 19 June 2009. Available on the in-ternet: http://www.cas.org/expertise/cascontent/registry.
Barone, M. & Frank, T. 1999. Effects of plant extracts on the feeding behaviour of the slug Arion lusitanicus. An-nals of Applied Biology 134: 341–345
Baur, B. & Raboud, C. 1988. Life history of the land snail Arianta arbustorum along an altitudinal gradient. The Journal of Animal Ecology 57:71–87.
Clark, S.J., Dodds, C.J., Henderson, I.F. & Martin, A.P. 1997. Bioassay for screening material influencing feeding in the field slug Deroceras reticulatum (Müller) (Mollus-ca: Pulmonata). Annals of Applied Biology 130: 379–385
Coupland, J.B. 1995. Note: Susceptibility of Helicid snails to isolates of the nematode Phasmarhabditis hermaph-rodita from Southern France. Journal of Invertebrate Pa-thology 66: 207–208.
Czernik, S. 2002. Environment, health and safety. In: Bridgewater A.V. (Ed.). Fast Pyrolysis of Biomass, A Handbook, CPL Press, Newbury, UK. p. 115–118
Garcia de Llasera, M. P. & Bernal-Gonzáles, M. 2001. Presence of carbamate pesticides in environmental wa-ters from the northwest of Mexico: determination by liq-uid chromatography. Water Research 35: 1933–1940.
Gelperin, A. 1974. Olfactory basis of homing behaviour in the giant garden slug, Limax maximus. Proceeding of the National Academy Sciences of the United States of America 71: 966–970.
Grimm, B. 2002. Effect of the nematode Phasmarhabdi-tis hermaphrodita on young stages of the pest slug Ari-on lusitanicus. Journal of Molluscan Studies 68: 25–28
Grimm, B. & Schaumberger, K. 2002. Daily activity of the pest slug Arion lusitanicus under laboratory conditions. Annals of Applied Biology 141: 35–44.
Hägele, B. F. & Rahier, M. 2001. Determinants of sea-sonal feeding of the generalist snail Arianta arbusto-rum at six sites dominated by Senecioneae. Oecolo-gia 128: 228–236.
Hagner, M. 2005. Koivutisle torjunta-aineena: vaikutukset lehtokotiloon (Arianta arbustorum) ja maaperään. Mas-
ters thesis. University of Helsinki. Department of Eco-logical and Environmental Sciences. 39 p. (in Finnish)
Hagner, M., Pasanen, T., Lindqvist, B., Lindqvist, I., Tii-likkala, K., Penttinen, O-P. & Setälä, H. 2010a. Effects of birch tar oils on soil organisms and plants. Agricul-tural and Food Science 19: 13–23.
Hagner, M., Pasanen, T., Tiilikkala, K., Penttinen, O-P. & Setälä, H. 2010b. Acute toxicity of birch tar oil on aquat-ic organisms. Agricultural and Food Science 19: 24–33.
Hofsvang, T. & Haukeland, S. 2006. Snegler som skade-dyr på planter. Bioforsk Tema 1: 1–10.
Langan, A.M. & Shaw, E.M. 2006. Responses of the earth-worm Lumbricus terrestris (L.) to iron phosphate and metaldehyde slug pellets formulations. Applied Soil Ecology 34: 184–189.
Murwanashyaka, J.-N., Pakdel, H. & Roy, C. 2002. Frac-tional vacuum pyrolysis of biomass and separation of phenolic compounds by steam distillation. In: Bridge-water A.V. (ed.). Fast Pyrolysis of Biomass, A Hand-book, volume 2. CPL Press, Newbury, UK, p. 407–419.
Procop, A. 2005. Ferramol (Sluggo) – new results of slug and snail control on various crops worldwide. IOBC/WPRS Bulletin 28: 19–23.
Purvis, G. & Bannon, J. W. 1992. Nontarget effects of re-peated methiocarb slug pellet application on carabid beetle (Coleoptera, Carabidae) activity in winter-sown cereals. Annals of Applied Biology 121: 401–422.
Raboud, C. 1986. Age determination of Arianta arbustorum (L.) (Pulmonata) based growth breaks and inner layers. Journal of Molluscan Studies 52: 243–247.
Ranta, E., Rita, H. & Kouki, J. 1989. Biometria. Helsinki University Print. 569 p. (in Finnish)
Shore, R. F., Feber, R. E., Firbank, L. G., Fishwick, S. K., Macdonald, D.W. & Norum, U. 1997. The impacts of molluscicide pellets on spring and autumn populations of wood mice Apodemus sylvaticus. Agriculture, Eco-systems & Environment 64: 211–217.
Speiser, B. & Rowell-Rahier, M. 1991. Effects of food avail-ability, nutritional value, and alkaloids of food choice in the generalist herbivore Arianta arbustorum (Gastrop-oda, Helicidae). Oikos 62: 306–318.
Speiser, B., Zaller, J.G. & Neudecker, A. 2001. Size-specific susceptibility of the pest slugs Deroceras reticulatum and Arion lusitanicus to the nematode biocontrol agent Phas-marhabditis hermaphrodita. BioControl 46: 311–320.
SPSS 1999. SPSS for Windows 10.0, 9.0.1. SPSS Chicago.Terhivuo, J. 1978. Growth, reproduction and hibernation
of Arianta arbustorum (L.) (Gastropoda, Helicidae) in southern Finland. Annales Zoologici Fennici 15: 8–16.
Thorsell, W., Mikiver, A., Malander, I. & Tunon, H. 1998. Efficacy of plant extracts and oils as a mosquito repel-lents. Phytomedicine 5: 311–323.
Valovirta, I. 1964. Porvoon Arianta arbustorum – esiintymä. Luonnon Tutkija 68: 127–128. (in Finnish).
Valovirta. I. 1968. Land molluscs in relation to acidity on hyperite hills in Central Finland. Annales Zoologici Fen-nici 5: 245–253.
Valovirta, I. 2001. Espanjansiruetana – uusi tuholainen Suomessa. Luonnontieteellinen keskusmuseo. Cited November 2007. Updated 2001. Available on the in-ternet: http://www.fmnh.helsinki.fi (tutkimus/eläinmu-seo/selkärangattomat/espanjansiruetana). (in Finnish).
Valovirta, I. & Heino, M. 1994. Maanilviäiset ympäristön

A G R I C U L T U R A L A N D F O O D S C I E N C E
Lindqvist, I. et al. Birch tar oil as a repellent
12
ELOSTUS
Koivuöljytisle karkottaa nilviäiset tehokkaasti Isa Lindqvist, Bengt Lindqvist, Kari Tiilikkala, Marleena Hagner, Olli-Pekka Penttinen, Tiina Pasanen
ja Heikki SetäläMTT ja Helsingin yliopisto
tilan seurannassa. Vesi ja ympäristöhallitus. Helsinki. 56 p. (in Finnish).
Weidema, I. 2006. NOBANIS – Invasive Alien Species Fact
Sheet – Arion lusitanicus. Cited 22 June 2009. Updated 24 March 2006. Available on the internet: http://www.nobanis.org/Factsheets.asp.

A G R I C U L T U R A L A N D F O O D S C I E N C E
Vol. 19(2010): 13–23.
13
© Agricultural and Food Science Manuscript received: February 2008
Effects of birch tar oils on soil organisms and plants
Marleena Hagner1, Tiina Pasanen1, Bengt Lindqvist2, Isa Lindqvist2, Kari Tiilikkala2, Olli-Pekka Penttinen1 and Heikki Setälä1*
1Department of Ecological and Environmental Sciences, University of Helsinki, Niemenkatu 73, FI-15140 Lahti, Finland, *e-mail: heikki [email protected]
2MTT Agrifood Research Finland, Plant Production Research, Rillitie 1, FI-31600 Jokioinen, Finland
The use of birch tar oil (BTO) is a new innovation in plant and animal protection working against various weeds, harmful insects and rodents. Due to its novelty as a biocide/repellent/plant protection product, no comprehensive information on the effects of BTO on non-target soil organisms is available. In this study we examined the impact of BTO on non-target soil organisms (enchytraeids, nematodes and soil microbes) and plants using laboratory toxicity tests and field experiments. In addition, we determined the LC50 value of BTO to the earthworm Aporrectodea caliginosa and the EC50 value of BTO to the offspring production of the collembolan Folsomia candida. The effects of BTO on soil fauna were mostly insignificant. BTO seemed to be detrimental to the growth of plants directly after application, but this effect was short-term; after a period of 2.5 months, the growth of most of the plant species recovered completely from the ap-plication. The LC50 for A. caliginosa was 6560 mg BTO kg-1 dry soil and EC50 for juvenile production of F. candida was 5100 mg BTO kg-1 dry soil. The results indicate that the risk caused by BTOs (concentration 500−1360 l ha-1) to the soil environment is insignificant and short-term as compared to the many chemical products applied for similar purposes.
Key-words: birch tar oil, plant protection, bio control, enchytraeids, nematodes, soil microbes, ecotoxicology
Introduction
The impact of pesticides on soils, their biota, and functions have become a matter of considerable concern especially in agriculture. Various pesticides are known to increase mortality of non-target soil
organisms, thereby hampering the decomposition rate of organic matter (Bűnemann et al. 2006) and thereby altering soil physico-chemical quality. Because of the various negative effects due to pesticides, there is an increasing need to develop biological methods for pest control.

A G R I C U L T U R A L A N D F O O D S C I E N C E
Hagner, M. et al. Birch oil toxity
14
A G R I C U L T U R A L A N D F O O D S C I E N C E
Vol. 19(2010): 13–23.
15
Birch tar oil (BTO) is a byproduct of process-ing birch wood through a pyrolysis process to pro-duce charcoal. There is ample anecdotal evidence suggesting the suitability of BTO for biocide and herbicide use, and/or repellents against insects, ro-dents, slugs and snails (Hagner et al. unpublished; personal observations by the authors, Hagner 2005, Hagner et al. 2010, Lindqvist et al. 2010, Salonen et al. 2008, Tiilikkala and Salonen 2008). Due to its novelty as a biological plant protection product, biocide, and repellent, and because of the high number of compounds evaporating in the py-rolysis process, no comprehensive information on the effective compounds of birch oil is available. Preliminary analyses indicate phenols to be one of the most promising groub of compounds in BTO acting as biocontrol agents, but various volatile compounds may also play a role.
According to international regulations (EU 1996), the ecotoxicological effects of chemicals on the environment are to be assessed before using chemicals in the field. To the best of our knowl-edge, no studies have been documented with regard to the ecotoxicological effects of BTO. In Finland large scale field experiments using biological plant protection products can not be established if the ecological effects of these products are not known. We therefore examined the general eco-logical effects of BTOs on target organisms before conducting the actual experiments. In the current study the effects of BTO on non-target soil organ-isms were tested using two kinds of birch tar oils, both derived from the same pyrolysis process: 1) BTO1, the liquid material originating during the early phase of the distillation process when the temperature remains below 380 oC, and 2) BTO2, the more viscous component generating at the end of the process when temperature rises to 400 oC. BTO1 is effective against many weeds and insects and can be used as a herbicide and insecticide for example in potato fields (personal observation by the authors), while BTO2 has been shown to be an effective molluscicide (Hagner 2005, Linqvist et al. 2010).
This study is part of a larger research pro-gramme in which the effect of BTOs as a mollusc repellent (Lindqvist et al. 2010) and their ecotoxi-
cological effects on both terrestrial (the current study) and aquatic (Hagner et al. 2010) organisms were investigated. Here we aimed at 1) determining the ecotoxicological effects of BTO’s on non-target soil organisms and plants, and 2) to determine the lethal concentration (LC50) value and the no ob-served effect concentration (NOEC) value for the earthworm Aporrectodea caliginosa, and the ef-fective concentration (EC50) value and the NOEC value for the reproduction of the springtail (col-lembolan), Folsomia candida.
Material and methods
Ecological effects of BTOs on non-target soil organisms and plants – field investigations
The ecotoxicological effects of BTOs on soil or-ganisms were monitored via changes in soil fauna and plant populations. Three different groups of organisms covering various trophic levels were chosen: enchytraeid worms (mostly omnivorous), nematodes (covering several trophic positions), and soil microbes (primary decomposers). Relatively high doses of BTO1 were used in the experiments because we aimed at getting information about the highest possible risks of the substance. Further, an effective control of perennial weeds is likely to require high doses (1.36 dl m-2) of this substance (Lindqvist et al., unpublished data). When used for weed control of annual crops the required dose of BTO is about one-third, and for controlling pest insects about a tenth of the dose applied for peren-nial grass control. In the toxicity tests we mostly applied BTO1 due to its higher viscosity which renders it use more convenient than that of BTO2.
In the first experiment, referred to as a “garden experiment”, six 2 m2 plots, enclosed with wooden fences (height 30 cm), were constructed in June 2003 in the city of Lahti. The plots were established in five home gardens, each containing two replicate plots of each of the three treatments (see below).

A G R I C U L T U R A L A N D F O O D S C I E N C E
Hagner, M. et al. Birch oil toxity
14
A G R I C U L T U R A L A N D F O O D S C I E N C E
Vol. 19(2010): 13–23.
15
No attention was paid to possible differences in soil characteristics between the study sites. Dominant plant species in the yards were Poa sp. and Festuca sp. (Poaceae), Taraxacum officinale (Asteraceae) and Trifolium repens (Fabaceae). In one yard Ae-gopodium podagraria (Apiaceae) was abundant. Two leaf-litterbags (mesh size of 1 mm) contain-ing 2 g (dry mass) of Calamagrostis arundinacea (Poaceae) –leaf litter was placed in the soil to a depth of ca. 1 cm in each plot to examine the effects of BTOs on decomposition rate. Three treatments were established in each area: plots were sprayed with 1) BTO1 (corresponding to the amount of 0.5 dl m-2; n = 10), 2) BTO2 (0.5 dl m-2; n = 10) and 3) tap water ( = control; n = 10 in each treatment). BTOs (and water control) were sprayed on the 2 m2 area using a compressed air pump once at the start of the study. Because the weather during the entire study period was dry and warm, water (2 l) was sprayed weekly on to each plot. Two soil samples (Ø 5 cm, 5 cm deep) were taken from each plot at 9, 17, 38 and 70 days after establishing the experi-ments. The samples were stored (1−20 days; so that the mean storage time for the soils in each of the three treatment was the same) at 5 °C and the num-bers of nematodes and enchytraeids were counted (for methods, see below). The effect of BTOs on plants (total plant coverage %) was estimated in concurrently with taking the soil samples. At the final sampling, plants were harvested at randomly chosen 50 × 50 cm2 areas in each plot, identified, dried (24 h, 105 oC) and weighed. The leaf-litter bags were removed and the contents dried (24 h, 105 oC) and weighed.
The second experiment, referred to as the “field experiment”, was carried out in an experimental field in central Finland (MTT Agrifood Research Finland, Toholampi), from mid June to late July 2005. An arable field containing numerous weed species and situated between two turnip rape fields, was divided into ten contiguous plots (1 m × 2 m). Five randomly chosen plots were sprayed with BTO1 (1.36 dl m-2) once at the start of the study using a compressed air pump. The control plots (n = 5) were treated with water only. The experiment was conducted over 42 days, within which time soil samples were taken at 4, 10, 20, 29 and 42 days
after the initiation of the study. At each sampling time, three soil samples (Ø 4 cm, 5 cm deep) were taken from each plot. The samples were stored in cooling boxes and transported to the laboratory for analysis of nematodes numbers, the biomass of enchytraeids, and the activity and biomass of soil microbes (for methods, see below).
Toxic effects of BTO1 on soil organisms and plants – mesocosm studies
Experiment 1 was established as a mesocosm study at the garden area of the Department of Ecological and Environmental Sciences, University of Hel-sinki, Lahti, in summer 2004. The experimental design consisted of 75 mesocosms established in 1500 ml glass jars (Ø 10 cm, height 19 cm) filled with 400 g of fresh homogenised garden soil taken from a lawn adjacent to the Departmental building. Earthworms, roots and other larger plant remains were removed from the soil. Grass (Festuca rubra, Festuca ovina and Poa pratensis) seeds were sown in the mesocosms and kept under a plastic cover in natural light and temperature conditions in the garden. The weather during the study was variable with heavy rains (cumulative rainfall during the study was 147 mm) to periods of dry and warm weather (average temperature during the study was 14.3 ºC). After a stabilisation period of one month, three treatments were established, each with five replicates: the mesocosms were treated once with: 1) 100% BTO1 (0.5 dl m-2), 2) 5% BTO1 (0.5 dl m-2) and 3) water ( = control). We aimed at keeping the moisture content of the soil constant during the 7-week study by adding 40−80 ml of water weekly to each mesocosm. Five jars per treatment were randomly selected at day 1, 7, 20, 29 and 48 for destructive sampling in which the effects of the treatments on the numbers of nematodes, biomass of enchytraeids and microbial activity were examined. After the last sampling, the plants were uprooted, dried (24 h, 105 oC), and weighed.
Experiment 2 was identical to the experiment 1 described above except that the former was con-ducted in 200 ml plastic bowls containing 100 g

A G R I C U L T U R A L A N D F O O D S C I E N C E
Hagner, M. et al. Birch oil toxity
16
A G R I C U L T U R A L A N D F O O D S C I E N C E
Vol. 19(2010): 13–23.
17
moist, homogenised garden soil, and no plants were sown into the mesocosms. The mesocosms were weighted weekly and the water evaporated from the mesocosms during the 7-week study was replaced by adding tap water into the mesocosms. The bowls were kept at room temperature (+ 22 oC) in constant darkness.
Sampling of soil fauna
Nematodes were extracted from 5 g (fresh) soil samples using the wet funnel method by Sohlenius (1979), and enchytraeids were extracted from 30-80 g soil samples using the wet funnel technique described by O’Connor (1955). The numbers of nematodes and enchytraeids were counted under a binocular microscope. In the mesocosm and field experiments the length of the enchytraeids was meas-ured and the biomass of the different size classes was estimated using the formula described by Ab-rahamsen (1973). The total biomass of enchytraeids in the garden experiment was calculated using an average dry mass of 25 µg per individual (Persson et al. 1980). The corresponding average dry mass of the nematodes was 0.03 µg (Persson et al. 1980). Water content of the soil samples was determined by placing the soil into an oven (70 ˚C) for 24 hours.
Measuring of microbial activity and biomass
Microbial activity was measured using basal res-piration as an estimate. Microbial biomass was determined using the substrate induced respiration (SIR) method described by Anderson and Domsch (1978).
Basal respiration in the autotrophic (with plants) mesocosms was measured from 5 g soil samples during a period of 50 h using a respirom-eter (Nordgren 1988). Basal respiration in the field soil (100 g fresh soil) and in the mesocosm soil without plants were determined using EasyQuant infrared-carbon analyzer. Soils from the field site
were stabilized for a period of 24 h before con-ducting the first measurement. Basal respiration in the mesocosms without plants was measured di-rectly from the test jars so that an air sample was taken through a hole in the lid using the syringe from the head-space of the mesocosm. After this the hole was closed and a second air sample was taken two hours after closing the lid. Basal res-piration was calculated from the difference in the amounts of CO2 between the two measurements. Microbial biomass (SIR), determined only from the field soils, was quantified using the EasyQuant infrared-carbonanalyzer two hours after an appli-cation of glucose (the application was performed immediately after the second measurement).
Toxicity tests against Aporrectodea caliginosa and Folsomia candida
The LC50 and NOEC values of BTO1 for the earthworm A. caliginosa were defined using adult individuals collected from an arable field close to the city of Lahti. In practice, Eisenia fetida is a standard earthworm species in terrestrial ecotoxicology tests in the EU, but in Northern Europe its occurrence is limited to sites rich in organic matter (Kula and Larink 1998). Therefore Aporrectodea caliginosa, a dominant endogeic earthworm species in the agro-ecosystems and grasslands (Kula and Larink 1998), was applied in the current study. The worms were maintained in the laboratory in the original field soil for a period of two weeks before the start of the experiment. The experiment was carried out according to the OECD guideline 207 (1984). Prior to the start of the experiment, BTO1, dissolved in distillate water, was mixed with artificial soil com-prised of 70% coarse sand, 20% kaolinite clay and 10% finely ground Sphagnum peat, and adjusted to pH 6.5 with CaCO3. Moisture content was adjusted to 35 % of the dry weight. The BTO1 concentrations used were 2695, 5380, 6725, 8070, 9420, 10760, 12200 and 13500 mg BTO1 kg-1 dry soil (n = 4). These concentrations were selected on the basis of results obtained in preliminary tests. Control soils (n = 4) received no BTO1. For each test, 750 g of

A G R I C U L T U R A L A N D F O O D S C I E N C E
Hagner, M. et al. Birch oil toxity
16
A G R I C U L T U R A L A N D F O O D S C I E N C E
Vol. 19(2010): 13–23.
17
the test medium was placed into each jar (vol. 1000 ml) and ten earthworms (ranging from 300 to 600 mg wet mass), which had been conditioned for 24 hours in artificial soil and then washed quickly before use, were placed on the test medium surface. The earthworms were not fed during the 2-week study. After 7 and 14 days of exposure, alive worms were removed and counted. During the exposure, the microcosms were kept in a climate cabinet (20±1 °C) in continuous light to keep the photophobic earthworms in the test jars during the test.
The effect of BTO1 (EC50 and NOEC values) on the reproduction of springtails, F. candida, was determined using the protocol published by the International Standards Organization (ISO 1999). The springtails were derived from a pure culture maintained at the Department of Ecological and Environmental Sciences, University of Helsinki. The test was performed in 125 ml glass jars (Ø 11 cm, height 19 cm), each filled with 30 g (wet mass) of artificial soil (70% coarse sand, 20% kaolinite clay and 10% finely ground Sphagnum peat) and adjusted to pH 5.8 with CaCO3. The test concen-trations of BTO1 were 50, 85, 140, 235, 390, 655, 1090, 1820, 3030, 5055, 8425, 14040 and 23400 mg BTO1 kg-1 dry soil (n = 5). These concentra-tions were selected on the basis of results obtained in preliminary tests. Control soils (n = 5) received no BTO1. BTO1 was added to the artificial soil with deionised water and the moisture content was adjusted to 25 % of the dry weight. Soils were allowed to stabilise for one day prior to the ex-periment. Ten springtails (10−12 days old) were introduced to each replicate microcosm, and 2 mg of dry yeast was placed on the soil surface as a diet. The lids of the microcosms were otherwise closed during the experiment but removed twice a week for aeration. Fresh yeast was added once a week. The experiment was carried out in a climate cabinet (20 °C) under a light:dark cycle (16:8 h), and conducted for 28 days thus allowing sufficient time for the springtails to lay eggs. At the end of the experiment, the soil from each microcosm was mixed with 200 ml of tap water and gently stirred. The number of springtails floating on the surface of the water was recorded.
Statistical analysis
To test for treatment effects in the field, a repeated measures ANOVA was conducted. When interaction between the time and treatment was observed the level of one treatment was fixed and the effects of the other treatment were studied within this level using one-way ANOVA (simple-effects model) (Zar 1999). The data was not always normally distributed and the variances were sometimes heterogeneous, even after data transformation. We were interested in the BTO -induced temporal patterns in the field studies and therefore repeated-measures (not avail-able in non-parametric test packages) model was considered to be the most appropriate analysis, despite the fact that data transformation did not improve the data and as such warrants caution when interpreting the data.
Enchytraeid and nematode data from the gar-den soils were analyzed using a repeated measures ANOVA with the custom-model. Custom model -option was applied when the degrees of freedom did not suffice due to the incomplete experimental design. Using this model interactions between the factors are not calculated. To find out whether ap-plication of BTO1 results in changes in the plant community composition, the Principal Component Analysis (PCA) was applied.
To detect possible differences in the numbers of soil organisms between differentially treated mesocosms, a 2-way-ANOVA was used with time and BTO-treatment as factors. Data was not al-ways normally distributed and the variances were sometimes heterogeneous. Transformations had no effect on data. Effects on plants in the mesocosms were analyzed by one-way-ANOVA, and differ-ences between treatments were compared using Tukey’s -test.
Probit analysis was used to determine LC50 val-ues for earthworms with 95% confidence intervals. The effective concentration (EC50) for juvenile pro-duction of Folsomia candida was calculated using DEBtox-package (2004). The DEBtox Growth Model was selected because it provided a better fit of reproduction data for BTO1 in F. candida. According to the Growth Model, the toxicant in-

A G R I C U L T U R A L A N D F O O D S C I E N C E
Hagner, M. et al. Birch oil toxity
18
A G R I C U L T U R A L A N D F O O D S C I E N C E
Vol. 19(2010): 13–23.
19
fluences mother´s energy allocation on offspring production. All statistical analyses were performed using the SPSS statistical package (SPSS 1999).
Results
Effects of BTOs on soil fauna Birch tar oils had no consistent effects either on the numbers of enchytraeid worms in the garden soil in the city of Lahti (repeated measures ANOVA, p = 0.642), or on their biomass in the Toholampi field study (repeated measures ANOVA, p = 0.85). The biomass of enchytraeids in garden soil varied between 1.25 and 15 µg g-1 dry soil, and their biomass in the Toholampi field study ranged from 0 to 2.5 µg g-1 dry soil. Similarly, the effect of BTO1 on the bio-mass of enchytraeids in the mesocosm experiments without plants (2-way-ANOVA, p = 0.33) and with plants was insignificant (2-way-ANOVA, p = 0.52). The biomass of enchytraeid worms in these studies ranged from 0 to 22 µg g-1 dry soil.
The numbers of nematodes did not differ signifi-cantly between the treatments either in the garden experiment (repeated measures ANOVA, p = 0.117), or in the mesocosm experiments without plants (2-way-ANOVA, p = 0.52), or with plants (2-way-ANOVA, p = 0.52). In garden soil the number of nematodes fluctuated quite much being between 10.5 and 49.5 individual g-1 dry soil. In the meso-cosm experiments with plants their numbers varied from 5.8 to 6.9 individual g-1 dry soil and in meso-cosm without plants from 14.7 to 31.7 individual g-1 dry soil. In the Toholampi field study, the number of nematodes in BTO1 treated plots decreased at the last sampling time as compared to the control soils (ANOVA, simple effects, p > 0.05) (Fig. 1).
BTO1 had no effect on microbial activity in the mesocosms with plants (2-way ANOVA, p = 0.52). However, when plants were absent, microbial res-piration in the mesocosms treated with 100% BTO1 increased 1 day after BTO application, being sig-nificantly higher than in the control systems and in the mesocosms treated with 5% BTO1 (Tukey, p
< 0.001) (Fig. 2). Similar to the mesocosm experi-ment without plants, the field experiment showed that microbial activity was positively affected soon after addition of BTO1 (ANOVA, simple effets, p > 0.05) (Fig. 3). However, from day 9 onwards,
0
10
20
30
40
50
0 10 20 30 40Time (d)
Number of nematodes g-1 dry soil
BTO1BTO1BTO1
Fig 1. The number (mean values + SD, n = 5) of nema-todes in the BTO1-treated (black line) and control plots (grey line) in the Toholampi field experiment
00.020.040.060.08
0.10.120.14
0 10 20 30 40 50
Time (d)
μg CO2 -C g-1 soil (dw) h-1
Fig 2. The effects of BTO1 treatments on the microbial activity during the mesocosms experiment without plants (mean values + SD, n = 5). Blue line = Control, black dashed line with squares = 5% BTO1, black line with triangles = 100% BTO1.
012345678
0 10 20 30 40Time (d)
μg CO2 g-1 soil (dw) h-1
Fig 3. The effect of BTO1 on microbial activity at the Toholampi field experiment (mean values + SD, n = 5). Blue line = Control, black line = BTO treated plots.

A G R I C U L T U R A L A N D F O O D S C I E N C E
Hagner, M. et al. Birch oil toxity
18
A G R I C U L T U R A L A N D F O O D S C I E N C E
Vol. 19(2010): 13–23.
19
the influence of BTO1 on microbial activity was negative (ANOVA, simple effects, p > 0.05) (Fig. 3) and BTO1 had no effect on microbial biomass at any sampling time (repeated measures ANOVA, p = 0.38).
There was a rapid loss in leaf-litter mass during the garden experiment with no significant difference between the treatments (ANOVA, p = 0.384). After 2.5 months, approximately 60% of the initial litter mass remained in the leaf-litter bags.
Effects of BTOs on plants
Plants showed signs of stress and began to wither immediately after BTO applications. In the garden plots, 40% and 60% of the total coverage of the plants withered within the first day of BTO1 and BTO2 application, respectively. However, plants started to recover one month after BTO treatments, and after 2.5 months no difference in plant biomass between the variously treated plots was observed (ANOVA, p = 0.532). Aegopodium podagraria made an exception; only a fraction (5 % of total cover-age) recovered in BTO2 treated plots, and 40% in BTO1 treated plots. Birch tar oils affected neither plant community composition nor plant species diversity as depicted from the results of the PCA analysis (results of the PCA-analysis not shown). The number of plant taxa varied between 2 and 14 at the experimental plots.
In mesocosms with plants, 100% BTO1 had a negative effect (Tukey test, p = 0.01) on plant biomass: 50 days after application, the biomass of 100% BTO1-treated plants was 84% less than in the control mesocosms. Application of 5% BTO1 showed no consistent effects on plant biomass pro-duction (Tukey test, p = 0.76).
EC50-values for collembolas and earth-worms
In F. candida EC50-value for juvenile production was 5100 mg BTO1 kg-1 dry weight soil (S.D. 1280 mg
kg-1) (Fig. 4). No mortality (NOEC = no observed effect concentration) occurred at 3033 mg BTO kg-1 dry weight soil. Soil pH was variable during the treatment: at the beginning of the test it varied between 5.8 (controls) and 4.5 (23400 mg BTO kg-1 dry weight) (soil pH was not adjusted between treatments). The mortality in the control jars was low and the animals reproduced during the test. At highest test concentrations (8425−23400 mg BTO1 kg-1 dry soil), all springtails died. Variation in reproduction in controls did not exceed 30%.
In the earthworm test 14-day LC50 for Apor-rectodea caliginosa was 6560 mg BTO kg-1 dry weight (95% confidence limits 6323-6834 mg BTO kg-1 dry weight) (Fig. 5). NOEC value was 2694 mg BTO kg-1 dry weight. There was no mortality in the control jars.
0100200300400500600700800900
0 85 235 655 1820 5055 14040Concentration (mg kg-1)
Number of offspring
012345678910
Number of adults
Number of offspring Number of adults
Fig 4. Chronic toxicity of BTO1 to F. candida adults ( = lines with squares) and offspring ( = lines with circles).
020406080
100
0 2695 5380 6725 8070 9415 10760 12200 13500
Consentration (mg kg-1 )
Survival (%)
7 d 14 d
Fig 5. Survival rate of the earthworm A. caliginosa as a function of concentrations of BTO1 after 7 ( = lines with circles) and 14 ( = lines with squares) day exposure.
A G R I C U L T U R A L A N D F O O D S C I E N C E
Hagner, M. et al. Birch oil toxity
20
A G R I C U L T U R A L A N D F O O D S C I E N C E
Vol. 19(2010): 13–23.
21
Discussion
Field tests
Enchytraeid worms, nematodes, soil microbes, earthworms and springtails were selected as test biota because they fullfill several criteria required for toxicity tests. They are present in a wide range of ecosystems, occur abundantly, play a key role in the functioning of the soil ecosystem, are easy to use, collect and culture, come into contact with a variety of stress factors (the soil solution, the solid phase, and the gaseous phase in soil), and are sensitive to environmental stresses (Didden and Römbke 2001, Römbke and Moser 2002, Schloter et al. 2003). Importantly, changes in the soil faunal community composition has been shown to mark-edly affect e.g. microbial and plant biomass and community composition, thereby controlling the functioning of the entire ecosystem (Bradford et al. 2002, Wardle et al. 2004).
BTOs proved to have a clear negative influence on plant biomass and species diversity in the home gardens, but this effect was short-term. Aegopo-dium podagraria, however, proved to be a sensitive species to BTOs with a poor recovery rate during the growing season. This species is a common, fast-growing weed in gardens that has hitherto been tedious to control. The reason for the sensitivity of A. podagraria to BTOs remains open.
In the mesocosm experiment established under a plastic shelter, 100% BTO1 imposed a clear nega-tive effect on the biomass of plants which continued up to 50 days post application. It is highly likely that the efficacy of BTO1 was reduced under field conditions due to rain and solar radiation, which can explain the differences between the field (open sky) and mesocosm (plastic roof) experiments.
BTO1 had no consistent effects on soil micro-bial biomass. Interestingly, both laboratory and field experiments suggest 100 % BTO1 having a positive effect on microbial activity immediately after application. This is often a typical reaction when added resources are rapidly consumed by mi-crobes (Meli et al. 2003). BTOs, being composed
of numerous chemical compounds, supposedly in-clude substances that are readily available for soil microbes. On the other hand, the enhanced respira-tion activity can, at least partly, be explainable by the so-called “gasping-effect”, whereby toxic com-pounds enhance soil respiration but not microbial growth (Bååth 1989, Connell et al. 1999).
In the Toholampi field experiment, BTO1 had a negative influence on soil microbial activity in the last samplings. As depicted from the SIR results, BTO1 did not reduce microbial biomass. This can result from the withering of the plants in the BTO-treated plots. There is an increasing amount of evi-dence suggesting that the structure and activity of soil food webs can, by large part, be controlled by the living plant community (Wardle 2002, Bardgett 2005) regulating, for example, an amount of certain organic compounds in the soil by root excretion (Smolander and Priha 2003, Wardle et al. 2004). We hypothesize that in the BTO-treated plots in To-holampi, a decreased amount of root excudates by the dead/wilting plants lead to drastically reduced nutritional resources for the soil microflora causing the microbes to enter into a dormant state (Mar-tikainen 2003). This negative effect is, however, likely to be short-term due to the resource input by the dead plant biomass later on in the growing season.
BTOs appeared to have little effect on en-chytraeid worms and nematodes. This result was unexpected as both enchytraeids and nematodes are indirectly influenced by changes taking place above the ground (Wardle et al. 2004). The drastic changes by BTOs in the primary producers should therefore have cascaded down to the soil food web. That this proved not to be the case suggests that nematodes (as a group) and enchytraeid worms are less dependent on dead organic matter than on root exudates produced by living plants. Because BTOs had no effect on the survival of enchytraeids which are commonly considered as sensitive (Salminen and Haimi 1999, Salminen and Haimi 2001) key-stone species (Huhta et al. 1998) living in the soil surface layer (Nurminen 1967), the direct and in-direct effects of BTOs to soil food-webs appear insignificant.

A G R I C U L T U R A L A N D F O O D S C I E N C E
Hagner, M. et al. Birch oil toxity
20
A G R I C U L T U R A L A N D F O O D S C I E N C E
Vol. 19(2010): 13–23.
21
Toxicity tests
Earthworms are widely used in laboratory toxicity tests because of their important role in ecosystems and sensitivity to numerous chemical stressors (Didden and Römbke 2001). The LC50 (14 d) of BTO1 for Aporrectodea caliginosa was 6560 mg BTO1 kg-1 dry soil. Most OECD countries follow the classification system where LC50-values being > 1000 mg kg-1 (kg of dry soil weight) indicate pesticides to be practically nontoxic for earthworms (OECD 2003). The LC50 of BTO1 to Aporrectodea caliginosa was over six times higher. As far as we know, literature values for the toxicity of BTO1 in other species are not available for comparison. In general, the LC50 values are not comparable in experiments conducted on different experimental conditions and on different time scales. In the present study, the acute toxicity was within range of LC50 values reported in the literature indicating low toxicity of a single chemical (Russom et al. 1997).
Springtails are present in most soil habitats at densities of up to 104 – 105 m-2 (Petersen and Lux-ton 1982) and play a vital role in the decomposition of organic material (Cragg and Bardgett 2001). The species F. candida is commonly applied as a test organism for estimating the effects of chemicals on non-target organisms (Fountain and Hopkin 2005) and it is among the most sensitive springtails to an array of chemicals (Chernova et al. 1995). The EC50 for the inhibition of juvenile production of F. candida was 5100 mg BTO1 kg-1 dry soil.
Although the clear negative impact of this mix-ture on both the lethality of earthworms and the re-production of collembolas was seen, the observed response is attributed to the combination of chemi-cals present in BTO1 and evidently the responses were not correlated with concentration of the main component producing toxicity. In theory, if a single
chemical from the BTO1 mixture has a prominent lipophilicity and specific target site, it can alone give rise to the observed responses.
In the field, BTO1 acts as a non-selective herbicide by destroying virtually all growth of the aboveground parts of plants. Therefore, BTO treatments should be done before the emergence of cultivated seedlings. We have ample anecdotal evidence suggesting the suitability of BTO1 as a herbicide, for example in potato and carrot fields, and in the row width of berry shrubs and fruit trees.
To conclude, birch tar oils appeared to have no consistent, direct negative effects on enchytraeid worms, nematodes or soil microbial biomass when used at concentrations between 500-1360 l ha-1. In-stead, 100 % BTO1 (500−1360 l ha-1) showed a positive effect on microbial activity immediately after application, suggesting that easily utilized substances in BTO1 were rapidly consumed by microbes. Futhermore, the high LC50 value for the earthworm A. caliginosa indicates BTO1 to be practically nontoxic to earthworms. Altogether the risks caused by BTO1 in the soil environment are insignificant and short-term as compared to the many of chemical products applied for similar purposes.
In spite of the low environmental risks shown in this study a thorough investigation of the chemi-cal composition of BTO is required. Although BTO is included in the worldwide substance database (CAS number 8001−88−5, American Chemical So-ciety 2007), knowledge of the chemical composi-tion of BTO is essential also for the EU registration of BTO as a biological plant protection product.
Acknowledgements. We are grateful to Asko Riihelä from the Lahti Region Environmental Service for finding the experimental sites for our studies. We warmly thank all the people who gave us permission to conduct experiments in their home yards.

A G R I C U L T U R A L A N D F O O D S C I E N C E
Hagner, M. et al. Birch oil toxity
22
A G R I C U L T U R A L A N D F O O D S C I E N C E
Vol. 19(2010): 13–23.
23
ReferencesAbrahamsen, G. 1973. Studies of body-volume, body-sur-
face area, density and live weight of Enchytraeidae (Oli-gocaheta). Pedobiologia 13: 6−15.
American Chemical Society 2007: Homepage. Update (29 Apri4.209). Cite (13 June 209). Available on the internet: http://www.cas.org/expertise/cascontent/registry/reg-syst.html?WT.mc_id = casrn708&WT.srch = 1.
Anderson, J.P.E. & Domsch, K.H. 1978. A physiological method for the quantitative measurement of microbi-al biomass in soils. Soil Biology and Biochemistry 10: 215−221.
Bardgett, R.D. 2005. The biology of soil: a community and ecosystem approach. Oxford University Press. 242 p.
Bradford, M.A., Jones, T.H., Bardgett, R.D., Black, H.I.J., Boag, B., Bonkowski, M., Cook, R., Eggers, T., Gange, A.C., Grayston, S.J., Kandeler, E., McCaig, A.E., New-ington, J.E., Prosser, J.I., Setälä, H., Staddon, P.L., Tord-off, G.M., Tscherko, D. & Lawton, J.H. 2002. Impacts of soil faunal community composition on model grassland ecosystems. Science 298: 615−618.
Bűnemann, E.K., Schwenke, G.D. & Van Zwieten, L. 2006. Impact of agricultural inputs on soil organisms – a re-view. Australian Journal of Soil Research 44: 379−406.
Bååth, E. 1989. Effects of heavy metals in soil on microbi-al processes and populations: A review. Water, Air, and Soil Pollution 47: 335−379.
Chernova, N.M., Balabina, I.P. & Ponomareva, O.N. 1995. Changes in population growth rate of sprintails (Collem-bola) under the influence of herbicides. Polskie Pismo Entomoogiczne 64: 91−98.
Connell, D., Lam, D., Richardson, B. & Wu, R. 1999. In-troduction to ecotoxicology. Blackwell Publishing. Unit-ed Kingdom. 170 p.
Cragg, R.G. & Bardgett, R.D. 2001. How changes in soil faunal diversity and composition within a tropic group influence decomposition processes. Soil Biology and Biochemistry 33: 2073−2081.
DEBtox, 2004. Publication v2.0. Department of Theoreti-cal Biology, Vrije Universitet, Amsterdam, Netherlands.
Didden, W. & Römbke, J. 2001. Enchytraeids as indicator organisms for chemical stress in terrestrial ecosystems. Ecotoxicology and Environmental Safety 50: 25−43.
EU (European Union) 1996. Technical guidance docu-ments in support of the Commission Directive 93/67/EEC on risk assessment for new notified substances and the Commission Regulation (EC) 1488/94 on risk assessment for existing substances, Brussels, Belgium.
Fountain, M.T. & Hopkin, S.P. 2005. Folsomia candida (Col-lembola): A “standard” soil arthropod. Annual Review of Entomology 50: 201−222.
Hagner, M. 2005. Koivutisle torjunta-aineena: vaikutuk-set lehtokotiloon (Arianta arbustorum) ja maaperään (in Finnish). Masters thesis. University of Helsinki. Depart-ment of Ecological and Environmental Sciences. 39 p.
Hagner, M., Penttinen, O-P., Pasanen, T., Tiilikkala, K. & Setälä, H. 2010. Acute toxicity of birch tar oil on aquatic organisms. Agricultural and Food Science 19: 24–33.
Huhta, V., Persson, T. & Setälä, H. 1998. Functional impli-cations of soil fauna diversity in boreal forests. Applied
Soil Ecology 10: 277−288.ISO 1999. Soil quality-inhibition of reproduction of Colle-
mbola (Folsomia candida) by soil pollutants. Rep. No. ISO 11267:1999(E). Geneva. 16 p.
Kula, H. & Larink, O. 1998. Tests on the earthworms Eisenia fetida and Aporrectodea caliginosa. In: Løkke, H. & van Gestel, C. A. M. (ed.) Handbook of soil invertebrate tox-icity tests. John Wiley & Sons Ltd, Chichester. p. 95−112.
Lindqvist, I., Lindqvist, B., Tiilikkala, K., Hagner, M., Penttinen,O-P., Pasanen. T. & Setälä, H. 2010. Birch tar oil is an effective mollusc repellent: field and laborato-ry experiments using Arianta arbustorum (Gastropoda: Helicidae) and Arion lusitanicus (Gastropoda: Arionidae). Agricultural and Food Science 19: 1–12.
Mar tikainen, P. 2003. Metsämaan mikrobisto – In: Mälkönen, E. (ed.), Metsämaa ja sen hoito (in Finnish). Karisto, Hämeenlinna. p. 101−114.
Meli, S.M., Badalucco, L., English, L.C. & Hopkins, D.W. 2003. Respiratory responses of soil micro-organisms to simple and complex organic substrates. Biology and Fertility of Soils 37: 96−101.
Nordgren, A. 1988. Apparatus for the continuous long-term monitory of soil respiration rate in a large number of samples. Soil Biology and Biochemistry 20: 955−957.
Nurminen, M. 1967. Ecology of enchytraeids (Oligochae-ta) in Finnish coniferous forest soil. Annales Zoologici Fennici 4: 147−157.
O’Connor, F. B. 1955. Extraction of enchytraeid worms from a coniferous forest soil. Nature 175: 815−816.
OECD 1984. OECD guideline for testing of chemicals. No. 207. “Earthworm, Acute Toxicity Tests”. Paris. Organi-zation for Economic Development. 9 p.
OECD 2003. OECD environmemt, health and safety pub-lications. Series on pesticides, No. 15. Persistent, bio-accumulative, and toxic pesticides in OECD member countries. 67 p.
Persson, T., Clarholm M., Lundkvist, H., Söderström, B. & Sohlenius B. 1980. Trophic structure, biomass dynam-ics and carbon metabolism in a Scots pine forest. − In: Persson T (ed.), Structure and function of northern co-niferous forest − an ecosystem study. Ecol Bull (Stock-holm) 23: 419−459.
Petersen, H. & Luxton, M. 1982. A comparative analysis of soil fauna populations and their role in decomposi-tion processes. Oikos 39: 288−388.
Russom, C.L., Bradbury, S.P., Broderius, S.J., Ham-mermeister, D.E. & Drummond, R.A. 1997. Predicting modes of toxic action from chemical structure: acute toxicity in the fathead minnow (Pimephales promelas). Environmental Toxicology and Chemistry 16: 948−967.
Römbke, J. & Moser, T. 2002. Validating the enchytraeid reproduction test: organisation and results of an interna-tional ringtest. Chemosphere 46: 1117−1140.
Salminen, J. & Haimi, J. 1999. Horizontal distribution of copper, nickel and enchytraeid worms in polluted soil. Environmental pollution 104: 351−358.
Salminen, J. & Haimi, J. 2001. Life history and spatial dis-tribution of the enchytraeid worm Cognettia sphagneto-rum (Oligochaeta) in metal-polluted soil: below-ground sink-source population dynamics? Environmental Toxi-cology and Chemistry 20: 1993−1999.
Salonen, J., Tiilikkala, K., Ruuttunen, P., Lindqvist, I. & Lindqvist, B. 2008. Birch Tar Oil: A Potential Herbicide
A G R I C U L T U R A L A N D F O O D S C I E N C E
Hagner, M. et al. Birch oil toxity
22
A G R I C U L T U R A L A N D F O O D S C I E N C E
Vol. 19(2010): 13–23.
23
from the Forests of Finland. In: Abstracts of the 5th In-ternational Weed Science Congress. Weeds local prob-lems/global challenge. Vancouver, British Columbia, Canada. p. 286−287
Schloter, M., Dilly, O. & Munch, J.C. 2003. Indicators for evaluating soil quality. Agriculture, Ecosystems and En-vironment 98: 255−262.
Smolander, A. & Priha, O. 2003. Puulajin merkitys metsä-maan viljavuuden hoidossa. In: Mälkönen, E. (Ed.), Met-sämaa ja sen hoito (in Finnish). Karisto, Hämeenlinna. p. 155−158
Sohlenius, B. 1979. A carbon budget for nematodes, roti-fers and tardigrades in a Swedish coniferous forest soil. Holarctic Ecology 2: 30−40.
SPSS, 1999. SPSS for Windows 10.0. publication 9.0.1. SPSS, Chicago.
Tiilikkala, K. & Salonen, J. 2008. Birch tar oil (BTO) a potential biological pesticide from forests. In: Biorefinery Joint Call Info Day. Information Booklet. Bryssel. p. 85
Wardle, D.A., Bardgett, R.D., Klironomos, J.N,. Setälä, H., van der Putten, W.H. & Wall, D.H. 2004. Ecological linkages between aboveground and belowground biota. Science 304: 1629−1633.
Wardle, D.A. 2002. Communities and ecosystems − linking the aboveground and belowground components, Princ-eton University Press, Princeton. 392 p.
Zar, J.H. 1999. Biostatistical analysis. 4 th edition. Prentice-Hall, Inc. Englewood Cliffs, New Jersey. 736 p.
SELOSTUS
Koivuöljytisleen vaikutukset maaperän eliöihin ja kasveihinMarleena Hagner, Tiina Pasanen, Bengt Lindqvist, Isa Lindqvist, Kari Tiilikkala, Olli-Pekka Penttinen
ja Heikki SetäläHelsingin yliopisto ja MTT

A G R I C U L T U R A L A N D F O O D S C I E N C E
Vol. 19 (2010): 24–33.
24
A G R I C U L T U R A L A N D F O O D S C I E N C E
Vol. 19(2010): 24–33.
25
© Agricultural and Food Science Manuscript received February 2008
Acute toxicity of birch tar oil on aquatic organisms
Marleena Hagner1, Olli-Pekka Penttinen1, Tiina Pasanen1, Kari Tiilikkala2 and Heikki Setälä1*1Department of Ecological and Environmental Sciences, University of Helsinki, Niemenkatu 73, FI-15140 Lahti,
Finland, *e-mail: [email protected] 2MTT Agrifood Research Finland, Plant Production Research, Rillitie 1, FI-31600 Jokioinen, Finland
Birch tar oil (BTO) is a by-product of processing birch wood in a pyrolysis system. Accumulating evidence suggests the suitability of BTO as a biocide or repellent in terrestrial environments for the control of weeds, insects, molluscs and rodents. Once applied as biocide, BTO may end up, either through run-off or leaching, in aquatic systems and may have adverse effects on non-target organisms. As very little is known about the toxicity of BTO to aquatic organisms, the present study investigated acute toxicity (LC50/EC50) of BTO for eight aquatic organisms. Bioassays with the Asellus aquaticus (crustacean), Lumbriculus variegatus (oligochaeta worm), Daphnia magna (crustacean), Lymnea sp. (mollusc), Lemna minor (vascular plant), Danio rerio (fish), Scenedesmus gracilis (algae), and Vibrio fischeri (bacterium) were performed accord-ing to ISO, OECD or USEPA-guidelines. The results indicated that BTO was practically nontoxic to most aquatic organisms as the median effective BTO concentrations against most organisms were > 150 mg l-1. In conclusion, our toxicity tests showed that aquatic organisms are to some extent, invariably sensitive to birch tar oil, but suggest that BTO does not pose a severe hazard to aquatic biota. We deduce that, unless BTOs are not applied in the immediate vicinity of water bodies, no special precaution is required.
Key-words: acute toxicity test, aquatic organisms, birch tar oil, biocide, EC50
Introduction
Birch tar oil (BTO; CAS #8001-88-5, American Chemical Society 2007) is a crude by-product of the slow destructive distillation or pyrolysation, of wood and bark for processing into coal. There
is anecdotal and scientific evidence suggesting the suitability of BTO as a biocide and/or repel-lent against molluscs, insects, weeds, and rodents (Hagner et al. unpublished, Hagner 2005, Hagner et al. 2010, Lindqvist et al. 2010, Salonen et al. 2008, Tiilikkala and Salonen 2008). Due to its novelty as a biocide/repellent/biological plant protection prod-
A G R I C U L T U R A L A N D F O O D S C I E N C E
Vol. 19 (2010): 24–33.
24
A G R I C U L T U R A L A N D F O O D S C I E N C E
Vol. 19(2010): 24–33.
25
uct, no comprehensive information on the effective compounds of BTO components is available and nothing is known about the toxicity of BTO against the aquatic organisms. Our preliminary analyses suggest phenols to be among the most interesting compounds of the BTO as biocontrol agents, but that also various other volatile compounds can play a role. Among the phenolic compounds alone, allylphenol, cresols, 4-ethyl guiaiacol, ethylvanil-lin, eugenol, guaiacol, isoeugenol, 4-methyl, and vanillin have been identified in biomass pyrolysis (Murwanashyaka et al. 2002).
Two types of birch tar oils can be derived from the same pyrolysis process. BTO1 is the liquid ma-terial resulting from the early phase of the distilla-tion process when the temperature is below 380 oC. BTO2 is the more viscous component generated at the end of the process when the temperature rises to and above 400 oC. BTO2 has proven to be an effective snail and slug repellent when smeared on barrier fences or the walls of plants pots (Hagner 2005, Lindqvist et al. 2010), while BTO1, sprayed with a compressed air pump directly on soil sur-face, is effective against numerous weed and in-sect pest species, and as such, may be used as a herbicide/insecticide, for example, in potato fields (Hagner et al. unpublished; personal observations by the authors). An effective control of perennial weeds is likely to require high doses (1.36 dl m-2) of this substance (Hagner et al. unpublished). When used for weed control of annual crops the required dose of BTO1 is about one-third, and for control-ling pest insects about a tenth of the dose applied for perennial grass control. In Finland, large scale field experiments using biological plant protection products can not be established if the ecological ef-fects of these products are not known. We therefore examined the general ecological effects of BTOs on target organisms in the laboratory.
Chemical substances applied in terrestrial eco-systems are often detected in aquatic ecosystems (Accinelli et al. 2002, Larson et al. 1995, Shipi-talo and Owens 2003). Should the use of BTO as a plant protection product become common practice in horticultural or agricultural production, it is pos-sible that BTO compounds may leach to surface and ground waterways. As aquatic organisms are
generally sensitive to various organic and inorganic pollutants (Connell et al. 1999), changes in the spe-cies composition of aquatic communities is likely to affect the function and structure of the whole ecosystem (Hanazato 1998). Consequently, accord-ing to international regulations (EC 1996) ecotoxi-cological effects of chemicals on the environment must be assessed before using in the field. To the best of our knowledge, no studies have been docu-mented with regard to the ecotoxicological effects of BTO on aquatic organisms. This study aims to assess the acute toxicity of BTO1 (EC50-values i.e. the concentration of BTO1 producing certain half-maximal effect) on an extensive group of aquatic organisms widely used in ecotoxicological studies. Of the organisms used, the water louse (Asellus aquaticus) and the oligochaeta worm (Lumbriculus variegates) are sediment dwelling benthic inver-tebrates, while the pond snail (Lymnea sp.) usu-ally harbours in aquatic plants (Olsen et al. 2005). Representing the pelagic and littoral organisms are the water flea (Daphnia magna), lesser duckweed (Lemna minor), zebrafish (Danio rerio), unicellular green algae (Scenedesmus gracilis), and fluores-cent bacteria (Vibrio fischeri).
This study is part of a larger research program in which the effect of BTOs as a molluscicide (Hagner 2005, Lindqvist et al. 2010) and their eco-toxicological effects on both terrestrial (Hagner et al. 2010) and aquatic (the current study) organisms were investigated.
Material and methods
BTO1 from pyrolysed birch wood and bark was kindly supplied by Charcoal Finland Ltd. The BTO1 concentrations used were chosen on the basis of preliminary tests, and prepared by add-ing a certain amount of BTO1 to the test solution and shaken vigorously for 10 seconds. To obtain acute toxicity within the duration of the laboratory protocol, it was necessary to test at concentrations greater than solubility of BTO1 in water by follow-ing the rationale given by Hatch and Burton 1998.

A G R I C U L T U R A L A N D F O O D S C I E N C E
Hagner, M. et al. Acute toxicity of birch tar oil
26
A G R I C U L T U R A L A N D F O O D S C I E N C E
Vol. 19(2010): 24–33.
27
The pH level of test waters was routinely monitored during treatments. At least five different exposure concentrations were applied in a geometric series without adjusting pH after BTO1 application. The test organisms were added to test jars (n=3 per treat-ment) immediately after BTO1 application, except for D. rerio. In each test, control jars received no BTO1 (n=3). The following response variables were determined: 1) root length and leaf number of duckweed (IC50, L. minor), 2) mobility of the water flea (EC50, D. magna), 3) survival rate of the water louse (LC50, A. aquaticus), zebrafish (LC50, D. rerio), oligochaeta worm (LC50, L. variegatus) and pond snail (LC50, Lymnea sp.), 4) inhibition of light emission capacity of the bacteria (IC50, V. fisheri) and 5) the number of cells of the algae S. gracilis. The organisms applied in the short-term toxicity test were not fed during the tests.
Daphnia magna – water flea (Crustacea)
A 48 h acute test with D. magna was performed according to standard procedure of ISO 6341 (1996) on up to 24h old newborns of daphnids obtained from the laboratory culture of the Fin-land’s Environmental Administration. Before using in the toxicity test, D. magna were kept in the test medium (reconstituted water (Elendt M7) prepared according to the OECD guideline (OECD 1997) for two months before the start of the experiment. Five newly hatched juveniles were carefully placed in each glass jar (20 ml vol.) containing 10 ml of solution. BTO1 concentrations ranged from 18 to 381 mg l-1 test medium, each with 3 replicates. The jars were covered with Parafilm® M and kept in complete darkness at 22 oC. At time 24 and 48 h, surviving animals were counted.
Lemna minor – lesser duckweed (Araceae)
Growth inhibition test was carried out according to the ISO/WD standard 20079 (2005). Whole, healthy duckweed was collected from a pond in the city of Lahti, Southern Finland and kept in the pond water until the start of the test. The
test medium was a modification of the Swedish standard (SIS) Lemna growth medium with pH adjusted to 6.5. The exposure concentrations ranged from 30 to 4900 mg l-1 test medium, each with 3 replicates. The test was performed in 50 ml glass Erlenmeyer flasks. Seven double-fronded healthy L. minor individuals, were transferred to each test flask. Before transformation, roots of the plants were removed. The flasks were covered with Parafilm® M to minimize evaporation and kept in continuous light (20000 lx) at 22 oC. After seven days, the number of fronds and the length of roots were measured.
Asellus aquaticus – water louse (Crustacea)
A mortality test was performed following the common guidelines by USEPA (2002). Before the test, Asellus individuals − collected from the field − were kept in jars filled with lake water containing sand and decomposing litter of Alnus glutinosa L. (Betulaceae). Asellus were not acclimated to the test water prior to exposure because acclimation may result in differentiation between individuals. Availability of Asellus was rather limited and ac-climation of animals may therefore prove to be use-less if animals exposed to changing environmental conditions are likely to die within the acclimation period. Because some BTO compounds can bind to humus in lake water, artificial freshwater, prepared according the SFS 5062 (1984) -standard, was used as a test solution. Three replicates were prepared for each test concentration that ranged from 229 to 4900 mg BTO1 l-1. The test was performed in 125 ml glass jars containing 100 ml test solution. Three adult Asellus individuals were placed in each jar which was covered with Parafilm® M. The jars were kept at 22 oC with a light:dark cycle 12:12h. Survival rate was recorded at time 24 and 48 h.
Danio rerio – zebrafish (Cyprinidae)
The mortality test for D. rerio was performed ac-cording to the standard procedure from the OECD Guideline 203 (1992). Fish, with an average length

A G R I C U L T U R A L A N D F O O D S C I E N C E
Hagner, M. et al. Acute toxicity of birch tar oil
26
A G R I C U L T U R A L A N D F O O D S C I E N C E
Vol. 19(2010): 24–33.
27
of 2 ±1 cm, originated from a commercial fish stock. The fish were held in the laboratory for 14 days before testing and fed once a day with commercially available fish (flake) food. Tap water was used as the test medium with TetraAqua® AquaSafe neu-tralizer (5 ml/10l test water) to improve the water quality for the fish. The test medium was allowed to stabilize for two days before BTO1 addition. The BTO1 concentrations ranged between 120 and 510 mg l-1 water (n=2). At 24 h after addition of BTO1, seven fish individuals were added to each tank (7000 ml capacity), containing 6000 ml water, and covered with plastic film. Tanks were kept at 22 oC with a light:dark cycle of 12:12h. During the test, tanks were aerated continuously ( > 6 % saturation) and the oxygen concentration and pH were measured every 24 h. Surviving fish were recorded at 24, 48, 72 and 96 h after the start of the test.
Lumbriculus variegatus – worm (Lumbriculidae)
The mortality test using L. variegatus worms fol-lowed the common guidelines by USEPA (2002) using worms originating from cultures maintained at the Department of Ecological and Environmental Sciences, University of Helsinki. Artificial fresh-water, prepared according to the SFS 5062 (1984) –standard, was used as the test medium. The BTO1 test concentrations ranged from 30 to 4900 mg l-1 test medium, each with 3 replicates. The test was performed in 125 ml glass jars, containing 100 ml test solution and covered with Parafilm® M. Five adult worms were carefully placed in each replicate jar which were kept at 22 oC with light:dark cycle of 12:12 h. The number of surviving worms was estimated at 24 and 48 h.
Lymnea sp. – fresh water snail (Lymnaeidae)
The mollusc mortality test with Lymnea sp. was performed following the guidelines described by USEPA (2002). Field-collected molluscs were kept
in the laboratory in lake water one week before the start of the test. Artificial water was used as a test solution and prepared according to the SFS 5062 (1984) -standard. The experimental unit comprised 125 ml glass jars, each containing 100 ml test solution. The BTO1 test concentrations ranged between 80 and 8160 mg l-1 test medium, each with 3 replicates. Three snails were placed in each jar, covered with Parafilm® M, and kept at 22 oC with light:dark cycle of 12:12 h. Surviving molluscs were counted at 24 and 48 h.
Vibrio fischeri – gram negative bacteria (Vibrionaceae)
The BioTox method is a traditional and standard-ized way to measure the toxicity of chemicals using the photobacteria Vibrio fischeri. Briefly, the metabolic pathway responsible for light emission by the bacterium is intrinsically linked to cellular respiration and any disruption of normal cellular metabolism causes a decrease in light production. Toxicity assessment was performed using freeze-dried V. fischeri (strain NRRL B-11177, Aboatox Oy, Finland). The reagent was stored at -20 oC to preserve microbial activity. BTO test concentra-tions ranged between 30 and 4900 mg BTO1 l-1 test medium, each with 2 replicates. A 15 and 30 min luminescence inhibition test was performed according to the ISO 11348-3 (1998) -standard. Light emission was measured using a luminometer after 15 and 30 minutes exposure.
Scenedesmus gracilis – green algae (Scenedesmaceae)
Algae was obtained from a monospecies culture of S. gracilis and supplied by the Lammi Biological Station, University of Helsinki. A growth inhibi-tion test was performed according to the OECD Guideline 201 (1984). Algae were cultured in algal medium according to the guideline two months prior to the start of the test. BTO1 concentrations

A G R I C U L T U R A L A N D F O O D S C I E N C E
Hagner, M. et al. Acute toxicity of birch tar oil
28
A G R I C U L T U R A L A N D F O O D S C I E N C E
Vol. 19(2010): 24–33.
29
highest concentrations tested (A. aquaticus > 1058 mg BTO1 l-1, L. variegatus > 381 mg BTO1 l-1, D. magna > 229 mg BTO1 l-1 and D. rerio > 370mg BTO1 l-1, Lymnaea sp. > 1760 mg BTO1 l-1), while the lowest concentrations tested (A. aquaticus <229 mg BTO1 l-1, L. variegatus <49 mg BTO1 l-1, D. magna <137 mg BTO1 l-1 and D. rerio <229 mg BTO1 l-1, Lymnaea sp. < 635 mg BTO1 l-1) had no observable effects on the mortality of the animals (Fig. 1, 2, 3, 4 & 5).
Growth of L. minor in control cultures was rapid, although not exponential, during the test period. The number of fronds had quadrupled by the seventh day of the test and remained green and healthy throughout the test. Growth was complete-ly inhibited and the fronds turned white in color at the highest concentrations tested (381-4900 mg BTO1 l-1 growth medium). Interestingly, the low-est test concentrations (30-137 mg BTO1 l-1) had a positive effect on the number of fronds and the length of roots (Fig. 6). The IC50 (Day 14) for root length in L. minor was 231 mg BTO1 l-1, and 229 mg BTO1 l-1 for the number of fronds.
In the absence of BTO1, the growth of the alga S. gracilis was exponential, increasing from ~900 cells ml-1 to 22 000±2000 cells ml-1 after 72 h. Only the highest exposure concentration (381 mg BTO1 l-1) produced a slight inhibition of the cell growth, thereby preventing the calculation of the IC50 value. An opposite pattern was observed in the luminescence inhibition test where the acute IC50 value for V. fisheri could not be calculated because BTO1 caused 85% luminescence inhibition even at the lowest tested concentration (30 mg l-1). It is possible that a colouring effect of BTO1 in the samples may have had an affect on light inhibition.
The sensitivity of different species to BTO1 was variable among the taxa, with the rank order being: V. fisheri (IC50 < 30 mg l-1) > D. magna (EC- 155 mg l-1) < L. variegates (LC50 176 mg l-1) < L. minor (IC50 229-231 mg l-1) < S. gracilis < D. rerio (LC50 320 mg l-1) < A. aquaticus (LC50 397 mg l-1) < Lymnaea sp. (LC50 866 mg l-1) (Table 1.).
ranged from 49 to 381 mg l-1 test medium, each with 3 replicates. The initial cell concentration of S. gracilis in test flasks was ~900 cells ml-1. The test was performed in 250 ml glass Erlenmeyer flasks, containing 100 ml test solution and covered with a plug of cotton wool to allow gas exchange during the test. The algae were incubated in the suspension under constant shaking (100 rpm) and continuous illumination (10 000 lx) at 22±1 oC. The cell concentrations and pH of the solutions were determined at 24, 48 and 72 hours after the start of the test. Cell concentrations were determined by microscopic counting. pH of the solvents was measured in the beginning and at the end of the experiment.
Data analysis
EC50 values and 95% confidence limits of BTO1 for L. variegatus, D. rerio, A. aguaticus, and Lymnaea sp. were calculated by regression using the Probit analysis (SPSS 1999). EC50 values for V. fisheri could not be calculated due to the 85% luminescence inhibition taking place already under the most diluted BTO1 concentration (30 mg l-1). The calculation of IC50 values for L. minor, D. magna, and S. gracilis was carried out according to the following logistic model by Haanstra et al. (1985): Y = Ymax / (1 + (conc/EC50)^b)). Where Y = response (e.g. number of roots/fronds/juve-niles); Ymax = maximum response in the untreated controls;EC50 = concentration at which response is 50% of that in the controls; and b = slope of the dose-response curve.
Results
As the mortality level in all control tests were below 10%, the toxicity tests for A. aquaticus, L. varie-gatus, D. magna, Lymnaea sp. and D. rerio were considered valid. Mortality rate was 100% at the

A G R I C U L T U R A L A N D F O O D S C I E N C E
Hagner, M. et al. Acute toxicity of birch tar oil
28
A G R I C U L T U R A L A N D F O O D S C I E N C E
Vol. 19(2010): 24–33.
29
DiscussionOur study demonstrates that aquatic organisms appear to be variably responsive to BTO1. The tests revealed the mollusc (Lymnaea sp.) and the crustacean (A. aquaticus) to be more tolerant to BTO1 than the other tested organisms, whereas D. magna (small-sized crustacean) and L. variegates (Oligochaeta worm) were, in general, most sensi-tive to BTO1. Species-specific structural, as well as functional characteristics are often associated with the bioavailability of a chemical compound, which often explains the differences in sensitivity between species. For example, D. magna, a widely used species in toxicological testing (van der Ohe and Liess 2004), is exposed to various toxicants both through feeding and cuticula (Olsen et al.
Fig. 5. Effect of BTO1 on survival rate (%) of Lymnaeae sp. after 24 and 48 h exposure.
Fig. 6. Effects of BTO1 on the number of fronds (=lines with squares) and the length of roots (=lines with cir-cles) in L. minor after 7 d exposure.
Fig. 1. Survival rate (%) of D. magna after 24 h expo-sure on different BTO1 concentrations.
Concentration (mg l-1 )
Survival (%)
0102030405060708090
100
0 18.0 29.6 49.4 82.3 137.2 228.6 381.0
Fig. 2. Survival rate (%) of L. variegatus as a function of concentrations of BTO1 after 24 and 48..
0102030405060708090
100
49002940176410586353812291378249300Concentration (mg l-1 )
Survival (%)
24h48h
Fig. 3. Survival rate (%) of D. rerio as a function of con-centrations of BTO1 after 24 and 96 h exposure.
00
102030405060708090
100
119 140 165 194 229 333 370 412 457 508Concentration (mg l-1 )
Survival (%)
24 h96 h
Fig. 4. Survival (%) of A. aquaticus as a function of BOD1 after 24 (=lines with circles) and 48 (=lines with squares) h exposure.
0102030405060708090
100
49002940176410586353812290
Concentration (mg l -1 )
Survival (%)
24h48h
0102030405060708090
100
81634900294017641058635381229137820
Concentration (mg l-1 )
Survival (%)
-60-40-20
020406080
10049002940176410586353812291378249300
Concentration (mg l-1 )
Growth inhibition (%)
number of frondslength of roots

A G R I C U L T U R A L A N D F O O D S C I E N C E
Hagner, M. et al. Acute toxicity of birch tar oil
30
A G R I C U L T U R A L A N D F O O D S C I E N C E
Vol. 19(2010): 24–33.
31
2005). The higher tolerance of A. aquaticus, also a crustacean, can be explained by its larger body size (4-12 mm, van Hattum 1995), around twice as long as D. magna (Koivisto 1995). The sensitivity of L. variegatus can be a consequence of its thin surface epithelium, while the shell of Lymnaea sp. evidently provides these fauna with efficient protection against harmful substances, despite their disability to close the frontal aperture of the shell due to the lacking operculum (Olsen et al. 2005). According to von der Ohe and Liess (2004), most species of Oligochaeta worms and Isopoda crustaceans (A. aquaticus) are less sensitive to organic compounds and metals than D. magna, a Branchiopoda crustacean, while molluscs are commonly the least sensitive group to organic compounds. Our results corroborate these findings and further show that while the impact of moderate to high concentrations of BTO1 on aquatic organisms was low, a small additional burden may have disproportionately large impacts.
Surprisingly, the duckweed Lemna minor ap-peared to react positively to BTO1 by increasing the number of fronds and the length of roots at low BTO1 concentrations. Other studies have shown that L. minor has reacted positively to certain or-ganic toxicants, which was speculated to be derived from hormone-like effects at low chemical expo-
sure levels (Sherry et al. 1997, Song and Huang 2005). In our case, the plants may have benefited from growth promoting nutrients in the birch tar oils, but this needs to be investigated in more de-tail. Interestingly, a similar response pattern was missing in algae (S. gracilis) in the present study.
According to the Categories of Ecotoxicity for pesticides (Kamrin 2000), the toxicity of a pesticide-active ingredient is qualitatively classi-fied to be very highly toxic to aquatic organisms if its LC50 value is less than 100 µg l-1. The sub-stance is considered nontoxic if the LC50 value is over 100 000 µg l-1. We found that the majority of acute toxicity values of BTO1 were above this limit with the exception of V. fisheri, whereby the exact IC50 value could not be obtained. In comparison to other pesticides such as Malathion, a widely used organophosphorus insecticide, the LC50 for D. magna is 1–2.35 µg l-1 (LC50 24 and 48 h; Keller and Ruessler 1997, Cano et al. 1999), and for D. rerio is 19.8 mg l-1 (LC50 96 h; Lange et al. 1995). As with BTO, Glyphosate (herbicide) can stimu-late the growth of L. minor in (EC50 = 2 µg l-1; 14 d) (Hartman and Martin 1984) but is toxic at low concentrations to D. magna (EC50 = 95.96 µg l-1; 48 h) (Alberdi et al. 1996). In the current study, the EC50 values of BTO1 for the organisms tested
Table 1. The acute toxicity (EC50-values with 95% confidence limits) of BTO1 for the tested aquatic organisms.
Test species Duration of test E/L/IC50 (mg l-1)
95% L.C.I (mg l-1)a
95% U.C.I (mg l-1)b
Daphnia magna EC50 48 h 155 nd nd
Asellus aquaticus LC50 48 h 397 314 492
Lumbriculus variegatus LC50 48 h 176 134 232
Vibrio fisheri IC50 30 min <30 - -
Lemna minor (root) IC50 7 d 231 157 305
Lemna minor (frond) IC50 7 d 229 33 425
Lymnaea sp. LC50 48 h 866 659 1132
Scenedesmus gracilis IC50 72 h - - -
Danio rerio LC50 96 h 320 297 337 a 95% lower confidence interval (LCI) b 95% upper confidence interval (UCI)
EC = effect, LC = lethal and IC = inhibition concentration

A G R I C U L T U R A L A N D F O O D S C I E N C E
Hagner, M. et al. Acute toxicity of birch tar oil
30
A G R I C U L T U R A L A N D F O O D S C I E N C E
Vol. 19(2010): 24–33.
31
ranged from between <30 and 866 mg BTO1 l-1 and is therefore much less toxic to most aquatic organ-isms than, for example, Malathion or Glyphosate.
The very steep dose response curve and high effective concentration indicates that BTO is only baseline toxic (Könemann 1981). Therefore it is unlikely that the effective compound/compounds represent just a fraction of the compounds in BTO1, or that the proportion of such biologically effective substances can vary between production runs. Furthermore, it is possible that, while a par-ticular effective compound(s) in BTO can elicit a response by a target organism, it can be practically non-toxic for many aquatic organisms when ex-isting in a mixture. Interestingly, aquatic animals appear to be more sensitive to birch tar oils than soil animals (Hagner et al. 2010), which effect is likely to stem from the difference in the amounts of bioavailable fractions of BTO between aquatic and terrestrial environments. Because BTO is a suspension with a complex mixture composition it was not possible for us to determine real dis-solved/bioavailable BTO1 concentrations and its changes in test medium over time. More investiga-tions are required to determine the risks of BTO1 to the aquatic environment. The tests of S. gracilis and V. fisheri should be repeated with higher/lower concentrations to get a comprehensive assessment of BTO1. All risk related topics of BTO belongs to the next step of the project and in future envi-ronmental Quality Standards will be derived using data available from this and other studies (Hagner et al. 2010, Lindqvist et al. 2010).
In contrast to some other toxic mixtures, such as creosote or municipal wastewaters, BTO has to be treated as a single chemical compound given the lack of comprehensive information on the active compounds present in the distillate. Furthermore, to better understand the mechanism behind the sen-sitivity of aquatic or terrestrial organisms to birch tar oils, a thorough investigation of the chemical composition of BTO is required. Knowledge of the chemical composition of BTO will also be essen-tial for EU registration and future permitted use as a biological plant protection product. In conclu-sion, our toxicity tests showed that a wide range of aquatic organisms are, to some extent, sensitive to
BTO, but further suggest that BTO does not pose a severe hazard to aquatic biota. We deduce that, unless BTO is not applied in the immediate vicinity of water bodies, no special precaution is required.
ReferencesAccinelli, C., Vicari, A., Pisa, P.R. & Catizone, P. 2002.
Losses of atrazine, metolachlor, prosulfuron and triasul-furon in subsurface drain water. I. Field results. Agron-omie 22: 399−411.
Alberdi, J.L. Sáenz, M.E., Di Marzio, W.D. & Tortorelli, M.C. 1996. Comparative acute toxicity of two herbicides, para-quat and glyphosate to Daphnia magna and D. spinu-lata. Bulletin of Environmental Contamination and Toxi-cology 57: 229−235.
American Chemical Society 2007: Homepage. Updated(29.April 200). Cited 13 June 2007. Available on the internet: http://www.cas.org/expertise/cascontent/registry/reg-syst.html?WT.mc_id=casrn708&WT.srch=1.
Cano, E., Jimenez, A., Cabral, J.A. & Ocete, M.E. 1999. Acute toxicity of Malathion and new surfactant “Genapol OXD 080” on species of rice basins. Bulletin of Envi-ronmental Contamination and Toxicology 63: 133-138.
Connell, D., Lam, D., Richardson, B. & Wu, R. 1999. In-troduction to ecotoxicology. Blackwell Publishing. Great Britain. 170 p.
EC 1996. Technical guidance documents in support of the Commission Directive 93/67/EEC on risk assessment for new notified substances and the Commission Regulation (EC) 1488/94 on risk assessment for existing substanc-es. European Comission, Brussels, Belgium.
Haanstra, L., Doelman, P., & Oude Voshaar, J.H. 1985. The use of sigmoidal dose response curves in soil ecotoxico-logical research. Plant and Soil 84: 293−297.
Hagner, M. 2005. Koivutisle torjunta-aineena: vaikutuk-set lehtokotiloon (Arianta arbustorum) ja maaperään (in Finnish). Masters thesis. University of Helsinki. Depart-ment of Ecological and Environmental Sciences. 39 p.
Hagner, M., Pasanen, T., Penttinen, O-P., Lindqvist, B., Lindqvist, I., Tiilikkala, K., & Setälä, H. 2010. Effects of birch tar oil on soil organisms and plants. Agricultural and Food Science 19: 13–23.
Hanazato, T. 1998. Response of a zooplankton commu-nity to insecticide application in experimental ponds: a review and the implications of the effects of chemicals on the structure and functioning of freshwater commu-nities. Environmental pollution 101: 361−373.
Hartman, W.A. & Martin, D.B. 1984. Effects of suspend-ed bentonite clay on the acute toxicity of glyphosate to Daphnia pulex and Lemna minor. Bulletin of Environmen-tal Contamination and Toxicology 33: 355−361.
Hatch, A.C. & Burton, Jr., G.A. 1998. Effects of photoin-duced toxicity of fluoranthene on amphibian embryos and larvae. Environmental Toxicology and Chemistry 17: 1777-1785.
A G R I C U L T U R A L A N D F O O D S C I E N C E
Hagner, M. et al. Acute toxicity of birch tar oil
32
A G R I C U L T U R A L A N D F O O D S C I E N C E
Vol. 19(2010): 24–33.
33
van Hattum, B. 1995. Bioaccumulation of Sediment-bound Contaminants by the Freshwater Isopod Asellus aquati-cus (L.). Doctoral thesis. Institute for Environmental Stud-ies of the Vrije Universiteit. 243 p.
ISO 1996. Water quality - Determination of the inhibition of the mobility of Daphnia magna Straus (Cladocera, Crustacea). Acute toxicity test. ISO 6341. International Organisation for Standardization. 13 p.
ISO 1998. Water quality - Determination of the inhibitory effect of water samples on the light emission of Vibrio fischeri (Luminescent bacteria test). Part 3: Method us-ing freeze-dried bacteria. ISO 11348-3. International Or-ganisation for Standardization. 13 p.
ISO 2005. Water quality - Determination of the toxic effect of water constituents and waste water to duckweed (Lemna minor) - Duckweed growth inhibition test. ISO/CD 20079. International Organisation for Standardization. 23 p.
Kamrin, M.A. 2000. Pesticide Profiles: Toxicity, Environ-mental Impact, and Fate. CRC Press LLC, New York. 704 p.
Keller, A.E. & Ruessler, D.S. 1997. The toxicity of mala-thion to unionid mussels: Relationship to expected en-vironmental concentrations. Environmental Toxicology and Chemistry 16: 1028-1033.
Koivisto, S. 1995. Is Daphnia magna an ecologically rep-resentative zooplankton species in toxicology tests? En-vironmental Pollution 90: 263−267.
Könemann, H. 1981. Fish toxicity tests with mixtures of more than two chemicals: A proposal for a quantita-tive approach and experimental results. Toxicology 19:229−238.
Lange, M., Gebauer, W., Markl, J. & Nagel, R. 1995. Com-parison of testing acute toxicity on ambryo of Zebrafish, Branchydanio rerio and RTG-2 cytotoxicity as possible alternatives to the acute toxicity test. Chemosphere 30: 2087−2102.
Larson, S.J., Capel, P.D., Goolsby, D.A., Zaugg, S.D & Sandstrom, M.W. 1995. Relations between pesticide use and riverine flux in the Mississippi River basin. Chem-osphere 31: 3305−3321.
Lindqvist, I., Lindqvist, B., Tiilikkala, K., Hagner, M. & Setälä, H. 2010. Birch tar oil is an effective repellent for snails. Agricultural and Food Science 19: 1–12.
Murwanashyaka, J.N., Pakdel, H. & Roy, C. 2002. Fraction-al vacuum pyrolysis of biomass and separation of phe-nolic compounds by stream distillation. In: Bridgewater A.V. (Ed.). Fast Pyrolysis of Biomass, A Handbook, vol-ume 2. CPL Press, Newbury, UK, p. 407−409.
OECD 1984. OECD guideline for testing of chemicals. No. 201. “Alga, Growth Inhibition Test”. Organization for
Economic Development. 14 p.OECD 1992. OECD guideline for testing of chemicals. No.
203. “Fish, Acute Toxicity Tests”. Organization for Eco-nomic Development. 9 p.
OECD 1997. Report on the Final Ring Test of the Daphnia magna Reproduction Test. OECD Environmental Health and Safety Publications. Series on Testing and Assess-ment. No. 6. Environment Directorate. 190 p.
Olsen, L-H., Sunesen, J. & Pedersen, V. 2005. Vesikirp-pu ja sudenkorento: makean veden eläimiä (in Finnish). WSOY, Porvoo. 231 p.
Salonen, J., Tiilikkala, K., Ruuttunen, P., Lindqvist, I. & Lindqvist, B. 2008. Birch Tar Oil: A Potential Herbicide from the Forests of Finland. In: Abstracts of the 5th In-ternational Weed Science Congress. Weeds local prob-lems/global challenge. Vancouver, British Columbia, Canada. p. 286−287
SFS 1984. Vesitutkimukset. Akuutin myrkyllisyyden määr-itys Daphnia Magna Straus vesikirpulla. SFS 5062 (in Finnish) Finnish Standards Association. 9 p.
Sherry, J, Scott, B. & Dutka, B. 1997. Use of various acute, sublethal and early life-stage tests to evaluate the toxic-ity of refinery effluents. Environmental Toxicology and Chemistry 16: 2249−2257.
Shipitalo, M.J. & Owens, L.B. 2003. Atrazine, deethylat-razine, and deisopropylatrazine in surface runoff from conservation tilled watersheds.Environmental Science and Technology 24: 944–950.
Song, Z.H. & Huang, G.L. 2005. Toxic effects of pentachlo-rophenol on Lemna minor. Bulletin of Environmental Contamination and Toxicology 74: 1166-1172.
SPSS, 1999. SPSS for Windows 10.0. publication 9.0.1. SPSS, Chicago.
Tiilikkala, K. & Salonen, J. 2008. Birch tar oil (BTO) a potential bi-ological pesticide from forests. In: Biorefinery Joint Call InfoDay. Information Booklet. Brussels. 85 p.
USEPA 2002. Methods for Measuring the Acute Toxicity of Effluents and Receiving Waters to Freshwater and Ma-rine Organisms. EPA-821-R-02-012. 5th edition. United States Environmental Protection Agency. 266 p.
van Hattum, B. 1995. Bioaccumulation of Sediment-bound Contaminants by the Freshwater Isopod Asellus aquati-cus (L.). Doctoral thesis. Institute for Environmental Stud-ies of the Vrije Universiteit. 243 p.
von der Ohe, P.C. & Liess, M. 2004. Relative sensitivity distribution of aquatic invertebrates to organic and met-al compounds. Environmental Toxicology and Chemis-try 23: 150–156.

A G R I C U L T U R A L A N D F O O D S C I E N C E
Hagner, M. et al. Acute toxicity of birch tar oil
32
A G R I C U L T U R A L A N D F O O D S C I E N C E
Vol. 19(2010): 24–33.
33
SELOSTUS
Koivuöljytisleen akuutti myrkyllisyys vesieliöilläMarleena Hagner, Olli-Pekka Penttinen, Tiina Pasanen, Kari Tiilikkala ja Heikki Setälä
Helsingin yliopisto ja MTT
A G R I C U L T U R A L A N D F O O D S C I E N C E
Vol. 19 (2009): 34–42.
34
A G R I C U L T U R A L A N D F O O D S C I E N C E
Vol. 18 (2009): 34–42.
35
© Agricultural and Food Science Manuscript received October 2008
Efficacy of fungicide tebuconazole in barley varieties with different resistance level
Pille Sooväli1, 2* and Mati Koppel1
1Jõgeva Plant Breeding Institute, Aamisepa 1, 48309 Jõgeva, Estonia2Institute of Agricultural and Environmental Sciences, Estonian University of Life Sciences, Kreutzwaldi 1,
51014 Tartu, Estonia, *e-mail: [email protected]
Efficacy of the fungicide tebuconazole was tested in 2 treatment regimes in 3 spring barley varieties over three years (2003–2005). The impact of the fungicide on the control of major barley pathogens Pyrenophora teres and Cochliobolus sativus, as well as kernel yield was studied in the course of field trials. The fungicide treatments had a strong impact on the control of infection of P. teres and increased kernel yield in variable disease infection conditions. For the more resistant genotype, fungicide application had relatively low returns because of the much higher level of biological resistance and small disease-related yield reductions. For the susceptible genotype, severe disease infection caused bigger yield reduction, not compensated by the use of fungicides. Use of fungicide demonstrated the highest economic return in the case of the moderately susceptible barley variety.
Key-words: spring barley, net and spot blotch, tebuconazole, application time, yield, quality
Introduction
Spring barley is the prevailing spring crop in Estonia, with growing area of 128.2 thousand ha, occupy-ing 48.2% of the total area under cereals in 2004 (www.stat.ee). In Estonian conditions, spot blotch, caused by Cochliobolus sativus (Ito & Kurib.) Drechsler, am Bipolaris sorokiana (Sacc.) Shoem.
Syn. Helminthosporium sativum P.K. et B) and net blotch, caused by Pyrenophora teres Drechsl. am. Drechlera teres (Sacc.) Shoem. (Palmer 1989, Mathre 1997), are serious foliar diseases of barley (Hordeum vulgare), causing serious yield and quality reduction. Both pathogens are mainly controlled by fungicide treatments. Estonian disease monitoring of the last decade has shown that the occurrence of net blotch is increasing, which is directly related

A G R I C U L T U R A L A N D F O O D S C I E N C E
Vol. 19 (2009): 34–42.
34
A G R I C U L T U R A L A N D F O O D S C I E N C E
Vol. 18 (2009): 34–42.
35
to the grown cultivars (Tamm 2003). Other com-mon barley diseases - powdery mildew (Erysiphe graminis f. sp. hordei E.M. Syn. Blumeria graminis (DC) E.O. Speer f.sp. hordei E.M.) (Mathre 1997) and scald (Rhynchosporium secalis (Oudem.) J.J. Davis) (Mathre 1997) – have been rather infrequent during the last years and have rarely crossed the threshold of economic importance.
Net blotch has been widely spread in particular years and is a serious problem in untreated fields. The first symptoms of P. teres can be seen in barley leaves starting from GS 12, the symptoms of C. sativus normally develop at later growth stages, in Estonian conditions after GS 37–39. The time and level of disease infection in the field depends on the susceptibility of the used variety, therefore the resistance of varieties has a great importance in the control of plant diseases. Use of fungicides reduces the occurrence of fungal diseases and thereby re-duces yield losses, increasing the economic profit. Economic profitability of fungicide use in spring barley is questionable during the years less suitable for disease development. The best disease control and yield increase are achieved by fungicide ap-plication at the early and late development stages of the crop plant (split application) but because of the high costs of fungicide application, the eco-nomic result could often be negative. Trial results from several countries have shown that despite of achieved yield increase, the high cost of fungicide application does often result in negative net rev-enue (Jørgensen 2006, Tischner et al. 2006, Laine et al. 2007). Higher net revenue is achieved by use of reduced fungicide doses at a later stage of plant development (after GS 37).
The aim of the study was to find out the efficacy of fungicides at different disease control intensities on spring barley varieties differing in the resist-ance level.
Fungicide trials usually deal with the effect of different fungicides and their doses on reduction of disease incidence and increase of yield or net rev-enue. Less attention is paid to the influence of the variety on the size of harvested yield and formation of net revenue. The objective of this study was to find out whether fungicide treatments would be jus-tified in relation to the low grain prices in Estonia.
In our study we used split application of tebu-conazole (250 g. a.i.; trade name in Estonia: Folicur 250EW) and reduced doses of the fungicide rec-ommended by decision support system PC–Plant Protection (PC–P) (Jørgensen et al. 2003). PC–P adjusts the fungicide dose according to the vari-ety resistance, growth stage, disease pressure and efficacy of fungicide. Split fungicide application provides long-lasting protection and has the best effect in control of diseases but compared to other treatment regimes, the cost of application is higher. PC–P is designed to recommend the minimum fun-gicide dose during the critical stage of disease de-velopment to restrict the development of diseases and to achieve the highest economic returns.
Implementation of integrated control strate-gies needs comprehensive studies on the efficacy of plant protection on varieties with different resist-ance levels and at different application intensities.
Material and methods
Field trials on disease control of spring barley were arranged with three replicates in a randomized design 20 m² plots at the rate of 500 germinating seeds per 1 m² at Jõgeva Plant Breeding Institute during the three seasons of 2003–2005. Three two-row spring barley varieties with different resistance levels were used: Anni (moderately resistant to net and spot blotch), Barke (moderately susceptible to net and spot blotch) and Extract (susceptible to net and spot blotch). Untreated certified seed was used for all varieties. The varieties were selected based on data from previous disease scoring trials in the same region (Tamm 2003). Fungicide ap-plication was started upon the first symptoms of infection (Table1). The effect of split application of tebuconazole 0.5 l ha-1 at stages BBCH 32–51 (T1) and BBCH 57–65 (T2) was compared with the effect of reduced fungicide dose recommended by the decision support system PC–P for control-ling disease infections on moderately susceptible barley varieties. For the PC–P treatments, the same fungicide dose and application time was used for
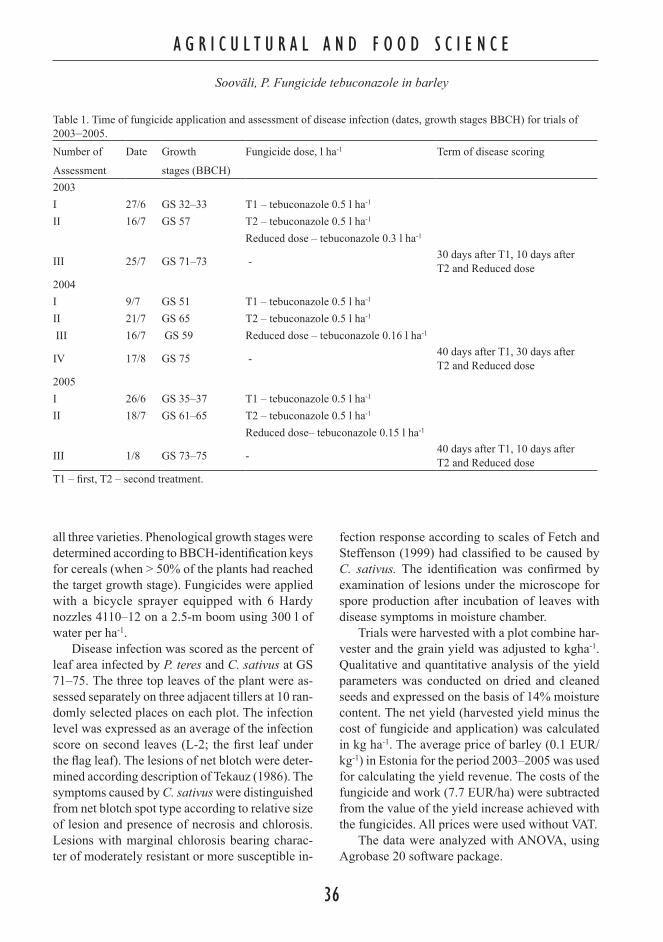
A G R I C U L T U R A L A N D F O O D S C I E N C E
Sooväli, P. Fungicide tebuconazole in barley
36
A G R I C U L T U R A L A N D F O O D S C I E N C E
Vol. 18 (2009): 34–42.
37
all three varieties. Phenological growth stages were determined according to BBCH-identification keys for cereals (when > 50% of the plants had reached the target growth stage). Fungicides were applied with a bicycle sprayer equipped with 6 Hardy nozzles 4110–12 on a 2.5-m boom using 300 l of water per ha-1.
Disease infection was scored as the percent of leaf area infected by P. teres and C. sativus at GS 71–75. The three top leaves of the plant were as-sessed separately on three adjacent tillers at 10 ran-domly selected places on each plot. The infection level was expressed as an average of the infection score on second leaves (L-2; the first leaf under the flag leaf). The lesions of net blotch were deter-mined according description of Tekauz (1986). The symptoms caused by C. sativus were distinguished from net blotch spot type according to relative size of lesion and presence of necrosis and chlorosis. Lesions with marginal chlorosis bearing charac-ter of moderately resistant or more susceptible in-
fection response according to scales of Fetch and Steffenson (1999) had classified to be caused by C. sativus. The identification was confirmed by examination of lesions under the microscope for spore production after incubation of leaves with disease symptoms in moisture chamber.
Trials were harvested with a plot combine har-vester and the grain yield was adjusted to kgha-1. Qualitative and quantitative analysis of the yield parameters was conducted on dried and cleaned seeds and expressed on the basis of 14% moisture content. The net yield (harvested yield minus the cost of fungicide and application) was calculated in kg ha-1. The average price of barley (0.1 EUR/ kg-1) in Estonia for the period 2003–2005 was used for calculating the yield revenue. The costs of the fungicide and work (7.7 EUR/ha) were subtracted from the value of the yield increase achieved with the fungicides. All prices were used without VAT.
The data were analyzed with ANOVA, using Agrobase 20 software package.
Table 1. Time of fungicide application and assessment of disease infection (dates, growth stages BBCH) for trials of 2003–2005. Number of Date Growth Fungicide dose, l ha-1 Term of disease scoring
Assessment stages (BBCH) 2003 I 27/6 GS 32–33 T1 – tebuconazole 0.5 l ha-1
II 16/7 GS 57 T2 – tebuconazole 0.5 l ha-1
Reduced dose – tebuconazole 0.3 l ha-1
III 25/7 GS 71–73 - 30 days after T1, 10 days after T2 and Reduced dose
2004 I 9/7 GS 51 T1 – tebuconazole 0.5 l ha-1
II 21/7 GS 65 T2 – tebuconazole 0.5 l ha-1
III 16/7 GS 59 Reduced dose – tebuconazole 0.16 l ha-1
IV 17/8 GS 75 - 40 days after T1, 30 days after T2 and Reduced dose
2005 I 26/6 GS 35–37 T1 – tebuconazole 0.5 l ha-1
II 18/7 GS 61–65 T2 – tebuconazole 0.5 l ha-1
Reduced dose– tebuconazole 0.15 l ha-1
III 1/8 GS 73–75 - 40 days after T1, 10 days after T2 and Reduced dose
T1 – first, T2 – second treatment.

A G R I C U L T U R A L A N D F O O D S C I E N C E
Sooväli, P. Fungicide tebuconazole in barley
36
A G R I C U L T U R A L A N D F O O D S C I E N C E
Vol. 18 (2009): 34–42.
37
Results
Disease development
Net blotch (P. teres) infection dominated during all the years. The infection was more severe in 2003 and 2004 when it was promoted by high relative humidity and high air temperature (Fig.1a). As expected, in both years, the highest infection levels were observed in the variety Extract (untreated 12.7 and 43.6% respectively). The biggest difference between varieties in terms of infection was observed in 2004 (Fig.1b) when more susceptible varieties Barke and Extract were strongly infected. Hot and
Fig. 1a. Efficacy of tebucona-zole application against P. teres and untreated control on L2 leaves in spring barley varie-ties in 2003. L2= first leaf un-der flag leaf. DAA = days after application. Anni moderately re-sistant, Barke moderately sus-ceptible, Extract susceptible to net blotch. І – LSD0.05 =1.04.
Fig. 1b. Efficacy of tebuconazole application against P. teres and untreated control on L2 leaves in spring barley varieties in 2004. L2= first leaf under flag leaf. DAA = days after application. Anni moderately resistant, Barke moderately susceptible, Extract susceptible to net blotch. І – LSD0.05 =2.54
dry July limited development of P. teres in 2005 when only slight damage by net blotch infection was observed. Only minimal infection occurred on Anni and Extract (untreated 1.5 and 1.7% respectively), infection level in Barke was 2.7% (Fig.1c).
Spot blotch infection caused by C. sativus was observed during all the years (Fig. 2). The infec-tion reached a significant level only in 2004 when C. sativus occupied 19.3–42.8% of leaf area for untreated varieties. Spot blotch infection level was low in 2003 and 2005, being the highest in the sus-ceptible variety Extract. Based on infection levels of both diseases, the trial years can be classified in the following terms: 2003 – medium infection, 2004 – severe infection and 2005 – slight infection.
05
101520253035404550
Tebu
cona
zole 2X
Red
uced
dose
Unt
reat
ed
Tebu
cona
zole 2X
redu
ced
dose
Unt
reat
ed
Tebu
cona
zole 2X
Red
uced
dose
Unt
reat
ed
Anni Barke Extract
Net blotch, % of L2 area diseased 2004
30 DAAb)
02468
10121416
Tebu
cona
zole 2X
Red
uced
dose
Unt
reat
ed
Tebu
cona
zole 2X
Red
uced
dose
Unt
reat
ed
Tebu
cona
zole 2X
Red
uced
dose
Unt
reat
ed
Anni Barke Extract
Net blotch, % of L2 area diseased 2003
30 DAAa)

A G R I C U L T U R A L A N D F O O D S C I E N C E
Sooväli, P. Fungicide tebuconazole in barley
38
A G R I C U L T U R A L A N D F O O D S C I E N C E
Vol. 18 (2009): 34–42.
39
Effect of different factors on disease incidence. Results of ANOVA verified that the impact of the year had the biggest influence on the infection in-tensity of P. teres and C. sativus (Table 2). The year and treatment were major factors determining the infection level with P. teres. The infection level with C. sativus was mostly determined by year, variety and year by variety interactions. Other fac-tors’ influence on the infection level was smaller. The coefficients of determination indicate that environmental and genetic factors’ contribution to the occurrence of P. teres was 72% (R²=0.72). The occurrence of C .sativus was less dependent on environmental and genetic factors (R²=0.46). The rest is related to some other factors.
Fig. 1c. Efficacy of tebucon-azole application against P. teres and untreated control on L2 leaves in spring barley varieties. L2= first leaf under flag leaf. DAA = days after applica-tion. Anni moderately resistant, Barke moderately susceptible, Extract susceptible to net blotch. І – LSD0.05 = 0.51.
Fig. 2. Efficacy of tebuconazole application against C. sativus and untreated control on L2 leaves in spring barley varieties during 2003–2005. L2= first leaf under flag leaf. DAA =days after first treat-ment. Anni moderately resist-ant, Barke moderately sus-ceptible, Extract susceptible to spot blotch. І – LSD0.05 = 0.71 (2003); 2.25 (2004); 0.42 (2005).
0
1
2
3
4
5
Tebu
cona
zole 2X
Red
uced
dose
Unt
reat
ed
Tebu
cona
zole 2X
Red
uced
dose
Unt
reat
ed
Tebu
cona
zole 2X
Red
uced
dose
Unt
reat
ed
Anni Barke Extract
Net blotch, % of L2 area diseased 2005
30 DAAC)
05
101520253035404550
Tebu
cona
zole 2X
Red
uced
dose
Unt
reat
ed
Tebu
cona
zole 2X
Red
uced
dose
Unt
reat
ed
Tebu
cona
zole 2X
Red
uced
dose
Unt
reat
ed
Anni Barke Extract
Spot blotch, % of L2 area diseased 2003–2005, 30 DAA
2003 2004 2005
Effect of fungicide application on disease control
As expected, the best disease control effect was achieved with two treatments per season. Two fun-gicide applications were needed in 2004 to control severe disease pressure. Also in conditions of low disease infection in 2005, split application of Foli-cur 250EW resulted in significantly better disease control effect than the use of reduced dose according to PC–P. Application of reduced fungicide dose ac-cording to PC–P was sufficient to control the spread of P. teres and C. sativus in spring barley in 2003 when the right timing for the application and the optimal dose for the disease pressure were chosen.

A G R I C U L T U R A L A N D F O O D S C I E N C E
Sooväli, P. Fungicide tebuconazole in barley
38
A G R I C U L T U R A L A N D F O O D S C I E N C E
Vol. 18 (2009): 34–42.
39
Grain yield
The intensity of plant protection caused signifi-cant differentiation in yields of tested varieties by treatment variants (Fig. 3). Two applications with the half-dose of tebuconazole improved disease control and resulted in the best yield in all varie-ties in all years. In all years, the split-treatment strategy brought about higher yield increase for more susceptible varieties Barke and Extract. Yield increase resulting from PC–P –based fungicide application was significantly lower than that from split application. The moderately resistant variety Anni had relatively low returns on both treatment regimes because of the much higher level of bio-logical resistance.
Fungicide impact on net revenue. Comparing the economic benefit of the extra yield produced by the barley varieties treated by the two strategies, the net yield of moderately resistant variety Anni did not increase, but was even reduced in result of PC–P treatment (Table 3). The yields of the other varieties were equal to or exceeded the control crop. In accordance with these results, we have to examine the possibility that use of fungicides at later growth stages may reduce yield formation in more resistant varieties. Because of low disease pressure, the use of fungicides was not profitable on any of the varieties in 2005.
Table 2. Mean squares of ANOVA of infection data of P. teres and C. sativus.
Net blotch p>F Spot blotch p>F
Treatment 20.8 0.000 4.0 0.000Year 58.0 0.000 38.8 0.000Variety 7.7 0.000 37.0 0.000Year by treatment 8.7 0.000 2.0 0.000Year by variety 2.8 0.000 16.4 0.000Year by variety by treatment 2.1 0.000 1.8 0.000R² 0.7236 0.4608
Fig. 3. Yield increase kg ha-1 in fungicide treated variants in com-parison with untreated control crop in 2003–2005.I - LSD0.05 = 182 (2003); 494 (2004); 178 (2005). Yields of un-treated control crop (kg ha-1) in the trials were 1) in 2003: Anni 4451, Barke 3356, Extract 3693, 2) in 2004: Anni 5924, Barke 3452, Extract 4869, 3) in 2005: Anni 4980, Barke 4012, Extract 4271.
-500
0
500
1000
1500
2000
Anni Barke Extract Anni Barke Extract
Tebuconazole2X
Reduced dose
Yield increase, kg ha-1
2003 2004 2005

A G R I C U L T U R A L A N D F O O D S C I E N C E
Sooväli, P. Fungicide tebuconazole in barley
40
A G R I C U L T U R A L A N D F O O D S C I E N C E
Vol. 18 (2009): 34–42.
41
Discussion
In recent years, intensive cereal cultivation with limited crop rotation and suitable seasonal weather factors have increased the occurrence of net blotch and, to a lesser extent, spot blotch infection in spring barley. Chemical control measures are needed to avoid yield reduction by disease infections. To achieve economic profitability, it is important to deploy integrated pest management practices among production methods. In the future, the ten-dency will probably be towards management of disease control under integrated protection methods whereby the fungicide dose and time of applica-tion are calculated based on the resistance level of the variety, the prevailing weather conditions and infection situation in the field, taking into account economic profitability. It has been found in the UK that fungicide treatment is effective when the infection level is visually more than 5% of leaf area (Cook et al. 1999), thus indicating that in the case of low-intensity infection, yield loss is smaller than the cost of fungicide application. Infection level of a specific variety may exceed the infection threshold because of weather conditions and/or susceptibility. For effective control and maximal net yield, the
minimal dose of fungicide may be smaller than the standard dose, if adjusted at the point of time when the disease normally emerges.
According to Jørgensen et al. (1996), Hardwick et al. (2000), Henriksen et al. (2000), and Jørgensen et al. (2003) it was found that the use of reduced fungicide doses was effective depending on the weather conditions of the year and on the resis-tance level of the variety. The PC–P system has previously been described to combine information on thresholds with recommendations for treatments using adjusted fungicide dose (Jørgensen et al. 1996, Henriksen et al. 2000, Jørgensen et al. 2003).
The results of this trial showed that the yield had tendency to display high returns upon appli-cation of high fungicide rates, but the high costs of fungicide application reduced the net revenue. Intensive protection was important for barley yield-ing but the integrated plant protection system was more economical, as the use of PC–P method ena-bles to lower direct costs. Danish trials (Jørgensen et al. 2000) have produced similar results. In our trials, the PC–P variants had significantly higher net yields in 2005, in conditions of low disease in-fection. This indicates that the fungicide dose may be lowered to achieve disease control but has to be applied at the proper time to be highly effective.
Table 3. Yield profit in terms of money (EUR ha-1) of spring barley varieties in 2003–005.
Variety Net yield kg/ha Net revenue EUR Benefit in monetary terms EUR/ha
Tebuconazole 2X
Reduced dose
Tebuconazole 2X
Reduced dose
Tebuconazole 2X
Reduced dose
Anni 2003 4419 4320 442 432 -8 -162004 5945 5120 595 512 -4 -732005 4543 4838 454 484 -42 -15
Barke 2003 4133 3852 413 385 59 372004 3675 3541 368 354 13 12005 3920 4399 392 440 -13 29
Extract 2003 3760 3772 376 377 0.3 22004 5046 5072 505 507 9 11
2005 3963 4218 396 422 -31 -8Anni moderately resistant, Barke moderately susceptible, Extract susceptible to net and spot blotch; Net yield = har-vest yield minus the cost of fungicide and application. Price of chemical control 49 (Tebuconazole 2x); 18 (Reduced dose 2003); 13 (Reduced dose 2004); 10 (Reduced dose 2005) EUR/ha.

A G R I C U L T U R A L A N D F O O D S C I E N C E
Sooväli, P. Fungicide tebuconazole in barley
40
A G R I C U L T U R A L A N D F O O D S C I E N C E
Vol. 18 (2009): 34–42.
41
It is important to note that fungicide application is, in many cases (low disease pressure, resistant cultivar), not profitable for the farmer and the cor-rect decision would be to refrain from it. In order to predict the need of fungicide use, it is important to use a DSS, e.g. PC–P. Comparison of fungicides on the market for spring barley in Finland in 2006 has shown that fungicide applications did not improve net revenue in any of the spring barley trials dur-ing the dry season of 2006, how ever the negative effect compared to the untreated plots was not sig-nificant either (Laine et al. 2007). Trial results from Bavaria also indicate that in years less favorable for disease development, disease control in spring barley can result in negative net revenue (Tischner and Schenkel 2006).
Our trials demonstrated a significant impact of variety resistance on net revenue. Fungicide use in the moderately resistant variety Anni resulted in negative net revenue for all years and doses, the moderately susceptible variety Barke produced the highest and significant net returns and the suscepti-ble variety Extract produced medium net revenue. The variety’s tolerance towards disease infection could be a reason for differences in net yield be-tween the studied varieties. According to definition, tolerance is an ability of plants to endure severe disease without severe losses in yield and quality (Schafer 1971). Yield reduction in the variety Anni seems to be lower than could be expected based on the disease infection level and therefore chemical control is too costly for this variety. On the other hand, disease infection seems to cause more severe yield reduction for the susceptible variety Extract than could be compensated by fungicide applica-tion. Trials performed in Finland have also shown that the relationship between net blotch symptom expression and yield maintenance in spring barley genotypes was stronger in the case of higher yields and less severe net blotch infection. In conditions of lower yields and/or severe disease infection, the relation between the level of disease infection, yield losses and net revenue was less clear (Rob-inson 2000).
Multiyear trials in Northern Ireland with a range of fungicides, applied at a range of doses, have demonstrated that the overall profitability was
higher for resistant cultivars than for susceptible cultivars and that treatment of resistant cultivars with fungicides did not significantly increase prof-itability of winter wheat and spring barley any fur-ther (Mercer and Ruddock 2002, 2005). Results indicate that the potential of disease resistance of cultivars should be fully exploited and prophylactic spraying is unlikely to be profitable (Mercer and Ruddock 2002).
Our previous trials on spring wheat have shown that chemical disease control is most complicat-ed in relation to moderately susceptible varieties grown in conditions of medium disease pressure (Koppel et al. 2003). Results of the current study indicate that chemical control is most profitable for moderately susceptible spring barley varieties with the use of different fungicide doses, thus differing from the chemical disease control of spring wheat. DSS programs should take more account of rela-tions between severity of disease symptoms and yield reduction.
ReferencesAgrobaseTM 20. The Software Solution for Plant Breed-
ers. 1999. Addendum and Instructional Guide. Winni-peg, Manitoba. 95 p.
Cook, R.J., Hims, M.J. & Vaughan, T.B. 1999. Effects of fungicide spray timing on winter wheat disease control. Plant Pathology 48: 33–50.
Fetch, T.G. and Steffenson, B.J. 1999. Rating scales for as-sessing infection responses of barley infected with Co-chliobolus sativus. Plant Disease 83: 213–217.
Hardwick, N.V., Slough, J.E. & Jones, D.R. 2000. Cereal disease control – are fungicides the sole answer? Pro-ceeding of the International Conference on Pests and Diseases 13–16 Nov 2000, Brighton, England. Pests and Diseases 2000, Vol. 2: 647–654.
Henriksen, K.E., Jørgensen, L.N. & Nielsen, G.C. 2000. PC-Plant Protection – a Danish tool to reduce fungicide input in cereals. Proceeding of BCPC Conference: Pests and Diseases 2000, Vol. 3: 835–840.
Jørgensen, L.N. 2006. Bekǽmpelse af svampesygdom-me I korn. In: Pesticideafprovning 2006. DJF rapport nr. 129: 21–70. (in Danish)
Jørgensen, L.N., Hagelskjaer, L. & Nielsen, G.C. 2003. Adjusting the fungicide input in winter wheat depen-ding on variety resistance. Proceeding of BCPC Inter-national Congress Crop Science & Technology 2003, Vol. 2: 1115–1120.
Jørgensen, L.N., Henriksen, K.E. & Nielsen, G.C. 2000.

A G R I C U L T U R A L A N D F O O D S C I E N C E
Sooväli, P. Fungicide tebuconazole in barley
42
Margin over cost in disease management in winter wheat and spring barley in Denmark. Proceeding of BCPC Con-ference: Pests and Diseases 2000, Vol. 2: 655–662.
Jørgensen, L.N., Secher, B.J.M. & Nielsen, G.C. 1996. Monitoring diseases of winter wheat on both a field and a national level in Denmark. Crop Protection 15: 383–390.
Koppel, M., Runno, E., Sooväli, P., Lauringson, E., Talgre, L. & Nurmekivi, H. 2003. Control of spring wheat diseas-es in meteorologically different conditions. Proceedings of the Crop Protection Conference for the Baltic Sea Re-gion, Poznan, p. 142–148.
Laine, P., Jalli, M. & Hannukkala, A. 2007. Fungicides in field crops. In: Marja Jalli, Jarmo Ketola, Päivi Kos-ki and Peppi Laine (eds). Trial Report: Fungicides and Insecticides, MTT Agrifood Research Finland. Jokioi-nen, MTT. 33 p.
Mathre, D.E. 1997. Compendium of Barley Diseases. 2nd ed. The American Phytopathological Society, St. Paul, MN. 90 p.
Mercer, P.C. & Ruddock, A. 2002. Disease management of spring barley with reduced doses of fungicides in North-ern Ireland. Crop Protection 22: 79–85.
Mercer, P.C. & Ruddock, A. 2005.Disease management of winter wheat with reduced doses of fungicides in North-
ern Ireland. Crop Protection 24: 221–228. Palmer, G.H. 1989. Cereals in Malting and Brewing. Ce-
real Science and Technology. Aberdeen: University Press. p. 61–243.
Robinson, J. 2000. Yield of doubled haploid lines of Nor-dic spring barley infected with net blotch, Pyrenophora teres. Plant Breeding 119: 219–222.
Schafer, J. 1971. Tolerance to plant disease. Annual Re-view of Phytopathology 9: 235–252.
Statistical Database. 2007. Available on the internet: http//www.stat.ee. Cited on 15.09.2007.
Tamm, Ü. 2003. Genetic resources in malting barley bree-ding. The Thesis for applying the doctor’s degree in ag-ricultural sciences in plant production. Tartu: 68–84. (in Estonian)
Tekauz, A. 1986. Effect of plant age and leaf positionon the reaction of barley to Pyrenophora teres. Canadian Journal of Plant Pathology 8: 380-386.
Tischner, H. & Schenkel, B. 2006. Entscheidungsmodel-le zur gezielten Schadpilzbekämpfung in Sommerger-ste. Versuch 812. In: Versuchsergebnisse aus Bayern. 2006. Getreide. Bayerische Landesanstalt für Landwirt-schaft. Institut für Pflanzenschutz, Freising-Weihenste-phan. 16 p. (in Germany)

A G R I C U L T U R A L A N D F O O D S C I E N C E
Vol. 19(2010): 43–56.
43
© Agricultural and Food Science Manuscript received June 2008
The impact of distance to the farm compound on the options for use of the cereal plot
Kalvi Tamm1*, Taavi Võsa1, Valdek Loko1, Jüri Kadaja1, Raivo Vettik1 and Jüri Olt2
1Estonian Research Institute of Agriculture, Department of Agricultural Engineering and Technology, Teaduse 13, 75501 Saku, Estonia, *email: [email protected]
2Estonian University of Life Sciences, Institute of Technology, Kreutzwaldi 56, Tartu 51014, Estonia
In increasingly competitive conditions, the dominant trend of enlarging the production area of farms is causing a growth in transportation costs making the profitability of cultivating distant plots questionable. The aim of this study was to provide a method to evaluate the rationality of using a plot depending on its distance, area and cultivation technology. An algorithm and a mathematical model were composed to calculate the total costs depending on the distance to the plot. The transportation costs of machines and materials, cost of organisational travel and timeliness costs are taken into account in the model to enable determination of the maximum distance or the minimum area of the plot necessary for profitable cultivation.Simulations allow us to conclude that the growth in yield and selling price of the production allow an increase in the limit value of driving costs and, thus, the profitable distance of the plot; on the other hand, it means also an increase of timeliness costs as a limitation for extending distance. Exploitation of more distant plots can be uneconomical in coming years because of increasing fuel costs.
Key-words: farm size, plot, distance travelled, intrafarm transport, transport costs, timeliness, economic evaluation, technology, mathematical models, simulation.
Introduction
Under the conditions of growing competition, the trend towards enlarging the production area of farms is dominating, causing longer driving distances to the plots. During the years 2001−2007, the portion
of farms of less than 50 ha decreased; those of over 100 ha increased in the total area of agricultural land in Estonia (Fig. 1). We can observe similar trends elsewhere in the world, for example, in the USA (Schnitkey 2005), Finland (Suomi et al. 2003), England (Burton and Walford 2005), and Hungary (Burger 2001).

A G R I C U L T U R A L A N D F O O D S C I E N C E
Tamm, K. et al. The impact of the plot distance
44
A G R I C U L T U R A L A N D F O O D S C I E N C E
Vol. 19(2010): 43–56.
45
(Bouma et al. 1998) the need for composing a me-thod that would assist determining optimal farm size. Mathematical modeling is an essential method here. In the late 1990s, a research team model-ling the agricultural production from the Estonian University of Agriculture composed a method to calculate the effect of the area of a round-shaped farm to the farm’s profitability (Asi et al. 1999). Kryachkov and Sharova (2005) studied the optimal area of farms in the region of Kursk (Russia), deter-mining factors to prognosticate the transportation costs depending on the area of the given agricultur-al enterprise. A mathematical model was presented
0
100
200
300
400
500
600
700
0 − <5 5 − <10 10 − <20 20 − <30 30 − <50 50 − <100 >=100
Farm size group, ha
Agricultural land, thousand ha
2001 2003 2005 2007
Fig. 1. Division of agricultur-al land according to farm sizes in years 2001−2007 (Statistics Estonia, 2009).
Table 1. The number of plots depending on plot size group in Estonia by register of area supports of Estonian Agricultural Registers and Information Board in year 2008.
Plot size group
Number of declared plots
Declared area, ha
Average plot area, ha
<1 ha 46 339 24 333 0.531 − <5 ha 61 570 160 791 2.615 − <10 ha 23 876 173 126 7.2510 − <50 ha 23 331 447 576 19.1850 − <100 ha 951 61 840 65.03100< 90 12 635 140.39Total 156 157 880 301 5.64
Farmers buy or rent land primarily to increase profitability of their enterprises (Gwyer et al. 2005), but expanded production tends to have an influence on expenses as well as on income. Enlargement of arable land enables increased effectiveness of ma-chinery use, and in the case of constant machinery equipment, the fixed costs per hectare are decreas-ing. However, it may cause an increase of the costs for maintenance and repair of the machines.
In 2007 in Estonia there were 23 257 farms with an average agricultural area of 39 ha; of those larger than 100 ha, 1549 farms have an average area of 405 ha. The number of plots by plots size group is given in Table 1. Aaltonen et al. (1999) reports that most plots are situated closer than 3.7 km to the farm compound in the EU and 6.6 km in Finland. There are no similar statistics for Estonia; studies are needed.
The enlargement of production area influences the portion of transportation expenses in the cost price of the yield. Along with increasing distances, transportation expenses are growing as well (Stein-sholt 1997) and, in certain conditions, may exceed the increase of the income created by enlarging of production area; as a result, profitability of the farm begins to decline.
The need for increasing the effectiveness of ex-ploitation of land and problems related to the grow-ing costs of energy, labour and other production resources, are calling for the creation of decision support systems that analyse and plan agricultural production. Several researchers have suggested

A G R I C U L T U R A L A N D F O O D S C I E N C E
Tamm, K. et al. The impact of the plot distance
44
A G R I C U L T U R A L A N D F O O D S C I E N C E
Vol. 19(2010): 43–56.
45
to calculate the profitability of the proposed farm depending on its production capacity.
The aim of these studies was to compose a method for determining the optimal size of a farm. Nevertheless, using this parameter in real-life man-agement of production is questionable. Should the farmer exclude from production the plots located outside the critical distance, i.e., sell or lease them, and seize the plots located in the vicinity, i.e., buy or rent them? In reality, individual plots have in-dividual properties, different crops, and, thus, dif-ferent operational capacities and production costs (Jabarin and Epplin 1994, Harasimowicz and Ost-ršgowska 2001). One critical factor is the size of the plot. Introduction of a small plot located far away from the farm compound will probably not be economical as the transportation costs will be so high that the production will not be profitable. This may also be true for plots remaining inside the criti-cal border. For planning of production, therefore, a method is required to analyse the costs taking into account the distance, the area and the cultivation technology used there.
In an overview of studies in the field of agrolo-gistics, Hahn (2006) denotes that theory-forming contributions to the mentioned research area are still rare in literature. Morlon and Trouche (2005) also find that there is scarcely relevant scientific literature available and the existing materials are generally based on ancient or simplistic schemes and models which are not of practical use in the present conditions.
There are, however, references to studies in which distances inside the farm are used as one of the problematical factors of plant production. One of the first contributions in that area was worked out by Johann Hermann von Thünen (1783−1850), who developed the model to describe the land use practices radiating out from a central market loca-tion (Crosier 2009). He theorized that several rings of agricultural land use practices would surround the central market place. The land within the closest ring around the market produces products that are profitable in the market, yet are perishable or dif-ficult to transport. As the distance from the central market increases, the land use shifts to producing products that are less profitable in the market, yet
are much easier to transport. The general approach of von Thünen illustrated the use of distance-based gradient analysis (e.g., the change in value for a variable such as land rent with increasing distance from the city center).
De Garis De Lisle (1982) has studied the effects of intra-farm distance on farm income and on inter-nal cropping patterns. The research was based on the data of the farms situated in Manitoba (Canada) collected by crop insurance agents. The following conclusions were drawn: 1) the distribution of crops is affected both by the distance of the plot to the farm compound and the soil productivity; 2) adjustments to the organization and intensity of farming compensate the effects of distance on the net income.
Myyrä and Pietola (2002) estimated with the help of a switching-type Probit-model the shadow prices for land parcel characteristics in Finland, such as size and distance from the compound, by adding these characteristics to the conditional profit maximization model. Their research concludes that plot size and distances from the farm compound significantly affect the farmer’s choice of allocat-ing most of the land either to grass or to grain. Harasimowicz (1997) describes an evaluation sys-tem, where plot distance to the compound is one factor affecting land value in points characterising the profitability potential of land: a plot situated far away is assessed to be less valuable than a closer one.
The literature overview indicates that there is no research available containing a method to esti-mate rationality for exploitation of the plot based on the distance between plot and farm compound. The aim of this study is to compose a mathematical model to calculate these costs and thereby estimate the rationality of exploitation of a plot on the basis of driving distance. The model considers transpor-tation costs of aggregates, hauling costs of materi-als, income loss caused by delays in field work, and the cost of organizational drives. All the factors in-fluencing technology, like crop (Fig. 2), machines or technological materials can be considered with choice of technology. The present model considers the cereals seedbed preparation and sowing opera-tions’ influence on the income loss.

A G R I C U L T U R A L A N D F O O D S C I E N C E
Tamm, K. et al. The impact of the plot distance
46
A G R I C U L T U R A L A N D F O O D S C I E N C E
Vol. 19(2010): 43–56.
47
On the basis of the model, software “Field dis-tance” is composed, enabling, in a relatively short period of time, evaluation of the rationality of using different technologies on a particular plot depend-ing on its area and distance.
The paper gives an overview of the composed model and its practical use with different tillage technologies. The simulations are used to estimate the influence of the price of fuel and yield, as well as the yield level on the economical maximum of plot distance.
The model
Economical parameters depending on plot distanceFollowing the aim of composing the mathematical model for evaluating the rationality of exploitation of a plot taking into account the driving distance, we concentrated on the economical parameters depending on that factor. The expenditures arising from distance were separated from other production costs; these are the costs related to the transporta-tion of the field aggregates and the technological materials, and the costs of all organizational trips to the plot (Tamm 2006). In addition to the expenses, we need to look at the effect of driving distance on income. If the distance increases, the daily perform-ance of the field aggregate will decrease and work periods will lengthen; as a result, the working time will increasingly deviate from the optimal and the average yield will decrease. The consequent income loss is considered a cost, as well. Thus:
Kh=Ks+Kv+Ko+ΔT, (1)
where Kh is the sum of costs depending on distance to the plot (€ ha-1), Ks is the driving cost of aggregate to and from the plot for one production year (€ ha-
1), Kv is the cost of hauling the materials to or from the plot (€ ha-1), Ko is the driving cost of service vehicles per one production year (€ ha-1), and ΔT is the income loss caused by driving duration (€ ha-1).
The evaluation of options of exploitation of the plotUsing a plot within a certain distance is rational in cases when the cost Kh related to distance is less than the maximum value Kh,max (Kh≤ Kh,max). The last one is found with formula
Kh,max =T–Km (2)
where T is predicted income (€ ha-1) and Km are the costs independent of distance (€ ha-1). If the model user wants take into account the profit or the production risk, these factors can be added to Km.
In order to determine the economically reason-able maximum distance between farm compound and the plot considering its area and technology, the distance in the case of Kh,max must be found. While the distance cannot be analytically found by the system of formulas composed for calculating Kh, then the iterative method is used. The method enables finding the distance in which the sum of the costs is the nearest to the limit value. i.e., Kh→ Kh,max. The plot area and the technology are fixed while seeking distance d. In the case of the iterative method, it is necessary to define the tolerance δ; when it has been achieved, the calculation proce-dure will be completed. In other words, the follow-ing condition should be fulfilled:
|Kh– Kh,max |≤δ. (3)
If the condition (3) is met, then the distance used for finding the parameter Kh is the economi-cally reasonable maximum distance between the farm compound and the plot, considering its area and technology.
There are three phases of the iterative method: we used the determination of the initial solution, the secant method (Weisstein 2006a) and bisec-tioning (Weisstein 2006b). The calculations thus far show that the 50 cycles are enough to reach a satisfying solution. After having tested the model, the following schema is composed to search solu-tion: 1) 1st Cycle – calculating the initial solution, 2) 2nd −5th Cycle – secant method, and 3) 6th – 50th Cycle – method of bisecting of interval.
That mathematical construction also enables the search for minimum area of plot at known

A G R I C U L T U R A L A N D F O O D S C I E N C E
Tamm, K. et al. The impact of the plot distance
46
A G R I C U L T U R A L A N D F O O D S C I E N C E
Vol. 19(2010): 43–56.
47
distance. The machines would still drive back and forth at least once even for a tiny plot. Thus the farmer has transportation costs, independent of plot size. However, the plot can be so small that the income does not cover the transportation costs, especially when the distance is long. It means that Kh>Kh,max – the transportation costs are larger than the amount of money available for transportation expenses. The larger the plot, the smaller the trans-portation costs per ha (costs are divided with the area) unless two trips are made – then the sum of transportation costs per ha jerk upward and then start to decrease again, etc. (Fig. 4). If the mar-ket conditions are favourable for the farmer, then with increasing the plot size the income for the whole plot grows faster than costs; at some point, the value of the area is Kh<Kh,max. The condition Kh=Kh,max is the indicator that shows the minimum value of a plot area.
The minimum area of the plot is calculated with the same algorithm as for maximum distance. The difference is that initially a value for distance d is fixed, and thereafter the minimum plot area is searched by the certain value of the limit cost Kh,max. If the distance is relatively long and the value of limit cost is relatively small, it is possible that the minimum area of the plot cannot to be determined.
The overview of the model for calculating costs depending on driving distance In the present study, the driving distance to the plot denotes the shortest way passable with an agricul-tural machine from farm compound to nearest entry point in the plot. The farm compound is the storage location for most of the farm’s field machines and technological materials.
In the process of composing a calculation mod-el, all technology/technical equipment used during the whole yield year on the plot is taken into ac-count (Fig. 2).
The model incorporates four components: the cost of transport of machines, the cost of hauling materials, the cost related to organisational drives, and the income loss arising from timeliness of seedbed preparation and sowing operations (Tamm 2006).
While calculating the transportation costs, it is considered that a task can be performed with several different aggregates and during numerous work days. It is presumed that the operator returns with an aggregate to the farm compound at the end of the work day. The calculation schema for trans-portation costs is based on the hourly cost of idle drive of aggregate considering expenses related to the machines in transit (Hunt 2001, Witney 1988).
In the case of hauling materials, it is considered that several hauling cycles and numerous vehicles can be used for moving one type of material. The materials are differentiated by the class of the pay-load usage of transporters and this defines the fac-tor of the payload usage of the wagon (ATK 1984). The calculation schema of hauling cost is based on the price of a driving hour of the vehicle, which is computed considering fuel consumption depend-ency on the machine load in different phases of the transportation cycle (Grisso et al 2006).
It is presumed by composing the calculation schema of costs related to organisational drives that the vehicle load undergoes no significant change during the entire trip. Required information in-cludes the count of one vehicle driving during the whole yield year as well as the average speed and price per driving hour of the given machine.
The relationship between income and plot distance is based on studies (Giunta et al. 2007, Haller 1969, Karmin 1975, Toro 2005) indicating that yield depends on the calendar time (days) of performing field operations:
ht=hmax(1–bt2) (4)
where ht is yield from farm area, seeded in day t (kg ha-1), hmax is yield from farm area, seeded in the best day (highest yield), b is regression coefficient related to the yield loss per sowing day (day-2) and t is number of days deviating from the optimal sowing day.
The longer the distance, the greater part of the workday is spent on driving to and from the plot. However, at the same time, hours available for work on the plot decreases, and thus the number of workdays necessary to perform the work on the plot increases. With a higher number of workdays,

A G R I C U L T U R A L A N D F O O D S C I E N C E
Tamm, K. et al. The impact of the plot distance
48
A G R I C U L T U R A L A N D F O O D S C I E N C E
Vol. 19(2010): 43–56.
49
an increase of deviation from the best working time is accompanied by a decrease of average yield. Pro-found research exists about relations of timeliness of sowing in Estonia (Tamm 1999), thus the model takes into account the knowledge of how timeliness is affected by the duration of transporting seedbed preparation aggregates and sowing aggregates.
Data used in simulations The data chosen for the simulations were previ-ously used in the calculations for economical comparison of different pre-sowing tillage and sowing technologies (direct drilling, conventional and minimum tillage) (Loko and Tamm 2004). In the calculations, for the purpose of simplification, it is assumed that all travels related to the plot start from the farm compound. To determine the number of working hours of the farm machines, it is taken into account that the farm has 450 ha of arable land with 75% under the spring cereals and 25% under the winter cereals.
The present calculations are made for spring ce-real plots, which account for the largest portion of
Estonian farming area. Although it was presumed that 25% of cereal area is under winter cereals, that does not affect the sowing period of spring cereals. The model presumes that formula 4 suits other crops as well. This is a widely used formula for calculating timeliness costs for crops (Witney 1988). Table 2 shows values of regression coef-ficient b for cereals if delay from best sowing time is 1−15 days.
Operations affecting length of sowing period
Operations performed during yield year on the plot , length of work day, time loss factor
THE SIMULATION MODEL FOR CALCULATING THE COSTS
Machines: hourly cost of drive, payload of transporters, velocity, operation performance
Materials: amount and factor of the payload usage of a transporter
Plot data: area, distance from farm compound
The crop: sowing area in farm, average sell price, maximum yield hmax, regression coefficient b related to the yield loss per sowing day, length of sowing period
Organisational drives: count, hourly cost and velocity
Transportation cost of machines, Ks
Hauling cost of materials, Kv
Cost related to organisational drives, Ko
Income loss due to timeliness of spring works, ΔT
Fig. 2. The calculation model for calculating costs depending on driving distance, the inputs and outputs of the model
Table 2. Value of regression coefficient b for cereals, if delay from best sowing time is 1−15 days (Tamm 1999).
Cereal Regression coefficient b
Variability with 95% probability
Spring barley 0.00117 0.00105 − 0.00129
Oat 0.00107 0.00080 − 0.00134
Spring wheat 0.00120 0.00095 − 0.00145
Winter rye 0.00203 0.00164 − 0.00242
Winter wheat 0.00170 0.00125 − 0.00215

A G R I C U L T U R A L A N D F O O D S C I E N C E
Tamm, K. et al. The impact of the plot distance
48
A G R I C U L T U R A L A N D F O O D S C I E N C E
Vol. 19(2010): 43–56.
49
The operation performances and hourly work costs of aggregates depend on tractors (Table 3). There are two tractors among the machinery, with the engine power of 100 kW and 75 kW (T1 and T2 in tables). The fuel price 0.69 € l-1 serves as the basis for calculating the hourly costs. In all vari-ations, the length of working day at value Tt=8 h and time loss factor τ=0.85 are considered. These factors influence the number of workdays and trips to the plot.
The software “Field distance” was programmed using developer software Microsoft Visual FoxPro 8.0 and includes both the calculation models need-ed for calculating the costs related to the driving distance as well as the algorithms for determining the maximum driving distance or the minimal area of the plot. The software enables drawing differ-ent plans with different technologies and plots, to modify them, and compare the results.
The increased cost of driving hour in the case of minimum tillage and direct drilling is related to the increase of proportion of fixed costs in the hourly cost. This is a result of the decrease in the number of operations and, thus, in the yearly load of the tractor. In conventional technology, two ag-gregates are ploughing simultaneously and there-fore the work capacity is divided according to per-formances. It is presumed for all three technologies that there are three spraying operations in different points in time covering the whole plot.
Data for computing transportation cost of ma-terials is presented in Tables 4 and 5.
Data for computing the income loss are pre-sented in Table 6.
Definition of number of organisational drives is based on the need to evaluate the status of the plot and quality of operations (Table 7). In case of op-erations with low performance, such as ploughing or harvesting (Table 3), it is essential to establish fuel supply to the plot.
Table 3. Data for calculating transportation cost of aggregates.Aggregate Speed, km
h-1Performance,
ha h-1Hourly cost of idle drive, € h-1
Conventional tillage Minimum tillage Direct drilling
Windrower (T1) 30 7 18.35
Stubble plough (T1) 30 7 17.46 17.97
Plough (T2) 30 0.9 14.83
Plough (T1) 30 1.1 17.46Cultivator (T2) 30 6 14.83 16.05
Drill (T1) 30 5 17.46 17.97 18.35
Harrow (T1) 30 5 17.46 17.97
3 times sprayer (T1) 30 8 17.46 17.97 18.35
Harvester 20 1.5 26.79 26.79 26.79
Table 4. Hourly costs and fuel consumptions of aggregates exploited for hauling of materials
VehicleHourly cost without fuel cost, € h-1
Fuel use at full load, l h-1
Fuel use at idle load, l h-1Conventional
tillageMinimum
tillageDirect drilling
Vehicle 1 (T1) 21.16 22.44 23.59 16.5 11.6
Vehicle 2 (T2) 25.13 29.80 31.52 17.5 11.9
Water trailer (T2) 36.64 41.30 43.03 15.1 9.8

A G R I C U L T U R A L A N D F O O D S C I E N C E
Tamm, K. et al. The impact of the plot distance
50
A G R I C U L T U R A L A N D F O O D S C I E N C E
Vol. 19(2010): 43–56.
51
SimulationsThe influence of tillage technologies The model was used to estimate the influence of tillage technology on the costs depending on driving distance and plot area (Table 8 and 9).
With minimum tillage, the number of opera-tions and thus drives is smaller compared to con-ventional technology; these numbers are at their smallest with direct drilling. However, after cal-culations it became clear that differences in maxi-mum distances to the plot are small across the dif-ferent technologies compared (Fig. 3). In the case of direct drilling, the cost of transportation of ma-chines and organisational drives is less than when
using other technologies, but the cost of hauling materials is higher (Table 8). It derives from the larger portion of fixed costs in the hourly cost of the tractor, caused by the smaller number of op-erations performed and, consequently, less yearly work time of the tractor compared to other technol-ogies. Many operations with low hourly cost were compared with few operations with high hourly cost. In comparison, in the high hourly cost opera-tion, in all technologies, the machines had the same yearly work load as well as hourly cost with con-ventional tillage. In these circumstances, all costs, except income loss, are decreasing along with a lessening number of operations, and the differences of maximum distances of plot are somewhat more
Table 5. Data for computing transportation cost of materials
Material Amount, kg ha-1
Factor of the payload usage
Loading performance t h-1
Down loading performance t h-1
Barley seed (T1) 230 1 28 20
NPK-fertiliser (T1) 300 1 28 15
Water for spraying (T2) 300 1 40 20
Barley yield (T1 +T2) 4500 1 40 1800
Table 6. Data for computing the income loss due to timeliness of spring sowing
Parameter Value
Farm’s spring sowing area, ha 337.5
Portion of spring sowing area (including the plot observed), remaining to seed, % 50
Average sale price of spring cereal, € Mg-1 180
Average yield of spring cereal in best sowing day hmax, kg ha-1 4500
Average regression coefficient for spring cereals b, day-2 0.00115
Length of sowing period, days 16.6
Driving time, affecting the sowing period, days 0.167
Table 7. Data for computing the cost of the organisational drives Reason for visiting the plot Vehicle Hourly cost,,
€ h-1Speed, km h-1 Number of plot visits
Conventional tillage Minimum tillage Direct drillObservations Car 19.18 60 10 9 7
Fuel supply Fuel truck 25.58 50 3 2 2

A G R I C U L T U R A L A N D F O O D S C I E N C E
Tamm, K. et al. The impact of the plot distance
50
A G R I C U L T U R A L A N D F O O D S C I E N C E
Vol. 19(2010): 43–56.
51
notable (Fig. 4) than in the case of unlike yearly workload. For example, for conventional tillage, minimum tillage and direct drill on the 30 ha plot in the case of different workloads, the maximum distances are, respectively, 17.9, 18.7, and 19.2 km. With similar workload, these distances are 17.9, 19.4 and 20.4 km.
Depending on the plot area, the maximum distance changes by fixed Kh,max at the beginning almost proportionally until the approximate plot area of 15 ha. From then on, the growth is slowing down slightly, but continues intensively until plot area of 20 ha; after that, the distance value will approximate asymptotically to some limit value. In economic conditions typical for Estonia, which date for this study approximates, the economical maximum distance for larger plots falls within the interval of 18 – 25 km. The jerks on the graphs (Fig. 3 and 4) are caused by the changes in the number of the driving times related to the specific work or hauling material. For example in the case of the 28 ha plot area, the sowing aggregate would be transported to the plot on two workdays, dou-bling the driving time, resulting in a sharp growth in income loss per hectare. However, while the to-tal value of costs is limited, the other costs should decrease accordingly and it will result in the need for shorter distance (Fig. 5). Although the cost re-lated to the transport of sowing aggregate is in-creasing, then a decrease in transportation cost of other aggregates due to shortening the distance is sufficient to slightly decrease the total transporta-tion cost of aggregates.
The influence of fuel priceIn order to examine the influence of the fuel price, conventional tillage technology was simulated and hourly prices of machines were computed for three fuel price levels (Fig. 6).
Fig. 3.The maximum plot distance dependency on plot area in the case of different tillage technologies if costs de-pending on the distance should not exceed 64 € ha-1. The yearly workload of machines depends on the technology
0
5
10
15
20
25
0 10 20 30 40 50 60 70 80 90 100Area of a plot, ha
Maximum distance to the plot, km
Direct drilling Minimum Conventional
Table 8. Costs (€ ha-1) depending on distance if the plot distance is 20 km and area is 16 ha
Cost Conventional tillage Minimum tillage Direct drill
Transportation cost of machines Ks 25.38 20.33 17.71
Hauling cost of materials Kv 32.21 34.84 36.24
Income loss due to yield recession, ΔT 18.09 18.09 18.09
Cost of organisational drives Ko 12.98 10.74 8.95
Total costs Kh 88.65 83.99 80.98
Table 9. Cost (€ ha-1) depending on plot distance and area in case of conventional technology
Distance Transportation cost Kh, € ha-1
10 ha 15 ha 20 ha
10 km 58.85 44.41 38.80
20 km 117.96 89.00 77.76
30 km 176.90 138.85 117.50

A G R I C U L T U R A L A N D F O O D S C I E N C E
Tamm, K. et al. The impact of the plot distance
52
A G R I C U L T U R A L A N D F O O D S C I E N C E
Vol. 19(2010): 43–56.
53
In Estonia, the special purpose diesel fuel can be used in agricultural production; this diesel fuel has fewer excises than paid by ordinary consumers. The excises on special purpose diesel fuel began to rise early in 2008, increasing the fuel price from about 0.57 to 0.69 € l-1. The third price level is established on the prediction that farmer will use the fuel priced for the ordinary consumer, 0.96 € l-1. If the plot area enlarges, then the fuel price af-fects the maximum distance of the plot until certain value – in the present case approximately until 25 km; after that the differences of distances for unlike price levels remain roughly the same. For example, for a plot area 30 ha, the maximum distances are 18.7, 17.9 and 16.2 km from the lowest to the high-est price level. Therefore, the higher the fuel price, the more the farmer must think about the rationality of exploitation of distant plots. Consequently, there exists the danger that a plot located in the distance that has provided profitable production in the past, is becoming unprofitable due to rising fuel prices. In Estonia, it has already occurred in 2008 because of the increase in fuel prices.
High fuel price can also hinder farm size. The greater the fuel price the higher are field operation and transportation costs, and increased operation costs decreases available funding for transpor-
tation. Accordingly the fuel price has a doubly damaging effect on the economically reasonable transportation distances. Thus at a certain point, fuel cost can limit maximum distance to the plot, regardless of plot size, cultivation technology or choice of crop.
The influence of the grain price and yield The grain price and yield influence the income ob-tained from a plot and thus the limit value reached by its costs Kh,max depending on the distance. The limit value of the costs affects the maximum dis-tance of the plot significantly (Fig.7). In the present simulation with a 30 ha plot, using limit values of 100, 64 and 50 € ha-1, the maximum distances are, respectively, 27.3, 17.9 and 14.1 km. Raising the limit value by 50 € ha-1 allows use of a plot located within the next 13 km range.
On the other hand, due to increasing selling price and yield, the income loss increases with every delayed sowing day (Tamm 2006) (Fig. 8 and 9). Thus the opportune performance of sow-ing operations and minimising of driving time is more important for plots with high yield potential than for those with poorer soil properties: the drill must be transported to the high yield plot as fast as possible and the plot seeded without intermediate
Fig. 5. The maximum plot distance and costs dependency on plot area in case of conventional technology. The costs depending on the distance should not exceed 64 € ha-1.
Direct drilling Minimum Conventional
Maximum distance to the plot, km
0
5
10
15
20
25
0 10 20 30 40 50 60 70 80 90 100
Area of a plot, ha
Fig. 4. The maximum plot distance dependency on plot area in the case of different tillage technologies if costs depending on the distance should not exceed 64 € ha-1. The yearly workload of machines are for all technolo-gies same as in conventional tillage.
0
5
10
15
20
25
30
35
0 10 20 30 40 50Area of a plot, ha
Costs, € ha-1
0
5
10
15
20
25
30
35Driving distance to a plot, km
Equipment transport Hauling of materialsIncome loss Organizational drivesDistance

A G R I C U L T U R A L A N D F O O D S C I E N C E
Tamm, K. et al. The impact of the plot distance
52
A G R I C U L T U R A L A N D F O O D S C I E N C E
Vol. 19(2010): 43–56.
53
drives to the farm compound. One of the future tasks would be to clarify which conditions would be most rational: to return with the application ag-gregate to the farm compound after the work day, leave the aggregate near the plot, or perform the operation with several consecutive shifts. We plan to supplement the model with algorithms to calcu-late the income loss due to transportation time for machines other than the sowing aggregate.
The present model does not consider the soil type. The soil type influences the germinating envi-ronment of seed (Haller 1969). The optimal sowing time for spring cereals on heavier soils is shorter than average (EVP 1992), meaning that yield loss for every delayed day is greater for heavy soil than for light; in this case, the regression coefficient b the value nearer to the higher limit of variability should be chosen (Table 2). However, the model can be supplemented by considering the type of soil, as soon as the values for correction factor de-pending on soil type are available.
Discussion about options for using plots depending on distance
There are several studies (De Garis de Lisle 1982, Myyrä and Pietola 2002) researching choices of crop mix affected by plot structure. Cereal crops are less expensive to transport than intensive crops such as potato, therefore it is more economical to include more cereals in arable land that is farther from the compound. A similar pattern was shown in the 19th century by von Thünen (Crosier 2009).
In the present model the loss of yield and in-come depend upon the crop. There are different timeliness factors (regression coefficient b in the table 2) for spring and winter cereals. Winter cere-als are more sensitive to a delay of sowing time than spring cereals. Distant cereal plots increase transportation time; that, in turn, lengthens the sow-ing period. A prolonged sowing period decreases average crop yield, therefore, winter cereals should be cultivated closer to the farm compound than spring cereals.
0
510
1520
2530
35
0 10 20 30 40 50 60 70 80 90 100Area of a plot, ha
Maximum distance to the plot, km
100 € h-1 64 € h-1 50 € h-1
0
5
10
15
20
25
0 10 20 30 40 50 60 70 80 90 100Area of a plot, ha
Maximum distance to the plot, km
0,57 € l-1 0,69 € l-1 0,94 € l-1
Fig. 6.The maximum plot distance dependency on plot area using different fuel prices. The costs depending on the distance should not exceed 64 € ha-1.
Fig. 8. The maximum plot distance dependency on plot area in the case of unlike grain prices. The costs depend-ing on the distance should not exceed 64 € ha-1 and grain yield is 4500 kg ha-1.
90 € Mg-1 140 € Mg-1 180 € Mg-1
0
5
10
15
20
25
0 10 20 30 40 50 60 70 80 90 100Area of a plot, ha
Maximum distance to the plot, km
Fig. 7. The maximum plot distance dependency on field area in the case of conventional technology if the costs depending on the distance should not exceed 50, 64 and 100 € ha-1.
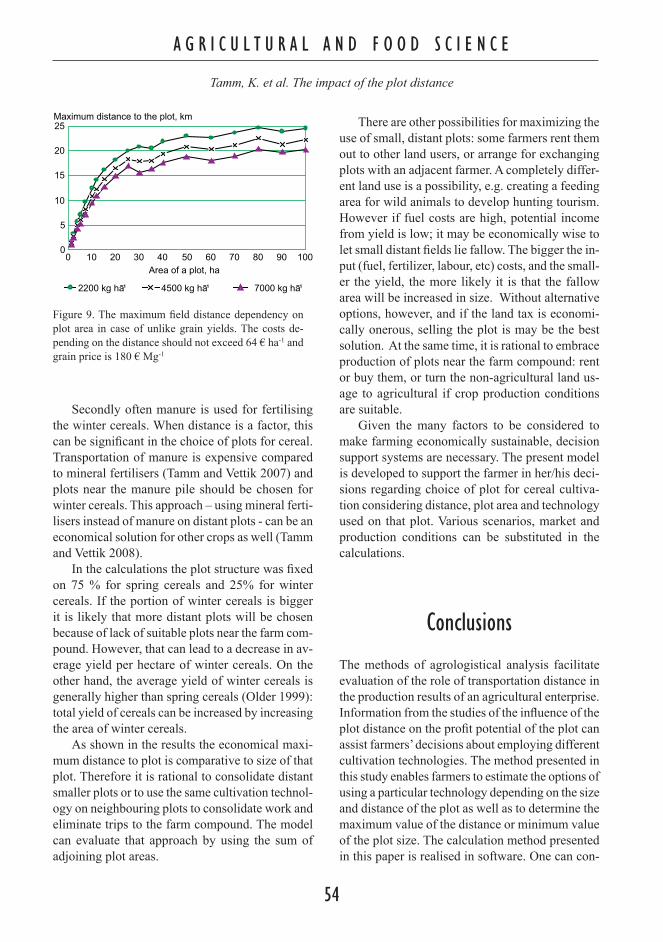
A G R I C U L T U R A L A N D F O O D S C I E N C E
Tamm, K. et al. The impact of the plot distance
54
A G R I C U L T U R A L A N D F O O D S C I E N C E
Vol. 19(2010): 43–56.
55
Secondly often manure is used for fertilising the winter cereals. When distance is a factor, this can be significant in the choice of plots for cereal. Transportation of manure is expensive compared to mineral fertilisers (Tamm and Vettik 2007) and plots near the manure pile should be chosen for winter cereals. This approach – using mineral ferti-lisers instead of manure on distant plots - can be an economical solution for other crops as well (Tamm and Vettik 2008).
In the calculations the plot structure was fixed on 75 % for spring cereals and 25% for winter cereals. If the portion of winter cereals is bigger it is likely that more distant plots will be chosen because of lack of suitable plots near the farm com-pound. However, that can lead to a decrease in av-erage yield per hectare of winter cereals. On the other hand, the average yield of winter cereals is generally higher than spring cereals (Older 1999): total yield of cereals can be increased by increasing the area of winter cereals.
As shown in the results the economical maxi-mum distance to plot is comparative to size of that plot. Therefore it is rational to consolidate distant smaller plots or to use the same cultivation technol-ogy on neighbouring plots to consolidate work and eliminate trips to the farm compound. The model can evaluate that approach by using the sum of adjoining plot areas.
There are other possibilities for maximizing the use of small, distant plots: some farmers rent them out to other land users, or arrange for exchanging plots with an adjacent farmer. A completely differ-ent land use is a possibility, e.g. creating a feeding area for wild animals to develop hunting tourism. However if fuel costs are high, potential income from yield is low; it may be economically wise to let small distant fields lie fallow. The bigger the in-put (fuel, fertilizer, labour, etc) costs, and the small-er the yield, the more likely it is that the fallow area will be increased in size. Without alternative options, however, and if the land tax is economi-cally onerous, selling the plot is may be the best solution. At the same time, it is rational to embrace production of plots near the farm compound: rent or buy them, or turn the non-agricultural land us-age to agricultural if crop production conditions are suitable.
Given the many factors to be considered to make farming economically sustainable, decision support systems are necessary. The present model is developed to support the farmer in her/his deci-sions regarding choice of plot for cereal cultiva-tion considering distance, plot area and technology used on that plot. Various scenarios, market and production conditions can be substituted in the calculations.
Conclusions
The methods of agrologistical analysis facilitate evaluation of the role of transportation distance in the production results of an agricultural enterprise. Information from the studies of the influence of the plot distance on the profit potential of the plot can assist farmers’ decisions about employing different cultivation technologies. The method presented in this study enables farmers to estimate the options of using a particular technology depending on the size and distance of the plot as well as to determine the maximum value of the distance or minimum value of the plot size. The calculation method presented in this paper is realised in software. One can con-
0
5
10
15
20
25
0 10 20 30 40 50 60 70 80 90 100Area of a plot, ha
Maximum distance to the plot, km
2200 kg ha¹ 4500 kg ha¹ 7000 kg ha¹
Figure 9. The maximum field distance dependency on plot area in case of unlike grain yields. The costs de-pending on the distance should not exceed 64 € ha-1 and grain price is 180 € Mg-1

A G R I C U L T U R A L A N D F O O D S C I E N C E
Tamm, K. et al. The impact of the plot distance
54
A G R I C U L T U R A L A N D F O O D S C I E N C E
Vol. 19(2010): 43–56.
55
sider plot distance and area while making decisions about the usage of arable land and thus support the competitiveness of the farm.
On the basis of the calculations performed by means of the model, it can be concluded that the economically profitable distance grows propor-tionally with plot size. Under the present Estonian economical conditions, in the farm with an average yield level, the increase in maximum plot distance continues until the plot area reaches 20 ha, with larger plot sizes the distance remains in the interval 18 – 25 km.
The results of the simulations show that tillage technology has more influence on the maximum distance when yearly workloads of machines are equal in all technologies, as compared to the case when the workload depends on technology. The calculation outcomes also show that the prognos-ticated price of fuel must be taken into account when making plot-related decisions. Using distant plots that have been cost-effective until now may become unprofitable due to higher fuel cost. Larger yield or selling price of production are increasing the limit value of costs and, thus, increasing the profitable distance of the plot; on the other hand, the income losses are increasing due to timeliness of operations, lessening the tendency to increase distance.
The composed model needs further elabora-tion. Today, the model considers only the sowing works influence on the income loss related to driv-ing distance, but in the future the model needs to be complemented with other operations. It would also be beneficial to create the possibility to evaluate which conditions would be most rational: to return to the farm compound with the application aggre-gate after the work day, leave it close to the plot, or perform the operation in several consecutive shifts.
ReferencesAaltonen, J., Järvenpää, M., Klemola E. & Laurila, I.
1999. Viljan korjuu-, kuivaus- ja logistiikkakustannuk-set Suomessa. Maatalouden taloudellinen tutkimuslai-tos. Selvityksiä 2/1999, 22 p. (in Finnish).
Asi, M., Möller, H., Soonets, K., Tamm, K & Vettik, R. 1999. Optimization of crop-growing farm and its machinery park parameters. Actual tasks on agricultural engineer-ing. Proceedings of 27. International Symposium on Ag-ricultural Engineering Opatija, Croatia. p. 21−27.
ATK 1984. Põllumajandustööde normid. Mehhaniseeritud tööd. Eesti NSV Agrotööstuskoondise Info- ja Juurutus-valitsus, 383 p. (in Estonian).
Bouma, J., Varallyay, G. & Batjes, N. H. 1998. Principal land use changes anticipated in Europe. Agriculture Ecosys-tems & Environment 67: 103−119.
Burger, A. 2001. Agricultural development and land con-centration in a central European country: a case study of Hungary. Land Use Policy 18: 259−268.
Burton, R. J. F. & Walford, N. 2005. Multiple succession and land division on family farms in the South East of England: A counterbalance to agricultural concentra-tion? Journal Of Rural Studies 21: 335−347.
Crosier, S. 2009. Johann-Heinrich von Thünen: Balanc-ing Land-Use Allocation with Transport Cost By Scott Crosier. Cited 26 January 2009. Updated 1 January 2009. Available on the Internet: http://www.csiss.org/classics/content/9.
EVP 1992. Suviteraviljad. Eesti Vabariigi Põllumajandus-ministeerium. Õppe-Metoodikakabinet.Tallinn, 64 p. (in Estonian).
Garis De Lisle, D. de. 1982. Effects of Distance on Crop-ping Patterns Internal to the Farm. Annals of the Asso-ciation of American Geographers 72: 88−98.
Giunta, F., Motzo, R. & Pruneddu, G. 2007. Trends since 1900 in the yield potential of Italian-bred durum wheat. European Journal of Agronomy 27: 12−24.
Grisso, R. D., David H. Vaughan, D.H.. & Roberson, G. T. 2006. Method for Fuel Prediction for Specific Tractor Models. ASABE Paper No. 061089. St.Joseph, Mich.: ASABE.
Gwyer, B., King, T., McKenzie, B. & Stothers, S. 2005. Land Expansion: Establishing Values and Options. Ma-nitoba Agriculture, Food and Rural Initiatives. Cited 30 August 2007. Updated May 2005. Available on the In-ternet: http://www.gov.mb.ca/agriculture/financial/farm/cap07s01.html
Hahn, J. 2006. Logistik. Jahrbuch Agrartechnik/Yearbook Agricultural Engineering. Band 18. VDMA Landtechnik/ VDI-MEG/ KTBL. Landwirtschaftsverlag: 52−58.
Haller, E. 1969. Idanemiskeskkonna mõju põllukultuuride saagile. Tallinn. 275 p. (in Estonian).
Harasimowicz S. & Ostršgowska B. 2001. Influence of field extent on cultivation costs. Electronic Journal Of Polish Agricultural Universities, Environmental Devel-opment 4. Cited 25 January 2008. Available on the In-ternet: http://www.ejpau.media.pl/volume4/issue2/envi-ronment/art-03.pdf.
Harasimowicz S. 1997. Influence of plot and farm charac-teristics on the value of land. Zeszyty Naukowe Aka-demii Rolniczej im. H. Kollataja w Krakowie. Geodezja (Poland), no.16: 77−85.
Hunt, D. 2001. Farm power and machinery management. -10th ed. Iowa. 368 p.
Jabarin, A. S. & Epplin, F. M. 1994. Impacts of land frag-mentation on the cost of producing wheat in the rain-fed region of northern Jordan. Agricultural Economics 11: 191−196.

A G R I C U L T U R A L A N D F O O D S C I E N C E
Tamm, K. et al. The impact of the plot distance
56
Karmin, M. 1975. Mullaharimise ja külvi kvaliteet. Tallinn: Valgus. p.118. (in Estonian).
Kryachkov, I. & Sharova, N. 2005. Justification of opti-mal sizes of agricultural enterprises. Mezhdunarodnyi Sel’skokhozyaistvennyi Zhurnal, 4: 30−33.
Loko, V. & Tamm, K. 2004. Agronomical and economi-cal aspects of grain growing technology. Teadustööde kogumik Agronoomia 219, Tartu: 34−36. (in Estonian).
Morlon, P. & Trouche, G. 2005. New stakes of field work logistics for annual crops in French conditions. II. The spatial organization of crops: Examples and questions.Cahiers d’études et de recherches francophones / Ag-ricultures. 14: 305−11.
Myyrä, S. & Pietola, K. 2002. Economic importance of par-cel structure on Finnish farms. Agricultural and Food Sci-ence in Finland 11: 163−173.
Older, H. Teraviljakasvatuse käsiraamat. EV Põllumajan-dusministeerium. Saku 1999. 342 p. (in Estonian).
Schnitkey, G. 2005. Growth in farm size. Farm business management. Farm Economics Facts and Opinions. University of Illinois Extension. Cited 28 August 2007. Updated 25 Juny 2005. Available on the Internet: http://www.farmdoc.uiuc.edu/manage/newsletters/fefo05_12/fefo05_12.html .
Statistics Estonia. 2009. Agricultural land by size class and legal form of holder. Cited 25 January 2009. Updat-ed 17 April 2008. Available on the Internet: http://www.stat.ee/agriculture.
Steinsholt, H. 1997. Calculation system for working time need at changes in field size, field shape and distance within the farm area. Informasjonsmoete i Landbruk-soekonomi 1997, Oslo (Norway), 4−5 Nov 1997.
Suomi, P., Lötjönen, T. & Mikkola, H. 2003. Modelling of grain harvesting and storing. Nordic Association of Ag-ricultural Scientists 22nd Congress, July 1−4 2003, Turku, Finland.
Tamm, K. 1999. Optimierung der Grundparameter des Getreideanbaubetriebes nach der Belastung des Mas-chinenparks. Eine Dissertation zur Erlangung des Mag-istergrades. Estnische Landwirtschaftliche Universität. Tartu. p. 76. (in Estonian).
Tamm, K. 2006. Travel distance and and field costs. Actu-al tasks on agricultural engineering. Proceedings of the 34. International symposium on agricultural engineer-ing. Faculty of Agricultural University of Zagreb,Croatia: 415−425.
Tamm, K. & Vettik, R. 2007. Distance and costs of transpor-tation to the field if slurry is used for ferilinsing. Agron-omy 2007: 155−158. (in Estonian).
Tamm, K. & Vettik, R. 2008. Case study: Economics of spring feeding in grassland. Agronomy Research 6, Special issue: 387−396.
Toro, A. de. 2005. Influences on timeliness costs and their variability on arable farms. Biosystems Engineer-ing 92: 1−13.
Weisstein, E. W. 2006a. “Secant Method.” From Math-World--A Wolfram Web Resource. Cited 18 December 2007. Updated 24 March 2006. Available on the Inter-net: http://mathworld.wolfram.com/SecantMethod.html.
Weisstein, E. W. 2006b. “Bisection.” From MathWorld – A Wolfram Web Resource. Cited 18 December 2007. Up-dated 1 March 2004. Available on the Internet: http://mathworld.wolfram.com/Bisection.html .
Witney, B. 1988. Choosing and Using Farm Machines. New York. 412 p.
A G R I C U L T U R A L A N D F O O D S C I E N C E
Vol. 18 (2009): 57–68.
57
© Agricultural and Food Science Manuscript received May 2008
Fertilizer value of urine in pumpkin (Cucurbita maxima L.) cultivationSurendra K. Pradhan*, Susanna Pitkänen, Helvi Heinonen-Tanski
Department of Environmental Science, University of Eastern Finland, PO Box 1627, FI-70211 Kuopio, Finland * e-mail: [email protected]
The fertilizer value of human urine was compared with mineral fertilizer in pumpkin (Cucurbita maxima) cultivation at a dose of 113 kg N ha-1 with no-fertilization used as control. The growth of the vine was bet-ter in urine fertilized pumpkins than in mineral fertilized and non-fertilized pumpkins. Total fruit biomass was higher in mineral fertilized plants compared to urine fertilized and non-fertilized pumpkins. Urine fertilized pumpkins may have suffered from lower potassium or higher chloride, thus they produced fewer flowers and fruits. However, total fruit biomass and the number of fruits were slightly higher in urine fertilized plants than in their non-fertilized counterparts, i.e. 17.2 t ha-1 more pumpkin could be produced with urine fertilizer. The microbial hygiene quality as well as the contents of soluble sugars, protein and taste quality were similar in all treatments, but lower nitrate and higher chloride contents were recorded in urine fertilized pumpkins than other treatments. In conclusion, our study shows that the production rate of urine fertilized pumpkins was somewhat lower than mineral fertilized pumpkins but it was higher than non-fertilized pumpkins. The hygienic quality was equally good with all treatments.
Key-words: Glucose, Nitrogen, Recycle, Sanitation, Vegetables, Waste.
Introduction
Sanitation is an important Millennium goal (UN 2007) and the so called “eco-toilet” or urine sepa-rating toilet could represent a good solution to this problem. Even in Europe, there are 33.4 million
rural people without sanitation services (Aertgeerts 2008). When such services are installed then the urine separating toilet systems may be a practical option. In human excreta, urine contains most of the nitrogen (N) that is excreted, but there is also some phosphorus (P) and potassium (K) (Schouw et al. 2002); i.e. its fertilizer value or nutrient propor-

A G R I C U L T U R A L A N D F O O D S C I E N C E
Pradhan, S.K. Urine fertilization in pumpkin cultivation
58
A G R I C U L T U R A L A N D F O O D S C I E N C E
Vol. 18 (2009): 57–68.
59
tion corresponds to NPK 18:2:5 (Lindén 1997). In general, pure human urine contains very few enteric microorganisms (Heinonen-Tanski et al. 2007). The nutrient content in human urine is in the range of a good fertilizer for plants and this can represent a novel way of recycling of nutrients.
The urea and ammonium found in urine and in artificial fertilizers are chemically similar i.e. 90–100% of urine N is either present as urea or as am-monium, thus they are readily available for plants as Kirchmann and Pettersson (1995) have verified in fertilizing experiments. The P and K contents in urine are also almost totally (95–100%) inor-ganic, i.e. readily plant available (Lentner 1981, Kirchmann and Pettersson 1995). In scientific stud-ies in Finland, urine has been successfully used to fertilize cucumber (Heinonen-Tanski et al. 2007) and cabbage (Pradhan et al. 2007). The growth and yields were as good as could be obtained with min-eral fertilization. However, it is important to study the use of urine fertilizer with different crop plants because of their different nutrients requirements and the variation in the nutrient content in urine. In particular, the high amount of Cl– and the relatively low amount of P in urine might evoke different responses in different plants. Pumpkin was selected for this work because of its worldwide distribu-tion and it is often cultivated near to homes and it is believed to have high nitrogen needs (Reiners 1997). The flowers and young shoots of the pump-kins are also edible and the ripened pumpkin can be preserved for a long time at room temperature. Pumpkin is a flowering vine plant so it is important to study the response of urine on its reproductive parts.
The main objectives of this study were to evalu-ate the use of urine fertilizer 1) on the growth and yield of pumpkin, 2) on the chemical and hygienic quality of the yield and 3) on the flavor charac-teristics of the fruit by comparing the effects of fertilization with urine and conventional, mineral fertilization on these properties. Our working hy-pothesis was that the yield, hygienic and chemical quality of urine fertilized pumpkin fruits would be similar to that of conventionally i.e. mineral ferti-lized, pumpkin fruits.
Materials and methods
Plant materials and plantation
Pumpkin (Cucurbita maxima L. Ver. cabaza) seeds (Hammenhögs) were sown in small pots in a greenhouse on 7th May 2007. The fully grown seedlings with similar vine lengths were planted outdoors in the research garden of University of Kuopio, (62.9oN and 27.7oE) on 6th June 2007. The total cultivation area was 80 m2, this being divided into 12 plots each of 3 m2 area with about 40 cm (total 32 m2) narrow protecting strips between the different treatment plots with no vegetation in these protective strips. The cultivated soil was clay loam and the soil characteristics in the upper 15 cm soil layer are shown in Table 1. The cultivated area had been used for cultivation of cabbage in 2006 and before that time it was a grass field. The experi-ment area was designed as a Latin square model for three different treatments i.e. no fertilizer, mineral fertilizer and urine fertilizer all with four replicates. One pumpkin plant was cultivated in each plot.
Fertilizer treatments
Urine fertilized and mineral fertilized plots were both treated with a dose of 113 kg N ha-1 (Table 2). Urine fertilizer (low concentrated NPK 0.93–0.063–0.36 and high concentrated NPK 8.17–0.65–2.1) was arranged so that the applications were first 7.3 L plant-1 with low concentrated urine on cultivation days 5 and 7 after planting, and then 0.84 L plant-1 with high concentrated urine on days 13, 19 and 45. The urine was applied with a measuring beaker and sprinkled on the soil about 50 cm around the plants. The soil surface was tilled before and after application of urine fertilizer so that the liquid could be better absorbed.
Mineral fertilizer (Puutarhan Y-lannos 1, NPK 10–7–14 i.e. 7% NH4
+-N and 3% NO3–-N) which
also contained Mg 2%, S 9%, B 0.15%, Cu 0.1%, Fe 0.1%, Mn 0.7%, Mo 0.01%, Zn 0.1% and Se 0.001% was also applied on days 5, 9, 13, 19, and

A G R I C U L T U R A L A N D F O O D S C I E N C E
Pradhan, S.K. Urine fertilization in pumpkin cultivation
58
A G R I C U L T U R A L A N D F O O D S C I E N C E
Vol. 18 (2009): 57–68.
59
45 with the applied dose being 68 g plant-1 at each interval. Mineral fertilizer was applied about 50 cm around the plants and mixed by tilling the soil. Meanwhile, soil from no-fertilization treatment plots was also tilled to ensure uniform soil activity in all treatments.
Urine collection and hygienic considerations
The low concentrated urine was collected from several eco-toilets (where urine is collected sepa-rately from other excreta) in private homes from the Finnish Baltic Archipelago. The high concentrated
urine was collected during the previous winter from several eco-toilets in private homes in the vicinity of Tampere, Finland. The collected urine was brought and stored at +6 oC until use as fertilizer i.e. high concentrated urine was about 2–3 months old and low concentrated urine about 1 year old. The stored urine was analyzed for its microbiological properties. The presence of Salmonella spp., fecal coliforms, clostridia, enterococci bacteria and coliphage virus was tested from the solution and sediment samples from the storage containers (Table 3). Salmonella spp. were determined by the ISO 6579 method (ISO 1993) including pre-enrichment, enrichment and confirmative plating on count on XLD and Rambach media. Fecal coliforms were determined by the SFS 4088 (SFS, 2001) standard plate count method on
Table 1. Nutrient contents in the soil of the field experiment before and after cultivation, geometrical mean values ± SD (N = 4).
Before cultivation and fertilization After cultivation and fertilization
Soil characteristics None Mineral Urine
Total-N (g kg-1 DW) 23.34 ND ND ND
NO3–-N (mg kg-1 DW) 224.31 ± 83.9 2.92 ± 1.02 3.66 ± 0.79 3.23 ± 1.76
NO2–-N (mg kg-1 DW) 0.07 0.15 ± 0.2 0.21 ± 0.15 0.12 ± 0.04
Cl– (mg kg-1 DW) 14.04 ± 3.0 24.68 ± 11.57 21.64 ± 3.07 20.14 ± 6.41
Water holding capacity (%) 43 ND ND ND
pH 7.11 6.72 6.65 6.81
SD = Standard deviation, DW = Dry weight, ND = Not determined.
Table 2. Applied amount of fertilizers plant-1 during the entire cultivation time and this fertilization be-ing applied to a 3 m2 cultivation area.
Amount of nutrients applied plant-1 Mineral fertilizer Urine fertilizer ( low concentrated urine + high concentrated urine)
N g 34 34 (13.58 + 20.43)
P g 23 2.41 (0.91 + 1.5)
K g 47.6 10.5 (5.25 + 5.25)
Total fertilizer applied 340 g 17.1 (14.6 + 2.5) L

A G R I C U L T U R A L A N D F O O D S C I E N C E
Pradhan, S.K. Urine fertilization in pumpkin cultivation
60
A G R I C U L T U R A L A N D F O O D S C I E N C E
Vol. 18 (2009): 57–68.
61
mFC agar and incubated at 44 oC for 24 hours. Enterococci were cultured on Slanetz-Bartley agar and incubated at 37 oC for 48 hours (SFS 2000). The Finnish microbiological SFS-methods correspond to the methods of the American Public Health As-sociation (2005). Clostridia were determined with sulphite-iron agar after heat treatment and anaerobic incubation at 37 oC for 48 hours according to the SFS-EN–26461–2 plate count method (SFS 1993). After incubation, bacterial colonies were counted and microbial numbers calculated as CFU ml-1. Coliphages were determined by the ISO method (ISO 1998) with two Escherichia coli hosts i.e. ATCC 13706 and ATCC 15597 on THG agar by a double layer method (ISO 1998) and incubated at 37 oC for 24 hours; plaques were counted on the next day (Table 3). In the statistical evaluation of
geometric means or log-transformed numbers half of the detection limit (i.e. 0.5 CFU or PFU ml-1) was used when the count was 0.
The nutrient contents of the urine; total-N, NH4
+-N, NO3–-N, NO2
–-N, total-P, PO4–-P, K were
analyzed according to the SFS standard methods, which correspond to the APHA methods (APHA 2005). Total nitrogen was analyzed by the Kjeldahl-method (ISO 1975). P and K were determined by colorimetric procedures with SFS 3026 and 8049 methods, respectively, ammonium by spectropho-tometry (SFS 2005). These SFS methods corre-spond to the ISO methods for particular chemical analysis. NO3
–, NO2–, and Cl– were analyzed by
ion-chromatography (Dionex DX–120, AS40 Au-tomated sampler, Dionex Corporation, USA).
Table 3. Main chemical parameters in the urine solution used (g L-1 urine except for pH). Log10 numbers ± SD of Salmonella and some indicator microorganisms in urine solution and sediment (CFU ml-1 and PFU ml-1 for bacteria and coliphages, respectively) (N = 3). ND = not determined. ldl = less than detection limit, detection limit = 1 CFU ml-1 and 1 PFU ml-1 except for Salmonella and fecal coliforms.
Parameters Low concentrated urine High concentrated urine
pH 8.6 9.2
Chloride 0.44 3.03
Total-P 0.063 0.65
PO4 -P ND 0.62
Suspended P 0.061 ND
Total-N 0.930 8.17
Ammonium-N 0.940 8.57
Nitrate-N < 0.005 0.01
Nitrite-N < 0.005 < 0.01
Potassium 0.360 2.1
Microorganisms Solution Sediment Solution Sediment
Salmonella spp. ND ND none 25ml-1 none 25ml-1
Fecal coliforms none 40ml-1 none 40ml-1 none 30ml-1 none 20ml-1
Enterococci ldl ldl 0.8 ± 0.7 1.1 ± 1.2
Clostridia 0.7 1 ldl ldl
Coliphages host E. coli ATCC 13706 0.5 0.9 1.6 ± 1.9 1.9 ± 2.2
Coliphages host E. coli ATCC 15597 ldl ldl ldl ldlNote: - Total-N showed slightly lower than NH4
+-N, which might be due to small losses of NH4+-N during the digestion process in
Kjeldahl method.

A G R I C U L T U R A L A N D F O O D S C I E N C E
Pradhan, S.K. Urine fertilization in pumpkin cultivation
60
A G R I C U L T U R A L A N D F O O D S C I E N C E
Vol. 18 (2009): 57–68.
61
Climate and irrigation
The monthly precipitation was 55, 113 and 56 mm, and the average temperatures were 14.7 16.7 and 16.6 oC in June, July and August as determined at the nearby Kuopio airport (Finnish Meteorological Institute 2007).
Pumpkin plants were irrigated for 2 hours every second day during the first month, for 3 hours every second day during the second and third month of the cultivation though there was no irrigation on rainy days. The irrigation was done by sprinkler irrigation and the wetting rate was 2 mm hr-1 dur-ing the irrigation period. In this trial, the first frost came earlier so the cultivation could not be con-tinued.
Growth and harvest
The vine length in the main vine and the area of the largest leaf of each plant were measured on every fifth to seventh day to determine the growth rate of the plants. Fully developed flowers were counted on every seventh day to determine the impact on the reproductive parts.
The pumpkins were harvested from day 74 up to day 92. The fruit biomass was recorded, and cir-cumference and length of the fruits were measured.
Microbial analyses
Peeled pumpkin fruit, mesocarp, was used for the chemical and hygienic analyses (nutrient content and microbiological hygiene). A total of 20 g peeled pumpkins was mixed with 180 ml of sterilized water and homogenized in grinder and this homogenized solution was used for the microbial analysis. Thus Salmonella spp., fecal coliforms, clostridia, ente-rococci and coliphages were determined with the same analysis as used for urine analysis with the detection limits being 10 CFU g-1 or 10 PFU g-1, except for 1 CFU 25g-1 sample for Salmonella.
Chemical analyses
For analysis of NO3–, NO2
– and Cl–, a representa-tive sample of peeled and cut pumpkin from each experimental plot was dried at 60 oC for 4 days. Dry pumpkin material was milled, 0.5 g milled sample was mixed with 100 ml ion free water (18.2 MΩ) and heated at 50 oC for 30 minutes in a water bath, the solution was filtered and 5 ml of the solution taken to a vial with a syringe filter. This extract sample was then frozen until analyzed. In the analyses of total-N and soluble sugar (sucrose, D-glucose, D-fructose), a parallel sample of peeled and cut pumpkins was freeze dried at –50 oC for 4 days. NO3
–, NO2–, Cl–
and total-N were determined by the same methods as used for urine.
The freeze-dried samples were homogenized with a mortar, and 300 ± 30 mg (exact weight re-corded for calculation) sample was weighed into a conical flask, 100 ml of ion free water was added and stirred for 1 hour to make the solution. The mixture solution was filtered and subsequently the filtrate was treated with Carrez-I and Carrez-II so-lution to deproteinize it and it was filtered again to separate the precipitated protein. This solution was transferred into the cuvettes and monitored with en-zymatic reactions at different time intervals for su-crose, D-glucose and D-fructose separately. After the enzymatic reactions, the samples were determined in a spectrophotometer at a wavelength of 340 nm and the absorbance recorded (Sekin 1978). The kit used for this assay was the enzymatic bio analysis/food analysis system from R-biopharm, Germany.
Flavor testing
Triangle and ordinal taste testing of the fresh peeled chopped pumpkins from differently fertilized plots were conducted with a panel of 31 individuals; the ability of panel participants to recognize basic tastes (sweet, sour, salty and bitter) had been pre-tested ac-cording to the procedure recommended by Meilgaard et al. (1991). The panel consisted of 21 women and 10 men aged from 20 to 62 years, mainly university and polytechnic students and staff. The tasting ses-

A G R I C U L T U R A L A N D F O O D S C I E N C E
Pradhan, S.K. Urine fertilization in pumpkin cultivation
62
A G R I C U L T U R A L A N D F O O D S C I E N C E
Vol. 18 (2009): 57–68.
63
sion was organized in a test kitchen with the tasters being served three sliced pumpkin samples marked with blind code numbers in two triangle taste tests. In the first triangle test, three sliced fresh pump-kins were tasted, one or two samples from urine fertilized, with the other one or two being mineral fertilized and in the second test, they were supplied with sliced pumpkin samples from urine fertilized pumpkins with non-fertilized pumpkins in the same manner as in the first test. The tasters had to state which sample differed from the other two. In the ordinal test, the tasters were served with three sliced pumpkin samples from all different fertilizers with blind codes and they were asked to evaluate which sample they preferred. The tasters could drink water between the tests and taste the samples as many times as they wished without any time limitations. They could also comment on any possible differences in texture or color of the sliced pumpkin.
All these chemical, microbial and flavor anal-ysis were conducted with peeled pumpkins, as mesocarp is the main part used of this variety of pumpkins. Similarly, for all these analysis, pump-kins were selected from the same harvesting day and similar size.
Statistical analyses
Basic data were organized in MS Excel, and general statistical parameter characteristics were calculated to characterize the overall feature of the data sets. Tests to ensure the normality of the raw and transformed data were performed prior to the other statistical analyses.
Fruit characteristics and results of microbial and chemical analysis were analyzed with SPSS 14.0 by one way variance analysis (ANOVA), and differenc-es between averages assessed by Tukey’s Post Hoc Test. The correlation between relevant characteris-tics was analyzed by Pearson correlation test (with 2-tailed test of significance). Kruskal Wallis Test and Mann-Whitney Test were also used to analyze the mean size of pumpkin fruits. The p values below 0.05 were considered as statistically significant.
Results
Urine quality
The smell of the low concentrated urine was mild, whereas high concentrated urine had a strong am-monia odor. Very few microorganisms were detected in the hygienic analysis of the urine (Table 3).
Plant growth
The plants in all three treatments grew well. For as-sessment of the growth rate, the differences among treatments in vine length, number of branches on main vine and size of largest leaf were compared, and the results for the number of branches and leaf area were not significantly different characteristics (data not shown). Hence, only results for main vine length are shown to illustrate the growth rate (Fig. 1). The growth rate of mineral fertilized pumpkins was slightly better than the urine and non-fertilized pumpkin plots on day 23 of the trial, but the urine fertilized plants grew faster from day 44 and overtook the mineral fertilized treatment on about day 50 (Fig. 1), and by about day 65 even the non-fertilized vines were longer than the vines fertilized with mineral fertilizer. The growth rate of urine fertilized pumpkin was higher than for non-fertilized pumpkin during the whole experiment. However, the difference between treatments was statistically significant only on cultivation day 92 (p = 0.039)
The growth of the fertilized pumpkins was more rapid, the flowering started on day 17 for the mineral fertilized pumpkins as compared to day 23 for urine and non-fertilized pumpkins. The num-bers of flowers (Fig. 2, Table 4) and fruits (Table 4) were also comparatively lower in the urine fer-tilized and non-fertilized treatments (Fig. 2). Vine length and leaf area were strongly correlated (r2 = 0.956, p = 0.0001) therefore only data for vine length is presented in Fig. 2.
The total fruit biomass of mineral fertilized pumpkins was considerably higher than for non-fertilized and urine fertilized pumpkins (Table 4).
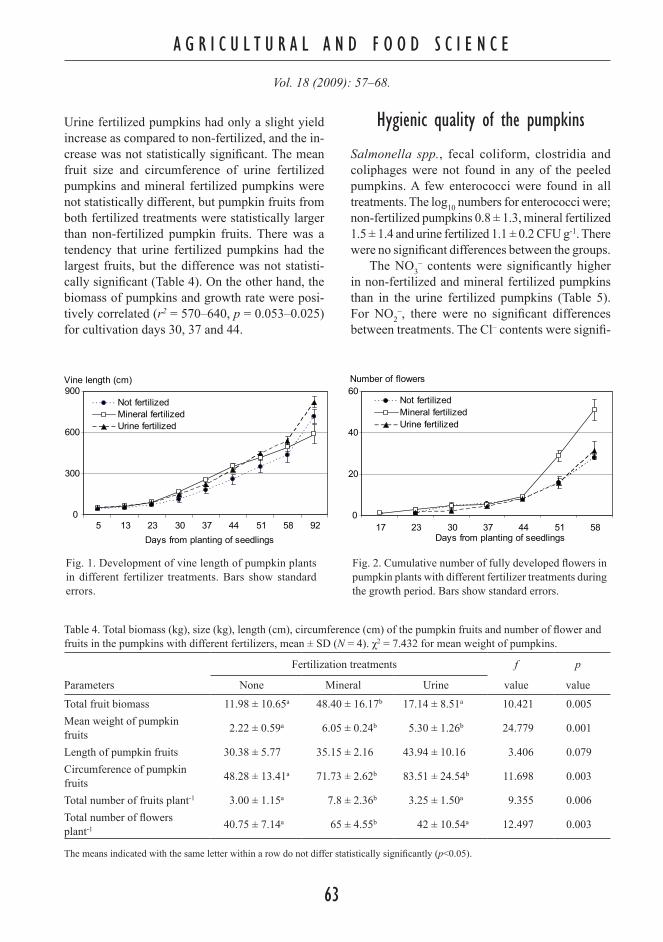
A G R I C U L T U R A L A N D F O O D S C I E N C E
Pradhan, S.K. Urine fertilization in pumpkin cultivation
62
A G R I C U L T U R A L A N D F O O D S C I E N C E
Vol. 18 (2009): 57–68.
63
Urine fertilized pumpkins had only a slight yield increase as compared to non-fertilized, and the in-crease was not statistically significant. The mean fruit size and circumference of urine fertilized pumpkins and mineral fertilized pumpkins were not statistically different, but pumpkin fruits from both fertilized treatments were statistically larger than non-fertilized pumpkin fruits. There was a tendency that urine fertilized pumpkins had the largest fruits, but the difference was not statisti-cally significant (Table 4). On the other hand, the biomass of pumpkins and growth rate were posi-tively correlated (r2 = 570–640, p = 0.053–0.025) for cultivation days 30, 37 and 44.
Hygienic quality of the pumpkins
Salmonella spp., fecal coliform, clostridia and coliphages were not found in any of the peeled pumpkins. A few enterococci were found in all treatments. The log10 numbers for enterococci were; non-fertilized pumpkins 0.8 ± 1.3, mineral fertilized 1.5 ± 1.4 and urine fertilized 1.1 ± 0.2 CFU g-1. There were no significant differences between the groups.
The NO3– contents were significantly higher
in non-fertilized and mineral fertilized pumpkins than in the urine fertilized pumpkins (Table 5). For NO2
–, there were no significant differences between treatments. The Cl– contents were signifi-
Table 4. Total biomass (kg), size (kg), length (cm), circumference (cm) of the pumpkin fruits and number of flower and fruits in the pumpkins with different fertilizers, mean ± SD (N = 4). χ2 = 7.432 for mean weight of pumpkins.
Fertilization treatments f p
Parameters None Mineral Urine value value
Total fruit biomass 11.98 ± 10.65a 48.40 ± 16.17b 17.14 ± 8.51a 10.421 0.005Mean weight of pumpkin fruits 2.22 ± 0.59a 6.05 ± 0.24b 5.30 ± 1.26b 24.779 0.001
Length of pumpkin fruits 30.38 ± 5.77 35.15 ± 2.16 43.94 ± 10.16 3.406 0.079Circumference of pumpkin fruits 48.28 ± 13.41a 71.73 ± 2.62b 83.51 ± 24.54b 11.698 0.003
Total number of fruits plant-1 3.00 ± 1.15a 7.8 ± 2.36b 3.25 ± 1.50a 9.355 0.006Total number of flowers plant-1 40.75 ± 7.14a 65 ± 4.55b 42 ± 10.54a 12.497 0.003
The means indicated with the same letter within a row do not differ statistically significantly (p<0.05).
0
20
40
60
17 23 30 37 44 51 58Days from planting of seedlings
Number of flowers
Not fertilizedMineral fertilizedUrine fertilized
0
300
600
900
5 13 23 30 37 44 51 58 92Days from planting of seedlings
Vine length (cm)
Not fertilizedMineral fertilizedUrine fertilized
Fig. 2. Cumulative number of fully developed flowers in pumpkin plants with different fertilizer treatments during the growth period. Bars show standard errors.
Fig. 1. Development of vine length of pumpkin plants in different fertilizer treatments. Bars show standard errors.
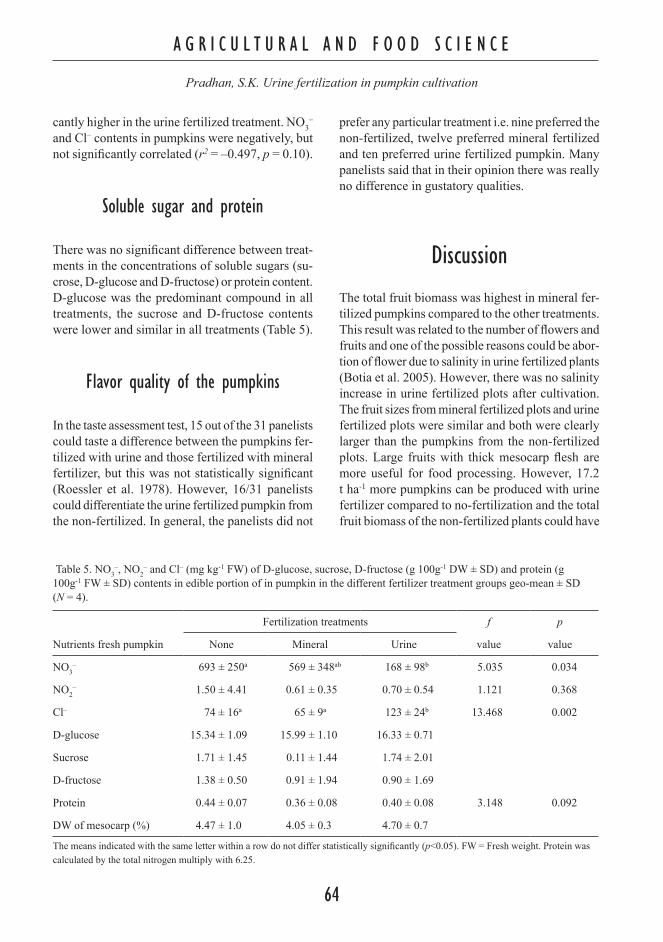
A G R I C U L T U R A L A N D F O O D S C I E N C E
Pradhan, S.K. Urine fertilization in pumpkin cultivation
64
A G R I C U L T U R A L A N D F O O D S C I E N C E
Vol. 18 (2009): 57–68.
65
cantly higher in the urine fertilized treatment. NO3–
and Cl– contents in pumpkins were negatively, but not significantly correlated (r2 = –0.497, p = 0.10).
Soluble sugar and protein
There was no significant difference between treat-ments in the concentrations of soluble sugars (su-crose, D-glucose and D-fructose) or protein content. D-glucose was the predominant compound in all treatments, the sucrose and D-fructose contents were lower and similar in all treatments (Table 5).
Flavor quality of the pumpkins
In the taste assessment test, 15 out of the 31 panelists could taste a difference between the pumpkins fer-tilized with urine and those fertilized with mineral fertilizer, but this was not statistically significant (Roessler et al. 1978). However, 16/31 panelists could differentiate the urine fertilized pumpkin from the non-fertilized. In general, the panelists did not
prefer any particular treatment i.e. nine preferred the non-fertilized, twelve preferred mineral fertilized and ten preferred urine fertilized pumpkin. Many panelists said that in their opinion there was really no difference in gustatory qualities.
Discussion
The total fruit biomass was highest in mineral fer-tilized pumpkins compared to the other treatments. This result was related to the number of flowers and fruits and one of the possible reasons could be abor-tion of flower due to salinity in urine fertilized plants (Botia et al. 2005). However, there was no salinity increase in urine fertilized plots after cultivation. The fruit sizes from mineral fertilized plots and urine fertilized plots were similar and both were clearly larger than the pumpkins from the non-fertilized plots. Large fruits with thick mesocarp flesh are more useful for food processing. However, 17.2 t ha-1 more pumpkins can be produced with urine fertilizer compared to no-fertilization and the total fruit biomass of the non-fertilized plants could have
Table 5. NO3–, NO2
– and Cl– (mg kg-1 FW) of D-glucose, sucrose, D-fructose (g 100g-1 DW ± SD) and protein (g 100g-1 FW ± SD) contents in edible portion of in pumpkin in the different fertilizer treatment groups geo-mean ± SD (N = 4).
Fertilization treatments f p
Nutrients fresh pumpkin None Mineral Urine value value
NO3– 693 ± 250a 569 ± 348ab 168 ± 98b 5.035 0.034
NO2– 1.50 ± 4.41 0.61 ± 0.35 0.70 ± 0.54 1.121 0.368
Cl– 74 ± 16a 65 ± 9a 123 ± 24b 13.468 0.002
D-glucose 15.34 ± 1.09 15.99 ± 1.10 16.33 ± 0.71
Sucrose 1.71 ± 1.45 0.11 ± 1.44 1.74 ± 2.01
D-fructose 1.38 ± 0.50 0.91 ± 1.94 0.90 ± 1.69
Protein 0.44 ± 0.07 0.36 ± 0.08 0.40 ± 0.08 3.148 0.092
DW of mesocarp (%) 4.47 ± 1.0 4.05 ± 0.3 4.70 ± 0.7
The means indicated with the same letter within a row do not differ statistically significantly (p<0.05). FW = Fresh weight. Protein was calculated by the total nitrogen multiply with 6.25.

A G R I C U L T U R A L A N D F O O D S C I E N C E
Pradhan, S.K. Urine fertilization in pumpkin cultivation
64
A G R I C U L T U R A L A N D F O O D S C I E N C E
Vol. 18 (2009): 57–68.
65
been even lower if the cultivation land had been of poorer quality such as sandy soil, soil after erosion or long time abandoned land.
Initial growth rate of pumpkin plants in min-eral fertilized plots was higher than urine fertilized plots, but later the growth rate was better in urine fertilized plots as has been found in previous stud-ies with cabbage and cucumber cultivation (Prad-han et al. 2007 and Heinonen-Tanski et al. 2007). One possible explanation for high initial growth in mineral fertilized pumpkins might be that it has an optimal NO3
–-N content (3% NO3–-N) and NO3
–-N is the preferred uptake compound of N for Cucur-bita pepo (Chance et al. 1999). On the other hand, some of the N might have been lost from urine fertilizer, especially from high concentrated urine (Singurindy et al. 2006). Here, we did not dilute the urine because we were interested to examine its output from very normal practice as water may not be readily available in many parts of the world. An-other possible explanation for this difference would be that the urine fertilized soil might have a slower nitrification process possibly as a result of the high chloride content. This explanation would conform to the proposal of Moussa et al. (2006) who showed that increasing salinity lead to a reduction of nitri-fication. Although the initial growth rate of min-eral fertilized pumpkins was better, their growth ceased midway through the trial, possibly because of nitrogen deficiency, whereas the urine fertilized pumpkins still continued to thrive, this is similar to the growth with cucumber (Heinonen-Tanski et al. 2007) and with cabbage (Pradhan et al. 2007). It may be because the nitrogen in urine fertilizer has a longer available time than the nitrogen in mineral fertilizer. Unfortunately the concentrations of residual ammonium and total-N in fertilized soil were not studied. Some chemical parameters were assayed but they were not significantly different in between treatments (Table 1). In addition, the re-sult showed that the growth rate and the total yield biomass was positively correlated (r2 = 570–640, p = 0.053–0.025) on cultivation days 30, 37 and 44.
Granular mineral fertilizer can remain undis-solved lying in the upper layer of dry soil e.g. dur-ing the dry season, if there is insufficient irrigation. On the contrary, urine is a soluble liquid fertilizer
which may mean that nitrogen is more rapidly available and effective even in the dry season. However, it may be best to apply urine fertilizer in the evening or to irrigate after use of urine or to till the soil before and after the urine application as a way to reduce the N loss from urine fertilizer.
It should be noted that the study was only based on equal N levels in each treatment. Hence, P and K contents were much lower with urine fertilization compared to mineral fertilization (Table 2). The numbers of flowers were lower in non-fertilized plots and urine fertilized plots than mineral fer-tilized plots (Fig. 2, Table 4), and there may be a relation between the lower P and K application and the lower number of fruits, especially since the vine growth did not differ greatly between the treatments until the main flowering time. This may be traced to the lack of P or/and K meaning that the plants might take up Na+ instead of K+ as proposed by Kaya et al. (2007) in tomato plants. This result is supported by the findings that lower K uptake has been shown to reduce the number of flowers and fruits of almond (Prunus dulcis) (Reidel et al. 2004) or reproductive growth in cotton (Gossypium hirsutum L) (Read et al. 2006). Although the num-bers of male and female flowers were not counted separately, the lower number of fruits in urine and non-fertilized plants points to a lower number of female flowers and this may be due to lower P or/and K contents. This explanation is supported from the results of Grazia et al. (2003) who reported that the lower K could reduce the number of female flower in summer squash (Cucurbita maxima). Our study showed a lower number of fruits compared to the total number of flowers. This may be due to the fact that in pumpkins the male to female flower ratio is < 10:1 due to high/excessive fruit setting (Nayar and More 1998). In order to increase the P and K availability, and thereby possibly the number of fruits, urine fertilized crops should also be sup-plied with other fertilizers e.g. meat and bone meal which is rich in P, or ash which is rich in P and K.
Very few microorganisms were detected in the urine and they were present at a similar level as re-ported by Schönning (2001) and Heinonen-Tanski et al. (2007). The few pathogens in urine fertilizer actually applied into soil may pose a very low

A G R I C U L T U R A L A N D F O O D S C I E N C E
Pradhan, S.K. Urine fertilization in pumpkin cultivation
66
A G R I C U L T U R A L A N D F O O D S C I E N C E
Vol. 18 (2009): 57–68.
67
risk for agricultural consumer products compared to many other contamination sources around the field. This study showed that the hygienic quality of urine fertilized pumpkins did not differ between the treatments. All fertilized pumpkins contained a few enterococci possibly as a result of contamina-tion by birds, insects etc. Nevertheless, urine fer-tilizer needs to be used with care to reduce any possible risks; it should never be applied directly to any parts of the plants, since in addition to possible microbial contamination, high concentrated urine can physically damage many plants. A protective period of some 25 days before harvesting is recom-mended (Jönsson et al. 2004).
The residual NO3–-N, NO2
–-N, and Cl– contents in the soil were similar after all fertilizer treatments (Table 1). Surprisingly, the residual chloride con-tent in soil from urine fertilized plots was similar to the plots receiving the other fertilizer treatments. This is possibly due to the high water solubility of chloride. The smaller number of fruits of the pumpkins in urine fertilized plots could be also at-tributable to the high chloride contents in the urine fertilizer (the salinity in the high concentrated urine was 47.2 mS cm-1), which could reduce the num-bers of flowers, flower fertility and seed viability as presented by Labidi et al. (2004) with 35 mM NaCl solution and Botia et al. (2005) with 6.1 dS m-1 salinity for irrigation water.
In this study, urine fertilization did not change the contents of soluble glucose. The level of D-glucose was higher than sucrose and D-fructose with all treatments which is a similar trend to that presented by Kurz et al. (2008). The protein content in our pumpkins was lower compared to the values presented by Bognar (2006) i.e. 1.7 g 100g-1 FW and Souci et al. (1994) i.e. 1.4 g 100g-1 FW.
There were similar levels of NO3– in mineral
fertilized and non-fertilized pumpkins and those values are in agreement with the NO3
– concentra-tions (55–639 mg kg-1) reported in fresh pumpkins from different countries by Thomson (2004). The NO3
– content in urine fertilized pumpkins was lower than in non-fertilized pumpkins. All pump-kin fruits were evaluated as tasting good, which may be due to their similar soluble sugar and other nutrients contents. Although the chloride content
was higher in urine fertilized pumpkins than in the others this does not seem to be appreciable in the taste assessment.
In conclusions, this study supports one part of our working hypothesis and it demonstrated that the chemical and microbial quality of pumpkins cultivated with human urine fertilizer is as good as that achieved with traditional treatments. This study did not substantiate a second study hypoth-esis i.e. it seemed that there were lower pumpkin yields in urine fertilized plots compared to mineral fertilized plots, perhaps attributable to either the lower K or the higher Cl– contents present in urine fertilizer. Although, the total biomass was lower in urine fertilized groups compared to mineral ferti-lized groups but the productions can be 17.2 t ha-1 higher than can be achieved with no fertilization. However, this can be rectified by artificially elevat-ing the P and K contents in urine with supplements as recommended for pumpkins cultivation. The ef-fect of high Cl– contents in the urine on different plants and soil ecology needs to be studied further.
Acknowledgements: We would like to thank Professor Jarmo K. Holopainen for his valuable advice, Finnish Cultural Foundation for financial support and Dr. Ewen McDonald for English language correction.
ReferencesAertgeerts, R. 2008. Europe’s success with water and
health: a policy chronology. Water 21 April 2008: 45–48. American Public Health Association (APHA). 2005. Stan-
dard methods for the examination of water and waste-water. 21st Edition. Washington DC.
Bognar, A. 2006. Nutritive value of some varieties of pump-kin and winter squash grown in Germany. Ernährungs-Umscha, 53: 305 p.
Botía, P., Carvajal, M., Cerdá, A. d Martinez, V. 2005. Yield and fruit quality of two melon cultivars irrigated with sa-line water at different stages of development, European Journal of Agronom, 23: 243–253.
Chance, W.O., Somda, Z.C. & Mills, H.A. 1999. Effect of nitrogen form during the flowering period on zucchini squash growth and nutrient element uptake. Journal of Plants Nutritio, 22: 597–607.
Finnish meteorological institute. 2007. Home pages. Ilma-tieteen laitos, meteorologiska institutet. Updated daily. Available on the internet: http://www.fmi.fi/il/index.html
Grazia, J.D., Tittonell, P., Perniola, O.S., Ariel Caruso, A. &

A G R I C U L T U R A L A N D F O O D S C I E N C E
Pradhan, S.K. Urine fertilization in pumpkin cultivation
66
A G R I C U L T U R A L A N D F O O D S C I E N C E
Vol. 18 (2009): 57–68.
67
Chiesa, Y.A. 2003. Summer squash (Cucurbita maxima var. zapallito (Carr.) Millán) earliness and yield as affect-ed by the nitrogen:potassium ratio. Agricultura Técnica (Chile), 64: 428–435. Available on the internet: https://tspace.library.utoronto.ca/handle/1807/5096.
Heinonen-Tanski, H., Sjöblom, A., Fabritius, H. & Karinen, P. 2007. Pure human urine is a good fertilizer for cucum-bers. Bioresource Technolog, 98: 214–217.
ISO 1871. 1975. Agricultural food products - General di-rections for the determination of nitrogen by the Kjel-dahl method.
ISO 6579, 1993. General guidance on methods for the de-tection of Salmonella.
ISO/DIS, 10705–2.2. 1998. Water quality-Detection and enumeration of bacteriophages- Part: 2, Enumeration of somatic coliphages.
Jönsson, H., Richert Stintzing, R., Vinnerås, B. & Salo-mon, E. 2004. Guidelines on the use of urine and feces in crop production. EcoSanRes publication. Stockholm Environmental Institution (SEI). 2. 18 p.
Kaya, C., Tuna, A.L., Ashraf, M., Altunlu, H., Yokas, I. , Yag-mur, B., 2007. The effects of calcium sulphate on growth, membrane stability and nutrient uptake of tomato plants grown under salt stress. Environmental and Experimen-tal Botan, 59: 173–178.
Kirchmann, H. & Pettersson, S. 1995. Human urine chem-ical composition and fertilizer use efficiency. Fertilizer Researc, 40: 149–154.
Kurz, C., Carle, R. & Schieber, A. 2008. Characterization of cell wall polysaccharide profiles of apricots (Prunus armeniaca L.), peaches (Prunus persica L.), and pump-kins (Cucurbita sp.) for the evaluation of fruit product au-thenticity. Food Chemistr, 106: 421–430.
Labidi, N., Lachaal, M., Soltani, A., Grignon, C. & Hajji, M. 2004. Variability of the effects of salinity on reproduc-tive capacity of Arabidopsis thaliana. Journal of Plant Nutritio, 27: 1561–1573.
Lentner, C.G. 1981. Scientific tables. Units of measure-ment, body fluids, composition of the body, nutrition. 8th ed. Med. Education Div., Ciba-Geigy.
Lindén, B. 1997. Human urine as a nitrogen fertilizer applied during crop growth to winter wheat and oats in organic farming. Department of Agricultural Research. Skara, Serie-B, Crops and Soils Report 1. Sweden.
Meilgaard, M., Civille, G.V. & Carr, B.C. 1991. Sensory eval-uation techniques. 3rd edition CRC Press book. 61–68 p.
Moussa, M.S., Fuentes, O.G., Lubberding, H.J., Hooijmans, C.M., Van Loosdrecht, M.C.M. & Gijzen, H.J. 2006. Nitri-fication activities in full-scale treatment plants with vary-ing salt loads. Environmental Technolog, 27: 635–643.
Nayar N.M. , More, T.A., 1998. Cucurbits. Science Publish-ers, Inc., Enfield, New Hampshire, USA. 340 p.
Pradhan, S.K., Nerg, A-M., Sjöblom, A., Holopainen, J.K. & Heinonen-Tanski, H. 2007. Use of human urine fertil-izer in cultivation of cabbage (Brassica oleracea) – im-pacts on chemical, microbial and flavor quality. Jour-nal of Agriculture and Food chemistr, 55: 8657–8662.
Read, J.J, Reddy, K.R. & Jenkins, J.N. 2006. Yield and fi-
ber quality of Upland cotton as influenced by nitrogen and potassium nutrition. European Journal of Agronom, 24: 282–290.
Reidel, E.J., Brown, P.H., Duncan, R.A., Heerema, R.J. & Weinbaum, S.A. 2004. Sensitivity of yield determinants to potassium deficiency in ‘Nonpareil’ almond (Prunus dulcis (Mill.) DA Webb). Journal of Horticultural Science and Biotechnolog, 79: 906–910.
Reiners, S., Riggs, D.I.M., 1997. Improving yields of pump-kins through spacing, fertilizer, and irrigation. Published by The South Central New York Agriculture Team, Cor-nell University, Ithaca, NY. Updated on April 2009. Avail-able on the internet: http://www.hort.uconn.edu/ipm/veg/htms/maxpumprod.htm.
Roessler, E.B., Pangborn, R.M., Sidel, J.L. & Stone, H. 1978. Expanded statistical tables for estimating signifi-cance in paired-preference, paired-difference, duo-trio and triangle test. Journal of Food Scienc, 43: 940–947.
Schönning, C. 2001. Hygienic aspects on the reuse of source-separated human urine. Paper prepared for NJF Seminar no. 327, Copenhagen. August 20–21.
Schouw, N.L., Danteravanich, S., Mosbaeck, H. & Tjell, J.C. 2002. Composition of human excreta, a case study from Southern Thailand. Science of Total Environmen, 286: 155–166.
Sekin, S. 1978. Enzymatic determination of Glucose, Su-crose and Fructose in tobacco. Tobacco Scienc. 23: 75–77 an; Tobacco Int, 181: 27–29.
SFS 4088, 2001. Membrane filter technique for the enumer-ation of thermotolerant (fecal) coliform bacteria in wa-ter. Finnish Standard Association, Helsinki, Finland. 4 p.
SFS-EN, 26461–2., 1993. Water quality. Detection and enumeration of the spores of sulfite-reducing anaerobes (clostridia). Part 2: Method by membrane filtration. Finn-ish Standard Association, Helsinki, Finland.
SFS-EN, ISO 7899–2., 2000. Water quality- Detection and enumeration of intestinal enterococci - Part 2: Membrane filtration method.
SFS-EN, ISO 11732: En., 2005. Water quality. Determi-nation of ammonium nitrogen. Method by flow analysis (CFA and FIA) and spectrometric detection.
Singurindy, O., Richards, B.., Molodovskaya, M. &, Steen-huis. T.S., 2006. Nitrous Oxide and Ammonia Emissions from Urine-Treated Soils: Texture Effec. Vadose Zone Journal, 5: 1236–1245.
Souci, S.W., Fachman, W. & Kraut, H. 1994. Food Com-position and Nutrition Tables. Fifth revised and com-pleted edition. Scientific Publishers, Stuttgart, Medp-harm. 896 p.
Thomson B. 2004. Nitrates and Nitrites Dietary Exposure and Risk Assessment. Institute of Environmental Sci-ence & Research Limited New Zealand. Client report. FW 0392. Updated on June 2004. Available on the in-ternet: http://www.nzfsa.govt.nz/consumers/food-safe-ty-topics/chemicals-in-food/residues-in-food/consumer-research/nitrite-nitrate-reportdf.
United Nations, (UN). 2007. Home pages. Updated on 2007. Available on the internet: www.un.org/millenniumgoals/pdf/mdg2007.pdf

A G R I C U L T U R A L A N D F O O D S C I E N C E
Pradhan, S.K. Urine fertilization in pumpkin cultivation
68
SELOSTUS
Virtsan lannoitearvo kurpitsan viljelyssäSurendra K. Pradhan, Susanna Pitkänen ja Helvi Heinonen-Tanski
Itä-Suomen Yliopisto

A G R I C U L T U R A L A N D F O O D S C I E N C E
Vol. 19(2010): 69–80.
69
© Agricultural and Food Science Manuscript received: October 2008
Effect of substrate type on the field performance and chemical composition of highbush
blueberry cv. Patriot
Ireneusz Ochmian1, Józef Grajkowski1 and Katarzyna Skupień2*
1Department of Pomology, West Pomeranian University of Technology, Szczecin ul. Janosika 8, 71-432 Szczecin, Poland
2Department of Plant Raw Materials Processing and Storage, West Pomeranian University of Technology, Szczecin, ul. Słowackiego 17, 71-434 Szczecin, Poland,
*e-mail: [email protected]
The aim of a 3-year study was to compare the effect of substrate type (peat, sawdust and cocoa husk) on the yield, fruit quality, general and phenolic composition, and antioxidant activity of highbush blueberry (Vaccinium corymbosum L.) cultivar Patriot. The largest berries and the highest yield were obtained from bushes grown in sawdust (3.661 kg ha-1). Berries from bushes grown in cocoa husk had the highest content of N (14.25 g kg-1), P (1.17 g kg-1), K (6.51 g kg-1), and Zn (8.78 mg kg-1), as well as P (1.26 g kg-1) and K (6.99 g kg-1) in the leaves. Both the leaves and fruits of plants grown in sawdust had higher Cu concentra-tions (3.89 and 3.01 mg kg-1). Berries from sawdust-grown bushes had the highest soluble solids (13.1%) and total sugar (10.80 g 100 g-1) content. The fruits obtained from peat-grown bushes exhibited enhanced antioxidant capacity (38.6 µmol Trolox g-1). However, the highest levels of phenolics were noted in berries produced in the cocoa husk (208.29 mg 100 g-1) and peat-bed system (174.07 mg 100 g-1). Regardless of the type of substrate used, the following phenols were identified (in descending order): anthocyanins>chlorogenic acid>flavonols. Delphinidin-glycosides were the most abundant pigments, and cyanidin, peonidin, petunidin, and malvidin-glycosides were also detected. Total flavonol content (quercetin derivatives and kaempferol 3-rutinoside) was not significantly affected by the type of substrate.
Key- words: Vaccinium corymbosum, yield, firmness, macro- and microelements, phenolics

A G R I C U L T U R A L A N D F O O D S C I E N C E
Ochmian, I. et al. Effect of substrates on highbush blueberry ‘Patriot’
70
A G R I C U L T U R A L A N D F O O D S C I E N C E
Vol. 19(2010): 69–80.
71
Introduction
Highbush blueberries (Vaccinium corymbosum L.), among other members of the Ericaceae fam-ily, are considered to be a rich source of phenolic compounds and are known for their antioxidant properties (Kalt et al., 1999, Zheng and Wang, 2003, Castrejón et al. 2008). Due to their chemical composition, blueberries are highlighted as one of the healthiest foodstuffs (Kader et al., 1996, Main-land et al. 2002). Because of its value, the species has been cultivated for years in North America. The first breeding project was launched in 1908 in Florida (Lyrene 1997), and soon afterwards high-bush blueberries were imported from the USA to Europe (Strik 2005).
In Poland, the first experiments involving highbush blueberry cultivation were undertaken in 1946, while the development of large-scale pro-duction methods began in 1976. According to the results of field trials, Patriot was one of the culti-vars recommended for growing in Poland (Smo-larz 2006). A considerable increase in blueberry production has been recently observed in Poland. In 2006 Poland took 1st place in Europe with re-gard to the highbush blueberry growing area, and blueberry production reached 8,000 t, which gave us the second place after Germany (10,000 t) (In-ternetowa giełda rolna fresh-market 2009).
The highbush blueberry requires specific grow-ing conditions including the right site, high in or-ganic matter, appropriate water and air drainage, low pH, and adequate moisture (Kozinski 2006). On the one hand, this species allows the use of land which as a result of its high acidity is not suit-able for other crops (Ciordia et al. 2006). On the other hand, such soils are less and less available, which hinders the establishment of new planta-tions. These factors have necessitated the search for and the development of modified soil systems.
An improvement in soil conditions can be achieved by using organic mulch materials, like peat with low pH, sawdust, or coniferous bark. The application of mulches contributes to the loosen-ing of the higher strata of soil thus improving root penetration (Kozinski 2006). In the USA, cotton
by-products, pecan hulls (Krewer et al. 2002), leaf-mould compost, pit-coal ash, sludge from sewage treatment plants (Black et al. 2002), and conifer needle litter (Entrop 2000) are used for mulching purposes. From the practical and economic point of view, the components used for substrates and mulching should be relatively cheap, easily acces-sible, and should meet the habitat requirements of a given species. Therefore, the use of agricultural and forest by-products for this purpose seems to be fully justified.
The objective of the present study was to evalu-ate the influence of three types of substrate (cocoa husk, sawdust and peat) on the yield, fruit quality (fruit size and firmness), bush growth rate, fruit chemical composition (the content of soluble sol-ids, total sugar, L-ascorbic acid, NO3
- , NO2-, phe-
nolics, macro- and microelements, titratable acid-ity, juice efficiency, antioxidant activity), macro- and microelement concentrations in the leaves of highbush blueberry cv. Patriot.
Materials and methods
The experiment was carried out in the spring of 2001 at the Experimental Station Rajkowo near Szczecin in heavy soil of neutral reaction (pH 7.1). The purpose of field trials was to evaluate highbush blueberry cultivation in three different substrates placed in the trenches, 35 cm deep and 100 cm wide (0.35 m3 medium per m of row length). Acidic muck soil (peat), conifer sawdust from a local sawmill, and cocoa husk – a by-product obtained from the Chocolate Confectionery Plant ‘Gryf’ in Szczecin were used as substrates. In vitro potted plants of highbush blueberry cv. Patriot were spaced 1.5 m apart in a row and 2.5 m between the rows. The experiment was conducted in 2005–2007. The physical properties of the substrates tested in the experiment are shown in Table 1. Soil samples were taken from each replicate of substrate and from the soil, with a sample stick, in mid-August. Among the substrates, peat had the highest and sawdust had the lowest field water capacity (44.8% and 31.3%

A G R I C U L T U R A L A N D F O O D S C I E N C E
Ochmian, I. et al. Effect of substrates on highbush blueberry ‘Patriot’
70
A G R I C U L T U R A L A N D F O O D S C I E N C E
Vol. 19(2010): 69–80.
71
respectively), while cocoa husk had the highest full water capacity (85.3%). These differences neces-sitated the use of varied watering rates.
Fertilization was limited to nitrogen supply only, because chemical analyses of both the soil and substrates showed a high and/or a medium content of other nutrients. Each type of media was fertilized with ammonium nitrate on three occa-
sions at a total dose of 30 kg N ha-1. Supplemen-tal irrigation with acidified water (with H2SO4 up to pH of 2.5–3.5 measured in H2O) was applied through a T-Tape drip line. The rate of water sup-ply was adjusted to soil moisture content based on the results of tensiometric monitoring expressed in pF units (pF – soil suction being the logarithm of water height in centimeters), carried out twice a week. Measuring tubes (30 cm) were installed 15 cm below the soil surface, and pF 2.2 was adopted as a threshold value for irrigation. Hav-ing reached the threshold, the soil was irrigated to approximately pF 1.0. Due to the wide range of substrate reaction, water used for irrigation was acidified to a different degree. Water used for peat irrigation had higher pH (3.72) because peat reac-tion was suitable for blueberry cultivation, while cocoa husk and sawdust beds were irrigated with water with pH of 2.36 to lower the reaction of these media (Table 2). Among the substrates tested, peat maintained a constant pH level of 3.3–3.5 during the field trials, while cocoa husk had the highest reaction (pH of 4.6–6.4) (data not shown). pH and EC were measured with a multi-function computer device CX-741 Elmetron (Zabrze, Poland).
The content of available Ca, Na, Fe, Mn, Zn and Cu in the soil and in the substrates was de-termined by the AAS method (Atomic Absorption Spectrometry) prior to sample extraction with 0.1
Table 1. Water capacity, pH and salinity of the sub-strates used for blueberry cultivation
Peat Cocoa husk SawdustField water capacitya (% vv-1) 44.8 36.9 31.3
Full water capacitya (% vv-1) 80.6 85.3 82.6
pHb 3.40 5.00 4.70
Soil salinity (g NaCl kg-1)c 0.87 0.35 0.56
a Water capacity of soil was measured with the gravimetric method in spring 2005.bThe reaction of substrates was measured with the conductomet-ric method in KCl at the end of highbush blueberry vegetative season. pH values are the mean for 2005-2007.cSoil salinity was measured with the conductometric method and the values are the mean for 2005-2007.
Table 2. Physicochemical properties of water used in the experiment (on average for 2005–2007).
Raw water* Acidified water for sawdust and cocoa husk* Acidified water to irrigate peat*
Fe+3 (mg·l-1) Ca+2 (mg·l-1) EC (mS·cm-1) pH EC (mS·cm-1) pH EC
(mS·cm-1) pH
0.17 94.0 0.80 7.01 2.46 2.36 2.01 3.72* The values are the mean of 2005-2007. The measurements were carried out three times in each year of experiment. Fe3+and Ca2+ were determined by the AAS method (Atomic Absorption Spectrometry), and EC (Electrical Conductance) and pH were measured with a conductometric method.
Table 3. The content of available macro- and microelements in the grey brown podsolic soil used in the experiment (an average for 2005–2007).
P K Ca Mg Na Fe Mn Zn Cu
(mg·100g-1) (mg·kg-1)
12.41 35.6 70.6 5.67 1.25 102.8 66.5 17.9 2.7

A G R I C U L T U R A L A N D F O O D S C I E N C E
Ochmian, I. et al. Effect of substrates on highbush blueberry ‘Patriot’
72
A G R I C U L T U R A L A N D F O O D S C I E N C E
Vol. 19(2010): 69–80.
73
M HCl. Soil samples for phosphorus and potassium analyses were extracted according to the Egner-Riehm method, and the concentrations of these elements were determined by a colorimetric and flame atomic emission, respectively. Soil samples for magnesium content estimation were extracted by the Schachtschabel method, and Mg levels were measured by the AAS
For macro- and microelement analyses in plant material, one hundred leaves of plants grown in the tested substrates were sampled each year at the beginning of August. The leaves were dried, first at room temperature in a shaded place and then at ~45 oC, and were pulverized with a WŻ-1 lab mill. Aliquots of berry samples of each harvest in the season were packed in polyethylene bags (250 g) and kept frozen (–25 oC). Following fruit collec-tion, all fruit samples for each substrate were com-bined, thawed at room temperature, and dried (ini-tial temperature 60–70 oC, final 105 oC). The dried fruits were pulverized (WŻ-1). The total content of macro- and microelements in leaves and fruits was determined according to the Polish Standards. After mineralization, total nitrogen content was de-termined by the Kjeldahl method. The concentra-tions of K and Ca were measured by flame atomic absorption spectroscopy, whereas Mg, Cu, Zn, Fe, and Mn content was determined by atomic emis-sion spectrometry using SAA Solaar. Phosphorus content was determined by the Barton method at a wavelength of 470 nm, and sulphur content - by the turbidimetric method at a wavelength of 490 nm, with a Marcel s 330 PRO spectrophotometer.
For plants grown in each substrate, bush growth rate was estimated and expressed as the total annual shoot length (cm) and the average length of one-year shoots. Fruit yield was assessed and expressed as kg per ha. Additionally, the mean weight of 100 fruits (g) was determined and fruit size measure-ments (mm) at the vertical and horizontal axis were taken. Fruit firmness was measured along the ver-tical axis (fruit height) and along the horizontal axis (fruit diameter) with a FirmTech 2 apparatus (BioWorks, USA) immediately after harvest and every 7 days during 21-day storage at 2 oC and 96% relative air humidity. The firmness of 50 ber-ries selected randomly from every replicate was
expressed as a gram-force causing fruit surface to bend 1 mm.
Titratable acidity, the content of total sugars, soluble solids, L-ascorbic acid, nitrates and ni-trites, and antioxidant capacity were determined in fresh fruit soon after harvest. Titratable acidity was determined by titration of the water extract of blueberry homogenate with 0.1 N NaOH to the end point of pH 8.1, according to PN-90/A-75101/04. Total sugar content was determined by the Luff-Schoorl method. Soluble solids content was deter-mined in berry juice with the use of an Abbé re-fractometer (PN-90/A-75101/02). L-ascorbic acid content was determined by the iodometric method (Samotus et al. 1982). In order to measure juice extraction efficiency, fruits were homogenized with a blender and heated up to 50 oC. After cooling, 3 mL of pectinase (Rapidase Super, BE, NC, USA) per kg of pulp was added. The pulp was left to stand at room temperature for 1 hour, and then it was pressed for 10 min at a final pressure of 300 kPa with a laboratory hydraulic press (Oszmiański and Wojdylo 2005). Nitrate and nitrite content was measured with a RQflex 10 reflectometer (Merck). Fruit antioxidant capacity was evaluated by met-myoglobin oxidation inhibition by antioxidants present in fruit extract and compared to that of Trolox (Miller and Rice-Evans 1996). Total anti-oxidant capacity was expressed as μmol Trolox per g fruit tissue. Phenolics composition of blueber-ries was determined in fruit samples that were kept frozen (–32 oC) in polyethylene bags (250–300 g) until analyzed. The 2 g aliquots of fruit (after thaw-ing) were extracted three times with approx. 8 mL of 80% MeOH acidified with a glacial acetic acid (1 mL of 100% acetic acid per 1 L 80% MeOH) in an ultrasonic bath for 15 min. The samples were filtered and transferred to the flasks and made up to the final volume 25 mL. Further, the extracts were centrifuged twice at 12,000x g and 20 μL of supernatants were injected into the HPLC system. The HPLC apparatus consisted of a Merck-Hitachi L-7455 diode array detector (DAD) and quater-nary pump L-7100 equipped with D-7000 HSM Multisolvent Delivery System (Merck-Hitachi, Tokyo, Japan). The separation was performed on a Cadenza CD C18 (75 × 4.6 mm, 5 mm) column

A G R I C U L T U R A L A N D F O O D S C I E N C E
Ochmian, I. et al. Effect of substrates on highbush blueberry ‘Patriot’
72
A G R I C U L T U R A L A N D F O O D S C I E N C E
Vol. 19(2010): 69–80.
73
(Imtakt, Japan). Column oven temperature was set at 30 oC. The mobile phase was composed of sol-vent A (4.5% formic acid), pH 2.2) and solvent B (acetonitrile). The program began with a linear gradient from 0% B to 21% B (0–30 min), followed by washing and reconditioning the column. The flow rate was 1 mL min-1 and the runs were moni-tored at the following wavelengths: chlorogenic acid at 320 nm, flavonols glycosides (quercetin and kaempferol derivatives) at 360 nm, and anthocy-anin glycosides at 520 nm. The Photo Diode Array spectra were measured over the wavelength range 200–600 nm in steps of 2 nm. Retention times and spectra were compared to those of pure standards within 200–600 nm. Standards of anthocyanidin glycosides and chlorogenic acid were obtained from Polyphenols Laboratories (Norway), while, kaempferol 3- rutinoside and quercetin glycosides from Extrasynthese (France). Except for phenolics, the all measurements of bushes, leaves and fruits were performed for each year of the experiment. Phenolic patterns for berries were determined in 2006 and 2007.
The results obtained were subjected to statisti-cal analysis using Statistica 7.1 (Statsoft, Poland). The values were evaluated by the Duncan test and for phenolics by the Student test. The differences between the means at p<0.05 were considered sig-nificant.
Results and discussion
Data relating to plant growth, yield, fruit size and weight of blueberries cv. Patriot are presented in Table 4. Three-year observations of highbush blueberry de-velopment showed that peat was the most stimulating medium, superior to sawdust and cocoa husk with regard to total annual shoot length and average one-year shoot length. Kozinski (2006) observed a higher growth rate of one-year-old shoots when blueberry was grown in soil mixed and mulched with sawdust compared to soil mixed and mulched with bark as well as in pure mineral soil (as control treatment).
In this experiment the vegetative growth of plants was not parallel to their productivity. Among the substrates tested, the highest yield was obtained from bushes grown in sawdust (3.661 kg ha-1 per season on average), whereas plants grown in cocoa husk were characterized by the lowest productivity (1.315 kg ha-1 per season on average). The values are so low due to frost damage in 2006. However, despite of unfavorable weather conditions, this spe-cies allows multi-annual utilization of plantings, though its productivity is conditioned by the age of bushes and agronomic practices involved, too. In a study conducted by Ciordia et al. (2006), the yield of southern highbush cultivars grown in plas-
Table 4. Growth vigour, yield, weight of 100 fruits, and fruit size of ‘Patriot’ cv. highbush blueberry depending on sub-strate type (an average for 2005–2007)
Type of substrate Peat Sawdust Cocoa husk
Total annual shoot length (cm) 401 b 311 a 315 a
Mean length of one-year shoots (cm) 46.0 b 37.7 ab 33.0 a
Mean yield (kg·ha-1) 2,639 b 3,661 c 1,315 a
Mean weight of 100 fruits (g) 140 b 126 a 120 a
Fruit size (mm)ha 14.50 b 15.15 b 12.15 a
øb 17.85 b 17.85 b 16.35 a
Fruit size reduction between begin-ning and end of harvest (%)
h -34.3 -37.6 -31.6
ø -46.6 -62.1 -48.9
ha – fruit size measured along fruit height (at vertical axis)øb - fruit size measured along fruit diameter (at horizontal axis)
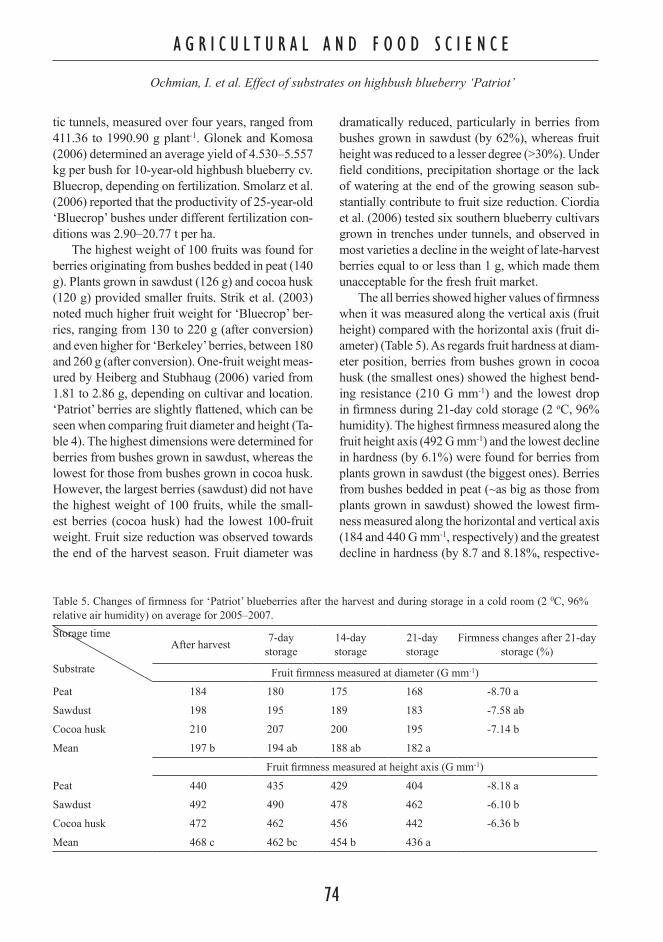
A G R I C U L T U R A L A N D F O O D S C I E N C E
Ochmian, I. et al. Effect of substrates on highbush blueberry ‘Patriot’
74
A G R I C U L T U R A L A N D F O O D S C I E N C E
Vol. 19(2010): 69–80.
75
tic tunnels, measured over four years, ranged from 411.36 to 1990.90 g plant-1. Glonek and Komosa (2006) determined an average yield of 4.530–5.557 kg per bush for 10-year-old highbush blueberry cv. Bluecrop, depending on fertilization. Smolarz et al. (2006) reported that the productivity of 25-year-old ‘Bluecrop’ bushes under different fertilization con-ditions was 2.90–20.77 t per ha.
The highest weight of 100 fruits was found for berries originating from bushes bedded in peat (140 g). Plants grown in sawdust (126 g) and cocoa husk (120 g) provided smaller fruits. Strik et al. (2003) noted much higher fruit weight for ‘Bluecrop’ ber-ries, ranging from 130 to 220 g (after conversion) and even higher for ‘Berkeley’ berries, between 180 and 260 g (after conversion). One-fruit weight meas-ured by Heiberg and Stubhaug (2006) varied from 1.81 to 2.86 g, depending on cultivar and location. ‘Patriot’ berries are slightly flattened, which can be seen when comparing fruit diameter and height (Ta-ble 4). The highest dimensions were determined for berries from bushes grown in sawdust, whereas the lowest for those from bushes grown in cocoa husk. However, the largest berries (sawdust) did not have the highest weight of 100 fruits, while the small-est berries (cocoa husk) had the lowest 100-fruit weight. Fruit size reduction was observed towards the end of the harvest season. Fruit diameter was
dramatically reduced, particularly in berries from bushes grown in sawdust (by 62%), whereas fruit height was reduced to a lesser degree (>30%). Under field conditions, precipitation shortage or the lack of watering at the end of the growing season sub-stantially contribute to fruit size reduction. Ciordia et al. (2006) tested six southern blueberry cultivars grown in trenches under tunnels, and observed in most varieties a decline in the weight of late-harvest berries equal to or less than 1 g, which made them unacceptable for the fresh fruit market.
The all berries showed higher values of firmness when it was measured along the vertical axis (fruit height) compared with the horizontal axis (fruit di-ameter) (Table 5). As regards fruit hardness at diam-eter position, berries from bushes grown in cocoa husk (the smallest ones) showed the highest bend-ing resistance (210 G mm-1) and the lowest drop in firmness during 21-day cold storage (2 oC, 96% humidity). The highest firmness measured along the fruit height axis (492 G mm-1) and the lowest decline in hardness (by 6.1%) were found for berries from plants grown in sawdust (the biggest ones). Berries from bushes bedded in peat (~as big as those from plants grown in sawdust) showed the lowest firm-ness measured along the horizontal and vertical axis (184 and 440 G mm-1, respectively) and the greatest decline in hardness (by 8.7 and 8.18%, respective-
Table 5. Changes of firmness for ‘Patriot’ blueberries after the harvest and during storage in a cold room (2 0C, 96% relative air humidity) on average for 2005–2007.Storage time
Substrate
After harvest 7-day storage
14-day storage
21-day storage
Firmness changes after 21-day storage (%)
Fruit firmness measured at diameter (G mm-1)
Peat 184 180 175 168 -8.70 a
Sawdust 198 195 189 183 -7.58 ab
Cocoa husk 210 207 200 195 -7.14 b
Mean 197 b 194 ab 188 ab 182 a
Fruit firmness measured at height axis (G mm-1)
Peat 440 435 429 404 -8.18 a
Sawdust 492 490 478 462 -6.10 b
Cocoa husk 472 462 456 442 -6.36 b
Mean 468 c 462 bc 454 b 436 a

A G R I C U L T U R A L A N D F O O D S C I E N C E
Ochmian, I. et al. Effect of substrates on highbush blueberry ‘Patriot’
74
A G R I C U L T U R A L A N D F O O D S C I E N C E
Vol. 19(2010): 69–80.
75
ly). Thus, in terms of handling, these berries would be most sensitive to up- and side-pressure.
The substrates tested in this experiment differed with respect to nutrient abundance (Table 6). In gen-eral, cocoa husk was abundant in P and Zn, sawdust was particularly rich in Mn and Cu but had a low Ca and Mg content, whereas peat had the lowest K content. Regardless of the substrate, blueberry leaves had higher amounts of total N, Ca, Mg, Fe and Mn, compared to fruits (Table 7). The highest N content was found in the leaves of plants grown in sawdust and in the fruits of plants grown in cocoa husk. According to Hanson (2006), the optimal N content of blueberry leaves picked in mid- summer amounts to 1.7–2.1%. After conversion the above data it can be seen that the N content of berry leaves
was sufficient. Fruit N content was approximately half of leaf N content, and the values obtained were lower compared to 1.7-2.8% determined by Skupień (2004) in four blueberry cultivars.
In this study, plants cultivated in cocoa husk had the highest concentration of P and K, both in the leaves and fruits. The leaf P status varying from 1.11 to 1.26 g kg-1 was lower than that reported by Glonek and Komosa (2006) for cv. Bluecrop (0.18-0.20%), while leaf K levels in cv. Patriot (5.15-6.99 g kg-1) were similar to those determined by these authors in cv. Bluecrop (0.56–0.58%). Fruit K levels measured in this study (5.18–6.51 g kg-1) were lower compared to the values obtained by Skupień (2004) (0.738–0.855%).
Table 6. The available macro- and microelements content in the tested substrates on average for 2005–2007.
P K Ca Mg Fe Mn Zn Cu
(mg·100g-1) (mg·100g-1)
Peat 13.04 b 29.65 a 170.1 b 28.62 b 202 a 32.03 a 12.65 a 1.81 a
Sawdust 7.54 a 52.49 b 83.4 a 21.94 a 231 ab 56.47 b 25.93 a 7.36 b
Cocoa husk 17.16 c 51.26 b 208.5 b 26.71 b 279 b 24.13 a 51.66 b 1.58 a
Table 7. Total macro- and microelements content in leaf and fruit of blueberry ‘Patriot’ on average for 2005–2007.
Macro- and microelementsa
Leaves Fruit
Peat Sawdust Cocoa husk Peat Sawdust Cocoa husk(g·kg-1)
Total N 21.81 a 23.06 b 21.45 a 12.27 a 12.94 a 14.25 b
P 1.13 a 1.11 a 1.26 b 0.79 a 0.90 a 1.17 b
K 5.74 a 5.15 a 6.99 b 5.18 a 5.35 a 6.51 b
Ca 3.38 b 3.05 b 1.54 a 0.12 b 0.10 ab 0.08 a
Mg 1.71 b 1.48 ab 1.14 a 0.27 a 0.58 b 0.26 a
S 1.73 a 1.60 a 1.48 a 1.38 b 1.05 a 1.32 b
(mg·kg-1)
Cu 2.72 ab 3.89 b 1.75 a 1.53 a 3.01 b 1.87 a
Zn 9.41 a 10.16 b 9.64 a 6.60 a 5.66 a 8.78 b
Fe 58.67 a 58.93 a 52.91 a 23.67 a 21.64 a 22.78 a
Mn 199.89 b 170.46 b 121.04 a 24.49 a 23.03 a 22.73 aa The values are calculated on dry weight basis
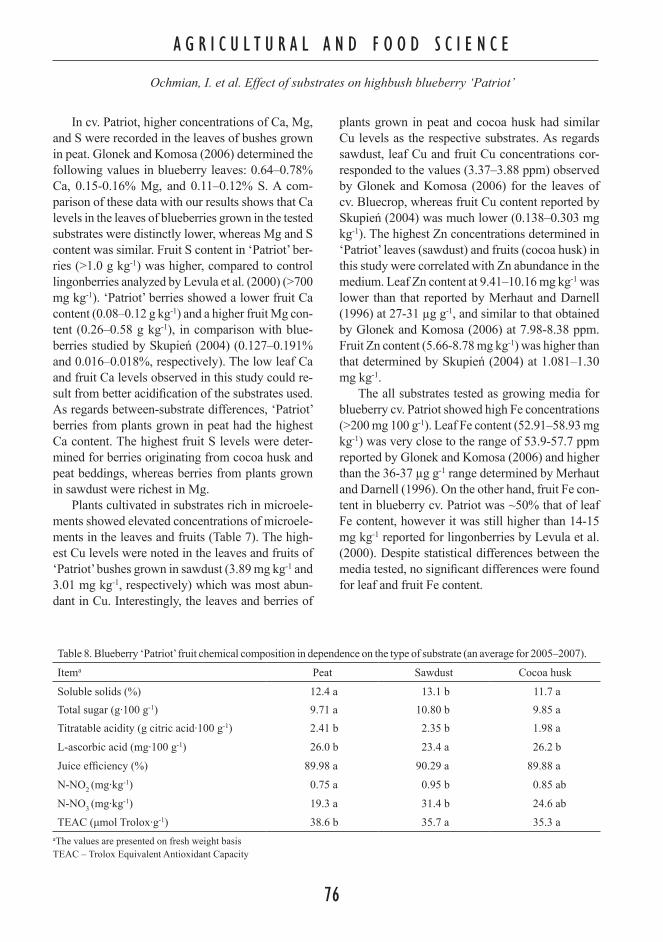
A G R I C U L T U R A L A N D F O O D S C I E N C E
Ochmian, I. et al. Effect of substrates on highbush blueberry ‘Patriot’
76
A G R I C U L T U R A L A N D F O O D S C I E N C E
Vol. 19(2010): 69–80.
77
In cv. Patriot, higher concentrations of Ca, Mg, and S were recorded in the leaves of bushes grown in peat. Glonek and Komosa (2006) determined the following values in blueberry leaves: 0.64–0.78% Ca, 0.15-0.16% Mg, and 0.11–0.12% S. A com-parison of these data with our results shows that Ca levels in the leaves of blueberries grown in the tested substrates were distinctly lower, whereas Mg and S content was similar. Fruit S content in ‘Patriot’ ber-ries (>1.0 g kg-1) was higher, compared to control lingonberries analyzed by Levula et al. (2000) (>700 mg kg-1). ‘Patriot’ berries showed a lower fruit Ca content (0.08–0.12 g kg-1) and a higher fruit Mg con-tent (0.26–0.58 g kg-1), in comparison with blue-berries studied by Skupień (2004) (0.127–0.191% and 0.016–0.018%, respectively). The low leaf Ca and fruit Ca levels observed in this study could re-sult from better acidification of the substrates used. As regards between-substrate differences, ‘Patriot’ berries from plants grown in peat had the highest Ca content. The highest fruit S levels were deter-mined for berries originating from cocoa husk and peat beddings, whereas berries from plants grown in sawdust were richest in Mg.
Plants cultivated in substrates rich in microele-ments showed elevated concentrations of microele-ments in the leaves and fruits (Table 7). The high-est Cu levels were noted in the leaves and fruits of ‘Patriot’ bushes grown in sawdust (3.89 mg kg-1 and 3.01 mg kg-1, respectively) which was most abun-dant in Cu. Interestingly, the leaves and berries of
plants grown in peat and cocoa husk had similar Cu levels as the respective substrates. As regards sawdust, leaf Cu and fruit Cu concentrations cor-responded to the values (3.37–3.88 ppm) observed by Glonek and Komosa (2006) for the leaves of cv. Bluecrop, whereas fruit Cu content reported by Skupień (2004) was much lower (0.138–0.303 mg kg-1). The highest Zn concentrations determined in ‘Patriot’ leaves (sawdust) and fruits (cocoa husk) in this study were correlated with Zn abundance in the medium. Leaf Zn content at 9.41–10.16 mg kg-1 was lower than that reported by Merhaut and Darnell (1996) at 27-31 µg g-1, and similar to that obtained by Glonek and Komosa (2006) at 7.98-8.38 ppm. Fruit Zn content (5.66-8.78 mg kg-1) was higher than that determined by Skupień (2004) at 1.081–1.30 mg kg-1.
The all substrates tested as growing media for blueberry cv. Patriot showed high Fe concentrations (>200 mg 100 g-1). Leaf Fe content (52.91–58.93 mg kg-1) was very close to the range of 53.9-57.7 ppm reported by Glonek and Komosa (2006) and higher than the 36-37 µg g-1 range determined by Merhaut and Darnell (1996). On the other hand, fruit Fe con-tent in blueberry cv. Patriot was ~50% that of leaf Fe content, however it was still higher than 14-15 mg kg-1 reported for lingonberries by Levula et al. (2000). Despite statistical differences between the media tested, no significant differences were found for leaf and fruit Fe content.
Table 8. Blueberry ‘Patriot’ fruit chemical composition in dependence on the type of substrate (an average for 2005–2007).
Itema Peat Sawdust Cocoa husk
Soluble solids (%) 12.4 a 13.1 b 11.7 a Total sugar (g·100 g-1) 9.71 a 10.80 b 9.85 aTitratable acidity (g citric acid·100 g-1) 2.41 b 2.35 b 1.98 a
L-ascorbic acid (mg·100 g-1) 26.0 b 23.4 a 26.2 b
Juice efficiency (%) 89.98 a 90.29 a 89.88 a
N-NO2 (mg·kg-1) 0.75 a 0.95 b 0.85 ab
N-NO3 (mg·kg-1) 19.3 a 31.4 b 24.6 ab
TEAC (μmol Trolox·g-1) 38.6 b 35.7 a 35.3 aaThe values are presented on fresh weight basisTEAC – Trolox Equivalent Antioxidant Capacity
A G R I C U L T U R A L A N D F O O D S C I E N C E
Ochmian, I. et al. Effect of substrates on highbush blueberry ‘Patriot’
76
A G R I C U L T U R A L A N D F O O D S C I E N C E
Vol. 19(2010): 69–80.
77
The highest Mn levels were recorded in the leaves of plants grown in peat and sawdust (Mn-richest substrates) however the type of substrate did not affect fruit Mn content. Leaf Mn concentrations determined for cv. Patriot (121.04–199.89 mg kg-
1) were higher than those found for cv. Bluecrop (107.6–128.0 ppm) (Glonek and Komosa 2006), and both ranges were higher than the value of 44–57 µg g-1 reported by Merhaut and Darnell (1996). On the other hand, ‘Patriot’ berries had a low Mn content, ranging from 21.64 mg kg-1 (sawdust) to 23.67 mg kg-1 (peat).
‘Patriot’ berries obtained from sawdust-grown bushes had the highest soluble solids (13.1%) and total sugar content (10.80 g 100 g-1) (Table 8). In the study conducted by Skupień (2004) the soluble solids content of blueberry cultivars mulched with sawdust was determined within a similar range of 11.6–13.8%. Prior et al. (1998) observed greater variation in soluble solids content (10.0–19.0%), affected by the cultivar, geographical location and harvest date. Total sugar content found in this inves-tigation (9.85–10.80 g 100 g-1) corresponds to the sum of glucose and fructose reported by Wang et al. (2008) for blueberries in a conventional culture system (10.90 g 100 g-1). Ostrowska and Ściążko (1996) determined a slightly lower total sugar con-tent of blueberries, ranging from 8.36 g 100 g-1(cv. Bluecrop) to 9.57 g 100 g-1(cv. Jersey).
Total acid content observed in this study was 1.98–2.41 g citric acid 100 g-1 (Table 8). Higher acidity was observed in the berries of bushes bed-ded in peat and sawdust. Rosenfeld et al. (1999) determined acid concentrations at 0.82% in ‘Blue-crop’ berries stored at 4 °C. L-ascorbic acid content determined for ‘Patriot’ berries varied from 23.4 mg 100 g-1 (sawdust) to 26.2 mg 100 g-1 (cocoa husk), and was not affected by the type of substrate (Table 8). Łata et al. (2005) reported vitamin C content of 16.6–30.6 mg 100 g-1 in blueberries, depending on the cultivar and seasonal variations.
Juice efficiency measured for ‘Patriot’ berries was high (89.9–90.9%) and not medium-dependent (Table 8). Rossi et al. (2003) obtained a lower juice yield for blueberries, amounting to 79–81%, which could result from a different extraction procedure.
The nitrite content of blueberries obtained from plants grown in all media tested in the study was below 1 mg kg-1 (Table 8), which is consistent with Polish regulations concerning, among others, apple juice, fruit-vegetable juices and banana-containing products for babies and young children under three. Blueberries are characterized by low nitrate accu-mulation. The values obtained in this study (Table 8) confirm that blueberries are nitrate-safe product and the amounts ranging from 19.9 mg kg-1 (peat) to 31.4 mg kg-1 (sawdust) are fairly below the lev-els permitted for bananas and vegetables meant for special usage (baby food, etc.) up to 200 mg kg-1.
The antioxidant capacity of blueberries is well substantiated in the literature (Prior et al. 1998, Ehlenfeldt and Prior 2001). In this experiment, blueberries showed TEAC values in the range of 35.3–38.6 μmol Trolox·g-1 (Table 8). Connor et al. (2002) found lower antioxidant activity for ‘Patriot’ berries, varying from 20 to 29 μmol Trolox·g-1 de-pending on the year of the experiment and location. Ścibisz et al. (2003) observed that early harvested berries showed 29.9 μmol Trolox·g-1, whereas late-harvested berries – 61.8 μmol Trolox·g-1. A likely reason is that smaller fruits of late harvest have a higher surface:volume ratio. Since in blueberries an-thocyanins are found in the skin only, the enhanced amount of these compounds (apart from other phe-nolics) in smaller berries contributes substantially to their higher antioxidant activity.
The type of substrate exerted a significant in-fluence on total phenolic content (Table 9). Ber-ries from bushes grown in cocoa husk showed the highest amounts of phenolics (208.29 mg 100 g-1), while the lowest value was observed for sawdust-originating berries (122.43 mg 100 g-1). Connor et al. (2002) measured a total phenol content of 360–569 mg chlorogenic acid equivalents 100 g-1 in ‘Patriot’ berries. Prior et al. (1998) estimated phenolic content at 181.1-390.5 mg 100g-1 in blue-berry cultivars obtained from different sources. In this study, the amount of total phenols was not in accordance with TEAC values. Berries from plants grown in sawdust and cocoa husk beddings had almost equal antioxidant capacity (35.7 and 35.3 μmol Trolox g-1, respectively), whereas the phenol content of berries originating from cocoa husk was
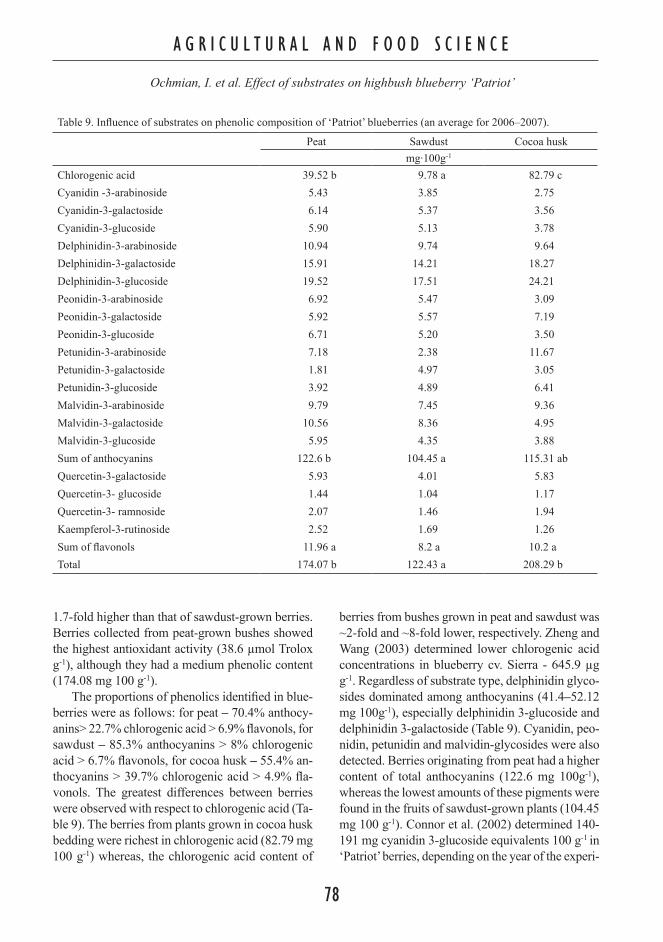
A G R I C U L T U R A L A N D F O O D S C I E N C E
Ochmian, I. et al. Effect of substrates on highbush blueberry ‘Patriot’
78
A G R I C U L T U R A L A N D F O O D S C I E N C E
Vol. 19(2010): 69–80.
79
1.7-fold higher than that of sawdust-grown berries. Berries collected from peat-grown bushes showed the highest antioxidant activity (38.6 µmol Trolox g-1), although they had a medium phenolic content (174.08 mg 100 g-1).
The proportions of phenolics identified in blue-berries were as follows: for peat – 70.4% anthocy-anins> 22.7% chlorogenic acid > 6.9% flavonols, for sawdust – 85.3% anthocyanins > 8% chlorogenic acid > 6.7% flavonols, for cocoa husk – 55.4% an-thocyanins > 39.7% chlorogenic acid > 4.9% fla-vonols. The greatest differences between berries were observed with respect to chlorogenic acid (Ta-ble 9). The berries from plants grown in cocoa husk bedding were richest in chlorogenic acid (82.79 mg 100 g-1) whereas, the chlorogenic acid content of
berries from bushes grown in peat and sawdust was ~2-fold and ~8-fold lower, respectively. Zheng and Wang (2003) determined lower chlorogenic acid concentrations in blueberry cv. Sierra - 645.9 µg g-1. Regardless of substrate type, delphinidin glyco-sides dominated among anthocyanins (41.4–52.12 mg 100g-1), especially delphinidin 3-glucoside and delphinidin 3-galactoside (Table 9). Cyanidin, peo-nidin, petunidin and malvidin-glycosides were also detected. Berries originating from peat had a higher content of total anthocyanins (122.6 mg 100g-1), whereas the lowest amounts of these pigments were found in the fruits of sawdust-grown plants (104.45 mg 100 g-1). Connor et al. (2002) determined 140-191 mg cyanidin 3-glucoside equivalents 100 g-1 in ‘Patriot’ berries, depending on the year of the experi-
Table 9. Influence of substrates on phenolic composition of ‘Patriot’ blueberries (an average for 2006–2007).
Peat Sawdust Cocoa huskmg·100g-1
Chlorogenic acid 39.52 b 9.78 a 82.79 cCyanidin -3-arabinoside 5.43 3.85 2.75Cyanidin-3-galactoside 6.14 5.37 3.56Cyanidin-3-glucoside 5.90 5.13 3.78Delphinidin-3-arabinoside 10.94 9.74 9.64Delphinidin-3-galactoside 15.91 14.21 18.27Delphinidin-3-glucoside 19.52 17.51 24.21Peonidin-3-arabinoside 6.92 5.47 3.09Peonidin-3-galactoside 5.92 5.57 7.19Peonidin-3-glucoside 6.71 5.20 3.50Petunidin-3-arabinoside 7.18 2.38 11.67Petunidin-3-galactoside 1.81 4.97 3.05Petunidin-3-glucoside 3.92 4.89 6.41Malvidin-3-arabinoside 9.79 7.45 9.36Malvidin-3-galactoside 10.56 8.36 4.95Malvidin-3-glucoside 5.95 4.35 3.88Sum of anthocyanins 122.6 b 104.45 a 115.31 abQuercetin-3-galactoside 5.93 4.01 5.83Quercetin-3- glucoside 1.44 1.04 1.17Quercetin-3- ramnoside 2.07 1.46 1.94Kaempferol-3-rutinoside 2.52 1.69 1.26Sum of flavonols 11.96 a 8.2 a 10.2 aTotal 174.07 b 122.43 a 208.29 b

A G R I C U L T U R A L A N D F O O D S C I E N C E
Ochmian, I. et al. Effect of substrates on highbush blueberry ‘Patriot’
78
A G R I C U L T U R A L A N D F O O D S C I E N C E
Vol. 19(2010): 69–80.
79
ment and the growing area. In an experiment per-formed by Prior et al. (1998), the total anthocyanin content of blueberries varied over a wide range of 93.1 to 235.4 mg 100 g-1. Quercetin derivatives and kaempferol 3-rutinoside were also identified, and quercetin 3-galactoside was found to be a predomi-nant flavonol. The total of quercetin derivatives var-ied from 6.51 mg 100 g-1 (sawdust) to 9.44 mg 100 g-1 (peat), and these values were higher compared with the data obtained for blueberries of different varieties and sites by Häkkinen and Törrönen (2000) – 2.2-4.7 mg 100 g-1, but lower than those reported by Zheng and Wang (2003) for cv. Sierra (248.7 µg g-1). However, in the present study the type of medium did not significantly affect total flavonol content (8.2–11.96 mg 100 g-1).
Conclusions
A three-year study of substrates tested as growing media for highbush blueberry cv. Patriot showed that the most intensive bush growth was observed when plants were grown in peat, while the highest yield (on a 3-year average) was attained in plants grown in sawdust. The berries of bushes bedded in sawdust were largest, but they showed the most disadvantageous fruit size reduction as the picking period progressed. On the other hand, these berries demonstrated the highest firmness measured along the vertical axis (fruit height), whereas the berries of bushes grown in cocoa husk had the highest firmness measured along the horizontal axis (fruit diameter).
Irrespective of the substrate used, the leaves of ‘Patriot’ plants contained larger amounts of N, Ca, Mg, Fe and Mn than the fruits. As regards particular media, the concentrations of macro- and microele-ments in leaves and fruits varied, except for leaf Fe, fruit Fe and fruit Mn content which showed no cor-relation with the substrate.
Berries originating from sawdust contained the highest amounts of soluble solids and total sugars, and the lowest L-ascorbic acid levels. For all ber-ries, juice efficiency was high and not substrate-de-pendent. The accumulation of nitrates and nitrites in
blueberry cv. Patriot was low and did not exceed the permissible levels for food items designed for babies and young children.
Berries originating from peat had the highest antioxidant capacity and the highest total anthocy-anin content. Delphinidin-glycosides were pre-dominant anthocyanins in all berries. The following phenolics were identified in ‘Patriot’ berries (in de-scending order): anthocyanins > chlorogenic acid > flavonols. The proportions of individual compounds were substrate-dependent. Berries originating from the cocoa husk bedding showed the highest content of chlorogenic acid and total polyphenols. On the other hand, the amount of total flavonols was not affected by the type of substrate.
From the quantitative point of view, the best pro-ductivity (yield) and consumer attractiveness (fruit-size) were observed for ‘Patriot’ blueberries grown in sawdust. These berries were richest in N, P, K, Zn, total sugars and soluble solids. However, their most undesirable characteristic was a considerable fruit size reduction at the end of the harvest season, and lower concentrations of anthocyanins and total phenols, compared with berries grown in peat and cocoa husk respectively.Acknowledgments. The study was supported by the grant of the Scientific Research Committee No.0395/P06/2004/26.
ReferencesBlack B.L., Zimmerman R.H., and Hepp R.F. 2002: Industri-
al and municipal by products as substrates for highbush blueberry production. Acta Horticulturae 574: 267–272
Castrejón A.D., Eichholz I., Rohn S., Kroh L.W., and Huyskens-Keil S. 2008. Phenolic profile and antioxidant activity of highbush blueberry (Vaccinium corymbosum L.) during fruit maturation and ripening. Food Chemis-try 109: 564–572.
Ciordia M., Garcia J.C., and Diaz M.B. 2006. Off-season production of southern highbush blueberries in the North of Spain. Acta Horticulturae 715: 317–322.
Connor A.M., Luby J.J., Tong C.B.S., Finn C.E., and Han-cock J.F. 2002. Journal of the American Society for Hor-ticultural Science 127: 89–97.
Glonek J. & Komosa A. 2006. The effect of fertigation on the nutrient status and yield of highbush blueberry cv. ‘Bluecrop’. Acta Horticulturae 715: 371–374.
Ehlenfeldt M.K. & Prior R.L. 2001. Oxygen radical absor-bance capacity (ORAC) and phenolic and anthocyanin

A G R I C U L T U R A L A N D F O O D S C I E N C E
Ochmian, I. et al. Effect of substrates on highbush blueberry ‘Patriot’
80
concentration in fruit and leaf tissues of highbush blue-berry. Journal of Agricultural and Food Chemistry 49: 2222–2227.
Entrop A.-P. 2000. Der Heidelbeeranbau in den Vereinig-ten Staaten von Amerika - Teil II. Kulturheidelbeeran-bau in Oregon und Florida; Mitteilungendes Obstbau-versuchsringes des Alten Landes (Mitt. OVR) 55: 44–53.
Häkkinen S.H. & Törrönen A.R. 2000. Content of flavonols and selected phenolic acids in strawberries aand Vac-cinium species : influence of cultivar, cultivation site and technique. Food Research International 33: 517–524.
Hanson E.J. 2006. Nitrogen fertilization of highbush blue-berry. Acta Horticulturae 715: 347–351.
Heiberg N. & Stubhaug E. 2006. First results from cultivar trials with highbush blueberry in Norway. Acta Horticul-turae 715: 307–311.
Internetowa giełda rolna fresh-market. 2009. Available on the internet: http://www.fresh-market.pl/katalog_produktow/owoce/borowka_wysoka Online. Cited 19 September 2008.
Kader R, Rovel B., Girardin M., and Metche M. 1996. Frac-tionation and identification of the phenolic compounds of Highbush blueberries (Vaccinium corymbosum). Food Chemistry 55: 35–40.
Kalt W., Forney C.F., Martin A., and Prior R.L. 1999. Anti-oxidant capacity, vitamin C, phenolics, and anthocyanins after fresh storage of small fruits. Journal of Agricultural and Food Chemistry 47: 4638–4644.
Kozinski B. 2006. Influence of mulching and nitrogen ferti-lization rate on growth and yield of highbush blueberry. Acta Horticulturae 715: 231–235.
Krewer G., Ruter J., NeSmith D. S., Clark J., Otts T., Scar-borough S., Mullinix B. and Hepp R. F., 2002. Perform-ance of low cost organic materials as blueberry sub-strates and soil amendments. Acta Horticulturae 574: 273–279.
Levula T., Saarsalmi A., and Rantavaara A. 2000. Effects of ash fertilization and prescribed burning on macronu-trient, heavy metal, sulphur and 137Cs concentrations in lingonberries (Vaccinium vitis-idea). Forest Ecology and Management 126: 269–279.
Lyrene PM. 1997. Value of various taxa in breeding tetra-ploid blueberries in Florida. Euphytica 94: 15–22.
Łata B., Trąmpczyńska A., and Mike A. 2005. Effect of cul-tivar and harvest date on thiols, ascorbate and pheno-lic compounds content in blueberries. Acta Scientiarum Polonorum Hortorum Cultus 4: 163–171.
Mainland C. M., Tucker J. W., and Hepp R. F. 2002. Blue-berry health information - some new mostly review. Acta Horticulturae 574: 39–43.
Merhaut D.J. & Darnell R.L. 1996. Vegetative growth and nitrogen/karbon partitioning In blueberry as influence by nitrogen fertilization. Journal of American Horticultural Society 121: 875–879.
Miller N. J. & Rice-Evans C. A. 1996. Spectrophotomet-ric determination of antioxidant activity. Redox Report 2: 161–171.
Ostrowska K. & Ściążko D. 1996. Zawartość składników bioorganicznych i mineralnyc owocach trzech odmian borówki wysokiej. (The contents of bioorganic and min-eral components in fruit of three blueberry cultivars). In: II Ogólnopolskie Sympozjum, AR w Poznaniu, p. 225–229.
Oszmiański, J. & Wojdylo A. 2005: Aronia melanocarpa phenolics and their antioxidant activity. European Food Research and Technology 221: 809–813.
Prior R.L., Cao G., Martin A., Sofic E., McEwen J., O’Brien C., Lischner N., Ehlenfeldt M., Kalt W., Krewer G., and Mainland C.M. 1998. Antioxidant capacity as influenced by total phenolic and anthocyanin content, maturity, and variety of Vaccinium species. Journal of Agricultural and Food Chemistry 46: 2686–2693.
Rosenfeld H.J., Meberg K.R., Haffner K., and Sundell H.A. 1999. Map of Highbush blueberries: sensory quality in relation to storage temperature, film type and initial high oxygen atmosphere. Postharvest Biology and Technol-ogy 16: 27–36.
Rossi M., Giussani E., Moreli R., Lo Scalzo R., Nani R.C., and Torreggiani D. 2003. Effect of fruit blanching on phe-nolics and radical scavenging activity of highbush blue-berry juice. Food Research International 36: 999–1005.
Samotus B., Leja M., and Ścigalski A. 1982. Porówna-nie czterech metod oznaczania kwasu askorbinowego w owocach i warzywach (Comparison of four methods for ascorbic acid determination in fruit and vegetables). Acta Agraria et Silvestria, Ser. Agraria XXI: 105–121.
Skupień K. 2004. Ocena wartości odżywczej czterech odmian borówki wysokiej (Vaccinium corymbosum L.) (Estimation of nutritive value of four cultivars of high-bush blueberry fruit (Vaccinium corymbosum L.)). Fo-lia Universitas Agriculturae Stetinensis, Agricultura 240: 171–174.
Smolarz, K. 2006. History of highbush blueberry (V. cor-ymbosum L.) growing in Poland. Acta Horticulturae 715: 313–316.
Smolarz K., Kozinski B., and Chlebowska D. 2006. Krót-ka informacja o wynikach badań nad mineralnym na-wożeniem borówki wysokiej prowadzonych w Insty-tucie Sadownictwa i Kwiaciarstwa w Skierniewicach. In: Międzynarodowa Konferencja „Uprawa Borówki i Żurawiny” (z elementami ekologii) (A brief report on the results of the experiments on mineral fertilization of high-bush blueberry at the Institute of Pomology and Floricul-ture in Skierniewice. In: International Scientific Confer-ence on ‘Blueberry and Cranberry growing’ (with ecologi-cal aspects)). ISK Skierniewice 19-22 czerwca, p. 63–70.
Strik B. 2005. Blueberry: an expanding world berry crop. Chronicles of Horticulture 45: 7–12.
Strik B., Buller G., and Hellman E. 2003. Pruning severity affects field, berry weight, and hand harvest efficiency of highbush blueberry. HortScience 38: 196–199.
Ścibisz I., Mitek M., and Malewska J. 2003. Aktywność przeciwutleniająca owoców borówki wysokiej (Vaccin-ium corymbosum L.) (Antioxidant activity of highbush blueberry fruit (Vaccinium corymbosum L.)). Żywność 2(35) Supl.: 159–166.
Wang S.H., Chen C.T., Sciarappa W., Wang C.Y., and Camp M.J. 2008. Fruit quality, antioxidant capacity, and flavo-noid content of organically and conventionally grown blueberries. Journal of Agricultural and Food Chemis-try 56: 5788–5794.
Zheng W. & Wang S.Y. 2003. Oxygen radical absorbing ca-pacity of phenolics in blueberries, cranberries, choke-berries, and lingonberries. Journal of Agricultural and Food Chemistry 51: 502–509.
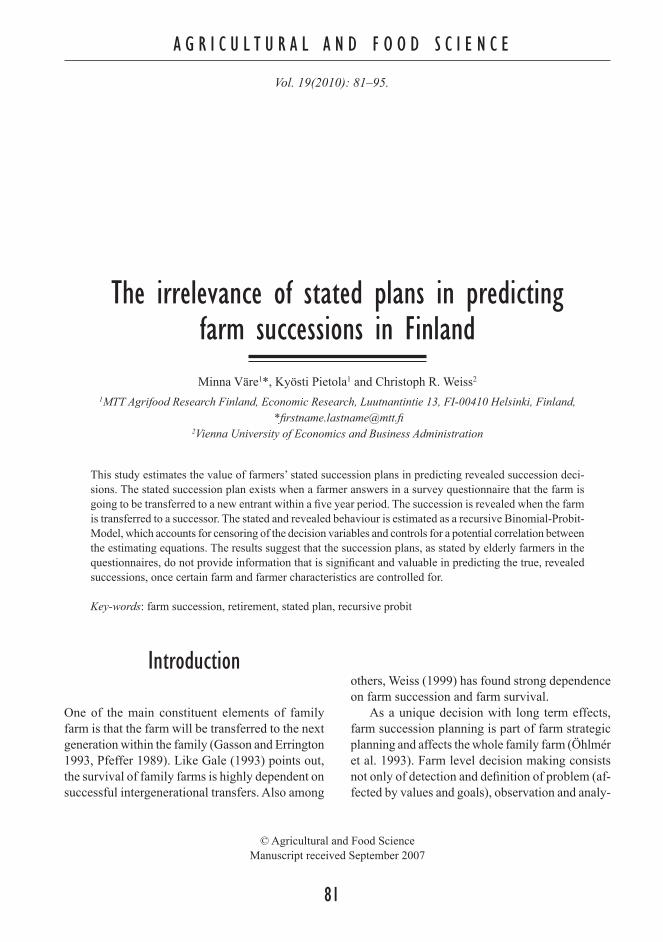
A G R I C U L T U R A L A N D F O O D S C I E N C E
Vol. 19(2010): 81–95.
81
© Agricultural and Food Science Manuscript received September 2007
The irrelevance of stated plans in predicting farm successions in FinlandMinna Väre1*, Kyösti Pietola1 and Christoph R. Weiss2
1MTT Agrifood Research Finland, Economic Research, Luutnantintie 13, FI-00410 Helsinki, Finland, *[email protected]
2Vienna University of Economics and Business Administration
This study estimates the value of farmers’ stated succession plans in predicting revealed succession deci-sions. The stated succession plan exists when a farmer answers in a survey questionnaire that the farm is going to be transferred to a new entrant within a five year period. The succession is revealed when the farm is transferred to a successor. The stated and revealed behaviour is estimated as a recursive Binomial-Probit-Model, which accounts for censoring of the decision variables and controls for a potential correlation between the estimating equations. The results suggest that the succession plans, as stated by elderly farmers in the questionnaires, do not provide information that is significant and valuable in predicting the true, revealed successions, once certain farm and farmer characteristics are controlled for.
Key-words: farm succession, retirement, stated plan, recursive probit
Introduction
One of the main constituent elements of family farm is that the farm will be transferred to the next generation within the family (Gasson and Errington 1993, Pfeffer 1989). Like Gale (1993) points out, the survival of family farms is highly dependent on successful intergenerational transfers. Also among
others, Weiss (1999) has found strong dependence on farm succession and farm survival.
As a unique decision with long term effects, farm succession planning is part of farm strategic planning and affects the whole family farm (Öhlmér et al. 1993). Farm level decision making consists not only of detection and definition of problem (af-fected by values and goals), observation and analy-

A G R I C U L T U R A L A N D F O O D S C I E N C E
Väre, M. et al. Stated plans and farm successions
82
A G R I C U L T U R A L A N D F O O D S C I E N C E
Vol. 19(2010): 81–95.
83
sis of information, implementation and bearing the responsibility but also of development of intention, a function before implementation. Choosing a way of action does not necessarily mean implementa-tion, there’s a way back too. The time before farm manager develops his intention to the implemen-tation depends among other factors on economic impact, consequences, time limits and support for the choice of actions (Öhlmér et al. 1998). For ex-ample farmers’ decision of buying machinery or land is based on long period of consideration and short decision phase (Jacobsen 1994).
Intentions may also be delayed because of time constraint or, because of dependency of other peo-ple (Ajzen 1985). In the case of farm succession, implementation of intention strongly depends on successors’ willingness to take over the farm. Like Kimhi and Lopez (1999) conclude, retirement and succession decisions in farm families are not sepa-rable.
During the last decade, the number of farm suc-cessions in Finland has decreased. At the beginning of the 1990s about 2,000 farms were transferred to new entrants annually, but in 2008 the corre-sponding number decreased to less than half of that (Pyykkönen 2001, Mela 2009). As a result, the share of young farmers has decreased and the average age of the farmers has increased from 44.8 years to 47.1 years during the last ten years (Mela 2009).
In order to predict and make scenarios about the future development of agricultural sector, differ-ent questionnaires have become important source of information. Lately, farmers have been asked frequently about their investment and production plans and succession considerations. However, dif-ference between the planned and realised invest-ments in agriculture can be large (Honkanen 1983, Kuhmonen 1995).
In the case of questionnaires it may be that, when the person has devoted only little time to de-cision making, the ill-formed intentions are held with low confidence and have only a weak con-nection to behaviour. This might have implications when measuring intentions. Individuals might feel obliged to answer questions about intentions even
though they had not yet formed real intentions (Ba-gozzi and Yi 1989).
Earlier studies on farm retirement are mainly based on farm surveys, where farm successions are observed either ex-post or they based on ex-ante statements about future decisions. Kimhi (1994), Kimhi and Bollman (1999) and Stiglbauer and Weiss (2000) have analysed (actual) succession ex-post by investigating panel data on farm house-holds. In these studies, information on the farm operator’s age in different time periods is used to identify farm succession to have taken place. More common approach has been to ask farm operators in a farm survey ex-ante about the probability and timing of family succession and whether a farm successor is already determined (Kimhi and Lopez 1999, Kimhi and Nachlieli 2001, Glauben et al. 2004, Hennessy 2002, Mishra et al. 2004).
The difference between the planned and real re-tirement behaviour may, however, be considerable. Intentions usually change over time. Some inten-tions change as time goes by, when new informa-tion becomes available or when economic situation changes (Ajzen 1985). As Horowitz (1992) found out, individuals’ plans about their future activi-ties are intertemporally inconsistent, but there is a consistency in the aggregate economic behaviour. According to Diamond and Hausmann (1984), planned timing of retirement may change over time when individual observes new information. Also Glauben et al. (2004) have found inconsistency in farm operator’s succession plans over time: “the extent to which farm operator’s plans materialise might be related to farm and family characteris-tics, thus introducing bias to farm surveys results” (Glauben et al. 2004).
The goal of this study is to estimate the signifi-cance of the information on succession plans, as stated by farmers in questionnaires, in predicting the true, revealed successions. The stated succes-sion plan is defined to exist when a farmer answers in a survey questionnaire that the farm is going to be transferred to a new entrant within a five year period. The succession is revealed when the farm is transferred to a successor. New information about the linkage between the stated and revealed behav-iour is important because farmer surveys are often

A G R I C U L T U R A L A N D F O O D S C I E N C E
Väre, M. et al. Stated plans and farm successions
82
A G R I C U L T U R A L A N D F O O D S C I E N C E
Vol. 19(2010): 81–95.
83
used as information sources in designing structural policy measures, such as the terms of farmer retire-ment programs. The questionnaires are sent to farm-ers because in practise it is difficult to have enough information to draw a sample amongst potential successors. If the information provided by the sur-veys is consistent with the revealed behaviour and they make predictions of the true behaviour more accurate, once farm and farmer characteristics are controlled for in making the predictions, then they are justified. However, if the survey results cannot be consistently linked to the observed behaviour, then these surveys cannot be justified as an expen-sive means for attempt to provide information on predicting behaviour.
We estimate the stated and revealed behaviour as a recursive Binomial-Probit-Model, which ac-counts for censoring of the decision variables and controls for a potential correlation between the esti-mating equations. Similar binary models have been earlier used for example by Kimhi and Bollman (1999), Kimhi and Nachlieli (2001), and Glauben et al. (2004) when analysing farmers’ succession and exit decisions. The data are annual surveys and accounts on farms in the Farm Accountancy Data Network (FADN).
The rest of the paper is organised as follows. Subsequent Sections 2 and 3 describe the method and data used in analysis. In section 4, the results are presented. The final Section 5 concludes.
Method
The economic model has two choice variables and decision rules to be estimated. The first choice variable (y1) is the farmer statement of whether he is or he is not planning to transfer the farm to a new successor within five years. This answer or statement is based on a survey that was conducted annually of all farmers in the sample. The second choice variable (y2) is the realised choice, i.e. the realized transfer of the farm to a new entrant.
The model has the following recursive struc-ture. The farmer is hypothesised to have a succes-
sion plan first, and then possibly execute the plan. Therefore, the statement on the succession plan (y1) enters as an endogenous explanatory variable in the equation for the realised succession (y2):
y i* 1 = β ' 1 1x i 1 + ε i 1
y i*
2 = β ' 2 x
i
2 + γ y
i
1 + ε
i
2 (1)
where the superscript i refers to the farmer i and an asterisk (*) refers to the uncensored latent form, which is unobserved. The matrices X1 and X2 include exogenous variables, such as farmer and farm characteristics. Parameters are denoted by β and the error ε=(ε1 ,ε2 ) is assumed to be normally distributed with mean zero and the variance covari-ance matrix Σ. That is, εi~N(0,Σ). The parameter γ indicates the effects of the stated succession plan whether the succession is revealed or not. It is used to test between the univariate (single-equation) and bivariate (two equation) specification of the estimating equations. As is the standard in Probit models, the model parameters are identified by normalising the variance of the errors at one. Under this normalisation, the variance covariance matrix takes the form:
Σ=[ 1 ρ ρ 1 ]
where ρ=Cov(ε1, ε2). The latent form decision variables are realised as observed binary indicators such that:
y i
1 =1 if y i*
1 >0, and 0 otherwise
(2)y
i
2 =1 if y i*
2 >0, and 0 otherwise
In other words, if the succession plan exists, the bi-nary indicator measuring the stated plan (y1) equals one, or otherwise, zero. Similarly, if the farm is transferred to a successor, the revealed choice variable (y2) takes value one, or otherwise, zero. Following Burnett (1997) and Greene (1998), the choice probabilities take the form Prob[y1=1, y2=1|x1, x2]=Ф1(β ' 1 x1, β ' 2 x2+ γy1, ρ) (3)

A G R I C U L T U R A L A N D F O O D S C I E N C E
Väre, M. et al. Stated plans and farm successions
84
A G R I C U L T U R A L A N D F O O D S C I E N C E
Vol. 19(2010): 81–95.
85
The model is a recursive, simultaneous-equa-tions model. The term entering the log-likelihood function is P(y1=1, y2=1) = P(y1=1|y2=1) P(y1=1). Following Maddala (1983, 123), the other three terms in the log-likelihood function are (Greene 2000):
P11=Ф1(β ' 1 x1,β ' 2 x2+γy1, ρ) P10=Ф1(β ' 1 x1,–β ' 2 x2–γy1,ρ)
P01=Ф1(–β ' 1 x1,β ' 2 x2,–ρ) P00=Ф1(–β ' 1 x1,–β ' 2 x2,–ρ)
The likelihood function to be maximised is (Maddala 1983): L(β2,γ1,γ2)=∏P
y1y2 11 P
y1(1–y2) 10 P
(1–y1)y2 01 P
(1–y1)(1–y2) 00 (4)
Equation (4) describes that the model is general enough to account for the censoring of the decision variables and to control for a potential correlation between the estimating equations. The parameters in the two choice equations were estimated using the standard maximum likelihood method.
The generic choice equations (1) are linear in the parameters. The set of variables includes field area, forest area, the age of the farmer and the spouse, a binary variable concerning the produc-tion line (arable land, livestock and dairy), a binary variable indicating the location of the farm in two support areas (north or south), total farm assets, farm debt and the farm family’s working hours (labour input).
Data
The farm data are from the Finnish Farm Ac-countancy Data Network (FADN) over the years 1996–2001. These accountancy data are supple-mented by a survey about the succession plans of the farmers. The supplementing survey was carried out on FADN farms twice, the first time in 1996 and the second time in 1997. The questionnaire included questions about farmers’ plans concerning their farm and off-farm activities over the next five
years. If the farmer did not intend to continue farm-ing himself, it was asked what would happen to the agricultural production. One of the nine response options was that there was to be a succession with a family successor (Appendix 1).
Only the farmers who were old enough at the beginning of the study period to have an access to the farm succession and, therefore, to have a reason to state a plan to transfer the farm to a successor within the next five- year period were included in the analysis. During the study period, the lower age limit of Finnish farmers’ retirement pension system for farmers transferring their farms to new entrants was 55 years. About half of the Finnish farmers transferring their farm to the new entrant utilize these pension benefits. The lower age limit of the farmers included in the sample was 50 years in 1996. This means, that also the youngest sam-ple farmers could have retired by transferring their farms to a new entrant and, thus received the re-tirement pension benefits according to the farmers’ retirement system on the last study year. Naturally, farm succession could also have taken place any time without the retirement system and there is no information concerning this on the data set.
The FADN data include 156 farms run by a farmer aged over 50 for which the survey data were available both in 1996 and in 1997. Out of these farms, 108 continued farm profitability account-ancy at least until the year 2001 and 48 gave it up during the years 1998–2001. Those 48 farms which were dropped from the data did not differ substantially from those participating in the farm profitability accountancy for the whole study pe-riod 1996–2001 (Tables 1 and 2). Unfortunately, no specific information was available on the reasons for the farms’ exit from the FADN. The rotation of farms in the FADN sample is also based on the sampling procedures that have a goal to have rota-tion for statistical reasons and, in addition, a match between the sample and the corresponding popu-lation stratified by different farm types and farm locations. Also Koivisto (1997) did not find any systematic endogenous reasons for the exits from the sample when studying the impacts of partici-pating on the FADN on the profitability of sample farms. It is evident that the exit cases involve ex-
A G R I C U L T U R A L A N D F O O D S C I E N C E
Väre, M. et al. Stated plans and farm successions
84
A G R I C U L T U R A L A N D F O O D S C I E N C E
Vol. 19(2010): 81–95.
85
Furthermore, those 11 observations where the farm operator reported plans to sell or rent out the farm to a non-family member or reforest the fields, or had some “other plans” for the following five years were eliminated because the number of these choices was too small to estimate a separate equation for them. Thus the econometric analysis is based on the information of 97 sample farms (Table 3).
ogenous exits, such as accidental and death cases. The exogenous exits do not, nevertheless, bias the parameter estimates. One of the possible reasons is the change of ownership, either in case of farm suc-cession or selling the farm land to another farmer. As pointed out by one of the referees, these types of unobserved exit cases may induce bias in the parameter estimates if they significantly correlate with the choices observed in the sample.
Table 1. Descriptive statistics of the farms continuing the Farm Accountancy Data Network during the sampling pe-riod of 1996 to 2001 (the number of farms is 108).
Mean Std. Dev. Min. Max.
Farmer’s age (years) 55.1 24.8 49.0 84.0
Spouse’s age (years) 45.5 38.2 - 69.0
Arable land (hectares) 43.8 24.1 6.3 187.4
Forest (hectares) 73.8 88.5 3.0 360.6
Share of livestock and dairy farms (%) 59.2 - 0 1.0
Share of farms located in the north (%) 36.5 - 0 1.0
Total assets (10,000 €) 18.9 8.0 3.9 79.1
Farm debts (10,000 €) 4.1 10.5 0 32.1
Farm family’s working hours (100 hours) 34.4 24.4 0.262 81.4
Share of farmers stating succession plan (%) 41.7 - 0 1.0
Table 2. Descriptive statistics of the farms exiting the Farm Accountancy Data Network during the sampling period of 1996 to 2001 (the number of farms is 48). Mean Std.Dev. Min. Max.
Farmer’s age (years) 55.2 13.4 50.0 68.0
Spouse’s age (years) 47.9 34.7 - 70.0
Arable land (hectares) 29.6 7.93 6.4 66.4
Forest (hectares) 82.6 11.9 1.4 312.3
Share of livestock and dairy farms (%) 60.0 - 0 1.0
Share of farms located in the north (%) 37.2 - 0 1.0
Total assets (10,000 €) 12.9 3.6 2.7 62.3
Farm debts (10,000 €) 3.8 16.7 0 26.7
Farm family’s working hours (100 hours) 33.1 18.5 0.4 84.5
Share of farmers stating succession plan (%) 43.4 - 0 1.0

A G R I C U L T U R A L A N D F O O D S C I E N C E
Väre, M. et al. Stated plans and farm successions
86
A G R I C U L T U R A L A N D F O O D S C I E N C E
Vol. 19(2010): 81–95.
87
In the surveys, carried out in 1996 and 1997, 45 (46%) of the sample farms announced that the farm would be transferred to a successor within the forthcoming five years (Stated succession plan=1). Among these farms that had a plan, succession actually happened on 18 farms (Revealed succes-sion=1), but on 27 farms the succession was de-layed (Revealed succession=0). In addition, 9 farms were transferred to a new entrant even though the plan was not announced in the survey (Stated suc-cession plan=0, Revealed succession=1) (Table 4). The share of observations for which the stated plan (either succession or no succession) matched with the realized outcome was 63%. (=100×61/97).
The choice of exogenous instruments included in the analysis is determined according to existing literature. In earlier studies, probability of farm transfer has been found to vary by farm and fam-ily characteristics (e.g. Kimhi 1994). In our study, the ages of the farmer and spouse are expected to
affect succession probability. Farm characteristics are expected to influence both the succession prob-ability and the succession process. This is because they affect the value of the farm for the potential successor. The bigger the farm, the more likely suc-cession is in earlier studies found to be (e.g. Kimhi and Nachlieli 2001). Variables related to farm size are arable land and forest area. Also, as stated ear-lier, one of the prime objectives for a family farm business is succession. A farmer with a potential successor has a constant incentive to plan ahead and expand the farm. Elderly farmers without a successor, on the other hand, have little incentive to expand or even maintain production but tend to reduce their working hours (shadow effect) (Gas-son and Errington 1993). The results of Calus et al. (2008) support the theory that higher total farm assets should result in a higher intention to transfer the farm to next generation. Here, total farm as-sets and farm debt are used to indicate the capital
Table 3. Descriptive statistics of the sample farms used for econometric analysis (the number of farms is 97).
Mean Std. Dev. Min. Max.
Farmer’s age (years) 54.9 4.78 50.0 68.0
Spouse’s age (years) 45.8 17.09 - 69.0
Arable land (hectares ) 44.5 32.02 6.3 187.0
Forest (hectares) 75.2 63.9 7.1 360.6
Share of livestock and dairy farms (%) 58.9 - 0 1.0
Share of farms located in the north (%) 36.1 - 0 1.0
Total assets (10,000 €) 19.5 13.6 3.9 79.1
Farm debts (10,000 €) 4.4 6.31 0 32.1
Farm family’s working hours (100 hours) 35.1 17.5 0.3 81.4
Share of farmers stating succession plan (%) 46.4 - 0 1.0
Table 4. The number of stated and revealed successions in the sample.
Revealed Succession (y2)
0 (no) 1 (yes) Total
Stated Succession
Plan (y1)
0 (no) 43 9 52 1 (yes) 27 18 45
Total 70 27 97
A G R I C U L T U R A L A N D F O O D S C I E N C E
Väre, M. et al. Stated plans and farm successions
86
A G R I C U L T U R A L A N D F O O D S C I E N C E
Vol. 19(2010): 81–95.
87
stock and capital structure of the farm. Similarly, Diwisch et al. (2009) have studied the relationship between family firms’ succession plans and per-formance measured by employment growth. Here, farm family labour is measured in annual working hours.
The production line is also assumed to affect succession probability and the timing of succes-sion (Stiglbauer and Weiss 2000, Glauben et al. 2004, Hennessy 2002). For example, in the case of a potential successor working on the farm before succession, a successor may be more important on a labour intensive dairy farm than on other types of farms (Pesquin et al. 1999), and thus also the succession decision is made earlier. Moreover, a dairy farm may be seen as a more stable and reli-able source of income than other farms and thus be more likely to be transferred to the next generation. Therefore a dummy variable divided livestock and dairy farms from other farms.
Farm location may also affect succession prob-ability (e.g. Pietola et al. 2003). The farms are di-vided according to the EU subsidy region to those located in the southern (coded as A and B subsidy area in the CAP) and the northern parts (C subsidy areas) of the country.
The data have no information about the po-tential successor or any information stated by the potential successor about whether a potential suc-cessor existed or not (however, it is assumed that when the succession plan was stated on the survey, a possible successor existed).
The variables included in the model were not correlated with each others. This means there was no possible multicollinearity in the analysis made.
Results
Between-equation correlation and the fit Parameter estimates of a recursive simultaneous bivariate probit model are shown in Table 5. In the model, the estimated covariance (ρ) between the
errors of the two equations was estimated at 0.998. The Wald test statistics for the null hypothesis of zero correlation between the errors was estimated at 137.19, which is more than the critical value of 10.828. Thus, the null hypothesis of zero correlation (ρ=0) can be rejected at a 0.1% level. This implies that there is dependency between the two decisions and that they are to be estimated jointly.
To some extent the estimated bivariate probit model overestimated the probability of behaving according to the stated survey answers both when having and not having any stated succession plans (Table 6). Whereas the model predicted 61 cases of neither having a stated succession plan nor being transferred to a new entrant, there were only 43 farms in the sample with these qualities. Similarly, there were only 18 farms stating succession plans that were actually transferred to next generation during the study period even though the model pre-dicted 28 cases. But the model underestimated both the probability of a stated succession plan without actual succession and revealed succession without a stated plan. The predicted number of farms hav-ing succession plans without being actually trans-ferred to the next generation was smaller (8) than the number of this kind of farms in the sample (27). Likewise, the model predicted no actual succes-sions without stated plan even though there were 9 cases like this in the sample.
Parameter estimates
The only significant variable explaining the prob-ability of having a stated succession plan was the age of the farmer (at a 10% level). In addition, the dummy variable for northern location was significant at a 12% two-sided risk level (Table 5). The results hold together with earlier findings of e.g. Glauben et al. (2004) that the probability of succession plans first increases by farmers’ age. Similarly, Pietola et al. (2003) have found succession to be more likely in northern parts of the country. Based on the estimated univariate models, farm assets and

A G R I C U L T U R A L A N D F O O D S C I E N C E
Väre, M. et al. Stated plans and farm successions
88
A G R I C U L T U R A L A N D F O O D S C I E N C E
Vol. 19(2010): 81–95.
89
debt were not assumed to have an influence on actual succession probability but on the probability of having a stated succession plan, and were not included in the model.1
Similarly to the findings on factors affecting the probability of succession planning, farmer age was found to increase the probability of actual succes-sion significantly (at a 5% level). Northern location was found to increase the actual succession prob-ability even more significantly (at a 10% level) than the probability to plan succession (Table 5). These factors were also found to be significant in the uni-variate probit model for succession (Appendix 2). One reason that succession plans are realised more often in northern parts of the country is the fewer
1 These are called exclusion restrictions. Contra-dicting to the earlier literature, farm debt and assets were not found to have a significant affect on the probability of having a stated succession plan nor on the probability of ac-tual succession based on estimated univariate probit models (Appendix 2). Dropping out less significant variables had no effect on the significance of other parameters.
alternative employment opportunities for the suc-cessor. Also the qualitative differences in agricul-tural support programs between the Southern and Northern parts of the country may have contributed to the result. In the South the national support pro-
Table 5. Parameter estimates of the recursive probit model of Equations 1 and 2 (t-values in parentheses).Stated Plan Equation
Revealed Succession Equation
Explanatory variable Coefficient t-value Coefficient t-value
Intercept –3.9291** (–2.302) –8.8617** (–3.076)
Farmer’s age 0.5936* (2.031) 1.4525** (2.996)
Spouse’s age 0.1340 (1.185) 0.0863 (0.589)
Arable land area 0.4035 (0.393) 0.7707 (1.413)
Forest area –0.3315 (–0.976) –0.2009 (–0.642)
Livestock and dairy farm 0.5211 (1.306) 0.6349 (1.368)
North 0.5851 (1.553) 0.6563* (2.088)
Total assets 0.0226 (0.091) - -
Farm debts 0.1458 (0.583) - -
Family labour –0.1538 (–1.359) –0.0654 (–0.457)
Stated plan - - –1.2044*** (–3.948)
Disturbance correlation ρ 0.9976*** (10.931)
Log likelihood –98.003*** A triple asterisk denotes significance at a two-sided 1% level.** A double asterisk denotes significance at a two-sided 5% level.* An asterisk denotes significance at a two-sided 10% level.
Table 6. Predicted and observed probabilities based on the recursive probit model.
Model Revealed succession
Cases Observations 0 1 Total
No stated Observed 43 9 52
succession Predicted 61 0 61
plan
Stated Observed 27 18 45
succession Predicted 8 28 36
plan
Total Observed 70 27 97
Predicted 69 28 97

A G R I C U L T U R A L A N D F O O D S C I E N C E
Väre, M. et al. Stated plans and farm successions
88
A G R I C U L T U R A L A N D F O O D S C I E N C E
Vol. 19(2010): 81–95.
89
gram has a fixed, temporary duration, while in the North the program continues for sure.
According to the results, the probability of ac-tual farm succession was found to decrease when having a stated succession plan (Table 5). This un-expected result may either be caused by data that are not informative enough or, by the age of the farmers. The average age of the sample farmers in analysis is 55 years, which means that they should transfer the farm to the next generation at latest at the age of 60. The lower age limit of Finnish farmers’ retirement pension system applied during the study period was 55 years. So actually, farm transfer could have taken place already on the first year of the study period. Also, the Finnish farmers are found to retire in average at the age of 60 years (Mela 2009). The result also suggests that farmer statements do not necessarily add information when predicting actual farm successions. Accord-ing to the earlier findings of Glauben et al. (2004) farmers’ succession considerations are time in-consistent and may lead to postponed successions. Also, surveys often consider the firm operator’s view and without paying enough attention to chil-dren’s opinion. However, these plans do not always materialize as the possible successor decides, for example, to choose another career (Diwisch et al. 2009). Another case is the unplanned successions, where sudden events (accidents, health problems etc) require another family member to take over the family firm without any stated plans (Diwisch et al. 2009, Steier 2001). In both cases, the reli-ability of answers on succession plans is reduced and the reasons for actual succession behaviour can not necessarily be identified when analysing family firm succession.
Conclusions
This study estimated a recursive probit model for farmers’ stated succession plans and the revealed farm successions on these farms. The farm data were the Finnish Farm Accountancy Data (FADN) and a questionnaire carried out on those farms in
1996 and 1997. The data consisted of 97 elderly farmers, and 45 of them stated a plan to transfer the farm to a family successor within a five-year period. Nevertheless, only 40% of these plans were realised in that the farm was actually transferred to the next generation during the years 1998–2001 as planned. In addition, farm succession took place on about 17% of the farms which did not state any succession plan on the questionnaire.
The farm rotation, which is characteristic for sampling in the FADN statistics, resulted in a quite small sample size that was used in estimation. We have to acknowledge, as pointed out by an anony-mous referee, the small sample size and possible bias caused by lacking information on the reasons why farms give up farm accountancy when inter-preting the results of the analysis. Nevertheless, earlier studies also suggest that there are no sys-tematic endogenous factors that are underlying the rotation of FADN farms.
According to the results, both the probability of having a stated succession plan and actually trans-ferring the farm to a new entrant increase by farmer age. Also, northern location was found to increase the probability of both planning succession and actual succession, suggesting that the potential successors have fewer occupational options in the north than in the south. The indicated results on the stated succession plans and actual succession are, consistent with earlier literature.
Nevertheless, the stated succession plans are not found to increase the probability of actual suc-cession. The results suggest that the farmer state-ments, usually collected in farmer surveys, do not add information that is significant in predicting actual, revealed farm successions. A reason for the irrelevance of the information generated by farmer surveys is that the stated plans, as supplied by the elderly farmers, may be inconsistent over time and conflicting with the views, expectations or plans of the potential successors as suggested earlier by Diwisch et al. (2009). As Glauben et al. (2004) suggest, farmers’ succession considerations are time inconsistent and may lead to postponed successions. In case of the postponed successions the whole succession may be endangered when the possible successor will not be able to take over the
A G R I C U L T U R A L A N D F O O D S C I E N C E
Väre, M. et al. Stated plans and farm successions
90
A G R I C U L T U R A L A N D F O O D S C I E N C E
Vol. 19(2010): 81–95.
91
farm when it suits him/her best. This may be caused e.g. by the difficulties in arranging the financing or the changes in the farmers’ retirement system. Later on the successor may have created another career and is no more willing to take over the farm at all. The observed behaviour may, therefore, be steered more by other circumstances and factors rather than the farmer’s stated plans.
Our main conclusion is that in designing policy measures that regulate or encourage farm succes-sions the policy simulations and decisions should be based on revealed behaviour (preferences) and predictions made conditional on observed farmer and farm characteristics rather than on survey re-sults on elderly farmers’ stated preferences. There can be a wide discrepancy between the revealed and stated behaviour. Further, the stated prefer-ences do not add significant information to the in-formation included in observable farmer and farm characteristics. One approach of improving the efficiency of predictions about farm successions would be to survey potential successors rather than the elderly farmers. It would be, nevertheless, more expensive and statistically involved to identify the potential entrants, as compared to identifying the current elderly farmers.
Our results further suggest, consistently with earlier literature, that over all it is a challenge to predict longstanding irreversible commitments, such as the timing of farm successions, where tim-ing is an issue and, at least to some extent, flexible, and which are further characterized by low prob-ability realizations in the population. This study is the first contribution on the area of generational bias simply because of difficulties of achieving proper data. But, certainly it is an issue that needs to be analysed more carefully when there are better data available and the analysing methods will be further developed.
Acknowledgements. Funding from the Austrian Science Fund (SFB F 020), Ministry of Agriculture and Forestry of Finland, Farmers’ Social Insurance Institution, Finland, and Finnish Association of Academic Agronomists are gratefully acknowledged.
References Ajzen, I. 1985. From Intentions to Actions: A Theory of
Planned Behaviour. In Kuhl, J. & Beckmann, J (eds.), Action Control. From Cognition to Behaviour. Berlin Hei-delberg: Springer-Verlag. p. 12–39.
Bagozzi, R.P. & Yi, Y. 1989. The Degree of Intention Forma-tion as a Moderator of the Attitude-Behaviour Relation-ship. Social Psychology Quarterly 52: 226–279.
Burnett, N.J. 1997. Gender Economics Courses in Lib-eral Arts Colleges. Journal of Economic Education 28: 369–377.
Calus, M., Van Huylenbroeck, G. & Van Lierde, D. 2008. The Relationship between Farm Succession and Farm Assets on Belgian Farms. Sociologia Ruralis 48: 38–56.
Diamond, P.A. & Hausman, J.A. 1984. Individual Retire-ment and Savings Behavior. Journal of Public Econom-ics 23:81-114.
Diwisch, D.S., Voithofer, P. & Weiss, C.R. 2009. Succession and firm growth: results from a non-parametric matching approach. Small Business Economics 32: 45–56.
Gale, H.F. 1993. Why Did the Number of Young Farm En-trants Decline? American Journal of Agricultural Eco-nomics 75: 138–146.
Gasson, R. & Errington, A. 1993. The Farm Family Busi-ness. CAB International. Wallingford, UK. 290 p.
Glauben, T., Tietje, H. & Weiss, C.R. 2004. Intergenera-tional Succession in Farm Households: Evidence from Upper Austria. Review of Economics of the Household 2: 443–461.
Greene, W.H. 1998. Gender Economic Courses in Liber-al Arts Colleges: Further Results. Journal of Economic Education 29: 291–300.
Greene, W.H. 2000. Econometric Analysis. New York Uni-versity. Fourth Edition. Prentice Hall International, Inc. New Jersey, USA. 1004 p.
Hennessy, T. 2002. Modelling Succession on Irish Dairy Farms. Contributed paper presented in EAAE 10th Con-gress in Zaragoza, in August 2002. Article on CD ROM. Exploring the Diversity in the European Agri-Food Sys-tem, EAAE.
Honkanen, S. 1983. Maatalouden investoinnit, pääomakan-ta ja PTT:n investointitiedustelu. (in Finnish). Pellervon taloudellisen tutkimuslaitoksen raportteja ja artikkeleita 34: 1–41. Helsinki: PTT.
Horowitz, J.K. 1992. A test of intertemporal consisten-cy. Journal of Economic Behavior & Organization 17: 171–182.
Jacobsen, B.H. 1994. Farmers’ Economic Decision Mak-ing Behaviour. Institute of Agricultural Economics. Rap-port nr. 81: 1–120. Copenhagen.
Kimhi, A. 1994. Optimal Timing of Farm Transferral from Parent to Child. American Journal of Agricultural Eco-nomics 76: 228–236.
Kimhi, A. & Bollman, R. 1999. Family farm dynamics in Canada and Israel: the case of farm exits. Agricultural Economics 21: 69–79.
Kimhi, A. & Lopez, R. 1999. A Note on Farmers’ Retire-ment and Succession Considerations: Evidence from a Household Survey. Journal of Agricultural Econom-ics 50: 154–162.
A G R I C U L T U R A L A N D F O O D S C I E N C E
Väre, M. et al. Stated plans and farm successions
90
A G R I C U L T U R A L A N D F O O D S C I E N C E
Vol. 19(2010): 81–95.
91
Kimhi, A. & Nachlieli, N. 2001. Intergenerational Succes-sion on Israeli Family Farms. Journal of Agricultural Eco-nomics 52: 42–58.
Koivisto, M. 1997. Talousseurannan vaikutus tilan kannatta-vuuteen. (in Finnish). Master thesis. Helsinki University. Department of Economics and Management. 50 p.
Kuhmonen, T. 1995. Suomen maatilojen sopeutuminen EU-jäsenyyteen –arvio vuonna 1995. Suomen aluetutkimus FAR. (in Finnish). Selvityksiä 8: 1–77. Sonkajärvi: FAR.
Maddala, G.S. 1983. Limited-dependent and qualitative var-iables in econometrics. Econometric Society Monographs No. 3. Cambridge University Press. USA. 401 p.
Mela 2009. Statistics of Farmers’ Social Insurance Institu-tion (Mela). Cited 30 May 2009.
Available on the internet: http://www.mela.fi. Mishra, A.K., El-Osta, H. & Jonhson, J.D. 2004. Succes-
sion in Family Farm Business: Empirical Evidence from the U.S. Farm Sector. Contributed paper presented at the AAEA Meeting in Denver 1–4 August, 2004.
Pesquin, C., Kimhi, A. & Kislev, Y. 1999. Old age security and Inter-Generational Transfer of Family Farms. Euro-pean Review of Agricultural Economics 26: 19–37.
Pfeffer, M. 1989. Part-time farming and the stability of fam-ily farms in the Federal Republic of Germany. European Review of Agricultural Economics 16: 425–444.
Pietola, K., Väre, M. & Oude Lansink, A. 2003. Timing and type of exit from farming: farmers’ early retirement pro-grammes in Finland. European Review of Agricultural Economics 30: 99–116.
Pyykkönen, P. 2001. Sukupolvenvaihdokset ja tilanpidon kehittäminen. (in Finnish). Pellervo Economic Research Institute Working Papers 49: 1–22. Helsinki.
Steier, L. 2001. Next-Generation Entrepreneurs and Suc-cession: An Explanatory Study of Modes and Means of Managing Social Capital. Family Business Review 14: 259–276.
Stiglbauer, A. & Weiss, C.R. 2000. Family and Non-Family Succession in the Upper-Austrian Farm Sector. Cahiers d’Économie et Sociologie Rurales 54: 6–26.
Weiss, C.R. 1999. Farm Growth and Survival: Econometric Evidence for Individual Farms in Upper Austria. American Journal of Agricultural Economics 81: 103–116.
Öhlmer, B., Olson, K. & Brehmer, B. 1993. Towards a stra-tegic decision making. An application to farmers’ adap-tation to deregulation of agriculture and EC-membership. Swedish University of Agricultural Sciences. Department of Economics. Rapport 60: 1–60. Uppsala.
Öhlmér, B., Olson, K. & Brehmer, B. 1998. Understand-ing farmers’ decision making processes and improv-ing managerial assistance. Agricultural Economics 18: 273–290.
SELOSTUS
Kyselyvastausten käyttökelpoisuus sukupolvenvaihdosten ennustamisessaMinna Väre, Kyösti Pietola ja Christoph R. Weiss
MTT ja Wienin yliopisto

A G R I C U L T U R A L A N D F O O D S C I E N C E
Väre, M. et al. Stated plans and farm successions
92
A G R I C U L T U R A L A N D F O O D S C I E N C E
Vol. 19(2010): 81–95.
93
Appendix 1
Questionnaire
The questionnaire on Finnish farms participating in the Farm Accountancy Data Network since 1996 includes questions about the farmers’ plans concerning farming over the next five years. First, it was asked whether the farmer was going to start, continue, expand or give up agricultural production, forestry, small business entrepreneurship and wage work outside the farm in the next five years. Next, it was asked more closely what was going to happen to agricultural production if the farmer was not going to continue it himself. The answer analysed in this study is the first answer option for the follow-up question:
If you are not going to continue farming on your farm yourself, what is going to happen to its agricultural production?
The farm is going to be transferred to a family successor. 1. The whole farm will be sold to a non-family-member.2. The farm, except the house lived in, will be sold.3. Only the fields will be sold.4. The whole farm will be rented out.5. Only the fields will be rented out.6. The fields will be reforested.7. Part of the fields will be reforested.8. Other, what?9.

A G R I C U L T U R A L A N D F O O D S C I E N C E
Väre, M. et al. Stated plans and farm successions
92
A G R I C U L T U R A L A N D F O O D S C I E N C E
Vol. 19(2010): 81–95.
93
Appendix 2 (1/3)
Univariate probit analysis
In the probit model, a discrete choice between two possibilities is described by the latent dependent vari-able y. The probit model follows a normal distribution (Maddala 1983):
y * i =α+β'xi+εi (A.1)
where the residual term is normally distributed as εi ~ (0, σ2). In the model, observed dependent variable y receives two values: y=1 if y * i >0 y=0 otherwise (A.2)
In the first case, (i) y received value 1 if there was a stated succession plan and zero if not. In the second case, (ii) y=1 if the farm was transferred to a successor and y=0 if the farm was not. The modelling is done separately for these choices.The analysis probability of y = 1 depends on a vector of independent variables labelled as x. The probability of P(y=1) increases with β’x. Thus, assuming that σ 2 =1, we get: P(yi=1) =Ф(β'xi) (A.3)P(yi=0) =1– Ф(β'xi)
where Φ = the cumulative distribution function of the normal distribution with normalised variance. The likelihood function is (Maddala, 1983): L= n
∏
i=1 [Ф(β'xi)]
yi[1– Ф(β'xi)]1–yi (A.4)

A G R I C U L T U R A L A N D F O O D S C I E N C E
Väre, M. et al. Stated plans and farm successions
94
A G R I C U L T U R A L A N D F O O D S C I E N C E
Vol. 19(2010): 81–95.
95
Appendix 2 (2/3)
Parameter estimates of the univariate probit models for stated succession plan and revealed succession (t values in parentheses).
Stated Plan
Equation
Revealed Succession
Equation
Explanatory variable Coefficient t value Coefficient t value
Intercept –4.3068** (–2.457) –12.898*** (–4.651)
Farmer’s age 0.6469* (2.201) 2.0189*** (4.550)
Spouse’s age 0.1372 (1.516) 0.0249 (0.227)
Arable land area 0.0877 (0.101) 0.8284 (0.792)
Forest area –0.4120 (–1.542) –0.0595 (–0.214)
Livestock and dairy farm 0.4390 (1.142) 0.7235 (1.404)
North 0.5669 (1.688) 0.7619* (2.001)
Total assets 0.1129 (0.550) 0.0356 (0.143)
Farm debts 0.1404 (0.598) –0.1048 (–0.307)
Family labour –0.1291 (–1.229) –0.0380 (–0.307)
Log likelihood –61.439 –39.653
Restricted log likelihood –66.983 –57.365
Likelihood ratio test 11.086 35.423
Degrees of freedom 9 9
Total number of observations 97 97*** A triple asterisk denotes significance at a two-sided 1% level.** A double asterisk denotes significance at a two-sided 5% level* An asterisk denotes significance at a two-sided 10% level.
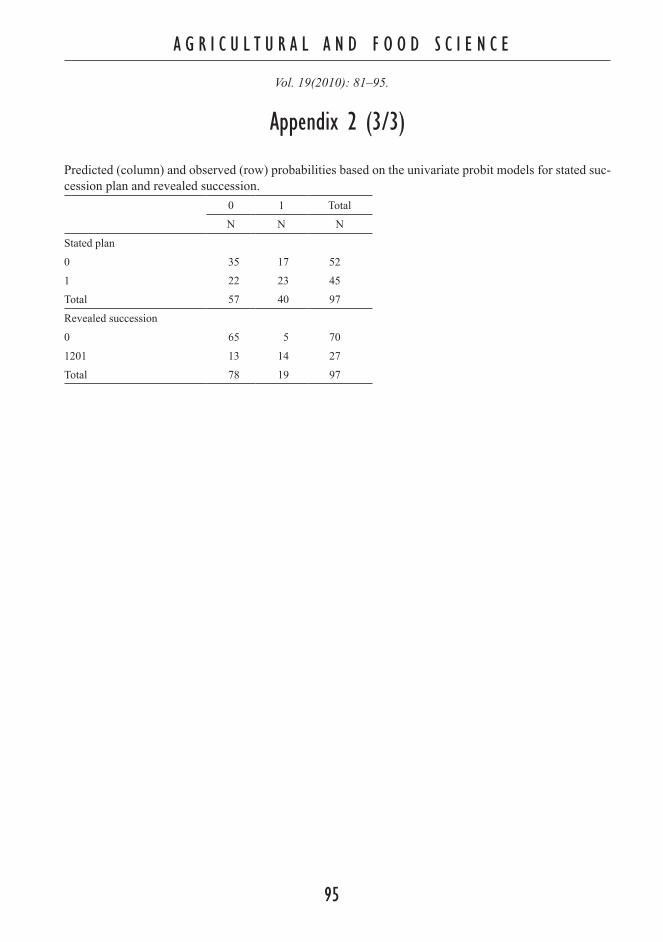
A G R I C U L T U R A L A N D F O O D S C I E N C E
Väre, M. et al. Stated plans and farm successions
94
A G R I C U L T U R A L A N D F O O D S C I E N C E
Vol. 19(2010): 81–95.
95
Appendix 2 (3/3)
Predicted (column) and observed (row) probabilities based on the univariate probit models for stated suc-cession plan and revealed succession. 0 1 Total
N N N
Stated plan
0 35 17 52
1 22 23 45
Total 57 40 97
Revealed succession
0 65 5 70
1201 13 14 27
Total 78 19 97

A G R I C U L T U R A L A N D F O O D S C I E N C E
Vol. 19(2010): 96–100.
96
A G R I C U L T U R A L A N D F O O D S C I E N C E
Vol. 19(2010): 96–100.
97
cass characteristics and blood metabolites in fattening pigs. p. 27–34.
Saprõkina, Z., Karus, A., Kuusik, S., Tikk, H., Järv, P., Soidla, R., Lember, A., Kaldmäe, H., Karus, V. and Roasto, M. Effect of dietary linseed supplements on ω–3 PUFA content and on IGF–1 expression in broiler tissues. p. 35–44.
Animal Science
Horticulture
Plant and Soil Science
Contents Vol. 18 (2009)
Agricultural EconomicsValentinov, V. Third sector organizations in rural develop-
ment: a transaction cost perspective. p. 3–15.
Huuskonen, A., Tuomisto, L., Joki-Tokola, E. and Kaup-pinen, R. Animal performance and carcass character-istics of growing Hereford bulls under insulated, uninsu-lated and outdoor housing conditions in Northern Fin-land. p. 16–26.
Pietruszka, A., Jacyno E., Kołodziej, A., Kawęcka, M., El-zanowski, C. and Matysiak B. Effects of L–carnitine and iron diet supplementations on growth performance, car-
Harding, K., Johnston, J.W. and Benson, E.E. Exploring the physiological basis of cryopreservation success and failure in clonally propagated in vitro crop plant germ-plasm. p. 103–116
Nukari, A., Uosukainen, M., Rokka, V–M., Antonius, K., Wang, Q. and Valkonen, J.P.T. Cryopreservation tech-niques and their exploitation in vegetatively propagat-ed crop plants in Finland (Review article). p. 117–128.
Martín, C. and González–Benito, M.E. Cryopreservation and genetic stability of Dendranthema grandiflora Tzve-lev in vitro cultures (Review article). p. 129–135.
Condello, E., Palombi M.A., Tonelli, M. G., Damiano, C. and Caboni, E. Genetic stability of wild pear (Pyrus pyraster,
burgsd) after cryopreservation by encapsulation dehy-dration. p. 136–143.
Peredo, E.L., Arroyo-García, R. Reed, B.M. and Revilla, A. Genetic stability of in vitro conserved germplasm of humulus lupulus L. p. 144–151.
Fang, J-Y., Wetten, A., Adu-Gyamfi, R., Wilkinson, M. and Rodriguez–Lopez, C. Use of secondary somatic embry-os promotes genetic fidelity in cryopreservation of co-coa (Theobroma cacao L.). p. 152–159.
Tsvetkov, I., Benelli, C., Capuana, M., De Carlo, A. and Lambardi, M. 2009. Application of vitrification–derived cryotechniques for long–term storage of poplar and as-pen (Populus spp.) germplasm. p.160–166.
Fältmarsch R., Österholm, P., Greger M. and Åström, M. Metal concentrations in oats (Avena sativa L.) grown on acid sulphate soils. p. 45–56.
Tontti, T., Nykänen, A. and Kuisma, M. Waste composts as nitrogen fertilizers for forage leys. p. 57–75.
Alaru, M., Laur, Ü., Eremeev, V., Reintam, E., Selge A., and Noormets, M. Winter triticale yield formation and quality affected by N rate, timing and splitting. p. 76–90.
Mäkelä, P. and Kousa, M. Seed production of two mead-ow fescue cultivars differing in growth habit. p. 91–99.

A G R I C U L T U R A L A N D F O O D S C I E N C E
Vol. 19(2010): 96–100.
96
A G R I C U L T U R A L A N D F O O D S C I E N C E
Vol. 19(2010): 96–100.
97
the diet, and level and type of concentrate supplemen-tation. p. 234–256.
Valkonen, E., Rinne, R. and Valaja, J. 2009. Effects of perch on feed consumption and behaviour of caged lay-ing hens. p. 257–267.
Kymäläinen, H–R., Kuisma, R., Määttä, J. and Sjöberg, A-M. 2009. Assessment of cleanness of environmen-tal surfaces in cattle barns and piggeries. p. 268–282.
Myyrä, S., Pihamaa, P. and Sipiläinen, T. 2009. Produc-tivity growth on Finnish grain farms from 1976 2006: a parametric approach. p. 283–301.
Kuosmanen, T. and Kuosmanen, N. 2009. Role of bench-mark technology in sustainable value analysis An appli-cation to Finnish dairy farms. p. 302–316.
Kuosmanen, T. and Niemi, J. 2009. What explains the widening gap between the retail and producer prices of food? p. 317–331. .
Energy, Environment
Food Security
Mikkola, H. J. and Ahokas, J. 2009. Energy ratios in Finn-ish agricultural production. p. 332–346.
Hakala, K., Kontturi, M. and Pahkala, K. 2009. Field bio-mass as global energy source. p. 347–365.
Hakala, K., Keskitalo, M., Eriksson, C. and Pitkänen, T. 2009. Nutrient uptake and biomass accumulation for eleven different field crops. p. 366–387.
Yli-Halla, M., Mokma, D.L., Alakukku, L., Drees, R. and Wilding, L.P. 2009. Evidence for the formation of Luvisols/Alfisols as a response to coupled pedogenic and anthro-pogenic influences in a clay soil in Finland. p. 388–401. Bärlund, I., Tattari, S., Puustinen, M., Koskiaho, J., Yli–Halla, M. and Posch, M. 2009. Soil parameter variabili-ty affecting simulated fieldscale water balance, erosion and phosphorus losses. p. 402–416.
Linjama, J., Puustinen, M., Koskiaho, J., Tattari, S., Ko-tilainen, H. and Granlund, K. 2009. Implementation of automatic sensors for continuous monitoring of runoff
quantity and quality in small catchments. p. 417–427. Tattari, S., Koskiaho, J., Bärlund, I. and Jaakkola, E. 2009.
Testing a river basin model with sensitivity analysis and autocalibration for an agricultural catchment in SW Fin-land. p. 428–439.
Hyytiäinen, K., Ahtiainen, H., Heikkilä, J., Helin, J., Huhta-la, A., Iho, A., Koikkalainen, K., Miettinen, A., Pouta, E. and Vesterinen, J. 2009. An integrated simulation model to evaluate national measures for the abatement of agri-cultural nutrients in the Baltic Sea. p. 440–459.
Usva, K., Saarinen, M., Katajajuuri, J-M. and Kurppa, S. 2009. Supply chain integrated LCA approach to as-sess environmental impacts of food production in Fin-land. p. 460–476.
Regina, K., Lehtonen, H., Nousiainen, J. and Esala, M. 2009. Modelled impacts of mitigation measures on greenhouse gas emissions from Finnish agriculture up to 2020. p. 477–493.
Peltonen-Sainio, P., Jauhiainen, L., Hakala, K. and Ojanen, H. 2009. Climate change and prolongation of growing season: changes in regional potential for field crop pro-duction in Finland. p. 171–190.
Stoddard, F. L., Hovinen, S., Kontturi, M., Lindström, K. and Nykänen, A. 2009. Legumes in Finnish agriculture: history, present status and future prospects. p.191–205.
Peltonen-Sainio, P., Jauhiainen, L. and Hakala, K. 2009. Are there indications of climate change induced increas-es in variability of major field crops in the northernmost European conditions? p. 206–222.
Lehtonen, M.J., Wilson, P.S., Ahvenniemi, P. and Valkonen, J.P.T. 2009. Formation of canker lesions on stems and black scurf on tubers in experimentally inoculated potato plants by isolates of AG2–1, AG3 and AG5 of Rhizocto-nia solani: a pilot study and literature review. p. 223–233.
Jaakkola, S., Saarisalo, E. and Heikkilä, T. 2009. Formic acid treated whole crop barley and wheat silages in dairy cow diets: effects of crop maturity, proportion in
Other titles
Helenius, J. 2009. Editorial. p. 1Uosukainen, M. 2009. Preface. p.101.
Helenius, J. 2009. Foreword. p.167Vanhatalo, A. 2009. Preface. p.169.

A G R I C U L T U R A L A N D F O O D S C I E N C E
Vol. 19 (2010): 96–100.
98
A G R I C U L T U R A L A N D F O O D S C I E N C E
Vol. 19 (2010): 96–100.
cultural and Environmental Research, NorwayDulloo Ehsan, Consultative Group on Internation-
al Agricultural Research, ItalyElkin Robert G., The Pennsylvania State Univer-
sity, USAElofsson Katarina, Swedish University of Agricul-
tural Sciences, SwedenEngelman Florent, Institute of research for devel-
opment, FranceEriksson Torsten, Department of Animal Nutri-
tion & Management,, SwedenFronzek Stefan, Finland’s environmental admin-
istration, FinlandGilles Bélanger, Agriculture and Agri-Food Can-
ada, CanadaGlew Robert H., University of New Mexico, USAGren Ing-Marie, Swedish University of Agricul-
tural Sciences, SwedenGrout Brian, University of Copenhagen, DenmarkGudleifsson Bjarni, Agricultural University of Ice-
land, IcelandGullstrand Joakim, University of Lund, SwedenHallett Paul, Scottish Crop Research Institute,
United KingdomHaukeland Soveig, Norwegian Institute for Agri-
cultural and Environmental Research, NorwayHausman Jean-Francois, Research Unit in Bio-
technologies in Forestry and Agriculture, Lux-embourg
Heinonen Marina, University of Helsinki, FinlandHeinämäki Jyrki, University of Helsinki, FinlandHelander Eija, Suomen Rehu, FinlandHelen Harry, University of Helsinki, FinlandHelynen Satu, VTT Technical Research Centre of
Finland, FinlandHennessy Thia, Rural Economy Research Cen-
tre, IrelandHermansen Arne, Norwegian Institute for Agri-
cultural and Environmental Research, Norway
Acknowledgement of referees Agricultural and Food Science expresses its sincere thanks to the following referees for their constructive critical reviews of one or more manuscripts during the year 2009.
Ahokas Jukka, University of Helsinki, FinlandAhvenjärvi Seppo, MTT Agrifood Research Fin-
land, FinlandAlakukku Laura, University of Helsinki, FinlandHans Andersson, Swedish University of Agricul-
tural Sciences, SwedenAnton Marc, French National Institute for Agri-
cultural Research, FranceArul Joseph, University of Laval, CanadaBarnett John, Victorian Government Australia,
AustraliaBelanger Gilles, Agriculture and Agri-Food Can-
ada, CanadaBende-Michl Ulrike, CSIRO Land and Water,
AustraliaBenson Erica, University of Derby, UKBerthiaume Robert, Agriculture and Agri-Food
Canada, CanadaBerg Lotta, Swedish University of Agricultural
Science, SwedenBlombäck Karin, Swedish University of Agricul-
tural Science, SwedenBohlin Lars, University of Örebro, SwedenBehrendt Joachim, Hamburg University of Tech-
nology, GermanyBorch Kristian, Technical University of Denmark,
DenmarkBunka Frantisek, Tomas Bata University in Zlin,
Czech RepublicBunn Eric, Botanic Gardens and Parks Author-
ity, USABång Ulla, Swedish University of Agricultural
Sciences, SwedenBörjesson Pål, University of Lund, SwedenCarter Tim, Finland’s environmental administra-
tion, FinlandCook Mark, University of Wisconsin-Madison,
USADeelstra Johannes, Norwegian Institute for Agri-

A G R I C U L T U R A L A N D F O O D S C I E N C E
Vol. 19 (2010): 96–100.
98
A G R I C U L T U R A L A N D F O O D S C I E N C E
Vol. 19 (2010): 96–100.
99
Hillier Jon, University of Aberdeen, United King-dom
Holm-Nielsen Jens Bo, University of Aalborg, Denmark
Honermeier Bernd, University of Giessen, Ger-many
Hyytiäinen Kari, MTT Agrifood Research Fin-land, Finland
Hyvönen Lea, University of Helsinki, FinlandIgnaciuk Adriana, Wageningen University and Re-
search Centre, The NetherlandsIlmakunnas Pekka, Helsinki School of Econom-
ics, FinladJaakkola Laura, University of Oulu, FinlandJaakkola Seija, University of Helsinki, FinlandJalli Marja, MTT Agrifood Research Finland,
FinlandJeliazkov Valtcho, Mississippi State Universi-
ty, USAJeppesen Leif Lau, University of Copenhagen,
DenmarkJokinen Kari, University of Helsinki, FinladJonsson Håkan, Swedish University of Agricultur-
al Sciences, SwedenJouppila Kirsi, University of Helsinki, FinlandJørgensen Lise Nistrup, Danish Institute of Agri-
cultural Sciences, DenmarkKadziuliene Zydre, Lithuanian Institute of Agri-
culture, Lithuania Kalendar Ruslan, University of Helsinki, FinlandKic Pavel, Czech University of Life Sciences,
Czech RepublicKirchmann Holger, Swedish University of Agri-
cultural Sciences, SwedenKorpelainen Helena, University of Helsinki, Fin-
landLambardi Maurizino, National Research Council
of Italy, ItalyLampi Anna-Maija, University of Helsinki, Fin-
landLawson Lartey Godwin, University of Copenha-
gen, DenmarkLehtonen Heikki, MTT Agrifood Research Fin-
land, FinlandLien Gudbrand, Norwegian Agricultural Econom-
ics Research Institute, NorwayLindroos Marko, University of Helsinki, Finland
Loponen Jussi, University of Helsinki, FinlandMathijs Erik, Katholieke Universiteit Leuven,
BelgiumMcKinnon John, College of Agriculture and Bi-
oresources, CanadaMoll Henri, University of Groningen, The Neth-
erlandsMonni Suvi, European Commission, Joint Re-
search Centre, ItalyMul Monique, Wageningen University and Re-
search Centre, The NetherlandsMyyrä Sami, MTT Agrifood Research Finland,
FinlandMøller Steen Henrik, Danish Institute of Agricul-
tural Sciences, DenmarkNadeau Elisabet, Swedish University of Agricul-
tural Sciences, SwedenNarits Lea, Jõgeva Plant Breeding Institute, Es-
toniaNavickas Kestutis, Lithuanian Institute of Agri-
culture, LithuaniaNiemi Jarkko, MTT Agrifood Research Finland,
FinlandNyborg Åge, Norwegian Forest and Landscape In-
stitute, NorwayNadeau Elisabet, Swedish University of Agricul-
tural Sciences, SwedenNaylor Robert, University of Aberdeen, United
KingdomOehlenschlaeger Joerg, Federal Research Institute
for Nutrition and Food, GermanyO’Kiely Pádraig, Grange Beef Research Centre,
IrelandOude Lansink Alfons, Wageningen University and
Research Centre, NetherlandsOygarden Lillian, Norwegian Centre for Soil and
Environmental Research, NorwayPalander Samu, Seinäjoki University of Applied
Sciences, FinlandPanis Bart, Katholieke Universiteit Leuven, Bel-
giumPartanen Kirsi, MTT Agrifood Research Finland,
FinlandPeltonen Jari, Agrimedia Oy, FinlandPeltonen-Sainio, MTT Agrifood Research Fin-
land, FinlandPeoples Mark, CSIRO Plant Industry, Australia
A G R I C U L T U R A L A N D F O O D S C I E N C E
Vol. 19 (2010): 96–100.
100
Steenfeldt Sanna, Aarhus University, DenmarkStoumann Jensen Lars, University of Copenha-
gen, DenmarkSumelius John, University of Helsinki, FinlandSutinen Marja-Liisa, Finnish Forest Research In-
stitute, FinlandSontag-Strohm Tuula, University of Helsinki,
FinlandTapio Petri, Turku School of Economics, FinlandTietje Hendrik, Federal Statistical Office, GermanyTrnka Mirek, Mendel University of Agriculture
and Forestry in Brno, Czech Republic Trombetta Maria Federica, Polytechnical Univer-
sity of Marche, ItalyTörmä Hannu, University of Helsinki, FinlandJarmo Valaja, MTT Agrifood Research Finland,
FinlandValtcho Jeliazkov, Mississippi State North MS Re-
search & Ext Center, USAVestergaard Mogens, Aarhus University, DenmarkVilkki Johanna, MTT MTT MTT Agrifood Re-
search Finland, FinlandVirkajärvi Perttu, MTT Agrifood Research Fin-
land, FinlandVärnik Rando, Estonian University, EstoniaWall Helena, Swedish University of Agricultural
Science, SwedenWeightman Richard, ADAS, United KingdomWhite Philip, Scottish Crop Research Institute,
United KingdomYli-Halla Markku, University of Helsinki, Finland
Pietola Liisa, Yara Finland, FinlandPritchard Hugh, Royal Botanic Gardens Kew, Unit-
ed KingdomPuolanne Eero, University of Helsinki, FinlandRankinen Katri, Finland’s environmental admin-
istration, FinlandRantamäki-Lahtinen Leena, MTT Agrifood Re-
search Finland, FinlandRinne Marketta, MTT Agrifood Research Fin-
land, FinlandRomero Carlos, Forestry School, SpainRuusunen Marita, University of Helsinki, FinlandRønning Lars, Nordland Research Institute, Nor-
waySaarela Into, MTT Agrifood Research Finland,
FinlandSalo Tapio, MTT Agrifood Research Finland,
FinlandSaloniemi Hannu, University of Helsinki, FinlandSalovaara Hannu O., University of Helsinki, Fin-
landSaris Per, University of Helsinki, FinlandSarkadi Livia, Hungarian Academy of Sciences,
HungarySchau Erwin M., Norwegian University of Science
and Technology, NorwaySeidler Christina, International Graduate School
of Zittau, GermanySkjelvåg Arne Oddvar, Norwegian Forest and
Landscape Institute, NorwayStarast Marge, Estonian University of Life Sci-
ences, Estonia
Vol. 19, 1 (2010) 1-517AG
RIC
ULTU
RAL AN
D FO
OD
SC
IEN
CE
The Scientific Agricultural Society of Finland
MTT Agrifood Research Finland www.mt t .fi /a fs
AGRICULTURAL AND FOOD SCIENCE
A G R I C U L T U R A L A N D F O O D S C I E N C EVol. 19, No. 1, 2010
ContentsP l a n t a n d S o i l S c i e n c eLindqvist, I., Lindqvist, B., Tiilikkala, K., Hagner, M. and Penttinen, O.-P.
Birch tar oil is an effective mollusc repellent: field and laboratory experiments using Arianta arbustorum (Gastropoda: Helicidae) and Arion lusitanicus (Gastropoda: Arionidae)
1
Hagner, M., Pasanen, T., Lindqvist, B., Lindqvist, I., Tiilikkala, K., O.-P., Pent-tinen and Setälä, H.
Effects of birch tar oils on soil organisms and plants 13
Hagner, M., Penttinen, O.-P., Pasanen, T., Tiilikkala, K. and Setälä, H.
Acute toxicity of birch tar oil on aquatic organisms 24
Sooväli, P. and Koppel, M. Efficacy of fungicide tebuconazole in barley varieties with dif-ferent resistance level
34
Tamm, K., Võsa, T., Loko, V., Kadaja, J., Vettik, R. and Olt, J.
The impact of distance to the farm compound on the options for use of the cereal plot
43
Pradhan, S. K., Pitkänen, S. and Heinonen-Tanski, H.
Fertilizer value of urine in pumpkin (Cucurbita maxima L.) cultivation
57
Ochmian, I., Grajkowski, J. and Skupień, K.
Effect of substrate type on the field performance and chemical composition of highbush blueberry cv. Patriot
69
Väre, M., Pietola, K. and Weiss, C.R. The irrelevance of stated plans in predicting farm successions in Finland
81
Contents Vol. 18 (2009)
Aknowledgements of referees
96
98
ISSN e lec t ronic ed i t ion 1795-1895
V o l . 1 9 , N o . 1 , 2 0 1 0
A g r i c u l t u r a l E c o n o m i c s
A g r i c u l t u r a l E n g i n e e r i n g
A n i m a l S c i e n c e
E n v i r o n m e n t a l S c i e n c e
F o o d S c i e n c e
H o r t i c u l t u r e
P l a n t a n d S o i l S c i e n c e

A G R I C U L T U R A L A N D F O O D S C I E N C E
Vol. 19(2010): 1–12.
1
© Agricultural and Food Science Manuscript received March 2009
Birch tar oil is an effective mollusc repellent: field and laboratory experiments using Arianta arbustorum
(Gastropoda: Helicidae) and Arion lusitanicus (Gastropoda: Arionidae)
Isa Lindqvist1*, Bengt Lindqvist1, Kari Tiilikkala1, Marleena Hagner2, Olli-Pekka Penttinen2, Tiina Pasanen2 and Heikki Setälä2
1MTT Agrifood Research Finland, Plant Production Research, Rillitie 1, FI-31600 Jokioinen, Finland,*e-mail: [email protected]
2Department of Ecological and Environmental Sciences, University of Helsinki, Niemenkatu 73, FI-15140 Lahti, Finland
Populations of two molluscs, the land snail Arianta arbustorum and the Iberian slug Arion lusitanicus, have increased substantially in many places in the northern Fennoscandia in recent years. This has resulted in considerable aesthetic and economic damage to plants in home gardens and commercial nurseries. Birch tar oil (BTO), is a new biological plant protection product, and was tested against these molluscs. In this study we examined whether 2 types of BTO, used either alone, mixed together, or mixed with Vaseline®, could be applied as 1) a biological plant protection product for the control of land snails by direct topical spray application, 2) as a repellent against snails when painted on a Perspex® fence, and 3) as a repellent against slugs when smeared on pots containing Brassica pekinensis seedlings. Both the fences and the pots with seedlings were placed in each field with a high population of the target organism.When applied as a spray on snails, BTO did not act as a toxic pesticide but rendered the snails inactive for a period of several months. The BTO barriers were effective in repelling both snails and slugs. However, the repellent effect of BTO alone against the molluscs was short-term. Repeated treatments were required to keep the slugs away from the plants and we found that the interval between treatments should not exceed two weeks. A collar fastened around the rim of the pots, combined with the BTO treatment, did not give any additional benefit in hindering slugs from invading the plants. Most noticeably, the BTO+Vaseline® mixture prevented the land snails from passing over the treated fences for up to several months. The results of these experiments provide evidence that BTO, especially when mixed with Vaseline®, serves as an excel-lent long-term repellent against molluscs.
Key-words: birch tar oil, biocontrol, biological plant protection product, Arianta arbustorum, Arion lusi-tanicus, land snail, Spanish slug, Iberian slug, repellent, mollusc.

A G R I C U L T U R A L A N D F O O D S C I E N C E
Lindqvist, I. et al. Birch tar oil as a repellent
2
A G R I C U L T U R A L A N D F O O D S C I E N C E
Vol. 19(2010): 1–12.
3
Introduction
Birch oil distillate or birch tar oil (BTO), is a by-product of processing birch (Betula sp.) wood to produce charcoal. Although anecdotal evidence in Finland suggests that BTO has been an effective repellent against burrowing rodents and moose, the use of BTO as a biological plant protection product or biocide is a new innovation. However, due to its novelty as a repellent and because of the chemical complexity of BTO, no comprehensive informa-tion on the active compounds of BTO is available. Preliminary analyses suggest phenols, comprising 20–30% of BTO (Czernik 2002), are among the most interesting compounds of BTO having a repellent effect on molluscs (Hagner 2005), but various other volatile compounds can also play a role. Among the phenolic compounds, cresols, allylphenol, guaiacol, 4-methyl- and 4-ethyl guaiacol, eugenol, isoeugenol, vanillin, and ethylvanillin have been identified in birch biomass pyrolysis (Murwanashyaka et al. 2002). Despite its potential value as a biological plant protection product, we are aware of only one publication in which the applicability of birch/pine oil has been tested as a repellent against mosquitoes (Thorsell et al. 1998).
This study focuses on two molluscs, the land snail Arianta arbustorum L. (Gastropoda: Helici-dae) and the Iberian slug Arion lusitanicus Mabille (Gastropoda: Arionidae). The species A. arbusto-rum belongs to the local snail fauna in Finland, but before 1990 its distribution was restricted to the southern coast of Finland with some sporadic establishments in fertile deciduous forests in the northern part of Finland (Terhivuo 1978, Valovirta and Heino 1994). In recent years the snail has in-creased its distribution dramatically in many urban/semi-urban areas in southern and central Finland. The species A. lusitanicus is a major pest of Euro-pean horticulture and a newcomer to Fennoscandia (Weidema 2006). Originally from the Iberian Pe-ninsula, A. lusitanicus reached the Åland Islands in Finland in 1990 and it is now widely distributed from the west coast to the south-eastern areas of the country (Valovirta 2001). The northernmost popu-lation was found in Oulu (65 02’ N; 25 31’ E) in
2005 (Valovirta personal communication). Despite its southern origin the slug has established itself in Finland’s northern climate and Fennoscandia (Hofsvang and Haukeland 2006), highlighting the ability of eggs and immature stages to acclimatize to the cold. The distribution of A. lusitanicus or other Arion slugs has not been studied in Finland, but the occurrence of A. circumscriptus (Johnston), A. fasciatus (Nilsson), and A. fuscus (O.F. Müller) [syn. Arion subfuscus (Drap.)] have been reported (Valovirta 1968).
Both A. arbustorum and A. lusitanicus are omnivorous, feeding on a wide range of living and dead plant material, mushrooms and dead fauna (Hägele and Rahier 2001, Valovirta 1964). As these molluscs are hermaphroditic, a popula-tion can begin from a single individual which can produce up to 400 eggs (A. lusitanicus). Although the distribution is still sporadic in Finland, it is not uncommon to find hundreds of individuals of A. arbustorum per square meter. Both species have spread with an alarming rate, often by the trade of produce and plants. As such, these molluscs have rapidly become an increasing problem with severe impacts, particularly in home gardens (Speiser and Rowell-Rahier 1991, Valovirta 2001). A. lusitani-cus also threatens larger professional horticultural operations and would have serious economic conse-quences in, for example, fields with perennial crops.
Control of A. arbustorum and A. lusitanicus has hitherto been tedious, usually collecting and killing being the most common methods in home gardens. To some extent, chemical control is useful but can be harmful to other organisms and ecosystems. Methiocarb (Mesurol), for example, is one of the two pesticides currently permitted for use as a mol-luscicide in Finland, is known to pose a threat to non-target biota (Purvis and Bannon 1992, Shore et al. 1997) and to ground waters (Garcia de Llasera and Bernal-Gonzáles 2001). Of the less harmful methods of chemical control, iron phosphate (Fer-ramol) has been effective against species of slugs and is relatively non toxic (Procop 2005). How-ever, high numbers of iron phosphate pellets may increase earthworm mortality (Langan and Shaw 2006). Biological control using the nematode Phas-marhabditis hermaphrodita Schneider (Nematoda:

A G R I C U L T U R A L A N D F O O D S C I E N C E
Lindqvist, I. et al. Birch tar oil as a repellent
2
A G R I C U L T U R A L A N D F O O D S C I E N C E
Vol. 19(2010): 1–12.
3
Rhabditidae), has been successfully used, not only against slugs (Grimm 2002), but also to some extent against snails (Coupland 1995). Grimm (2002) and Speiser et al. (2001) also reported that this nema-tode only killed immature stages of the slug A. lusi-tanicus. This is in agreement with the results from a small-scale experiment conducted at MTT Agrifood Research Finland. (MTT pesticide efficacy studies 2005, unpublished data). Consequently, the possi-ble repelling effect of BTO on A. arbustorum and A. lusitanicus warrants further investigations to complement the current methods of control used in horticultural operations and home gardens.
This study is part of a larger research programme in which the effects of BTO as a molluscicide (the current study) and their ecotoxicological effects on both terrestrial (Hagner et al. 2010a) and aquatic (Hagner et al. 2010b) organisms were investigated. Here we aimed at 1) studying the toxic effect of BTO on populations of A. arbustorum in the labo-ratory by direct spray application, 2) exploring the efficacy of the distillate to repel A. arbustorum outdoors when painted on a Perspex® fence, and 3) demonstrating the repelling effect (and duration) of a BTO barrier in a field with a high frequency of A. lusitanicus.
Material and methods
Birch tar oil (BTO)Two types of BTO from pyrolysed birch wood and bark were supplied by Charcoal Finland Ltd.: BTO1, a more soluble form resulting from the early phase of the distillation process i.e. at temperatures less than 380 oC, and a viscous form (BTO2) resulting at the end of the process when the temperature reaches 400 oC. A mixture (BTOm) of the two forms was also used in the experiments. Birch tar oil (BTO) has been assigned with a CAS number (8001-88-5) in the worldwide substance database (American Chemical Society 2007). Thus the same abbreviation, BTO, has been used for the closely related product in our studies.
Experiment 1: Toxic effect of BTOs on A. arbustorum – direct spray application
Experimental setupAn experiment using different ages (adults, eggs and the newly hatched young) of the snails was established as a laboratory study at the Department of Ecological and Environmental Sciences in summer 2003. Both BTO1 and BTO2 were tested. The snails were col-lected close to the Departmental building in the city of Lahti, Southern Finland. Adult snails were allowed to reproduce in 1.7 l glass jars (Ø 10 cm, height 19 cm) containing a soil monolith (4 cm thick), and covered with gauze. Fresh food consisting of carrot, lettuce and earthworms was given to the snails twice a week. Maturity of the adult snails was determined by the thickened outer lip framing the aperture of the shell (Baur and Raboud 1988, Raboud 1986, Terhivuo 1978). The jars were kept outdoors under natural light and temperature conditions. The eggs laid by the snails were removed daily, placed into glass jars with moist soils and kept in the fridge (+5 oC) before the start of the experiment. After two months there were sufficient numbers of eggs to conduct the experiment.
Toxicity bioassayThe experiment was performed in 1.7 l glass jars with a soil monolith (3 cm thick) growing Trifolium repens, Festuca pratensis and Taraxacum officinale. Four mature snails and about 55–65 eggs were placed on the soil in each jar. Three treatments, each with 5 replicates, were established: 1) jars sprayed once with BTO1 (0.5 dl m–2; the amount equalling 500 l ha–1), 2) jars sprayed with BTO2 (0.5 dl m–2) and 3) jars sprayed with equal amount of water (control). The containers were covered with gauze and kept at 20 oC under a 16:8 h light:dark cycle. During the experiment, the snails were fed twice a week with fresh carrots, lettuce and leaves of T. officinale and T. repens. Fresh water was sprayed weekly in the jars to maintain favourable moisture conditions for the snails. Hatching of the eggs and movement of the adult snails were observed weekly. After three months the snails were removed to clean jars with fresh plant material to activate and check the survival of the snails. The following day the number of surviving snails was recorded.

A G R I C U L T U R A L A N D F O O D S C I E N C E
Lindqvist, I. et al. Birch tar oil as a repellent
4
A G R I C U L T U R A L A N D F O O D S C I E N C E
Vol. 19(2010): 1–12.
5
Experiment 2: Repellent effect of BTO2 on A. arbustorum - Perspex® fence barrier
Experiment 2.1 – Snails inside the fencesTransparent Perspex® fences (height 40 cm, area 0.74 m2), partly buried in the soil (3 cm deep), were constructed in mid June 2005. The fences were established in five home yards containing grassy vegetation, in the city of Lahti. The fences received four treatments, each with three to five rep-licates, fenced areas: 1) without Vaseline® or BTO2 (control; n=4); 2) receiving Vaseline® only (n=3); 3) with BTO2 only (n=5); and 4) with a mixture of Vaseline® and BTO2 (n=5). The Vaseline®, the BTO2, and the mixture of BTO2+Vaseline® (40/60, v/v.), was spread using a brush on the outer upper side of the walls to form a 10 cm wide barrier. The upper 5 cm of the fence was bent so as to form “a rain shadow” for the area at which the repellent was applied. Spreading of the smears was done only once at the start of the study. The next day, 50 snails were placed into each fenced area. The study lasted for 38 days and within this time, the number of snails in the fenced areas were monitored at 1, 4, 6, 8, 11, 14, 18, 21, 28, 36 and 38 days after initiation of the study.
Experiment 2.2 – Snails outside the fencesThe set up of experiment was identical to the Experiment 2.1 described above except that no snails were added to the fenced areas. The experi-ment was conducted in the city of Lahti in a fertile fallow meadow growing tall herbs, grasses and some deciduous trees. The study was conducted from late July to early September in 2005. The A. arbustorum population in the area was >10 adults
m–2 (visual assessment). Naturally occurring snails were removed from the fenced areas at the start of the study. Three treatments, each with 2 to 4 rep-licates, were established: 1) fenced areas without Vaseline® or BTO2 (control; n=2); 2) Vaseline® only (n=2); and 3) a mixture of Vaseline®+BTO2 (n=4). Spreading of the smears on the outer upper side of the walls was carried out only once at the onset of the study. After removing all the snails, pieces of carrot were placed inside the fence to attract snails
into the fenced area. The study lasted for 42 days within which time the entrance of snails into the fenced area was monitored at 3, 6, 9, 18 and 42 days after initiation of the study. During the first month the snails were removed from the systems at every inspection, after which, the snails that entered the systems were left untouched. One control and one BTO2+Vaseline® treated fence were left in the meadow over winter. In the following summer, the entrance of snails into the fenced area was moni-tored five times.
The weather during Experiments 2.1 and 2.2 (mid June to early September) was variable with heavy rains (collective rainfall during the study 271 mm) to periods of dry and warm weather (average temperature 15 ºC; Finnish Meteorological Insti-tute).
Experiment 3: The repelling effect of a BTOm barrier against A. lusitanicus
Experimental set up The experiment was established at MTT Agrifood Research Finland, Jokioinen, in 2005. The field area (4.5 × 42 m) was surrounded by glasshouses on both long sides. One of the short ends was bounded by the storehouse and the other end was separated from the main field by a 50 cm high tin plate treated with BTO to prevent slugs from escaping. The field veg-etation consisted mainly of Elymus repens, Trifolium repens and Taraxacum officinale. The vegetation was left to grow wild except for a mowed strip (1.20 m wide) in the middle of the area to facilitate moving without crushing the slugs (Fig. 1).
Slug populationA. lusitanicus were originally collected in 2001 from Åland and transported to Jokioinen for the purpose of testing pesticides. The slugs were reared and contained outdoors in a secured grassy field area. Within four years the population had developed from a few individuals in the area into approximately 20–100 individuals m–2, the density varying in different parts of the field according to the weather and vegetation. Some naturally occurring

A G R I C U L T U R A L A N D F O O D S C I E N C E
Lindqvist, I. et al. Birch tar oil as a repellent
4
A G R I C U L T U R A L A N D F O O D S C I E N C E
Vol. 19(2010): 1–12.
5
A. fasciatus (Nilsson) slugs were also found in the experimental field and included in the experiment.
Test plantsChinese cabbage seedlings, Brassica pekinensis var. Yamiko, were produced in the glasshouse and grown in 1.5 l black plastic pots containing com-mercially available horticultural peat (Kekkilä: N-P-K 14-4-20). At the end of June the plants were placed outdoors in the experimental field. Strips of irrigation-mat (40 × 40 cm) were placed on the mowed strip of grass and the pots were centred on the mats at a distance of one meter from each other. Automatic drip irrigation was used to keep the irrigation mat constantly wet.
The experiment was designed on information and experiences from a preliminary field trial ar-ranged in the same way. The experiment was com-pletely randomized with four replicates. The use
of irrigation-mats prevented grass from reaching the pots and creating passage ways for the slugs to cross the BTO barrier. Splashing of rainwater with soil on the treated surface of the pots was also reduced, which minimized any further possibility of access to the potted plants.
TreatmentsThe experiment consisted of 24 pots, half of which were equipped with a plastic collar, 3 cm in breadth, fastened around the rim of the pots to prevent the washing effect by raindrops. A mixture (BTOm) of BTO1 and BTO2 (30/70, v/v) was painted evenly on the whole outer surface of the pots. The pots received six treatments (completely randomized design), each with four replicates: 1) pots without collar and repellent (control), 2) pots without collar but with repellent (BTOm × 2) applied twice (fort-nightly), 3) pots without collar and with repellent (BTOm × 4) applied four times (weekly), 4) pots with collar but no repellent, 5) pots with collar and with repellent (collar + BTOm × 2) applied twice (fortnightly), 6) pots with collar and with repellent (collar + BTOm × 4) applied four times (weekly). The weekly and fortnightly treatments with BTOm started on the first day of the experiment, which extended from 23 of June to 8 of August. A bird-net was put up over the entire field to prevent thrushes from eating the slugs.
Data collectionThe plants were checked in the morning on a daily basis for the duration of the study. The number of slugs entering the pots and accessing the plants were counted and then placed back into the field outside the grass strip of the experiment. At the same time, all old cabbage leaves hanging over the pot rims were removed. The damage to the plants caused by the slugs was estimated by visual assessment as a percentage of the damaged leaf area (Fig. 2). Ob-servations from the first 35 days covered the period of BTOm treatments. The second part of the study, the follow-up period, monitored the duration of the repellent effect of BTOm on the slugs after day 35. Observations were made until it could be verified that slugs had entered all treatments.Climate conditions during the study
Fig. 1. Experiment 3. The experimental area was situated in the middle of a small field with slugs and surround-ed by glasshouses.

A G R I C U L T U R A L A N D F O O D S C I E N C E
Lindqvist, I. et al. Birch tar oil as a repellent
6
A G R I C U L T U R A L A N D F O O D S C I E N C E
Vol. 19(2010): 1–12.
7
The experimental area was surrounded by green-house walls on two sides making the area less exposed to normal weather conditions than in an open field. Subsequently, the area received more rainfall due to runoff from the greenhouse roofs. Compared to data from the local weather station (Fig. 3) the total rainfall in the experimental area was approximately three times higher than in the open field. Temperature changes in the pots during the experiment were equivalent with those in an overturned black plastic pot on the ground where the temperature was monitored by a data-logger (CelciPick CK-39/+75 °C ).
Statistical analysis of all experimentsStatistical analyses were performed using the SPSS 10.0 statistical software (SPSS 1999). To examine the differences in the amount of adult and newly hatched young snails between the treatments in Experiment 1, analysis of variance (one-way ANOVA) was conducted. In Experiment 2.1 and Experiment 3, ANOVA for repeated measurements was used. Data from Experiment 2.2 was analyzed by non-parametric 2-way Kruskall-Wallis analysis (Ranta et al. 1989) with time and distillate treat-ment as factors. In Experiment 3, only data from observations in the period of BTO treatments were statistically analysed.
Results
Toxic effect of BTOs on A. arbustorum - direct spray application
The results of the laboratory study (Experiment 1) proved BTOs to be ineffective in eliminating snails; neither BTO1 nor BTO2 had a statistically signifi-cant effect on the survival of adult snails (ANOVA, F=1.68, p=0.226) (Fig. 4). The snails excreted extensive amounts of slime directly after spraying of BTOs and aimed at escaping from the jars. On day 2, all adult snails in the BTO1 and BTO2 treated jars were inactive and a slime plug excretion was observed in the front aperture of the shell. The eggs started to hatch one week after initiation (and spray-ing) of the study in all treatments with BTOs having no clear effects on the number of hatched eggs, the activity, or survival of the young snails. During the 3-month study period, most adult snails in the BTO1 and BTO2 treated systems remained passive while those in the control treatments were active. After being removed to jars with fresh food at the end of the study, almost all adults, irrespective of the treatment, were still alive. The data was not always normally distributed and the variances were some-times heterogenous, even after data transformation.
Fig. 2. Experiment 3. The number of Arion lusitanicus slugs in pots were counted and the leaf area damage was estimated. Treatment 4) pot with collar but no birch tar oil mixture (BTOm).
0102030405060708090
100
23.6. 27.6. 1.7. 5.7. 9.7. 13.7. 17.7. 21.7. 25.7. 29.7. 2.8. 6.8.
Dates
Rainfall (mm d-1) and temperature (oC)
Fig. 3. Experiment 3. Rainfall (mm d-1) and temperature (oC) in the enclosed experimental area based on informa-tion from the local weather station at Jokioinen. Bars indi-cate the rainfall and the shaded area indicates the temper-ature. The excess water runoff from greenhouse roofs tri-pled the amount of water received in the experimental area.

A G R I C U L T U R A L A N D F O O D S C I E N C E
Lindqvist, I. et al. Birch tar oil as a repellent
6
A G R I C U L T U R A L A N D F O O D S C I E N C E
Vol. 19(2010): 1–12.
7
Repellent effect of BTO2 on A. arbusto-rum - Perspex® fence barrier
In the field enclosure study (Experiment 2.1), BTO2 displayed a clear repelling influence on the A. arbustorum. The day after placing the snails in the fenced systems, it was found that only 20 % remained in the control systems, while all individu-als were still present in the systems painted with the Vaseline®+BTO2 - mixture. Both BTO2 and Vaseline® alone repelled the snails to some extent (repeated measures ANOVA, p=0.000), but these effects were short-term and less effective when com-pared to the results produced by the Vaseline®+BTO2 - mixture (repeated measures ANOVA, p=0.000) (Fig. 5). Data from Experiment 2.1 was not always normally distributed and the variances were some-times heterogeneous, even after data transformation. The data was log10-transformed due to the high variation of snail densities in the controls and in the treatment with Vaseline® only. Although this did not normalize the data completely, ANOVA for repeated measurements using log10-tansformed values was applied. We were interested in the BTO induced temporal patterns in the field studies. Therefore a repeated-measures (not available in non-parametric test packages) model was considered to be the most appropriate form of analysis. The fact that data
transformation did not improve the data, warrants caution when interpreting the data.
The results from Experiment 2.2 support those obtained from Experiment 2.1, i.e.that the Vaseline®+BTO2 - mixture was the most effective snail repellent (2-way Kruskal-Wallis, p<0.05) (Fig. 6). This mixture formed an effective barrier preventing all snails from entering the fenced sys-tems up to seven weeks after initiating the study, whereas in the control fences, between two and six snails were found at every inspection. As was seen in Experiment 2.1, Vaseline® alone also seemed to repel the snails in Experiment 2.2, although the effect was not statistically significant (2-way Krus-kall-Wallis, p>0.05). Unlike in the control and in the Vaseline® treated systems, the carrots remained intact and untouched in the Vaseline®+BTO2 treat-ed systems. Data from Experiment 2.2 was ana-lyzed by a non-parametric 2-way Kruskall-Wallis test (Ranta et al. 1989) with time and distillate treat-ment as factors. The data was not always normally distributed and the variances were sometimes het-erogeneous. Transformations had no effect on data.
The monitoring results (Experiment 2.2) from summer 2006 (one year after the initiation of study), showed that the repelling effect of the BTO2+Vaseline® -mixture remained over winter.
05
101520253035404550
CONTROL
Living snails/jar
BTO1 BTO2
Fig. 4. Experiment 1. The number of living adult and young Arianta arbustorum in the control and treated jars at the end of the study. Soluble (1) and viscous (2) forms of birch tar oil (BTO) were used. Black bars = adult snails, grey bars = young snails (<3mm). Mean values + SD, n=5.
Average number of Arianta arbustorumper treated area
05
101520253035404550
1 4 6 8 11 14 18 21 28 36 38Time after treatment
Fig. 5. Experiment 2.1. The number of Arianta arbusto-rum (mean values + SD) found inside the differently treat-ed fences at different times. At day zero, 50 adult snails were placed inside the fenced areas. Control (black line); Vaseline® (green line with squares); viscous birch tar oil (BTO2) (grey line with triangles); BTO2+Vaseline® (blue line with diamonds).

A G R I C U L T U R A L A N D F O O D S C I E N C E
Lindqvist, I. et al. Birch tar oil as a repellent
8
A G R I C U L T U R A L A N D F O O D S C I E N C E
Vol. 19(2010): 1–12.
9
At all five monitoring times during the year 2006, we found >3 snails inside the control fence but no snails from inside the BTO2+Vaseline® treated systems.
The repelling effect of a BTOm barrier against A. lusitanicus
It was found that BTOm effectively repelled A. lusi-tanicus from potted cabbage plants when applied as a protective barrier around plastic pots (Experiment 3). Upon reaching the BTOm barrier on the plastic pots, the slugs shrank away immediately before coming in contact with the smear. The slugs were strongly attracted to the cabbages and tried repeat-edly, but unsuccessfully, to find a way to cross the BTOm barrier.
The first part of the study clearly showed that treatment of pots with BTOm significantly reduced the amount of damage on the cabbage plants (re-peated measures ANOVA, p=0.000), which were almost left untouched (Fig. 7). The plants in the control pots were completely consumed 18 days after start of the experiment (Fig. 8). Figure 8 also shows that the collar alone did not have any hin-
dering effect on leaf damage caused to the plants (repeated measures ANOVA, p=0.527). This was further highlighted by the lack of interaction be-tween the collar and the BTOm treatments. Inter-estingly, there was no difference in the repelling effect between the weekly and fortnightly applica-tions. The data was normally distributed and the variances were homogenous.
The follow-up period revealed that 21 days af-ter the final BTOm treatment (36 days after start-ing), 12.5% of the leaf area of the plants in the pots treated with BTOm was damaged compared to the total damage in the control pots. As expected, the effect of BTOm in the fortnightly treated pots be-gan to decrease sooner than in the weekly treated pots (Fig. 9). At the end of the experiment, only 7.8% of the leaf area of the plants was damaged in the weekly treated pots with and without collar, compared to 30.1% in the fortnightly treatments. The species A. fasciatus was not found in the treat-
Average number of Arianta arbustorumper treated area
02468
101214161820
0 10 20 30 40Time after treatment
Fig. 6. Experiment 2.2. The number of Arianta arbus-torum (mean values + SD) found inside the different-ly treated fences at different times. Control (grey line); Vaseline® (black lines with squares); viscous birch tar oil (BTO2)+Vaseline® (blue lines with diamonds).
Fig. 7. Experiment 3. Birch tar oil mixture (BTOm) ef-ficiently prevents Arion lusitanicus from reaching the plants when applied as a protective barrier outside the pots (July 25). Treatment 2) no collar + BTOm fortnight-ly application. The photo was taken 19 days after paint-ing with the BTOm.

A G R I C U L T U R A L A N D F O O D S C I E N C E
Lindqvist, I. et al. Birch tar oil as a repellent
8
A G R I C U L T U R A L A N D F O O D S C I E N C E
Vol. 19(2010): 1–12.
9
indicates that the food source, also receiving BTO spray, of the snails remained repellant for a long time. It should be noted that the inactivating effect of BTOs on snails in the field would be shorter as the effect of BTOs is likely to be reduced by rain and UV. However, BTO could still be useful in IPM strategies, where the aim is not always to kill insect pests, but rather to prevent yield losses. Yield losses may be possible to be reduced by the inactivating effect of BTO on snails. Furthermore, a relatively long time of inactivity is bound to affect the fecundity and fertility of A. arbustorum which is likely to have a negative impact on the population densities of the snails.
Repellent effect of BTO against slugs and snails
The results clearly showed that BTO exhibited a repellent effect against A. arbustorum and A. lusi-tanicus in confined areas heavily infested with these molluscs. BTO2 indisputably showed high potential as a mollusc repellent against A. arbustorum given
0
20
40
60
80
100
0 7 11 13 14 15 18 19 21 27 28 29 30 31 32 33 34 35Days from start of experiment
Leaf damage (%)
Control BTOm x 2 BTOm x 4Collar Collar + BTOm x 2 Collar + BTOm x 4
Fig. 8. Experiment 3. Percent leaf damage (mean values ± SD) of potted Brassica pekinensis by Arion lusitani-cus in the control and birch tar oil mixture (BTOm) treat-ments during the first part of the study. Arrows with a triangle indicate the weekly treatments, and arrows with a circle, fortnightly treatments.
0
5
10
15
20
25
30
35
36 37 38 39 40 41 42 43 44 45 46
Days from start of experiment
Leaf damage (%)
Fig. 9. Experiment 3. Percent leaf damage (mean val-ues) of potted Brassica pekinensis by Arion lusitani-cus in birch tar oil mixture (BTOm) treatments during the follow-up phase. Treatments: weekly in pots with-out collar (triangles) and with collar (circles), fortnightly in pots without collar (squares) and with collar (crossed squares). Untreated control pots were not included in the graph because the plants were completely eaten and the leaf damage could not be estimated.
ed pots and thus the leaf damage was solely caused by A. lusitanicus.
Discussion
Toxic effect of BTOs on A. arbustorum Our preliminary studies (unpublished data) have clearly shown the negative influence of BTOs on the two slug species Deroceras agreste and A. lusitanicus: BTO1 sprayed over land areas grow-ing grasses and herbs resulted in the death of these molluscs soon after spraying. However, as was clearly shown in the current study, the mortality effect of BTOs against snails was low. Furthermore, the eggs and the newly hatched juveniles with a fragile shell also survived the spraying. The results suggest that shells of the snails, irrespective of their age, provide these organisms an efficient shelter against substances that are seemingly toxic to other molluscs. The slime plug excreted by the snails in the frontal aperture further enhances their survival under unfavourable, even hostile conditions. That the adult snails became temporarily inactive for a period of three months after the BTO treatments

A G R I C U L T U R A L A N D F O O D S C I E N C E
Lindqvist, I. et al. Birch tar oil as a repellent
10
A G R I C U L T U R A L A N D F O O D S C I E N C E
Vol. 19(2010): 1–12.
11
that none of the snails crossed the BTO2+Vaseline® barrier of the fenced systems during the 43-day experiment. However, repeated applications of the cabbage pots over a period of several weeks were required to maintain the repellent mode of action against A. lusitanicus. In doing so, the concentra-tion of the active constituents was maintained at a level high enough to prevent slugs from crossing the BTOm barrier. Weekly treatments with BTOm provided the best protection against slugs, as it took them more than three weeks after the last treatment to enter the pots. Moreover, the interval between the treatments should preferably not exceed two weeks, which seem to be the critical point for the BTOm barrier to start breaking down. Unexpect-edly, the pot collar, intended to protect the BTOm barrier from rain and sunshine, did not improve the repelling effect. Rather, it was more relevant to keep the outside of the pots free from dirt and grass as the slugs avoided the BTOm barrier provided it was clean. The large individuals of A. lusitanicus, which are the most active and able to travel long distances (Grimm and Schaumberger 2002), were also found in the pots with collars.
According to the results in Experiment 2 with A. arbustorum, it can be assumed that BTO mixed with a greasy substrate such as Vaseline® could ex-tend the repelling effect against A. lusitanicus as well. Although the mechanism is not yet known, we suggest that Vaseline® prevents BTO2 from drying, thereby retaining the repelling volatiles in the mixture. Vaseline® can also prevent the water-soluble compounds from dissolving and leaching out under heavy rain. It seems that Vaseline® alone works as a repellent against snails, although the ef-fect is short-term and far less intense as in BTOs. Whether the repellency of Vaseline®, as a mineral oil based grease, bases on volatiles or its unpleasant physical properties for the snails, remains open.
Interestingly, there appears to be a specific, hitherto unknown, compound or group of com-pounds in the BTO that acts as an efficient repellent to both slugs (unpublished data) and snails. These molluscs appear to be able to detect the repellent compounds in BTO by olfaction only at a short distance. When confronted with BTO, the molluscs stop at a distance of approximately 1 cm from the
substrate, and turn around to escape from the obvi-ous unpleasant odour. It is noteworthy to mention that common pine tar (manufacturing process hav-ing similarities to that of BTO) has a similar physi-cal structure and odour to that of BTO, but is far less effective at repelling molluscs when compared to BTO. Where pine tar is concerned, the snails stop by the substrate for a while but then glide over the sticky substrate with slightly increased mucus production (Hagner 2005).
Locomotion of slugs via olfaction cues is a well know phenomenon (Gelperin 1974). Some plant extracts, such as extracts of Saponaria officina-lis and Valerianella locusta, are known to have a similar effect on the behaviour of A. lusitanicus (Barone and Frank 1999). The repelling or attract-ing properties of the specific active compounds in a substance is also connected to the level of concentration in the substance (Clark et al. 1997). Further studies are needed to find out how many treatments, or which concentrations give the best result for protection against molluscs.
Our results indicate that BTO smeared on plas-tic pots, Perspex® fences (or other non-absorbing material), has a definite repellent effect against A. lusitanicus and A. arbustorum. Although shelled molluscs do not appear to be killed by BTOs when directly sprayed, the fact that these distillates re-duced the active period of the snails is likely to reduce the damages brought about this snail in northern latitudes with already a short growing sea-son. To fully understand the effect of BTO on slugs and snails, a thorough investigation of the chemical composition of BTO is required. This information will enable the better selection of the most effective type of BTO for control of molluscs. Furthermore, although BTO is included in the worldwide sub-stance database, knowledge of its chemical com-position is also essential for EU registration and future use as a biological plant protection product.
To conclude, our studies give strong evidence on the potential of BTOs to be applied as an effec-tive, non-costly, easy-to-use, and an environmen-tally friendly (Hagner et al. 2010a, 2010b) method against molluscs. As biological plant protection methods are needed to compensate for the poten-tially harmful and decreasing range of chemical

A G R I C U L T U R A L A N D F O O D S C I E N C E
Lindqvist, I. et al. Birch tar oil as a repellent
10
A G R I C U L T U R A L A N D F O O D S C I E N C E
Vol. 19(2010): 1–12.
11
molluscicides, this method could be a useful contri-bution as an alternative pest management strategy not only in home gardens, but also to some extent in organic farming practices and IPM strategies.
Acknowledgements. The authors are grateful to the Finnish Ministry of Agriculture and Forestry for the financial sup-port of our studies on renewable biomaterials. We also wish to thank Asko Riihelä from the Lahti Region Environmental Service for finding suitable snail study experimental sites. We warmly thank all the people who gave us permission to conduct experiments in their home yards.
ReferencesAmerican Chemical Society 2007. Homepage. Cited 29
June 2009. Updated 19 June 2009. Available on the in-ternet: http://www.cas.org/expertise/cascontent/registry.
Barone, M. & Frank, T. 1999. Effects of plant extracts on the feeding behaviour of the slug Arion lusitanicus. An-nals of Applied Biology 134: 341–345
Baur, B. & Raboud, C. 1988. Life history of the land snail Arianta arbustorum along an altitudinal gradient. The Journal of Animal Ecology 57:71–87.
Clark, S.J., Dodds, C.J., Henderson, I.F. & Martin, A.P. 1997. Bioassay for screening material influencing feeding in the field slug Deroceras reticulatum (Müller) (Mollus-ca: Pulmonata). Annals of Applied Biology 130: 379–385
Coupland, J.B. 1995. Note: Susceptibility of Helicid snails to isolates of the nematode Phasmarhabditis hermaph-rodita from Southern France. Journal of Invertebrate Pa-thology 66: 207–208.
Czernik, S. 2002. Environment, health and safety. In: Bridgewater A.V. (Ed.). Fast Pyrolysis of Biomass, A Handbook, CPL Press, Newbury, UK. p. 115–118
Garcia de Llasera, M. P. & Bernal-Gonzáles, M. 2001. Presence of carbamate pesticides in environmental wa-ters from the northwest of Mexico: determination by liq-uid chromatography. Water Research 35: 1933–1940.
Gelperin, A. 1974. Olfactory basis of homing behaviour in the giant garden slug, Limax maximus. Proceeding of the National Academy Sciences of the United States of America 71: 966–970.
Grimm, B. 2002. Effect of the nematode Phasmarhabdi-tis hermaphrodita on young stages of the pest slug Ari-on lusitanicus. Journal of Molluscan Studies 68: 25–28
Grimm, B. & Schaumberger, K. 2002. Daily activity of the pest slug Arion lusitanicus under laboratory conditions. Annals of Applied Biology 141: 35–44.
Hägele, B. F. & Rahier, M. 2001. Determinants of sea-sonal feeding of the generalist snail Arianta arbusto-rum at six sites dominated by Senecioneae. Oecolo-gia 128: 228–236.
Hagner, M. 2005. Koivutisle torjunta-aineena: vaikutukset lehtokotiloon (Arianta arbustorum) ja maaperään. Mas-
ters thesis. University of Helsinki. Department of Eco-logical and Environmental Sciences. 39 p. (in Finnish)
Hagner, M., Pasanen, T., Lindqvist, B., Lindqvist, I., Tii-likkala, K., Penttinen, O-P. & Setälä, H. 2010a. Effects of birch tar oils on soil organisms and plants. Agricul-tural and Food Science 19: 13–23.
Hagner, M., Pasanen, T., Tiilikkala, K., Penttinen, O-P. & Setälä, H. 2010b. Acute toxicity of birch tar oil on aquat-ic organisms. Agricultural and Food Science 19: 24–33.
Hofsvang, T. & Haukeland, S. 2006. Snegler som skade-dyr på planter. Bioforsk Tema 1: 1–10.
Langan, A.M. & Shaw, E.M. 2006. Responses of the earth-worm Lumbricus terrestris (L.) to iron phosphate and metaldehyde slug pellets formulations. Applied Soil Ecology 34: 184–189.
Murwanashyaka, J.-N., Pakdel, H. & Roy, C. 2002. Frac-tional vacuum pyrolysis of biomass and separation of phenolic compounds by steam distillation. In: Bridge-water A.V. (ed.). Fast Pyrolysis of Biomass, A Hand-book, volume 2. CPL Press, Newbury, UK, p. 407–419.
Procop, A. 2005. Ferramol (Sluggo) – new results of slug and snail control on various crops worldwide. IOBC/WPRS Bulletin 28: 19–23.
Purvis, G. & Bannon, J. W. 1992. Nontarget effects of re-peated methiocarb slug pellet application on carabid beetle (Coleoptera, Carabidae) activity in winter-sown cereals. Annals of Applied Biology 121: 401–422.
Raboud, C. 1986. Age determination of Arianta arbustorum (L.) (Pulmonata) based growth breaks and inner layers. Journal of Molluscan Studies 52: 243–247.
Ranta, E., Rita, H. & Kouki, J. 1989. Biometria. Helsinki University Print. 569 p. (in Finnish)
Shore, R. F., Feber, R. E., Firbank, L. G., Fishwick, S. K., Macdonald, D.W. & Norum, U. 1997. The impacts of molluscicide pellets on spring and autumn populations of wood mice Apodemus sylvaticus. Agriculture, Eco-systems & Environment 64: 211–217.
Speiser, B. & Rowell-Rahier, M. 1991. Effects of food avail-ability, nutritional value, and alkaloids of food choice in the generalist herbivore Arianta arbustorum (Gastrop-oda, Helicidae). Oikos 62: 306–318.
Speiser, B., Zaller, J.G. & Neudecker, A. 2001. Size-specific susceptibility of the pest slugs Deroceras reticulatum and Arion lusitanicus to the nematode biocontrol agent Phas-marhabditis hermaphrodita. BioControl 46: 311–320.
SPSS 1999. SPSS for Windows 10.0, 9.0.1. SPSS Chicago.Terhivuo, J. 1978. Growth, reproduction and hibernation
of Arianta arbustorum (L.) (Gastropoda, Helicidae) in southern Finland. Annales Zoologici Fennici 15: 8–16.
Thorsell, W., Mikiver, A., Malander, I. & Tunon, H. 1998. Efficacy of plant extracts and oils as a mosquito repel-lents. Phytomedicine 5: 311–323.
Valovirta, I. 1964. Porvoon Arianta arbustorum – esiintymä. Luonnon Tutkija 68: 127–128. (in Finnish).
Valovirta. I. 1968. Land molluscs in relation to acidity on hyperite hills in Central Finland. Annales Zoologici Fen-nici 5: 245–253.
Valovirta, I. 2001. Espanjansiruetana – uusi tuholainen Suomessa. Luonnontieteellinen keskusmuseo. Cited November 2007. Updated 2001. Available on the in-ternet: http://www.fmnh.helsinki.fi (tutkimus/eläinmu-seo/selkärangattomat/espanjansiruetana). (in Finnish).
Valovirta, I. & Heino, M. 1994. Maanilviäiset ympäristön

A G R I C U L T U R A L A N D F O O D S C I E N C E
Lindqvist, I. et al. Birch tar oil as a repellent
12
ELOSTUS
Koivuöljytisle karkottaa nilviäiset tehokkaasti Isa Lindqvist, Bengt Lindqvist, Kari Tiilikkala, Marleena Hagner, Olli-Pekka Penttinen, Tiina Pasanen
ja Heikki SetäläMTT ja Helsingin yliopisto
tilan seurannassa. Vesi ja ympäristöhallitus. Helsinki. 56 p. (in Finnish).
Weidema, I. 2006. NOBANIS – Invasive Alien Species Fact
Sheet – Arion lusitanicus. Cited 22 June 2009. Updated 24 March 2006. Available on the internet: http://www.nobanis.org/Factsheets.asp.