Contents Pages - cma.or.ke Unga Group.pdf · To approve the Directors’ remuneration as shown in...
65
Transcript of Contents Pages - cma.or.ke Unga Group.pdf · To approve the Directors’ remuneration as shown in...


1
Contents Pages
Contents 1
Notice of Meeting 2 - 3
Directors’ Profile 4 - 6
Chairman’s Statement 7 - 8
Group Managing Director’s Report 9-10
Corporate Governance 11 - 13
Corporate Social Responsibility 14 - 15
Five Year Financial Review 16
Corporate Information 17
Report of the Directors 18
Statement of Directors’ Responsibilities 19
Independent Auditors’ Report 20
Financial Statements:
Consolidated Statement of Profit or Loss and Other Comprehensive Income 21
Consolidated Statement of Financial Position 22
Company Statement of Financial Position 23
Consolidated Statement of Changes in Equity 24
Company Statement of Changes in Equity 25
Consolidated Statement of Cash Flows 26
Notes to the Financial Statements 27 - 62

2 Annual Report and Financial Statements
Notice of Meeting
NOTICE IS HEREBY GIVEN that the Eighty Sixth Annual General Meeting of the Company will be held at Kenyatta International Conference Centre (KICC), the Amphitheatre, Harambee Avenue, Nairobi, on Thursday, 28 November 2013 at 10.30 a.m. for the following purposes:-
ORDINARY BUSINESS
1. To read the notice convening the meeting.
2. To confirm the minutes of the Eighty Fifth Annual General Meeting held on 5 December 2012.
3. To receive the Chairman’s report.
4. To receive and adopt the Consolidated Audited Financial Statements for the financial year ended 30 June 2013 together with the reports of the Directors and the Auditors therein.
5. To consider and approve a first and final dividend of Kshs 0.75 per share for the year ended 30 June 2013 payable on or about 8 January 2014 to the shareholders on the Register of Members at the close of business on 28 November 2013, and to approve the closure of the Register of Members for one day from the close of business on Thursday, 28 November 2013 to close of business on Friday, 29 November 2013 for the purpose of processing the dividend.
6. Election of Directors:-
a) In accordance with the provisions of Articles 88 and 89 of the Company’s Articles of Association:-
i) Mr Vitalis Ondeke Ojode retires at this meeting and being eligible, offers himself for re-election.
ii) Mr Jinaro Kibet retires at this meeting and being eligible, offers himself for re-election.
b) In accordance with the provisions of Articles 93 of the Company’s Articles of Association:-
i) Mrs Mary Kimotho M’Mukindia retires at this meeting and being eligible, offers herself for re-election.
ii) Mr Patrick O Obath retires at this meeting and being eligible, offers himself for re-election.
7. To approve the Directors’ remuneration as shown in the Financial Statements for the year ended 30 June 2013.
8. To note that Messrs Deloitte & Touche continue in office as Auditors under the provisions of Section 159(2) of the Companies Act and to authorise the Directors to fix their remuneration for the ensuing financial year.
SPECIAL BUSINESS
9. Increase in Authorised Share Capital
To consider, and if thought fit, to pass the following resolution as an Ordinary Resolution:-
“THAT the authorised share capital of the Company be increased, with a view to the acquisition of shares in Ennsvalley Bakery Limited, from Kenya Shillings Four Hundred and Thirteen Million, Eight Hundred Thousand (Kshs 413,800,000.00) divided into 82,760,000 Ordinary Shares of Kenya Shillings Five (5.00) each to Kenya Shillings Five Hundred and Thirty Eight Million, Eight Hundred Thousand.(Kshs 538,800,000.00) divided into 107,760,000 Ordinary Shares of Kenya Shillings Five (Kshs 5.00) each by the creation of 25,000,000 Ordinary Shares of Kenya Shillings Five (Kshs 5.00) each to rank pari passu in all respects with the existing Ordinary Shares in the capital of the Company.”
10. Possible Acquisition of Ennsvalley Bakery Limited and Allotment of Shares
To consider, and if thought fit, to pass the following resolution as an Ordinary Resolution:-
“THAT, for the purposes of paragraph G.06(a) of the Fifth Schedule to the Capital Markets (Securities) (Public Offers, Listing and Disclosure) Regulations (“Disclosure Regulations”) and subject to (i) the passing of the foregoing resolution, (ii) compliance with requirements of the Fourth Schedule to the Disclosure Regulations, (iii) the approval of the Capital Markets Authority, and (iv) any other necessary approvals:
(a) the acquisition of Ennsvalley Bakery Limited as a subsidiary of the Company be and is hereby approved upon such terms and conditions as may be negotiated by the Directors of the Company; and

3Annual Report and Financial Statements
Notice of Meeting
(b) the Directors be and are hereby authorised to allot and issue up to 25,000,000 Ordinary Shares of Kenya Shillings Five (Kshs 5.00) each credited as fully paid as consideration for the aforementioned acquisition.”
11. Sale of the Investment in Bullpak Limited
To consider and if thought fit to pass the following resolution as an Ordinary Resolution:-
“That, for the purposes of paragraph G.06(b) of the Fifth Schedule to the Disclosure Regulations, the Company be and is hereby authorised to dispose of all or part of the investment of Unga Holdings Limited (an indirect subsidiary of the Company) in Bullpak Limited (an indirect subsidiary of the Company) upon such terms and conditions as may be negotiated by the Directors of Unga Holdings Limited. ”
12. Any Other Business of which due notice has been received.
BY ORDER OF THE BOARD
Winniefred N JumbaSECRETARY
24 October 2013
Notes: 1. A member entitled to attend and vote is entitled to appoint
a proxy to attend and vote in his stead and a proxy need not be a member of the Company.
2. In the case of a member being a limited Company, this form must be completed under its common seal or under the hand of an officer or attorney duly authorised in writing.
3. To be valid, a form of proxy, which is provided with this report, must be duly completed by the member and must be lodged at the Company’s Offices, Ngano House, Commercial Street, Industrial Area, P O Box 30096,
00100-Nairobi, or posted in time to reach not later than 10.30 a.m. on 26 November 2013, in an envelope marked “AGM”.

4 Annual Report and Financial Statements
Appointed to the Board in June 2006. She has a BA degree in Business Administration from University of Dar-es-Salaam and an MBA (Marketing) from University of British Columbia, Canada. She has many years of management experience working for Johnson and Johnson (K) Limited. She has a directorship in NIC Bank Limited among others. She is currently a Business Consultant, having retired from as a project Manager with DFID’s Business Partnership Programme in 2005.
Appointed to the Board in May 2003, having become the Group Managing Director of Unga Holdings Limited in September 2000. He holds a BSc (Hons) degree in Horticulture from the University of London and has many years of business management experience working for Monsanto Company in East Africa, Europe, North America and South Asia. His other directorships include Kisima Farm Limited and Sunpower Products Limited.
Appointed to the Board in September 1998. An engineer by profession and Group Managing Director of NAS Holdings Limited for the past 18 years. He has other directorships and considerable experience in Eastern and Southern Africa in the manufacturing and production sectors including the livestock industry. He was the Group’s Managing Director between September 1998 and May 2003.
Directors’ Profiles
Appointed to the Board in September 2001. He graduated from University of Oxford with a Bachelor of Arts (Hons) degree in Philosophy, Politics and Economics. He started his career in the banking industry, firstly with Citibank Limited and then with Mercantile Banking Company Limited before moving to First Chartered Securities Limited where he is the Executive Director. He holds many other directorships among which are NIC Bank Limited.
Mrs Isabella Ochola-Wilson
Non Exec (64)Nicholas C. Hutchinson
Exec (57)
Alan McKittrickNon Exec (58)
Andrew S. Ndegwa Non Exec (45)

5Annual Report and Financial Statements
Directors’ Profiles (continued)
Vitalis O. OjodeNon Exec (68)
Mrs. Mary K. M’MukindiaNon Exec (56)
Appointed to the Board in May 2003. He is a BCom (Hons) graduate from University of Nairobi; a Fellow of the Association of Chartered Certified Accountants (FCCA) and is a member of ICPAK. He worked for UDV Kenya Limited for many years where he held several directorships in the group both in Kenya and Tanzania. He was the Group’s Finance Director between November 2001 and May 2006. He is currently a consultant in Financial Management.
Appointed to the Board in February 2005. He holds an LLB degree from University of Nairobi; is an Advocate of the High Court of Kenya and a partner in the Law firm of Ochieng, Onyango, Kibet and Ohaga- Advocates. He holds other directorships including Elmarak Holdings Limited and Sicham Aviation Limited.
Jinaro K. KibetNon Exec (49)
Appointed to the Board in February 2013. She is a BCom (Hons) graduate of the University of Nairobi. Mary has over 33 years of business experience both in the public and private sector, 26 of which were in the energy sector where she served at top positions in the oil industry both here and the United Kingdom, moving on to serve as the Managing Director of National Oil Corporation of Kenya. She has directorships in Jacaranda Holdings Limited and Kenya Revenue Authority. Mary is a management consultant, having left UNEP at the end of 2012.

6 Annual Report and Financial Statements
Patrick O. ObathNon- Exec (58
Ms Winniefred N Jumba Company Secretary (41)
Appointed to the Board in September 2013. He is a BSc (Hons) Mechanical Engineering graduate of the University of Nottingham, UK and is a member of the Institution of Engineers, Kenya and the Energy Institute (UK). Mr. Obath has more than 30 years business experience working for Shell group of companies in Europe, Asia, and Africa, finally serving as the CEO of Kenya Shell and Shell Tanzania. He has served in many boards, both private and public, and is the immediate past Chairman of Kenya Private Sector Alliance (KEPSA) and a director in Standard Chartered Bank Kenya Limited and Kenya Power & Lighting Company Limited among others. He is currently the Managing Consultant in Eduardo & Associates.
Appointed Company Secretary in 2011. She is a holder of a BCom degree and a Masters in Business Administration, both from the University of Nairobi. She is a Certified Public Secretary and a member of ICPSK, with over 14 years experience in Company Secretarial and Registration Services.
Directors’ Profiles (continued)

7Annual Report and Financial Statements
I am pleased to present the group’s annual report and financial statements for the financial year that ended in 30th June 2013.
Solid financial performance in a challenging year
Profit before tax was 29% higher than in the previous year,
despite turnover being flat and unrealised foreign exchange losses having a negative impact (as opposed to the positive impact of foreign exchange gains of the prior year). Earnings per share increased from Shs.2.81 in 2012 to Shs.4.09 in 2013.
Given the operating results the board is pleased to recommend a first and final dividend of Shs. 0.75per share, the same level as last year. This is subject to shareholder approval at the Annual General Meeting to be held on 28th November 2013.
Living our vision and our values
We attach great importance to living our vision, “To be a respected world class agri-business, delivering satisfaction to our stakeholders with passion and commitment”.
We work equally hard at living our values, of Self-Responsibility, Trust, Respect, Integrity, Innovation, Continual Improvement and Teamwork.We continue to deliver high quality products in both our human foods and our animal health and nutrition businesses; the continued success of our flagship brands such as EXE®, Jogoo® and Fugo® is a clear testimony of this commitment to living our vision; and we have been modernising and expanding our milling and production facilities.
Chairman’s Statement
Improved margins are already being realised in the animal health and nutrition business, following the refurbishment of the Nairobi feeds plant; and additional wheat milling capacity is being commissioned at the Nairobi plant.
All this has been designed to satisfy the projected increase in demand for our high quality products – while also ensuring our ongoing financial sustainability.
The Group’s philosophy of continual improvement has seen us strengthen our core business through a number of other ambitious initiatives. During the past year we have:
built on the previous year’s adoption of the Hoshin Kanri tool, a powerful component of our methodologies for continual improvement. The Hoshin Kanri discipline has been extraordinarily useful in enabling us to develop and deploy strategies that ensure our goals are aligned, and that we measure and manage our performance regularly and transparently throughout the organisation.improved production efficiency and reduced costs, not only through plant modernisation but thanks to the continued evolution and embedding of our lean manufacturing practices.
Exe All Purpose Jogoo Fugo Fast-Gro Finesher Pellets
Fugo Layer Compleat Meal
PaTaMu Champions Award winners for 2013

8 Annual Report and Financial Statements
Chairman’s Statement (continued)
engaged and developed our staff, with much ground work having been laid in identifying the needed skills and competencies for sustained high performance, at the shop floor and at the management level. We continue to develop our talent pool through targeted recruiting and internal job promotions and assignments.
strengthened our Corporate Social Responsibility programme, to deliver deeper and more sustainable impact in the communities where we operate (as described further, later in the annual report).purchased the entire minority shareholding in Unga Millers (U) Limited, through our subsidiary, Unga Holdings Limited.
I wish to particularly emphasise the Group’s commitment to enlightened forward thinking talent management. We take very seriously our philosophy of developing passionate and committed teams who strive to achieve stretch goals, and we fully expect that the benefits of such an approach accrue equally to employee and employer.
It is in these ways that we aspire to be world class, adopting global best practices from within and beyond our industry. Through such initiatives we are enabling the future growth of the company.
A robust board
The board, through the Nominations and Remuneration Committee, constantly examines the composition of its membership to ensure that all the necessary competencies are covered for it to provide effective oversight of and guidance to management. As a result, two new directors were appointed during the year, to fill board vacancies:
Mary Kimotho M’Mukindia was appointed in February 2013. She has many years of experience in the energy sector, first working for multinational oil companies and later serving as the Managing Director of National Oil Corporation of Kenya. She is currently a director of several companies, and a management consultant.
Patrick O Obath was appointed in September 2013. He served for many years with the Shell group of companies, in Europe, Asia and Africa, finally serving as the CEO of Shell’s operations in Kenya and Tanzania. He is the immediate past Chairman of the Kenya Private Sector Alliance (KEPSA), and is a director of several public and private companies as well as running his own consultancy.
I am confident that the Group will benefit considerably from the additional skills and experience they bring to it.
Positive Outlook
Despite the raw material supply and foreign currency challenges we anticipate in the coming year, we remain positive that the initiatives that are planned will mitigate the negative impacts of these factors on our business and enable us to grow our volumes and realise further gains in profitability.
In particular, we are working on the following areas:improved operations through further modernisation and expansion of our production facilities and increased grain storage capacity.
product and geographic diversification (specifically Uganda and Tanzania).human resource development that ensures we have skilled, competent and engaged employees to drive our future growth.realising synergies, through value added partnerships and strategic acquisitions that will expand both our product range and geographic coverage, whilst and enhancing shareholder value.
Through our Group value of continual improvement, we fully appreciate that the journey of organisational strengthening on which we are embarked is a long one. It is also an exciting one, as we build the financial, human and operational base that will enable us to embark on a period of sustained and profitable growth.
Appreciation of all our stakeholders
The financial year just ended presented numerous and significant challenges, requiring the resourcefulness and diligence of many people to confront them. I therefore wish to express my appreciation first to my fellow directors for their support, and then to the management and staff for their professionalism and ingenuity, all of which made the achievement of the year’s results possible. I wish also to convey my appreciation to the shareholders for their continued faith in the Group.
Isabella Ochola- WilsonChairman

9Annual Report and Financial Statements
Group Managing Director’s Report
Navigating in an uneasy economic environment
During the year in question we were not lacking in external challenges. These included the delayed long rains and uncertainties surrounding the months prior to and even following the Kenyan elections. But
while harvests of local maize and wheat improved, with local grain prices remaining stable, the price of imported wheat and other raw materials continued to be volatile throughout.
The Kenya and Uganda shillings continued to be under pressure, resulting in unrealised foreign exchange losses – as opposed to gains in the previous year.
Inadequate production capacity for wheat flour products negatively impacted volume growth, but this is being addressed through the commissioning of additional milling capacity in Nairobi.
While turnover remained at par with that in the prior year, our operating profit rose by 30% to Shs.680 million over the previous
year’s Shs.523 million, thanks to better margins in the animal nutrition and health sector and in the packaging businesses.
Profit before taxation showed an increase of 29%, rising to Shs.662 million relative to the prior year’s Shs.513 million. It should be pointed out that this figure includes a Shs.198 million surplus resulting from a revaluation of the retirement benefits assets.
Mixed performance
In her report, the Chairman has commented on the raw material supply and foreign currency challenges; we are also mindful of other factors such as aggressive pricing by competitors and restrained consumer buying power (putting further pressure on our pricing). Faced with this environment, we have been introducing new products and adjusting in other ways – as highlighted below.
Human foods
Fortified Jogoo® and Hostess® were launched to add to the portfolio of nutritious products; fortified wheat flour products will be launched in the next financial year.
A revamping of the route-to-market in the next financial year will ensure that volume targets are realised met, thanks to the resulting broader and deeper distribution.
Animal health and nutrition
On the cost front, even though the price of imported raw materials continued to be high, maize prices remained stable. The sector is now able to satisfy the increased demand for quality animal feeds, following the refurbishment of the feeds plant in Nairobi. Happily, improved margins are now being realised through production efficiencies.
A range of branded Fugo® animal feeds in a more convenient 50 kilogram pack was launched; the Afya Bora® mineral range was re-branded and introduced in a new pack; and the next
Segment turnover contributions

10 Annual Report and Financial Statements
Group Managing Director’s Report (continued)
financial year will see the introduction of branded feed premixes targeted at the retail market.
Packaging
Despite the absence of volume growth, gross margins improved due to the more favourable landed cost of paper and management’s success in balancing volume and price.
Upgrading our certifications, largely thanks to Kaizen
All our Kenyan plants have been HACCP certified for some time. These are now being upgraded to ISO 22000:2005 FSMS. The Nairobi feeds plant received certification during the period under review, and we expect all the other Kenyan plants to be certified by the end of the current financial year. Additionally we are upgrading our central laboratory to ISO 17025:2005 LMS certification.
Kaizen has made the process of acquiring and sustaining such certifications that much faster and easier, as the whole Kaizen ethos actively promotes the attainment of consistently high and improving standards. Applying Kaizen in our workplaces has delivered extraordinary benefits of increased productivity, enabling us to more readily reach and maintain ISO standards.
Developing our people
As described by the Chairman, the first phase of the Hoshin Kanri policy deployment has now been completed across all sites, and we have mapped out the skills and competencies of our staff at almost all levels. The application of Hoshin Kanri has also enabled us to reach much further with our management of individual employee performance. Performance reviews are now both more transparent and more regular, and an extra benefit of this discipline has been the development of our problem-solving skills.
Specialised training in Total Quality Management (TQM) and Value Stream Mapping were also undertaken during the year.
Meeting future challenges
The prices of imported wheat and other raw materials, particularly in the animal nutrition business, are expected to remain high. Uncertainty in the financial markets, especially as concerns the position of the shilling against the US Dollar and the Euro, will remain a challenge.
The introduction of 16% VAT on animal feeds will have an adverse effect on our dairy and poultry businesses, as farmers are unlikely to be able to cater for their increased production costs by increasing the price of milk, meat and eggs. As for the flour business, margins are expected to be depressed, as it will not be possible to pass on the full amount of the higher costs resulting from the re-classification of wheat flour and maize meal from ‘zero-rated’ to ‘exempt’ status.
The constraint in the production capacity for wheat products is being addressed through the commissioning of additional milling capacity in Nairobi.
Our new Central Customer Service Centre will begin taking orders and coordinating deliveries for all the Kenyan sites in the next financial year. This is designed to improve the level of service, partly thanks to our emphasis on measuring and monitoring performance and taking corrective measures where necessary.
The success of agri-business is significantly dependent on factors over which there is little control: weather conditions and world commodity prices. We understand and accept our external challenges – all business live with them. Our job is to mitigate and manage the risks, and also to take advantage of the many opportunities that are available to us. Here, therefore, are the key focus areas for the coming year:
procuring quality raw materials at favourable prices, for both the short and medium termimproving production efficiencies, driven by our Kaizen continual improvement programmes and investment in plant modernisationreducing distribution costs and increasing volumes, through an improved route-to-market structure that improves distribution reach and depthimplementing our new compensation philosophy, and applying the skills and competencies matrices we have now defined to developing both technical and managerial staff
Finally, I wish to express my personal appreciation to the board, the management team and our staff, all of whom worked tirelessly to achieve the results we have realised, despite operating under very challenging economic conditions.
Nick HutchinsonGroup Managing Director

11Annual Report and Financial Statements
Committed to the highest standard of corporate governance, Unga Group complies fully with all requirements of a publicly listed company, including clarity of financial reporting and shareholder accountability. Our policy is to set best practice standards in product and service quality, combined with fair conduct towards our employees, suppliers and customers.
Recognising its responsibilities of good citizenship in national and international communities, Unga Group particularly concentrates on issues of social welfare, environmental care and principles of integrity. Composition of the Board
The Board consists of the Chairman, who is independent and has no executive responsibilities, one executive and six non-executive directors. More than one third of the directors are both independent and non-executive; one third retires by rotation each year but is eligible for re-election.
Mrs. Mary Kimotho M’Mukindia and Mr. Patrick O Obath were appointed directors on 27 February 2013 and 26 September 2013 respectively.
Collectively, the directors possess a broad range of leading edge skills and competencies, covering the areas of legal, finance, banking, operations and management. The directors’ profiles appear on pages 4 - 6 of this Annual Report.
Role of the Board
The responsibility of the Board is to hold the Group’s long-term vision, set broad goals, plans and organisational policies to uphold it, and offer guidance on strategic decisions and actions of management. It ensures compliance with auditing and accounting standards, and is also tasked with the management of risk, through overseeing the implementation of adequate control systems.
Other Board Information
The roles of the Chairman and Chief Executive are clearly separated, to ensure true accountability of management to shareholders through the Board, in parallel with equally clearly defined autonomy and authority of management in the day-to-day operation of the Group. Directors are kept fully informed of all company activities through both regular and special event reports.
Board Meetings
The Unga Group Board has four scheduled meetings per year and stands ready for additional meetings on any specific or urgent matters. In the period under review, it met five times.
Board Committees
Under its mandate to establish appropriate committees for technical or other specialised issues, the Board currently operates an Audit and Risk Committee and a Nominations and Remuneration Committee.
Audit and Risk Committee
The Audit and Risk Committee has the primary function to assist the Board in fulfilling its oversight responsibilities for the integrity of the Group’s financial statements, compliance with legal and regulatory requirements, corporate governance, risk management and performance of the internal audit function and that of the independent auditors. The Group incorporated formal Risk Management methodology into its management practices during the year.
The committee consists of three members, all of whom are independent non-executive directors. It was chaired by Mrs. Mary Kimotho M’Mukindia who was appointed in February 2013.
It met four times during the year to review internal risk assessments and statutory compliance requirements.
Nominations and Remuneration Committee
The Nominating and Remuneration Committee has the mandates to review succession planning within the Board, identify and nominate for the approval of the Board, suitable candidates to fill Board vacancies as and when they arise. In addition, it reviews and approves the remuneration for the non-executive directors.
It is currently composed of Mr J. Kibet (Chairman) and Mr A. Ndegwa who are independent non-executive directors.
It met twice during the year to identify and nominate suitable candidates for approval of the Board.
The compensation for the financial year ended 30th June 2013 is disclosed in Note 5 of the Financial Statements.
Corporate Governance

12 Annual Report and Financial Statements
Corporate Governance - continued
Name SharesAlan McKittrick 13,472
Name No of Shares %01. Victus Limited 38,557,190 50.93 02. Moses Thara 3,808,117 5.0303. Standard Chartered Nominees Ltd - non Res A/c 9924 1,681,400 2.2204. Rakesh Prakash Gadani 1,631,880 2.1605. Alimohamed Adam 1,047,342 1.3806. Kingsway Nominees Limited 1,043,254 1.3807. Savitaben Velji Raichand Shah 745,677 0.9808. Lawrence Gatitu Mbugua 623,775 0.8209. Shah D Premchand & Premchand D Fulchand 497,356 0.6610. CFC Stanbic Nominees Ltd. A/c R 48701 325,704 0.43Total number of shares 49,961,695 65.99
Communication
The Board receives management reports in advance of all scheduled meetings and as necessary at other times. It issues an Annual Report and Financial Statements to all shareholders and other interested parties, and keeps the public advised through half-yearly and annual press notices of results and any significant developments. Shareholders have direct access to the company in line with conventional business practices.
Directors’ Benefits and Loans In the year under review, Directors have received no benefits other than fees and no loans to directors have been advanced.
Directors’ Interests
The interests of the Directors in the shares of the Company as
at 30th June 2013 was as follows:
There were no material contracts involving directors’ interests during the year.
The ten largest shareholdings in the company and the respective number of shares at 30th June 2013 are as follows:
Distribution of the shareholders
(a) By number of shares range
Range Shareholders Shares %1-500 shares 3,938 708,099 0.94501-5,000 3,142 5,538,475 7.315,001-10,000 531 3,682,756 4.8610,001-100,000 438 10,606,542 14.01100,001-1,000,000 39 7,401,931 9.781,000,001 and above 6 47,769,183 63.10Total

13Annual Report and Financial Statements
(b) By category of shareholders
I Ochola-Wilson (Mrs) N HutchinsonDirector Director
26 September 2013
Corporate Governance - continued
Domicile Shareholders Shares %Foreign companies 7 1,890,360 2.50Foreign individuals 250 1,964,258 2.59Local companies 267 43,201,062 57.06Local individuals 7,570 28,651,306 37.85Total

14 Annual Report and Financial Statements
Corporate Social Responsibility
Making a difference in our communities
The Unga Group is enthusiastic about its CSR policy of partnering with communities in which it operates to assist the needy and vulnerable members of those communities. We engage in programmes that are of high impact and synergistic with the Group’s business.
In the past, the emphasis was on income-generating projects implemented in partnership with appropriate institutions, often schools. Sometimes it was possible for the money raised to be used to support the education of a needy child. We have now advanced our thinking and CSR ambitions further through a more systematic and therefore more sustainable approach. We have identified the girl child as our area of focus, stretched our project handover expectation from one to three years, and integrated some of the Kaizen pillars that have been applied to such great effect around the Group into the CSR programme.
Key to the girl’s development is literacy, and this forms the core component of the current CSR programme. All the projects have the underlying purpose of using the revenue generated from the sale of excess production to sponsor the education of academically suitable needy girls; it is our ultimate hope that some of the young women will become Unga employees.
Additionally, our employees share the learning’s we have enjoyed with the chosen schools, and in particular the disciplines of 6K (Kuchagua, Kupanga, Kusafisha, Kusanifisha, Kudumisha, Kusiritisha), Visual Management and SHE (Safety, Health & Environment). The exposure to these tools provides valuable life skills to the students which they can also use in their home environments and elsewhere. In addition, the head teachers and teaching faculty are utilising the Kaizen methodologies to improve the running of their institutions.
The Group’s CSR projects are driven from the sites rather than from the centre, and within sites by the employees themselves. Not unexpectedly, as a result of their full participation in the CSR initiatives, staff have developed new skills, and it has been found that their levels of motivation and commitment have also increased.
The school-based projects are funded by cash earned from site team performance against the previous period goals and they follow this sequence:
Unga’s business
girls
people, advice, money
Projects in the early stages require more staff participation, especially with planning and start-up logistics, but those that have been completed and handed over also benefit from ongoing appropriate engagement.
Five projects were initiated in the last financial year, three of which involved bakeries and two of which supported animal husbandry:
A bakery project was started in this school of 600 students by employees from the Central Support Office (CSO) in Nairobi. The company supplies the school with its daily flour requirement, as a commercial transaction, and the savings and extra revenue will be used to assist needy girls.
Unga employees from Eldoret started a bakery project for Wareng High School, a mixed secondary school with 950 students. The project is so successful that it not only satisfies all the school’s requirement for bread, but revenue from the sale of surplus bread is used to pay fees for needy students.
Employees participate in the bakery construction
Buns straight from the oven

15Annual Report and Financial Statements
Corporate Social Responsibility (continued)
Nairobi)A bakery project was started for Our Lady of Mercy Girls High School in Nairobi by the employees from Commercial Street, Nairobi. The school is already saving money on its daily expenditure on bread, and earns revenue through the sale of surplus bread to the neighbouring community. The project is environmentally friendly, using briquettes made from maize cobs and paper, partly sourced from Unga, instead of charcoal to fire the jikos.
Parasite and disease control will now become easy. Also the farm manager is able to keep good records for the milk produced per cow on daily basis.
The calf pen has been very helpful in sheltering our calves from rainfall and cold weather. The dung collected from the zero grazing units is now being collected at a pit and in future it can be used to produce biogas and also for use as farm manure.
We are grateful for the support from Unga and we as a school will ensure that the project succeeds’’
Employees from the Nairobi Feeds plant started a pig husbandry project for this school of 400 students. It will impact the lives of over 1,500 individuals, whose source of livelihood is livestock farming.
Apart from helping the schools to generate funds to sponsor needy girls, the employees also share their practical knowledge and skills with the students, be it in bakery or animal husbandry or in other relevant areas. In addition, the schools become safer and more hygienic, and also more organised and efficient, through the implementation of the Kaizen 6K process that has been applied so successfully and to such great effect within the Group.
At the end of the three years, the schools involved will compete for a prize, thus fuelling the competitiveness that we believe is a vital business ingredient to ensure the success of the projects.
At all levels we are excited about our CSR programme, and expect it to deliver significant benefits to the communities where they are based while endorsing Unga as a company that takes it Corporate Social Responsibility seriously.
This 800-students school was already active in the dairy industry, keeping 30 free range cows. Employees from Nakuru introduced zero grazing, setting up a unit for 10 animals. The increased milk yield has led to the generation of cash from its sale, and the proceeds are to be used to educate a needy girl child.
Testimonial
“I am happy that Unga chose Nakuru Girls to start a zero grazing project at the school. This came at the right time since the school was struggling to set up a zero grazing unit for the dairy cows which were managed though free range method.
The project initiated by Unga will be used by the agriculture students to understand the concept of zero grazing. It will also make the management of the zero grazed cows easy and increase the milk yield.
Mrs. Mutisya – The Agriculture teacher addressing Unga employees
Part of the process in making of the briquettes
Dairy cattle under zero grazing
The first three sows and the piglets

16 Annual Report and Financial Statements
Five Year Financial Review (Summary)
Shs’000 Shs’000 Shs’000 Shs’000 Shs’000
CONSOLIDATED INCOME STATEMENT
Turnover 11,643,639 11,524,454 13,214,442 15,976,763 15,759,078
Operating Profit 300,334 351,614 643,342 523,160 680,848
Profit Before Taxation 260,439 335,101 631,070 512,569 662,243
Taxation charge (75,247) (98,928) (190,027) (164,374) (154,223)
Earnings Per Share- basic & diluted Shs 1.55 Shs 1.81 Shs 3.57 Shs 2.81 Shs 4.09
CONSOLIDATED STATEMENT OFFINANCIAL POSITION
ASSETS
Non-current Assets 1,732,684 1,644,583 1,622,280 1,765,368 2,481,195Current Assets 3,832,857 3,419,837 4,086,617 4,644,891 5,835,732
EQUITY AND LIABILITIES Capital and reservesShare Capital and premium 451,683 451,683 451,683 451,683 451,683Reserves 1,715,291 1,848,086 2,078,952 2,224,082 2,505,196
Equity attributable to equity holders of the parent 2,166,974 2,299,769 2,530,635 2,675,765 2,956,879 Non controlling interest 979,413 1,064,934 1,214,316 1,313,453 1,547,036 Total Equity 3,146,387 3,364,703 3,744,951 3,989,218 4,503,915 Non current liabilities 334,142 355,354 345,150 453,088 646,148Current liabilities 2,085,012 1,344,363 1,618,796 1,967,953 3,166,864 2,419,154 1,699,717 1,963,946 2,421,041 3,813,012

17Annual Report and Financial Statements
DIRECTORS I Ochola-Wilson (Mrs) - Chairman N C Hutchinson* - Group Managing Director A McKittrick A S M Ndegwa - (Alternate - J P M Ndegwa) V O Ojode J K Kibet M K M’Mukindia (Mrs) P O Obath
*British
SECRETARY Ms Winniefred N Jumba Certified Public Secretary (Kenya) Livingstone Associates Deloitte Place, Waiyaki Way, Muthangari P O Box 30029, 00100 Nairobi
REGISTERED OFFICE Plot No.209/6841 Ngano House, Commercial Street Industrial Area P O Box 30096, 00100 Nairobi Tel: +254(020)3933000
REGISTRARS Custody & Registrars Services Limited 6th Floor, Bruce House Standard Street P O Box 8484, 00100 Nairobi
AUDITORS Deloitte & Touche Certified Public Accountants (Kenya) Deloitte Place, Waiyaki Way, Muthangari P O Box 40092, 00100 Nairobi
BANKERS Barclays Bank of Kenya Limited The West End, Waiyaki Way P O Box 30120, 00100 Nairobi
ADVOCATES Kaplan & Stratton Williamson House 4th Ngong Avenue P O Box 40111, 00100 Nairobi
Corporate Information

18 Annual Report and Financial Statements
The directors present their report together with the audited financial statements of Unga Group Limited and its subsidiaries (the “group”) for the year ended 30 June 2013 which show their state of affairs.
Activities
The company operates as a holding company. The principal activities of the group continue to be the milling of wheat and maize, the manufacture of packaging materials and animal nutrition products, and the distribution of animal health products.
Group Results
Profit before taxation 662,243 512,569Taxation charge (154,223) (164,374) ______ ______Profit for the year 508,020 348,195 ======= =======Attributable to:
Equity holders of the parent 309,985 212,683Non - controlling interests 198,035 135,512 ______ ______ 508,020 348,195 ======= =======Dividend
The directors recommend the payment of a first and final dividend of Shs 0.75 (2012 – Shs 0.75) per share amounting to Shs 56,780,240 (2012: Shs 56,780,240) in respect of the financial year. The dividend is subject to approval by the shareholders at the next Annual General Meeting.
Directors
The present board of directors is shown on page 17.
Mrs Mary Kimotho M’Mukindia was appointed to the board on 27 February 2013 while Mr Patrick O Obath was appointed to the board on 26 September 2013.
Mr V O Ojode and Mr J K Kibet retire in accordance with Articles 88 and 89 of the Company’s Articles of Association and, being eligible, offer themselves for re-election.
Auditors
Deloitte & Touche, having confirmed their willingness, continue in office in accordance with section 159 (2) of the Companies Act.
By Order of the Board
Winniefred N JumbaSecretary
Nairobi
Report of the Directors

19Annual Report and Financial Statements
Statement of Directors’ Responsibilities
The Kenyan Companies Act requires the directors to prepare financial statements for each financial year which give a true and fair view of the state of affairs of the company and its subsidiaries as at the end of the financial year and of the operating results of the group for that year. It also requires the directors to ensure that the company and its subsidiaries keep proper accounting records which disclose with reasonable accuracy at any time the financial position of the group. They are also responsible for safeguarding the assets of the group.
The directors are responsible for the preparation of financial statements that give a true and fair view in accordance with International Financial Reporting Standards and the requirements of the Kenyan Companies Act, and for such internal controls as the directors determine are necessary to enable the preparation of financial statements that are free from material misstatement, whether due to fraud or error.
The directors accept responsibility for the annual financial statements, which have been prepared using appropriate accounting policies supported by reasonable and prudent judgments and estimates, in conformity with International Financial Reporting Standards and in the manner required by the Kenyan Companies Act. The directors are of the opinion that the financial statements give a true and fair view of the state of the financial affairs of the company and its subsidiaries’ and of the group’s operating results. The directors further accept responsibility for the maintenance of accounting records which may be relied upon in the preparation of financial statements, as well as adequate systems of internal financial control.
Nothing has come to the attention of the directors to indicate that the company and its subsidiaries will not remain going concerns for at least the next twelve months from the date of this statement.
I Ochola-Wilson (Mrs) N HutchinsonDirector Director

20 Annual Report and Financial Statements
Report on the Financial Statements
We have audited the accompanying financial statements of Unga Group Limited and its subsidiaries, set out on pages 21 to 62 which comprise the consolidated and company statements of financial position as at 30 June 2013, and the consolidated statement of profit or loss and other comprehensive income, consolidated and company statements of changes in equity and consolidated statement of cash flows for the year then ended, and a summary of significant accounting policies and other explanatory notes.
Directors’ Responsibility for the Financial Statements
The directors are responsible for the preparation of financial statements that give a true and fair view in accordance with International Financial Reporting Standards and the requirements of the Kenyan Companies Act, and for such internal controls as the directors determine are necessary to enable the preparation of financial statements that are free from material misstatement, whether due to fraud or error.
Auditors’ Responsibility
Our responsibility is to express an independent opinion on these financial statements based on our audit. We conducted our audit in accordance with International Standards on Auditing. Those standards require that we comply with ethical requirements and plan and perform the audit to obtain reasonable assurance about whether the financial statements are free of material misstatement.
An audit involves performing procedures to obtain audit evidence about the amounts and disclosures in the financial statements. The procedures selected depend on our judgment, including the assessment of the risks of material misstatement of the financial statements, whether due to fraud or error. In making those risk assessments, we considered the internal controls relevant to the entity’s preparation of financial statements that give a true and fair view in order to design audit procedures that were appropriate in the circumstances,
Independent Auditors’ Reportto the members of Unga Group Limited
but not for the purpose of expressing an opinion on the effectiveness of the company’s internal controls. An audit also includes evaluating the appropriateness of accounting policies used and the reasonableness of accounting estimates made by the directors, as well as evaluating the overall presentation of the financial statements.
We believe that the audit evidence we have obtained is sufficient and appropriate to provide a basis for our audit opinion.
Opinion
In our opinion, the accompanying financial statements give a true and fair view of the state of financial affairs of the company and its subsidiaries as at 30 June 2013, and of their profit and cash flows for the year then ended in accordance with International Financial Reporting Standards and the requirements of the Kenyan Companies Act.
Report on Other Legal Requirements
As required by the Kenyan Companies Act we report to you, based on our audit, that: i) we have obtained all the information and explanations
which to the best of our knowledge and belief were necessary for the purposes of our audit;
ii) in our opinion, proper books of account have been kept by the company, so far as appears from our examination of those books; and
iii) the company’s statement of financial position (balance sheet) is in agreement with the books of account.
Certified Public Accountants (Kenya)
Anne Muraya
Nairobi, Kenya

21Annual Report and Financial Statements
Consolidated Statement of Profit or Loss and Other Comprehensive Income
Turnover 15,759,078 15,976,763
Cost of Sales (14,373,535) (14,607,072) ________ ________Gross Profit 1,385,543 1,369,691
Other Operating Income 281,879 103,232
Distribution Costs (354,896) (400,108)
Administrative Expenses (615,340) (688,938)
Net Foreign Exchange (Losses)/Gains (16,338) 139,283
Finance Costs 4 (18,605) (10,591) _______ _______
Profit Before Taxation 5 662,243 512,569
Taxation Charge 7(a) (154,223) (164,374) _______ _______
Profit for the Year 8 508,020 348,195
Other Comprehensive Income/LossItems that will not be reclassified subsequentlyto profit or loss:Revaluation Surplus 375,186 -Deferred Tax On Revaluation Surplus (112,557) -
Items that will may be reclassified subsequently toprofit or loss:Exchange Differences on Translationof Foreign Operations (16,166) (16,574) _______ _______Total Other Comprehensive Income/(Loss) 246,463 (16,574) _______ _______
Total Comprehensive Income for The Year 754,483 331,621 ======== ========Profit for the Year Attributable To:Equity Holders f the Parent 309,985 212,683Non - Controlling Interests 23 198,035 135,512 _______ _______ 508,020 348,195 ======== ========Total Comprehensive Income For The Year Attributable To:
Equity Holders Of The Parent 450,819 201,910Non - Controlling Interests 23 303,664 129,711 _______ _______
754,483 331,621 ======== ========Earnings Per Share – Basic & Diluted 9 Sh 4.09 Sh 2.81 ======== ========

22 Annual Report and Financial Statements
Consolidated Statement of Financial Position
ASSETSNon-current assetsProperty, plant and equipment 11 2,209,074 1,633,333Prepaid operating lease rentals 12 35,688 37,813Intangible assets 13 8,794 5,672Retirement benefits asset 15 224,600 45,000Deferred taxation 16 3,039 43,550 _______ _______ 2,481,195 1,765,368 _______ _______Current assetsInventories 17 3,172,479 2,115,489Trade and other receivables 18 1,999,052 1,748,593Taxation recoverable 7(c) 29,598 132,290Term deposits 20 219,511 280,000Cash and bank balances 29(b) 399,565 364,591 _______ _______ 5,820,205 4,640,963Non-current assets classified as held for sale 21 15,527 3,928 _______ _______ 5,835,732 4,644,891 _______ _______
======== ========EQUITY AND LIABILITIESCapital and reservesShare capital 22 378,535 378,535Share premium 73,148 73,148Revaluation surplus 797,335 670,898Translation reserve (15,729) (5,221)Revenue reserve 1,723,590 1,558,405 _______ _______
Non-controlling interests _______ _______
_______ _______Non-current liabilitiesDeferred taxation 16 427,672 388,347Borrowings 24 149,364 -Service gratuity 25 69,112 64,741 _______ _______ 646,148 453,088 _______ _______Current liabilitiesBorrowings 24 13,964 -Trade and other payables 26 1,313,768 1,174,553Unclaimed dividends 27 21,482 21,482Due to related companies 28 1,743,768 761,463Taxation payable 7(c) 73,882 10,455 _______ _______ 3,166,864 1,967,953 _______ _______
======== ========The financial statements on pages 21 to 62 were approved and authorised for issue by the board of directors on 26 September 2013 and were signed on its behalf by:
I Ochola-Wilson (Mrs) N HutchinsonDirector Director

23Annual Report and Financial Statements
ASSETS Non current assetsInvestment in subsidiary company 14 1,297,335 1,297,335Deferred taxation 16 1,251 1,251 _______ _______ 1,298,586 1,298,586 _______ _______
Current assetsReceivables 18 35 2,518Due from subsidiary companies 19(a) 69,053 13,477Taxation recoverable 7(d) 10,773 10,203Term deposits 20 219,511 280,000Bank balance 2,027 1,805 _______ _______ 301,399 308,003 _______ _______
======== ========EQUITY AND LIABILITIESCapital and reservesShare capital 22 378,535 378,535Share premium 73,148 73,148Revenue reserve 992,495 997,132 _______ _______ 1,444,178 1,448,815 _______ _______
Current liabilitiesDue to subsidiary companies 19(b) 143,665 142,757Payables 26 12,142 15,017 _______ ______ 155,807 157,774 _______ ______Total equity and liabilities 1,599,985 1,606,589 ======== =======
The financial statements on pages 21 to 62 were approved and authorised for issue by the board of directors on 26 September 2013 and were signed on its behalf by:
I Ochola-Wilson (Mrs) N HutchinsonDirector Director
Company Statement of Financial Position

24 Annual Report and Financial Statements
Consolidated Statement of Changes in Equity
The revaluation surplus represents the surplus arising from the revaluation of property, plant and equipment and is not distributable. The translation reserve represents translation differences arising from translation of the foreign subsidiary held by the company. The revenue reserve represents accumulated profit from the normal operations of the Group.
Sharecapital
Shs’000
Share premiumShs’000
Revaluation reserveShs’000
Translation reserveShs’000
Revenue reserveShs’000
Due to to equity
holders of parent
Non-controlling
interestsShs’000
Total
At 1 July 2011 378,535 73,148 689,208 5,552 1,384,192 1,214,316
______ ______ _______ ______ _______ _______ _______ _______
Profit for the year - - - - 212,683 135,512
Other comprehensive loss- - - (10,773) - (5,801) (16,574)
Total comprehensive (loss) /income for the year - - -
______ _______ _______ _______ _______ _______ _______ _______
Transfer of excess depreciation- - (24,905) - 24,905 - - -
Deferred tax on excess depreciation - - 7,472 - (7,472) - - -
Surplus realised on disposal of revalued assets - - (1,253) - 1,253 - - -
Deferred tax on revaluation surplus realised on disposal of revalued assets
- - 376 - (376) - - -
Dividend paid to shareholders - - - - (56,780) -
Dividend paid to non-controlling interests - - - - - - (30,574)
______ _______ ______ ______ _______ ________ ______ ________
At 30 June 2012 378,535 73,148 670,898 (5,221) 1,558,405 1,313,453
====== ====== ======= ====== ======= ======== ====== =======
At 1 July 2012 378,535 73,148 670,898 (5,221) 1,558,405 1,313,453
______ _______ ______ ______ _______ _______ ______ ________
Profit for the year - - - - 309,985 198,035
Other comprehensive income/(loss) - - 151,342 (10,508) - 105,629
______ _______ ______ ______ _______ _______ ______ ________
Total comprehensive income/(loss) for the year - -
______ _______ ______ ______ _______ _______ ______ ________
Transfer of excess depreciation - - (35,578) - 35,578 - - -
Deferred tax on excess depreciation - - 10,673 - (10,673) - - -
Dividend paid to shareholders - - - - (56,780) -
Dividend paid to non-controlling interests - - - - - - (52,134) (52,134)
Acquisition of non-controlling Interests (note 23) - - - - (112,925) (17,947)
At 30 June 2013 378,535 73,148 797,335 (15,729) 1,723,590 1,547,036
====== ====== ====== ====== ======= ======= ======= =======

25Annual Report and Financial Statements
Company Statement of Changes in Equity
Share Share Revenue capital premium reserve Total Shs’000 Shs’000 Shs’000
At 30 June 2011 378,535 73,148 998,390
Profit for the year - - 55,522
Other comprehensive income for the year - - - - ______ _______ _______ _______
Total comprehensive income for the year - - 55,522 ______ _______ _______ _______
Dividends paid to shareholders - 2011 - - (56,780) ______ ______ _______ _______
At 30 June 2012 378,535 73,148 997,132 1,448,815 ======= ======= ======== ========
At 1 July 2012 378,535 73,148 997,132 1,448,815
Profit for the year - - 52,143 Other comprehensive income for the year - - - -
Total comprehensive income for the year - - 52,143 ______ _______ _______ _______
Dividends paid to shareholders - 2012 - - (56,780) ______ _______ _______ _______
At 30 June 2013 378,535 73,148 992,495 1,444,178 ======= ======== ======== ========

26 Annual Report and Financial Statements
Consolidated Statement of Cash Flows
Cash Flows from Operating Activities
Cash generated from operations 29(a) 431,031 218,807Taxation paid 7(c) (19,414) (275,696) _______ _______
Net cash generated from/(used in) operating activities 411,617 (56,889) _______ _______
Cash Flows from Investing Activities
Purchase of property, plant and equipment 11 (354,218) (283,692)Purchase of intangible assets 13 (6,650) (2,051)Proceeds of disposal of property, plant and equipment 1,427 15,684Proceeds of uplift/(investment) in term deposit 280,000 (30,500)Acquisition of non-controlling interests 23 (130,872) - _______ _______
Net cash used in investing activities (210,313) (300,559) _______ _______
Cash Flows from Financing Activities
Loans received 24 163,328 -Dividends paid to non - controlling interests 23 (52,134) (30,574)Dividends paid to shareholders 27 (56,780) (56,780) _______ _______
Net cash generated from/(used in) financing activities 54,414 (87,354) _______ _______
Increase/(Decrease) in Cash and Cash Equivalents 255,718 (444,802)
Cash and Cash Equivalents at beginning of year 364,591 810,635
Exchange adjustment (1,233) (1,242) _______ _______Cash and Cash Equivalents at end of year 29(b) 619,076 364,591 ======= ========

27Annual Report and Financial Statements
1 ACCOUNTING POLICIES
Statement of compliance
The financial statements have been prepared in accordance with International Financial Reporting Standards (IFRS).
Notes to the Financial Statements
Amendments to IFRS 7 Disclosures – Transfers of Financial Assets
The amendments to IFRS 7 increase the disclosure requirements for transactions involving transfers of financial assets. These amendments are intended to provide greater transparency around risk exposures of transactions where a financial asset is transferred but the transferor retains some level of continuing exposure in the asset
The application of the amendment had no effect on the Group’s financial statements as none of the companies in the Group transferred any such financial assets during the year.
Amendments to IFRS 1 Severe Hyperinflation
The amendments regarding severe hyperinflation provide guidance for entities emerging from severe hyperinflation either to resume presenting IFRS financial statements or to present IFRS financial statements for the first time
The amendments had no effect on the Group’s financial statements as none of the companies in the Group operated in a hyper-inflationary environment.
Amendments to IAS 1 Presentation of Items of Other Comprehensive Income
The amendments to IAS 1 introduce new terminology for the statement of comprehensive income and income statement. Under the amendments to IAS 1, the ‘statement of comprehensive income’ is renamed the ‘statement of profit or loss and other comprehensive income’ and the ‘income statement’ is renamed the ‘statement of profit or loss’. The amendments to IAS 1 retain the option to present profit or loss and other comprehensive income in either a single statement or in two separate but consecutive statements. However, the amendments to IAS 1 require items of other comprehensive income to be grouped into two categories in the other comprehensive income section: (a) items that will not be reclassified subsequently to profit or loss and (b) items that may be reclassified subsequently to profit or loss when specific conditions are met.
Income tax on items of other comprehensive income is required to be allocated on the same basis the amendments do not change the option to present items of other comprehensive income either before tax or net of tax.
The amendments have been applied retrospectively and hence the presentation of items of other comprehensive income in the prior year has been modified to reflect the changes. Other than the above mentioned presentation changes, the application of the amendments to IAS 1 does not result in any impact on profit or loss, other comprehensive income and total comprehensive income.
For the Kenyan Companies Act reporting purposes, in these financial statements, the balance sheet is represented by/equivalent to the statement of financial position and the profit and loss account is presented in the statement of comprehensive income.
Adoption of new and revised International Financial Reporting Standards (IFRSs) and Interpretations (IFRIC)
(i) Relevant new standards and amendments to published standards effective for the year ended 30 June 2013
The following new and revised IFRSs were effective in the current year and had no material impact on the amounts reported in these financial statements.

28 Annual Report and Financial Statements
1. Accounting Policies (continued)
Adoption of new and revised International Financial Reporting Standards (IFRSs) and Interpretations (IFRIC) (Continued)
(ii) Relevant new and amended standards and interpretations in issue but not yet effective in the year ended 30 June 2013
(iii) Impact of relevant new and amended standards and interpretations on the financial statements for the year ended 30 June 2013 and future annual periods
New and Amendments to the standards Effective for annual periods beginning on or after
IFRS 9, Financial Instruments 1 January 2015
IFRS 10, Consolidated Financial Statements 1 January 2013IFRS 11, Joint Arrangements 1 January 2013IFRS 12, Disclosure of Interests in Other Entities 1 January 2013IFRS 13, Fair Value Measurement 1 January 2013IAS 27 (as revised in 2011), Separate Financial Statements 1 January 2013IAS 28 (as revised in 2011), Investments in Associates and Joint Venture 1 January 2013IAS 19 (as revised in 2011), Employee Benefits 1 January 2013Amendments to IAS 32, Offsetting Financial Assets and Financial Liabilities 1 January 2014Amendments to IFRSs, Annual Improvements to IFRSs 2009-2011 Cycle except for the amendment to IAS 11 1 January 2013
Amendments to IFRS 7, Disclosures – Offsetting Financial Assetsand Financial Liabilities 1 January 2013
Amendments to IFRS 9 and IFRS 7, Mandatory Effective Date of IFRS 9 and Transition Disclosures 1 January 2015
IFRIC 20, Stripping Costs in the Production Phase of a Surface Mine 1 January 2013IFRIC 21 Levies 1 January 2014
Notes to the Financial Statements (continued)
IFRS 9, Financial Instruments
IIFRS 9 Financial Instruments issued in November 2010 and amended in October 2010 and December 2012 introduces new requirements for the classification and measurement of financial assets and financial liabilities and for de-recognition.
IFRS 9 requires all recognised financial assets that are within the scope of IAS 39 Financial Instruments: Recognition and Measurement to be subsequently measured at amortised cost or fair value. Specifically, debt investments that are held within a business model whose objective is to collect the contractual cash flows, and that have contractual cash flows that are solely payments of principal and interest on the principal outstanding are generally measured at amortised cost at the end of subsequent accounting periods. All
other debt investments and equity investments are measured at their fair values at the end of subsequent accounting periods.
The most significant effect of IFRS 9 regarding the classification and measurement of financial liabilities relates to the accounting for changes in fair value of a financial liability (designated as at fair value through profit or loss) attributable to changes in the credit risk of that liability. Specifically, under IFRS 9, for financial liabilities that are designated as at fair value through profit or loss, the amount of change in the fair value of the financial liability that is attributable to changes in the credit risk of that liability is recognised in other comprehensive income, unless the recognition of the effects of changes in the liability’s credit risk in other comprehensive income would create or enlarge an accounting mismatch in profit or loss. Changes in

29Annual Report and Financial Statements
fair value attributable to a financial liability’s credit risk are not subsequently reclassified to profit or loss. Previously, under IAS 39, the entire amount of the change in the fair value of the financial liability designated as at fair value through profit or loss was recognised in profit or loss.
IFRS 9 is effective for annual periods beginning on or after 1 January 2015, with earlier application permitted. The directors anticipate that IFRS 9 will be adopted in the Group’s financial statements for the annual period beginning 1 January 2015 and that the application of IFRS 9 will not have a significant impact on amounts reported in respect of the Group’s financial assets and financial liabilities.
IFRS 10 Consolidated financial statements
IFRS 10 requires a parent to present consolidated financial statements as those of a single economic entity, replacing the requirements previously contained in IAS 27 ‘Consolidated and Separate Financial Statements’ and SIC-12 ‘Consolidation - Special Purpose Entities’.
The standard identifies the principles of control, determines how to identify whether an investor controls an investee and therefore must consolidate the investee, and sets out the principles for the preparation of consolidated financial statements. The Standard introduces a single consolidation model for all entities based on control, irrespective of the nature of the investee (i.e. whether an entity is controlled through voting rights of investors or through other contractual arrangements as is common in ‘special purpose entities’). Under IFRS 10, control is based on whether an investor has:
involvement with the investee, and
affect the amount of the returns.
1. Accounting Policies (continued)
Adoption of new and revised International Financial Reporting Standards (IFRSs) and Interpretations (IFRIC) (continued)
(iii) Impact of relevant new and amended standards and interpretations on the financial statements for the year ended 30 June 2013 and future annual periods (continued).
Notes to the Financial Statements (continued)
The standard is effective for annual periods beginning on or after 1 January 2013. The Group will apply this amendment prospectively. The directors anticipate no material impact to the financial statements of the Group.
IFRS 11: Joint Arrangements
IFRS 11 replaces IAS 31 ‘Interests in Joint Ventures’. It requires a party to a joint arrangement to determine the type of joint arrangement in which it is involved by assessing its rights and obligations and then account for those rights and obligations in accordance with that type of joint arrangement.
Joint arrangements are either joint operations or joint ventures:
parties that have joint control of the arrangement (joint operators) have rights to the assets, and obligations for the liabilities, relating to the arrangement. Joint operators recognise their assets, liabilities, revenue and expenses in relation to its interest in a joint operation (including their share of any such items arising jointly)
parties that have joint control of the arrangement (joint venturers) have rights to the net assets of the arrangement. A joint venturer applies the equity method of accounting for its investment in a joint venture in accordance with IAS 28 ‘Investments in Associates and Joint Ventures (2012)’. Unlike IAS 31, the use of ‘proportionate consolidation’ to account for joint ventures is not permitted.
The standard is effective for annual periods beginning on or after 1 January 2013. The Group will apply this amendment prospectively. The directors anticipate no material impact to the Group’s financial statements currently. However, the Group would have to apply this standard to any such arrangements entered in the course of its expansion strategy.

30 Annual Report and Financial Statements
IFRS 12 Disclosure of Interests in Other Entities
IFRS 12 requires the extensive disclosure of information that enables users of financial statements to evaluate the nature of, and risks associated with, interests in other entities and the effects of those interests on its financial position, financial performance and cash flows.
In high-level terms, the required disclosures are grouped into the following broad categories:
how control, joint control, significant influence has been determined
the structure of the Group, risks associated with structured entities, changes in control, and so on
nature, extent and financial effects of interests in joint arrangements and associates (including names, details and summarised financial information)
information to allow an understanding of the nature and extent of interests in unconsolidated structured entities and to evaluate the nature of, and changes in, the risks associated with its interests in unconsolidated structured entities
IFRS 12 lists specific examples and additional disclosures which further expand upon each of these disclosure objectives, and includes other guidance on the extensive disclosures required.
The adoption of IFRS 12 in the Group’s financial statements for the annual period beginning 1 January 2013 and that the application of the new standard would result in more extensive disclosures in the financial statements.
IFRS 13 Fair Value Measurements
IFRS 13 replaces the guidance on fair value measurement in existing IFRS accounting literature
Notes to the Financial Statements (continued)
1. Accounting Policies (continued)
Adoption of new and revised International Financial Reporting Standards (IFRSs) and Interpretations (IFRIC) (continued)
(iii) Impact of relevant new and amended standards and interpretations on the financial statements for the year ended 30 June 2013 and future annual periods (continued).
with a single standard. The IFRS is the result of joint efforts by the IASB and FASB to develop a converged fair value framework. The IFRS defines fair value, provides guidance on how to determine fair value and requires disclosures about fair value measurements. However, IFRS 13 does not change the requirements regarding which items should be measured or disclosed at fair value.
IFRS 13 applies when another IFRS requires or permits fair value measurements or disclosures about fair value measurements (and measurements, such as fair value less costs to sell, based on fair value or disclosures about those measurements).
With some exceptions, the standard requires entities to classify these measurements into a ‘fair value hierarchy’ based on the nature of the inputs:
assets or liabilities that the entity can access at the measurement date;
included within Level 1 that are observable for the asset or liability, either directly or indirectly;
or liability.
The scope of IFRS 13 is broad; it applies to both financial instrument items and non-financial instrument items for which other IFRSs require or permit fair value measurements and disclosures about fair value measurements, except in specified circumstances. In general, the disclosure requirements in IFRS 13 are more extensive than those required in the current standards. For example, quantitative and qualitative disclosures based on the three-level fair value hierarchy currently required for financial instruments only under IFRS 7 Financial Instruments: Disclosures will be extended by IFRS 13 to cover all assets and liabilities within its scope.
31Annual Report and Financial Statements
IFRS 13 Fair Value Measurements (continued)
IFRS 13 is effective for annual periods beginning on or after 1 January 2013, with earlier application permitted.
The directors anticipate that the application of the new standard may affect the amounts reported in the financial statements and result in more extensive disclosures in the financial statements. However, the Group is yet to assess IFRS 13’s full impact and intends to adopt the standard no later than the accounting period beginning on or after 1 January 2013.
IAS 27 Separate Financial Statements (2012)
Amended version of IAS 27 which now only deals with the requirements for separate financial statements, which have been carried over largely unamended from IAS 27 Consolidated and Separate Financial Statements. Requirements for consolidated financial statements are now contained in IFRS 10 Consolidated Financial Statements.
The Standard requires that when an entity prepares separate financial statements, investments in subsidiaries, associates, and jointly controlled entities are accounted for either at cost, or in accordance with IFRS 9 Financial Instruments.
The Standard also deals with the recognition of dividends, certain group reorganisations and includes a number of disclosure requirements.
The standard is effective for annual periods beginning on or after 1 January 2013. The Group will apply this amendment prospectively. The directors anticipate no material impact to the Group’s financial statements.
IAS 28 Investments in Associates and Joint Ventures (2012)
This Standard supersedes IAS 28 Investments in Associates and prescribes the accounting
Notes to the Financial Statements (continued)
1. Accounting Policies (continued)
Adoption of new and revised International Financial Reporting Standards (IFRSs) and Interpretations (IFRIC) (continued)
(iii) Impact of relevant new and amended standards and interpretations on the financial statements for the year ended 30 June 2013 and future annual periods (continued).
for investments in associates and sets out the requirements for the application of the equity method when accounting for investments in associates and joint ventures.
The Standard defines ‘significant influence’ and provides guidance on how the equity method of accounting is to be applied (including exemptions from applying the equity method in some cases). It also prescribes how investments in associates and joint ventures should be tested for impairment.
The standard is effective for annual periods beginning on or after 1 January 2013. The Group will apply this amendment prospectively. The directors, however, anticipate no material impact to the Group’s financial statements as the Group does not currently have such investments.
Disclosures — Offsetting Financial Assets and Financial Liabilities (Amendments to IFRS 7)
Amends the disclosure requirements in IFRS 7 Financial Instruments: Disclosure to require information about all recognised financial instruments that are set off in accordance with paragraph 42 of IAS 32 Financial Instruments: Presentation.
The amendments also require disclosure of information about recognised financial instruments subject to enforceable master netting arrangements and similar agreements even if they are not set off under IAS 32. The IASB believes that these disclosures will allow financial statement users to evaluate the effect or potential effect of netting arrangements, including rights of set-off associated with an entity’s recognised financial assets and recognised financial liabilities, on the entity’s financial position.
The amendments to IFRS 7 are effective for annual periods beginning on or after 1 January 2013 and interim periods within those annual periods. The director’s anticipate that the application of these amendments

32 Annual Report and Financial Statements
to IFRS 7 may result in more disclosures being made with regard to offsetting financial assets and financial liabilities in the future financial statements.
IAS 19 Employee Benefits (2011)
An amended version of IAS 19 Employee Benefits with revised requirements for pensions and other post-retirement benefits, termination benefits and other changes.
The key amendments include:
defined benefit liability (asset) including immediate recognition of defined benefit cost, disaggregation of defined benefit cost into components, recognition of remeasurements in other comprehensive income, plan amendments, curtailments and settlements (eliminating the ‘corridor approach’ permitted by the existing IAS 19)
benefit plans
including distinguishing benefits provided in exchange for service and benefits provided in exchange for the termination of employment and affect the recognition and measurement of termination benefits
the classification of employee benefits, current estimates of mortality rates, tax and administration costs and risk-sharing and conditional indexation features
Interpretations Committee.
The directors anticipate that the application of the amendment may affect the amounts reported in the financial statements. However, the group is yet to assess full impact of the amendment.
Notes to the Financial Statements (continued)
1. Accounting Policies (continued)
Adoption of new and revised International Financial Reporting Standards (IFRSs) and Interpretations (IFRIC) (continued)
(iii) Impact of relevant new and amended standards and interpretations on the financial statements for the year ended 30 June 2013 and future annual periods (continued).
Offsetting Financial Assets and Financial Liabilities (Amendments to IAS 32)
Amends IAS 32 Financial Instruments: Presentation to clarify certain aspects because of diversity in application of the requirements on offsetting, focused on four main areas:
right of set-off’
settlement
requirements.
The above amendments are generally effective for annual periods beginning on or after 1 January 2013. The company will apply the amendments prospectively. The directors anticipate no material impact to the company’s financial statements.
Annual Improvements to IFRSs 2009 – 2011 Cycle issued in May 2012
The Annual Improvements to IFRSs 2009 – 2011 Cycle include a number of amendments to various IFRSs. The amendments are effective for annual periods beginning on or after 1 January 2013. Amendments to IFRSs include:
Statements;
and
Presentation.
IAS 1 Presentation of Financial Statements
The amendments to IAS 1 clarify that an entity is required to present a statement of financial position as at the beginning of the preceding period (third statement of financial position) only when the retrospective application of an accounting policy, restatement or reclassification has a material effect

33Annual Report and Financial Statements
Annual Improvements to IFRSs 2009 – 2011 Cycle issued in May 2012 (Continued)
on the information in the third statement of financial position and that the related notes are not required to accompany the third statement of financial position.The amendments also clarify that additional comparative information is not necessary for periods beyond the minimum comparative financial statement requirements of IAS 1. However, if additional comparative information is provided, the information should be presented in accordance with IFRSs, including related note disclosure of comparative information for any additional statements included beyond the minimum comparative financial statement requirements. Presenting additional comparative information voluntarily would not trigger a requirement to provide a complete set of financial statements.
The directors anticipate that the amendments to IAS 1 will result in the Group presenting a statement of financial position at the beginning of the preceding period (third statement of financial position) only when the restatement or reclassification has a material effect on the information in the financial statements.
IAS 16, Plant and Equipment
The amendments to IAS 16 clarify that spare parts, stand-by equipment and servicing equipment should be classified as property, plant and equipment when they meet the definition of property, plant and equipment in IAS 16 and as inventory otherwise.
The directors do not anticipate that the amendments to IAS 16 will have a significant effect on the Group’s financial statements.
IAS 32 Financial Instruments: Presentation
The amendments to IAS 32 clarify that income tax relating to distributions to holders of an equity instrument and to transaction costs of an equity transaction should be accounted for in accordance with IAS 12 Income Taxes.
Notes to the Financial Statements (continued)
1. Accounting Policies (continued)
Adoption of new and revised International Financial Reporting Standards (IFRSs) and Interpretations (IFRIC) (continued)
(iii) Impact of relevant new and amended standards and interpretations on the financial statements for the year ended 30 June 2013 and future annual periods (continued).
The directors anticipate that the amendments to IAS 32 will have no effect on the Group’s financial statements as the Group has already adopted this treatment.
(iii) Early adoption of standards
The Group did not early-adopt any new or amended standards in the financial year.
Basis of preparation
The financial statements are prepared on the historical cost basis of accounting as modified to include the revaluation of certain assets. The principal accounting policies adopted in the preparation of these financial statements remain unchanged from the previous year and are as set out below:
Consolidation
The consolidated financial statements incorporate the financial statements of Unga Group Limited and its subsidiary companies, all of which are made up to 30 June each year.
Subsidiary undertakings are those companies in which the group either directly or indirectly has an interest of more than 50% of the voting rights or otherwise has power to exercise control over the operations. All subsidiaries have been consolidated. Subsidiaries are consolidated from the date on which effective control is transferred to the group and are no longer consolidated as from the date of disposal. All inter-company transactions and balances and unrealised surpluses and deficits on transactions with the subsidiary companies have been eliminated. Subsidiary undertakings are disclosed on note 14.
Non-controlling interests in the net assets of consolidated subsidiaries are identified separately from the group’s equity therein. Non-controlling interests consist of the amount of those interests at the date of the original business combination and the non-controlling interest’s share of changes in equity since the date of the combination.
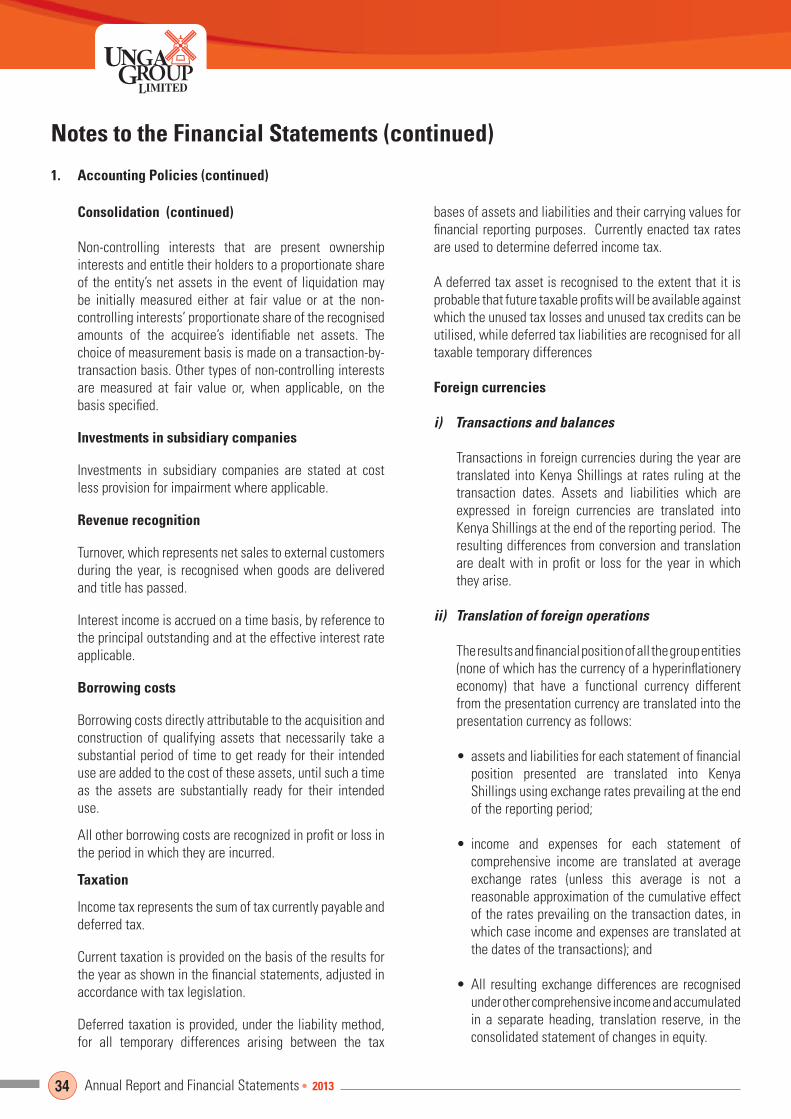
34 Annual Report and Financial Statements
Consolidation (continued)
Non-controlling interests that are present ownership interests and entitle their holders to a proportionate share of the entity’s net assets in the event of liquidation may be initially measured either at fair value or at the non-controlling interests’ proportionate share of the recognised amounts of the acquiree’s identifiable net assets. The choice of measurement basis is made on a transaction-by-transaction basis. Other types of non-controlling interests are measured at fair value or, when applicable, on the basis specified.
Investments in subsidiary companies
Investments in subsidiary companies are stated at cost less provision for impairment where applicable.
Revenue recognition
Turnover, which represents net sales to external customers during the year, is recognised when goods are delivered and title has passed.
Interest income is accrued on a time basis, by reference to the principal outstanding and at the effective interest rate applicable.
Borrowing costs
Borrowing costs directly attributable to the acquisition and construction of qualifying assets that necessarily take a substantial period of time to get ready for their intended use are added to the cost of these assets, until such a time as the assets are substantially ready for their intended use.
All other borrowing costs are recognized in profit or loss in the period in which they are incurred.
Taxation
Income tax represents the sum of tax currently payable and deferred tax.
Current taxation is provided on the basis of the results for the year as shown in the financial statements, adjusted in accordance with tax legislation.
Deferred taxation is provided, under the liability method, for all temporary differences arising between the tax
Notes to the Financial Statements (continued)
1. Accounting Policies (continued)
bases of assets and liabilities and their carrying values for financial reporting purposes. Currently enacted tax rates are used to determine deferred income tax.
A deferred tax asset is recognised to the extent that it is probable that future taxable profits will be available against which the unused tax losses and unused tax credits can be utilised, while deferred tax liabilities are recognised for all taxable temporary differences
Foreign currencies
i) Transactions and balances
Transactions in foreign currencies during the year are translated into Kenya Shillings at rates ruling at the transaction dates. Assets and liabilities which are expressed in foreign currencies are translated into Kenya Shillings at the end of the reporting period. The resulting differences from conversion and translation are dealt with in profit or loss for the year in which they arise.
ii) Translation of foreign operations
The results and financial position of all the group entities (none of which has the currency of a hyperinflationery economy) that have a functional currency different from the presentation currency are translated into the presentation currency as follows:
position presented are translated into Kenya Shillings using exchange rates prevailing at the end of the reporting period;
comprehensive income are translated at average exchange rates (unless this average is not a reasonable approximation of the cumulative effect of the rates prevailing on the transaction dates, in which case income and expenses are translated at the dates of the transactions); and
under other comprehensive income and accumulated in a separate heading, translation reserve, in the consolidated statement of changes in equity.

35Annual Report and Financial Statements
Employee entitlements
Employee entitlements to annual leave are recognised when they accrue to employees. A provision is made for the estimated liability for annual leave accrued at the end of each reporting period.
The group’s unionisable staff who resign or retire at retirement age or whose services are terminated for reasons other than gross misconduct are entitled to service gratuity payments in accordance with the prevailing Collective Bargaining Agreement. Service gratuity is provided in the financial statements as it accrues to each employee.
Employee benefits costs
The group operates a defined benefit retirement scheme for its employees. The assets of this scheme are held in a separate trustee administered fund. The scheme is funded by contributions from both the employees and the employer. Benefits are paid to retiring staff in accordance with scheme rules. The cost of providing retirement benefits is assessed using the attained age method by qualified actuaries. The scheme is valued once every three years: the last valuation was as at 30 June 2013.
The amount recognised at the end of each reporting period represents the difference between the actuarial value of past service pension benefits and the fair value of scheme assets.
The retirement benefit asset is amortised on the straight line basis over a period recommended by the scheme’s Actuaries.
The group also contributes to a statutory defined contribution pension scheme, the National Social Security Fund (NSSF). Contributions are determined by local statutes in Kenya and Uganda and are currently at Shs 200 per employee per month in Kenya and 10% of the employee’s salary in Uganda. The group’s contributions are charged to profit or loss in the year to which they relate.
Inventories
Inventories are stated at the lower of cost and net realisable value. Cost comprises expenditure directly incurred in purchasing or manufacturing the inventories plus an
Notes to the Financial Statements (continued)
1. Accounting Policies (continued)
allocation of normal overhead expenditure attributable to the processes through which they have passed and is determined using standard costs. Net realisable value represents the estimated selling price less all estimated costs to completion and costs to be incurred in selling and distribution. Specific provisions are made for obsolete, slow moving and defective inventories.
Intangible assets
Intangible assets represent computer software.
Intangible assets acquired separately are measured on initial recognition at cost. Following initial recognition, intangible assets are carried at cost less any accumulated amortisation and any accumulated impairment losses.
Intangible assets are amortised over the useful economic life of three years and assessed for impairment whenever there is an indication that the intangible asset may be impaired. The amortisation period and the amortisation method is reviewed at each financial year end.
Changes in the expected useful life or the expected pattern of consumption of future economic benefits embodied in the asset is accounted for by changing the amortisation period or method, as appropriate, and are treated as changes in accounting estimates. The amortisation expense is recognised in profit or loss.
Gains or losses arising from de-recognition of an intangible asset are measured as the difference between the net disposal proceeds and the carrying amount of the asset and are recognised in profit or loss when the asset is derecognized.
Property, plant and equipment
Property, plant and equipment are stated at cost or as professionally revalued less accumulated depreciation and any impairment losses.
Professional valuations are carried out in accordance with the group policy of revaluing items of property, plant and equipment that are carried at valuation every five years.
The basis of valuation is as follows:
(a) Land and buildings – open market value;(b) Other assets – depreciated replacement cost.

36 Annual Report and Financial Statements
Property, plant and equipment (continued)
Increases in the carrying amounts of property, plant and equipment resulting from revaluation shall be recognised in other comprehensive income and accumulated in the revaluation surplus. However, the increase shall be recognised in profit or loss to the extent that it reverses a revaluation decrease of the same asset previously recognised in profit or loss. Decreases that offset previous increases of the same asset are recognised in other comprehensive income and charged against the revaluation surplus; all other decreases are charged to profit or loss. Each year the difference between depreciation based on the revalued carrying amount of an asset (the depreciation charged to profit or loss) and depreciation based on the asset’s original cost is transferred from the revaluation surplus to revenue reserves.
Depreciation
Depreciation is calculated to write off the cost or valuation of property, plant and equipment in equal annual instalments over their estimated useful lives. The annual rates used are:
Long leasehold buildings - 2.5%Short leasehold buildings - Over period of leaseComputer equipment - 33.3%Plant and machinery - 5 - 7.5%Furniture and fittings - 12.5%Motor vehicles - 25%Silos - Shorter of 50 years or the
unexpired period of the lease in respect of the land on which they are built
Capital work in progress
Capital work in progress relates to property and plant under construction. Cost includes materials, direct labour and any other direct expenses incurred in respect of the project. The amounts are transferred to the appropriate property, plant and equipment categories once the project is completed and commissioned.
Leasehold land
Payments to acquire interests in leasehold land are treated as prepaid operating lease rentals and amortised over the term of the related lease.
Notes to the Financial Statements (continued)
1. Accounting Policies (continued)
Non-current assets held for sale
The group classifies a non-current asset as held for sale if, and only if, its carrying amount will be recovered principally through a sale transaction rather than through continuing use. Non current assets held for sale are measured at the lower of their carrying amounts and fair values less estimated selling costs at end of reporting period date.
Impairment loss arising from any subsequent write-down of the carrying amount of an asset identified for sale to fair value less costs to make the sale is charged to profit or loss in the year in which the loss is identified.
Impairment
At the end of each reporting period, the group reviews the carrying amounts of its tangible and intangible assets to determine whether there is any indication that those assets have suffered an impairment loss. If any such indication exists, the recoverable amount of the asset is estimated in order to determine the extent of the impairment loss. Where it is not possible to estimate the recoverable amount of an individual asset, the group estimates the recoverable amount of the cash generating unit to which the asset belongs.
Any impairment losses are recognised as an expense immediately. Where an impairment loss subsequently reverses, the carrying amount of the asset is increased to the revised estimate of its recoverable amount. A reversal of an impairment loss is recognised as income immediately.
Leases
Leases are classified as finance leases whenever the terms of the lease transfer substantially all risks and rewards of ownership to a company within the group as a lessee. All other leases are classified as operating leases.
The company as a lessor
Rental income from operating leases is recognised on the straight line basis over the terms of the relevant leases.
The company as a lessee
Rentals payable under operating leases are charged to profit or loss on the straight line basis over the term of the relevant lease.

37Annual Report and Financial Statements
Segmental reporting
Operating segments are reported in a manner consistent with the internal reporting provided to the Chief Operating Decision Maker (the Group Managing Director). Management then allocates resources to and assesses the performance of the operating segments of the Group.
Segment result is segment revenue less segment expenses.
Segment revenue is the revenue that is directly attributable to a segment plus the relevant portion of the group’s revenue that can be allocated to the segment on a reasonable basis.
Segment expenses are expenses resulting from the operating activities of a segment plus the relevant portion of an expense that can be allocated to the segment on a reasonable basis.
Segment assets and liabilities comprise those operating assets and liabilities that are directly attributable to the segment or can be allocated to the segment on a reasonable basis.
Capital expenditure represents the total cost incurred during the year to acquire segment assets (property, plant and equipment) that are expected to be used during more than one year.
Financial instruments
Financial assets and liabilities are recognised in the group’s statement of financial position when the group has become a party to the contractual provisions of the instrument.
Trade receivables
Trade receivables are stated at their nominal value as reduced by appropriate allowances for estimated irrecoverable amounts. Objective evidence of impairment of the receivables is when there is significant financial difficulty of the counter party or when there is a default or delinquency in payment according to agreed terms. When a trade receivable is considered uncollectible it is written off against the allowance account. Subsequent recoveries of amounts previously written off are credited against the
Notes to the Financial Statements (continued)
1. Accounting Policies (continued)
allowance account. Changes in the carrying amount of the allowance account are recognised in profit or loss.
Term deposits
Term deposits are classified as held to maturity and are measured at amortised cost.
Bank borrowings
Interest bearing bank loans and overdrafts are recorded at the proceeds received, net of direct issue costs. Finance charges including premiums payable on settlement or redemption, are accounted for on the accruals basis and are added to the carrying amount of the instrument to the extent that they are not settled in the period they arise.
Trade payables
Trade payables are stated at their nominal value.
Dividends payable
Dividends payable on ordinary shares are charged to retained earnings in the period in which they are declared. Proposed dividends are not accrued for until ratified in an Annual General Meeting.
Comparatives
Where necessary, comparative figures have been adjusted to conform with changes in presentation in the current year.

38 Annual Report and Financial Statements
Notes to the Financial Statements (continued)
ACCOUNTING POLICIES
In the process of applying the Group’s accounting policies, management has made estimates and assumptions that affect the reported amounts of assets and liabilities within the next financial year. Estimates and judgements are continually evaluated and are based on historical experience and other factors, including expectations of future events that are believed to be reasonable under the circumstances. The key areas of judgement in applying the Group’s accounting policies are dealt with below:
Impairment losses
At the end of each reporting period, the Group reviews the carrying amounts of its tangible and intangible assets to determine whether there is any indication that those assets have suffered an impairment loss. If any such indication exists, the recoverable amount of the asset is estimated in order to determine the extent of the impairment loss. Where it is not possible to estimate the recoverable amount of an individual asset, the Group estimates the recoverable amount of the cash generating unit to which the asset belongs.
Property, plant and equipment
Critical estimates are made by directors in determining the useful lives and residual values to property, plant and equipment based on the intended use of the assets and the economic lives of those assets. Subsequent changes in circumstances such as technological advances or prospective utilisation of the assets concerned could result in the actual useful lives or residual values differing from initial estimates.
The principal activity of the Group continues to be the milling of wheat and maize, the manufacture of packaging materials and animal nutrition products, and the distribution of animal health products.
Management has chosen to organise the entity around differences in market segments served by their products into two main segments namely consumer and animal nutrition and health. Management considers the fact that reports regularly reviewed by the chief operating decision maker in order to allocate resources and to assess performance are based on these two operating segments.
Description of the types of products and services from which each reportable segment derives its revenues
Unga Group Limited has two reportable segments: consumer and animal nutrition and health. The consumer segment produces products for human consumption. The animal nutrition and health segment produces animal feed and mineral supplement products and distributes products for animal health.
Measurement of operating segment profit or loss, assets and liabilities
The accounting policies of the operating segments are the same as those described in the summary of significant accounting policies.
Unga Group Limited accounts for intersegment sales and transfers as if the sales or transfers were to third parties, i.e. at current market prices.
Factors that management uses to identify the entity’s reportable segments
Unga Group Limited segments are strategic business units that serve different market segments. They are managed separately because each business requires different technology and marketing strategies.
Information about major customers
One customer under the animal health and nutrition segment accounts for more than 10% of the revenue arising from direct sales while other operating segments have none.

39Annual Report and Financial Statements
Notes to the Financial Statements (continued)
Information on reportable segment profit or loss, assets and liabilities
Animal nutrition and Consumer health Others Eliminations Consolidated Shs’000 Shs’000 Shs’000 Shs’000 Shs’000
Revenue from external customers 9,554,392 5,866,584 338,102 - 15,759,078Inter-segment revenues 492,438 55,791 278,959 (827,188) -Interest income 3,584 - 29,663 - 33,247 Interest expense 14,328 2,642 1,635 - 18,605 Depreciation and amortisation 83,197 48,770 10,651 142,618 Reportable segmental profit 186,839 261,074 308,916 (248,809) 508,020 ======= ======= ======== ======== ========
Other material non-cash items:
Actuarial surplus from valuation of the retirement benefit asset 132,227 61,673 4,500 - 198,400
Amortisation of actuarial surplus 10,716 8,084 - - 18,800
Reportable segment assets 5,185,298 2,433,457 698,172 - 8,316,927
Expenditures for reportablesegment non-current assets 306,297 47,657 6,914 - 360,868
Reportable segmental liabilities 2,650,207 841,989 320,816 - 3,813,012 ======= ======= ======== ======== ========
Revenue from external customers 9,746,029 5,913,524 317,210 - 15,976,763
Inter-segment revenues 954,829 49,801 306,293 (1,310,923) -
Interest income 10,647 - 36,940 - 47,587
Interest expense 1,059 87 9,445 - 10,591
Depreciation and amortisation 79,876 41,462 7,282 - 128,620
Reportable segmental profit 92,543 194,837 261,729 (200,914) 348,195 ======= ======= ======== ======== ========
40 Annual Report and Financial Statements
Animal nutrition and Consumer health Others Eliminations Consolidated Shs’000 Shs’000 Shs’000 Shs’000 Shs’000
Other material non-cash items:
Amortisation of actuarial surplus 10,716 8,084 - - 18,800
Reportable segment assets 3,522,399 2,213,823 674,037 - 6,410,259
Expenditures for reportablesegment non-current assets 41,312 180,948 63,483 - 285,743
Reportable segmental liabilities 1,339,565 859,871 221,605 - 2,421,041 ======= ======= ======== ======== ========
Geographical information Non-current Revenues assets
CountryKenya 14,913,047 2,321,878Uganda 846,031 159,317 ________ ________
Total 15,759,078 2,481,195 ======== ========
CountryKenya 14,837,502 1,666,956Uganda 1,139,261 98,412 ________ ________
Total 15,976,763 1,765,368 ======== ========
4. FINANCE COSTS
Interest payable:
Loans 1,601 -Bank overdrafts 5,870 341Other trade interest 11,134 10,250 _______ _______ 18,605 10,591 ======= ========
Notes to the Financial Statements (continued)
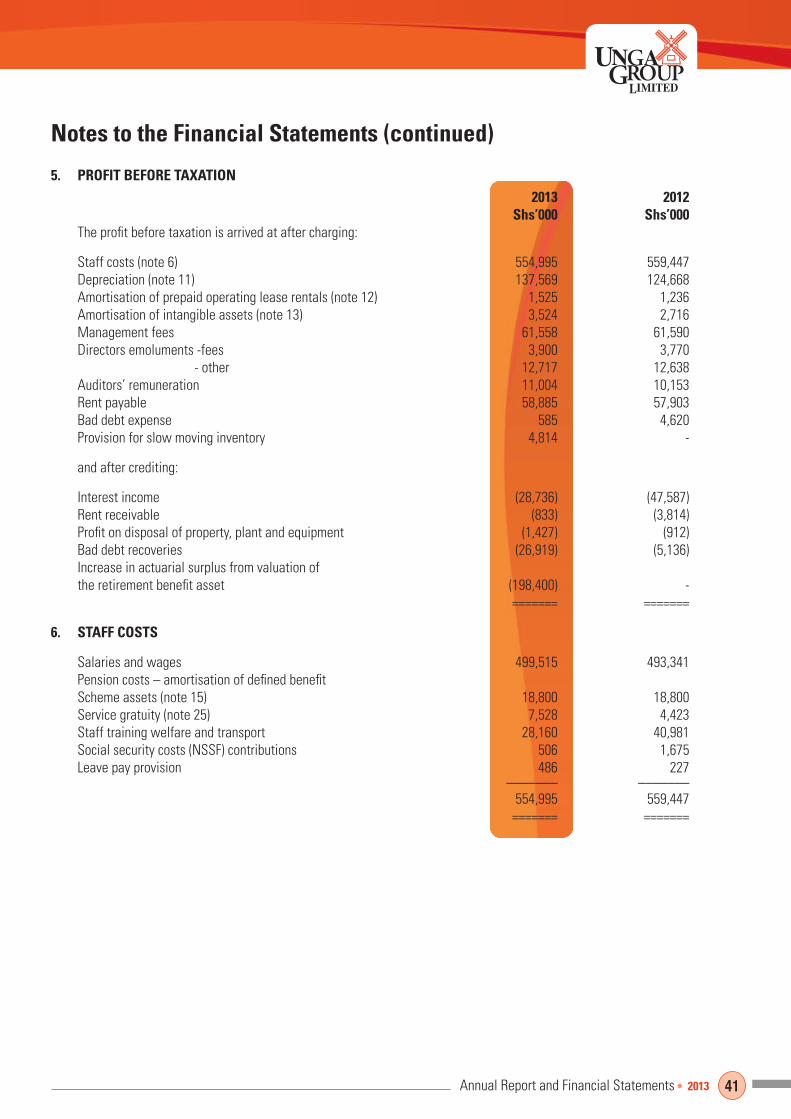
41Annual Report and Financial Statements
Notes to the Financial Statements (continued)
5. PROFIT BEFORE TAXATION
The profit before taxation is arrived at after charging:
Staff costs (note 6) 554,995 559,447Depreciation (note 11) 137,569 124,668Amortisation of prepaid operating lease rentals (note 12) 1,525 1,236Amortisation of intangible assets (note 13) 3,524 2,716Management fees 61,558 61,590Directors emoluments -fees 3,900 3,770 - other 12,717 12,638Auditors’ remuneration 11,004 10,153Rent payable 58,885 57,903Bad debt expense 585 4,620Provision for slow moving inventory 4,814 -
and after crediting:
Interest income (28,736) (47,587)Rent receivable (833) (3,814)Profit on disposal of property, plant and equipment (1,427) (912)Bad debt recoveries (26,919) (5,136) Increase in actuarial surplus from valuation of the retirement benefit asset (198,400) - ======= =======
6. STAFF COSTS
Salaries and wages 499,515 493,341Pension costs – amortisation of defined benefit Scheme assets (note 15) 18,800 18,800Service gratuity (note 25) 7,528 4,423Staff training welfare and transport 28,160 40,981Social security costs (NSSF) contributions 506 1,675Leave pay provision 486 227 _______ _______ 554,995 559,447 ======= =======

42 Annual Report and Financial Statements
7. TAXATION
(a) Taxation charge
Current taxation based on the chargeableprofit for the year at 30% 190,259 76,311Prior year under provision (4,941) 2,669 ______ ______ 185,318 78,980 ______ ______Deferred taxation (credit)/charge (note 16)- Current year (30,960) 85,983- Prior year over provision (135) (589) ______ ______
(31,095) 85,394 ______ ______ 154,223 164,374 ======= =======
(b) Reconciliation of taxation charge to the expected tax based on accounting profit
Accounting profit before taxation 662,243 512,569 ======= =======
Tax charge at the applicable rate of 30% 198,673 153,771Tax effect of expenses not allowable for tax 25,749 13,730Tax effect of income not subject to tax (67,913) (5,207)Deferred tax credit not taken up 2,790 -Prior year current tax under provision (4,941) 2,669Prior year deferred tax over provision (135) (589) ______ ______Taxation charge 154,223 164,374 ====== =======
(c) Taxation payable/(recoverable)
At beginning of year:
Payable 10,455 81,424Recoverable (132,290) (6,584) _______ ______ (121,835) 74,840
Charge for the year 185,318 78,980Exchange adjustment 215 41Payments during the year (19,414) (275,696) ______ ______
At end of year 44,284 (121,835) ======== ========
Notes to the Financial Statements (continued)

43Annual Report and Financial Statements
Notes to the Financial Statements (continued)
7. TAXATION (continued)
(c) Taxation payable/(recoverable) (continued)
Comprising:
Payable 73,882 10,455Recoverable (29,598) (132,290) ______ _______
44,284 (121,835) ======= =======
(d) Taxation recoverable - COMPANY
At beginning of year 10,203 1,854Prior year over provision (1,276) 2,300Payments during the year 1,846 6,049 ______ ______
At end of year 10,773 10,203 ======= =======
8. PROFIT FOR THE YEAR
A profit of Shs 52,143,000 (2012 – Shs 55,522,000) has been dealt with in the books of the company, Unga Group Limited.
9. EARNINGS PER SHARE
Basic earnings per share has been calculated by dividing the net profit attributable to shareholders by the weighted average number of ordinary shares in issue during the year.
Profit for the year attributable to shareholders (Shs ‘000) 309,985 212,683 ========= =========
Weighted average number of ordinary shares 75,706,986 75,706,986 ========= =========
Basic earnings per share Sh 4.09 Sh 2.81 ========= =========
Diluted earnings per share is the same as basic earnings per share.

44 Annual Report and Financial Statements
Dividend – proposed (Shs) 56,780,240 56,780,240 ========= =========Number of ordinary shares 75,706,986 75,706,986 ========= =========Dividend per share Shs 0.75 Shs 0.75 ========= =========
Notes to the Financial Statements (continued)
In respect of the current financial year, the directors propose a first and final dividend of Shs 0.75 (2012 – Shs 0.75) per ordinary share totalling Shs 56,780,240 (2012 – Shs 56,780,240). The proposed dividend is subject to approval by shareholders at the Annual General Meeting and has not been included as a liability in these financial statements.
Payment of dividend is subject to withholding tax at a rate of 10% for non-resident shareholders and 5% for resident shareholders. For resident shareholders, withholding tax is only deductible where the shareholding is below 12.5%.
11. PROPERTY, PLANT AND EQUIPMENT
Group Plant, Capital Leasehold machinery, Motor work in buildings and equipment vehicles progress Total Shs’000 Shs’000 Shs’000 Shs’000 Shs’000
Cost or Valuation
At 1 July 2011 857,738 1,193,342 156,069 18,110 2,225,259Exchange adjustments (3,028) (5,608) (424) (373) (9,433)Additions 1,727 239,153 37,225 5,587 283,692Transfer from Capital Work In Progress - 12,748 - (12,748) - Disposals - (108,234) (19,299) - (127,533) _______ ________ _______ ________ ________At 30 June 2012 856,437 1,331,401 173,571 10,576 2,371,985 _______ ________ _______ _______ ________Comprising:
Valuation in 2008 850,666 919,148 - - 1,769,814Cost 5,771 412,253 173,571 10,576 602,171 _______ ________ _______ ________ ________ 856,437 1,331,401 173,571 10,576 2,371,985 _______ ________ _______ ________ ________
At 1 July 2012 856,437 1,331,401 173,571 10,576 2,371,985Exchange adjustments (2,032) (4,106) (285) - (6,423)Additions - 57,733 5,243 291,242 354,218 Disposals - (536) (4,094) - (4,630)Asset write off - (178) - - (178)Transfer from Capital Work In Progress - 6,911 - (6,911) -Revaluation adjustment (121,616) (97,839) - - (219,455)Transfer to property heldfor sale (note 21) - (11,599) - - (11,599) _______ ________ _______ ________ ________At 30 June 2013 732,789 1,281,787 174,435 294,907 2,483,918 _______ ________ _______ ________ ________

45Annual Report and Financial Statements
Notes to the Financial Statements (continued)
11. PROPERTY, PLANT AND EQUIPMENT (continued)
Cost or Valuation (continued) Plant, Capital Leasehold machinery, Motor work in buildings and equipment vehicles progress Total Shs’000 Shs’000 Shs’000 Shs’000 Shs’000 Comprising: Valuation in 2013 732,789 1,152,797 - - 1,885,586Cost - 128,990 174,435 294,907 598,332 ________ _________ _______ ________ ________At 30 June 2013 732,789 1,281,787 174,435 294,907 2,483,918 ________ _________ _______ ________ ________
Depreciation
At 1 July 2011 80,278 516,698 132,099 - 729,075Exchange adjustments (505) (1,727) (98) - (2,330)Charge for the year 25,439 82,054 17,175 - 124,668Eliminated on disposal - (103,513) (9,248) - (112,761) ________ _________ _______ ________ ________At 30 June 2012 105,212 493,512 139,928 - 738,652 ________ _________ _______ ________ ________
At 1 July 2012 105,212 493,512 139,928 - 738,652Exchange adjustments (379) (1,428) (121) - (1,928)Charge for the year 26,469 94,929 16,171 - 137,569Eliminated on disposal - (536) (4,094) - (4,630)Eliminated on write off - (178) - - (178)Eliminated on revaluation (131,302) (463,339) - - (594,641) ________ _________ _______ ________ ________At 30 June 2013 - 122,960 151,884 - 274,844 ________ _________ _______ ________ ________
Net Book Value
At 30 June 2013 732,789 1,158,827 22,551 294,907 2,209,074 ======== ======== ======= ======= ========At 30 June 2012 751,225 837,889 33,643 10,576 1,633,333 ======== ======== ======= ======= ========
Net Book Value (Cost basis)
At 30 June 2013 179,885 650,588 88,760 294,907 1,214,140 ======== ======== ======= ======= ========At 30 June 2012 305,797 640,855 33,643 10,576 992,871 ======== ======== ======= ======= ========
All buildings and certain items of plant, machinery and equipment were revalued as at 30 June 2013 by Knight Frank Valuers Limited, Registered Valuers and Estate Agents. Buildings were revalued on an open market value while plant and machinery were revalued on the depreciated replacement costs basis.
Included in property, plant and equipment are fully depreciated assets with a cost/valuation of Shs 307,468,210
(2012 – Shs 263,863,000). The normal annual depreciation on these assets would have been Shs 65,767,122 (2012 – Shs 31,902,186).
The Group has pledged assets with net book value of Shs 516,181,028 (2012 - Shs 536,581,000) to secure its borrowings facilities (See note 24).

46 Annual Report and Financial Statements
Group
CostAt beginning of year 58,432 59,597Exchange adjustment (406) (1,165) _______ _______At end of year 58,026 58,432 _______ _______
AmortisationAt beginning of year 20,619 19,160Exchange adjustment 194 223Amortisation for the year 1,525 1,236 _______ _______At end of year 22,338 20,619 _______ _______Net Book ValueAt end of year 35,688 37,813 ======= =======
Notes to the Financial Statements (continued)
The operating lease prepayment relates to leasehold land. The leasehold land was revalued as at 30 June 2013 by Knight Frank Valuers Limited on an open market value basis for existing use at Shs 878,500,000.
The Group has pledged leasehold land with a net book value of Shs 13,844,604 (2012 – Shs 13,845,760) to secure borrowings granted to it (See note 24).
GroupCostAt beginning of year 49,815 47,876Additions 6,650 2,051Exchange difference (6) (112) _______ ______At end of year 56,459 49,815 _______ ______AmortisationAt beginning of year 44,143 41,442Exchange difference (2) (15) Amortisation for the year 3,524 2,716 _______ ______At end of year 47,665 44,143 _______ ______
Net Book ValueAt end of year 8,794 5,672 ======= ======

47Annual Report and Financial Statements
Notes to the Financial Statements (continued)
14. INVESTMENT IN SUBSIDIARY COMPANY
Company
Unquoted investment at cost in wholly owned subsidiary: Unga Investments Limited 1,297,335 1,297,335 ======= ======== Details of the company’s subsidiaries are as follows:
Unga Investments Limited has a 65% holding in its subsidiary, Unga Holdings Limited, which has the following subsidiaries:
Unga Farm Care (East Africa) Limited has a 74% holding in Unga Farm Care (Tanzania) Limited, a company incorporated in Tanzania. This subsidiary is dormant and is currently undergoing liquidation. The carrying amount of this investment has been fully impaired.
The Group acquired the entire non-controlling interests in Unga Millers (U) Limited at 31 December 2012.
15. RETIREMENT BENEFITS ASSET
Group
The Group operates a defined benefits pension plan for employees working for Group companies. The retirement benefits scheme asset represents the surplus of the fair value of scheme assets over the value of past service pension benefits, following an actuarial valuation carried out by Alexander Forbes Financial Services (East Africa) Limited as at 30 June 2013 using the projected unit credit methodology.
Name Share capital Country of incorporation Principal activity Percentage
Holding
Unga Investments Limited 22,200 Kenya Operates as a holding and an investment company. 100%
Company Share capital Country of Incorporation Principal activity Percentage
Unga Limited 220,000 Kenya Milling and sale of wheat and maize flour. 100%Unga Farm Care (East Africa) Limited 22,520 Kenya Manufacture of animal nutrition products
and distribution of animal health products. 100%
Unga Feeds Limited 42,300 Kenya Dormant company. 100%Unga Foods Limited 15,400 Kenya Dormant company. 100%
Bullpak Limited 4,760 KenyaManufacture and sale of packaging material for wheat and maize flour products.
51%
Unga Millers (U) Limited 7,280 UgandaMilling and sale of wheat and maize flour, and distribution of animal nutrition products.
100%

48 Annual Report and Financial Statements
15. RETIREMENT BENEFITS ASSET (continued)
Group (continued)
In accordance with a recommendation by the Actuaries, the Group is taking a contribution holiday with effect from 1 January 2013 until the next valuation. The length of the contribution holiday is subject to review at every valuation date based on the advice of the Actuaries. The next actuarial valuation is due as at 31 December 2015.
The principal actuarial assumptions applied in the last valuation were:
Rate of interest 12.5%Rate of salary escalation 7.0%Rate of pension increases 0% ======
Amounts recognised in profit or loss in respect of the defined benefit plan are as follows:
Surplus on actuarial valuation during the year 198,400 -Amortisation of actuarial surplus (18,800) (18,800) _______ _______
Excess of plan assets over accrued liabilities 179,600 (18,800) ======= ========
The amount included in the statement of financial position arising from the Group’s obligation in respect of this defined benefit plan is as follows:
Fair value of plan assets 398,800 268,300Present value of funded defined benefit obligations (174,200) (176,300) _______ _______Excess of plan assets over accrued liabilities 224,600 92,000 ======== ========Movement:Share of excess of plan assets over accrued liabilities at beginning of year 92,000 92,000Surplus for the year 132,600 - _______ _______
At end of year 224,600 92,000 _______ _______Amortisation:Amortisation at beginning of year (47,000) (28,200)Charge recognised in profit or loss (18,800) (18,800)Surplus for the year 65,800 - _______ _______Amortisation at end of year - (47,000) _______ _______
Net asset arising from defined benefit obligation 224,600 45,000 ======== ========
Notes to the Financial Statements (continued)

49Annual Report and Financial Statements
Notes to the Financial Statements (continued)
16 DEFERRED TAXATION
Group
Deferred taxation is provided on all temporary differences under the liability method using the currently enacted rate of 30%.
The net deferred taxation liability is made up as follows:
Deferred tax liabilities:Accelerated capital allowances 146,804 146,769Revaluation surpluses in subsidiary companies 354,427 252,518Unrealised exchange differences - 13,637 _______ _______ 501,231 412,924 _______ _______Deferred tax assets:Tax losses available for offset against future profits (5,325) (2,344) Provision for leave pay (2,001) (2,779)General provisions (44,700) (43,582)Provision for service gratuity (20,734) (19,422)Unrealised exchange differences (6,628) - _______ _______ (79,388) (68,127) _______ _______
Net deferred tax liability 421,843 344,797Less deferred tax asset on tax losses not recognised (2,790) - _______ _______Net deferred tax liability recognised 424,633 344,797 ======== ========
Movement on the deferred tax account is as follows:
At beginning of year 344,797 261,349Exchange adjustments (1,626) (1,946)Profit or loss (charge)/credit (note 7) (30,960) 85,394Prior year over provision (135) -Charged to other comprehensive income 112,557 - ______ _______
At end of year 424,633 344,797 ======= ======Comprising:
Deferred tax asset (3,039) (43,550)Deferred tax liability 427,672 388,347 ______ _______
424,633 344,797 ======= ========
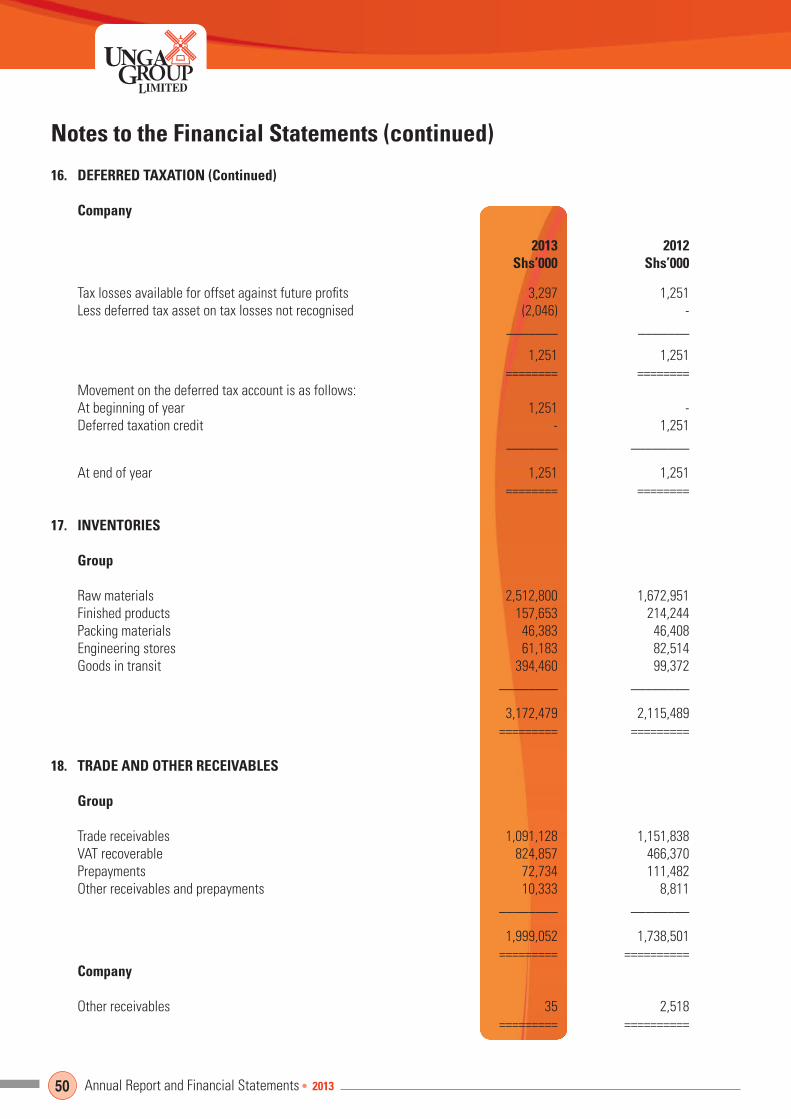
50 Annual Report and Financial Statements
16. DEFERRED TAXATION (Continued)
Company
Tax losses available for offset against future profits 3,297 1,251 Less deferred tax asset on tax losses not recognised (2,046) - _______ _______
1,251 1,251 ======== ========Movement on the deferred tax account is as follows:At beginning of year 1,251 - Deferred taxation credit - 1,251 _______ ________
At end of year 1,251 1,251 ======== ========
17. INVENTORIES
Group
Raw materials 2,512,800 1,672,951Finished products 157,653 214,244Packing materials 46,383 46,408Engineering stores 61,183 82,514Goods in transit 394,460 99,372 ________ ________
3,172,479 2,115,489 ========= =========
18. TRADE AND OTHER RECEIVABLES
Group
Trade receivables 1,091,128 1,151,838VAT recoverable 824,857 466,370Prepayments 72,734 111,482Other receivables and prepayments 10,333 8,811 ________ ________
1,999,052 1,738,501 ========= ==========Company
Other receivables 35 2,518 ========= ==========
Notes to the Financial Statements (continued)

51Annual Report and Financial Statements
19. SUBSIDIARY COMPANIES BALANCES
Company
(a) Due from Subsidiary Companies
Unga Limited - 6,477Unga Feeds Limited 7,000 7,000Unga Holdings Limited 62,053 - _______ _______ 69,053 13,477 ======== ========
(b) Due to Subsidiary Companies
Unga Holdings Limited - 23,013Unga Investments Limited 140,539 119,744Unga Limited 3,126 - _______ _______ 143,665 142,757 ======== ========
Group
Maturing within 90 days 219,511 -Maturing within 180 days - 280,000 _______ _______
219,511 280,000 ======== ========CompanyMaturing within 90 days 219,511 -Maturing within 180 days - 280,000 _______ _______
219,511 280,000 ======== ========
The effective interest rate on term deposits as at 30 June 2013 was 6.9% (2012 – 17.2%).
Group
At beginning and end of year 3,928 3,928 Transfer from property plant and equipment (note 11) 11,599 - _______ _______
15,527 3,928 ======== ========
The Group intends to dispose of a parcel of leasehold land and plant and machinery it no longer utilises in the next twelve months. A search is underway for a buyer.
Notes to the Financial Statements (continued)

52 Annual Report and Financial Statements
Authorised: 82,760,000 ordinary shares of Shs 5 each 413,800 413,800 ======= =======Issued and fully paid:75,706,986 ordinary shares of Shs 5 each 378,535 378,535 ======= =======
Group
At beginning of year 1,313,453 1,214,316Dividend paid (52,134) (30,574)Acquisition of non-controlling interests by shareholders of the parent (17,947) - _______ _______
1,243,372 1,183,742 _______ _______
Share of profit for the year 198,035 135,512Share of revaluation surplus 111,287 -Exchange adjustment (5,658) (5,801) _______ _______
Total comprehensive income for the year 303,664 129,711 _______ _______
At end of year 1,547,036 1,313,453 ======== ========Acquisition of non-controlling interests:
At beginning of year 25,691 -Share of loss for the period to 31 December 2012 (5,858) -Exchange adjustment (1,886) - _______ _______
17,947 -Cash paid to non-controlling interests (130,872) - _______ _______
Net loss recognised in revenue reserves (112,925) - ======== ========The non-controlling interests consists of:
Unga Holdings Limited:Equity interest held by Seaboard Corporation 35% 1,434,124 1,178,061
Bullpak Limited:Equity interest held by Nampak Holdings Limited 49% 112,912 109,701
Unga Millers (U) Limited:Equity interest held by individual minority shareholders 40% - 25,691 ________ ________
1,547,036 1,313,453 ========= =========
Notes to the Financial Statements (continued)

53Annual Report and Financial Statements
Notes to the Financial Statements (continued)
Group
Bank loans 163,328 - ======= =======The borrowings are repayable as follows:Within one year 13,964 - ______ ______Between two and five years 111,712 -Beyond five years 37,652 - ______ ______Over one year 149,364 - ______ ______ 163,328 - ======= =======Movement in borrowings:At beginning of year - -Loans received 163,328 - ______ ______At end of year 163,328 - ======= =======
The borrowing facilities consist of loans and bank overdrafts. The borrowings are secured by an all assets debenture for Shs 1.5 billion, corporate guarantees of Shs 1.5 billion and legal charges of Shs 1.5 billion over certain properties. (See notes 11 and 12).
The Group has a term loan facility of USD 7,500,000 with its bankers acquired for purposes of financing installation of a wheat milling plant. Interest will be charged at 4% above the 3 months LIBOR rate. The loan has a 3 months moratorium from the date of commissioning of the plant which is expected to be October 2013. The loan is expected to mature in June 2020. The outstanding loan at 30 June 2013 amounted to USD 1,899,092.
The effective interest rate of the loan at 30 June 2013 was 4.36%.
At beginning of year 64,741 60,952Charge recognised in profit or loss 7,528 4,423Paid during the year (3,157) (634) ______ ______At end of year 69,112 64,741 ======= =======The service gratuity represents the present value of future obligations in respect of unionisable staff in accordance with the Collective Bargaining Agreement.
Group
Trade payables 586,660 566,464Other payables and accruals 727,108 608,089 _______ _______ 1,313,768 1,174,553 ======== ========Company
Other payables and accruals 12,142 15,017 ======== =======

54 Annual Report and Financial Statements
Group & Company
At beginning of the year 21,482 21,482Declared in the year 56,780 56,780Dividends paid (56,780) (56,780) ______ _______
At end of year 21,482 21,482 ====== =======
Group
Seaboard Corporation subsidiaries 1,647,283 665,196Nampak Kenya Limited 3,820 5,246Nampak International Limited 92,665 91,021 _______ _______
1,743,768 761,463 ======== ======= The amounts are repayable as follows:
On demand or within one year 1,743,768 761,463 ======== =======
A disclosure note in related parties is provided in note 30.
(a) Reconciliation of profit before taxation to cash generated from operations
Profit before taxation 662,243 512,569
Adjustments for: Depreciation (note 11) 137,569 124,668 Amortisation of prepaid operating lease rentals (note 12) 1,525 1,236 Amortisation of intangible assets (note 13) 3,524 2,716 Profit on disposal of property, plant and equipment (1,427) (912) Amortization of retirement benefits asset (note 15) 18,800 18,800 Increase in actuarial surplus arising fromvaluation of the retirement benefit asset (note 15) (198,400) -
Working capital changes;
Increase in inventories (1,067,235) (197,695)Increase in trade and other receivables (249,658) (664,055)
Notes to the Financial Statements (continued)

55Annual Report and Financial Statements
Notes to the Financial Statements (continued)
(a) Reconciliation of profit before taxation to cash generated from operations (continued)
Increase in trade and other payables 137,414 483,525Movement in related company balance 982,305 (65,834)Increase in service gratuity 4,371 3,789
______ ______Cash generated from operations 431,031 218,807
======= =======
(b) Analysis of the balances of cash and cash equivalents as shown in the statement of financial position
Bank balances 398,960 364,171Cash balances 605 420 _______ ______ 399,565 364,591Term deposits (note 20) 219,511 - _______ ______At end of year 619,076 364,591 ======= ======
(c) Exchange adjustments on working capital
Inventories (10,248) (8,498)Trade and other receivables (963) (5,211)Trade and other payables (34) 4,999 ______ ______ (11,245) (8,710) ======= =======
For the purposes of the statement of cash flows, cash equivalents include short term liquid investments which are readily convertible into known amounts of cash and which were within three months of maturity when acquired, less advances from the bank repayable within three months from the date of advance.
Group
During the year the following transactions were entered into with related parties:
Purchase of goods/services:
Raw material purchases – Seaboard Overseas Limited 4,054,052 4,160,108Other expenses – Seaboard Overseas Management Company 101,380 62,295 – Nampak Kenya Limited 12,815 9,141Purchase of equipment and spares – Seaboard Overseas Group 379,526 95,337Interest charged – Seaboard Overseas Limited 9,499 9,125 ======== ========
Sale of goods/services:
Sale of finished goods – Kenchic Limited 1,525,329 1,500,413 ======== ========

56 Annual Report and Financial Statements
Group (continued)
Amounts not settled as at the end of the reporting period are disclosed in note 28.
The Group is related to one of its bankers, NIC Bank Limited, by virtue of common directorship.
The Group is also related to one of its customers, Kenchic Limited, by virtue of common directorship. Amounts not settled as at the end of the reporting period and included in trade receivables amount to Shs 377,018,295 (2012 – 317,139,719).
Key management compensation
The remuneration of directors and other members of key management during the year were as follows:
Salaries and other short-term employment benefits 40,590 58,815 ======= =======Directors’ remuneration
Fees for services as a director 3,900 3,770Other emoluments (included in key managementcompensation above) 12,717 12,638 ______ _______ 16,617 16,408 ======= ========
The Group manages its capital to ensure that it will be able to continue as a going concern while maximising the return to stakeholders through the optimisation of the debt and equity balance.
The capital structure of the Group consists of equity attributable to equity holders, comprising issued capital and reserves as well as borrowings. Consistent with others in the industry, the Group monitors capital on the basis of the gearing ratio. This ratio is calculated as net debt divided by total capital. Net debt is calculated as total borrowings less cash and cash equivalents.
The constitution of capital managed by the Group is as follows:
Share capital 378,535 378,535Share premium 73,148 73,148Revaluation surplus 797,656 670,898Translation reserve (15,729) (5,221)Revenue reserve 1,723,590 1,558,405 _______ _______Equity 2,956,879 2,675,765 ======== ========
Borrowings (note 24) 163,328 - Less: cash equivalents (note 29(b)) (619,076) (362,786) _______ _______Net debt (455,748) (362,786) ======== ========Gearing ratio - - ======== ========
Notes to the Financial Statements (continued)

57Annual Report and Financial Statements
Notes to the Financial Statements (continued)
The Group’s activities expose it to a variety of financial risks, including credit risk and the effects of changes in debt prices, foreign currency exchange rates and interest rates. The Group’s overall risk management programme focuses on the unpredictability of financial markets and seeks to minimise potential adverse effects on its financial performance.
Risk management is carried out by management under policies based on guidance received from the board of directors. Management identifies and evaluates financial risks. The board provides guidance for overall risk management, as well as providing direction on specific areas such as foreign exchange risk and liquidity risk. The Group has policies in place to ensure that sales are made to customers with an appropriate credit history.
Credit risk
Credit risk is managed on a group-wide basis. Credit risk arises from cash and cash equivalents, deposits with banks, as well as trade and other receivables. The credit risk on liquid funds is limited because the counterparties are banks with high credit-ratings assigned by the banking regulatory authority The Group management assesses the credit quality of each customer, taking into account their financial position, past experience and other factors. Individual risk limits are set based on internal or external ratings in accordance with limits set by the management. The utilisation of credit limits is regularly monitored.
The amount that best represents the Group’s and Company’s maximum exposure to credit risk as at the end of each reporting period is made up as follows:
Group Fully performing Past due Impaired Total Shs’000 Shs’000 Shs’000 Shs’000
Trade receivables 1,065,851 25,277 195,324 1,286,452Bank balances 398,960 - - 398,960Term deposits 219,511 - - 219,511 _______ ______ _______ _______Total financial assets 1,684,322 25,277 195,324 1,904,923 ======== ======= ======= ========
Trade receivables 856,191 242,465 192,082 1,290,738Due from group companies 70,951 - - 70,951Bank balances 362,366 - - 362,366 _______ _______ _______ _______
1,289,508 242,465 192,082 1,724,055 ======== ======== ======= ========
Company
Due from subsidiary companies 69,053 - - 69,053Bank balances 2,027 - - 2,027Term deposits 219,511 - - 219,511 ________ ________ _______ _______ 290,591 - - 290,591 ======== ======== ======== ========

58 Annual Report and Financial Statements
Credit risk (continued)
Company (continued)
30 June 2012
Due from subsidiary companies 13,477 - - 13,477Bank balances 1,805 - - 1,805Term deposits 280,000 - - 280,000 ________ ______ _______ _______ 295,282 - - 295,282 ======== ======= ======== ========
Notes to the Financial Statements (continued)
The customers under the fully performing category are paying their debts as they continue trading.
The receivables that are past due relate to trade receivables overdue between 30 to 120 days. The receivables are not impaired and continue to be paid. The credit control department is actively following these receivables. Cash deposits of Shs 36,289,131 (2012: Shs 32,535,000) and bank guarantees amounting to Shs 544,750,000 (2012: Shs 504,300,000) are held as collateral for trade receivables.
The impaired amounts are fully provided for and the amount of loss incurred dealt with in profit or loss in the year of impairment.
In determining the recoverability of a trade receivable, the group considers any change in the credit quality of the trade receivable from the date credit was initially granted up to the end of the reporting period..
Concentration risk
One customer accounts for 10% of the revenue of the group
(2012 – 9%). This customer has a high credit rating. All other sales are to a large and unrelated customer base.
Liquidity risk
Ultimate responsibility for liquidity risk management rests with the board of directors, which together with management, closely monitors the Group’s short, medium and long term funding and liquidity management requirements. The group manages liquidity risk by maintaining adequate reserves, banking facilities and reserve borrowing facilities, by continuously monitoring forecast and actual cash flows and matching the maturity profiles of financial assets and liabilities.
The table below analyses the Group’s financial liabilities that will be settled on a net basis into relevant maturity groupings based on the remaining period at end of reporting period to the contractual maturity date. The amounts disclosed in the table below are the contractual undiscounted cash flows. Balances due within 12 months equal their carrying balances, as the impact of discounting is not significant.
Group 1-3 4-12 Over months months 1 year Total Shs’000 Shs’000 Shs’000 Shs’000
Assets:Trade receivables 987,914 103,214 - 1,091,128Bank balances 398,960 - - 398,960Term deposits 219,511 - - 219,511 ________ _______ ________ ________ Total financial assets 1,606,385 103,214 - 1,709,599 ________ _______ ________ ________
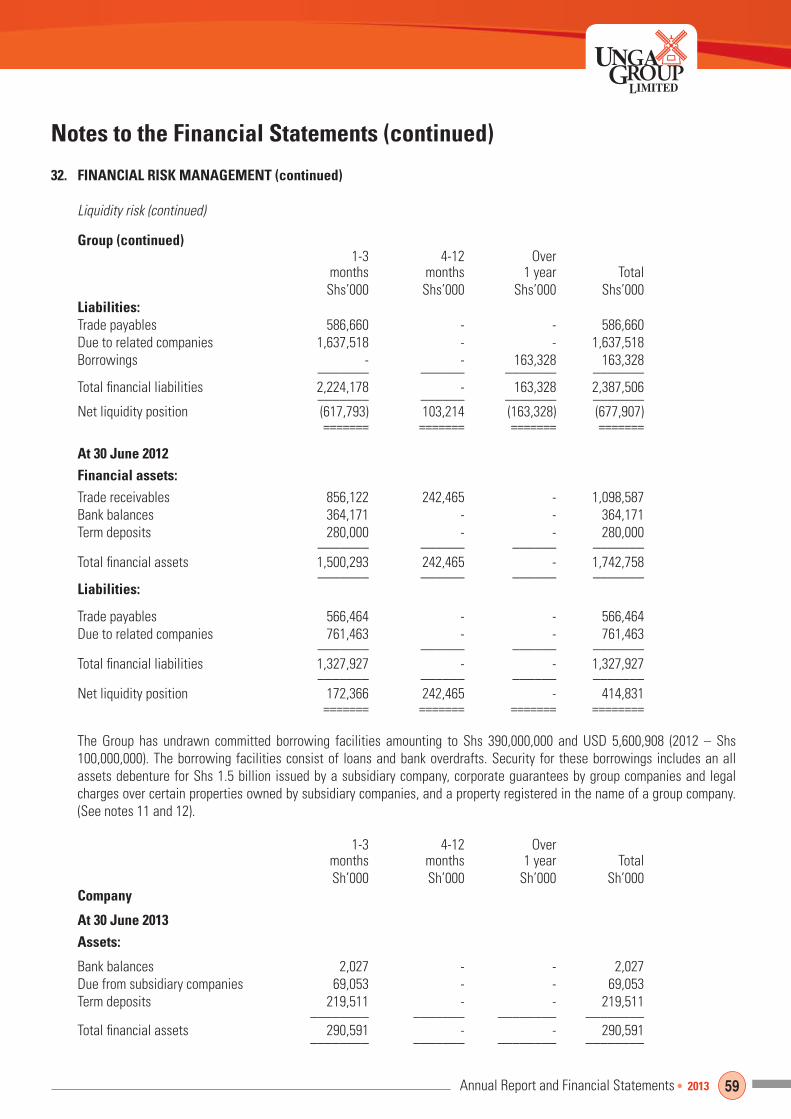
59Annual Report and Financial Statements
Liquidity risk (continued)
Group (continued) 1-3 4-12 Over months months 1 year Total Shs’000 Shs’000 Shs’000 Shs’000Liabilities:Trade payables 586,660 - - 586,660Due to related companies 1,637,518 - - 1,637,518Borrowings - - 163,328 163,328 _______ ______ _______ _______Total financial liabilities 2,224,178 - 163,328 2,387,506 _______ ______ _______ _______Net liquidity position (617,793) 103,214 (163,328) (677,907) ======= ======= ======= =======
Financial assets:Trade receivables 856,122 242,465 - 1,098,587Bank balances 364,171 - - 364,171Term deposits 280,000 - - 280,000 _______ ______ ______ _______Total financial assets 1,500,293 242,465 - 1,742,758 _______ ______ ______ _______Liabilities:
Trade payables 566,464 - - 566,464Due to related companies 761,463 - - 761,463 _______ ______ ______ _______Total financial liabilities 1,327,927 - - 1,327,927 _______ ______ ______ _______Net liquidity position 172,366 242,465 - 414,831 ======= ======= ======= ========
The Group has undrawn committed borrowing facilities amounting to Shs 390,000,000 and USD 5,600,908 (2012 – Shs 100,000,000). The borrowing facilities consist of loans and bank overdrafts. Security for these borrowings includes an all assets debenture for Shs 1.5 billion issued by a subsidiary company, corporate guarantees by group companies and legal charges over certain properties owned by subsidiary companies, and a property registered in the name of a group company. (See notes 11 and 12).
1-3 4-12 Over months months 1 year Total Sh’000 Sh’000 Sh’000 Sh’000Company
Assets:
Bank balances 2,027 - - 2,027Due from subsidiary companies 69,053 - - 69,053Term deposits 219,511 - - 219,511 ________ _______ ________ ________ Total financial assets 290,591 - - 290,591 ________ _______ ________ ________
Notes to the Financial Statements (continued)

60 Annual Report and Financial Statements
Liquidity risk (continued)
Company (continued)
1-3 4-12 Over months months 1 year Total Shs’000 Shs’000 Shs’000 Shs’000
Liabilities:
Due to related companies 143,665 - - 143,665 _______ ______ ______ ______Net liquidity position 146,926 - - 146,926 ======== ======= ======= =======
Assets:
Due from subsidiary companies 13,477 - - 13,477Bank balances 1,805 - - 1,805Term deposits 280,000 - - 280,000 ________ ______ ______ ______Total financial assets 295,282 - - 295,282 ________ ______ ______ ______
Liabilities:
Due to related companies 142,757 - - 142,757 _______ ______ ______ ______Net liquidity position 152,525 - - 152,525 ======== ======= ======= =======
Notes to the Financial Statements (continued)
Market risks
(i) Interest rate risk
Interest rate risks arise from fluctuations in the bank borrowing rates. The interest rates vary from time to time depending on the prevailing economic circumstances. The Group closely monitors the interest rate trends to minimize the potential adverse impact of interest rate changes.
As at 30 June 2013, the Group had short term and fixed deposits with a carrying amount of Shs 219,511,000 (2012: Shs 280,000,000). An increase or decrease of 10 percent in the interest rate would result in an increase/decrease in pre-tax profit and total capital
of Shs 1,514,626 (2012: Shs 4,816,000). The company had no other interest bearing financial assets and liabilities. At 30 June 2013, the company had an outstanding USD denominated loan subject to variable interest rate for the construction of a new plant. Had the interest increased by 10% with all other variables held constant, the impact on total capital would have been Shs 57,980.
(ii) Price risk
Price risk arises from fluctuations in the prices of equity investments. At 30 June 2013 and 30 June 2012, the group did not hold investments that would be subject to price risk; hence this risk is not relevant.

61Annual Report and Financial Statements
Liquidity risk (continued)
(iii) Foreign exchange risk
The Group undertakes certain transactions denominated in foreign currencies. Exchange rate exposures are managed within approved policy parameters.
The carrying amounts of the Group’s foreign currency denominated monetary assets and liabilities at the end of each reporting period date are as follows:
USD GBP EURO
Assets
Bank and cash balances 50,107 - 882 ======= ======= =======Liabilities
Trade payables 39,845 - 1,318Due to related companies 1,591,691 92 439,694Borrowings 163,328 - - ________ ______ _______ 1,794,864 92 441,012 ======== ======= =======
Assets
Bank and cash balances 15,295 - 35,884Trade receivables 20,734 - - ______ ______ ______
36,029 - 35,884 ======= ======= =======Liabilities
Trade payables 130,786 - 2,612Due to related companies 403,052 545 174,700 ______ ______ ______ 533,838 545 177,312 ======= ======= =======
Notes to the Financial Statements (continued)
At 30 June 2013, if the Shilling had weakened/strengthened by 5% against the foreign currencies with all other variables held constant, the impact on pre tax profit for the year and total capital would have been Shs 109,247,500 (2012: Shs 33,025,800) lower/higher, mainly as a result of imports, bank balances and borrowings.
Company
The company has no foreign currency denominated financial instruments and thus is not exposed to foreign exchange risks.

62 Annual Report and Financial Statements
Group
Commitments at the year-end for which no provision has been made in these financial statements:
Authorised and contracted for 283,466 23,885 Authorised but not contracted for 891,103 958,524 _______ _______ 1,174,569 982,409 ======== ======= The bulk of the capital commitments relate to the acquisition of plant and machinery.
Guarantees 62,986 64,205Bills and letters of credit 18,958 122,014 _______ _______ 81,944 186,219 ======== =======
Several legal claims have been made against the group by former employees, mainly for wrongful dismissal or industrial accident claims. The cases are on-going and their likely outcomes are not known.
The directors, based on advice received from the group’s legal advisors, believe no material liability will arise from these cases.
The company is domiciled and incorporated in Kenya under the Companies Act.
The financial statements are presented in Kenya Shillings thousands (Shs’000).
Notes to the Financial Statements (continued)

63Annual Report and Financial Statements
I/WE
of being a member/members
of Unga Group Limited, hereby appoint
and failing him/her whom failing, the duly appointed Chairman of the Meeting, as my/our proxy, to vote for me/us and on my/our behalf at the EightySixth Annual General meeting of the Company to be held on Thursday, 28 November 2013 at 10.30 a.m. and at any adjournment thereof.
As witness my/our hand this day of 2013
Signed
Notes
1. If you are unable to attend this meeting personally, this form should be completed and returned to the Secretary, Unga Group Limited, P O Box 30096, 00100 Nairobi, to reach her no later than 48 hours before the time appointed for the meeting.
2. A person appointed to act as a proxy need not also be a member of the Company.3. If the appointer is a corporation, this form must be under its common seal or under the hand of an officer or an attorney
duly authorised in writing.
Form of Proxy
I authorise my proxy to vote as follows on the resolutions for the meeting:
Item Yes No2456 (a) (i) (ii) 6 (b) (i) (ii)78910 (a) (b)11
64 Annual Report and Financial Statements
The Secretary
UNGA GROUP LIMITED
P.O. Box 30096
00100 GPO
NAIROBI
FOLD 3
FOLD 2
FO
LD
1