
CONTENTS Our Stakeholders Pro˜le Annual Report 2017 Special Features ESG Information Financial...
CONTENTS To Our Stakeholders 3 Casio’s Strength 4 Business Overview Profile 5 Six Global Timepiece Brands 6 Timepieces 7 GAKUHAN Business 8 Musical Instruments 9 New Business (Wrist Devices) 10 System Equipment Business Special Features 11 Corporate Governance 12 Corporate Social Responsibility (CSR) Activities ESG Information 17 Management’s Discussion and Analysis 18 Business Risks 21 Consolidated Balance Sheets 20 Consolidated Five-Year Summary 22 Consolidated Statements of Income and Consolidated Statements of Comprehensive Income 23 Consolidated Statements of Changes in Net Assets 24 Consolidated Statements of Cash Flows 25 Notes to Consolidated Financial Statements 42 Independent Auditor’s Report Financial Section 43 Principal Subsidiaries Directors and Audit & Supervisory Board Members 44 Corporate Data / Investor Information Corporate Data
-
Upload
trinhkhanh -
Category
Documents
-
view
216 -
download
4
Transcript of CONTENTS Our Stakeholders Pro˜le Annual Report 2017 Special Features ESG Information Financial...

CONTENTS
To Our Stakeholders
3 Casio’s Strength
4 Business Overview
Profile
5 Six Global Timepiece Brands
6 Timepieces
7 GAKUHAN Business
8 Musical Instruments
9 New Business (Wrist Devices)
10 System Equipment Business
Special Features
11 Corporate Governance
12 Corporate Social Responsibility (CSR) Activities
ESG Information
17 Management’s Discussion and Analysis
18 Business Risks
21 Consolidated Balance Sheets
20 Consolidated Five-Year Summary
22 Consolidated Statements of Income and Consolidated Statements of Comprehensive Income
23 Consolidated Statements of Changes in Net Assets
24 Consolidated Statements of Cash Flows
25 Notes to Consolidated Financial Statements
42 Independent Auditor’s Report
Financial Section
43 Principal Subsidiaries Directors and Audit & Supervisory Board Members
44 Corporate Data / Investor Information
Corporate Data

Annual Report 2017 PAGE 1CONTENTS
Message from the Chairman and the President
Kazuo KashioChairman and
Chief Executive Officer
To Our Stakeholders
In fiscal 2017, the impact of the Kumamoto Earthquake and production adjustments and sales restrictions related to structural
changes in the System Equipment segment led to downward revisions in our earnings forecast at the end of the second quarter.
The revised forecast called for net sales of ¥330.0 billion and operating income of ¥30.5 billion. Net sales fell short of this
target, but operating income, ordinary income and profit attributable to owners of parent all achieved their targets.
In the timepiece business, which accounts for half of overall Company sales and the majority of income, G-SHOCK
shipments were robust. These shipments grew by 0.5 million units year on year, to a total of 8.5 million units shipped. The
overall timepiece business maintained an operating profit margin of 20%.
In the education products business, although sales declined from the previous fiscal year, the operating profit margin
was 7%. The calculator business, which accounts for approximately 50% of education products business sales, remained on
track with an operating profit margin of 16%, with contributions from the sales of scientific calculators introduced mainly for
schools. Net sales of electronic dictionaries, which account for approximately 25% of sales, remained at the same level as in
the previous fiscal year supported by ongoing sales to students, resulting in an operating profit margin of 3%. The receipt of
a large order in the fourth quarter and the contribution from English-language learning devices resulted in an operating profit
margin of 11%. The remaining approximately 25% of sales came from the electronic musical instruments business. Despite a
temporary production delay caused by quality issues resulting in lower sales in the third quarter, conditions returned to normal
in the fourth quarter.
In the digital camera business, sales declined due to the impact of the Kumamoto Earthquake and the emergence of TR series
competitor products in China. However, these losses receded in the fourth quarter when new models in the TR series launched.
The promotion of structural changes in the System Equipment segment during the full fiscal year caused sales to decline, resulting
in losses. Nevertheless, these losses disappeared in the fourth quarter, as structural changes began to bear fruit.
Casio is the one and only company with strengths in the timepiece, scientific calculator and electronic dictionary businesses,
where it will attempt to expand further. At the same time, in areas where markets have matured, we will engage in the creation
of distinctive new genres typical of Casio.
In the timepiece business, we aim to increase G-SHOCK shipments by 0.5 million units year on year, to a total of 9.0 million
units. We will also further invigorate the youth market and expand the young adult market with a focus on the affordably
priced G-STEEL metal analog watch. In addition, we will attempt to expand metal analog watches, which comprise the majority
Business Report for Fiscal 2017
Priority Strategies for Fiscal 2018
Profile Special Features ESG Information Financial SectionTo Our Stakeholders Corporate Data

Annual Report 2017 PAGE 2CONTENTS
of the timepiece market, augmenting all six brands with new generation radio-controlled watches that connect to the Internet
through smartphones. We will also create markets through the proposal of new applications and added value in new areas
such as smartwatches.
With respect to scientific calculators and electronic dictionaries, we will enhance our framework for school sales, one of
our strengths, in each global area and pursue further growth. In the electronic musical instrument, digital camera and projector
businesses, we will share technologies and make other efforts to improve development efficiencies while combining proprietary
technologies in an effort to create new businesses.
In the System Equipment segment, the elimination of fixed expenses through structural changes will contribute to future
profit improvement. We also aim to establish a revenue base by strengthening solutions development. Specifically, we will
attempt to convert to a business model able to generate ongoing revenue by leveraging our strengths in information terminal
hardware for businesses and in businesses targeting small-scale individual business owners.
New market cultivation and improvement policies in each business have enabled us to establish the foundation for a V-shaped
recovery after bottoming out last fiscal year. Going forward, we will make an effort toward ongoing companywide improvements.
Casio is making steady strides in strengthening its business position, maintaining a policy of providing shareholder returns
based on performance. Regarding the distribution of dividends to shareholders, our basic policy is to provide stable dividends, thus
we will provide an annual dividend of ¥40 yen per share, the same as in the previous fiscal year based on fiscal 2017 performance,
and plan to maintain an annual dividend of ¥40 per share in the next fiscal year as well. In fiscal 2018, we will attempt a V-shaped
recovery in earnings to further enhance shareholder returns. Going forward, we will continue making every effort to execute
management in a way that meets the expectations of our shareholders.
To Our Stakeholders
Kazuhiro KashioPresident and
Chief Operating Officer
Kazuo Kashio
Chairman and Chief Executive Officer
Kazuhiro Kashio
President and Chief Operating Officer
Message for Shareholders
Profile Special Features ESG Information Financial SectionTo Our Stakeholders Corporate Data

ProfileTo Our Stakeholders
Annual Report 2017
Special Features ESG Information Financial Section Corporate Data
PAGE 3CONTENTS
Casio’s Strength
High Profitability through Innovative Products
9.5% 9.2%
(Performance in fiscal year ended March 31, 2017)(Performance in fiscal year ended March 31, 2017)
15 (%) 20
15
10
5
0
(%)
12
9
6
3
0
2012
3.0
1.7
7.69.2
13.615.4
6.7
8.3
10.912.0
9.59.2
2013 2014 2015 2016 2017 2012 2013 2014 2015 2016 2017
15 (%) 20
15
10
5
0
(%)
12
9
6
3
0
2012
3.0
1.7
7.69.2
13.615.4
6.7
8.3
10.912.0
9.59.2
2013 2014 2015 2016 2017 2012 2013 2014 2015 2016 2017
Operating Profit Margin ROE

ProfileTo Our Stakeholders
Annual Report 2017
Special Features ESG Information Financial Section Corporate Data
PAGE 4CONTENTS
Business Overview (Year ended March 31, 2017)
Percentage of Total Sales by Segments
Net Sales
Year endedMarch 31, 2017
¥321.2billion
Others 2.7%Principal Products Molds etc.
System Equipment 12.4%
Handheld terminals
Data ProjectorsOffice Computers
ElectronicCash Registers
Principal Products Handheld terminals Electronic cash registers
Office computers Data projectors etc.
Consumer 84.9%
Electronic MusicalInstruments Digital Cameras Wrist Devices
WatchesElectronic
Calculators Electronic Dictionaries
Principal Products Watches Clocks Electronic dictionaries
Electronic calculators Label printers Electronic musical instruments Digital cameras etc.

Special Features
Annual Report 2017
ESG Information Financial Section Corporate DataProfileTo Our Stakeholders
PAGE 5CONTENTS
Six Global Timepiece Brands
Growing Our Six Brands
Absolute Toughness
Built tough with a shockresistant
structure
Feel the Field
Ideal for those with a rugged
lifestyle
Elegance and Technology
Speed and Intelligence
Advanced electronic technology
with sophisticated styling
A fusion of dynamic forms with
elaborate face designs
Elegant, Smart and ShiningMetal watches for stylish
women
Tough and Cool
A unique fusion of function with
fashion

Special Features
Annual Report 2017
ESG Information Financial Section Corporate DataProfileTo Our Stakeholders
PAGE 6CONTENTS
Timepieces
Newly Developed Connected Engine 3-Way
To realize a fully automated timepiece that always keeps accurate time anywhere in the world
GPS + Radio-controlled + Smartphone-link
OCEANUSG-SHOCK

Special Features
Annual Report 2017
ESG Information Financial Section Corporate DataProfileTo Our Stakeholders
PAGE 7CONTENTS
GAKUHAN Businesses
Scientific Calculators Electronic Dictionaries
Certified and recommended products by schools
Cultivate new markets and eradicate fake products
Introduce new color graphing calculators
Cultivate overseas and senior markets Create new genre in English learning tools
(Japanese)
(Japanese)

Special Features
Annual Report 2017
ESG Information Financial Section Corporate DataProfileTo Our Stakeholders
PAGE 8CONTENTS
Musical Instruments
Pianos Keyboards
Expand CELVIANO Grand Hybrid pianos (GH series) and increase the number of musical instrument shops that carry these pianos
Develop new genre of keyboard aiding the emotional development of beginners

Special Features
Annual Report 2017
ESG Information Financial Section Corporate DataProfileTo Our Stakeholders
PAGE 9CONTENTS
New Business (Wrist Devices)
Smart Outdoor Watch
Ideal for Outdoor Activities
For Fishing For Trekking For Cycling, etc.
GPS + Full-Color Map Accumulated expertise in both watch and communication business Differentiation by wearability

Special Features
Annual Report 2017
ESG Information Financial Section Corporate DataProfileTo Our Stakeholders
PAGE 10CONTENTS
System Equipment Business
Handheld Terminals Cash Registers
Strengthen solution businessUseful data for management
Original hardwareTough body Android™ (G-mail, Google Maps, etc.)* Google Maps, Gmail and Android are the trademarks or registered trademarks of Google Inc.

ESG Information
Annual Report 2017
Special Features Financial Section Corporate DataProfileTo Our Stakeholders
PAGE 11CONTENTS
Corporate Governance
Casio recognizes the importance of responding to the expectations of shareholders and other
stakeholders, swift decision-making, appropriate and efficient business operations, and
enhanced supervisory functions that improve the soundness and transparency of management
in steadily achieving management goals and continuously increasing enterprise value. We are
implementing various initiatives to improve corporate governance.
1. System DesignCasio is a company with an Audit & Supervisory Board. The
Board of Directors and the Audit & Supervisory Board supervise
management. Casio is further strengthening corporate
governance by enhancing its executive officer system and
expanding the responsibilities of outside directors.
The Board of Directors delegates most of the authority for
important business execution to enable prompt and efficient
business execution. The Board of Directors makes resolutions
as required by laws and the Articles of Incorporation, as well as
decisions about important business execution matters, using its
vested authority to ensure that it fulfills its supervisory functions.
In addition, Casio has enhanced the management supervision
function of the Board of Directors by establishing the Nomination
Committee and the Compensation Committee, which include
outside directors.
The Audit & Supervisory Board is independent of the Board
of Directors, supervises the business execution of directors
and, without loss of management speed and effectiveness,
takes a corporate governance stance that sufficiently fulfills the
supervisory function.
2. Board of Directors and DirectorsThe Board of Directors has the function of making management
decisions and supervising business execution, and deliberating
and deciding on important management issues specified by laws,
the Articles of Incorporation and Board of Director regulations.
In order to enhance the efficiency and flexibility of business
execution, the Board of Directors has entrusted Executive Officers
with the authority for items that do not meet the standards for
discussion as prescribed by laws, the Articles of Incorporation and
Board of Director regulations.
In order for the Board of Directors to effectively fulfill its
management supervision function, we believe the Board
of Directors must be composed of members with diverse
perspectives, experiences and abilities. In addition to directors
from within the company who are thoroughly knowledgeable
about the company’s business, the Board of Directors has outside
directors with broad discernment and extensive experience.
Consideration is also given to the balance among the
members of the Board of Directors for experience and
accomplishment in corporate management and specialization in
the fields of technical development, sales and finance and other
areas.
We plan on maintaining an appropriate number of members
of the Board of Directors so that swift management decisions can
be made.
Currently there are eleven members, two of whom are outside
directors.
The term of directors is one year in order to clarify their
management responsibility and make it possible to swiftly
respond to changes in the management environment.
Internal candidates for director are selected by a Nomination
Committee after discerning that they are persons capable of
fulfilling management responsibilities, have the disposition
required of directors, and have superior achievements,
capabilities and character.
We select several knowledgeable persons to be outside
directors. These outside directors are invited so they can
give opinions and advice to the Board of Directors from
many angles regarding contributions to society in addition
to bringing an outsider’s viewpoint to management and
enhancing transparency of management with the goal of further
strengthening the supervisory function of business execution.
The two outside directors make comments and suggestions
as they see fit to guarantee the appropriateness and soundness
of Board of Director decisions.
3. Audit & Supervisory Board and Audit & Supervisory Board Members
The Audit & Supervisory Board follows policies and handles
assignments set out by the Audit & Supervisory Board to
ensure sound and transparent business management. In
addition to attending meetings of the Board of Directors and
other important meetings and committee sessions, Audit
& Supervisory Board Members fulfill their responsibility to
rigorously monitor the Company’s management processes by
speaking with directors and other managers, receiving reports
from them, and reading the minutes of meetings at which
decisions on important matters were made and related reference
material. Audit & Supervisory Board Members coordinate with
Total remuneration by director of submitting company, breakdown of remuneration and number of directors paid
Total remuneration by director of submitting company
Notes: 1. The amount of remuneration paid to directors does not include the employee salaries of directors who also hold an employee post. 2. Remuneration paid to directors in the amount of no more than ¥700 million was approved at the 53rd Regular General Meeting of Shareholders
held on June 26, 2009 (however, the employee salary and provision for directors’ retirement benefits reserve transfers are not included). 3. Remuneration paid to auditors in the amount of no more than ¥70 million was approved at the 51st Regular General Meeting of Shareholders
held on June 28, 2007 (however, the provision for directors’ retirement benefits reserve transfers is not included).
PositionTotal
remuneration(Millions of yen)
Breakdown of remuneration (Millions of yen) Number ofBasic directors
paidBasic
remunerationStock options Bonus
Retirementbenefits
Directors(excluding outside directors)
346 245 — 101 10
Auditors(excluding outside auditors)
13 13 — — — 1
Outside officers 34 34 — — — 4
Note: “Total consolidated remuneration” is restricted to persons with consolidated remuneration of ¥100 million or more.
Name
Totalconsolidatedremuneration
(Millions of yen)
Company
Totalconsolidatedremuneration
(Millions of yen)
Breakdown of remuneration (Millions of yen)
Basic remuneration
Stock options BonusRetirement
benefits
Kazuo Kashio 138 DirectorSubmittingcompany
98 — 40 —
outside directors as needed to obtain information and exchange
opinions, and are assigned expert assistants who support their
audit activities.
More than half of the members of the Audit & Supervisory
Board are outside auditors. The Audit & Supervisory Board
includes members with knowledge of finance and accounting in
order to strengthen its audit function.
The current Audit & Supervisory Board is composed of three
Audit & Supervisory Board Members, two of whom are outside
auditors.
4. Accounting Auditor and Internal AuditIndependent auditing corporations conduct external audits in
accordance with auditing standards generally accepted in Japan
to determine fairness and appropriateness. The Internal Audit
Department monitors the organizational management of the
Company to check that it is appropriate and conforms to laws
and regulations as well as internal standards.
5. CSR ManagementIn addition, the CSR Committee deliberates on basic policies and
major issues in CSR activities across the Group. This committee
is chaired by the officer in charge of CSR at Casio Computer
Co., Ltd. and includes the officers in charge of staff function
departments, Audit & Supervisory Board Members and managers
of staff function departments.
The Corporate Governance System
Corporate Governance Framework Director Remuneration
Business divisions / Group companies
BusinessExecution
Oversight
Oversight
Appointment,dismissal, andoversight
AuditCoordination
Coordination
Internal audit
AccountingauditInternal audit
Audit
Electionanddismissal
Electionanddismissal
Electionanddismissal
Compensation Committee
Nomination Committee
Executive officers
Representative Director
Internal Audit Department
Audit staff
General Meeting of Shareholders
Board of Directors
Directors: 11(2 outside)
Audit & Supervisory Board
Audit & SupervisoryBoard Members: 3
(2 outside)
Accounting Auditor
Subcommittees

ESG Information
Annual Report 2017
Special Features Financial Section Corporate DataProfileTo Our Stakeholders
PAGE 12CONTENTS
Corporate Social Responsibility (CSR) Activities
Making life richer and more convenient by creating innovative products—this was the aspiration of Casio’s
founders, and it is summed up in the corporate creed, “Creativity and Contribution.” Casio believes that
part of its social responsibility is to pass down this corporate creed to all of its employees without fail. Casio
is determined to ensure that its businesses, which create something from nothing, continue to make a
consistent contribution to a more sustainable global society
As an enterprise with a worldwide reach, Casio has endorsed and is guided by the universal principles of
the UN Global Compact. Using the ISO 26000 international guidance standard on social responsibility,
Casio analyzes its current progress and establishes action plans for improvement. The Company also
discloses its CSR performance in accordance with GRI Sustainability Reporting Guidelines.
Implementation
International guidance standard on social responsibility
Disclosure
Guidelines that indicate a framework for sustainability reports
Casio’s CSR ideals are to resolve
issues as society expects on the
environmental and social fronts
through its business operations. At
the same time, through sustainable
growth Casio aims to remain a
company that is necessary to society
and respected by its employees.
Enhancing Employee Motivation
Building Employee Loyalty
Casio’s Corporate Creed and Approach to CSR
CSR Implementation Framework
Casio’s CSR Ideals
Casio’s CSR Platform
Promoting CSR That Builds Corporate Value
Corporate Creed “Creativity and Contribution”
Charter of Creativity for Casio and CasioCommon Commitment
Casio Group Code of Conduct
Casio’s Business Activities
Providing new value through productsSocial and environmental initiatives
Employees Suppliers
Localcommunities Customers
Globalenvironment
Shareholdersand investors
Sustainableglobal society
Principles
Universal principles that Casio respects as a global corporation
UN Global Compact
GRI Guidelines ISO 26000
Creating Value for Society
Resolving Social Issues
Reinforcing Casio’s Businesses
Finding New Business Angles
Casio’s CSR
Ideals

ESG Information
Annual Report 2017
Special Features Financial Section Corporate DataProfileTo Our Stakeholders
PAGE 13CONTENTS
Corporate Social Responsibility (CSR) Activities
The United Nations adopted the Sustainable Development Goals (SDGs) in September 2015, and the Paris
Agreement was adopted in November of the same year. Against this backdrop, and the global trend toward
the expansion of ESG investment, Casio has formulated the following Medium-Term CSR Policy for the next
two years.
In accordance with these medium-term policies, Casio will engage in initiatives targeting the following
three priority issues.
(1) Initiatives Involving the SDGs
In fiscal 2018, Casio will take stock of how its business activities relate to the SDGs, and will ensure that
all employees understand the opportunities and responsibilities that the SDGs represent. Casio will then
gradually link its business plans to the SDGs, allowing it to achieve its business plans and resolve social
issues simultaneously, aiming to further enhance corporate value.
(2) Initiatives Involving the Medium- to Long-Term Environmental Targets
In February 2017, Casio revised its medium- to long-term environmental targets, taking into account
changes in the business structure, the status of CO2 emissions, and Japanese government targets. Going
forward, Casio will work to achieve our new long-term targets based on a clearly delineated path toward
carbon reduction, setting general targets for each reduction measure.
(3) Initiatives Involving the Disclosure of ESG Information
Casio plans to revise its corporate communications, clarifying the economic value and social value of its
medium- to long-term growth scenarios. For the future, Casio has set its sights on issuing integrated
reports that disclose ESG information more extensively and clarify communication objectives and targets.
On this basis, Casio will promote effective information disclosure in response to society’s requirements.
Casio will set these key performance indicators (KPIs) and promote and manage the PDCA cycle.
Medium-Term CSR Policy
Medium-Term CSR Policy
Based on materiality linked with our business operations, Casio will promote specific
initiatives for resolving social and environmental issues that are related to the SDGs.
Casio will work to consistently enhance environmental performance by formulating
achievement scenarios linked to our long-term environmental targets and by
practicing EMS.
Casio will strive to reinforce the management foundation by aggregating and
consistently enhancing compliance and ESG information for each company in the Casio
Group.
Casio will promote reforms in the awareness and behaviors of all employees in the
Casio Group.

ESG Information
Annual Report 2017
Special Features Financial Section Corporate DataProfileTo Our Stakeholders
PAGE 14CONTENTS
As a company with a global reach, it is extremely important for Casio to pursue initiatives that meet the
expectations of the international community. The worldwide movement to build more sustainable societies
continues to evolve, year by year. Companies today are expected to carry out strategic initiatives as part
of their core business activities. Casio is no exception. Even more so, as a company known for “creating
something from nothing,” Casio must strategically implement social contribution measures that are
integrated with its business activities.
Responding to these trends, Casio has specified the issues with the greatest significance (materiality) to its
practice of social responsibility, in accordance with the G4 Sustainability Reporting Guidelines issued by GRI
in May 2013.
Material Issues for Casio
Corporate Social Responsibility (CSR) Activities
Materiality specification process
Specifying Significance of Issues
In fiscal 2015, Casio made a detailed
list of CSR issues with reference to its
business areas, and prioritized them
based on relevance to its own activities.
In fiscal 2016, Casio sent a questionnaire
to its stakeholders and conducted
interviews in order to organize the issues
by their significance to stakeholders.
Based on the results of the processes
in steps 1 and 2, in fiscal 2016 Casio
formally specified its material issues with
the approval of the director in charge of
CSR.
Casio formulated key performance
indicators (KPI) with reference to the
specified material issues, thereby enabling
each responsible department to evaluate
its CSR initiatives quantitatively. In fiscal
2017, Casio is implementing related
activities using the plan-do-check-act
(PDCA) cycle.
STEP 1
Specification of issues with significance to Casio
STEP 2
Specification of issues with significance to stakeholders
STEP 3
Summarization and finalization
STEP 4
KPI formulation and implementation
Specified issues of high significance are plotted, and materiality is identified
Issues to be addressed with the highest priority
Issues that should be addressed in order to meet society’ s expectations and advance the business
Issues with lower relevance but that must still receive attention
Significance to Casio
Sign
ifica
nce
to S
take
hold
ers

ESG Information
Annual Report 2017
Special Features Financial Section Corporate DataProfileTo Our Stakeholders
PAGE 15CONTENTS
Casio investigated key performance indicators (KPI) with reference to the specified material issues, in order
to enable the responsible departments to evaluate their initiatives quantitatively. With the approval of the
CSR Officer, the KPI were finalized, and efforts are underway in fiscal 2017 to ensure high performance.
Material Issues for Casio
Corporate Social Responsibility (CSR) Activities
Guided by its corporate creed of “Creativity and Contribution,” Casio is engaging
in business activities that “create something from nothing,” thereby realizing
original inventions that make people’s lives better. This is Casio’s way of maximizing
economic performance and strategically managing the company to increase
corporate value.
Maximizing economic performance
As a manufacturer, Casio intends to further enhance resource productivity through
the efficient use of water and other precious resources of the planet, including the
reuse of resources and the utilization of alternate materials, and enhances such
measures.
Building a recycling societyRecognizing that it must provide vibrant and motivating workplaces that promote
the mental and physical wellbeing of employees, Casio provides various programs
and provisions while striving to build a workplace culture that fosters mutual
acceptance of diversity in working styles. Casio also supports diversity by working
to create workplace environments where all employees—inclusive of women, older
employees, persons with disabilities, and persons from other countries—can realize
their talents to the fullest.
Providing supportive workplace environments and promoting diversity
Casio supports international frameworks for realizing a low-carbon society. Casio
will contribute to this goal by providing products and services that make an even
greater contribution to the reduction and absorption of CO2 emissions. In addition
to expanding products and services that use energy sources that are friendly
to people and the planet, including solar, wind, and hydro power, Casio will
incorporate these renewable energy sources into its own business operations.
Realizing a low-carbon society
Recognizing the importance of nature to its business, Casio is promoting awareness
of the need to take care of the planet through biodiversity preservation activities,
while working to achieve harmony between business activities and the cycles of
nature.
Living in harmony with nature
Casio procures diverse materials from numerous suppliers in and outside with
a fundamental emphasis on developing long-term supplier relations endeavors
to enhance social responsibility throughout supply chains and p responsible
procurement.
Promoting CSR procurement
As a global business entity and part of the global community, Casio recognizes the
importance of human rights and respects the fundamental human rights of all of
its stakeholders, including its employees. Casio is also establishing a framework for
conducting human rights due diligence based on the Casio Group Policy on Human
Rights.
Respecting human rights
Recognizing that bribery and corruption hinder sustainable social development,
Casio is establishing rules and guidelines for each region to reduce the risk of
bribery and corruption throughout the group.
Preventing corruption
For details, please refer tohttp://world.casio.com/csr/materiality/

ESG Information
Annual Report 2017
Special Features Financial Section Corporate DataProfileTo Our Stakeholders
PAGE 16CONTENTS
Revising Our Greenhouse Gas Reduction Target, Setting the Bar Higher
Based on the Casio Environmental Vision
2050, the Company’s long-term environmental
management policy, in February 2017 Casio
revised its long-term greenhouse gas reduction
target to “an 80% reduction by fiscal 2051,
compared with 2014 levels.” This meant raising
the bar significantly by changing the base year, as
the previous target had been “an 80% reduction
by fiscal 2051, compared with 2006 levels.”
At the same time, Casio revised its medium-
term target. The Casio Environmental Declaration
2020 called for a “30% reduction by fiscal 2021,
compared with 2006 levels,” which the Company
had essentially met by 2017. Casio therefore set
itselve a substantially tougher target, of a “26%
reduction by fiscal 2031, compared with fiscal
2014 levels.”
These targets are high; it would be
impossible to reach them simply by extending
the trajectory of Casio’s conventional initiatives.
The Company needs to make dramatic changes,
revising its manufacturing processes, product
logistics, the manner of its offices and the way
people work. The current revisions are meaningful
for Casio as a leading environmental company,
as they mean reaching for high goals through
strategic initiatives linked to our management.
Making Steady Progress on Environmental Materiality
Having identified its three environmental
materiality commitments—“realizing a low-carbon
society,” “building a recycling society” and “living
in harmony with nature”—Casio is mapping out
long-term ideals for these commitments, plotting
them out clearly on a time axis and formulating
KPIs to ensure we make steady progress.
For “realizing a low-carbon society,” Casio
will hone its already-high product development
skills related to energy-conserving functions, a
Casio strength, thereby differentiating itselve
from competitors. In addition, to reduce
greenhouse gas emissions in the manufacturing
and distribution processes, Casio is gradually
starting to introduce energy-saving diagnoses at
its locations in Japan.
In terms of “building a recycling society,”
given that Casio’s business characteristics mean
Pulling Together as a Company to Reinforce
Initiatives on Environmental Management
under a New Structure
In fiscal 2017, Casio conducted a major overhaul
of its environmental management system (EMS) to
promote an overarching companywide framework
for Casio’s three environmental materiality issues.
Casio has adopted an EMS (ISO 14001)
as an environmental management tool, but in
the past the Company had obtained ISO 14001
certifications at individual business sites. Casio
revised the system, integrating the certification for
our three main business sites: the head office, the
Hamura R&D Center and the Hachioji R&D Center.
Furthermore, to pursue environmental activities
along the materiality axis, Casio established
committees according to its three themes of
“realizing a low-carbon society,” “building a
recycling society” and “living in harmony with
nature.” These committees’ activities link directly
to ISO 14001.
Through these reforms, Casio moved away
from our previous micro-oriented activities on
a departmental basis, putting in place a more
robust promotion structure with effectiveness
for Casio as a whole. As it happened, in
September 2015 the 2016 edition of ISO 14001
was announced, calling for even higher levels
of environmental management based on past
performance. Based on the new EMS we are
starting in fiscal 2018, Casio will pull together as a
group to improve our performance.
it invests few resources in the manufacturing
process, it is essential to go beyond looking at the
Company on a standalone basis. Rather, Casio
needs to engage in initiatives to conserve and
recycle resources throughout the entire product
life cycle, including suppliers. On a standalone
basis, Casio will continue in its environmentally
conscious manufacturing efforts to satisfy
standards for Casio Green Products and Casio
Super Green Star Products. Casio will also enhance
communication with customers regarding the
value these certified products can provide.
With respect to “living in harmony with
nature,” based on the Casio biodiversity guidelines
the Company will promote initiatives that consider
direct and indirect impacts throughout the entire
value chain. Casio is currently beginning these
initiatives in Japan by conducting environmental
impact assessments at each business site, accelerating
responses to issues that have been lagging to date.
Fulfilling our Corporate Social Responsibilities as a Leading Environmental Company
Corporate Social Responsibility (CSR) Activities
Materiality in the Environmental Field
Realizing a low-carbon society
Living in harmony with
nature
Building a recycling society

Financial Section
Annual Report 2017
Special FeaturesProfileTo Our Stakeholders Corporate DataESG Information
PAGE 17CONTENTS
Management’s Discussion and Analysis
Net Sales
Consolidated net sales for the year ended March 31, 2017, decreased 8.8% compared with the previous
fiscal year, to ¥321,213 million.
Sales by Segment
Consumer segment sales decreased 9.4% compared with the previous fiscal year to ¥272,804 million, and
accounted for 84.9% of net sales. In the timepiece business, sales of the medium- to high-end G-SHOCK
line remained strong in China and ASEAN countries due to effective unique promotion. In addition, sales of
the EDIFICE model that connects to a smartphone via Bluetooth® remained robust mainly in Europe. In the
calculator business, scientific calculator sales were favorable due to enhanced school sales overseas.
System Equipment segment sales decreased 6.9% compared with the previous fiscal year, to ¥39,734
million. Others segment sales increased 0.5% compared with the previous fiscal year, to ¥8,675 million.
Results of Operations
Operating income decreased 27.3% compared with the previous fiscal year, to ¥30,636 million. Consumer
segment income increased to ¥37,194 million. Strong profitability was maintained in the timepiece business
due to an improved product mix. The calculator business secured profitability with robust overseas sales of
scientific calculators. System Equipment segment loss was ¥2,224 million. Others segment profit was ¥335
million.
Net income decreased 41.0% compared with the previous fiscal year to ¥18,410 million. Net income
per share decreased 39.3% to ¥72.67.
Financial Condition
Total assets as of March 31, 2017, decreased ¥17,002 million from a year earlier to ¥351,452 million, largely
because securities decreased. Net assets as of March 31, 2017, decreased ¥5,779 million from a year earlier
to ¥196,332 million due to a decrease in retained earnings.
Total liabilities as of March 31, 2017, decreased ¥11,223 million from a year earlier to ¥155,120 million.
Current liabilities decreased ¥4,073 million to ¥75,495 million. Non-current liabilities decreased ¥7,150
million to ¥79,625 million.
As a result, the equity ratio increased 1.0 percentage points compared with the end of the previous fiscal
year to 55.9%.
Cash Flow Analysis
Net cash provided by operating activities decreased ¥4,790 million year on year to ¥27,920 million. Net
cash used in investing activities amounted to ¥3,255 million, which was a ¥11,414 million decrease year
on year. Net cash used in financing activities amounted to ¥30,933 million, which was a ¥9,260 million
decrease year on year.
As a result, cash and cash equivalents as of March 31, 2017 decreased ¥9,302 million from a year earlier to
¥118,755 million. The Casio Group therefore has ample liquidity.
Capital Investment
Capital investment was ¥5,496 million. By segment, capital investment was ¥4,531 million centered on
watches and other items in the Consumer segment, ¥705 million in the System Equipment segment, and
¥150 million in the Others segment.
Research & Development
R&D expenses were ¥6,599 million. By segment, R&D expenses were ¥3,232 million centered on watches
and other items in the Consumer segment, ¥431 million in the System Equipment segment, and ¥2,935
million in the Others segment.
Millions of Yen
2017 2016
Consumer 272,804 300,956
System Equipment 39,734 42,669
Others 8,675 8,633
Total 321,213 352,258

Financial Section
Annual Report 2017
Special FeaturesProfileTo Our Stakeholders Corporate DataESG Information
PAGE 18CONTENTS
Business Risks
The management performance, financial position and share price of Casio Computer Co., Ltd. and
its consolidated subsidiaries (“the Casio Group” or “the Group”) are subject to the following risks.
Statements below concerning the future represent the judgment of the Casio Group as of March
31, 2017.
(1) Japan’s economy and the global economy
The Group’s products are sold in Japan and in markets around the world, and demand is therefore
subject to the economic trends of each country. Trends in consumer spending particularly affect
the Group because we market the majority of our products to consumers.
(2) Price changes
Competition is intensifying in the Group’s industries because many companies are aggressively
trying to increase market share in Japan and overseas. A rapid decline in product prices could
negatively affect the Group’s results.
(3) New products
The Group could lose all or some of the advantage of being first or among the first to market if the
Group is unable to quickly and consistently launch popular new products, or if competitors launch
products that are similar to those of the Group, especially if such launches are concurrent with
those of the Group.
(4) Transactions with major customers
Any changes in strategy or product specifications made by major customers, and any cancellation
of orders or changes in their schedule could negatively affect the Group’s results.
(5) Outsourcing
The Group outsources a substantial portion of its manufacturing and assembly work to outside
service suppliers to improve the Group’s production efficiency and the operating income margin,
which could pose problems for consistent quality control. Moreover, problems among outside
suppliers including violations of laws, regulations, and intellectual property rights of third parties
could negatively affect the Group’s results and the reputation of its products.
(6) Technology development and change
Rapidly changing technologies and market needs in the Group’s businesses could unexpectedly
hasten product obsolescence and cause a sharp drop in sales.
(7) Risks associated with international expansion and overseas operations
The majority of the Group’s production and sales are outside Japan. Consequently, overseas
political and economic developments and revisions of laws and legislation may significantly affect
the Group’s financial position. In particular, regulatory changes and the enactment of new laws are
difficult to predict and could negatively affect the Group’s results.

Financial Section
Annual Report 2017
Special FeaturesProfileTo Our Stakeholders Corporate DataESG Information
PAGE 19CONTENTS
Business Risks
(8) Intellectual property
The Group principally uses proprietary technologies, and protects these proprietary technologies
through a combination of patents, registered trademarks and other intellectual property.
The following is a list of associated risks:
Competitors might develop the same technologies as the Group’s proprietary technologies;
The Group’s patent applications might not be approved;
The Group’s measures to prevent the misuse or violation of its intellectual property rights might
be ineffective;
Intellectual property laws and regulations might not adequately protect the Group’s intellectual
property;
The Group’s future products and technologies might violate another company’s intellectual
property rights.
(9) Defective products and lawsuits
The Group rigorously controls the quality of the products it manufactures and markets, and has
not experienced significant complaints or negative publicity since its founding. However, the Group
could be exposed to product liability or safety complaints in the future.
(10) Information management risk
The Group has acquired a large volume of personal and confidential information in the course of
its business. Internal rules govern the use of this information, and each Group company enhances
the control of this information through employee training programs. However, information leaks
might occur that could negatively affect the Group’s business, financial position and results.
(11) Alliances, mergers and strategic investments
The Group may implement alliances, mergers or strategic investments in Japan or overseas to
expand its business operations or raise management efficiency. Changes in the management
environment, business strategies, or operating environment of counterparties could negatively
affect the Group’s business, financial position and results.
(12) Foreign exchange and interest rate risk
Exchange rate fluctuations significantly affect the Group because it operates internationally.
Fluctuations in the exchange rates of foreign currencies against the yen could negatively affect
the Group’s earnings. The Group is also exposed to risks associated with interest rate changes
that could affect overall operating costs, procurement costs, and the value of financial assets and
liabilities, particularly long-term debt.
(13) Other risks
The following are other factors that could affect the Group’s business and results:
Cyclical trends in the information technology industry;
The ability to procure required equipment, raw materials, facilities, and electricity at reasonable
prices;
A decline in the value of securities held by the Group;
Revisions to laws and regulations regarding the accounting standards for retirement benefits,
pension plan revisions, and abrupt changes affecting pension plan asset management;
Accidents and disasters, including fires and earthquakes;
Social unrest caused by wars, terrorist attacks, or epidemics.

Financial Section
Annual Report 2017
Special FeaturesProfileTo Our Stakeholders Corporate DataESG Information
PAGE 20CONTENTS
Consolidated Five-Year SummaryYears ended March 31 Casio Computer Co., Ltd. and Consolidated Subsidiaries
Millions of Yen
2017 2016 2015 2014 2013
For the year:
Net sales ¥321,213 ¥352,258 ¥338,389 ¥321,761 ¥297,763
Cost of sales 187,755 199,251 190,706 189,358 181,479
Selling, general and administrative expenses 96,223 104,229 103,733 97,475 88,313
Research and development expenses 6,599 6,609 7,187 8,352 7,918
Operating profit 30,636 42,169 36,763 26,576 20,053
Profit attributable to owners of parent 18,410 31,194 26,400 15,989 11,876
Comprehensive income 20,095 18,703 38,628 24,072 19,544
Capital investment 5,496 6,889 5,926 5,574 7,637
Depreciation on property, plant and equipment 6,357 6,505 5,794 5,717 5,325
At year-end:
Current assets 233,447 250,237 244,614 244,135 249,719
Current liabilities 75,495 79,568 82,306 122,110 115,302
Working capital 157,952 170,669 162,308 122,025 134,417
Net assets 196,332 202,111 204,158 185,256 163,968
Total assets 351,452 368,454 374,656 366,964 369,322
Amounts per share of common shares (in yen):
Basic earnings 72.67 119.72 100.08 59.47 44.17
Diluted earnings 71.28 117.50 98.77 59.45 44.15
Cash dividends applicable to the year 40.00 40.00 35.00 25.00 20.00
(Interim dividends) (20.00) (17.50) (12.50) (10.00) (–)
Performance indicators:
Return on equity (%) 9.2 15.4 13.6 9.2 7.6
Return on assets (%) 5.1 8.4 7.1 4.3 3.2
Equity ratio (%) 55.9 54.9 54.5 50.5 44.4
Interest coverage (times) 77.5 98.0 42.6 22.9 17.4
Assets turnover (times) 0.9 1.0 0.9 0.9 0.8
Inventory turnover (months) 3.3 3.5 3.5 3.0 3.6
Other:
Number of employees 12,287 11,322 11,592 10,992 11,276

Financial Section
Annual Report 2017
Special FeaturesProfileTo Our Stakeholders Corporate DataESG Information
PAGE 21CONTENTS
Consolidated Balance SheetsMarch 31, 2017 and 2016 Casio Computer Co., Ltd. and Consolidated Subsidiaries
See accompanying notes.
Millions of Yen
Thousands of U.S.Dollars
(Note 1)
Assets 2017 2016 2017
Current assets:
Cash and deposits (Notes 3 and 5) ¥ 55,197 ¥ 66,648 $ 492,830
Securities (Notes 3, 5 and 6) 43,920 55,600 392,143
Notes and accounts receivable-trade (Note 5) 47,725 47,843 426,116
Allowance for doubtful accounts (548) (501) (4,893)
Inventories (Note 4) 52,258 57,776 466,589
Deferred tax assets (Note 9) 6,155 6,732 54,955
Short-term loans receivable with resale agreement (Notes 3 and 5) 20,000 6,154 178,572
Other 8,740 9,985 78,036
Total current assets 233,447 250,237 2,084,348
Property, plant and equipment:
Land 34,090 36,091 304,375
Buildings and structures 58,239 60,097 519,991
Machinery, equipment and vehicles 14,218 14,057 126,946
Tools, furniture and fixtures 35,285 35,484 315,045
Leased assets (Note 12) 3,022 3,050 26,982
Construction in progress 308 256 2,750
145,162 149,035 1,296,089
Accumulated depreciation (88,371) (88,153) (789,027)
Net property, plant and equipment 56,791 60,882 507,062
Investments and other assets:
Shares of associates 2,701 2,510 24,116
Investment securities (Notes 5 and 6) 32,452 31,897 289,750
Net defined benefit asset (Note 10) 13,122 9,113 117,161
Deferred tax assets (Note 9) 3,227 4,644 28,813
Other 9,779 9,242 87,312
Allowance for doubtful accounts (67) (71) (598)
Total investments and other assets 61,214 57,335 546,554
Total assets (Note 13) ¥351,452 ¥368,454 $3,137,964
Millions of Yen
Thousands of U.S.Dollars
(Note 1)
Liabilities and Net Assets 2017 2016 2017Current liabilities:
Short-term loans payable (Note 8) ¥ 155 ¥ 260 $ 1,384 Current portion of long-term loans payable (Notes 5 and 8) 2,000 – 17,857 Notes and accounts payable-trade (Note 5) 31,751 34,542 283,491 Accounts payable-other (Note 5) 19,079 21,483 170,348 Accrued expenses 12,357 13,045 110,331 Income taxes payable (Note 9) 2,593 4,334 23,152 Provision for business structure improvement 631 – 5,634 Other 6,929 5,904 61,866 Total current liabilities 75,495 79,568 674,063
Non-current liabilities:Bonds and long-term loans payable (Notes 5 and 8) 71,023 77,033 634,134 Net defined benefit liability (Note 10) 491 1,338 4,384 Deferred tax liabilities (Note 9) 1,628 1,441 14,535 Provision for business structure improvement 784 – 7,000 Other 5,699 6,963 50,884 Total non-current liabilities 79,625 86,775 710,937 Total liabilities 155,120 166,343 1,385,000
Contingent liabilities (Note 14)
Net assets (Note 11):Shareholders' equity:
Capital stock:Authorized – 471,693,000 sharesIssued – 259,020,914 shares 48,592 48,592 433,857 Capital surplus 65,058 65,058 580,875 Retained earnings 92,228 100,041 823,464 Treasury shares (19,942) (20,291) (178,053)Total shareholders' equity 185,936 193,400 1,660,143
Accumulated other comprehensive income:Valuation difference on available-for-sale securities 9,138 7,781 81,589 Foreign currency translation adjustment (3,573) (1,844) (31,902)Remeasurements of defined benefit plans (Note 10) 4,831 2,774 43,134 Total accumulated other comprehensive income 10,396 8,711 92,821 Total net assets 196,332 202,111 1,752,964
Total liabilities and net assets ¥351,452 ¥368,454 $3,137,964

Financial Section
Annual Report 2017
Special FeaturesProfileTo Our Stakeholders Corporate DataESG Information
PAGE 22CONTENTS
Consolidated Statements of Income and Consolidated Statements of Comprehensive IncomeYears ended March 31, 2017 and 2016 Casio Computer Co., Ltd. and Consolidated Subsidiaries
Millions of Yen
Thousands of U.S.Dollars
(Note 1)
Consolidated Statements of Income 2017 2016 2017
Net sales (Note 13) ¥321,213 ¥352,258 $2,867,973
Costs and expenses (Note 13):
Cost of sales 187,755 199,251 1,676,384
Selling, general and administrative expenses 96,223 104,229 859,134
Research and development expenses 6,599 6,609 58,919
290,577 310,089 2,594,437
Operating profit (Note 13) 30,636 42,169 273,536
Other income (expenses):
Interest and dividend income 920 1,145 8,214
Interest expenses (407) (442) (3,634)
Foreign exchange losses (4,869) (1,681) (43,473)
Gain on sales of non-current assets 909 22 8,116
Gain (loss) on sales of investment securities (Note 6) 426 1,108 3,804
Business structure improvement expenses (Notes 13, 15 and 16) (4,469) – (39,902)
Impairment loss (Notes 13 and 15) (19) (1,047) (170)
Other, net 328 (610) 2,929
(7,181) (1,505) (64,116)
Profit before income taxes 23,455 40,664 209,420
Income taxes (Note 9):
Current 4,450 6,940 39,732
Deferred 595 2,530 5,313
5,045 9,470 45,045
Profit 18,410 31,194 164,375
Profit attributable to owners of parent ¥ 18,410 ¥ 31,194 $ 164,375
YenU.S.Dollars
(Note 1)
Amounts per share of common shares:
Basic earnings ¥72.67 ¥119.72 $0.65
Diluted earnings 71.28 117.50 0.64
Cash dividends applicable to the year 40.00 40.00 0.36
Millions of Yen
Thousands of U.S.Dollars
(Note 1)
Consolidated Statements of Comprehensive Income 2017 2016 2017
Profit ¥18,410 ¥ 31,194 $164,375
Other comprehensive income:
Valuation difference on available-for-sale securities 1,357 (3,611) 12,116
Foreign currency translation adjustment (1,729) (4,466) (15,437)
Remeasurements of defined benefit plans 2,057 (4,414) 18,366
Share of other comprehensive income of entities accounted for using equity method (0) 0 (0)
Total other comprehensive income 1,685 (12,491) 15,045
Comprehensive income ¥20,095 ¥ 18,703 $179,420
Comprehensive income attributable to:
Owners of parent ¥20,095 ¥ 18,703 $179,420
Non-controlling interests – – –
Reclassification Adjustments and Tax Effects for Other Comprehensive Income
Millions of Yen
Thousands of U.S.Dollars
(Note 1)
2017 2016 2017
Valuation difference on available-for-sale securities
Increase (decrease) during period ¥ 2,308 ¥ (5,633) $ 20,607
Reclassification adjustments (353) 12 (3,152)
Amount before income tax effect 1,955 (5,621) 17,455
Income tax effect (598) 2,010 (5,339)
Total 1,357 (3,611) 12,116
Foreign currency translation adjustment
Increase (decrease) during period (1,729) (4,466) (15,437)
Remeasurements of defined benefit plans
Increase (decrease) during the period 3,393 (6,050) 30,295
Reclassification adjustments (385) (584) (3,438)
Amount before income tax effect 3,008 (6,634) 26,857
Income tax effect (951) 2,220 (8,491)
Total 2,057 (4,414) 18,366
Share of other comprehensive income of entities accounted for using equity method
Increase (decrease) during period (0) 0 (0)
Total other comprehensive income ¥ 1,685 ¥(12,491) $ 15,045
See accompanying notes. See accompanying notes.

Financial Section
Annual Report 2017
Special FeaturesProfileTo Our Stakeholders Corporate DataESG Information
PAGE 23CONTENTS
Consolidated Statements of Changes in Net AssetsYears ended March 31, 2017 and 2016 Casio Computer Co., Ltd. and Consolidated Subsidiaries
(Note): The retirement of treasury shares above is subject to the approval of the board of directors' meeting.
See accompanying notes.
Millions of Yen
Number ofcommon shares
Capitalstock
Capitalsurplus
Retainedearnings
Treasuryshares
Valuationdifference onavailable-for-sale securities
Foreigncurrency
translationadjustment
Remeasurementsof defined
benefit plansTotal
net assets
Balance at April 1, 2015 269,020,914 ¥48,592 ¥65,058 ¥ 79,301 ¥ (9,995) ¥11,392 ¥2,622 ¥ 7,188 ¥204,158
Dividends of surplus – – – (10,454) – – – – (10,454)
Profit attributable to owners of parent – – – 31,194 – – – – 31,194
Purchase of treasury shares – – – – (10,297) – – – (10,297)
Disposal of treasury shares – – 0 – 1 – – – 1
Retirement of treasury shares – – – – – – – – –
Net changes of items other than shareholders' equity – – – – – (3,611) (4,466) (4,414) (12,491)
Balance at April 1, 2016 269,020,914 ¥48,592 ¥65,058 ¥100,041 ¥(20,291) ¥ 7,781 ¥(1,844) ¥ 2,774 ¥202,111
Dividends of surplus – – – (10,894) – – – – (10,894)
Profit attributable to owners of parent – – – 18,410 – – – – 18,410
Purchase of treasury shares – – – – (14,980) – – – (14,980)
Disposal of treasury shares – – 0 – 0 – – – 0
Retirement of treasury shares (10,000,000) – (0) (15,329) 15,329 – – – –
Net changes of items other than shareholders' equity – – – – – 1,357 (1,729) 2,057 1,685
Balance at March 31, 2017 259,020,914 ¥48,592 ¥65,058 ¥ 92,228 ¥(19,942) ¥ 9,138 ¥(3,573) ¥ 4,831 ¥196,332
Thousands of U.S. Dollars (Note 1)
Balance at April 1, 2016 $433,857 $580,875 $893,223 $(181,169) $69,473 $(16,465) $24,768 $1,804,562
Dividends of surplus – – (97,268) – – – – (97,268)
Profit attributable to owners of parent – – 164,375 – – – – 164,375
Purchase of treasury shares – – – (133,750) – – – (133,750)
Disposal of treasury shares – 0 – 0 – – – 0
Retirement of treasury shares – (0) (136,866) 136,866 – – – –
Net changes of items other than shareholders' equity – – – – 12,116 (15,437) 18,366 15,045
Balance at March 31, 2017 $433,857 $580,875 $823,464 $(178,053) $81,589 $(31,902) $43,134 $1,752,964

Financial Section
Annual Report 2017
Special FeaturesProfileTo Our Stakeholders Corporate DataESG Information
PAGE 24CONTENTS
Consolidated Statements of Cash FlowsYears ended March 31, 2017 and 2016 Casio Computer Co., Ltd. and Consolidated Subsidiaries
See accompanying notes.
Millions of Yen
Thousands of U.S.Dollars
(Note 1)
2017 2016 2017
Cash flows from operating activities
Profit before income taxes ¥ 23,455 ¥ 40,664 $ 209,420
Depreciation 9,741 9,708 86,973
Impairment loss 19 1,047 170
Loss (gain) on sales and retirement of non-current assets (795) 466 (7,098)
Loss (gain) on sales of investment securities (426) (1,108) (3,804)
Increase (decrease) in net defined benefit liability (828) 196 (7,393)
Interest and dividend income (920) (1,145) (8,214)
Interest expenses 407 442 3,634
Foreign exchange losses (gains) 1,309 (1,450) 11,688
Share of (profit) loss of entities accounted for using equity method (15) (53) (134)
Loss (gain) on transfer of business (500) – (4,464)
Decrease (increase) in notes and accounts receivable-trade 164 (2,690) 1,464
Decrease (increase) in inventories 4,157 (3,750) 37,116
Increase (decrease) in notes and accounts payable-trade (2,456) (61) (21,929)
Decrease/increase in consumption taxes receivable/payable 1,156 (1,081) 10,321
Other, net (82) (3,816) (732)
Subtotal 34,386 37,369 307,018
Interest and dividend income received 897 1,164 8,009
Interest expenses paid (412) (445) (3,679)
Income taxes paid (6,951) (5,378) (62,062)
Net cash provided by (used in) operating activities 27,920 32,710 249,286
Cash flows from investing activities
Payments into time deposits (1,438) (433) (12,839)
Proceeds from withdrawal of time deposits 1,439 983 12,848
Purchase of property, plant and equipment (4,815) (6,430) (42,991)
Proceeds from sales of property, plant and equipment 3,564 81 31,821
Purchase of intangible assets (4,148) (3,916) (37,036)
Purchase of investment securities (23) (87) (205)
Proceeds from sales and redemption of investment securities 1,816 18,014 16,214
Purchase of shares of subsidiaries and associates (180) – (1,607)
Proceeds from transfer of business 500 – 4,464
Other, net 30 (53) 268
Net cash provided by (used in) investing activities (3,255) 8,159 (29,063)
Millions of Yen
Thousands of U.S.Dollars
(Note 1)
2017 2016 2017
Cash flows from financing activities
Net increase (decrease) in short-term loans payable (105) 9 (937)
Proceeds from long-term loans payable 21,500 23,000 191,964
Repayments of long-term loans payable (25,500) (23,000) (227,678)
Purchase of treasury shares (14,980) (10,297) (133,750)
Proceeds from sales of treasury shares 0 1 0
Repayments of finance lease obligations (954) (932) (8,518)
Cash dividends paid (10,894) (10,454) (97,268)
Net cash provided by (used in) financing activities (30,933) (21,673) (276,187)
Effect of exchange rate change on cash and cash equivalents (3,034) (1,876) (27,089)
Net increase (decrease) in cash and cash equivalents (9,302) 17,320 (83,053)
Cash and cash equivalents at beginning of period (Note 3) 128,057 110,737 1,143,366
Cash and cash equivalents at end of period (Note 3) ¥118,755 ¥128,057 $1,060,313

Financial Section
Annual Report 2017
Special FeaturesProfileTo Our Stakeholders Corporate DataESG Information
PAGE 25CONTENTS
The accompanying consolidated financial statements of CASIO COMPUTER CO., LTD. (“the Company”)
and its consolidated subsidiaries have been prepared in accordance with the provisions set forth in the
Japanese Financial Instruments and Exchange Law and its related accounting regulations, and in conformity
with accounting principles generally accepted in Japan (“Japanese GAAP”), which are different in certain
respects as to application and disclosure requirements from International Financial Reporting Standards.
The accompanying consolidated financial statements have been restructured and translated into
English (with certain expanded disclosure) from the consolidated financial statements of the Company
prepared in accordance with Japanese GAAP and filed with the appropriate Local Finance Bureau of the
Ministry of Finance as required by the Financial Instruments and Exchange Law. Certain supplementary
information included in the statutory Japanese language consolidated financial statements, but not
required for fair presentation, is not presented in the accompanying consolidated financial statements.
The translation of the Japanese yen amounts into U.S. dollars is included solely for the convenience
of readers outside Japan, using the prevailing exchange rate at March 31, 2017, which was ¥112 to U.S.$1.
The convenience translation should not be construed as a representation that the Japanese yen amounts
have been, could have been, or could in the future be, converted into U.S. dollars at this or any other rate
of exchange.
Consolidation
The accompanying consolidated financial statements include the accounts of the Company and significant
subsidiaries (together with the Company, “the Group”) which the Company controls through majority voting
rights or existence of certain conditions. Shares of associates of which the Company has the ability to exercise
significant influence over operating and financial policies are accounted for using the equity method.
In the elimination of investments in subsidiaries, the portion of assets and liabilities of a subsidiary
attributable to the subsidiary’s shares acquired by the Company are recorded based on the fair value as of
the respective dates when such shares are acquired. The amounts of assets and liabilities attributable to
non-controlling interests of the subsidiary are determined using the financial statements of the subsidiary.
Material intercompany balances, transactions and profits have been eliminated in consolidation.
The difference between the cost and underlying fair value of the net assets of investments in
subsidiaries at acquisition is included in other assets and is amortized on a straight-line basis over five years.
Cash flow statements
In preparing the consolidated statements of cash flows, cash on hand, readily available deposits and short-
term highly liquid investments with maturities not exceeding three months at the time of purchase are
Notes to Consolidated Financial Statements
considered to be cash and cash equivalents.
Foreign currency translation
All monetary assets and liabilities denominated in foreign currencies are translated at the current exchange
rates at the balance sheet date, and the translation gains and losses are credited or charged to income (loss).
Assets and liabilities of consolidated overseas subsidiaries are translated into yen at the current
exchange rate at the balance sheet date while their revenue and expenses are translated at the average
exchange rate for the period. Differences arising from such translation are included in net assets as foreign
currency translation adjustment.
Securities and investment securities
Debt securities designated as held-to-maturity are carried at amortized cost using the straight-line method.
Available-for-sale securities for which fair value is readily determinable, are stated at fair value as of the
end of the period with unrealized gains and losses, net of applicable deferred tax assets or liabilities, not
reflected in earnings but directly reported as a separate component under net assets. The cost of such
securities sold is determined primarily by the moving-average method. Available-for-sale securities for
which fair value is not readily determinable are stated primarily at moving-average cost.
Derivatives and hedge accounting
The accounting standards for financial instruments require companies to state derivative financial
instruments at fair value and to recognize changes in the fair value as gains or losses unless derivative
financial instruments meet the criteria for hedge accounting.
If derivative financial instruments are used as hedges and meet certain hedging criteria, the Group
defers recognition of gains or losses resulting from changes in the fair value of derivative financial
instruments until the related losses or gains on the hedged items are recognized.
Also, if interest rate swap contracts are used as hedges and meet certain hedging criteria, the net
amount to be paid or received under the interest rate swaps is added to or deducted from the interest on
the assets or liabilities for which the swap contract is executed.
The Group uses forward foreign currency contracts and interest rate swaps as derivative financial
instruments primarily for the purpose of mitigating future risks of fluctuations of foreign currency exchange
rates with respect to foreign currency assets and liabilities and of interest rate changes with respect to cash
management.
Forward foreign currency and interest rate swap contracts are subject to risks of foreign currency
exchange rate changes and interest rate changes, respectively.
The derivative transactions are executed and managed by the Company’s Finance Department in
Years ended March 31, 2017 and 2016 Casio Computer Co., Ltd. and Consolidated Subsidiaries
2. Significant Accounting Policies
1. Basis of Presenting Consolidated Financial Statements

Financial Section
Annual Report 2017
Special FeaturesProfileTo Our Stakeholders Corporate DataESG Information
PAGE 26CONTENTS
accordance with the established policies and within the specified limits on the amounts of derivative
transactions allowed.
Allowance for doubtful accounts
The allowance for doubtful accounts is provided at an amount sufficient to cover probable losses on the
collection of receivables.
The amount of the allowance is determined by an estimated amount of probable bad debt that is
based on past write-off experience and a review of the collectability of individual receivables.
Inventories
Inventories are stated primarily at the lower of cost (first-in, first-out) or net realizable values at year-end.
Property, plant and equipment, except leased assets
Property, plant and equipment is stated at cost. For the Company and its consolidated subsidiaries in Japan,
depreciation is principally determined by the declining-balance method at rates based on estimated useful
lives except for the following items. Buildings, excluding facilities attached to buildings, acquired on or after
April 1, 1998, the building and structures of the head office of the Company, and facilities attached to
buildings and structures acquired on or after April 1, 2016, are depreciated using the straight-line method.
For overseas subsidiaries, depreciation is principally determined by the straight-line method. The depreciation
period ranges from 2 years to 50 years for buildings and structures, from 2 years to 17 years for machinery,
equipment and vehicles, and from 1 year to 20 years for tools, furniture and fixtures.
Software, except leased assets
Software is categorized by the following purposes and amortized using the following two methods.
Software for market sales: The production costs for the master product are capitalized and amortized
over no more than 3 years on a projected revenue basis.
Software for internal use: The acquisition costs of software for internal use are amortized over 5
years using the straight-line method.
The amount of software costs capitalized is included in Other under Investments and other assets in
the consolidated balance sheets.
Leased assets
(Finance leases which do not transfer ownership of the leased property to the lessee)
Leased assets are divided into the two principal categories of property, plant and equipment and
intangible assets included in Other under Investments and other assets. The former consists primarily of
facilities (machinery and equipment, tools, furniture and fixtures) while the latter consists of software. The
assets are depreciated on a straight-line basis on the assumption that the lease term is the useful life and
the residual value is zero.
Retirement benefits
Under the terms of the employees’ severance and retirement plan, eligible employees are entitled under
most circumstances, upon mandatory retirement or earlier voluntary severance, to severance payments
based on compensation at the time of severance and years of service.
For employees’ severance and retirement benefits, the Company and its consolidated subsidiaries in
Japan provide a defined benefit plan and have established and are participating in the Casio corporate
pension fund, which is a system with multiple business proprietors.
The Company and its consolidated subsidiaries in Japan received permission from the Minister of
Health, Labour and Welfare, for release from the obligation of paying benefits for employees’ prior services
relating to the substitutional portion of the Welfare Pension Insurance Scheme. Afterwards, the welfare
pension insurance plan was changed to the defined benefit plan.
The Company and a part of its consolidated subsidiaries in Japan also provide a defined contribution
plan. On April 1, 2012, the Company and certain consolidated subsidiaries transferred part of the defined
benefit plan to the defined contribution plan. In addition, the Company has established an employee
retirement benefit trust.
The liabilities and expenses for retirement benefits are determined based on the amounts actuarially
calculated using certain assumptions. The liability and expenses for the retirement benefit plan subject to
some of the consolidated subsidiaries are calculated by a simplified method.
Income taxes
Taxes on income consist of corporation, inhabitants’ and enterprise taxes.
The Company and certain consolidated subsidiaries in Japan apply the consolidated tax payment system.
The Group recognizes tax effects of temporary differences between carrying amounts for financial
reporting purposes and amounts for tax purposes. The provision for income taxes is computed based on
the profit before income taxes included in the statements of income of each company of the Group. The
asset and liability approach is used to recognize deferred tax assets and liabilities for the expected future
tax consequences of temporary differences.
Appropriations of retained earnings
Appropriations of retained earnings are accounted for and reflected in the accompanying consolidated
financial statements when approved by the shareholders.
Notes to Consolidated Financial Statements

Financial Section
Annual Report 2017
Special FeaturesProfileTo Our Stakeholders Corporate DataESG Information
PAGE 27CONTENTS
Amounts per share of common shares
Earnings per share of common shares is computed based on the weighted average number of common
shares outstanding during each fiscal year (less the treasury shares).
Cash dividends per share represent the actual amount applicable to the respective years.
Reclassifications
Certain reclassifications have been made in the 2016 consolidated financial statements to conform to the
2017 presentation.
Changes in accounting policies
Due to amendments to the Japanese Corporation Tax Act, the Company and its domestic subsidiaries
adopted “Practical Solution on a change in depreciation method due to Tax Reform 2016” (Practice Issue
Task Force No.32, June 17, 2016) from the fiscal year ended March 31, 2017 and changed the depreciation
method for facilities attached to buildings and structures, which were acquired on or after April 1, 2016,
from the declining balance method to the straight line method.
This change had a negligible impact on earnings.
Additional Information
The Company and its domestic subsidiaries adopted “Revised Implementation Guidance on Recoverability
of Deferred Tax Assets” (ASBJ Guidance No. 26, March 28, 2016) from the fiscal year ended March 31,
2017.
(1) Cash and cash equivalents at March 31, 2017 and 2016:
(2) Significant non-cash transactions
1) Assets and obligations relating to finance lease transactions
2) Retirement of treasury shares
Notes to Consolidated Financial Statements
3. Cash and Cash Equivalents
4. Inventories
Millions of Yen
Thousands of U.S.Dollars
(Note 1)
2017 2016 2017
Cash and deposits ¥ 55,197 ¥ 66,648 $ 492,830
Time deposits over three months (362) (345) (3,232)
Debt securities within three months to maturity 43,920 55,600 392,143
Short-term loans receivable with resale agreement 20,000 6,154 178,572
Cash and cash equivalents ¥118,755 ¥128,057 $1,060,313
Millions of Yen
Thousands of U.S.Dollars
(Note 1)
2017 2016 2017
Finished goods ¥38,352 ¥43,082 $342,428
Work in process 5,606 6,943 50,054
Raw materials and supplies 8,300 7,751 74,107
Total ¥52,258 ¥57,776 $466,589
Millions of Yen
Thousands of U.S.Dollars
(Note 1)
2017 2016 2017
Assets relating to finance lease transactions ¥723 ¥833 $6,455
Obligations relating to finance lease transactions 779 893 6,955
Millions of Yen
Thousands of U.S.Dollars
(Note 1)
2017 2016 2017
Retirement of treasury shares ¥15,329 ¥– $136,866

Financial Section
Annual Report 2017
Special FeaturesProfileTo Our Stakeholders Corporate DataESG Information
PAGE 28CONTENTS
(2) Fair values of financial instruments
The following table summarizes book value and fair value of the financial instruments, and the difference
between them as of March 31, 2017 and 2016. Items for which fair value is difficult to estimate are not
included in the following table (see (Note) 2 on P. 30).
Notes to Consolidated Financial Statements
Millions of Yen
For 2017 Book value Fair value Difference
Assets
[1] Cash and deposits ¥ 55,197 ¥ 55,197 ¥ –
[2] Notes and accounts receivable-trade 47,725 47,725 –
[3] Securities and investment securities
a. Held-to-maturity debt securities 23,920 23,920 –
b. Available-for-sale securities 52,396 52,396 –
[4] Short-term loans receivable with resale agreement 20,000 20,000 –
Total assets ¥199,238 ¥199,238 ¥ –
Liabilities
[1] Notes and accounts payable-trade ¥ 31,751 ¥ 31,751 ¥ –
[2] Accounts payable-other 19,079 19,079 –
[3] Bonds with subscription rights to shares 10,023 10,420 397
[4] Long-term loans payable 63,000 63,013 13
Total liabilities ¥123,853 ¥124,263 ¥410
Derivative transactions * ¥ 182 ¥ 182 ¥ –
(1) Qualitative information on financial instruments
1) Policies for using financial instruments
The Group invests surplus funds in highly secure financial assets, and funds required for working capital
and capital investments are raised through the issuance of bonds or loans from financial institutions such
as banks. Derivatives are used to avoid the risks described hereinafter and no speculative transactions are
entered into.
2) Details of financial instruments used and risks involved, and how they are managed
Notes and accounts receivable-trade are exposed to customers’ credit risk. To minimize that risk, the Group
periodically monitors the due date and the balance of the accounts.
Securities and investment securities are primarily highly secure and highly-rated debt securities
and shares of companies with which the Group has business relations, and are exposed to market price
fluctuation risk. The Group periodically monitors the market price and reviews the status of these holdings.
Short-term loans receivable with resale agreement are highly secure short-term loans to financial
institutions ranking above a certain level, and are of no substantial credit risk.
Operating payables comprising notes and accounts payable-trade and accounts payable-other have a
due date of within one year.
Operating payables, loans payable, and bond with subscription rights to shares are subject to
liquidity risk (the risk of an inability to pay by the due date). However, the Group manages liquidity risk by
maintaining short-term liquidity in excess of a certain level of consolidated sales or by other means.
The Group uses derivative transactions of forward foreign currency contracts to hedge currency
fluctuation risks arising from debts and credits denominated in foreign currencies, as well as interest
rate swap contracts to fix the cash flows associated with loans payable. The Group utilizes and manages
derivative transactions following the internal regulations for them, which stipulate policy, objective, scope,
organization, procedures and financial institutions to deal with, and has an implementation and reporting
system for derivative transactions reflecting proper internal control functions.
3) Supplemental information on fair values
The fair value of financial instruments is calculated based on quoted market price or, in the case where
there is no market price, by making a reasonable estimation. Because the preconditions applied include
a floating element, estimation of fair value may vary. The contract amounts, as presented in Note 7
“Derivative Transactions,” do not reflect market risk.
5. Fair Value of Financial Instruments

Financial Section
Annual Report 2017
Special FeaturesProfileTo Our Stakeholders Corporate DataESG Information
PAGE 29CONTENTS
(Note) 1: Method for calculating the fair value of financial instruments and matters related to
securities and investment securities and derivative transactions
Assets
[1] Cash and deposits, [2] Notes and accounts receivable-trade, [4] Short-term loans receivable
with resale agreement
Since these items are short-term and the fair value approximates the book value, the book value is used as
fair value.
[3] Securities and investment securities
The fair value of equity securities is the market price, while the fair value of debt securities is the market
price or the price quoted by the correspondent financial institution. Since certificates of deposit are short-
term, and the fair value approximates the book value, the book value is used as fair value.
See Note 6 “Securities and Investment Securities” for information on securities categorized by holding
purpose.
Liabilities
[1] Notes and accounts payable-trade, [2] Accounts payable-other
Since these items are short-term, and the fair value approximates the book value, the book value is used as
fair value.
[3] Bonds with subscription rights to shares
The fair value of bonds with subscription rights to shares is the price quoted by the correspondent financial
institution.
[4] Long-term loans payable
The fair value of long-term loans payable with fixed interest rates is the sum of the principal and total
interest discounted by the rate that is applied if a new loan is made.
Since long-term loans payable with floating interest rates reflect market interest rates over the short
term, and the fair value approximates the book value, the book value is used as fair value. However, those
that are subject to special treatment interest rate swaps are measured by taking the sum of the principal
and total interest associated with the interest rate swaps and discounting it by the rate that is reasonably
estimated and applied if a new loan is made (see Note 7 “Derivative Transactions”).
Long-term loans payable include current portion of long-term loans payable.
Notes to Consolidated Financial Statements
Millions of Yen
For 2016 Book value Fair value Difference
Assets[1] Cash and deposits ¥ 66,648 ¥ 66,648 ¥ –
[2] Notes and accounts receivable-trade 47,843 47,843 –
[3] Securities and investment securities
a. Held-to-maturity debt securities 30,000 30,000 –
b. Available-for-sale securities 57,436 57,436 –
[4] Short-term loans receivable with resale agreement 6,154 6,154 –
Total assets ¥208,081 ¥208,081 ¥ –
Liabilities[1] Notes and accounts payable-trade ¥ 34,542 ¥ 34,542 ¥ –
[2] Accounts payable-other 21,483 21,483 –
[3] Bonds with subscription rights to shares 10,033 11,704 1,671
[4] Long-term loans payable 67,000 67,361 361
Total liabilities ¥133,058 ¥135,090 ¥2,032
Derivative transactions ¥ – ¥ – ¥ –
Thousands of U.S.Dollars (Note 1)
For 2017 Book value Fair value Difference
Assets[1] Cash and deposits $ 492,830 $ 492,830 $ –[2] Notes and accounts receivable-trade 426,116 426,116 –[3] Securities and investment securities
a. Held-to-maturity debt securities 213,571 213,571 –b. Available-for-sale securities 467,822 467,822 –
[4] Short-term loans receivable with resale agreement 178,572 178,572 –Total assets $1,778,911 $1,778,911 $ –
Liabilities[1] Notes and accounts payable-trade $ 283,491 $ 283,491 $ –[2] Accounts payable-other 170,348 170,348 –[3] Bonds with subscription rights to shares 89,491 93,036 3,545[4] Long-term loans payable 562,500 562,616 116
Total liabilities $1,105,830 $1,109,491 $3,661Derivative transactions * $ 1,625 $ 1,625 $ –
* Net receivables and payables, which are derived from derivative transactions, are presented in net amounts.

Financial Section
Annual Report 2017
Special FeaturesProfileTo Our Stakeholders Corporate DataESG Information
PAGE 30CONTENTS
Derivative transactions
See Note 7 “Derivative Transactions.”
(Note) 2: Financial instruments of which fair value is difficult to estimate
The market price of the above shares is not available, therefore the fair value is difficult to estimate. Hence,
they are not included in “[3] Securities and investment securities” on P. 28-29.
In the fiscal years ended March 31, 2017 and 2016, there were no unlisted shares declared impairment loss.
(Note) 3: Monetary claims and securities and investment securities with repayment due dates
after March 31, 2017 and 2016:
Notes to Consolidated Financial Statements
Millions of Yen
Thousands of U.S.Dollars
(Note 1)
2017 2016 2017
Book value Book value Book value
Unlisted shares ¥2,757 ¥2,571 $24,616
Millions of Yen
For 2017Within
one yearWithin
five yearsWithin
ten yearsOver
ten yearsCash and deposits ¥ 55,197 ¥– ¥– ¥–Notes and accounts receivable-trade 47,725 – – –Securities and investment securities
1. Held-to-maturity debt-securities(1) Government bonds – – – –(2) Corporate bonds – – – –(3) Other 23,920 – – –
2. Available-for-sale securities with maturities(1) Debt securities
a. Government bonds – – – –b. Corporate bonds 10,000 – – –c. Other – – – –
(2) Other 10,000 – – –Short-term loans receivable with resale agreement 20,000 – – –Total ¥166,842 ¥– ¥– ¥–
Thousands of U.S.Dollars (Note 1)
For 2017Within
one yearWithin
five yearsWithin
ten yearsOver
ten yearsCash and deposits $ 492,830 $– $– $–Notes and accounts receivable-trade 426,116 – – –Securities and investment securities
1. Held-to-maturity debt-securities(1) Government bonds – – – –(2) Corporate bonds – – – –(3) Other 213,571 – – –
2. Available-for-sale securities with maturities(1) Debt securities
a. Government bonds – – – –b. Corporate bonds 89,286 – – –c. Other – – – –
(2) Other 89,286 – – –Short-term loans receivable with resale agreement 178,572 – – –Total $1,489,661 $– $– $–
Millions of Yen
For 2016Within
one yearWithin
five yearsWithin
ten yearsOver
ten years
Cash and deposits ¥ 66,648 ¥– ¥– ¥–
Notes and accounts receivable-trade 47,843 – – –
Securities and investment securities
1. Held-to-maturity debt-securities
(1) Government bonds – – – –
(2) Corporate bonds – – – –
(3) Other 30,000 – – –
2. Available-for-sale securities with maturities
(1) Debt securities
a. Government bonds – – – –
b. Corporate bonds 15,600 – – –
c. Other – – – –
(2) Other 10,000 – – –
Short-term loans receivable with resale agreement 6,154 – – –
Total ¥176,245 ¥– ¥– ¥–

Financial Section
Annual Report 2017
Special FeaturesProfileTo Our Stakeholders Corporate DataESG Information
PAGE 31CONTENTS
Notes to Consolidated Financial Statements
Millions of Yen
For 2016Within
one yearWithin
two yearsWithin
three yearsWithin
four yearsWithin
five yearsOver
five years
Bonds with subscription rights to shares ¥– ¥ – ¥ – ¥10,000 ¥ – ¥–
Long-term loans payable – 6,000 38,000 – 23,000 –
Total ¥– ¥6,000 ¥38,000 ¥10,000 ¥23,000 ¥–
(2) Available-for-sale securities
Securities with book values exceeding acquisition costs:
6. Securities and Investment Securities
(1) Held-to-maturity debt securities
Millions of Yen
2017
Book value Fair value Difference
Securities with fair values exceeding book values ¥23,920 ¥23,920 ¥–
Securities other than the above – – –
Total ¥23,920 ¥23,920 ¥–
Millions of Yen
2017
Book value Acquisition cost Difference
Equity securities ¥26,842 ¥13,653 ¥13,189
Debt securities 10,000 10,000 –
Other 10,000 10,000 –
Total ¥46,842 ¥33,653 ¥13,189
Thousands of U.S. Dollars (Note 1)
2017
Book value Acquisition cost Difference
Equity securities $239,660 $121,901 $117,759
Debt securities 89,286 89,286 –
Other 89,286 89,286 –
Total $418,232 $300,473 $117,759
Thousands of U.S. Dollars (Note 1)
2017
Book value Fair value Difference
Securities with fair values exceeding book values $213,571 $213,571 $–
Securities other than the above – – –
Total $213,571 $213,571 $–
Millions of Yen
2016
Book value Fair value Difference
Securities with fair values exceeding book values ¥30,000 ¥30,000 ¥–
Securities other than the above – – –
Total ¥30,000 ¥30,000 ¥–
(Note) 4: Bonds with subscription rights to shares and long-term loans payable with due dates
after March 31, 2017 and 2016
Millions of Yen
For 2017Within
one yearWithin
two yearsWithin
three yearsWithin
four yearsWithin
five yearsOver
five years
Bonds with subscription rights to shares ¥ – ¥ – ¥10,000 ¥ – ¥– ¥ –
Long-term loans payable 2,000 16,500 – 23,000 – 21,500
Total ¥2,000 ¥16,500 ¥10,000 ¥23,000 ¥– ¥21,500
Thousands of U.S. Dollars (Note 1)
For 2017Within
one yearWithin
two yearsWithin
three yearsWithin
four yearsWithin
five yearsOver
five years
Bonds with subscription rights to shares $ – $ – $89,286 $ – $– $ –
Long-term loans payable 17,857 147,321 – 205,357 – 191,964
Total $17,857 $147,321 $89,286 $205,357 $– $191,964

Financial Section
Annual Report 2017
Special FeaturesProfileTo Our Stakeholders Corporate DataESG Information
PAGE 32CONTENTS
(3) Available-for-sale securities sold for the years ended March 31, 2017 and 2016
(4) Securities and investment securities impaired
No impairment of securities and investment securities was recorded for the years ended March 31, 2017
and 2016.
With respect to impairment loss, securities with a fair value that has declined by 50% or more against
their acquisition costs are impaired. Among securities that have declined by 30% or more, but less than
50% against their acquisition costs, those that have been comprehensively assessed and deemed as
unlikely to recover their value are also impaired.
Notes to Consolidated Financial Statements
Securities other than the above:
(Notes): 1. Acquisition cost is presented based on book values after posting of impairment loss.
2. The market price of unlisted shares is not available, therefore the fair value is difficult to estimate. Hence, the amounts
of unlisted shares, which are ¥2,757 million ($24,616 thousand) and ¥2,571 million on the consolidated balance sheets
as of March 31, 2017 and 2016 respectively, are not included in Available-for-sale securities above.
Millions of Yen
2017
Book value Acquisition cost Difference
Equity securities ¥ 538 ¥ 545 ¥ (7)
Debt securities – – –
Other 5,016 5,027 (11)
Total ¥5,554 ¥5,572 ¥(18)
Millions of Yen
2017
Sales amount Gross realized
gainsGross realized
losses
Equity securities ¥1,800 ¥426 ¥–
Debt securities – – –
Other – – –
Total ¥1,800 ¥426 ¥–
Thousands of U.S. Dollars (Note 1)
2017
Book value Acquisition cost Difference
Equity securities $ 4,803 $ 4,866 $ (63)
Debt securities – – –
Other 44,786 44,884 (98)
Total $49,589 $49,750 $(161)
Thousands of U.S. Dollars (Note 1)
2017
Sales amount Gross realized
gainsGross realized
losses
Equity securities $16,071 $3,804 $–
Debt securities – – –
Other – – –
Total $16,071 $3,804 $–
Millions of Yen
2016
Book value Acquisition cost Difference
Equity securities ¥1,715 ¥2,014 ¥(299)
Debt securities – – –
Other – – –
Total ¥1,715 ¥2,014 ¥(299)
Millions of Yen
2016
Sales amount Gross realized
gainsGross realized
losses
Equity securities ¥3,342 ¥1,313 ¥205
Debt securities – – –
Other – – –
Total ¥3,342 ¥1,313 ¥205
Millions of Yen
2016
Book value Acquisition cost Difference
Equity securities ¥25,020 ¥13,544 ¥11,476
Debt securities 15,600 15,600 –
Other 15,101 15,062 39
Total ¥55,721 ¥44,206 ¥11,515

Financial Section
Annual Report 2017
Special FeaturesProfileTo Our Stakeholders Corporate DataESG Information
PAGE 33CONTENTS
(2) Interest rate-related derivatives
Derivative transactions not subject to hedge accounting
(1) Currency-related derivatives
Not applicable at March 31, 2016.
(2) Interest rate-related derivatives
Not applicable at March 31, 2017 and 2016.
Derivative transactions subject to hedge accounting
(1) Currency-related derivatives
Not applicable at March 31, 2017 and 2016.
Notes to Consolidated Financial Statements
Millions of Yen
2017
Contract amount
TotalDue afterone year Fair value
Realized gain (loss)
Forward contracts:
To sell:
Euros ¥16,222 ¥– ¥133 ¥133
Chinese yuan 3,590 – 49 49
Total ¥19,812 ¥– ¥182 ¥182
Millions of Yen
2017
Contract amount
Hedge accounting method Type Main hedged item Total
Due afterone year Fair value
Interest rate swaps that are subject to special treatment
Interest rate swaps: Receive float/
Pay fixLong-term loans
payable ¥2,000 ¥2,000 (Note) 2
Total ¥2,000 ¥2,000 ¥ –
Thousands of U.S. Dollars (Note 1)
2017
Contract amount
Hedge accounting method Type Main hedged item Total
Due afterone year Fair value
Interest rate swaps that are subject to special treatment
Interest rate swaps: Receive float/
Pay fixLong-term loans
payable $17,857 $17,857 (Note) 2
Total $17,857 $17,857 $ –
Millions of Yen
2016
Contract amount
Hedge accounting method Type Main hedged item Total
Due afterone year Fair value
Interest rate swaps that are subject to special treatment
Interest rate swaps: Receive float/
Pay fixLong-term loans
payable ¥3,500 ¥3,500 (Note) 2
Total ¥3,500 ¥3,500 ¥ –
Thousands of U.S. Dollars (Note 1)
2017
Contract amount
TotalDue afterone year Fair value
Realized gain (loss)
Forward contracts:
To sell:
Euros $144,839 $– $1,187 $1,187
Chinese yuan 32,054 – 438 438
Total $176,893 $– $1,625 $1,625
7.Derivative Transactions
(Notes): 1. Fair values of derivative transactions are determined by forward exchange rates.
2. Transactions are transactions other than market transactions.
(Notes): 1. Fair values of derivative transactions are determined by prices principally reported by the financial institutions with
which the Group engages in derivative transactions.
2. Since interest rate swaps that are subject to special treatment are accounted for with long-term loans payable, which
are hedged items, their fair value is included in the fair value of the said long-term loans payable.

Financial Section
Annual Report 2017
Special FeaturesProfileTo Our Stakeholders Corporate DataESG Information
PAGE 34CONTENTS
The annual maturities of bonds and long-term loans payable within five years:
The annual maturities of lease obligations within five years:
The lines of credit with the main financial institutions agreed as of March 31, 2017 and 2016:
Short-term loans payable, bonds and long-term loans payable and lease obligation at March 31, 2017 and
2016:
Notes to Consolidated Financial Statements
8. Short-term Loans Payable, Bonds and Long-term Loans Payable and Lease Obligation
* Details of bonds with subscription rights to shares ("warrants")
** The average interest rate is the weighted average rate on the year-end balance.
Upon request to exercise warrants in question, payments usually required for the issuance of the corresponding number of
shares shall be exempted as the issuer of bonds in question, in return, will be automatically exempted from obligation of
redemption of the bonds in lump-sum.
Exercise of warrants in question shall be regarded as an eligible request for exercise of subscription rights.
The conversion price of the euro-yen convertible bond-type bonds with subscription rights to shares due in 2019 was
adjusted to ¥2,051.8 ($18.32) from ¥2,055.7 retroactive to April 1, 2016 pursuant to the terms and conditions of the bonds
due to the payment of a year-end dividend of ¥22.5 per share and an annual dividend of ¥40.00 per share. The General
Meeting of Shareholders held on June 29, 2016 approved the payment of these dividends.
Type of shares involved common shares
Price of warrants gratis
Share issue price ¥2,051.8 ($18.32)
Total issue amount ¥10,050 million ($89,732 thousand)
Total value of new shares issued upon exercise of warrants –Warrant-linked 100%
Period of exercise of warrants August 6, 2014 to July 9, 2019
Millions of Yen
Thousands of U.S.Dollars
(Note 1)
Average interest rates
(%)** 2017 2016 2017
Euro-yen convertible bond-type bonds with subscription rights to shares due in 2019* – ¥10,023 ¥10,033 $ 89,491
Short-term loans payable 0.0 155 260 1,384
Long-term loans payable due within one year 0.3 2,000 – 17,857
Lease obligations due within one year 3.1 733 841 6,544
Long-term loans payable due over one year 0.3 61,000 67,000 544,643
Lease obligations due over one year 3.2 1,291 1,354 11,527
Other – – – –
Total – ¥75,202 ¥79,488 $671,446
Year ending March 31 Millions of Yen
Thousands of U.S.Dollars
(Note 1)
2018 ¥ 2,000 $ 17,857
2019 16,500 147,321
2020 10,000 89,286
2021 23,000 205,357
2022 – –
Millions of Yen
Thousands of U.S.Dollars
(Note 1)
2017 2016 2017
Line of credit ¥57,000 ¥57,100 $508,929
Unused 57,000 57,100 508,929
Year ending March 31 Millions of Yen
Thousands of U.S.Dollars
(Note 1)
2018 ¥733 $6,545
2019 499 4,455
2020 360 3,214
2021 234 2,089
2022 100 893

Financial Section
Annual Report 2017
Special FeaturesProfileTo Our Stakeholders Corporate DataESG Information
PAGE 35CONTENTS
(1) The following table summarizes the significant differences between the statutory tax rate and the Group’s
actual income tax rate for financial statement purposes for the years ended March 31, 2017 and 2016.
(2) Significant components of deferred tax assets and liabilities as of March 31, 2017 and 2016:
(3) Adjustments of amount of deferred tax assets and liabilities due to change in the corporate tax rate
The ”Act for Partial Revision of Acts, Including Partial Revision of the Consumption Tax Act for the
Fundamental Reform of the Taxation System to Achieve a Stable Source of Revenue for Social Security”
(Act No.85 of 2016) and the “Act for Partial Revision of Acts, Including Partial Revision of the Local Tax Act
and the Local Allocation Tax Act for the Fundamental Reform of the Taxation System to Achieve a Stable
Source of Revenue for Social Security” (Act No.86 of 2016) were enacted by the Japanese government
on November 18, 2016. In conjunction with these acts, the effective date for the increase in Japanese
consumption tax rate to 10% was extended from April 1, 2017 to October 1, 2019.
Accordingly, the effective dates of the abolition of the local corporation special tax, the accompanying
restoration of the corporate enterprise tax, and changes in statutory tax rates for local corporation taxes
and corporate inhabitant taxes have been extended from fiscal years beginning April 1, 2017 or later to
fiscal years beginning October 1, 2019 or later.
This change had a negligible impact on earnings.
(1) Defined benefit plan (Defined benefit plans, including multi-employer pension plans)
1)Movement in projected benefit obligation (except plans applying the simplified method)
Notes to Consolidated Financial Statements
9. Income Taxes
10. Retirement Benefits
2017 2016
Statutory tax rate 30.9% 33.1%
Increase (reduction) in tax resulting from:
Difference in statutory tax rate (including overseas subsidiaries) (3.4) (2.7)
Valuation allowance (2.9) (9.4)
Retained earnings of overseas subsidiaries (3.3) (1.4)
Decrease of deferred tax assets at year end due to changes of Japan tax rate 0.0 1.8
Other 0.2 1.9
Actual income tax rate 21.5% 23.3%
Millions of Yen
Thousands of U.S.Dollars
(Note 1)
2017 2016 2017
Deferred tax assets:
Net operating loss carryforwards ¥11,111 ¥11,626 $99,205
Inventories 1,689 1,932 15,080
Accrued expenses (bonuses to employees) 1,566 1,695 13,982
Property, plant and equipment 1,168 1,491 10,429
Retirement benefits related expenses 104 1,928 929
Other 5,078 5,017 45,339
Gross deferred tax assets 20,716 23,689 184,964
Valuation allowance (5,482) (6,025) (48,946)
Total deferred tax assets 15,234 17,664 136,018
Deferred tax liabilities:
Valuation difference on available-for-sale securities (4,039) (3,526) (36,062)
Retained earnings of overseas subsidiaries (2,013) (2,775) (17,973)
Unrealized holding gain (1,287) (1,287) (11,491)
Reserve for advanced depreciation of non-current assets (67) (70) (598)
Other (74) (71) (661)
Total deferred tax liabilities (7,480) (7,729) (66,785)
Net deferred tax assets ¥7,754 ¥ 9,935 $69,233
Millions of Yen
Thousands of U.S.Dollars
(Note 1)
2017 2016 2017
Projected benefit obligation at beginning of period ¥53,239 ¥54,206 $475,349
Service cost 1,704 1,747 15,214
Interest cost 571 588 5,098
Actuarial differences accrued (563) 45 (5,027)
Benefits paid (2,535) (2,320) (22,634)
Other (21) (1,027) (187)
Projected benefit obligation at end of period ¥52,395 ¥53,239 $467,813

Financial Section
Annual Report 2017
Special FeaturesProfileTo Our Stakeholders Corporate DataESG Information
PAGE 36CONTENTS
4) Reconciliation from projected benefit obligation and pension plan assets to liability (asset) for retirement benefits
5) Retirement benefit expenses
6) Remeasurements of defined benefit plans (before income tax effects)
Notes to Consolidated Financial Statements
Millions of Yen
Thousands of U.S.Dollars
(Note 1)
2017 2016 2017Service cost ¥1,704 ¥1,747 $ 15,214 Interest cost 571 588 5,098 Expected return on pension plan assets (2,016) (2,193) (18,000)Amortization of actuarial differences 1,461 1,273 13,045 Amortization of prior service costs (1,846) (1,857) (16,482)Other 608 476 5,429 Retirement benefit expenses ¥ 482 ¥ 34 $ 4,304
Millions of Yen
Thousands of U.S.Dollars
(Note 1)
2017 2016 2017
Actuarial differences ¥ 4,854 ¥(4,777) $ 43,339
Prior service costs (1,846) (1,857) (16,482)
Total ¥ 3,008 ¥(6,634) $ 26,857
Millions of Yen
Thousands of U.S.Dollars
(Note 1)
2017 2016 2017
Funded projected benefit obligation ¥ 56,433 ¥57,383 $ 503,866
Pension plan assets (69,299) (65,337) (618,741)
(12,866) (7,954) (114,875)
Unfunded projected benefit obligation 235 179 2,098
Total net liability (asset) for retirement benefits recorded on the consolidated balance sheets (12,631) (7,775) (112,777)
Net defined benefit liability 491 1,338 4,384
Net defined benefit asset (13,122) (9,113) (117,161)
Total net liability (asset) for retirement benefits recorded on the consolidated balance sheets ¥(12,631) ¥ (7,775) $(112,777)
(Note): Including plans applying the simplified method.
(Note): Premium retirement benefit expenses paid onetime are included in Other.
2) Movement in pension plan assets (except plans applying the simplified method)
3) Movement in net defined benefit liability for plans applying the simplified method
Millions of Yen
Thousands of U.S.Dollars
(Note 1)
2017 2016 2017
Net defined benefit liability at beginning of period ¥(171) ¥(449) $(1,527)
Retirement benefit expenses (199) 483 (1,777)
Benefits paid (10) (44) (89)
Contributions paid by the employer (150) (157) (1,339)
Other (7) (4) (63)
Net defined benefit liability at end of period ¥(537) ¥(171) $(4,795)
Millions of Yen
Thousands of U.S.Dollars
(Note 1)
2017 2016 2017Pension plan assets at beginning of period ¥60,843 ¥66,676 $543,241
Expected return on pension plan assets 2,016 2,193 18,000 Actuarial differences accrued 2,768 (6,268) 24,714 Contributions paid by the employer 1,191 1,215 10,634 Benefits paid (2,322) (2,162) (20,732)Other (7) (811) (62)
Pension plan assets at end of period ¥64,489 ¥60,843 $575,795

Financial Section
Annual Report 2017
Special FeaturesProfileTo Our Stakeholders Corporate DataESG Information
PAGE 37CONTENTS
7) Accumulated remeasurements for retirement benefit (before income tax effects)
8) Pension plan assets
(i) Pension plan assets comprise:
(ii) Long-term expected rate of return
Current and target asset allocations, as well as current and expected returns on various categories of
pension plan assets have been considered in determining the long-term expected rate of return.
9) Actuarial assumptions
The principal actuarial assumptions at the end of the period are as follows:
(2) Defined Contribution Plan
At March 31, 2017 and 2016, the required contributions to the defined contribution plans of the Company
and its consolidated subsidiaries were ¥954 million ($8,518 thousand) and ¥1,011 million, respectively.
Notes to Consolidated Financial Statements
(Note): The employee retirement benefit trust set up for corporate pension plans represents 15% and 14% of total pension assets,
as of March 31, 2017 and 2016, respectively.
2017 2016
Equity securities 15% 54%
Debt securities 2% 16%
General account 23% 20%
Cash and deposits 55% 5%
Other 5% 5%
Total 100% 100%
2017 2016
Discount rate mainly 0.8% mainly 0.8%
Long-term expected rate of return mainly 3.0% mainly 3.0%
Under the Japanese Corporation Law (“the Law”) and regulations, the entire amount paid for new shares
is required to be designated as capital stock. However, a company may, by a resolution of the board of
directors, designate an amount not exceeding one-half of the price of the new shares as legal capital
surplus, which is included in capital surplus.
In cases where dividend distribution of surplus is made, the smaller of an amount equal to 10% of
the dividend or the excess, if any, of 25% of capital stock over the total of legal capital surplus and legal
retained earnings must be set aside as legal capital surplus or legal retained earnings. Legal retained
earnings are included in retained earnings in the accompanying consolidated balance sheets.
Legal capital surplus and legal retained earnings may not be distributed as dividends. However, all legal
capital surplus and all legal retained earnings may be transferred to other capital surplus and retained
earnings, respectively, which are potentially available for dividends.
The maximum amount that the Company can distribute as dividends is calculated based on the
nonconsolidated financial statements of the Company in accordance with the Law.
(1) Finance lease transactions which do not transfer the ownership of the leased property to the
lessee, and that were concluded prior to the year that began on April 1, 2008 for which the
new accounting standards were applied
The assumed outstanding future lease payments as of March 31, 2017 and 2016:
11. Net Assets
12. Lease Transactions
Millions of Yen
Thousands of U.S.Dollars
(Note 1)
2017 2016 2017
Future lease payments:
Due within one year ¥13 ¥12 $116
Due over one year 20 33 179
Total ¥33 ¥45 $295
Millions of Yen
Thousands of U.S.Dollars
(Note 1)
2017 2016 2017
Unrecognized actuarial differences ¥ 2,781 ¥ 7,635 $ 24,830
Unrecognized prior service costs (9,742) (11,588) (86,982)
Total ¥(6,961) ¥(3,953) $(62,152)

Financial Section
Annual Report 2017
Special FeaturesProfileTo Our Stakeholders Corporate DataESG Information
PAGE 38CONTENTS
Notes to Consolidated Financial Statements
(2) Finance leases
See Note2 on P. 26
(3) Operating leases
Outstanding future noncancellable lease payments as of March 31, 2017 and 2016:
Total lease expenses, total assumed depreciation cost and total assumed interest cost as lessee for the years
ended March 31, 2017 and 2016:
Assumed acquisition cost, accumulated depreciation and net book value of the leased assets under the
finance lease contracts as lessee as of March 31, 2017 and 2016:
Millions of Yen
Thousands of U.S.Dollars
(Note 1)
2017 2016 2017
Total lease expenses ¥14 ¥15 $125
Total assumed depreciation cost 10 11 89
Total assumed interest cost 2 2 18 Millions of Yen
Thousands of U.S.Dollars
(Note 1)
2017 2016 2017
Future lease payments:
Due within one year ¥174 ¥ 231 $1,554
Due over one year 723 869 6,455
Total ¥897 ¥1,100 $8,009 Millions of Yen
2017
Acquisition cost
Accumulated depreciation
Net bookvalue
Machinery, equipment and vehicles ¥155 ¥129 ¥26
Total ¥155 ¥129 ¥26
Millions of Yen
2016
Acquisition cost
Accumulated depreciation
Net bookvalue
Machinery, equipment and vehicles ¥155 ¥119 ¥36
Total ¥155 ¥119 ¥36
Thousands of U.S.Dollars (Note 1)
2017
Acquisition cost
Accumulated depreciation
Net bookvalue
Machinery, equipment and vehicles $1,384 $1,152 $232
Total $1,384 $1,152 $232
(Notes): 1. In calculating assumed depreciation cost, the leased assets are depreciated on a straight-line basis on the assumption
that the lease term is the useful life and the residual value is zero.
2. In calculating the assumed interest cost, the difference between the total lease amount and the assumed acquisition
cost is taken as the assumed interest cost. The method of distribution over each period depends on the interest
method.
(1) Overview of reportable segments
The Group’s reportable segments consist of the Group’s constituent units for which separate financial
information is available and which are subject to periodic examination in order for the board of directors to
determine the allocation of management resources and evaluate financial results.
The Group designates three areas of segment reporting, which are the “Consumer,” “System
Equipment,” and “Others” segments, based on the type of products and services, and the market and
consumer categories.
The categories of the main products and services belonging to each reportable segment are as follows:
Consumer...................Watches, Clocks, Electronic dictionaries, Electronic calculators, Label printers,
Electronic musical instruments, Digital cameras, etc.
System Equipment ......Handheld terminals, Electronic cash registers, Office computers, Page printers,
Data projectors, etc.
Others ........................Molds, etc.
(2) Basis of measurement for net sales, income or loss, assets and others for each reportable
segment
The accounting method for the reportable segments is largely in line with the descriptions in Notes 1-2 on
P. 25-27 Intersegment profits are based on the market price.
13. Segment Information

Financial Section
Annual Report 2017
Special FeaturesProfileTo Our Stakeholders Corporate DataESG Information
PAGE 39CONTENTS
Notes to Consolidated Financial Statements
(3) Information on net sales, profit or loss, assets and others for each reportable segment
Millions of Yen
Reportable segments
Adjustments*
Amounts on consolidated
financial statements**For 2017 Consumer
System Equipment Others Total
Net sales:
External customers ¥272,804 ¥39,734 ¥ 8,675 ¥321,213 ¥ – ¥321,213
Intersegment 1 29 6,888 6,918 (6,918) –
Total 272,805 39,763 15,563 328,131 (6,918) 321,213
Segment profit (loss) 37,194 (2,224) 335 35,305 (4,669) 30,636
Segment assets 190,178 40,744 19,985 250,907 100,545 351,452
Other
Depreciation 7,044 1,957 421 9,422 319 9,741
Amortization of goodwill 28 11 – 39 – 39
Investment to entities accounted for using equity method – – 2,701 2,701 – 2,701
Increase in property, plant and equipment and intangible assets 7,561 2,208 174 9,943 177 10,120
Millions of Yen
Reportable segments
Adjustments*
Amounts on consolidated
financial statements**For 2016 Consumer
System Equipment Others Total
Net sales:
External customers ¥300,956 ¥42,669 ¥ 8,633 ¥352,258 ¥ – ¥352,258
Intersegment 2 49 8,788 8,839 (8,839) –
Total 300,958 42,718 17,421 361,097 (8,839) 352,258
Segment profit (loss) 48,981 (1,825) (114) 47,042 (4,873) 42,169
Segment assets 189,995 45,219 19,809 255,023 113,431 368,454
Other
Depreciation 6,684 2,308 442 9,434 274 9,708
Amortization of goodwill – 11 – 11 – 11
Investment to entities accounted for using equity method – – 2,510 2,510 – 2,510
Increase in property, plant and equipment and intangible assets 7,178 2,979 274 10,431 454 10,885
Thousands of U.S.Dollars (Note 1)
Reportable segments
Adjustments*
Amounts on consolidated
financial statements**For 2017 Consumer
System Equipment Others Total
Net sales:
External customers $2,435,750 $354,768 $ 77,455 $2,867,973 $ – $2,867,973
Intersegment 9 259 61,500 61,768 (61,768) –
Total 2,435,759 355,027 138,955 2,929,741 (61,768) 2,867,973
Segment profit (loss) 332,089 (19,857) 2,991 315,223 (41,687) 273,536
Segment assets 1,698,018 363,786 178,437 2,240,241 897,723 3,137,964
Other
Depreciation 62,893 17,473 3,759 84,125 2,848 86,973
Amortization of goodwill 250 98 – 348 – 348
Investment to entities accounted for using equity method – – 24,116 24,116 – 24,116
Increase in property, plant and equipment and intangible assets 67,509 19,714 1,554 88,777 1,580 90,357
* Adjustments are as shown below:
(1) Downward adjustments to segment profit (loss) for the years ended March 31, 2017 and 2016 are ¥4,669 million ($41,687
thousand) and ¥4,873 million, respectively. These amounts include corporate expenses that are not allocated to any
reportable segments of ¥4,669 million ($41,687 thousand) and ¥4,873 million, respectively. Corporate expenses principally
consist of administrative expenses of the parent company and R&D expenses for fundamental research, which are not
attributable to any reportable segments.
(2) Adjustments to segment assets for the years ended March 31, 2017 and 2016 are ¥100,545 million ($897,723 thousand)
and ¥113,431 million, respectively. These amounts include corporate assets that are not allocated to any reportable
segments of ¥101,134 million ($902,982 thousand) and ¥113,886 million, respectively.
(3) Adjustments to depreciation for the years ended March 31, 2017 and 2016 are ¥319 million ($2,848 thousand) and
¥274 million, respectively. These amounts consist of depreciation of assets related to administrative divisions that are not
attributable to any reportable segments.
(4) Adjustments to the increase in property, plant and equipment and intangible assets for the years ended March 31, 2017
and 2016 are ¥177 million ($1,580 thousand) and ¥454 million, respectively. These amounts consist of capital expenditures
in administrative divisions that are not attributable to any reportable segments.
** Segment profit (loss) is reconciled with operating profit in the consolidated financial statements.

Financial Section
Annual Report 2017
Special FeaturesProfileTo Our Stakeholders Corporate DataESG Information
PAGE 40CONTENTS
Notes to Consolidated Financial Statements
Thousands of U.S.Dollars (Note 1)
For 2017 Japan North America Europe Asia Others Total
Net sales: $955,955 $366,509 $437,402 $779,893 $328,214 $2,867,973
Thousands of U.S.Dollars (Note 1)
For 2017 Japan North America Europe Asia Others Total
Property, plant and equipment $436,116 $9,196 $3,955 $56,982 $813 $507,062
Millions of Yen
For 2016 Japan North America Europe Asia Others Total
Property, plant and equipment ¥52,396 ¥1,028 ¥431 ¥6,944 ¥83 ¥60,882
Millions of Yen
For 2017 Japan North America Europe Asia Others Total
Property, plant and equipment ¥48,845 ¥1,030 ¥443 ¥6,382 ¥91 ¥56,791
(5) Information on impairment loss of non-current assets for each reportable segment
(6) Information on amortization of goodwill and unamortized balance in each reportable segment
Millions of Yen
For 2017 ConsumerSystem
Equipment Others
Elimination or unallocated
amount Total
Impairment loss ¥– ¥1,003 ¥– ¥19 ¥1,022
Millions of Yen
For 2017 ConsumerSystem
Equipment Others
Elimination or unallocated
amount Total
GoodwillBalance at the end of the reporting year ¥376 ¥34 ¥– ¥– ¥410
Thousands of U.S.Dollars (Note 1)
For 2017 ConsumerSystem
Equipment Others
Elimination or unallocated
amount Total
GoodwillBalance at the end of the reporting year $3,357 $304 $– $– $3,661
Millions of Yen
For 2016 ConsumerSystem
Equipment Others
Elimination or unallocated
amount Total
Impairment loss ¥– ¥743 ¥16 ¥288 ¥1,047
Millions of Yen
For 2016 ConsumerSystem
Equipment Others
Elimination or unallocated
amount Total
GoodwillBalance at the end of the reporting year ¥– ¥45 ¥– ¥– ¥45
(Note): Disclosure of the amount of goodwill amortization has been omitted as it is disclosed in the segment information above.
(Note): The above impairment loss includes the impairment loss amount indicated as business structure improvement expenses.
Thousands of U.S.Dollars (Note 1)
For 2017 ConsumerSystem
Equipment Others
Elimination or unallocated
amount Total
Impairment loss $– $8,955 $– $170 $9,125
(4) Information about geographic areas
Millions of Yen
For 2017 Japan North America Europe Asia Others Total
Net sales: ¥107,067 ¥41,049 ¥48,989 ¥87,348 ¥36,760 ¥321,213
Millions of Yen
For 2016 Japan North America Europe Asia Others Total
Net sales: ¥110,594 ¥47,166 ¥51,714 ¥99,085 ¥43,699 ¥352,258
(Notes): 1. Sales are classified by country or region where customers are located.
2. Net sales of North America includes ¥36,001 million ($321,438 thousand) in 2017 and ¥42,164 million in 2016 in U.S.
while that of Asia includes ¥41,387 million in 2016 in China.

Financial Section
Annual Report 2017
Special FeaturesProfileTo Our Stakeholders Corporate DataESG Information
PAGE 41CONTENTS
Notes to Consolidated Financial Statements
For 2017
The Group recognized impairment loss.
With respect to business assets, the Group carries out asset grouping principally according to its
management accounting categories, which are employed to enable continuous monitoring of the Group’s
earnings situation, while idle assets are managed on an individual basis.
The Group has applied impairment accounting to business assets and idle assets whose values are
deemed to have significantly declined due to deteriorating business environment and review of optimal use
in the future, respectively. Book value of these assets has been reduced to recoverable amounts and the
reduced amounts of ¥1,022 million ($9,125 thousand) is recognized as “business structure improvement
expenses” and “impairment loss.”
The breakdown of the losses is: ¥153 million ($1,366 thousand) for machinery, equipment and vehicles,
¥144 million ($1,286 thousand) for tools, furniture and fixtures, ¥19 million ($169 thousand) for land, ¥157
million ($1,402 thousand) for leased assets, ¥545 million ($4,866 thousand) for software, and ¥4 million
($36 thousand) for others.
Recoverable amounts are estimated using net selling prices which are reasonably estimated. Recoverable
amounts for land are calculated based on publicly assessed value, etc., and those for assets other than land
are based on estimated disposal values.
For 2016
The Group recognized impairment loss.
These expenses include loss on abandonment of assets, impairment loss of non-current assets, retirement-
related expenses and other related expenses related to System Equipment business structural reforms.
Appropriation of retained earnings
At the annual shareholders’ meeting held on June 29, 2017, the Company’s shareholders approved the
payment of a cash dividend of ¥20.00 ($0.18) per share aggregating ¥4,927 million ($43,991 thousand) to
registered shareholders as of March 31, 2017.
With respect to business assets, the Group carries out asset grouping principally according to its
management accounting categories, which are employed to enable continuous monitoring of the Group’s
earnings situation, while idle assets are managed on an individual basis.
The Group has applied impairment accounting to business assets and idle assets whose values are
deemed to have significantly declined due to deteriorating business environment and review of optimal use
in the future, respectively. Book value of these assets has been reduced to recoverable amounts and the
reduced amounts of ¥1,047 million is recognized as” impairment loss.”
The breakdown of the losses is: ¥135 million for tools, furniture and fixtures, ¥293 million for land, ¥310
million for leased assets, ¥291 million for software, and ¥18 million for others.
Recoverable amounts are estimated using net selling prices which are reasonably estimated. Recoverable
amounts for land are calculated based on publicly assessed value, etc., and those for assets other than land
are based on estimated disposal values.
Use Type of assets Location
Business assetsMachinery, equipment and vehicles, tools, furniture
and fixtures, leased assets, software etc.Iruma City, Saitama Pref. and
others
Idle assets Land Fussa City, Tokyo
Use Type of assets Location
Business assetsTools, furniture and fixtures, leased
assets, software etc.Hachioji City, Tokyo, Iruma City, Saitama Pref. and others
Idle assets Land, buildings and structuresYamagata City, Yamagata Pref.Ashiya City, Hyogo Pref. and others
15. Impairment Loss
16. Business structure improvement expenses
17. Subsequent Events
At March 31, 2017 and 2016, the Group was contingently liable for trade notes and export drafts discounted
with banks in the amount of ¥730 million ($6,518 thousand) and ¥1,193 million, respectively.
14. Contingent Liabilities

Financial Section
Annual Report 2017
Special FeaturesProfileTo Our Stakeholders Corporate DataESG Information
PAGE 42CONTENTS
To the Board of Directors of CASIO COMPUTER Co., Ltd.:
We have audited the accompanying consolidated financial statements of CASIO COMPUTER Co., Ltd. and its consolidated subsidiaries, which comprise the consolidated balance sheets as at March 31, 2017 and 2016, and the
consolidated statements of income, statements of comprehensive income, statements of changes in net assets and statements of cash flows for the years then ended, and a summary of significant accounting policies and other
explanatory information.
Management’s Responsibility for the Consolidated Financial Statements
Management is responsible for the preparation and fair presentation of these consolidated financial statements in accordance with accounting principles generally accepted in Japan, and for such internal control as management
determines is necessary to enable the preparation of consolidated financial statements that are free from material misstatement, whether due to fraud or error.
Auditor’s Responsibility
Our responsibility is to express an opinion on these consolidated financial statements based on our audits. We conducted our audits in accordance with auditing standards generally accepted in Japan. Those standards require
that we comply with ethical requirements and plan and perform the audit to obtain reasonable assurance about whether the consolidated financial statements are free from material misstatement.
An audit involves performing procedures to obtain audit evidence about the amounts and disclosures in the consolidated financial statements. The procedures selected depend on our judgement, including the assessment of
the risks of material misstatement of the consolidated financial statements, whether due to fraud or error. In making those risk assessments, we consider internal control relevant to the entity’s preparation and fair presentation
of the consolidated financial statements in order to design audit procedures that are appropriate in the circumstances, while the objective of the financial statement audit is not for the purpose of expressing an opinion on the
effectiveness of the entity’s internal control. An audit also includes evaluating the appropriateness of accounting policies used and the reasonableness of accounting estimates made by management, as well as evaluating the
overall presentation of the consolidated financial statements.
We believe that the audit evidence we have obtained is sufficient and appropriate to provide a basis for our audit opinion.
Opinion
In our opinion, the consolidated financial statements present fairly, in all material respects, the financial position of CASIO COMPUTER Co., Ltd. and its consolidated subsidiaries as at March 31, 2017 and 2016, and their financial
performance and cash flows for the years then ended in accordance with accounting principles generally accepted in Japan.
Convenience Translation
The U.S. dollar amounts in the accompanying consolidated financial statements with respect to the year ended March 31, 2017 are presented solely for convenience. Our audit also included the translation of yen amounts into
U.S. dollar amounts and, in our opinion, such translation has been made on the basis described in Note 1 to the consolidated financial statements.
June 29, 2017
Tokyo, Japan
Independent Auditor’s Report

Corporate Data
Annual Report 2017
Special FeaturesProfileTo Our Stakeholders ESG Information Financial Section
PAGE 43CONTENTS
Directors and Audit & Supervisory Board MembersPrincipal Subsidiaries(As of June 29, 2017)(As of March 31, 2017)
Overseas Subsidiaries
Europe
Casio Europe GmbH F.R. Germany Sales of Casio products
Casio Electronics Co. Ltd. U.K. Sales of Casio products
Casio France S.A. France Sales of Casio products
Casio Benelux B.V. The Netherlands Sales of Casio products
Casio Scandinavia AS Norway Sales of Casio products
Casio Espana, S.L. Spain Sales of Casio products
Limited Liability Company Casio Russia Sales of Casio products
Casio Italia S.r.l. Italy Sales of Casio products
Asia
Casio Computer (Hong Kong) Ltd. Hong Kong Production of electronic calculators
Casio Taiwan Co., Ltd. Taiwan Sales of Casio products
Casio Singapore Pte., Ltd. Singapore Sales of Casio products
Casio India Co., Pvt. Ltd. India Sales of Casio products
Casio Electronic Technology(Zhongshan) Co., Ltd. The People’s Republic of China
Production of electronic calculators, electronic dictionaries and electronic musical instruments
Casio Electronics (Shenzhen) Co., Ltd. The People’s Republic of China Design
and production of electronic timepieces
Casio (Guangzhou) Co., Ltd. The People’s Republic of China Sales
of electronic timepieces
Casio (Thailand) Co., Ltd. Thailand Production of electronic timepieces
Casio (China) Co., Ltd. The People’s Republic of China Sales of Casio products
Casio Malaysia, Sdn. Bhd. Malaysia
Sales of Casio products
Americas
Casio America, Inc. U.S.A. Sales of Casio products
Casio Canada Ltd. Canada Sales of Casio products
Casio Holdings, Inc. U.S.A. Holding company
Casio Brasil Comercio de ProdutosEletronicos Ltda. Brazil Sales of Casio products
Casio Mexico Marketing,S. de R. L. de C.V. Mexico Sales of Casio products
Middle East
Casio Middle East FZE U.A.E. Sales of Casio products
Domestic Subsidiaries
Yamagata Casio Co., Ltd. Production of digital cameras, electronic
timepieces and system equipment
Casio Electronic Manufacturing Co., Ltd. Development and production of page printers
Casio Techno Co., Ltd. Customer service for Casio products
Casio Information Systems Co., Ltd. Sales of system equipment
CXD NEXT Co., Ltd. Electronic settlements and support
services for retail stores utilizing Casio’s electronic cash registers
Casio Human Systems Co., Ltd. Sales of software for system equipment
(Total: 46 consolidated subsidiaries and 3
equitymethod affiliates)
Chairman and CEO Kazuo Kashio April 1950 Joined Kashio SeisakujoDecember 1988 Representative Director and President of the CompanyJune 2015 Chairman and CEO of the Company (to the present)
President and COO Kazuhiro Kashio April 1991 Joined the CompanyMay 2014 Senior Executive Managing Officer, Member of the Board, Senior
General Manager of Business Headquarters of Consumer Product and System Solution of the Company
June 2015 President and COO of the Company (to the present)Executive Vice President
Hiroshi Nakamura April 2000 Joined the Company President of Casio Computer Co., GmbH DeutschlandJanuary 2016 Executive Vice President of the Company (to the present)
Senior Executive Managing Officers, Members of the Board
Akinori Takagi April 1999 Advisor of the CompanyMay 2014 Senior Executive Managing Officer, Member of the Board, in
charge of Finance and IR of the Company (to the present)Yuichi Masuda April 1978 Joined the Company
May 2014 Senior Executive Managing Officer, Member of the Board, Senior General Manager of Timepiece Product Division of the Company (to the present)
Shigenori Itoh April 1983 Joined the CompanyJanuary 2016 Senior Executive Managing Officer, Member of the Board, Senior General
Manager of Global Marketing Headquarters of the Company (to the present)Executive Officers, Members of the Board
Toshiyuki Yamagishi April 1985 Joined the CompanyJune 2013 Executive Officer, Member of the Board, Senior General Manager of
Corporate Management Division of the Company (to the present)Shin Takano April 1984 Joined the Company
June 2015 Executive Officer, Member of the Board, Senior General Manager of Finance Division of the Company (to the present)
Harumi Saito April 1980 Joined the CompanyJune 2016 Executive Officer, Member of the Board, Senior General Manager of
General Affairs & Personnel Department of the Company (to the present)Directors, Members of the Board
Hirokazu Ishikawa (Outside)Makoto Kotani (Outside)
Audit & Supervisory Board Member
Tomoyuki Uchiyama
Outside Audit & Supervisory Board Members
Hironori Daitoku (Outside)Kazuhiko Tozawa (Outside)
Senior Executive Officers
Nobuyuki Mochinaga Senior General Manager of Development CenterTetsuo Kashio General Manager of CS HeadquartersTakashi Kashio Senior General Manager of Legal & Intellectual Property Division and Corporate
Communication DivisionJin Nakayama Senior General Manager of Consumer Product Development Headquarters
Executive Officers Makoto Kobayashi General Manager of CSR Promotion DepartmentAtsushi Yazawa Senior General Manager of Productin & Purchasing UnitKoji Moriya Senior General Manager of System Product DivisionMasayuki Uehara Senior General Manager of Domestic Sales and Marketing Division of Global
Marketing HeadquartersNobuyuki Inada General Manager of General Affairs Department of General Affairs & Personnel DivisionToshiyuki Iguchi Deputy Senior General Manager of Development Center Hideaki Terada Executive Officer / Digital Art DivisionShinji Ota Senior General Manager of General Manager of Consumer & Educational Solution Product DivisionKazuyuki Yamashita Senior General Manager of Overseas Sales Division of Global Marketing Headquarters
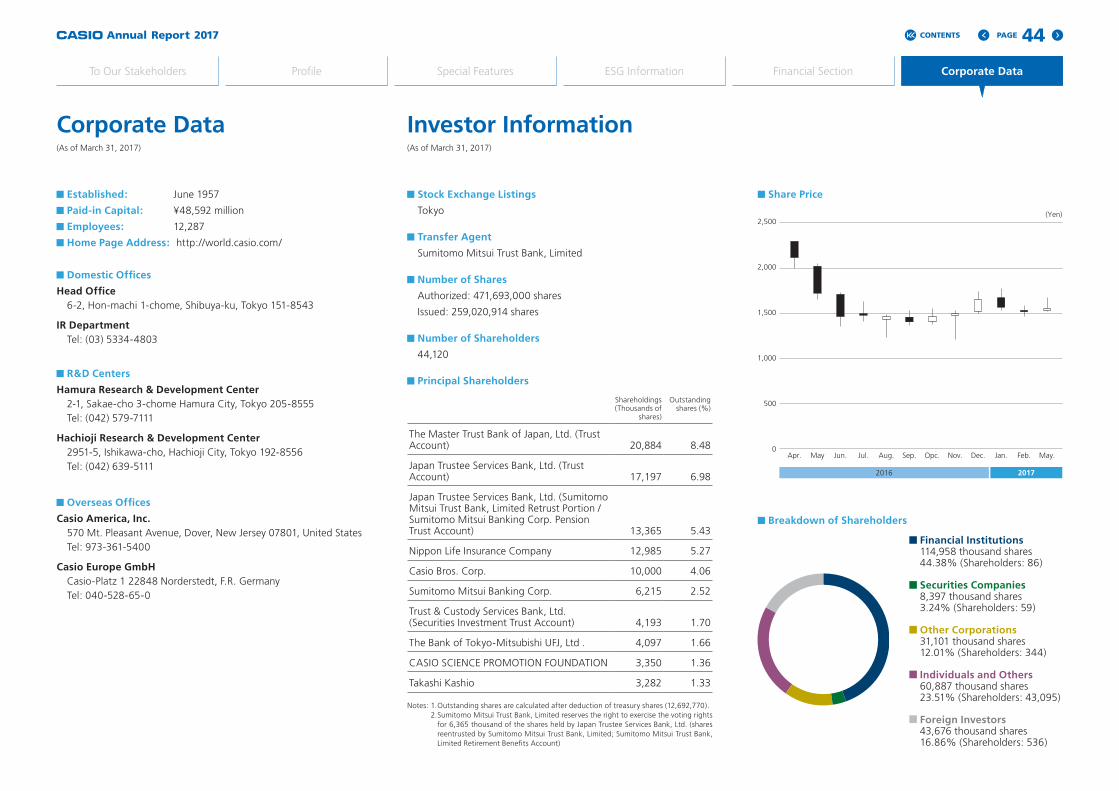
Corporate Data
Annual Report 2017
Special FeaturesProfileTo Our Stakeholders ESG Information Financial Section
PAGE 44CONTENTS
Corporate Data Investor Information(As of March 31, 2017) (As of March 31, 2017)
Established: June 1957
Paid-in Capital: ¥48,592 million
Employees: 12,287
Home Page Address: http://world.casio.com/
Domestic Offices
Head Office 6-2, Hon-machi 1-chome, Shibuya-ku, Tokyo 151-8543
IR Department Tel: (03) 5334-4803
R&D Centers
Hamura Research & Development Center 2-1, Sakae-cho 3-chome Hamura City, Tokyo 205-8555 Tel: (042) 579-7111
Hachioji Research & Development Center 2951-5, Ishikawa-cho, Hachioji City, Tokyo 192-8556 Tel: (042) 639-5111
Overseas Offices
Casio America, Inc. 570 Mt. Pleasant Avenue, Dover, New Jersey 07801, United States Tel: 973-361-5400
Casio Europe GmbH Casio-Platz 1 22848 Norderstedt, F.R. Germany Tel: 040-528-65-0
Stock Exchange Listings
Tokyo
Transfer Agent
Sumitomo Mitsui Trust Bank, Limited
Number of Shares
Authorized: 471,693,000 shares
Issued: 259,020,914 shares
Number of Shareholders
44,120
Principal Shareholders
Share Price
Breakdown of Shareholders
Notes: 1. Outstanding shares are calculated after deduction of treasury shares (12,692,770). 2. Sumitomo Mitsui Trust Bank, Limited reserves the right to exercise the voting rights
for 6,365 thousand of the shares held by Japan Trustee Services Bank, Ltd. (shares reentrusted by Sumitomo Mitsui Trust Bank, Limited; Sumitomo Mitsui Trust Bank, Limited Retirement Benefits Account)
Shareholdings(Thousands of
shares)
Outstandingshares (%)
The Master Trust Bank of Japan, Ltd. (Trust Account) 20,884 8.48
Japan Trustee Services Bank, Ltd. (Trust Account) 17,197 6.98
Japan Trustee Services Bank, Ltd. (Sumitomo Mitsui Trust Bank, Limited Retrust Portion /Sumitomo Mitsui Banking Corp. Pension Trust Account) 13,365 5.43
Nippon Life Insurance Company 12,985 5.27
Casio Bros. Corp. 10,000 4.06
Sumitomo Mitsui Banking Corp. 6,215 2.52
Trust & Custody Services Bank, Ltd. (Securities Investment Trust Account) 4,193 1.70
The Bank of Tokyo-Mitsubishi UFJ, Ltd . 4,097 1.66
CASIO SCIENCE PROMOTION FOUNDATION 3,350 1.36
Takashi Kashio 3,282 1.33
2,500
Apr. May Jun. Jul. Aug. Sep. Opc. Nov. Dec. Jan. Feb. May.
(Yen)
2,000
1,500
1,000
500
0
2016 2017
Financial Institutions114,958 thousand shares44.38% (Shareholders: 86)
Securities Companies8,397 thousand shares3.24% (Shareholders: 59)
Other Corporations31,101 thousand shares12.01% (Shareholders: 344)
Individuals and Others60,887 thousand shares23.51% (Shareholders: 43,095)
Foreign Investors43,676 thousand shares16.86% (Shareholders: 536)

CASIO COMPUTER CO., LTD.6-2, Hon-machi 1-chome, Shibuya-ku, Tokyo 151-8543, Japanhttp://world.casio.com/


