Contents Nichirei Then and Now: Then · Message to Our Shareholders Nichirei Then and Now 01...
30
-
Upload
phungkhuong -
Category
Documents
-
view
221 -
download
0
Transcript of Contents Nichirei Then and Now: Then · Message to Our Shareholders Nichirei Then and Now 01...
Message to Our Shareholders 01Nichirei Then and Now
Contents
Nichirei Then and Now: Then
About Us Our Strategy Our Governance and Responsibilities Financial Section Data Section
About Us
01 Nichirei Then and Now04 Our Business Model06 Financial Highlights08 Our Objectives
Our Strategy
10 Message to Our Shareholders12 President’s Discussion18 Growth Strategies for Core Operations18 Processed Foods20 Logistics22 Marine Products, Meat and Poultry Products
Our Governance and Responsibilities
24 Corporate Governance28 Directors, Auditors and Officers30 Human Resource Initiatives31 Responsible Procurement32 Quality Control33 Concern for the Environment
Financial Section
34 Management’s Discussion and Analysis42 Consolidated Balance Sheets44 Consolidated Statements of Income /
Consolidated Statements of Comprehensive Income45 Consolidated Statements of Changes in Net Assets47 Consolidated Statements of Cash Flows48 Notes to Consolidated Financial Statements
Data Section56 Investor Information56 Overseas Network
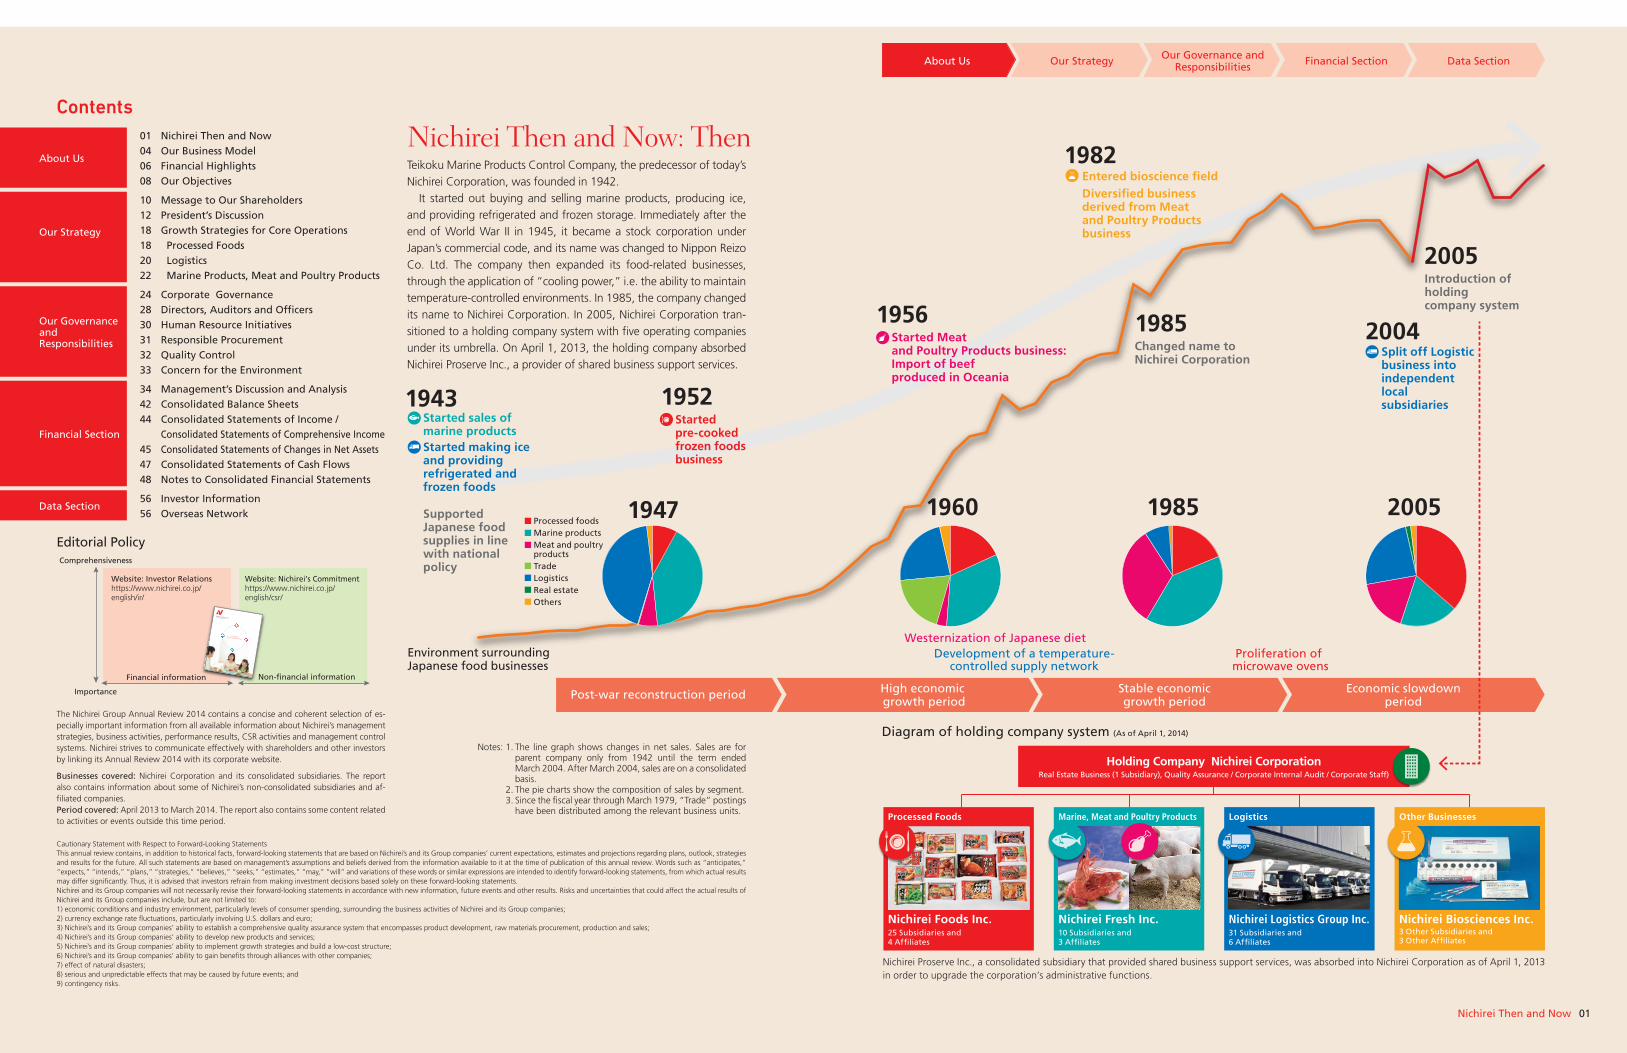
Teikoku Marine Products Control Company, the predecessor of today’s Nichirei Corporation, was founded in 1942. It started out buying and selling marine products, producing ice, and providing refrigerated and frozen storage. Immediately after the end of World War II in 1945, it became a stock corporation under Japan’s commercial code, and its name was changed to Nippon Reizo Co. Ltd. The company then expanded its food-related businesses, through the application of “cooling power,” i.e. the ability to maintain temperature-controlled environments. In 1985, the company changed its name to Nichirei Corporation. In 2005, Nichirei Corporation tran-sitioned to a holding company system with five operating companies under its umbrella. On April 1, 2013, the holding company absorbed Nichirei Proserve Inc., a provider of shared business support services.
The Nichirei Group Annual Review 2014 contains a concise and coherent selection of es-pecially important information from all available information about Nichirei’s management strategies, business activities, performance results, CSR activities and management control systems. Nichirei strives to communicate effectively with shareholders and other investors by linking its Annual Review 2014 with its corporate website.
Businesses covered: Nichirei Corporation and its consolidated subsidiaries. The report also contains information about some of Nichirei’s non-consolidated subsidiaries and af-filiated companies.Period covered: April 2013 to March 2014. The report also contains some content related to activities or events outside this time period.
Cautionary Statement with Respect to Forward-Looking StatementsThis annual review contains, in addition to historical facts, forward-looking statements that are based on Nichirei’s and its Group companies’ current expectations, estimates and projections regarding plans, outlook, strategies and results for the future. All such statements are based on management’s assumptions and beliefs derived from the information available to it at the time of publication of this annual review. Words such as “anticipates,” “expects,” “intends,” “plans,” “strategies,” “believes,” “seeks,” “estimates,” “may,” “will” and variations of these words or similar expressions are intended to identify forward-looking statements, from which actual results may differ significantly. Thus, it is advised that investors refrain from making investment decisions based solely on these forward-looking statements.Nichirei and its Group companies will not necessarily revise their forward-looking statements in accordance with new information, future events and other results. Risks and uncertainties that could affect the actual results of Nichirei and its Group companies include, but are not limited to:1) economic conditions and industry environment, particularly levels of consumer spending, surrounding the business activities of Nichirei and its Group companies;2) currency exchange rate fluctuations, particularly involving U.S. dollars and euro;3) Nichirei’s and its Group companies’ ability to establish a comprehensive quality assurance system that encompasses product development, raw materials procurement, production and sales;4) Nichirei’s and its Group companies’ ability to develop new products and services;5) Nichirei’s and its Group companies’ ability to implement growth strategies and build a low-cost structure;6) Nichirei’s and its Group companies’ ability to gain benefits through alliances with other companies;7) effect of natural disasters;8) serious and unpredictable effects that may be caused by future events; and9) contingency risks.
Comprehensiveness
Importance
Financial information
Website: Investor Relations https://www.nichirei.co.jp/english/ir/
Website: Nichirei’s Commitmenthttps://www.nichirei.co.jp/english/csr/
Non-�nancial information
ANNUAL REVIEW 2014Year Ended March 31, 2014
C r e a t i n gS a v o r y M o m e n t s
Nichirei Proserve Inc., a consolidated subsidiary that provided shared business support services, was absorbed into Nichirei Corporation as of April 1, 2013 in order to upgrade the corporation’s administrative functions.
Diagram of holding company system (As of April 1, 2014)
Holding Company Nichirei CorporationReal Estate Business (1 Subsidiary), Quality Assurance / Corporate Internal Audit / Corporate Staff)
Nichirei Foods Inc.25 Subsidiaries and4 Affiliates
Nichirei Fresh Inc.10 Subsidiaries and3 Affiliates
Nichirei Biosciences Inc.3 Other Subsidiaries and 3 Other Affiliates
Nichirei Logistics Group Inc.31 Subsidiaries and6 Affiliates
Processed Foods Logistics Other BusinessesMarine, Meat and Poultry Products
Environment surrounding Japanese food businesses
1947
1943Started sales of marine productsStarted making ice and providing refrigerated and frozen foods
1952Started pre-cooked frozen foods business
1956Started Meat and Poultry Products business: Import of beef produced in Oceania
1982Entered bioscience �eldDiversi�ed business derived from Meat and Poultry Products business
1985 2004
2005
Changed name to Nichirei Corporation
Introduction of holding company system
Split off Logistic business into independent local subsidiaries
Supported Japanese food supplies in line with national policy
1960 1985 2005Processed foodsMarine productsMeat and poultry productsTradeLogisticsReal estateOthers
Post-war reconstruction period Stable economic growth period
Economic slowdownperiod
High economic growth period
Westernization of Japanese dietProliferation of microwave ovens
Development of a temperature-controlled supply network
Notes: 1. The line graph shows changes in net sales. Sales are for parent company only from 1942 until the term ended March 2004. After March 2004, sales are on a consolidated basis.
2. The pie charts show the composition of sales by segment. 3. Since the fiscal year through March 1979, “Trade” postings
have been distributed among the relevant business units.
Editorial Policy
02 03Nichirei Then and NowNichirei Then and Now
About Us Our Strategy Our Governance and Responsibilities Financial Section Data Section
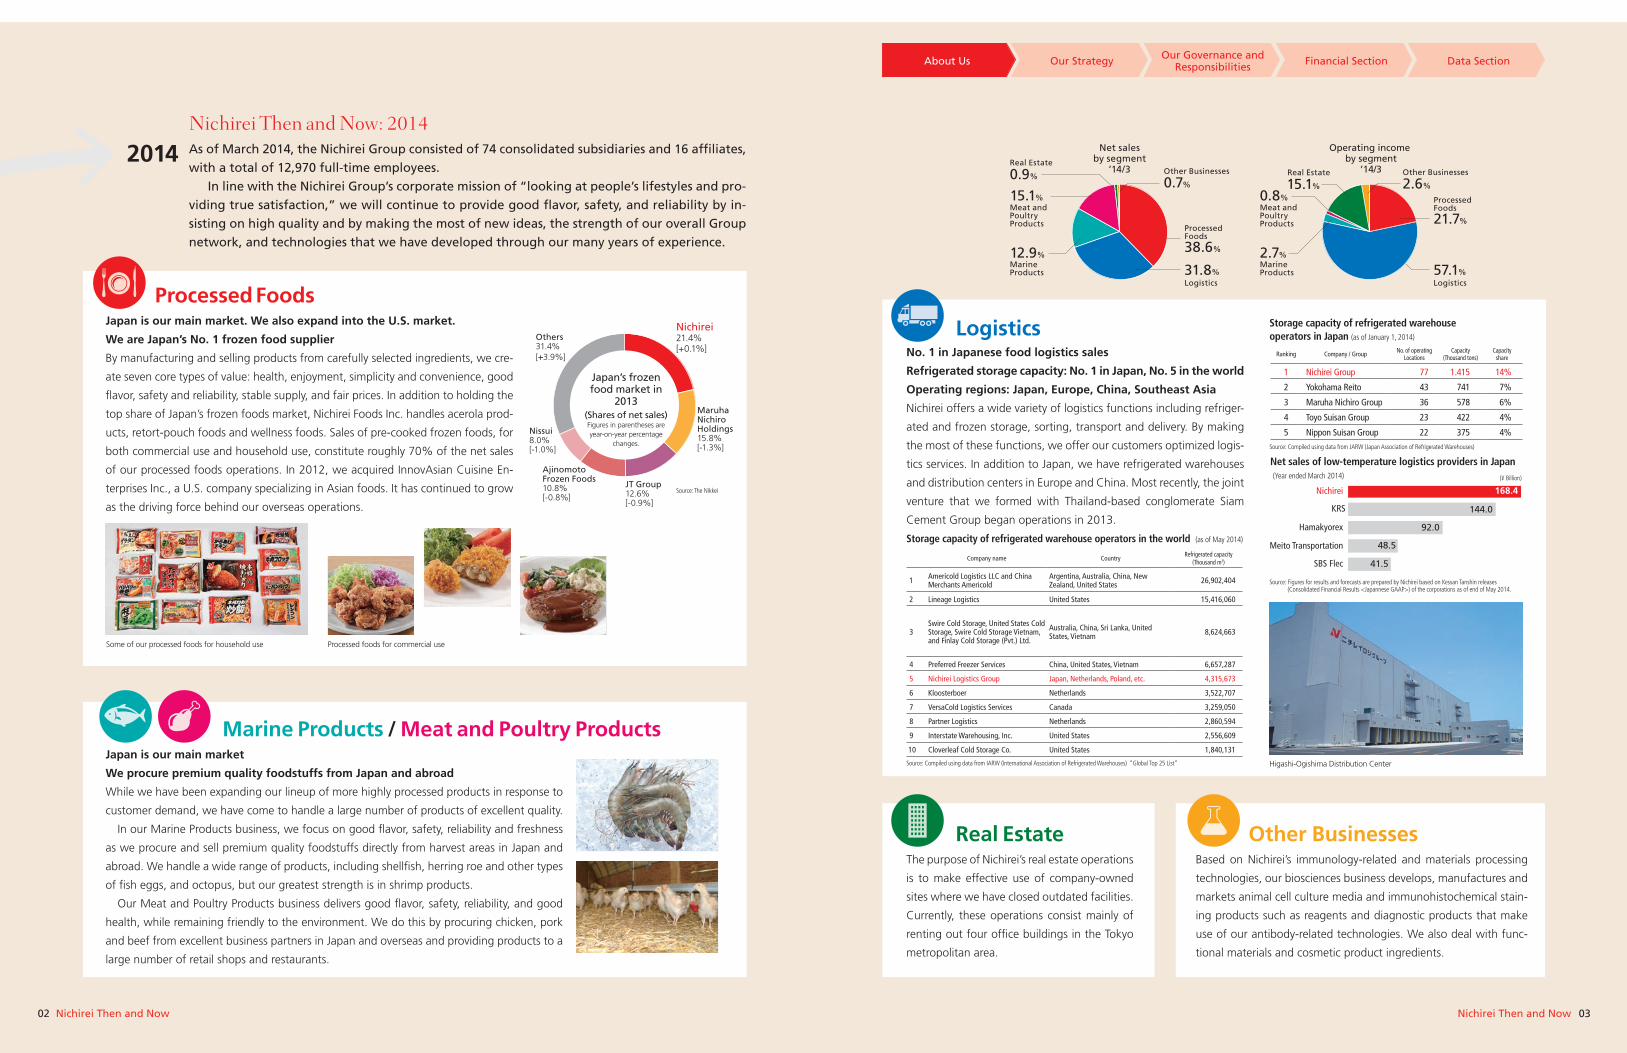
As of March 2014, the Nichirei Group consisted of 74 consolidated subsidiaries and 16 affiliates, with a total of 12,970 full-time employees. In line with the Nichirei Group’s corporate mission of “looking at people’s lifestyles and pro-viding true satisfaction,” we will continue to provide good flavor, safety, and reliability by in-sisting on high quality and by making the most of new ideas, the strength of our overall Group network, and technologies that we have developed through our many years of experience.
2014
Japan’s frozen food market in
2013 (Shares of net sales)Figures in parentheses are year-on-year percentage
changes.
Source: The Nikkei
Nichirei Then and Now: 2014
Nichirei21.4%[+0.1%]
MaruhaNichiroHoldings15.8%[-1.3%]
JT Group12.6%[-0.9%]
AjinomotoFrozen Foods10.8%[-0.8%]
Nissui8.0%[-1.0%]
Others31.4%[+3.9%]
Processed Foods
Logistics
Real Estate Other Businesses
Marine Products / Meat and Poultry Products
Japan is our main market. We also expand into the U.S. market.
We are Japan’s No. 1 frozen food supplier
By manufacturing and selling products from carefully selected ingredients, we cre-
ate seven core types of value: health, enjoyment, simplicity and convenience, good
flavor, safety and reliability, stable supply, and fair prices. In addition to holding the
top share of Japan’s frozen foods market, Nichirei Foods Inc. handles acerola prod-
ucts, retort-pouch foods and wellness foods. Sales of pre-cooked frozen foods, for
both commercial use and household use, constitute roughly 70% of the net sales
of our processed foods operations. In 2012, we acquired InnovAsian Cuisine En-
terprises Inc., a U.S. company specializing in Asian foods. It has continued to grow
as the driving force behind our overseas operations.
No. 1 in Japanese food logistics sales
Refrigerated storage capacity: No. 1 in Japan, No. 5 in the world
Operating regions: Japan, Europe, China, Southeast Asia
Nichirei offers a wide variety of logistics functions including refriger-
ated and frozen storage, sorting, transport and delivery. By making
the most of these functions, we offer our customers optimized logis-
tics services. In addition to Japan, we have refrigerated warehouses
and distribution centers in Europe and China. Most recently, the joint
venture that we formed with Thailand-based conglomerate Siam
Cement Group began operations in 2013.
The purpose of Nichirei’s real estate operations
is to make effective use of company-owned
sites where we have closed outdated facilities.
Currently, these operations consist mainly of
renting out four office buildings in the Tokyo
metropolitan area.
Based on Nichirei’s immunology-related and materials processing
technologies, our biosciences business develops, manufactures and
markets animal cell culture media and immunohistochemical stain-
ing products such as reagents and diagnostic products that make
use of our antibody-related technologies. We also deal with func-
tional materials and cosmetic product ingredients.
Japan is our main market
We procure premium quality foodstuffs from Japan and abroad
While we have been expanding our lineup of more highly processed products in response to
customer demand, we have come to handle a large number of products of excellent quality.
In our Marine Products business, we focus on good flavor, safety, reliability and freshness
as we procure and sell premium quality foodstuffs directly from harvest areas in Japan and
abroad. We handle a wide range of products, including shellfish, herring roe and other types
of fish eggs, and octopus, but our greatest strength is in shrimp products.
Our Meat and Poultry Products business delivers good flavor, safety, reliability, and good
health, while remaining friendly to the environment. We do this by procuring chicken, pork
and beef from excellent business partners in Japan and overseas and providing products to a
large number of retail shops and restaurants.
Storage capacity of refrigerated warehouse operators in Japan (as of January 1, 2014)
Ranking Company / Group No. of operating Locations
Capacity(Thousand tons)
Capacityshare
1 Nichirei Group 77 1.415 14%
2 Yokohama Reito 43 741 7%
3 Maruha Nichiro Group 36 578 6%
4 Toyo Suisan Group 23 422 4%
5 Nippon Suisan Group 22 375 4%Source: Compiled using data from JARW (Japan Association of Refrigerated Warehouses)
Source: Figures for results and forecasts are prepared by Nichirei based on Kessan Tanshin releases (Consolidated Financial Results <Japannese GAAP>) of the corporations as of end of May 2014.
Net sales of low-temperature logistics providers in Japan (Year ended March 2014)
Higashi-Ogishima Distribution Center
Some of our processed foods for household use Processed foods for commercial use
Storage capacity of refrigerated warehouse operators in the world (as of May 2014)
(¥ Billion)
Nichirei
KRS
Hamakyorex
Meito Transportation
SBS Flec
168.4
144.0
92.0
48.5
41.5
Processed Foods
Logistics
Marine Products
Other Businesses Real Estate
Meat and Poultry Products
38.6%
31.8%
12.9%
15.1%
0.9% 0.7%
Net salesby segment
’14/3
Operating income by segment
’14/3
Logistics57.1%
Processed Foods
Marine Products
Other Businesses Real Estate
Meat and Poultry Products 21.7%
2.7%
0.8%15.1% 2.6%
Company name CountryRefrigerated capacity
(Thousand m3)
1 Americold Logistics LLC and China Merchants Americold
Argentina, Australia, China, New Zealand, United States 26,902,404
2 Lineage Logistics United States 15,416,060
3Swire Cold Storage, United States Cold Storage, Swire Cold Storage Vietnam, and Finlay Cold Storage (Pvt.) Ltd.
Australia, China, Sri Lanka, United States, Vietnam 8,624,663
4 Preferred Freezer Services China, United States, Vietnam 6,657,287
5 Nichirei Logistics Group Japan, Netherlands, Poland, etc. 4,315,673
6 Kloosterboer Netherlands 3,522,707
7 VersaCold Logistics Services Canada 3,259,050
8 Partner Logistics Netherlands 2,860,594
9 Interstate Warehousing, Inc. United States 2,556,609
10 Cloverleaf Cold Storage Co. United States 1,840,131
Source: Compiled using data from IARW (International Association of Refrigerated Warehouses) “Global Top 25 List”
04 05
Production locations Consumption locations
Processed FoodsMarine, Meat and Poultry Products
Logistics business
ConsumersProducersFood manufacturers
Food wholesalers
Restaurant industry
Retail stores
Coolingpower
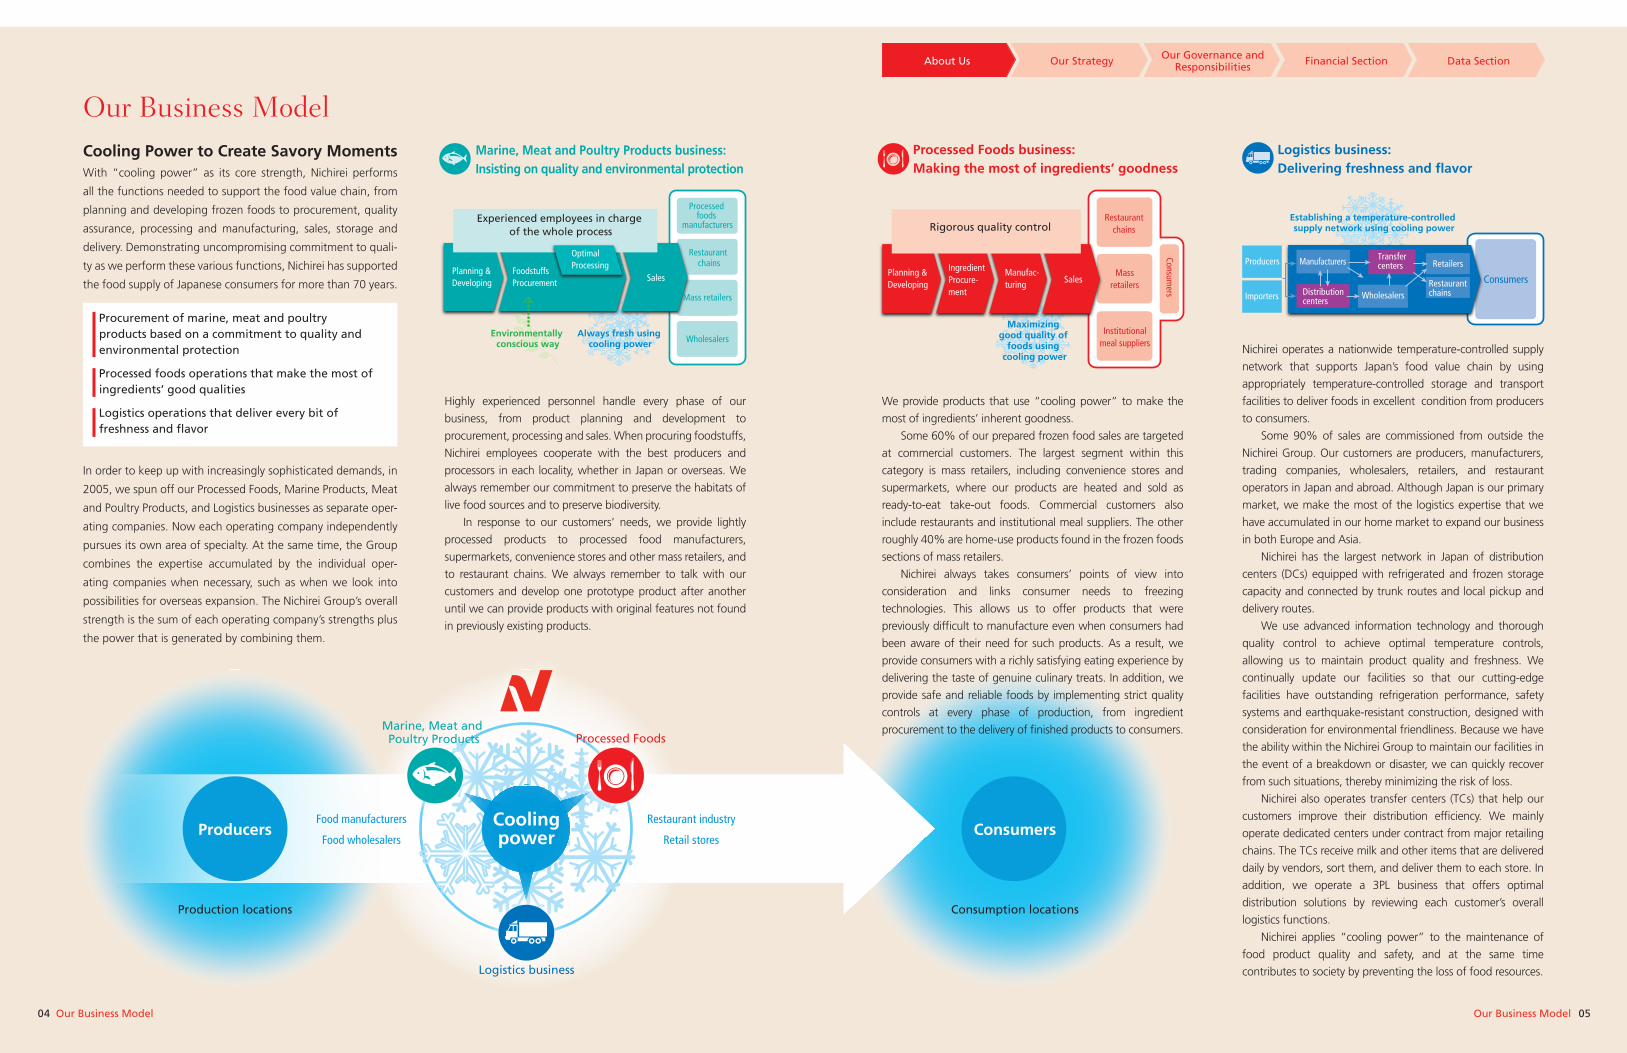
Our Business ModelOur Business Model
About Us Our Strategy Our Governance and Responsibilities Financial Section Data Section
Cooling Power to Create Savory MomentsWith “cooling power” as its core strength, Nichirei performs
all the functions needed to support the food value chain, from
planning and developing frozen foods to procurement, quality
assurance, processing and manufacturing, sales, storage and
delivery. Demonstrating uncompromising commitment to quali-
ty as we perform these various functions, Nichirei has supported
the food supply of Japanese consumers for more than 70 years.
In order to keep up with increasingly sophisticated demands, in
2005, we spun off our Processed Foods, Marine Products, Meat
and Poultry Products, and Logistics businesses as separate oper-
ating companies. Now each operating company independently
pursues its own area of specialty. At the same time, the Group
combines the expertise accumulated by the individual oper-
ating companies when necessary, such as when we look into
possibilities for overseas expansion. The Nichirei Group’s overall
strength is the sum of each operating company’s strengths plus
the power that is generated by combining them.
Marine, Meat and Poultry Products business: Insisting on quality and environmental protection
Highly experienced personnel handle every phase of our
business, from product planning and development to
procurement, processing and sales. When procuring foodstuffs,
Nichirei employees cooperate with the best producers and
processors in each locality, whether in Japan or overseas. We
always remember our commitment to preserve the habitats of
live food sources and to preserve biodiversity.
In response to our customers’ needs, we provide lightly
processed products to processed food manufacturers,
supermarkets, convenience stores and other mass retailers, and
to restaurant chains. We always remember to talk with our
customers and develop one prototype product after another
until we can provide products with original features not found
in previously existing products.
Processed Foods business: Making the most of ingredients’ goodness
We provide products that use “cooling power” to make the
most of ingredients’ inherent goodness.
Some 60% of our prepared frozen food sales are targeted
at commercial customers. The largest segment within this
category is mass retailers, including convenience stores and
supermarkets, where our products are heated and sold as
ready-to-eat take-out foods. Commercial customers also
include restaurants and institutional meal suppliers. The other
roughly 40% are home-use products found in the frozen foods
sections of mass retailers.
Nichirei always takes consumers’ points of view into
consideration and links consumer needs to freezing
technologies. This allows us to offer products that were
previously difficult to manufacture even when consumers had
been aware of their need for such products. As a result, we
provide consumers with a richly satisfying eating experience by
delivering the taste of genuine culinary treats. In addition, we
provide safe and reliable foods by implementing strict quality
controls at every phase of production, from ingredient
procurement to the delivery of finished products to consumers.
Logistics business: Delivering freshness and flavor
Nichirei operates a nationwide temperature-controlled supply
network that supports Japan’s food value chain by using
appropriately temperature-controlled storage and transport
facilities to deliver foods in excellent condition from producers
to consumers.
Some 90% of sales are commissioned from outside the
Nichirei Group. Our customers are producers, manufacturers,
trading companies, wholesalers, retailers, and restaurant
operators in Japan and abroad. Although Japan is our primary
market, we make the most of the logistics expertise that we
have accumulated in our home market to expand our business
in both Europe and Asia.
Nichirei has the largest network in Japan of distribution
centers (DCs) equipped with refrigerated and frozen storage
capacity and connected by trunk routes and local pickup and
delivery routes.
We use advanced information technology and thorough
quality control to achieve optimal temperature controls,
allowing us to maintain product quality and freshness. We
continually update our facilities so that our cutting-edge
facilities have outstanding refrigeration performance, safety
systems and earthquake-resistant construction, designed with
consideration for environmental friendliness. Because we have
the ability within the Nichirei Group to maintain our facilities in
the event of a breakdown or disaster, we can quickly recover
from such situations, thereby minimizing the risk of loss.
Nichirei also operates transfer centers (TCs) that help our
customers improve their distribution efficiency. We mainly
operate dedicated centers under contract from major retailing
chains. The TCs receive milk and other items that are delivered
daily by vendors, sort them, and deliver them to each store. In
addition, we operate a 3PL business that offers optimal
distribution solutions by reviewing each customer’s overall
logistics functions.
Nichirei applies “cooling power” to the maintenance of
food product quality and safety, and at the same time
contributes to society by preventing the loss of food resources.
Environmentally conscious way
Always fresh using cooling power
Planning &Developing
FoodstuffsProcurement Sales
Processed foods
manufacturers
Restaurant chains
Mass retailers
Wholesalers
Experienced employees in charge of the whole process
OptimalProcessing
Maximizing good quality of
foods using cooling power
Planning &Developing
IngredientProcure-ment
Manufac-turing Sales
Consumers
Restaurantchains
Institutionalmeal suppliers
Massretailers
Rigorous quality controlEstablishing a temperature-controlled supply network using cooling power
Consumers
Producers
Importers
Transfercenters Retailers
WholesalersDistributioncenters
Restaurantchains
Manufacturers
Procurement of marine, meat and poultry products based on a commitment to quality and environmental protection
Processed foods operations that make the most of ingredients’ good qualities
Logistics operations that deliver every bit of freshness and flavor
Our Business Model
06 07Financial HighlightsFinancial Highlights
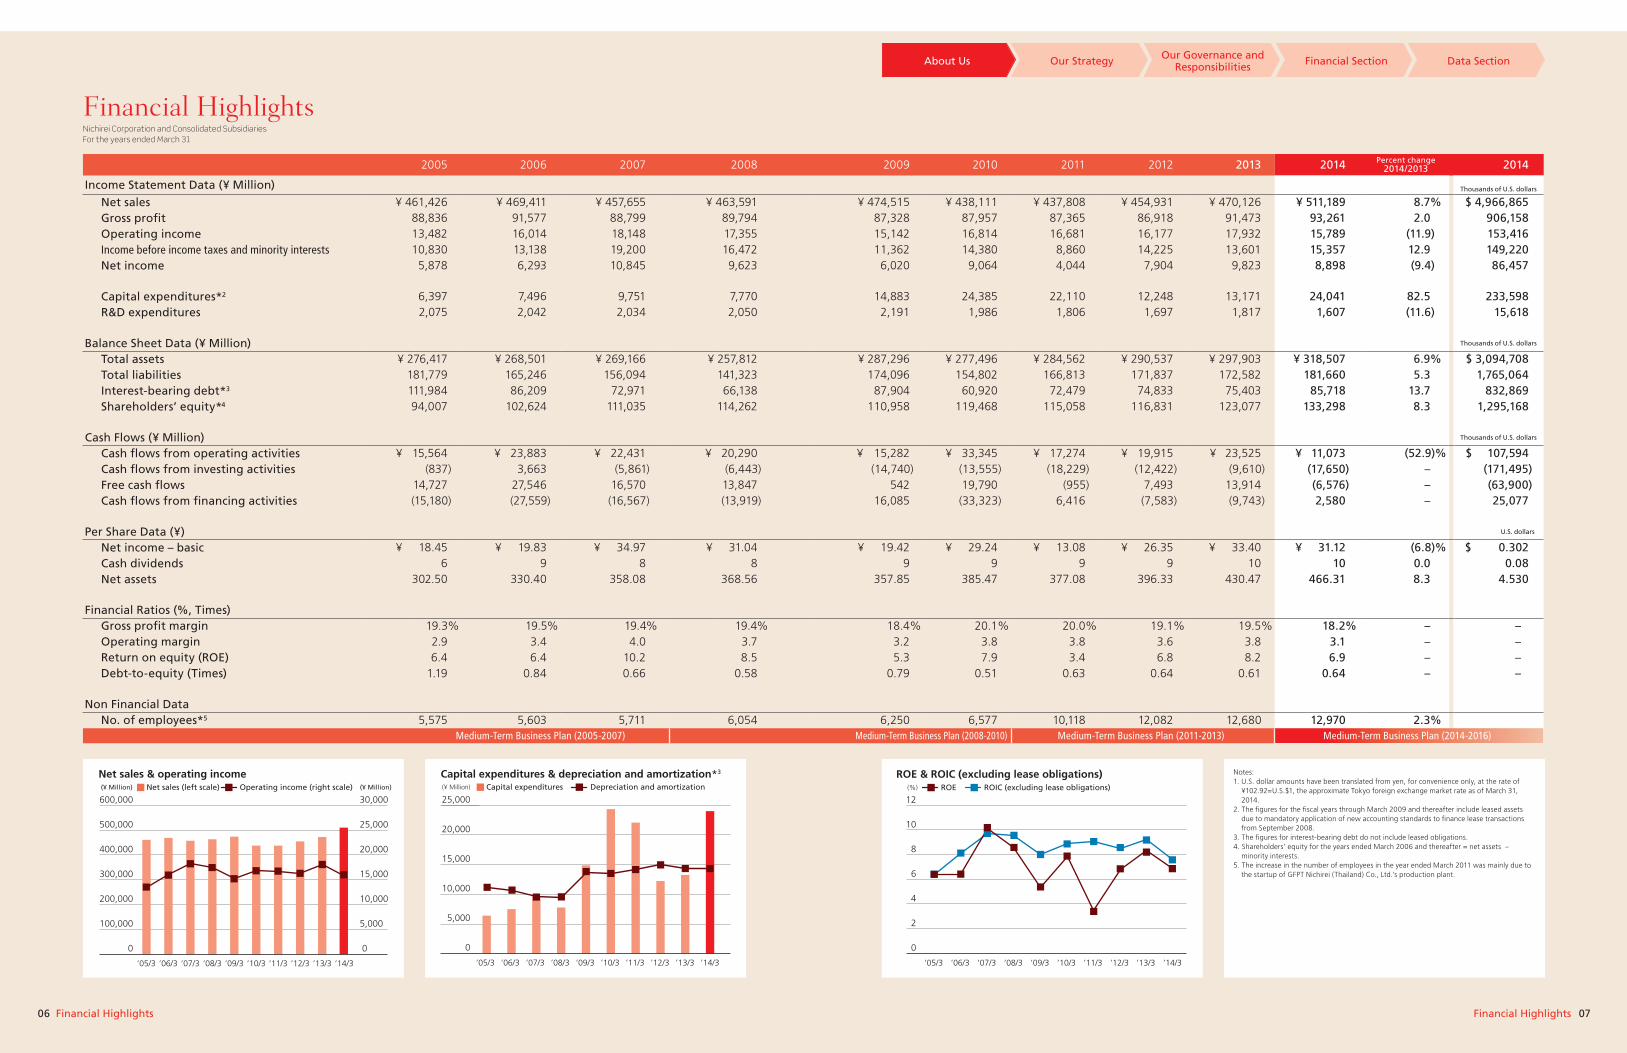
Nichirei Corporation and Consolidated Subsidiaries For the years ended March 31
2005 2006 2007 2008 2009 2010 2011 2012 2013 2014 Percent change2014/2013 2014
Income Statement Data (¥ Million) Thousands of U.S. dollars
Net sales ¥ 461,426 ¥ 469,411 ¥ 457,655 ¥ 463,591 ¥ 474,515 ¥ 438,111 ¥ 437,808 ¥ 454,931 ¥ 470,126 ¥ 511,189 8.7% $ 4,966,865 Gross profit 88,836 91,577 88,799 89,794 87,328 87,957 87,365 86,918 91,473 93,261 2.0 906,158 Operating income 13,482 16,014 18,148 17,355 15,142 16,814 16,681 16,177 17,932 15,789 (11.9) 153,416 Income before income taxes and minority interests 10,830 13,138 19,200 16,472 11,362 14,380 8,860 14,225 13,601 15,357 12.9 149,220 Net income 5,878 6,293 10,845 9,623 6,020 9,064 4,044 7,904 9,823 8,898 (9.4) 86,457
Capital expenditures*2 6,397 7,496 9,751 7,770 14,883 24,385 22,110 12,248 13,171 24,041 82.5 233,598 R&D expenditures 2,075 2,042 2,034 2,050 2,191 1,986 1,806 1,697 1,817 1,607 (11.6) 15,618
Balance Sheet Data (¥ Million) Thousands of U.S. dollars
Total assets ¥ 276,417 ¥ 268,501 ¥ 269,166 ¥ 257,812 ¥ 287,296 ¥ 277,496 ¥ 284,562 ¥ 290,537 ¥ 297,903 ¥ 318,507 6.9% $ 3,094,708 Total liabilities 181,779 165,246 156,094 141,323 174,096 154,802 166,813 171,837 172,582 181,660 5.3 1,765,064 Interest-bearing debt*3 111,984 86,209 72,971 66,138 87,904 60,920 72,479 74,833 75,403 85,718 13.7 832,869 Shareholders’ equity*4 94,007 102,624 111,035 114,262 110,958 119,468 115,058 116,831 123,077 133,298 8.3 1,295,168
Cash Flows (¥ Million) Thousands of U.S. dollars
Cash flows from operating activities ¥ 15,564 ¥ 23,883 ¥ 22,431 ¥ 20,290 ¥ 15,282 ¥ 33,345 ¥ 17,274 ¥ 19,915 ¥ 23,525 ¥ 11,073 (52.9)% $ 107,594 Cash flows from investing activities (837) 3,663 (5,861) (6,443) (14,740) (13,555) (18,229) (12,422) (9,610) (17,650) – (171,495) Free cash flows 14,727 27,546 16,570 13,847 542 19,790 (955) 7,493 13,914 (6,576) – (63,900) Cash flows from financing activities (15,180) (27,559) (16,567) (13,919) 16,085 (33,323) 6,416 (7,583) (9,743) 2,580 – 25,077
Per Share Data (¥) U.S. dollars
Net income – basic ¥ 18.45 ¥ 19.83 ¥ 34.97 ¥ 31.04 ¥ 19.42 ¥ 29.24 ¥ 13.08 ¥ 26.35 ¥ 33.40 ¥ 31.12 (6.8)% $ 0.302 Cash dividends 6 9 8 8 9 9 9 9 10 10 0.0 0.08 Net assets 302.50 330.40 358.08 368.56 357.85 385.47 377.08 396.33 430.47 466.31 8.3 4.530
Financial Ratios (%, Times) Gross profit margin 19.3% 19.5% 19.4% 19.4% 18.4% 20.1% 20.0% 19.1% 19.5% 18.2% – – Operating margin 2.9 3.4 4.0 3.7 3.2 3.8 3.8 3.6 3.8 3.1 – – Return on equity (ROE) 6.4 6.4 10.2 8.5 5.3 7.9 3.4 6.8 8.2 6.9 – – Debt-to-equity (Times) 1.19 0.84 0.66 0.58 0.79 0.51 0.63 0.64 0.61 0.64 – –
Non Financial Data No. of employees*5 5,575 5,603 5,711 6,054 6,250 6,577 10,118 12,082 12,680 12,970 2.3%
Medium-Term Business Plan (2005-2007) Medium-Term Business Plan (2008-2010) Medium-Term Business Plan (2011-2013) Medium-Term Business Plan (2014-2016)
Financial Highlights
About Us Our Strategy Our Governance and Responsibilities Financial Section Data Section
(¥ Million) (¥ Million)Net sales (left scale) Operating income (right scale)
0
100,000
200,000
300,000
400,000
500,000
600,000
0
5,000
10,000
15,000
20,000
25,000
30,000
’05/3 ’06/3 ’07/3 ’08/3 ’09/3 ’10/3 ’11/3 ’12/3 ’13/3 ’14/3
Net sales & operating income (¥ Million)
0
5,000
10,000
15,000
20,000
25,000
’05/3 ’06/3 ’07/3 ’08/3 ’09/3 ’10/3 ’11/3 ’12/3 ’13/3 ’14/3
Capital expenditures & depreciation and amortization*3
Capital expenditures Depreciation and amortization (%)
0
2
4
6
8
10
12
’05/3 ’06/3 ’07/3 ’08/3 ’09/3 ’10/3 ’11/3 ’12/3 ’13/3 ’14/3
ROE & ROIC (excluding lease obligations)ROE ROIC (excluding lease obligations)
Notes:1. U.S. dollar amounts have been translated from yen, for convenience only, at the rate of
¥102.92=U.S.$1, the approximate Tokyo foreign exchange market rate as of March 31, 2014.
2. The figures for the fiscal years through March 2009 and thereafter include leased assets due to mandatory application of new accounting standards to finance lease transactions from September 2008.
3. The figures for interest-bearing debt do not include leased obligations.4. Shareholders’ equity for the years ended March 2006 and thereafter = net assets –
minority interests.5. The increase in the number of employees in the year ended March 2011 was mainly due to
the startup of GFPT Nichirei (Thailand) Co., Ltd.’s production plant.
08 09Our ObjectivesOur Objectives
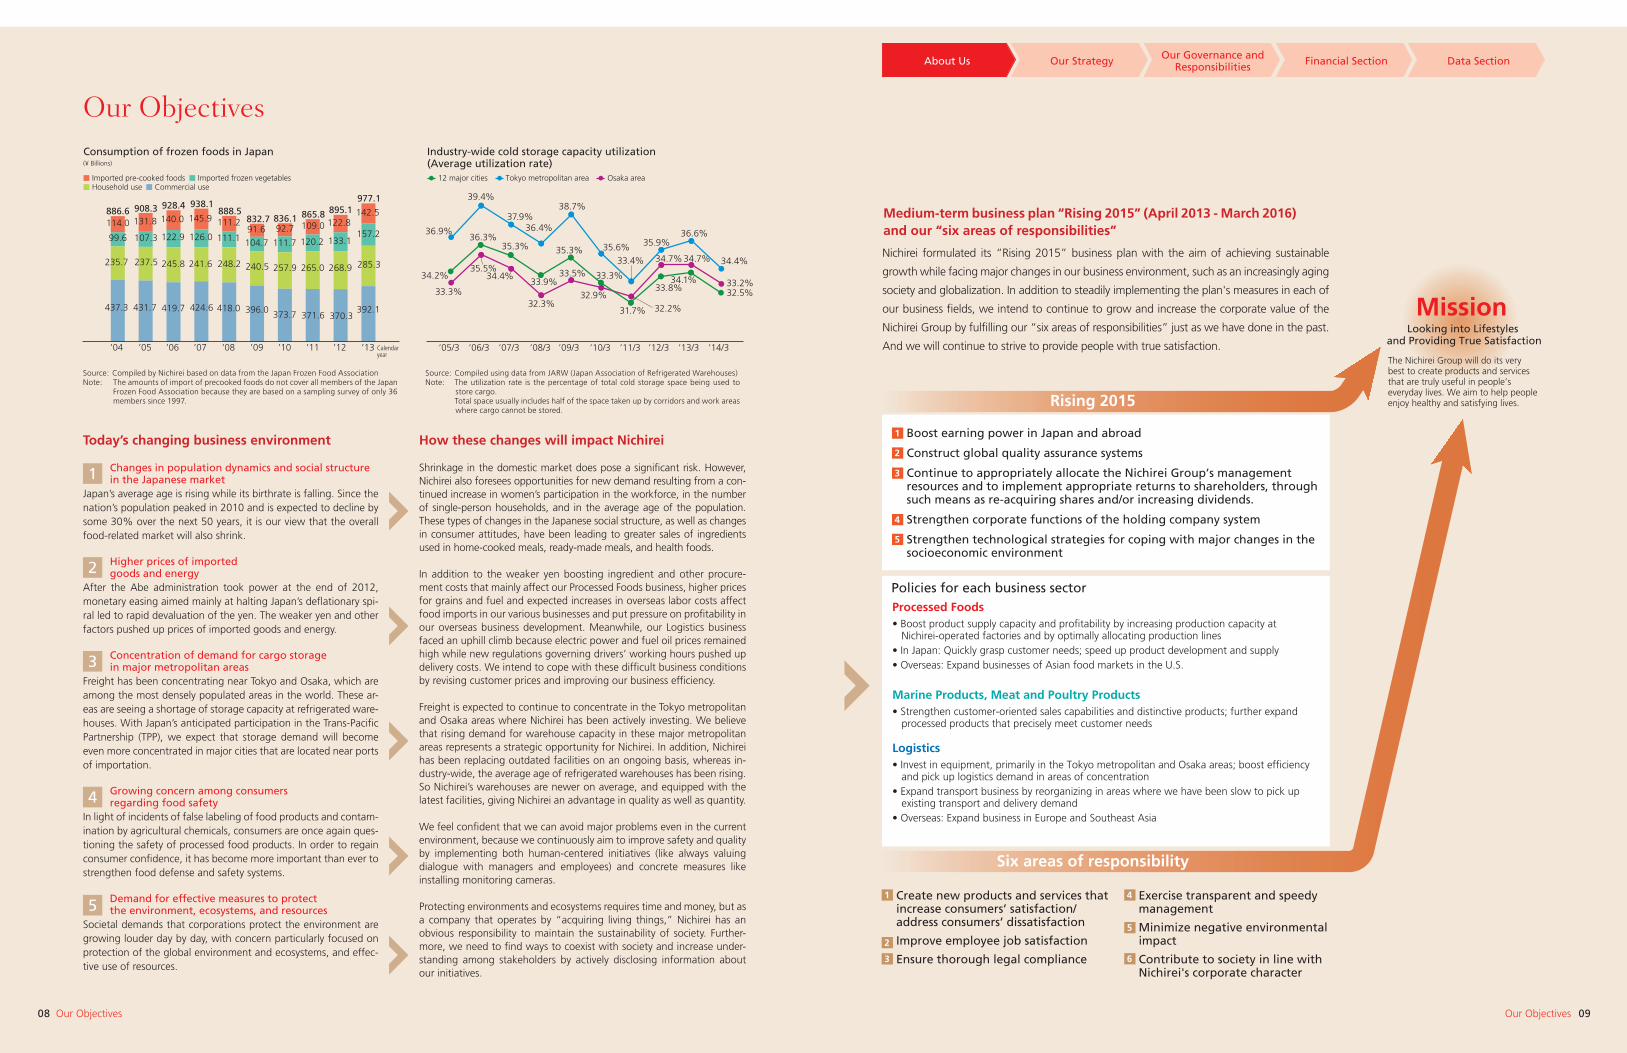
Changes in population dynamics and social structure in the Japanese market
Japan’s average age is rising while its birthrate is falling. Since the nation’s population peaked in 2010 and is expected to decline by some 30% over the next 50 years, it is our view that the overall food-related market will also shrink.
Higher prices of imported goods and energy
After the Abe administration took power at the end of 2012, monetary easing aimed mainly at halting Japan’s deflationary spi-ral led to rapid devaluation of the yen. The weaker yen and other factors pushed up prices of imported goods and energy.
Concentration of demand for cargo storage in major metropolitan areas
Freight has been concentrating near Tokyo and Osaka, which are among the most densely populated areas in the world. These ar-eas are seeing a shortage of storage capacity at refrigerated ware-houses. With Japan’s anticipated participation in the Trans-Pacific Partnership (TPP), we expect that storage demand will become even more concentrated in major cities that are located near ports of importation.
Growing concern among consumers regarding food safety
In light of incidents of false labeling of food products and contam-ination by agricultural chemicals, consumers are once again ques-tioning the safety of processed food products. In order to regain consumer confidence, it has become more important than ever to strengthen food defense and safety systems.
Demand for effective measures to protect the environment, ecosystems, and resources
Societal demands that corporations protect the environment are growing louder day by day, with concern particularly focused on protection of the global environment and ecosystems, and effec-tive use of resources.
Shrinkage in the domestic market does pose a significant risk. However, Nichirei also foresees opportunities for new demand resulting from a con-tinued increase in women’s participation in the workforce, in the number of single-person households, and in the average age of the population. These types of changes in the Japanese social structure, as well as changes in consumer attitudes, have been leading to greater sales of ingredients used in home-cooked meals, ready-made meals, and health foods.
In addition to the weaker yen boosting ingredient and other procure-ment costs that mainly affect our Processed Foods business, higher prices for grains and fuel and expected increases in overseas labor costs affect food imports in our various businesses and put pressure on profitability in our overseas business development. Meanwhile, our Logistics business faced an uphill climb because electric power and fuel oil prices remained high while new regulations governing drivers’ working hours pushed up delivery costs. We intend to cope with these difficult business conditions by revising customer prices and improving our business efficiency.
Freight is expected to continue to concentrate in the Tokyo metropolitan and Osaka areas where Nichirei has been actively investing. We believe that rising demand for warehouse capacity in these major metropolitan areas represents a strategic opportunity for Nichirei. In addition, Nichirei has been replacing outdated facilities on an ongoing basis, whereas in-dustry-wide, the average age of refrigerated warehouses has been rising. So Nichirei’s warehouses are newer on average, and equipped with the latest facilities, giving Nichirei an advantage in quality as well as quantity.
We feel confident that we can avoid major problems even in the current environment, because we continuously aim to improve safety and quality by implementing both human-centered initiatives (like always valuing dialogue with managers and employees) and concrete measures like installing monitoring cameras.
Protecting environments and ecosystems requires time and money, but as a company that operates by “acquiring living things,” Nichirei has an obvious responsibility to maintain the sustainability of society. Further-more, we need to find ways to coexist with society and increase under-standing among stakeholders by actively disclosing information about our initiatives.
Nichirei formulated its “Rising 2015” business plan with the aim of achieving sustainable
growth while facing major changes in our business environment, such as an increasingly aging
society and globalization. In addition to steadily implementing the plan's measures in each of
our business fields, we intend to continue to grow and increase the corporate value of the
Nichirei Group by fulfilling our “six areas of responsibilities” just as we have done in the past.
And we will continue to strive to provide people with true satisfaction.
1
2
3
4
5
Today’s changing business environment How these changes will impact Nichirei
Medium-term business plan “Rising 2015” (April 2013 - March 2016)and our “six areas of responsibilities”
’04
437.3
235.7
99.6
114.0886.6
Consumption of frozen foods in Japan Industry-wide cold storage capacity utilization (Average utilization rate)
Imported pre-cooked foods
908.3 928.4 938.1888.5
832.7 836.1 865.8 895.1977.1
131.8 140.0 145.9 111.291.6 92.7 109.0 122.8
142.5
107.3 122.9 126.0 111.1 104.7 111.7 120.2 133.1157.2
237.5 245.8 241.6 248.2 240.5 257.9 265.0 268.9 285.3
431.7 419.7 424.6 418.0 396.0 373.7 371.6 370.3392.1
’05 ’06 ’07 ’08 ’09 ’10 ’11 ’12 ’13 ’05/3 ’06/3 ’07/3 ’08/3 ’09/3 ’10/3 ’11/3 ’12/3 ’13/3 ’14/3
36.9%
34.2%
33.3%
36.3%
35.5%
35.3%
34.4%
32.3%
33.9%
35.3%
33.5%
32.9%
33.3%
39.4%
37.9%36.4%
38.7%
35.6%33.4% 34.7%
33.8%34.1% 33.2%
32.5%
34.7%
31.7% 32.2%
35.9%36.6%
34.4%
Imported frozen vegetables 12 major cities Tokyo metropolitan area Osaka areaHousehold use Commercial use
(¥ Billions)
Calendaryear
Mission
Rising 2015
Six areas of responsibility
Looking into Lifestyles and Providing True Satisfaction
The Nichirei Group will do its very best to create products and services that are truly useful in people’s everyday lives. We aim to help people enjoy healthy and satisfying lives.
Create new products and services that increase consumers’ satisfaction/ address consumers’ dissatisfaction
Improve employee job satisfaction
Ensure thorough legal compliance
Exercise transparent and speedy management
Minimize negative environmental impact
Contribute to society in line with Nichirei's corporate character
1
1
2
3
4
5
4
5
6
2
3
Boost earning power in Japan and abroad
Construct global quality assurance systems
Continue to appropriately allocate the Nichirei Group’s management resources and to implement appropriate returns to shareholders, through such means as re-acquiring shares and/or increasing dividends.
Strengthen corporate functions of the holding company system
Strengthen technological strategies for coping with major changes in the socioeconomic environment
Policies for each business sector Processed Foods• Boost product supply capacity and pro�tability by increasing production capacity at
Nichirei-operated factories and by optimally allocating production lines• In Japan: Quickly grasp customer needs; speed up product development and supply• Overseas: Expand businesses of Asian food markets in the U.S.
Marine Products, Meat and Poultry Products• Strengthen customer-oriented sales capabilities and distinctive products; further expand
processed products that precisely meet customer needs
Logistics • Invest in equipment, primarily in the Tokyo metropolitan and Osaka areas; boost ef�ciency
and pick up logistics demand in areas of concentration• Expand transport business by reorganizing in areas where we have been slow to pick up
existing transport and delivery demand• Overseas: Expand business in Europe and Southeast Asia
About Us Our Strategy Our Governance and Responsibilities Financial Section Data Section
Our Objectives
Source: Compiled by Nichirei based on data from the Japan Frozen Food Association Note: The amounts of import of precooked foods do not cover all members of the Japan
Frozen Food Association because they are based on a sampling survey of only 36 members since 1997.
Source: Compiled using data from JARW (Japan Association of Refrigerated Warehouses)Note: The utilization rate is the percentage of total cold storage space being used to
store cargo. Total space usually includes half of the space taken up by corridors and work areas
where cargo cannot be stored.
About Us Our Strategy Our Governance and Responsibilities Financial Section Data Section
1110 Message to Our ShareholdersMessage to Our Shareholders
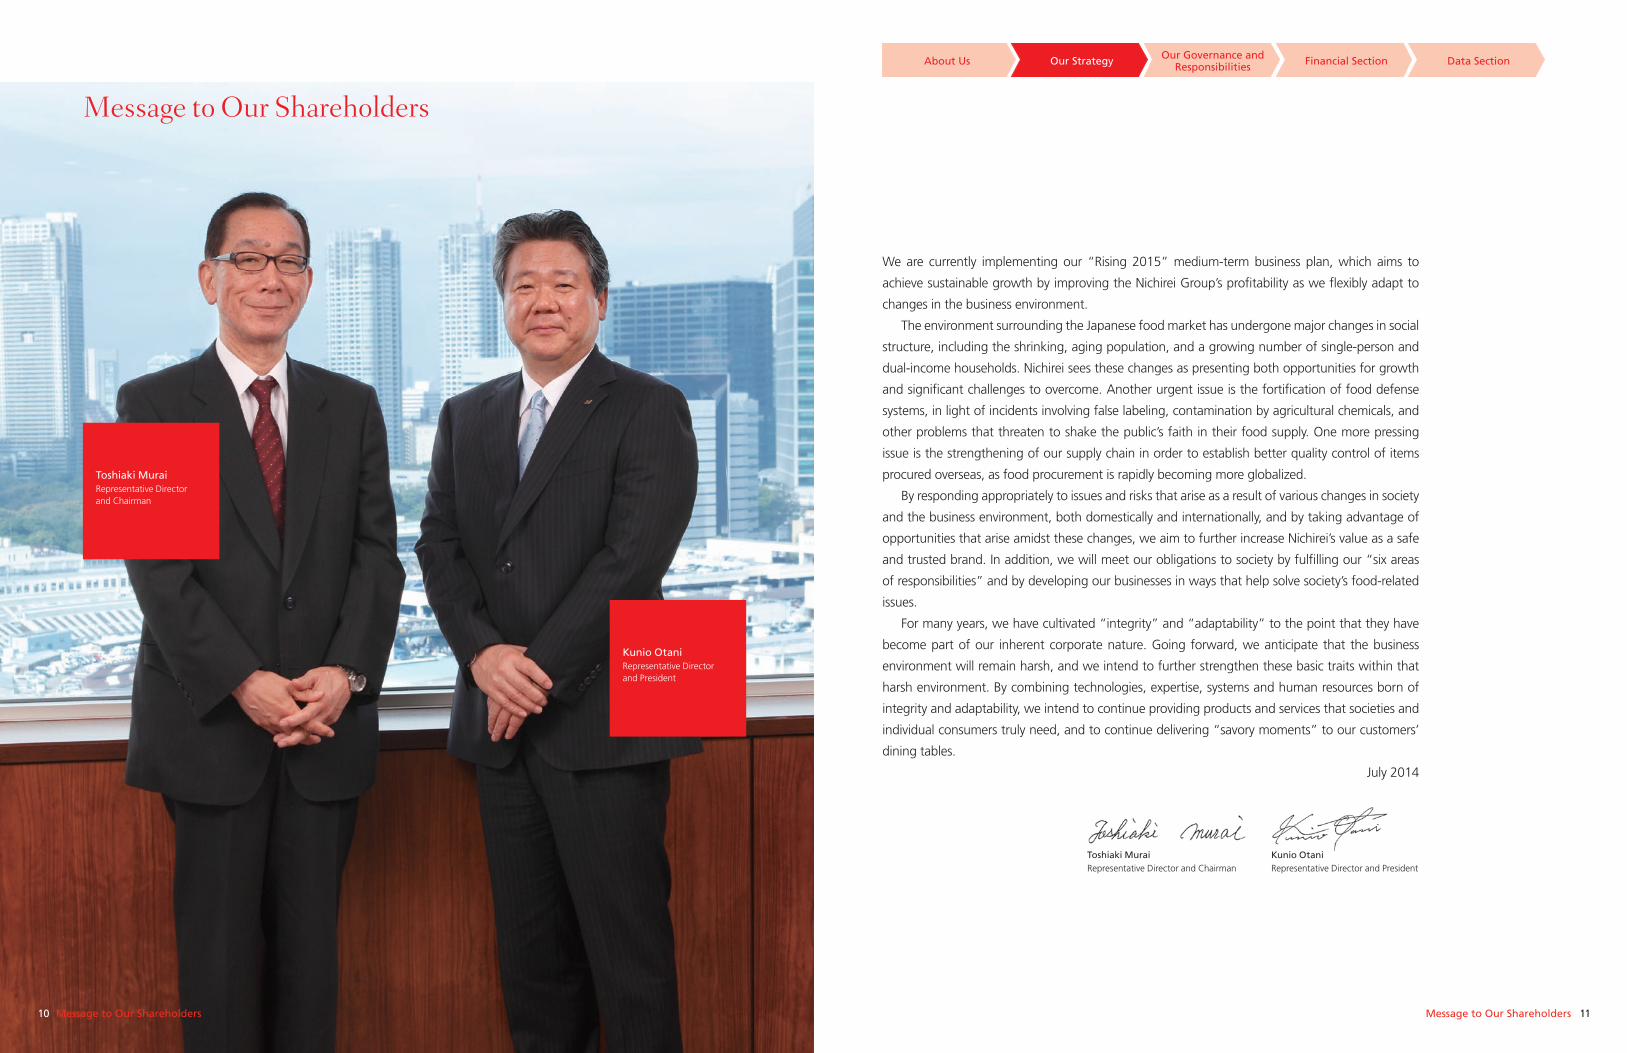
Toshiaki MuraiRepresentative Directorand Chairman
Kunio OtaniRepresentative Director and President
We are currently implementing our “Rising 2015” medium-term business plan, which aims to
achieve sustainable growth by improving the Nichirei Group’s profitability as we flexibly adapt to
changes in the business environment.
The environment surrounding the Japanese food market has undergone major changes in social
structure, including the shrinking, aging population, and a growing number of single-person and
dual-income households. Nichirei sees these changes as presenting both opportunities for growth
and significant challenges to overcome. Another urgent issue is the fortification of food defense
systems, in light of incidents involving false labeling, contamination by agricultural chemicals, and
other problems that threaten to shake the public’s faith in their food supply. One more pressing
issue is the strengthening of our supply chain in order to establish better quality control of items
procured overseas, as food procurement is rapidly becoming more globalized.
By responding appropriately to issues and risks that arise as a result of various changes in society
and the business environment, both domestically and internationally, and by taking advantage of
opportunities that arise amidst these changes, we aim to further increase Nichirei’s value as a safe
and trusted brand. In addition, we will meet our obligations to society by fulfilling our “six areas
of responsibilities” and by developing our businesses in ways that help solve society’s food-related
issues.
For many years, we have cultivated “integrity” and “adaptability” to the point that they have
become part of our inherent corporate nature. Going forward, we anticipate that the business
environment will remain harsh, and we intend to further strengthen these basic traits within that
harsh environment. By combining technologies, expertise, systems and human resources born of
integrity and adaptability, we intend to continue providing products and services that societies and
individual consumers truly need, and to continue delivering “savory moments” to our customers’
dining tables.
July 2014
Toshiaki MuraiRepresentative Director and Chairman
Kunio OtaniRepresentative Director and President
Message to Our Shareholders
About Us Our Strategy Our Governance and Responsibilities Financial Section Data Section
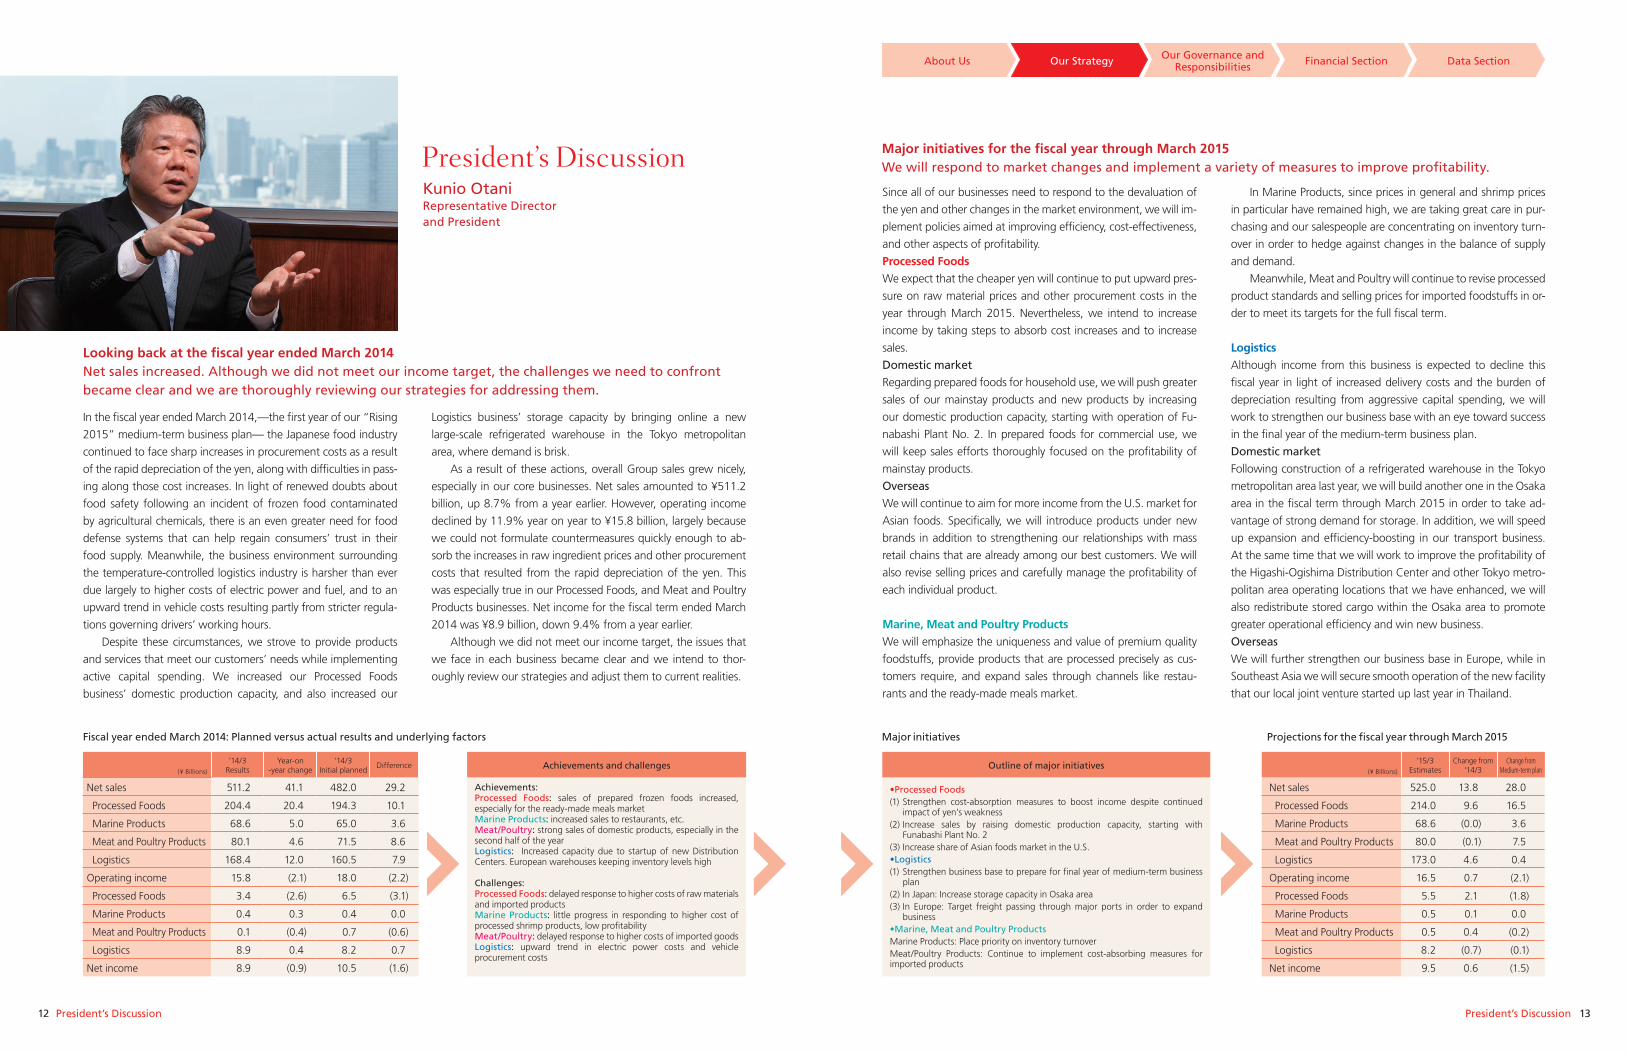
12 13President’s DiscussionPresident’s Discussion
Looking back at the fiscal year ended March 2014Net sales increased. Although we did not meet our income target, the challenges we need to confront became clear and we are thoroughly reviewing our strategies for addressing them.
Major initiatives for the fiscal year through March 2015We will respond to market changes and implement a variety of measures to improve profitability.
In the fiscal year ended March 2014,—the first year of our “Rising
2015” medium-term business plan— the Japanese food industry
continued to face sharp increases in procurement costs as a result
of the rapid depreciation of the yen, along with difficulties in pass-
ing along those cost increases. In light of renewed doubts about
food safety following an incident of frozen food contaminated
by agricultural chemicals, there is an even greater need for food
defense systems that can help regain consumers’ trust in their
food supply. Meanwhile, the business environment surrounding
the temperature-controlled logistics industry is harsher than ever
due largely to higher costs of electric power and fuel, and to an
upward trend in vehicle costs resulting partly from stricter regula-
tions governing drivers’ working hours.
Despite these circumstances, we strove to provide products
and services that meet our customers’ needs while implementing
active capital spending. We increased our Processed Foods
business’ domestic production capacity, and also increased our
Logistics business’ storage capacity by bringing online a new
large-scale refrigerated warehouse in the Tokyo metropolitan
area, where demand is brisk.
As a result of these actions, overall Group sales grew nicely,
especially in our core businesses. Net sales amounted to ¥511.2
billion, up 8.7% from a year earlier. However, operating income
declined by 11.9% year on year to ¥15.8 billion, largely because
we could not formulate countermeasures quickly enough to ab-
sorb the increases in raw ingredient prices and other procurement
costs that resulted from the rapid depreciation of the yen. This
was especially true in our Processed Foods, and Meat and Poultry
Products businesses. Net income for the fiscal term ended March
2014 was ¥8.9 billion, down 9.4% from a year earlier.
Although we did not meet our income target, the issues that
we face in each business became clear and we intend to thor-
oughly review our strategies and adjust them to current realities.
Since all of our businesses need to respond to the devaluation of
the yen and other changes in the market environment, we will im-
plement policies aimed at improving efficiency, cost-effectiveness,
and other aspects of profitability.
Processed FoodsWe expect that the cheaper yen will continue to put upward pres-
sure on raw material prices and other procurement costs in the
year through March 2015. Nevertheless, we intend to increase
income by taking steps to absorb cost increases and to increase
sales.
Domestic marketRegarding prepared foods for household use, we will push greater
sales of our mainstay products and new products by increasing
our domestic production capacity, starting with operation of Fu-
nabashi Plant No. 2. In prepared foods for commercial use, we
will keep sales efforts thoroughly focused on the profitability of
mainstay products.
OverseasWe will continue to aim for more income from the U.S. market for
Asian foods. Specifically, we will introduce products under new
brands in addition to strengthening our relationships with mass
retail chains that are already among our best customers. We will
also revise selling prices and carefully manage the profitability of
each individual product.
Marine, Meat and Poultry ProductsWe will emphasize the uniqueness and value of premium quality
foodstuffs, provide products that are processed precisely as cus-
tomers require, and expand sales through channels like restau-
rants and the ready-made meals market.
In Marine Products, since prices in general and shrimp prices
in particular have remained high, we are taking great care in pur-
chasing and our salespeople are concentrating on inventory turn-
over in order to hedge against changes in the balance of supply
and demand.
Meanwhile, Meat and Poultry will continue to revise processed
product standards and selling prices for imported foodstuffs in or-
der to meet its targets for the full fiscal term.
LogisticsAlthough income from this business is expected to decline this
fiscal year in light of increased delivery costs and the burden of
depreciation resulting from aggressive capital spending, we will
work to strengthen our business base with an eye toward success
in the final year of the medium-term business plan.
Domestic marketFollowing construction of a refrigerated warehouse in the Tokyo
metropolitan area last year, we will build another one in the Osaka
area in the fiscal term through March 2015 in order to take ad-
vantage of strong demand for storage. In addition, we will speed
up expansion and efficiency-boosting in our transport business.
At the same time that we will work to improve the profitability of
the Higashi-Ogishima Distribution Center and other Tokyo metro-
politan area operating locations that we have enhanced, we will
also redistribute stored cargo within the Osaka area to promote
greater operational efficiency and win new business.
OverseasWe will further strengthen our business base in Europe, while in
Southeast Asia we will secure smooth operation of the new facility
that our local joint venture started up last year in Thailand.
Fiscal year ended March 2014: Planned versus actual results and underlying factors Projections for the fiscal year through March 2015 Major initiatives
(¥ Billions)
‘14/3Results
Year-on-year change
‘14/3Initial planned
Difference
Net sales 511.2 41.1 482.0 29.2
Processed Foods 204.4 20.4 194.3 10.1
Marine Products 68.6 5.0 65.0 3.6
Meat and Poultry Products 80.1 4.6 71.5 8.6
Logistics 168.4 12.0 160.5 7.9
Operating income 15.8 (2.1) 18.0 (2.2)
Processed Foods 3.4 (2.6) 6.5 (3.1)
Marine Products 0.4 0.3 0.4 0.0
Meat and Poultry Products 0.1 (0.4) 0.7 (0.6)
Logistics 8.9 0.4 8.2 0.7
Net income 8.9 (0.9) 10.5 (1.6)
Achievements and challenges
Achievements:Processed Foods: sales of prepared frozen foods increased, especially for the ready-made meals market Marine Products: increased sales to restaurants, etc. Meat/Poultry: strong sales of domestic products, especially in the second half of the yearLogistics: Increased capacity due to startup of new Distribution Centers. European warehouses keeping inventory levels high
Challenges: Processed Foods: delayed response to higher costs of raw materials and imported products Marine Products: little progress in responding to higher cost of processed shrimp products, low profitability Meat/Poultry: delayed response to higher costs of imported goods Logistics: upward trend in electric power costs and vehicle procurement costs
Outline of major initiatives
•Processed Foods (1) Strengthen cost-absorption measures to boost income despite continued
impact of yen’s weakness (2) Increase sales by raising domestic production capacity, starting with
Funabashi Plant No. 2 (3) Increase share of Asian foods market in the U.S.•Logistics (1) Strengthen business base to prepare for final year of medium-term business
plan(2) In Japan: Increase storage capacity in Osaka area(3) In Europe: Target freight passing through major ports in order to expand
business•Marine, Meat and Poultry Products Marine Products: Place priority on inventory turnoverMeat/Poultry Products: Continue to implement cost-absorbing measures for imported products
(¥ Billions)
‘15/3Estimates
Change from ‘14/3
Change from Medium-term plan
Net sales 525.0 13.8 28.0
Processed Foods 214.0 9.6 16.5
Marine Products 68.6 (0.0) 3.6
Meat and Poultry Products 80.0 (0.1) 7.5
Logistics 173.0 4.6 0.4
Operating income 16.5 0.7 (2.1)
Processed Foods 5.5 2.1 (1.8)
Marine Products 0.5 0.1 0.0
Meat and Poultry Products 0.5 0.4 (0.2)
Logistics 8.2 (0.7) (0.1)
Net income 9.5 0.6 (1.5)
President’s DiscussionKunio OtaniRepresentative Director and President
About Us Our Strategy Our Governance and Responsibilities Financial Section Data Section
14 15President’s DiscussionPresident’s Discussion
President’s Discussion
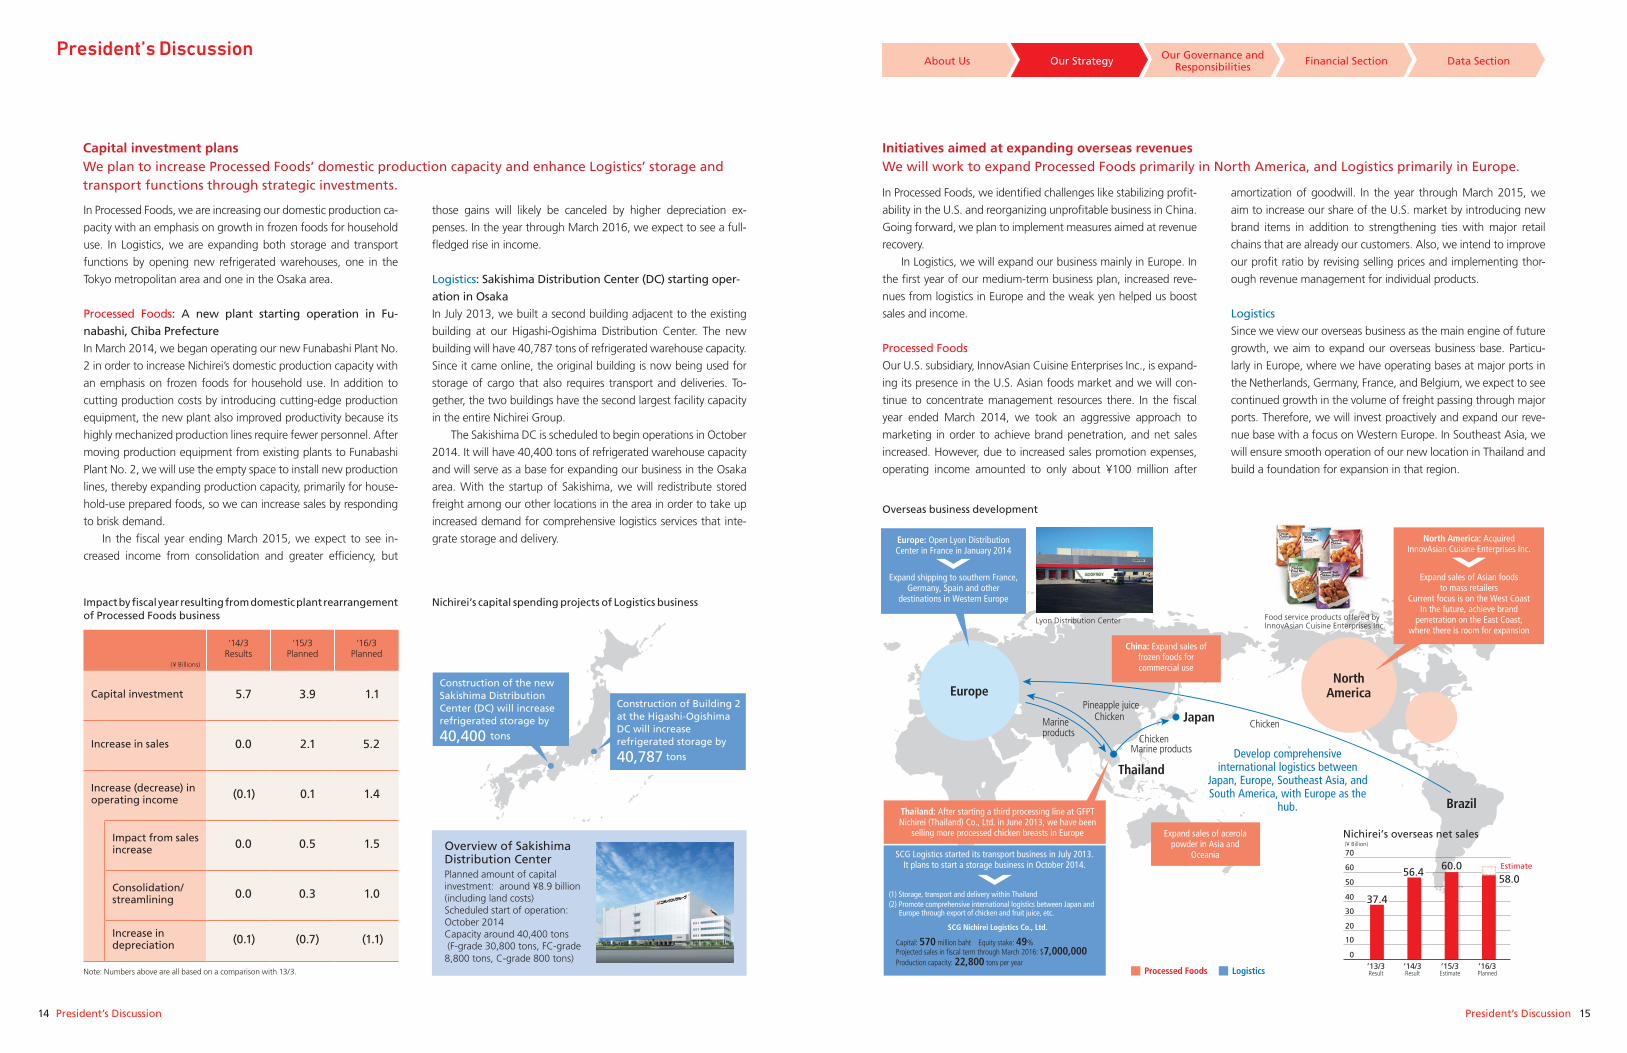
Capital investment plansWe plan to increase Processed Foods’ domestic production capacity and enhance Logistics’ storage and transport functions through strategic investments.
Initiatives aimed at expanding overseas revenuesWe will work to expand Processed Foods primarily in North America, and Logistics primarily in Europe.
In Processed Foods, we are increasing our domestic production ca-
pacity with an emphasis on growth in frozen foods for household
use. In Logistics, we are expanding both storage and transport
functions by opening new refrigerated warehouses, one in the
Tokyo metropolitan area and one in the Osaka area.
Processed Foods: A new plant starting operation in Fu-nabashi, Chiba PrefectureIn March 2014, we began operating our new Funabashi Plant No.
2 in order to increase Nichirei’s domestic production capacity with
an emphasis on frozen foods for household use. In addition to
cutting production costs by introducing cutting-edge production
equipment, the new plant also improved productivity because its
highly mechanized production lines require fewer personnel. After
moving production equipment from existing plants to Funabashi
Plant No. 2, we will use the empty space to install new production
lines, thereby expanding production capacity, primarily for house-
hold-use prepared foods, so we can increase sales by responding
to brisk demand.
In the fiscal year ending March 2015, we expect to see in-
creased income from consolidation and greater efficiency, but
those gains will likely be canceled by higher depreciation ex-
penses. In the year through March 2016, we expect to see a full-
fledged rise in income.
Logistics: Sakishima Distribution Center (DC) starting oper-ation in OsakaIn July 2013, we built a second building adjacent to the existing
building at our Higashi-Ogishima Distribution Center. The new
building will have 40,787 tons of refrigerated warehouse capacity.
Since it came online, the original building is now being used for
storage of cargo that also requires transport and deliveries. To-
gether, the two buildings have the second largest facility capacity
in the entire Nichirei Group.
The Sakishima DC is scheduled to begin operations in October
2014. It will have 40,400 tons of refrigerated warehouse capacity
and will serve as a base for expanding our business in the Osaka
area. With the startup of Sakishima, we will redistribute stored
freight among our other locations in the area in order to take up
increased demand for comprehensive logistics services that inte-
grate storage and delivery.
In Processed Foods, we identified challenges like stabilizing profit-
ability in the U.S. and reorganizing unprofitable business in China.
Going forward, we plan to implement measures aimed at revenue
recovery.
In Logistics, we will expand our business mainly in Europe. In
the first year of our medium-term business plan, increased reve-
nues from logistics in Europe and the weak yen helped us boost
sales and income.
Processed FoodsOur U.S. subsidiary, InnovAsian Cuisine Enterprises Inc., is expand-
ing its presence in the U.S. Asian foods market and we will con-
tinue to concentrate management resources there. In the fiscal
year ended March 2014, we took an aggressive approach to
marketing in order to achieve brand penetration, and net sales
increased. However, due to increased sales promotion expenses,
operating income amounted to only about ¥100 million after
amortization of goodwill. In the year through March 2015, we
aim to increase our share of the U.S. market by introducing new
brand items in addition to strengthening ties with major retail
chains that are already our customers. Also, we intend to improve
our profit ratio by revising selling prices and implementing thor-
ough revenue management for individual products.
LogisticsSince we view our overseas business as the main engine of future
growth, we aim to expand our overseas business base. Particu-
larly in Europe, where we have operating bases at major ports in
the Netherlands, Germany, France, and Belgium, we expect to see
continued growth in the volume of freight passing through major
ports. Therefore, we will invest proactively and expand our reve-
nue base with a focus on Western Europe. In Southeast Asia, we
will ensure smooth operation of our new location in Thailand and
build a foundation for expansion in that region.
Impact by fiscal year resulting from domestic plant rearrangementof Processed Foods business
Nichirei’s capital spending projects of Logistics business
Overseas business development
Europe
Japan
Thailand
Brazil
NorthAmerica
Pineapple juice
Marine products
Marine products
ChickenChicken
ChickenDevelop comprehensive
international logistics between Japan, Europe, Southeast Asia, and South America, with Europe as the
hub.
’14/3Result
’13/3Result
’15/3Estimate
’16/3Planned
(¥ Billion)
0
20
50
40
60
70
10
30
Nichirei’s overseas net sales
56.460.0
58.0Estimate
37.4
Europe: Open Lyon Distribution Center in France in January 2014
China: Expand sales of frozen foods for commercial use
Thailand: After starting a third processing line at GFPT Nichirei (Thailand) Co., Ltd. in June 2013, we have been
selling more processed chicken breasts in Europe Expand sales of acerola powder in Asia and
Oceania
Expand shipping to southern France, Germany, Spain and other
destinations in Western Europe
North America: Acquired InnovAsian Cuisine Enterprises Inc.
Expand sales of Asian foods to mass retailers
Current focus is on the West CoastIn the future, achieve brand
penetration on the East Coast, where there is room for expansion
SCG Logistics started its transport business in July 2013. It plans to start a storage business in October 2014.
(1) Storage, transport and delivery within Thailand(2) Promote comprehensive international logistics between Japan and
Europe through export of chicken and fruit juice, etc.
SCG Nichirei Logistics Co., Ltd.
Capital: 570 million baht Equity stake: 49%Projected sales in �scal term through March 2016: $7,000,000Production capacity: 22,800 tons per year
Processed Foods Logistics
Construction of Building 2 at the Higashi-Ogishima DC will increase refrigerated storage by
40,787 tons
Construction of the new Sakishima Distribution Center (DC) will increase refrigerated storage by
40,400 tons
Overview of Sakishima Distribution Center Planned amount of capital investment: around ¥8.9 billion (including land costs) Scheduled start of operation: October 2014 Capacity around 40,400 tons (F-grade 30,800 tons, FC-grade 8,800 tons, C-grade 800 tons)
‘14/3Results
‘15/3Planned
‘16/3Planned
Capital investment 5.7 3.9 1.1
Increase in sales 0.0 2.1 5.2
Increase (decrease) in operating income (0.1) 0.1 1.4
Impact from sales increase 0.0 0.5 1.5
Consolidation/streamlining 0.0 0.3 1.0
Increase in depreciation (0.1) (0.7) (1.1)
(¥ Billions)
Note: Numbers above are all based on a comparison with 13/3.
Lyon Distribution Center Food service products offered by InnovAsian Cuisine Enterprises Inc.
About Us Our Strategy Our Governance and Responsibilities Financial Section Data Section
16 17President’s DiscussionPresident’s Discussion
President’s Discussion
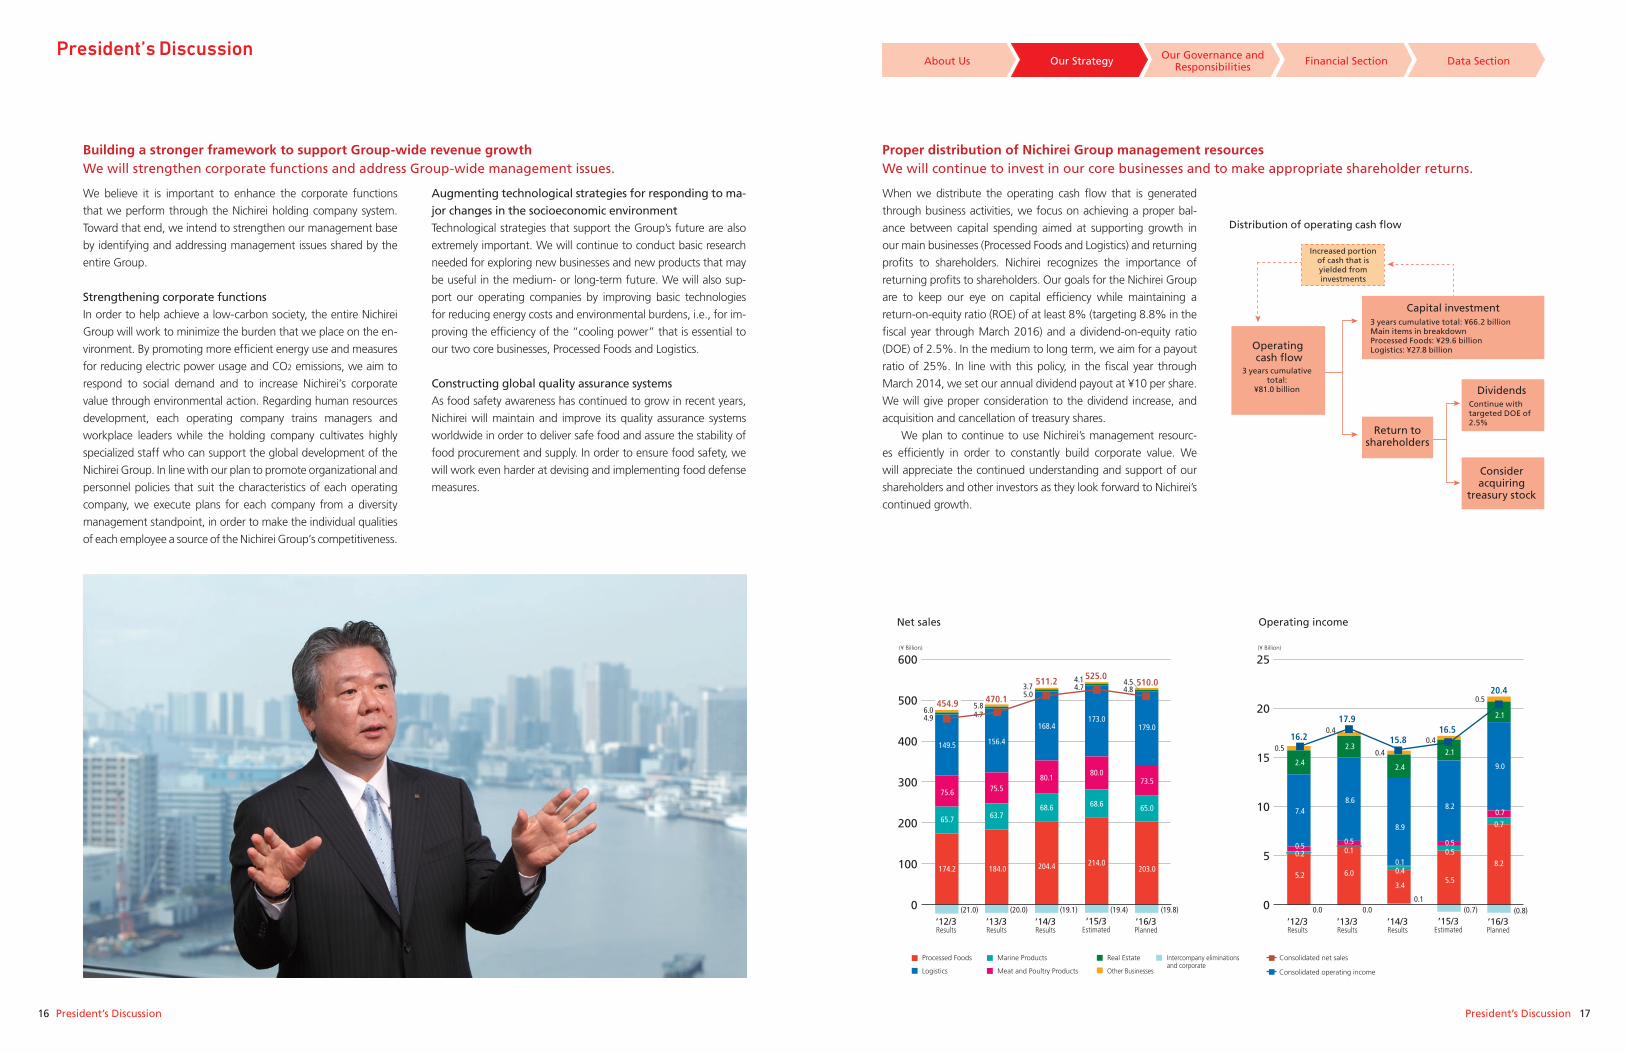
Building a stronger framework to support Group-wide revenue growthWe will strengthen corporate functions and address Group-wide management issues.
We believe it is important to enhance the corporate functions
that we perform through the Nichirei holding company system.
Toward that end, we intend to strengthen our management base
by identifying and addressing management issues shared by the
entire Group.
Strengthening corporate functionsIn order to help achieve a low-carbon society, the entire Nichirei
Group will work to minimize the burden that we place on the en-
vironment. By promoting more efficient energy use and measures
for reducing electric power usage and CO2 emissions, we aim to
respond to social demand and to increase Nichirei’s corporate
value through environmental action. Regarding human resources
development, each operating company trains managers and
workplace leaders while the holding company cultivates highly
specialized staff who can support the global development of the
Nichirei Group. In line with our plan to promote organizational and
personnel policies that suit the characteristics of each operating
company, we execute plans for each company from a diversity
management standpoint, in order to make the individual qualities
of each employee a source of the Nichirei Group’s competitiveness.
Augmenting technological strategies for responding to ma-jor changes in the socioeconomic environment Technological strategies that support the Group’s future are also
extremely important. We will continue to conduct basic research
needed for exploring new businesses and new products that may
be useful in the medium- or long-term future. We will also sup-
port our operating companies by improving basic technologies
for reducing energy costs and environmental burdens, i.e., for im-
proving the efficiency of the “cooling power” that is essential to
our two core businesses, Processed Foods and Logistics.
Constructing global quality assurance systemsAs food safety awareness has continued to grow in recent years,
Nichirei will maintain and improve its quality assurance systems
worldwide in order to deliver safe food and assure the stability of
food procurement and supply. In order to ensure food safety, we
will work even harder at devising and implementing food defense
measures.
Proper distribution of Nichirei Group management resourcesWe will continue to invest in our core businesses and to make appropriate shareholder returns.
When we distribute the operating cash flow that is generated
through business activities, we focus on achieving a proper bal-
ance between capital spending aimed at supporting growth in
our main businesses (Processed Foods and Logistics) and returning
profits to shareholders. Nichirei recognizes the importance of
returning profits to shareholders. Our goals for the Nichirei Group
are to keep our eye on capital efficiency while maintaining a
return-on-equity ratio (ROE) of at least 8% (targeting 8.8% in the
fiscal year through March 2016) and a dividend-on-equity ratio
(DOE) of 2.5%. In the medium to long term, we aim for a payout
ratio of 25%. In line with this policy, in the fiscal year through
March 2014, we set our annual dividend payout at ¥10 per share.
We will give proper consideration to the dividend increase, and
acquisition and cancellation of treasury shares.
We plan to continue to use Nichirei’s management resourc-
es efficiently in order to constantly build corporate value. We
will appreciate the continued understanding and support of our
shareholders and other investors as they look forward to Nichirei’s
continued growth.
0
100
200
300
400
500
600
0
5
10
15
20
25
Logistics Meat and Poultry Products
Marine Products Real Estate
Other Businesses
Processed Foods
Consolidated operating income
Consolidated net salesIntercompany eliminations and corporate
’13/3Results
’12/3Results
’14/3Results
’16/3Planned
’15/3Estimated
(¥ Billion) (¥ Billion)
Net sales Operating income
184.0174.2
65.7
75.6
149.5
6.0 5.2
0.20.5
7.4
2.4
0.5
0.1
8.6
2.3
0.4
0.4
0.4
0.5
3.4
0.40.1
8.9
2.4
5.5
0.50.5
8.2
2.1
8.2
0.7
0.7
9.0
2.1
63.7
75.5
156.4
204.4
68.6
80.1
168.4
214.0
68.6
80.0
173.0
203.0
65.0
73.5
179.0
5.8
(20.0)(21.0) (19.1) (19.4) (19.8) (0.7)0.00.00.1
(0.8)
3.74.1 4.5
470.1454.9
511.2 525.0510.0
17.9
16.2 15.8
4.74.96.0
5.04.7 4.8
’13/3Results
’12/3Results
’14/3Results
’16/3Planned
’15/3Estimated
16.5
20.4
0.5
Distribution of operating cash flow
Operating cash �ow
Capital investment
Return toshareholders
Dividends
Consideracquiring
treasury stock
Increased portion of cash that is yielded from investments
3 years cumulative total:
¥81.0 billion
3 years cumulative total: ¥66.2 billionMain items in breakdownProcessed Foods: ¥29.6 billionLogistics: ¥27.8 billion
Continue withtargeted DOE of2.5%
About Us Our Strategy Our Governance and Responsibilities Financial Section Data Section
18 19Growth Strategies for Core OperationsGrowth Strategies for Core Operations
Because we expect that procurement prices of raw and other
materials will rise in the fiscal year through March 2015, mainly due
to the weak yen, we will continue to take steps to absorb those
additional costs. Specifically, we will work to improve profitability
mainly by changing specifications for imported products, which are
more affected by currency fluctuations.
Domestic business
We will strengthen our production capacity in Japan. In March
2014, we began operating a second frozen foods plant in
Funabashi, Chiba Prefecture. We introduced cutting-edge
production equipment to promote cost-cutting and greater
production efficiency. Now that we have begun operating
Funabashi Plant No. 2, which can produce 9,000 tons per year,
we are moving some of the production equipment from existing
plants into the new plant. At the existing plants, we will install
new production lines in the resulting freed space. We plan to
expand sales of our mainstay products and new products in order
to meet brisk domestic demand, mainly for prepared foods for
household use.
Overseas business
In the U.S., we expect demand to continue to grow as Asian
foods are becoming more popular among the general public,
rather than remaining a niche market targeted at wealthy, health-
conscious people. We plan to strengthen relations with the mass
retailing chains that are the best customers of InnovAsian Cuisine
Enterprises Inc., the consolidated subsidiary we acquired in June
2012, and to introduce products under a new brand to increase
our share of the still rapidly growing Asian foods market. In order
to improve profitability, we will revise selling prices and implement
thorough profitability management of individual products.
Meanwhile, we began full-fledged operation of a third
processing line at GFPT Nichirei (Thailand) Co., Ltd. in June 2013.
We plan to continue to strengthen sales of processed chicken
breasts from this factory in Europe, where they have been selling
well. At the same time, we plan to further reduce costs by
mechanizing more production processes.
Addressing issues affecting global societyThe social contribution of our mainstay chicken products businessAs the world’s population grows, the risk of future food shortages
also grows. At the same time, supplies of grains used as animal feed
are expected to grow tighter. Given this situation, chicken is widely
seen as a good solution to the growing demand for food, since it is a
source of high-quality animal protein that requires less feed grain
and can be digested more efficiently than beef or pork.
Nichirei’s Processed Foods business keeps this global perspective
in mind as we address the expanding market for processed chicken
products by investing in chicken processing plants and by developing
new products. By making maximum use of the infrastructure at our
consolidated subsidiary in Thailand, GFPT Nichirei, we are always
finding new ways to take advantage of chicken’s properties as a raw
ingredient. Specifically, we will continue to develop and propose
new products that make use of chicken breasts and wings along with
fried chicken and other classic favorites that use the thighs. In this
way we can establish ourselves as the leader in the Japanese chicken
market while addressing the issue of future food supplies and
minimizing stress on the environment.
Major Initiatives for the Second Year of Our “Rising 2015”
Market and Industry Trends
Performance in the Fiscal Year through March 2014
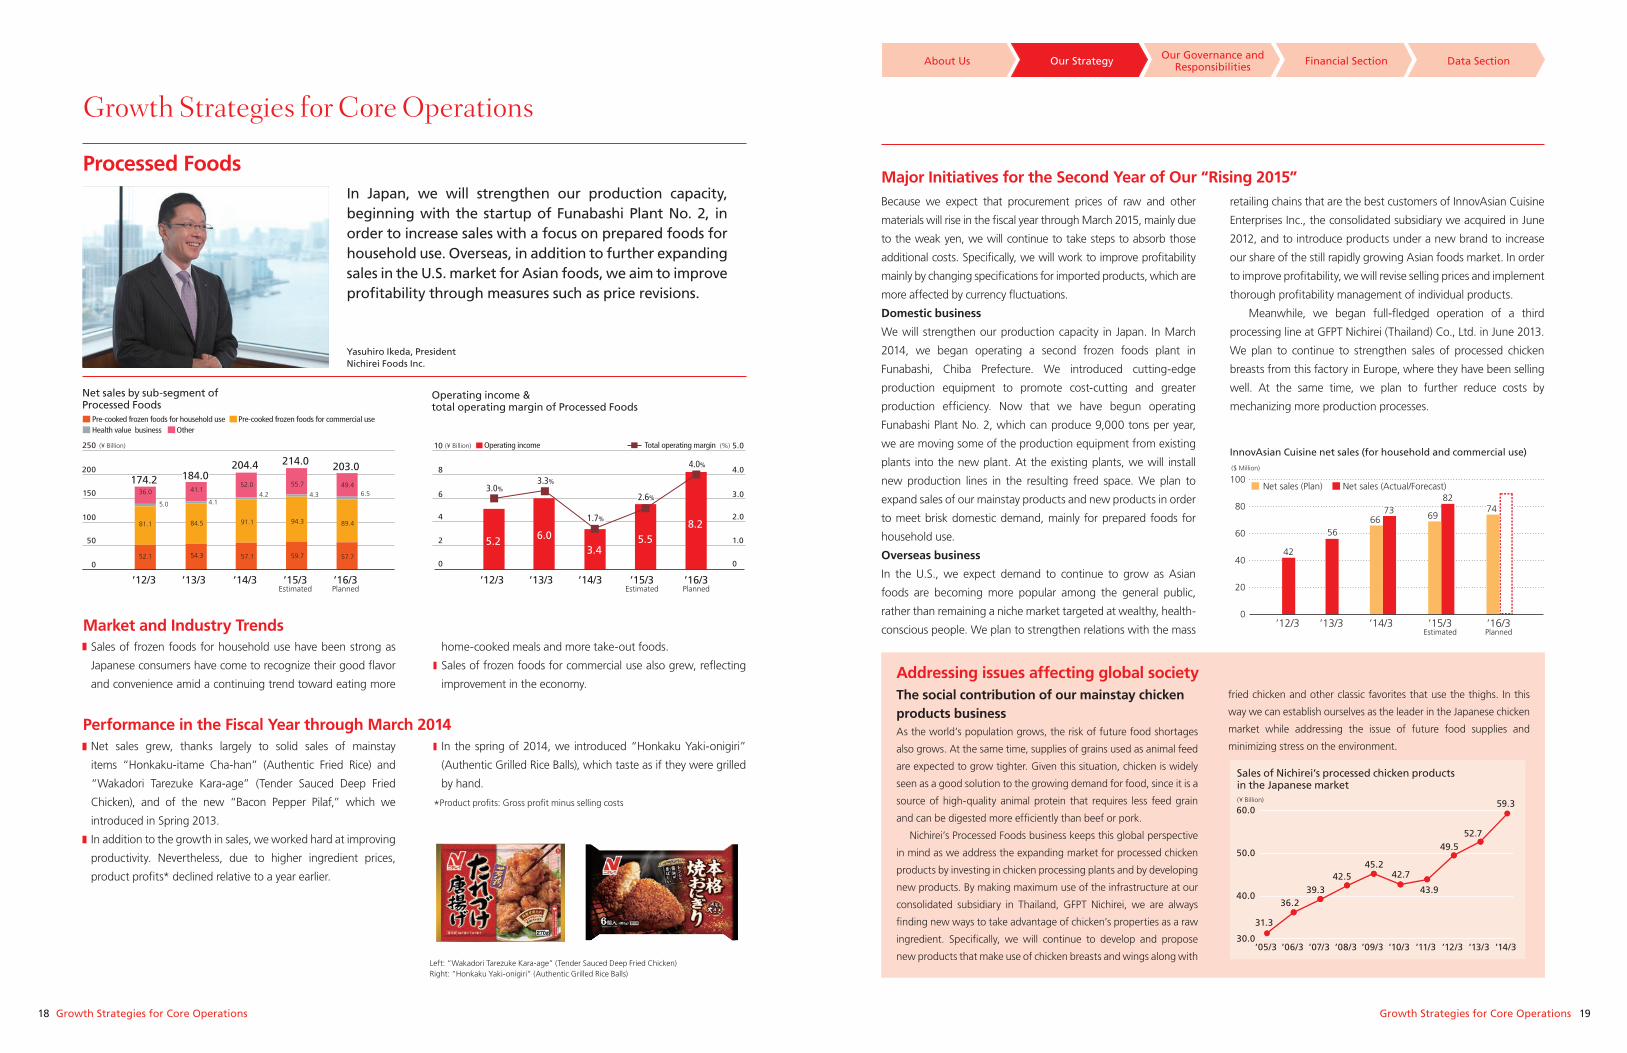
In Japan, we will strengthen our production capacity, beginning with the startup of Funabashi Plant No. 2, in order to increase sales with a focus on prepared foods for household use. Overseas, in addition to further expanding sales in the U.S. market for Asian foods, we aim to improve profitability through measures such as price revisions.
Processed Foods
Yasuhiro Ikeda, President Nichirei Foods Inc.
Sales of frozen foods for household use have been strong as
Japanese consumers have come to recognize their good flavor
and convenience amid a continuing trend toward eating more
home-cooked meals and more take-out foods.
Sales of frozen foods for commercial use also grew, reflecting
improvement in the economy.
Net sales grew, thanks largely to solid sales of mainstay
items “Honkaku-itame Cha-han” (Authentic Fried Rice) and
“Wakadori Tarezuke Kara-age” (Tender Sauced Deep Fried
Chicken), and of the new “Bacon Pepper Pilaf,” which we
introduced in Spring 2013.
In addition to the growth in sales, we worked hard at improving
productivity. Nevertheless, due to higher ingredient prices,
product profits* declined relative to a year earlier.
In the spring of 2014, we introduced “Honkaku Yaki-onigiri”
(Authentic Grilled Rice Balls), which taste as if they were grilled
by hand.
*Product profits: Gross profit minus selling costs
Left: “Wakadori Tarezuke Kara-age” (Tender Sauced Deep Fried Chicken) Right: “Honkaku Yaki-onigiri” (Authentic Grilled Rice Balls)
Operating income & total operating margin of Processed Foods
Net sales by sub-segment of Processed Foods
0
2
4
6
8
10
0
1.0
2.0
3.0
4.0
5.0
5.2 6.08.2
’12/3 ’13/3 ’14/3 ’15/3Estimated
’16/3Planned
’12/3 ’13/3 ’14/3 ’15/3Estimated
’16/3Planned
0
50
150
100
200
250
174.2 184.0204.4 214.0 203.0
52.1
81.1
5.0
36.0
54.3
6.54.34.2
84.5
4.1
41.1 3.0%3.3%
(¥ Billion) (¥ Billion) (%)
Pre-cooked frozen foods for household use Pre-cooked frozen foods for commercial use Health value business Other
Operating income Total operating margin
4.0%
57.1
91.1
52.0
59.7
94.3
55.7
57.7
89.4
49.4
2.6%
5.53.4
1.7%
Sales of Nichirei’s processed chicken products in the Japanese market
30.0
40.0
50.0
60.0
31.3
36.239.3
42.5
(¥ Billion)
45.242.7
43.9
49.552.7
59.3
’05/3 ’06/3 ’07/3 ’08/3 ’09/3 ’10/3 ’11/3 ’12/3 ’13/3 ’14/3
0
20
40
60
80
100
’12/3 ’13/3 ’14/3 ’15/3Estimated
’16/3Planned
Net sales (Plan)
($ Million)
Net sales (Actual/Forecast)
42
69
82
5666
73 74
InnovAsian Cuisine net sales (for household and commercial use)
Growth Strategies for Core Operations
About Us Our Strategy Our Governance and Responsibilities Financial Section Data Section
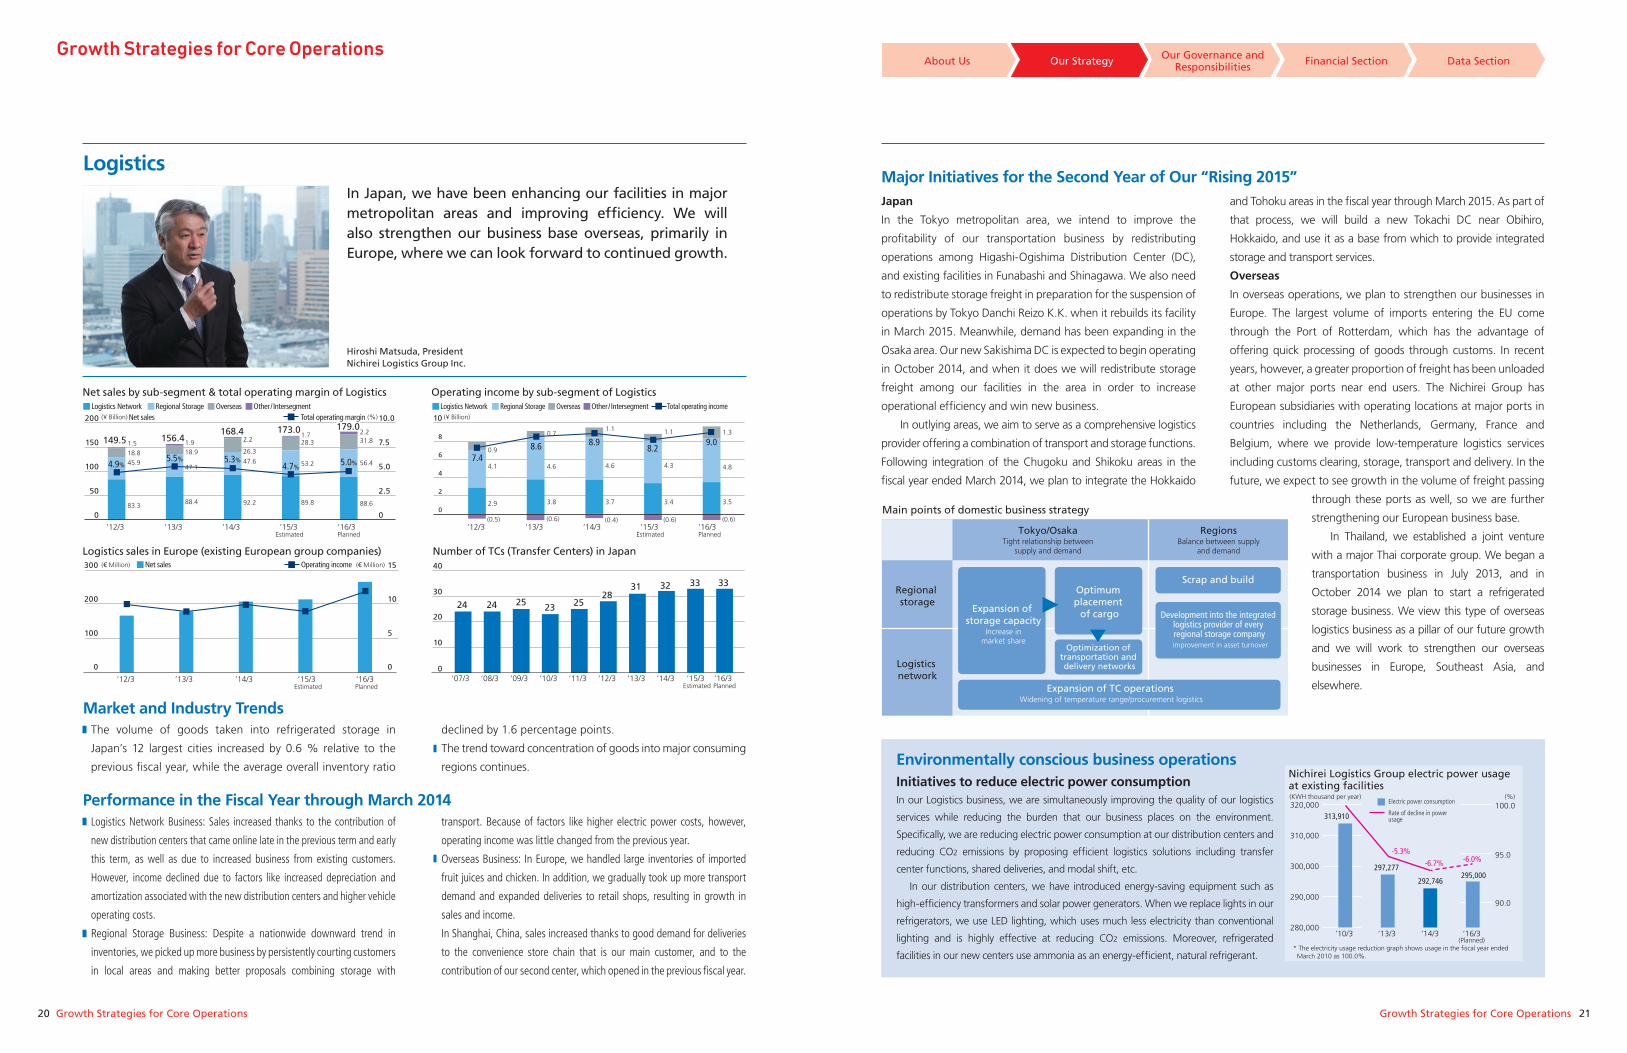
20 21Growth Strategies for Core OperationsGrowth Strategies for Core Operations
Logistics
Japan
In the Tokyo metropolitan area, we intend to improve the
profitability of our transportation business by redistributing
operations among Higashi-Ogishima Distribution Center (DC),
and existing facilities in Funabashi and Shinagawa. We also need
to redistribute storage freight in preparation for the suspension of
operations by Tokyo Danchi Reizo K.K. when it rebuilds its facility
in March 2015. Meanwhile, demand has been expanding in the
Osaka area. Our new Sakishima DC is expected to begin operating
in October 2014, and when it does we will redistribute storage
freight among our facilities in the area in order to increase
operational efficiency and win new business.
In outlying areas, we aim to serve as a comprehensive logistics
provider offering a combination of transport and storage functions.
Following integration of the Chugoku and Shikoku areas in the
fiscal year ended March 2014, we plan to integrate the Hokkaido
and Tohoku areas in the fiscal year through March 2015. As part of
that process, we will build a new Tokachi DC near Obihiro,
Hokkaido, and use it as a base from which to provide integrated
storage and transport services.
Overseas
In overseas operations, we plan to strengthen our businesses in
Europe. The largest volume of imports entering the EU come
through the Port of Rotterdam, which has the advantage of
offering quick processing of goods through customs. In recent
years, however, a greater proportion of freight has been unloaded
at other major ports near end users. The Nichirei Group has
European subsidiaries with operating locations at major ports in
countries including the Netherlands, Germany, France and
Belgium, where we provide low-temperature logistics services
including customs clearing, storage, transport and delivery. In the
future, we expect to see growth in the volume of freight passing
through these ports as well, so we are further
strengthening our European business base.
In Thailand, we established a joint venture
with a major Thai corporate group. We began a
transportation business in July 2013, and in
October 2014 we plan to start a refrigerated
storage business. We view this type of overseas
logistics business as a pillar of our future growth
and we will work to strengthen our overseas
businesses in Europe, Southeast Asia, and
elsewhere.
Environmentally conscious business operationsInitiatives to reduce electric power consumptionIn our Logistics business, we are simultaneously improving the quality of our logistics
services while reducing the burden that our business places on the environment.
Specifically, we are reducing electric power consumption at our distribution centers and
reducing CO2 emissions by proposing efficient logistics solutions including transfer
center functions, shared deliveries, and modal shift, etc.
In our distribution centers, we have introduced energy-saving equipment such as
high-efficiency transformers and solar power generators. When we replace lights in our
refrigerators, we use LED lighting, which uses much less electricity than conventional
lighting and is highly effective at reducing CO2 emissions. Moreover, refrigerated
facilities in our new centers use ammonia as an energy-efficient, natural refrigerant.
Major Initiatives for the Second Year of Our “Rising 2015”
Market and Industry Trends
Performance in the Fiscal Year through March 2014
In Japan, we have been enhancing our facilities in major metropolitan areas and improving efficiency. We will also strengthen our business base overseas, primarily in Europe, where we can look forward to continued growth.
Hiroshi Matsuda, PresidentNichirei Logistics Group Inc.
The volume of goods taken into refrigerated storage in
Japan’s 12 largest cities increased by 0.6 % relative to the
previous fiscal year, while the average overall inventory ratio
declined by 1.6 percentage points.
The trend toward concentration of goods into major consuming
regions continues.
Logistics Network Business: Sales increased thanks to the contribution of
new distribution centers that came online late in the previous term and early
this term, as well as due to increased business from existing customers.
However, income declined due to factors like increased depreciation and
amortization associated with the new distribution centers and higher vehicle
operating costs.
Regional Storage Business: Despite a nationwide downward trend in
inventories, we picked up more business by persistently courting customers
in local areas and making better proposals combining storage with
transport. Because of factors like higher electric power costs, however,
operating income was little changed from the previous year.
Overseas Business: In Europe, we handled large inventories of imported
fruit juices and chicken. In addition, we gradually took up more transport
demand and expanded deliveries to retail shops, resulting in growth in
sales and income.
In Shanghai, China, sales increased thanks to good demand for deliveries
to the convenience store chain that is our main customer, and to the
contribution of our second center, which opened in the previous fiscal year.
0
10
20
30
40
Logistics sales in Europe (existing European group companies) Number of TCs (Transfer Centers) in Japan
’12/3 ’13/3 ’14/3 ’15/3Estimated
’16/3Planned
’07/3
’12/3 ’13/3 ’14/3 ’15/3Estimated
’16/3Planned
’12/3 ’13/3 ’14/3 ’15/3Estimated
’16/3Planned
’08/3 ’09/3 ’10/3 ’11/3 ’12/3 ’13/3 ’14/3 ’15/3Estimated
’16/3Planned
0
100
200
300
0
5
10
15(€ Million) (€ Million)
Logistics Network Regional Storage Overseas Other/Intersegment
Net sales Operating income
Logistics Network Regional Storage Overseas Other/Intersegment Total operating income
Net sales by sub-segment & total operating margin of Logistics Operating income by sub-segment of Logistics
83.3 88.4 92.2 89.8 88.6 2.9
(0.6) (0.6)(0.4)(0.5) (0.6)
3.8 3.7 3.4 3.5
4.8
1.3
4.3
1.1
4.6
1.1
4.6
0.7
4.1
0.9
56.4
31.82.2
53.2
28.31.7
47.6
26.3
2.2
47.1
18.91.9
45.918.81.5149.5 156.4
168.4 173.0 179.0
0
50
100
150
200
0
2.5
5.0
7.5
10.0(¥ Billion) (%) (¥ Billion)
4.9%5.5% 5.3%
4.7%5.0%
0
2
4
6
8
10
7.48.6 8.9
8.29.0
24 24 25 23 25
31 32 33 3328
Net sales Total operating margin
Growth Strategies for Core Operations
280,000
290,000
300,000
310,000
320,000
90.0
95.0
100.0
’10/3 ’13/3 ’14/3 ’16/3(Planned)
313,910
-5.3%
Rate of decline in power usage
Electric power consumption
-6.7% -6.0%297,277
292,746295,000
Nichirei Logistics Group electric power usage at existing facilities
* The electricity usage reduction graph shows usage in the �scal year ended March 2010 as 100.0%.
(%)(KWH thousand per year)
Main points of domestic business strategy
Tokyo/Osaka Tight relationship between
supply and demand
Regions Balance between supply
and demand
Regional storage
Logistics network
Expansion of storage capacity
Increase in market share
Development into the integrated logistics provider of every regional storage company
improvement in asset turnover
Expansion of TC operations Widening of temperature range/procurement logistics
Optimum placement
of cargo
Scrap and build
Optimization of transportation and delivery networks
About Us Our Strategy Our Governance and Responsibilities Financial Section Data Section
22 23Growth Strategies for Core OperationsGrowth Strategies for Core Operations
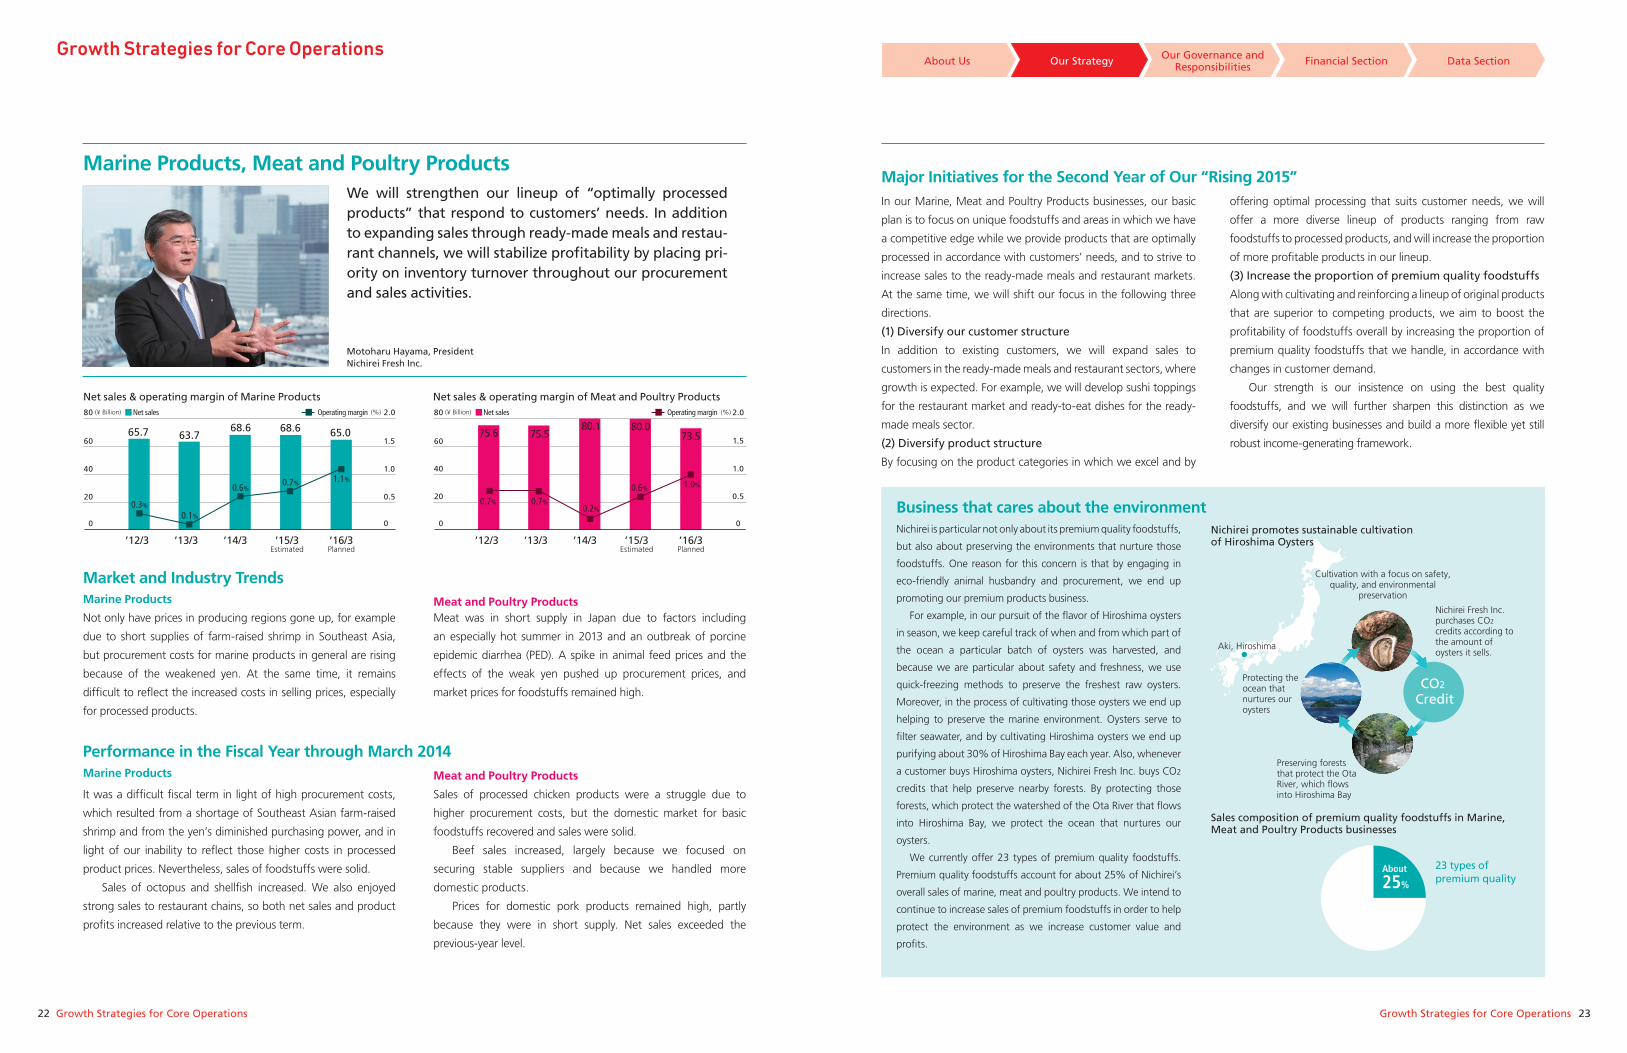
In our Marine, Meat and Poultry Products businesses, our basic
plan is to focus on unique foodstuffs and areas in which we have
a competitive edge while we provide products that are optimally
processed in accordance with customers’ needs, and to strive to
increase sales to the ready-made meals and restaurant markets.
At the same time, we will shift our focus in the following three
directions.
(1) Diversify our customer structure
In addition to existing customers, we will expand sales to
customers in the ready-made meals and restaurant sectors, where
growth is expected. For example, we will develop sushi toppings
for the restaurant market and ready-to-eat dishes for the ready-
made meals sector.
(2) Diversify product structure
By focusing on the product categories in which we excel and by
offering optimal processing that suits customer needs, we will
offer a more diverse lineup of products ranging from raw
foodstuffs to processed products, and will increase the proportion
of more profitable products in our lineup.
(3) Increase the proportion of premium quality foodstuffs
Along with cultivating and reinforcing a lineup of original products
that are superior to competing products, we aim to boost the
profitability of foodstuffs overall by increasing the proportion of
premium quality foodstuffs that we handle, in accordance with
changes in customer demand.
Our strength is our insistence on using the best quality
foodstuffs, and we will further sharpen this distinction as we
diversify our existing businesses and build a more flexible yet still
robust income-generating framework.
Business that cares about the environmentNichirei is particular not only about its premium quality foodstuffs,
but also about preserving the environments that nurture those
foodstuffs. One reason for this concern is that by engaging in
eco-friendly animal husbandry and procurement, we end up
promoting our premium products business.
For example, in our pursuit of the flavor of Hiroshima oysters
in season, we keep careful track of when and from which part of
the ocean a particular batch of oysters was harvested, and
because we are particular about safety and freshness, we use
quick-freezing methods to preserve the freshest raw oysters.
Moreover, in the process of cultivating those oysters we end up
helping to preserve the marine environment. Oysters serve to
filter seawater, and by cultivating Hiroshima oysters we end up
purifying about 30% of Hiroshima Bay each year. Also, whenever
a customer buys Hiroshima oysters, Nichirei Fresh Inc. buys CO2
credits that help preserve nearby forests. By protecting those
forests, which protect the watershed of the Ota River that flows
into Hiroshima Bay, we protect the ocean that nurtures our
oysters.
We currently offer 23 types of premium quality foodstuffs.
Premium quality foodstuffs account for about 25% of Nichirei’s
overall sales of marine, meat and poultry products. We intend to
continue to increase sales of premium foodstuffs in order to help
protect the environment as we increase customer value and
profits.
Major Initiatives for the Second Year of Our “Rising 2015”
Market and Industry Trends
Performance in the Fiscal Year through March 2014
We will strengthen our lineup of “optimally processed products” that respond to customers’ needs. In addition to expanding sales through ready-made meals and restau-rant channels, we will stabilize profitability by placing pri-ority on inventory turnover throughout our procurement and sales activities.
Marine Products, Meat and Poultry Products
Motoharu Hayama, PresidentNichirei Fresh Inc.
Marine Products
Not only have prices in producing regions gone up, for example
due to short supplies of farm-raised shrimp in Southeast Asia,
but procurement costs for marine products in general are rising
because of the weakened yen. At the same time, it remains
difficult to reflect the increased costs in selling prices, especially
for processed products.
Meat and Poultry ProductsMeat was in short supply in Japan due to factors including
an especially hot summer in 2013 and an outbreak of porcine
epidemic diarrhea (PED). A spike in animal feed prices and the
effects of the weak yen pushed up procurement prices, and
market prices for foodstuffs remained high.
Marine Products
It was a difficult fiscal term in light of high procurement costs,
which resulted from a shortage of Southeast Asian farm-raised
shrimp and from the yen’s diminished purchasing power, and in
light of our inability to reflect those higher costs in processed
product prices. Nevertheless, sales of foodstuffs were solid.
Sales of octopus and shellfish increased. We also enjoyed
strong sales to restaurant chains, so both net sales and product
profits increased relative to the previous term.
Meat and Poultry Products
Sales of processed chicken products were a struggle due to
higher procurement costs, but the domestic market for basic
foodstuffs recovered and sales were solid.
Beef sales increased, largely because we focused on
securing stable suppliers and because we handled more
domestic products.
Prices for domestic pork products remained high, partly
because they were in short supply. Net sales exceeded the
previous-year level.
0
20
40
60
80
0
0.5
1.0
1.5
2.0
65.7 63.768.6 68.6 65.0
’12/3 ’13/3 ’14/3 ’15/3Estimated
’16/3Planned
(¥ Billion) (%)
0
40
20
60
80
0
1.0
0.5
1.5
2.0
75.6 75.580.1 80.0
73.5
’12/3 ’13/3 ’14/3 ’15/3Estimated
’16/3Planned
(¥ Billion) (%)
Net sales & operating margin of Marine Products Net sales & operating margin of Meat and Poultry ProductsOperating margin Net sales Net sales Operating margin
0.3%
0.1%
0.6%0.7% 1.1%
0.7% 0.7%
0.6% 1.0%
0.2%
Growth Strategies for Core Operations
Nichirei promotes sustainable cultivation of Hiroshima Oysters
Sales composition of premium quality foodstuffs in Marine, Meat and Poultry Products businesses
Cultivation with a focus on safety, quality, and environmental
preservation
Nichirei Fresh Inc. purchases CO2 credits according to the amount of oysters it sells.
Preserving forests that protect the Ota River, which �ows into Hiroshima Bay
Protecting the ocean that nurtures our oysters
Aki, Hiroshima
CO2 Credit
About
25%
23 types of premium quality
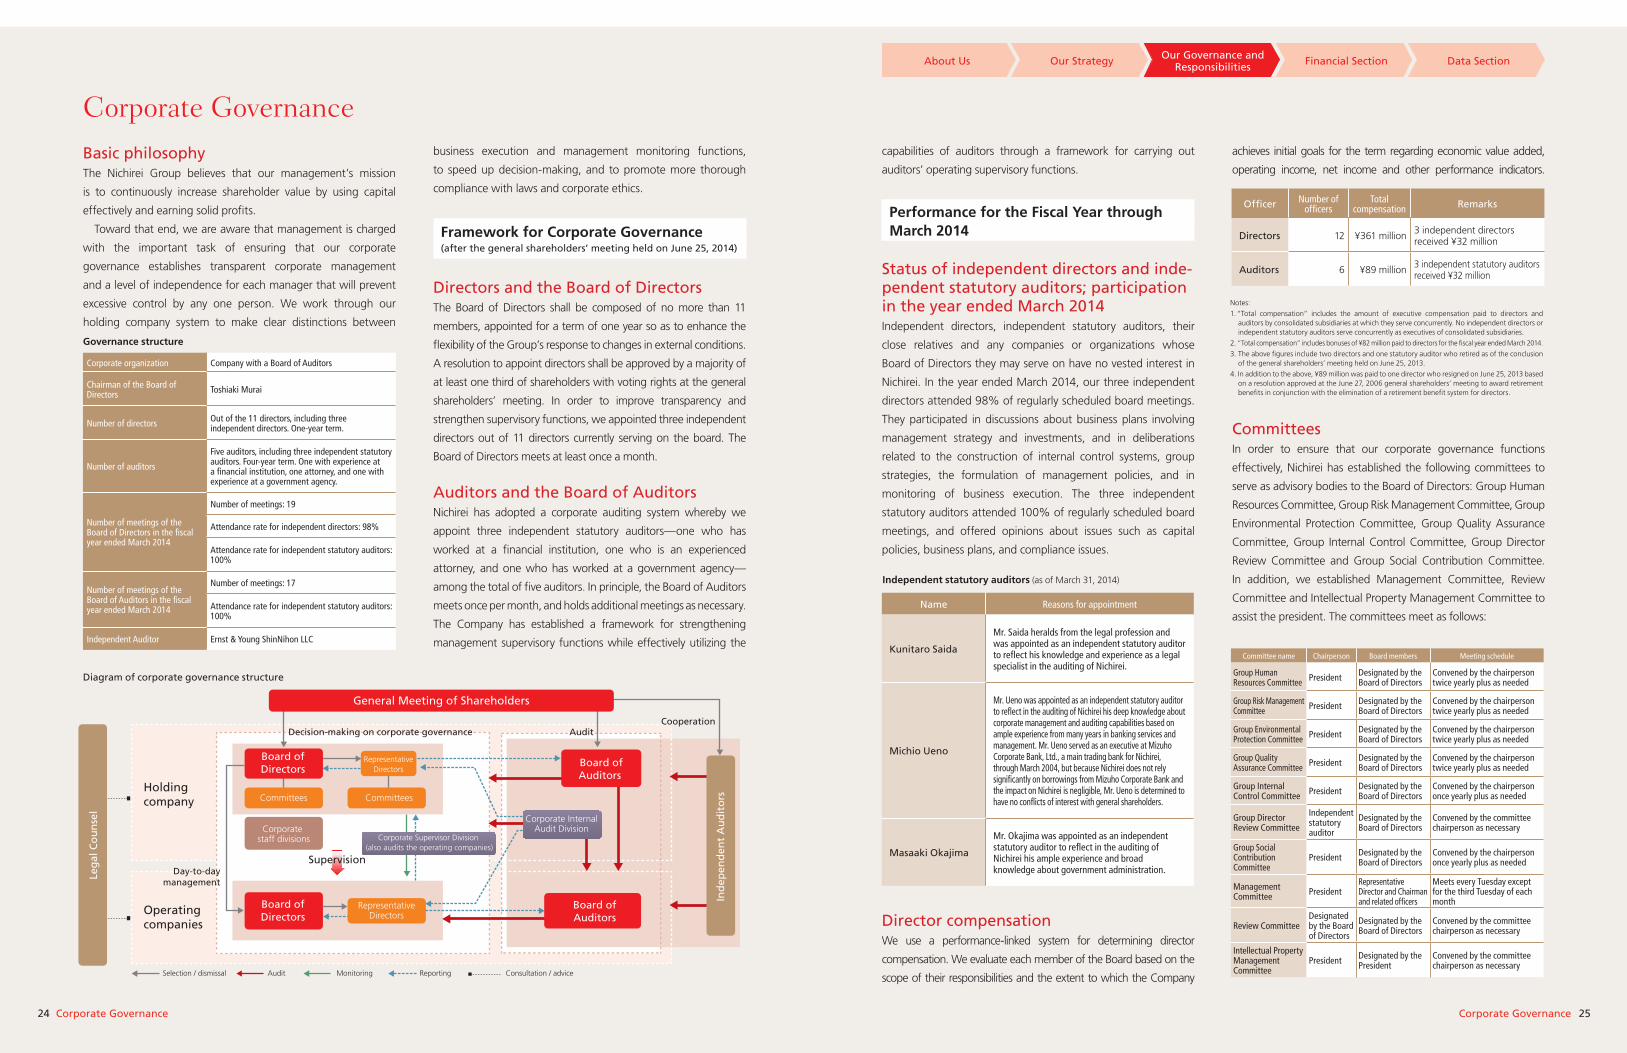
About Us Our Strategy Our Governance and Responsibilities Financial Section Data Section
Diagram of corporate governance structure
Corporate organization Company with a Board of Auditors
Chairman of the Board of Directors Toshiaki Murai
Number of directors Out of the 11 directors, including three independent directors. One-year term.
Number of auditors
Five auditors, including three independent statutory auditors. Four-year term. One with experience at a financial institution, one attorney, and one with experience at a government agency.
Number of meetings of the Board of Directors in the fiscal year ended March 2014
Number of meetings: 19
Attendance rate for independent directors: 98%
Attendance rate for independent statutory auditors: 100%
Number of meetings of the Board of Auditors in the fiscal year ended March 2014
Number of meetings: 17
Attendance rate for independent statutory auditors: 100%
Independent Auditor Ernst & Young ShinNihon LLC
24 25Corporate GovernanceCorporate Governance
Basic philosophyThe Nichirei Group believes that our management’s mission
is to continuously increase shareholder value by using capital
effectively and earning solid profits.
Toward that end, we are aware that management is charged
with the important task of ensuring that our corporate
governance establishes transparent corporate management
and a level of independence for each manager that will prevent
excessive control by any one person. We work through our
holding company system to make clear distinctions between
capabilities of auditors through a framework for carrying out
auditors’ operating supervisory functions.
Performance for the Fiscal Year throughMarch 2014
Status of independent directors and inde-pendent statutory auditors; participation in the year ended March 2014Independent directors, independent statutory auditors, their
close relatives and any companies or organizations whose
Board of Directors they may serve on have no vested interest in
Nichirei. In the year ended March 2014, our three independent
directors attended 98% of regularly scheduled board meetings.
They participated in discussions about business plans involving
management strategy and investments, and in deliberations
related to the construction of internal control systems, group
strategies, the formulation of management policies, and in
monitoring of business execution. The three independent
statutory auditors attended 100% of regularly scheduled board
meetings, and offered opinions about issues such as capital
policies, business plans, and compliance issues.
Director compensationWe use a performance-linked system for determining director
compensation. We evaluate each member of the Board based on the
scope of their responsibilities and the extent to which the Company
achieves initial goals for the term regarding economic value added,
operating income, net income and other performance indicators.
CommitteesIn order to ensure that our corporate governance functions
effectively, Nichirei has established the following committees to
serve as advisory bodies to the Board of Directors: Group Human
Resources Committee, Group Risk Management Committee, Group
Environmental Protection Committee, Group Quality Assurance
Committee, Group Internal Control Committee, Group Director
Review Committee and Group Social Contribution Committee.
In addition, we established Management Committee, Review
Committee and Intellectual Property Management Committee to
assist the president. The committees meet as follows:
business execution and management monitoring functions,
to speed up decision-making, and to promote more thorough
compliance with laws and corporate ethics.
Framework for Corporate Governance(after the general shareholders’ meeting held on June 25, 2014)
Directors and the Board of DirectorsThe Board of Directors shall be composed of no more than 11
members, appointed for a term of one year so as to enhance the
flexibility of the Group’s response to changes in external conditions.
A resolution to appoint directors shall be approved by a majority of
at least one third of shareholders with voting rights at the general
shareholders’ meeting. In order to improve transparency and
strengthen supervisory functions, we appointed three independent
directors out of 11 directors currently serving on the board. The
Board of Directors meets at least once a month.
Auditors and the Board of AuditorsNichirei has adopted a corporate auditing system whereby we
appoint three independent statutory auditors—one who has
worked at a financial institution, one who is an experienced
attorney, and one who has worked at a government agency—
among the total of five auditors. In principle, the Board of Auditors
meets once per month, and holds additional meetings as necessary.
The Company has established a framework for strengthening
management supervisory functions while effectively utilizing the
Holdingcompany
Operatingcompanies
Decision-making on corporate governance
Day-to-daymanagement
Supervision
Committees
Corporate staff divisions Corporate Supervisor Division
(also audits the operating companies)
Committees
Selection / dismissal Audit Monitoring Reporting Consultation / advice
RepresentativeDirectors
Board ofDirectors
Board ofDirectors
Leg
al C
ou
nse
l
General Meeting of Shareholders
Corporate InternalAudit Division
Audit
Board ofAuditors
Board ofAuditors
Ind
epen
den
t A
ud
ito
rs
Cooperation
RepresentativeDirectors
Committee name Chairperson Board members Meeting schedule
Group Human Resources Committee President Designated by the
Board of DirectorsConvened by the chairperson twice yearly plus as needed
Group Risk Management Committee President Designated by the
Board of DirectorsConvened by the chairperson twice yearly plus as needed
Group Environmental Protection Committee President Designated by the
Board of DirectorsConvened by the chairperson twice yearly plus as needed
Group Quality Assurance Committee President Designated by the
Board of DirectorsConvened by the chairperson twice yearly plus as needed
Group Internal Control Committee President Designated by the
Board of DirectorsConvened by the chairperson once yearly plus as needed
Group Director Review Committee
Independent statutory auditor
Designated by the Board of Directors
Convened by the committee chairperson as necessary
Group Social Contribution Committee
President Designated by the Board of Directors
Convened by the chairperson once yearly plus as needed
Management Committee President
Representative Director and Chairman and related officers
Meets every Tuesday except for the third Tuesday of each month
Review CommitteeDesignated by the Board of Directors
Designated by the Board of Directors
Convened by the committee chairperson as necessary
Intellectual Property Management Committee
President Designated by the President
Convened by the committee chairperson as necessary
Officer Number of officers
Total compensation Remarks
Directors 12 ¥361 million 3 independent directorsreceived ¥32 million
Auditors 6 ¥89 million 3 independent statutory auditorsreceived ¥32 million
Notes:
1. “Total compensation” includes the amount of executive compensation paid to directors and auditors by consolidated subsidiaries at which they serve concurrently. No independent directors or independent statutory auditors serve concurrently as executives of consolidated subsidiaries.
2. “Total compensation” includes bonuses of ¥82 million paid to directors for the fiscal year ended March 2014.
3. The above figures include two directors and one statutory auditor who retired as of the conclusion of the general shareholders’ meeting held on June 25, 2013.
4. In addition to the above, ¥89 million was paid to one director who resigned on June 25, 2013 based on a resolution approved at the June 27, 2006 general shareholders’ meeting to award retirement benefits in conjunction with the elimination of a retirement benefit system for directors.
Name Reasons for appointment
Kunitaro Saida
Mr. Saida heralds from the legal profession and was appointed as an independent statutory auditor to reflect his knowledge and experience as a legal specialist in the auditing of Nichirei.
Michio Ueno
Mr. Ueno was appointed as an independent statutory auditor to reflect in the auditing of Nichirei his deep knowledge about corporate management and auditing capabilities based on ample experience from many years in banking services and management. Mr. Ueno served as an executive at Mizuho Corporate Bank, Ltd., a main trading bank for Nichirei, through March 2004, but because Nichirei does not rely significantly on borrowings from Mizuho Corporate Bank and the impact on Nichirei is negligible, Mr. Ueno is determined to have no conflicts of interest with general shareholders.
Masaaki Okajima
Mr. Okajima was appointed as an independent statutory auditor to reflect in the auditing of Nichirei his ample experience and broad knowledge about government administration.
Independent statutory auditors (as of March 31, 2014)
Governance structure
Corporate Governance
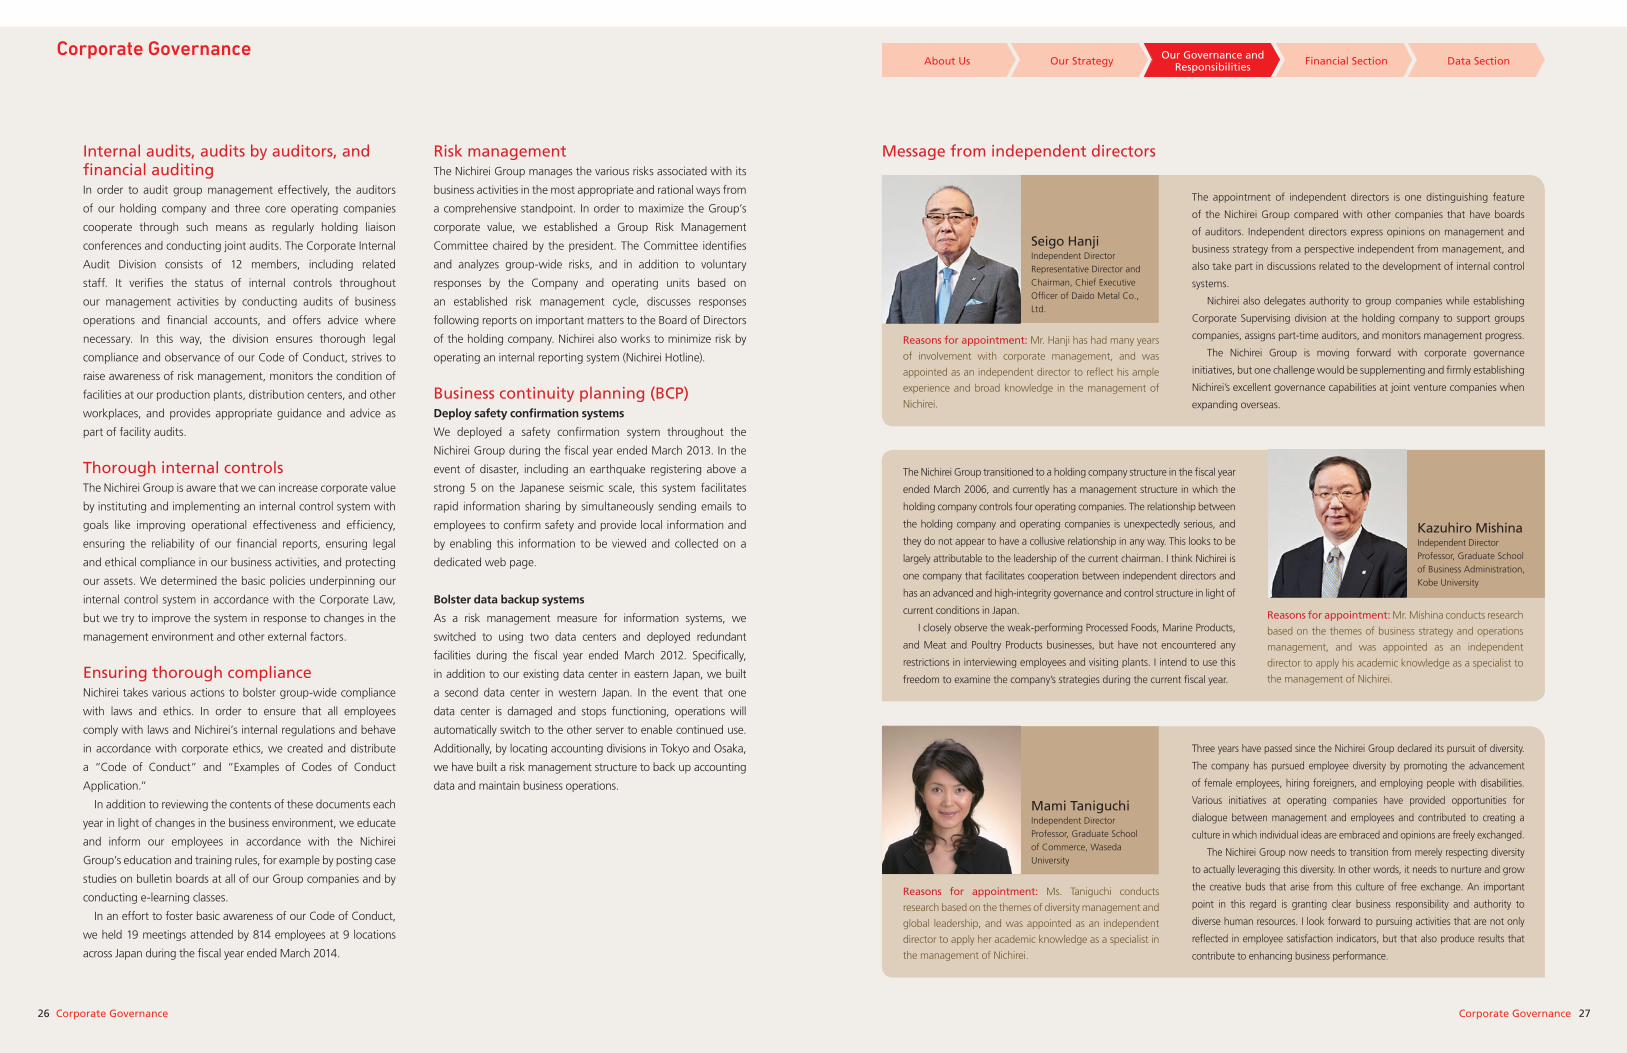
About Us Our Strategy Our Governance and Responsibilities Financial Section Data Section
26 27Corporate GovernanceCorporate Governance
Internal audits, audits by auditors, and financial auditingIn order to audit group management effectively, the auditors
of our holding company and three core operating companies
cooperate through such means as regularly holding liaison
conferences and conducting joint audits. The Corporate Internal
Audit Division consists of 12 members, including related
staff. It verifies the status of internal controls throughout
our management activities by conducting audits of business
operations and financial accounts, and offers advice where
necessary. In this way, the division ensures thorough legal
compliance and observance of our Code of Conduct, strives to
raise awareness of risk management, monitors the condition of
facilities at our production plants, distribution centers, and other
workplaces, and provides appropriate guidance and advice as
part of facility audits.
Thorough internal controlsThe Nichirei Group is aware that we can increase corporate value
by instituting and implementing an internal control system with
goals like improving operational effectiveness and efficiency,
ensuring the reliability of our financial reports, ensuring legal
and ethical compliance in our business activities, and protecting
our assets. We determined the basic policies underpinning our
internal control system in accordance with the Corporate Law,
but we try to improve the system in response to changes in the
management environment and other external factors.
Ensuring thorough complianceNichirei takes various actions to bolster group-wide compliance
with laws and ethics. In order to ensure that all employees
comply with laws and Nichirei’s internal regulations and behave
in accordance with corporate ethics, we created and distribute
a “Code of Conduct” and “Examples of Codes of Conduct
Application.”
In addition to reviewing the contents of these documents each
year in light of changes in the business environment, we educate
and inform our employees in accordance with the Nichirei
Group’s education and training rules, for example by posting case
studies on bulletin boards at all of our Group companies and by
conducting e-learning classes.
In an effort to foster basic awareness of our Code of Conduct,
we held 19 meetings attended by 814 employees at 9 locations
across Japan during the fiscal year ended March 2014.
Risk managementThe Nichirei Group manages the various risks associated with its
business activities in the most appropriate and rational ways from
a comprehensive standpoint. In order to maximize the Group’s
corporate value, we established a Group Risk Management
Committee chaired by the president. The Committee identifies
and analyzes group-wide risks, and in addition to voluntary
responses by the Company and operating units based on
an established risk management cycle, discusses responses
following reports on important matters to the Board of Directors
of the holding company. Nichirei also works to minimize risk by
operating an internal reporting system (Nichirei Hotline).
Business continuity planning (BCP)Deploy safety confirmation systems
We deployed a safety confirmation system throughout the
Nichirei Group during the fiscal year ended March 2013. In the
event of disaster, including an earthquake registering above a
strong 5 on the Japanese seismic scale, this system facilitates
rapid information sharing by simultaneously sending emails to
employees to confirm safety and provide local information and
by enabling this information to be viewed and collected on a
dedicated web page.
Bolster data backup systems
As a risk management measure for information systems, we
switched to using two data centers and deployed redundant
facilities during the fiscal year ended March 2012. Specifically,
in addition to our existing data center in eastern Japan, we built
a second data center in western Japan. In the event that one
data center is damaged and stops functioning, operations will
automatically switch to the other server to enable continued use.
Additionally, by locating accounting divisions in Tokyo and Osaka,
we have built a risk management structure to back up accounting
data and maintain business operations.
Message from independent directors
Corporate Governance
The appointment of independent directors is one distinguishing feature
of the Nichirei Group compared with other companies that have boards
of auditors. Independent directors express opinions on management and
business strategy from a perspective independent from management, and
also take part in discussions related to the development of internal control
systems.
Nichirei also delegates authority to group companies while establishing
Corporate Supervising division at the holding company to support groups
companies, assigns part-time auditors, and monitors management progress.
The Nichirei Group is moving forward with corporate governance
initiatives, but one challenge would be supplementing and firmly establishing
Nichirei’s excellent governance capabilities at joint venture companies when
expanding overseas.
Three years have passed since the Nichirei Group declared its pursuit of diversity.
The company has pursued employee diversity by promoting the advancement
of female employees, hiring foreigners, and employing people with disabilities.
Various initiatives at operating companies have provided opportunities for
dialogue between management and employees and contributed to creating a
culture in which individual ideas are embraced and opinions are freely exchanged.
The Nichirei Group now needs to transition from merely respecting diversity
to actually leveraging this diversity. In other words, it needs to nurture and grow
the creative buds that arise from this culture of free exchange. An important
point in this regard is granting clear business responsibility and authority to
diverse human resources. I look forward to pursuing activities that are not only
reflected in employee satisfaction indicators, but that also produce results that
contribute to enhancing business performance.
Reasons for appointment: Mr. Hanji has had many years
of involvement with corporate management, and was
appointed as an independent director to reflect his ample
experience and broad knowledge in the management of
Nichirei.
Reasons for appointment: Ms. Taniguchi conducts
research based on the themes of diversity management and
global leadership, and was appointed as an independent
director to apply her academic knowledge as a specialist in
the management of Nichirei.
Seigo HanjiIndependent DirectorRepresentative Director and Chairman, Chief Executive Officer of Daido Metal Co., Ltd.
Mami TaniguchiIndependent DirectorProfessor, Graduate School of Commerce, Waseda University
The Nichirei Group transitioned to a holding company structure in the fiscal year
ended March 2006, and currently has a management structure in which the
holding company controls four operating companies. The relationship between
the holding company and operating companies is unexpectedly serious, and
they do not appear to have a collusive relationship in any way. This looks to be
largely attributable to the leadership of the current chairman. I think Nichirei is
one company that facilitates cooperation between independent directors and
has an advanced and high-integrity governance and control structure in light of
current conditions in Japan.
I closely observe the weak-performing Processed Foods, Marine Products,
and Meat and Poultry Products businesses, but have not encountered any
restrictions in interviewing employees and visiting plants. I intend to use this
freedom to examine the company’s strategies during the current fiscal year.
Reasons for appointment: Mr. Mishina conducts research
based on the themes of business strategy and operations
management, and was appointed as an independent
director to apply his academic knowledge as a specialist to
the management of Nichirei.
Kazuhiro MishinaIndependent DirectorProfessor, Graduate School of Business Administration, Kobe University
About Us Our Strategy Our Governance and Responsibilities Financial Section Data Section
28 29Directors, Auditors and OfficersDirectors, Auditors and Officers
AuditorsDirectors Officers
Independent Statutory Auditors
Independent Directors
Kunitaro SaidaIndependent Statutory AuditorApr 1969 Prosecutor, Tokyo District Public
Prosecutor's OfficeAug 2005 Superintending Prosecutor,
Osaka High Public Prosecutor's Office
May 2006 Registered as an attorney with Dai-Ichi Tokyo Bar Association (to present)
Jun 2007 Independent Statutory Auditor of Nichirei
(to present)Jun 2008 Independent Director of Sumitomo Osaka Cement Co., Ltd. (to present)Jun 2010 Independent Director of Heiwa
Real Estate Co., Ltd. (to present)Mar 2014 Independent Director of Canon Inc. (to present)
Seigo HanjiIndependent DirectorApr 1965 Joined Daido Metal Co., Ltd.Jun 1995 Representative Director and PresidentJun 2005 Representative Director and President, Chief Executive OfficerJun 2007 Representative Director and Chairman, Chief Executive Officer (to present)Jun 2010 Independent Director of Nichirei (to present)
Kunio Otani Representative Director and President, Executive General Manager, Corporate Social Responsibility HeadquartersApr 1980 Joined NichireiApr 2005 Director and Managing Executive Director, Nichirei
Proserve Inc.Apr 2008 General Manager, Strategic PlanningJun 2010 Executive Officer, General
Manager, Corporate Supervisor Division and General Manager, Strategic PlanningApr 2012 Concurrently, Representative Director and President, Nichirei Proserve Inc (to present)Jun 2012 Director and Executive Officer, General Manager,
Strategic PlanningJun 2013 Representative Director and President (to present)
Hiroshi MatsudaDirector and Executive OfficerApr 1983 Joined NichireiMay 2008 Representative Director and President, Nichirei Logistics Tokai Inc.Apr 2010 Executive Officer, Nichirei
Logistics Group Inc.Apr 2011 Managing Executive Officer, Nichirei Logistics
Group Inc.Jun 2012 Director and Executive Officer (to present) Concurrently, Representative Director and President, Nichirei Logistics Group Inc. (to present)
Mami TaniguchiIndependent DirectorApr 1999 Associate Professor, Department
of Economics, Hiroshima Univer-sity of Economics
Apr 2000 Associate Professor, Graduate School of Social Sciences
Management Program, Hiroshima UniversityApr 2003 Associate Professor, School of
Commerce, Waseda UniversityApr 2008 Professor, Graduate School of
Commerce, Waseda University (to present)
Jun 2012 Independent Director of Nichirei (to present)
Tatsuo Udagawa Executive Officer, in charge of Accounting & Tax;concurrently, General Manager, Finance & Investor RelationsApr 1987 Joined NichireiApr 2012 General Manager, Finance &
Investor Relations (to present)Jun 2014 Executive Officer (to present)
Kenya OkushiExecutive Officer and General Manager, Strategic PlanningApr 1988 Joined NichireiApr 2011 General Manager, Business Coordination, Nichirei Foods Inc.Apr 2013 General Manager, Strategic
Planning (to present)Jun 2014 Executive Officer (to present)
Toshiaki Murai Representative Director and ChairmanApr 1977 Joined NichireiApr 2001 General Manager, Strategic PlanningApr 2005 Representative Director and President, Nichirei Logistics Group Inc.Jun 2005 Director and Executive OfficerJun 2007 Representative Director and
President Jun 2012 Concurrently, Representative Director and Chairman, Nichirei Logistics Group Inc. Jun 2013 Representative Director and Chairman (to present)
Yasuhiro IkedaDirector and Executive OfficerApr 1979 Joined NichireiApr 2007 Executive Officer, Nichirei
Foods Inc.Apr 2010 Managing Executive Director, Nichirei Foods Inc.Jun 2011 Representative Director and President, Nichirei Foods Inc. (to present) Director and Executive Officer
(to present)
Takeshi Ara Standing Statutory Auditor Apr 1977 Joined NichireiJun 2001 Executive Officer and General
Manager, Wellness Foods Division and Biosciences Division Jun 2007 Director and Executive OfficerJun 2013 Standing Statutory Auditor (to present)
Kazutoshi Kaitsu Standing Statutory Auditor Apr 1979 Joined NichireiApr 2006 Executive Officer, Logistics
Network, Inc.Apr 2007 Managing Executive Officer and
General Manager, Business Administration, Logistics Network, Inc.Apr 2010 Executive Officer and General
Manager, Business Administration, Nichirei Logistics Group Inc.
Jun 2012 Director, Managing Executive Officer and General Manager,
Overseas Business Development, Nichirei Logistics Group Inc.
Jun 2014 Standing Statutory Auditor (to present)
Michio UenoIndependent Statutory AuditorMay 1970 Joined the Fuji Bank, LimitedApr 2002 Executive Director, Mizuho
Corporate Bank Ltd.Apr 2004 Representative Director and
Vice-President, Mizuho Research Institute, Ltd.
Jun 2008 Outside Director, NSK Ltd.Jun 2010 Outside Auditor, TOPY Industries
Ltd.Jun 2012 Independent Statutory Auditor
of Nichirei (to present)
Takashi Nakamura Director and Executive OfficerApr 1978 Joined NichireiApr 2008 Executive Officer and General Manager, FinanceJun 2010 Director and Executive Officer; General Manager,
Internal Controls; General Manager, Finance
Concurrently, Representative Director and President,
Nichirei Proserve Inc.Apr 2012 Director and Executive Officer (to present)Jun 2012 Concurrently, Representative Director and President, Nichirei Biosciences Inc. (to present)
Toshiki Ouchiyama Director and Executive Officer,supervising Quality Assurance Division; concurrently, General Manager, Technology ManagementApr 1979 Joined NichireiApr 2007 Executive Officer, Nichirei Foods Inc.Apr 2011 Managing Executive DirectorJun 2013 Director and Executive Officer (to present)
Masaaki OkajimaIndependent Statutory AuditorApr 1977 Joined the Ministry of Agriculture, Forestry and Fisheries (MAFF)Jan 2006 Director-General of the General
Food Policy Bureau, MAFFJan 2008 Deputy Vice-Minister, MAFFApr 2010 Visiting Professor, Gradu-
ate School of Cultural and Creative Studies, Aoyama
Gakuin University (to present)Sep 2011 Visiting Professor, Graduate School of Public Policy, Chuo University (to present)Jun 2012 Independent Statutory Auditor of Nichirei (to present)
Kazuhiro MishinaIndependent DirectorSep 1989 Associate Professor, Harvard
Business SchoolSep 1995 Associate Professor, Industrial
Collaboration Promotion Center, JAIST
Sep 2002 Associate Professor, Graduate School of Business Administra-tion, Kobe University
Sep 2004 Professor, Graduate School of Business Administration, Kobe University (to present)
Jun 2012 Independent Director of Nichirei (to present)
Jun 2013 Independent Director of Fuji Oil Co., Ltd. (to present)
Motoharu Hayama Director and Executive OfficerApr 1977 Joined NichireiApr 2005 Executive Officer, Nichirei Fresh Inc.Apr 2008 Managing Executive Officer,
Nichirei Fresh Inc. Jun 2010 Director and Managing Executive Officer, Nichirei Fresh Inc.Apr 2011 Representative Director and President, Nichirei Fresh Inc. (to present)Jun 2011 Director and Executive Officer (to present)
Takumi Taguchi Director and Executive Officer,Deputy Executive General Manager,Corporate Social Responsibility Headquarters;supervising Corporate Internal Auditing,Strategic Planning, Legal Affairs, Human Resources Strategy & General Affairs, Finance and Investor Relations, and Accounting & Tax;concurrently General Manager, CorporateSupervising, and Public RelationsApr 1987 Joined NichireiApr 2011 General Manager, FinanceApr 2012 General Manager, Accounting & TaxJun 2012 Executive Officer and General
Manager, Accounting & TaxApr 2014 Executive Officer, General Manager, Corporate Supervising and General Manager, Public Relations (to present)Jun 2014 Director and Executive Officer
(to present)
(As of June 25, 2014)
Directors, Auditors and Officers
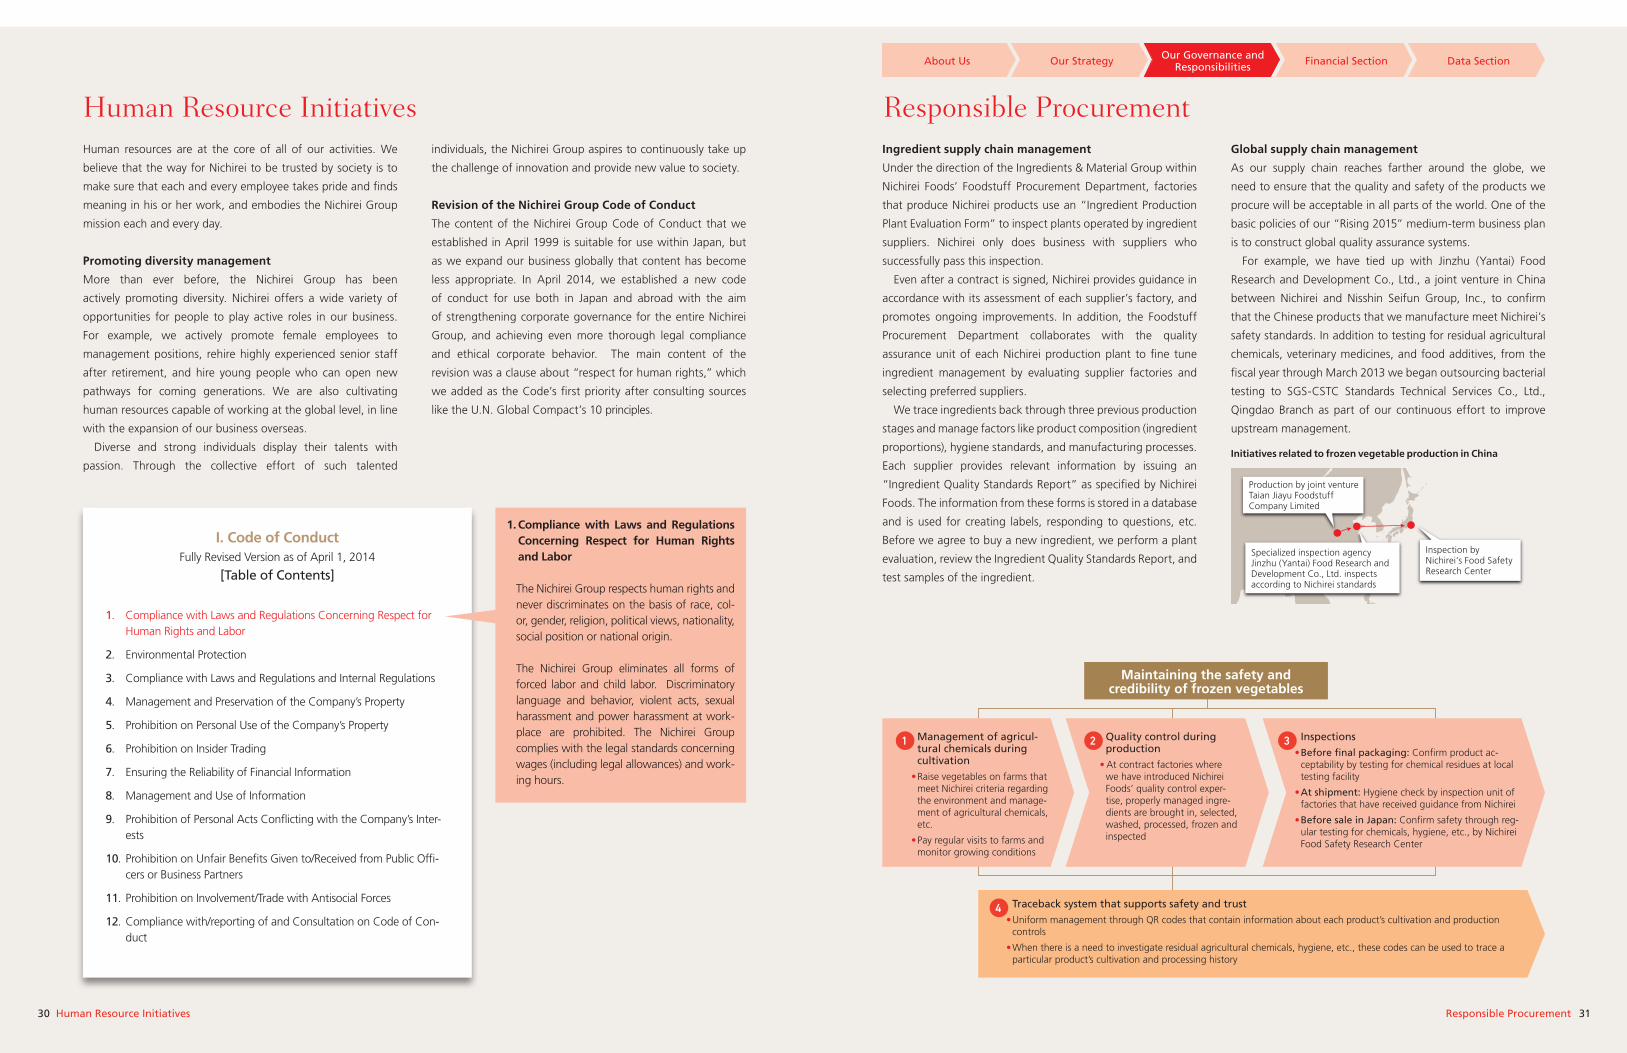
About Us Our Strategy Our Governance and Responsibilities Financial Section Data Section
30 31Responsible ProcurementHuman Resource Initiatives
I. Code of ConductFully Revised Version as of April 1, 2014
[Table of Contents]
1. Compliance with Laws and Regulations Concerning Respect for Human Rights and Labor
2. Environmental Protection
3. Compliance with Laws and Regulations and Internal Regulations
4. Management and Preservation of the Company’s Property
5. Prohibition on Personal Use of the Company’s Property
6. Prohibition on Insider Trading
7. Ensuring the Reliability of Financial Information
8. Management and Use of Information
9. Prohibition of Personal Acts Conflicting with the Company’s Inter-ests
10. Prohibition on Unfair Benefits Given to/Received from Public Offi-cers or Business Partners
11. Prohibition on Involvement/Trade with Antisocial Forces
12. Compliance with/reporting of and Consultation on Code of Con-duct
1. Compliance with Laws and Regulations Concerning Respect for Human Rights and Labor
The Nichirei Group respects human rights and never discriminates on the basis of race, col-or, gender, religion, political views, nationality, social position or national origin.
The Nichirei Group eliminates all forms of forced labor and child labor. Discriminatory language and behavior, violent acts, sexual harassment and power harassment at work-place are prohibited. The Nichirei Group complies with the legal standards concerning wages (including legal allowances) and work-ing hours.
Human resources are at the core of all of our activities. We
believe that the way for Nichirei to be trusted by society is to
make sure that each and every employee takes pride and finds
meaning in his or her work, and embodies the Nichirei Group
mission each and every day.
Promoting diversity management
More than ever before, the Nichirei Group has been
actively promoting diversity. Nichirei offers a wide variety of
opportunities for people to play active roles in our business.
For example, we actively promote female employees to
management positions, rehire highly experienced senior staff
after retirement, and hire young people who can open new
pathways for coming generations. We are also cultivating
human resources capable of working at the global level, in line
with the expansion of our business overseas.
Diverse and strong individuals display their talents with
passion. Through the collective effort of such talented
individuals, the Nichirei Group aspires to continuously take up
the challenge of innovation and provide new value to society.
Revision of the Nichirei Group Code of Conduct
The content of the Nichirei Group Code of Conduct that we
established in April 1999 is suitable for use within Japan, but
as we expand our business globally that content has become
less appropriate. In April 2014, we established a new code
of conduct for use both in Japan and abroad with the aim
of strengthening corporate governance for the entire Nichirei
Group, and achieving even more thorough legal compliance
and ethical corporate behavior. The main content of the
revision was a clause about “respect for human rights,” which
we added as the Code’s first priority after consulting sources
like the U.N. Global Compact’s 10 principles.
Ingredient supply chain management
Under the direction of the Ingredients & Material Group within
Nichirei Foods’ Foodstuff Procurement Department, factories
that produce Nichirei products use an “Ingredient Production
Plant Evaluation Form” to inspect plants operated by ingredient
suppliers. Nichirei only does business with suppliers who
successfully pass this inspection.
Even after a contract is signed, Nichirei provides guidance in
accordance with its assessment of each supplier’s factory, and
promotes ongoing improvements. In addition, the Foodstuff
Procurement Department collaborates with the quality
assurance unit of each Nichirei production plant to fine tune
ingredient management by evaluating supplier factories and
selecting preferred suppliers.
We trace ingredients back through three previous production
stages and manage factors like product composition (ingredient
proportions), hygiene standards, and manufacturing processes.
Each supplier provides relevant information by issuing an
“Ingredient Quality Standards Report” as specified by Nichirei
Foods. The information from these forms is stored in a database
and is used for creating labels, responding to questions, etc.
Before we agree to buy a new ingredient, we perform a plant
evaluation, review the Ingredient Quality Standards Report, and
test samples of the ingredient.
Global supply chain management
As our supply chain reaches farther around the globe, we
need to ensure that the quality and safety of the products we
procure will be acceptable in all parts of the world. One of the
basic policies of our “Rising 2015” medium-term business plan
is to construct global quality assurance systems.
For example, we have tied up with Jinzhu (Yantai) Food
Research and Development Co., Ltd., a joint venture in China
between Nichirei and Nisshin Seifun Group, Inc., to confirm
that the Chinese products that we manufacture meet Nichirei’s
safety standards. In addition to testing for residual agricultural
chemicals, veterinary medicines, and food additives, from the
fiscal year through March 2013 we began outsourcing bacterial
testing to SGS-CSTC Standards Technical Services Co., Ltd.,
Qingdao Branch as part of our continuous effort to improve
upstream management.
Maintaining the safety and credibility of frozen vegetables
Management of agricul-tural chemicals during cultivation
• Raise vegetables on farms that meet Nichirei criteria regarding the environment and manage-ment of agricultural chemicals, etc.
• Pay regular visits to farms and monitor growing conditions
Quality control during production
• At contract factories where we have introduced Nichirei Foods’ quality control exper-tise, properly managed ingre-dients are brought in, selected, washed, processed, frozen and inspected
Inspections • Before final packaging: Confirm product ac-
ceptability by testing for chemical residues at local testing facility
• At shipment: Hygiene check by inspection unit of factories that have received guidance from Nichirei
• Before sale in Japan: Confirm safety through reg-ular testing for chemicals, hygiene, etc., by Nichirei Food Safety Research Center
Traceback system that supports safety and trust • Uniform management through QR codes that contain information about each product’s cultivation and production
controls
• When there is a need to investigate residual agricultural chemicals, hygiene, etc., these codes can be used to trace a particular product’s cultivation and processing history
1 2 3
4
Initiatives related to frozen vegetable production in China
Production by joint venture Taian Jiayu Foodstuff Company Limited
Inspection by Nichirei’s Food Safety Research Center
Specialized inspection agency Jinzhu (Yantai) Food Research and Development Co., Ltd. inspects according to Nichirei standards
Human Resource Initiatives Responsible Procurement
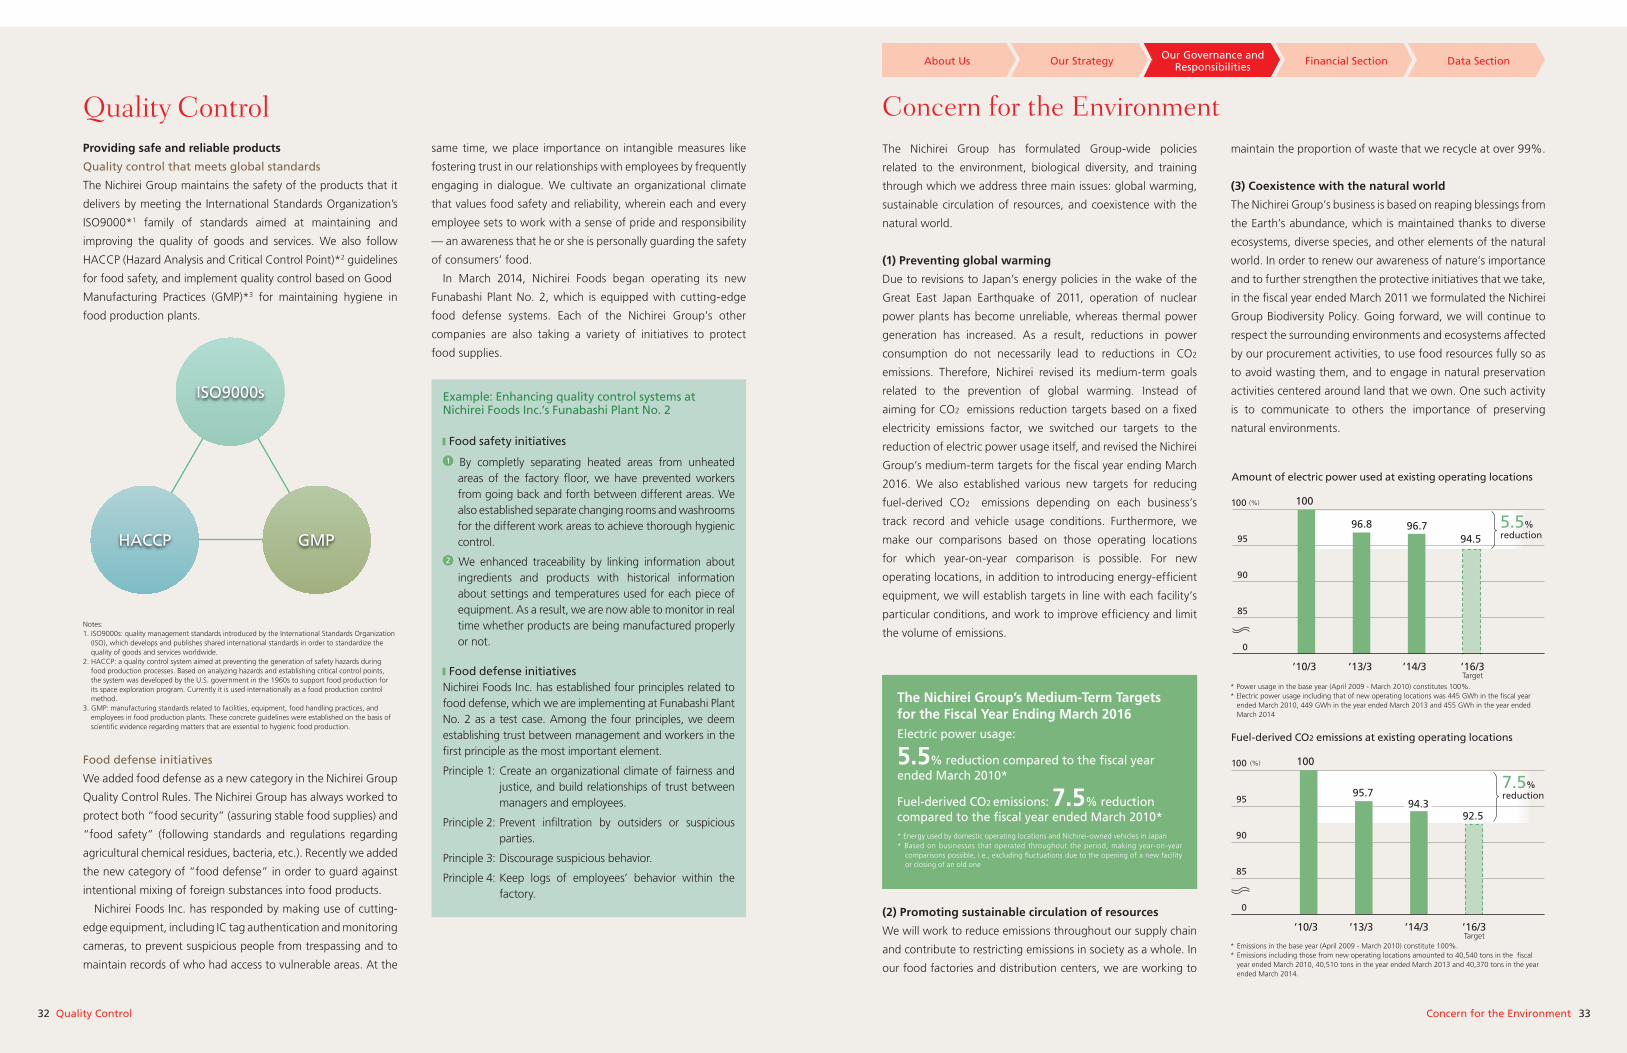
32 33Concern for the EnvironmentQuality Control
About Us Our Strategy Our Governance and Responsibilities Financial Section Data Section
The Nichirei Group has formulated Group-wide policies
related to the environment, biological diversity, and training
through which we address three main issues: global warming,
sustainable circulation of resources, and coexistence with the
natural world.
(1) Preventing global warming
Due to revisions to Japan’s energy policies in the wake of the
Great East Japan Earthquake of 2011, operation of nuclear
power plants has become unreliable, whereas thermal power
generation has increased. As a result, reductions in power
consumption do not necessarily lead to reductions in CO2
emissions. Therefore, Nichirei revised its medium-term goals
related to the prevention of global warming. Instead of
aiming for CO2 emissions reduction targets based on a fixed
electricity emissions factor, we switched our targets to the
reduction of electric power usage itself, and revised the Nichirei
Group’s medium-term targets for the fiscal year ending March
2016. We also established various new targets for reducing
fuel-derived CO2 emissions depending on each business’s
track record and vehicle usage conditions. Furthermore, we
make our comparisons based on those operating locations
for which year-on-year comparison is possible. For new
operating locations, in addition to introducing energy-efficient
equipment, we will establish targets in line with each facility’s
particular conditions, and work to improve efficiency and limit
the volume of emissions.
(2) Promoting sustainable circulation of resources
We will work to reduce emissions throughout our supply chain
and contribute to restricting emissions in society as a whole. In
our food factories and distribution centers, we are working to
maintain the proportion of waste that we recycle at over 99%.
(3) Coexistence with the natural world
The Nichirei Group’s business is based on reaping blessings from
the Earth’s abundance, which is maintained thanks to diverse
ecosystems, diverse species, and other elements of the natural
world. In order to renew our awareness of nature’s importance
and to further strengthen the protective initiatives that we take,
in the fiscal year ended March 2011 we formulated the Nichirei
Group Biodiversity Policy. Going forward, we will continue to
respect the surrounding environments and ecosystems affected
by our procurement activities, to use food resources fully so as
to avoid wasting them, and to engage in natural preservation
activities centered around land that we own. One such activity
is to communicate to others the importance of preserving
natural environments.
The Nichirei Group’s Medium-Term Targets for the Fiscal Year Ending March 2016Electric power usage:
5.5% reduction compared to the fiscal year ended March 2010*
Fuel-derived CO2 emissions: 7.5% reduction compared to the fiscal year ended March 2010** Energy used by domestic operating locations and Nichirei-owned vehicles in Japan* Based on businesses that operated throughout the period, making year-on-year
comparisons possible, i.e., excluding fluctuations due to the opening of a new facility or closing of an old one
Amount of electric power used at existing operating locations
Fuel-derived CO2 emissions at existing operating locations
0
85
90
95
100 (%)
(%)
0
85
90
95
100
’10/3
100
100
96.894.5
5.5% reduction
92.5
’13/3
96.7
’14/3 ’16/3Target
’10/3 ’13/3 ’14/3 ’16/3Target
7.5% reduction
* Power usage in the base year (April 2009 - March 2010) constitutes 100%.* Electric power usage including that of new operating locations was 445 GWh in the �scal year
ended March 2010, 449 GWh in the year ended March 2013 and 455 GWh in the year ended March 2014
* Emissions in the base year (April 2009 - March 2010) constitute 100%.* Emissions including those from new operating locations amounted to 40,540 tons in the �scal
year ended March 2010, 40,510 tons in the year ended March 2013 and 40,370 tons in the year ended March 2014.
95.794.3
Quality Control Concern for the EnvironmentProviding safe and reliable products
Quality control that meets global standards
The Nichirei Group maintains the safety of the products that it
delivers by meeting the International Standards Organization’s
ISO9000*1 family of standards aimed at maintaining and
improving the quality of goods and services. We also follow
HACCP (Hazard Analysis and Critical Control Point)*2 guidelines
for food safety, and implement quality control based on Good
Manufacturing Practices (GMP)*3 for maintaining hygiene in
food production plants.
Notes:1. ISO9000s: quality management standards introduced by the International Standards Organization
(ISO), which develops and publishes shared international standards in order to standardize the quality of goods and services worldwide.
2. HACCP: a quality control system aimed at preventing the generation of safety hazards during food production processes. Based on analyzing hazards and establishing critical control points, the system was developed by the U.S. government in the 1960s to support food production for its space exploration program. Currently it is used internationally as a food production control method.
3. GMP: manufacturing standards related to facilities, equipment, food handling practices, and employees in food production plants. These concrete guidelines were established on the basis of scientific evidence regarding matters that are essential to hygienic food production.
Food defense initiatives
We added food defense as a new category in the Nichirei Group
Quality Control Rules. The Nichirei Group has always worked to
protect both “food security” (assuring stable food supplies) and
“food safety” (following standards and regulations regarding
agricultural chemical residues, bacteria, etc.). Recently we added
the new category of “food defense” in order to guard against
intentional mixing of foreign substances into food products.
Nichirei Foods Inc. has responded by making use of cutting-
edge equipment, including IC tag authentication and monitoring
cameras, to prevent suspicious people from trespassing and to
maintain records of who had access to vulnerable areas. At the
same time, we place importance on intangible measures like
fostering trust in our relationships with employees by frequently
engaging in dialogue. We cultivate an organizational climate
that values food safety and reliability, wherein each and every
employee sets to work with a sense of pride and responsibility
— an awareness that he or she is personally guarding the safety
of consumers’ food.
In March 2014, Nichirei Foods began operating its new
Funabashi Plant No. 2, which is equipped with cutting-edge
food defense systems. Each of the Nichirei Group’s other
companies are also taking a variety of initiatives to protect
food supplies.
ISO9000s
HACCP GMP
Example: Enhancing quality control systems at Nichirei Foods Inc.’s Funabashi Plant No. 2
Food safety initiatives
1 By completly separating heated areas from unheated areas of the factory floor, we have prevented workers from going back and forth between different areas. We also established separate changing rooms and washrooms for the different work areas to achieve thorough hygienic control.
2 We enhanced traceability by linking information about ingredients and products with historical information about settings and temperatures used for each piece of equipment. As a result, we are now able to monitor in real time whether products are being manufactured properly or not.
Food defense initiativesNichirei Foods Inc. has established four principles related to food defense, which we are implementing at Funabashi Plant No. 2 as a test case. Among the four principles, we deem establishing trust between management and workers in the first principle as the most important element.
Principle 1: Create an organizational climate of fairness and justice, and build relationships of trust between managers and employees.
Principle 2: Prevent infiltration by outsiders or suspicious parties.
Principle 3: Discourage suspicious behavior.
Principle 4: Keep logs of employees’ behavior within the factory.

34 35Management’s Discussion and Analysis Management’s Discussion and Analysis
About Us Our Strategy Our Governance and Responsibilities Financial Section Data Section
Operations
Business Environment
Japan’s economy generally improved during the fiscal year ended
March 2014. Corporate earnings expanded, especially in export
industries, aided by an economic recovery in the United States
and yen depreciation from monetary easing and other government
policies. Employment conditions also showed signs of improvement.
In the food and logistics industries, the main business domains
of the Nichirei Group, although ready-made meals and restaurant
demand was firm, consumers are still strongly motivated to
economize to maintain their lifestyles, and absorbing increases in
procurement costs from rapid yen depreciation remains difficult.
Additionally, there have been renewed calls for initiatives related
to food defense systems in the wake of food safety scandals, and
control systems need to be strengthened further. Electricity rates
and fuel prices also remain high, and an increase in freight volume
and stricter safety regulations have resulted in an acute shortage
of drivers. Accordingly, the business environment has grown more
severe.
Overview
In this business environment, the fiscal year ended March 2014
was the first year of our medium-term business plan “Rising
2015” (April 2013 through March 2016). We made investments
intended to expand our earnings base in the future, including
reinforcing our domestic production structure in the Processed
Foods business and augmenting capacity in the Logistics business.
Operating Results
Net sales for the fiscal year ended March 2014 rose 8.7% from
the previous year to ¥511,189 million.
Operating income fell 11.9% from the previous year to
¥15,789 million. The operating margin decreased 0.7 percentage
points to 3.1%.
Among key cost items, cost of sales rose 10.4% from the
previous year to ¥417,928 million, equating to 81.8% of net
sales, up 1.2 percentage points. Selling, general and administrative
expenses rose 5.3% from the previous year to ¥77,472 million,
due partly to higher sales promotion expense.
(b) Pre-cooked frozen foods for commercial use
Net sales of pre-cooked frozen foods for commercial use grew
7.8% from the previous year on an increase in handling volume
of processed chicken products and spring rolls. Despite
improvement in the product mix and progress in revising prices for
some products, product profits decreased due to an increase in
raw material and purchasing costs caused by the weaker yen.
(c) Frozen agricultural products
Net sales of frozen agricultural products grew 6.4% from the
previous year on continued strong sales for the “Sono Mama
Tsukaeru” (Just Thaw and Eat) series of convenience-oriented
products for commercial use and an increase in handling volume
for broccoli and Western-style mixed vegetables for household
use. Still, product profits decreased due to the impact of the
weaker yen.
During the fiscal year ending March 2015, we expect the trend
toward home dining and ready-made meals to continue and the
pre-cooked frozen food market to be firm. For pre-cooked frozen
foods, we will work to expand sales of mainstay products and
new products by reinforcing our domestic production structure,
starting with launching operations at Funabashi Plant No.2.
In terms of profits, we expect a continued impact from higher
raw material and purchasing costs due to the weaker yen, but
look for profits to increase based on cost absorption measures
and a boost from higher sales.
Based on these activities, we forecast net sales in the Processed
Foods business to grow 4.7% from the previous year to ¥214,000
million and operating income to grow 61.9% to ¥5,500 million
during the fiscal year ending March 2015.
Performance by SegmentProcessed Foods
In the processed foods market during the year ended March 2014,
consumer demand continued to shift toward home cooking and
ready-made meals, and household frozen foods performed well as
consumers grew more accustomed to the good taste and
convenience of these products. Commercial frozen foods also
showed steady growth, reflecting an upturn in the economy.
In this market environment, net sales in the Processed Foods
business grew 11.1% from the previous year to ¥204,427 million.
Handling volume increased for pre-cooked frozen foods and frozen
vegetables amid continued strong domestic demand for home
cooking and ready-made meals, and sales at overseas subsidiaries
acquired in the previous fiscal year also contributed. Despite
improvement in productivity and progress in revising prices for some
products, we were unable to fully absorb the increase in purchasing
costs caused by the weaker yen, and operating income fell a sharp
43.6% from the previous year to ¥3,398 million.
(a) Pre-cooked frozen foods for household use
Net sales of pre-cooked frozen foods for household use grew
5.2% from the previous year on favorable sales of mainstay
products “Honkaku-itame Cha-han” (Authentic Fried Rice) and
“Wakadori Tarezuke Kara-age” (Tender Sauced Deep Fried
Chicken) and a contribution from “Bacon Pepper Pilaf,” released
in spring 2013. However, product profits decreased as a result of
high prices for raw materials.
Marine Products, Meat and Poultry Products
Marine Products
Looking at the marine products industry during the fiscal year
ended March 2014, prices in producing areas increased, including
for farm-raised shrimp in Southeast Asia amid supply shortages,
and the weak yen drove up procurement costs for marine products
across the board. Conditions also remained difficult for passing
through procurement costs to selling prices, especially for
processed products.
In this business environment, net sales in the Marine Products
business grew 7.8% from the previous year to ¥68,648 million
and operating income grew 493.0% to ¥419 million based on
strong handling volume for octopus due to moderate prices, firm
sales of foodstuffs due to quickly responding to market changes,
and stronger sales in restaurant and delicatessen channels.
(a) Shrimp
Procurement costs increased as a result of the weak yen and
supply shortages for farm-raised shrimp in Southeast Asia, and
we remained unable to pass higher costs through to selling prices
for processed products. Nevertheless, foodstuffs performed well
and net sales of shrimp grew 15.6% from the previous year and
product profits also increased.
2013.3 2014.3 Change (%)Net sales ¥184,041 ¥ 204,427 11.1 Operating income 6,030 3,398 -43.6Operating margin 3.3% 1.7% (¥ Million)
2013.3 2014.3 Change (%)Net sales ¥ 63,686 ¥ 68,648 7.8Operating income 70 419 493.0Operating margin 0.1% 0.6% (¥ Million)
’10/3 ’11/3 ’12/3 ’13/3 ’14/3
600,000
500,000
400,000
300,000
200,000
100,000
0
-100,000
(¥ Million)
0
100000
200000
300000
400000
500000
600000
184,041
63,686
75,504
156,350
4,7405,770
184,041
63,686
75,504
156,350
4,7405,770
3,7045,025
168,361
80,112
68,648
204,427
(19,090)
470,126511,189
3,7045,025
80,112
68,648
204,427
511,189
(19,968)
168,361
0
100000
0
100000
200000
300000
400000
500000
600000
’10/3 ’11/3 ’12/3 ’13/3 ’14/3
20,000
15,000
10,000
5,000
0
-5,000
(¥ Million)
0
10000
20000
0
10000
2000017,932
431
2,285
8,562
52470
6,030
26
15,789400
2,370
8,936
1274193,398137 0
10000
20000
Net Sales by Segment 2010-2014 Operating Income or Loss by Segment 2010-2014
0
1
2
3
4
55.0
4.0
3.0
2.0
1.0
0’10/3 ’11/3 ’12/3 ’13/3 ’14/3
(%)
3.8 3.83.6
3.83.1
Operating Margin 2010-2014
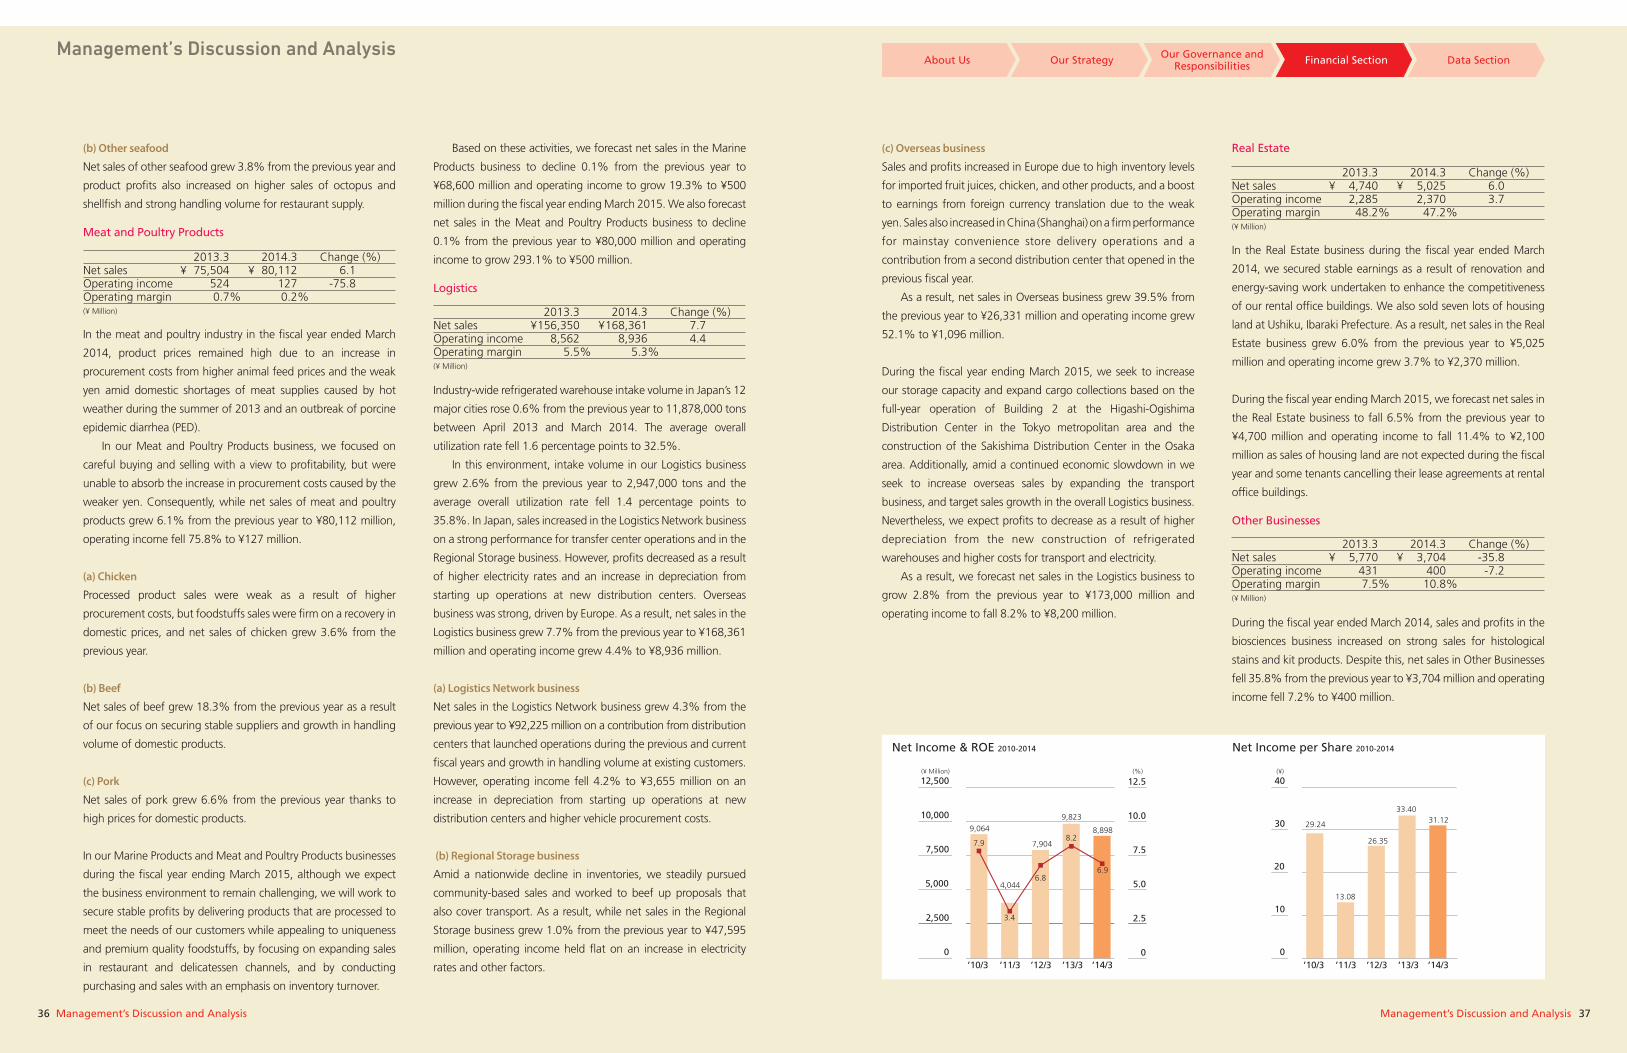
36 37Management’s Discussion and Analysis Management’s Discussion and Analysis
About Us Our Strategy Our Governance and Responsibilities Financial Section Data Section
Net Income & ROE 2010-2014
(b) Other seafood
Net sales of other seafood grew 3.8% from the previous year and
product profits also increased on higher sales of octopus and
shellfish and strong handling volume for restaurant supply.
Meat and Poultry Products
In the meat and poultry industry in the fiscal year ended March
2014, product prices remained high due to an increase in
procurement costs from higher animal feed prices and the weak
yen amid domestic shortages of meat supplies caused by hot
weather during the summer of 2013 and an outbreak of porcine
epidemic diarrhea (PED).
In our Meat and Poultry Products business, we focused on
careful buying and selling with a view to profitability, but were
unable to absorb the increase in procurement costs caused by the
weaker yen. Consequently, while net sales of meat and poultry
products grew 6.1% from the previous year to ¥80,112 million,
operating income fell 75.8% to ¥127 million.
(a) Chicken
Processed product sales were weak as a result of higher
procurement costs, but foodstuffs sales were firm on a recovery in
domestic prices, and net sales of chicken grew 3.6% from the
previous year.
(b) Beef
Net sales of beef grew 18.3% from the previous year as a result
of our focus on securing stable suppliers and growth in handling
volume of domestic products.
(c) Pork
Net sales of pork grew 6.6% from the previous year thanks to
high prices for domestic products.
In our Marine Products and Meat and Poultry Products businesses
during the fiscal year ending March 2015, although we expect
the business environment to remain challenging, we will work to
secure stable profits by delivering products that are processed to
meet the needs of our customers while appealing to uniqueness
and premium quality foodstuffs, by focusing on expanding sales
in restaurant and delicatessen channels, and by conducting
purchasing and sales with an emphasis on inventory turnover.
(c) Overseas business
Sales and profits increased in Europe due to high inventory levels
for imported fruit juices, chicken, and other products, and a boost
to earnings from foreign currency translation due to the weak
yen. Sales also increased in China (Shanghai) on a firm performance
for mainstay convenience store delivery operations and a
contribution from a second distribution center that opened in the
previous fiscal year.
As a result, net sales in Overseas business grew 39.5% from
the previous year to ¥26,331 million and operating income grew
52.1% to ¥1,096 million.
During the fiscal year ending March 2015, we seek to increase
our storage capacity and expand cargo collections based on the
full-year operation of Building 2 at the Higashi-Ogishima
Distribution Center in the Tokyo metropolitan area and the
construction of the Sakishima Distribution Center in the Osaka
area. Additionally, amid a continued economic slowdown in we
seek to increase overseas sales by expanding the transport
business, and target sales growth in the overall Logistics business.
Nevertheless, we expect profits to decrease as a result of higher
depreciation from the new construction of refrigerated
warehouses and higher costs for transport and electricity.
As a result, we forecast net sales in the Logistics business to
grow 2.8% from the previous year to ¥173,000 million and
operating income to fall 8.2% to ¥8,200 million.
Based on these activities, we forecast net sales in the Marine
Products business to decline 0.1% from the previous year to
¥68,600 million and operating income to grow 19.3% to ¥500
million during the fiscal year ending March 2015. We also forecast
net sales in the Meat and Poultry Products business to decline
0.1% from the previous year to ¥80,000 million and operating
income to grow 293.1% to ¥500 million.
Logistics
Industry-wide refrigerated warehouse intake volume in Japan’s 12
major cities rose 0.6% from the previous year to 11,878,000 tons
between April 2013 and March 2014. The average overall
utilization rate fell 1.6 percentage points to 32.5%.
In this environment, intake volume in our Logistics business
grew 2.6% from the previous year to 2,947,000 tons and the
average overall utilization rate fell 1.4 percentage points to
35.8%. In Japan, sales increased in the Logistics Network business
on a strong performance for transfer center operations and in the
Regional Storage business. However, profits decreased as a result
of higher electricity rates and an increase in depreciation from
starting up operations at new distribution centers. Overseas
business was strong, driven by Europe. As a result, net sales in the
Logistics business grew 7.7% from the previous year to ¥168,361
million and operating income grew 4.4% to ¥8,936 million.
(a) Logistics Network business
Net sales in the Logistics Network business grew 4.3% from the
previous year to ¥92,225 million on a contribution from distribution
centers that launched operations during the previous and current
fiscal years and growth in handling volume at existing customers.
However, operating income fell 4.2% to ¥3,655 million on an
increase in depreciation from starting up operations at new
distribution centers and higher vehicle procurement costs.
(b) Regional Storage business
Amid a nationwide decline in inventories, we steadily pursued
community-based sales and worked to beef up proposals that
also cover transport. As a result, while net sales in the Regional
Storage business grew 1.0% from the previous year to ¥47,595
million, operating income held flat on an increase in electricity
rates and other factors.
Real Estate
In the Real Estate business during the fiscal year ended March
2014, we secured stable earnings as a result of renovation and
energy-saving work undertaken to enhance the competitiveness
of our rental office buildings. We also sold seven lots of housing
land at Ushiku, Ibaraki Prefecture. As a result, net sales in the Real
Estate business grew 6.0% from the previous year to ¥5,025
million and operating income grew 3.7% to ¥2,370 million.
During the fiscal year ending March 2015, we forecast net sales in
the Real Estate business to fall 6.5% from the previous year to
¥4,700 million and operating income to fall 11.4% to ¥2,100
million as sales of housing land are not expected during the fiscal
year and some tenants cancelling their lease agreements at rental
office buildings.
Other Businesses
During the fiscal year ended March 2014, sales and profits in the
biosciences business increased on strong sales for histological
stains and kit products. Despite this, net sales in Other Businesses
fell 35.8% from the previous year to ¥3,704 million and operating
income fell 7.2% to ¥400 million.
2013.3 2014.3 Change (%)Net sales ¥ 75,504 ¥ 80,112 6.1Operating income 524 127 -75.8Operating margin 0.7% 0.2% (¥ Million) 2013.3 2014.3 Change (%)
Net sales ¥ 156,350 ¥ 168,361 7.7Operating income 8,562 8,936 4.4Operating margin 5.5% 5.3% (¥ Million)
2013.3 2014.3 Change (%)Net sales ¥ 4,740 ¥ 5,025 6.0Operating income 2,285 2,370 3.7Operating margin 48.2% 47.2% (¥ Million)
2013.3 2014.3 Change (%)Net sales ¥ 5,770 ¥ 3,704 -35.8Operating income 431 400 -7.2Operating margin 7.5% 10.8% (¥ Million)
’10/3 ’11/3 ’12/3 ’13/3 ’14/3
12,500
10,000
7,500
5,000
2,500
0
(¥ Million) (%)
7.9
4,0446.8
8.2
6.9
9,064
7,904
9,823
8,898
3.4
0
7.5
5.0
2.5
10.0
12.5
0.0
2.5
5.0
7.5
10.0
12.5
0
2500
5000
7500
10000
12500
’10/3 ’11/3 ’12/3 ’13/3 ’14/3
40
30
20
10
0
(¥)
13.08
29.24
26.35
33.40 31.12
0
10
20
30
40
Net Income per Share 2010-2014
Management’s Discussion and Analysis
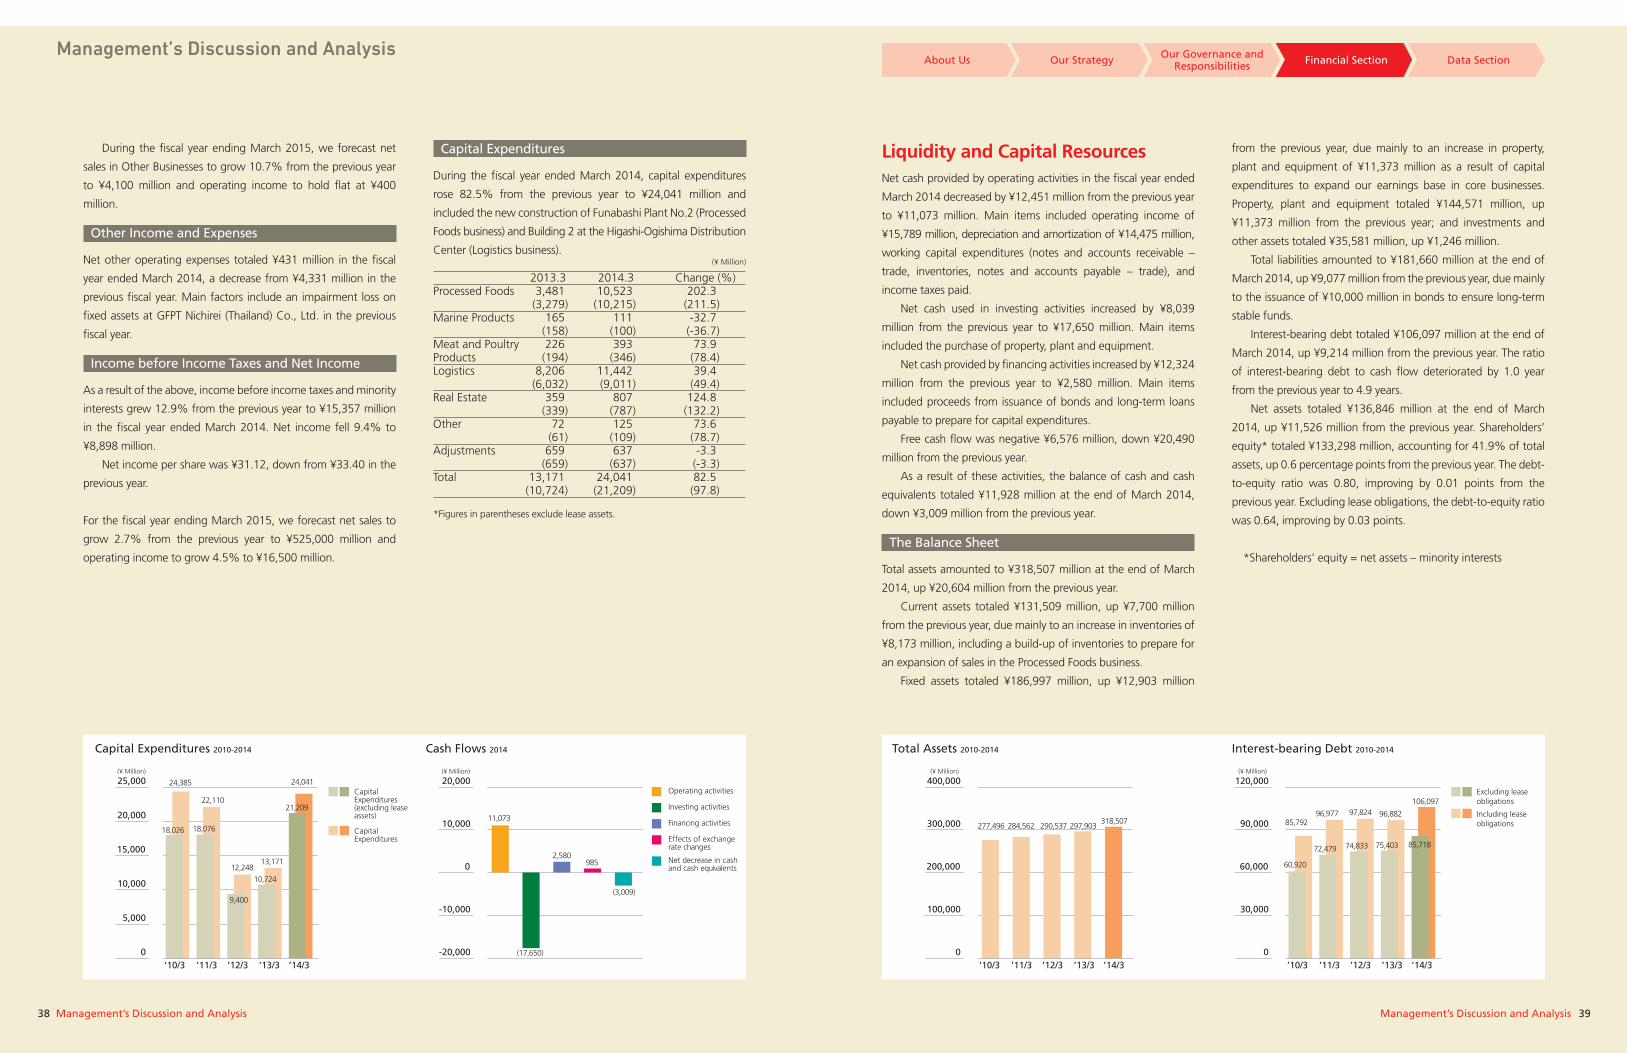
38 39Management’s Discussion and Analysis Management’s Discussion and Analysis
About Us Our Strategy Our Governance and Responsibilities Financial Section Data Section
Management’s Discussion and Analysis
During the fiscal year ending March 2015, we forecast net
sales in Other Businesses to grow 10.7% from the previous year
to ¥4,100 million and operating income to hold flat at ¥400
million.
Other Income and Expenses
Net other operating expenses totaled ¥431 million in the fiscal
year ended March 2014, a decrease from ¥4,331 million in the
previous fiscal year. Main factors include an impairment loss on
fixed assets at GFPT Nichirei (Thailand) Co., Ltd. in the previous
fiscal year.
Income before Income Taxes and Net Income
As a result of the above, income before income taxes and minority
interests grew 12.9% from the previous year to ¥15,357 million
in the fiscal year ended March 2014. Net income fell 9.4% to
¥8,898 million.
Net income per share was ¥31.12, down from ¥33.40 in the
previous year.
For the fiscal year ending March 2015, we forecast net sales to
grow 2.7% from the previous year to ¥525,000 million and
operating income to grow 4.5% to ¥16,500 million.
Liquidity and Capital ResourcesNet cash provided by operating activities in the fiscal year ended
March 2014 decreased by ¥12,451 million from the previous year
to ¥11,073 million. Main items included operating income of
¥15,789 million, depreciation and amortization of ¥14,475 million,
working capital expenditures (notes and accounts receivable –
trade, inventories, notes and accounts payable – trade), and
income taxes paid.
Net cash used in investing activities increased by ¥8,039
million from the previous year to ¥17,650 million. Main items
included the purchase of property, plant and equipment.
Net cash provided by financing activities increased by ¥12,324
million from the previous year to ¥2,580 million. Main items
included proceeds from issuance of bonds and long-term loans
payable to prepare for capital expenditures.
Free cash flow was negative ¥6,576 million, down ¥20,490
million from the previous year.
As a result of these activities, the balance of cash and cash
equivalents totaled ¥11,928 million at the end of March 2014,
down ¥3,009 million from the previous year.
The Balance Sheet
Total assets amounted to ¥318,507 million at the end of March
2014, up ¥20,604 million from the previous year.
Current assets totaled ¥131,509 million, up ¥7,700 million
from the previous year, due mainly to an increase in inventories of
¥8,173 million, including a build-up of inventories to prepare for
an expansion of sales in the Processed Foods business.
Fixed assets totaled ¥186,997 million, up ¥12,903 million
Capital Expenditures
During the fiscal year ended March 2014, capital expenditures
rose 82.5% from the previous year to ¥24,041 million and
included the new construction of Funabashi Plant No.2 (Processed
Foods business) and Building 2 at the Higashi-Ogishima Distribution
Center (Logistics business).
from the previous year, due mainly to an increase in property,
plant and equipment of ¥11,373 million as a result of capital
expenditures to expand our earnings base in core businesses.
Property, plant and equipment totaled ¥144,571 million, up
¥11,373 million from the previous year; and investments and
other assets totaled ¥35,581 million, up ¥1,246 million.
Total liabilities amounted to ¥181,660 million at the end of
March 2014, up ¥9,077 million from the previous year, due mainly
to the issuance of ¥10,000 million in bonds to ensure long-term
stable funds.
Interest-bearing debt totaled ¥106,097 million at the end of
March 2014, up ¥9,214 million from the previous year. The ratio
of interest-bearing debt to cash flow deteriorated by 1.0 year
from the previous year to 4.9 years.
Net assets totaled ¥136,846 million at the end of March
2014, up ¥11,526 million from the previous year. Shareholders’
equity* totaled ¥133,298 million, accounting for 41.9% of total
assets, up 0.6 percentage points from the previous year. The debt-
to-equity ratio was 0.80, improving by 0.01 points from the
previous year. Excluding lease obligations, the debt-to-equity ratio
was 0.64, improving by 0.03 points.
*Shareholders’ equity = net assets – minority interests
Operating activities
Investing activities
Financing activities
Effects of exchangerate changes
Net decrease in cashand cash equivalents
30,000
20,000
10,000
0
-10,000
-20,000
(¥ Million)
23,525
(9,743)
158
4,329
(9,610)
20,000
10,000
0
-10,000
-20,000
(¥ Million)
(17,650)
11,073
2,580985
(3,009)
-20000
-10000
0
10000
20000
12,24813,171
24,385
CapitalExpenditures
CapitalExpenditures(excluding leaseassets)
’10/3 ’11/3 ’12/3 ’13/3 ’14/3
25,000
20,000
15,000
10,000
5,000
0
(¥ Million)
18,076
22,110
18,026
9,400
10,724
21,209
24,041
0
5000
10000
15000
20000
25000
0
5000
10000
15000
20000
25000
’09/3 ’10/3 ’11/3 ’12/3 ’13/3
400,000
300,000
200,000
100,000
0
(¥ Million)
287,296 284,562 290,537 297,903277,496
’10/3 ’11/3 ’12/3 ’13/3 ’14/3
400,000
300,000
200,000
100,000
0
(¥ Million)
284,562277,496 290,537 297,903318,507
0
100000
200000
300000
400000
’10/3 ’11/3 ’12/3 ’13/3 ’14/3
120,000
90,000
60,000
30,000
0
(¥ Million)
97,824
72,479
96,977
75,403 85,718
106,097
74,833
96,882
60,920
85,792
0
40000
80000
120000
0
40000
80000
120000
Cash Flows 2014Capital Expenditures 2010-2014 Total Assets 2010-2014 Interest-bearing Debt 2010-2014
2013.3 2014.3 Change (%)Processed Foods 3,481 10,523 202.3 (3,279) (10,215) (211.5) Marine Products 165 111 -32.7 (158) (100) (-36.7)Meat and Poultry 226 393 73.9 Products (194) (346) (78.4) Logistics 8,206 11,442 39.4 (6,032) (9,011) (49.4) Real Estate 359 807 124.8 (339) (787) (132.2) Other 72 125 73.6 (61) (109) (78.7) Adjustments 659 637 -3.3 (659) (637) (-3.3)Total 13,171 24,041 82.5 (10,724) (21,209) (97.8)
(¥ Million)
*Figures in parentheses exclude lease assets.
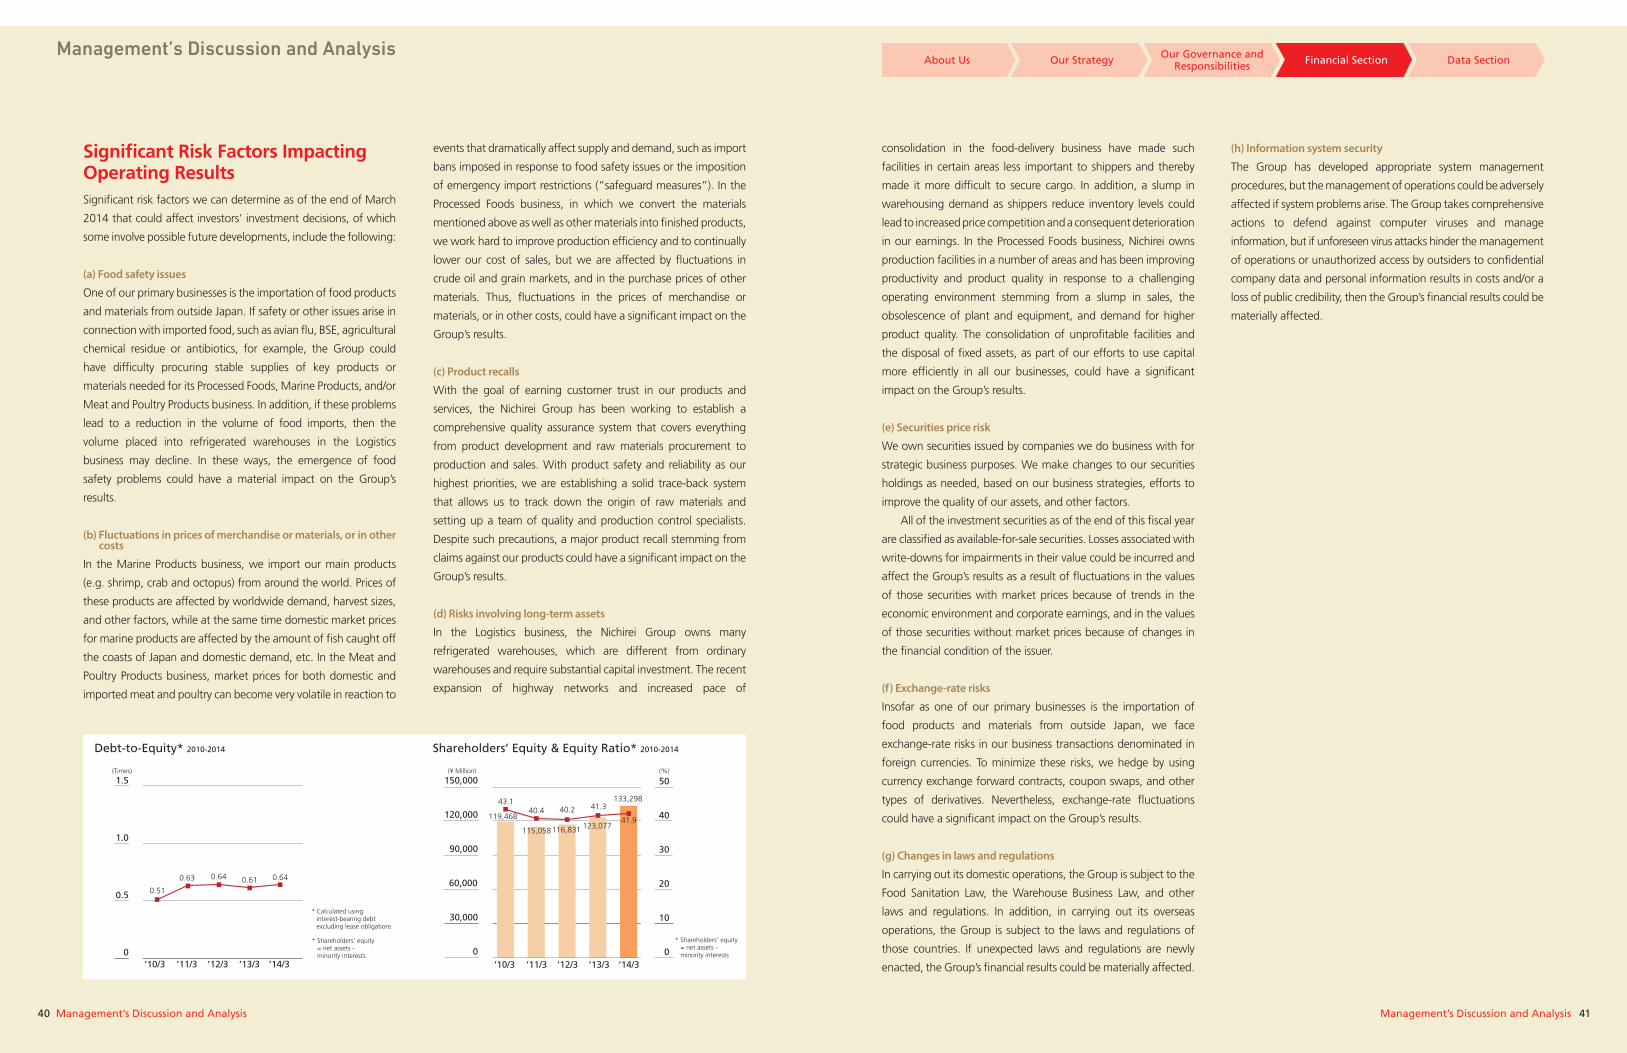
40 41Management’s Discussion and Analysis Management’s Discussion and Analysis
About Us Our Strategy Our Governance and Responsibilities Financial Section Data Section
Management’s Discussion and Analysis
Significant Risk Factors Impacting Operating ResultsSignificant risk factors we can determine as of the end of March
2014 that could affect investors’ investment decisions, of which
some involve possible future developments, include the following:
(a) Food safety issues
One of our primary businesses is the importation of food products
and materials from outside Japan. If safety or other issues arise in
connection with imported food, such as avian flu, BSE, agricultural
chemical residue or antibiotics, for example, the Group could
have difficulty procuring stable supplies of key products or
materials needed for its Processed Foods, Marine Products, and/or
Meat and Poultry Products business. In addition, if these problems
lead to a reduction in the volume of food imports, then the
volume placed into refrigerated warehouses in the Logistics
business may decline. In these ways, the emergence of food
safety problems could have a material impact on the Group’s
results.
(b) Fluctuations in prices of merchandise or materials, or in other costs
In the Marine Products business, we import our main products
(e.g. shrimp, crab and octopus) from around the world. Prices of
these products are affected by worldwide demand, harvest sizes,
and other factors, while at the same time domestic market prices
for marine products are affected by the amount of fish caught off
the coasts of Japan and domestic demand, etc. In the Meat and
Poultry Products business, market prices for both domestic and
imported meat and poultry can become very volatile in reaction to
consolidation in the food-delivery business have made such
facilities in certain areas less important to shippers and thereby
made it more difficult to secure cargo. In addition, a slump in
warehousing demand as shippers reduce inventory levels could
lead to increased price competition and a consequent deterioration
in our earnings. In the Processed Foods business, Nichirei owns
production facilities in a number of areas and has been improving
productivity and product quality in response to a challenging
operating environment stemming from a slump in sales, the
obsolescence of plant and equipment, and demand for higher
product quality. The consolidation of unprofitable facilities and
the disposal of fixed assets, as part of our efforts to use capital
more efficiently in all our businesses, could have a significant
impact on the Group’s results.
(e) Securities price risk
We own securities issued by companies we do business with for
strategic business purposes. We make changes to our securities
holdings as needed, based on our business strategies, efforts to
improve the quality of our assets, and other factors.
All of the investment securities as of the end of this fiscal year
are classified as available-for-sale securities. Losses associated with
write-downs for impairments in their value could be incurred and
affect the Group’s results as a result of fluctuations in the values
of those securities with market prices because of trends in the
economic environment and corporate earnings, and in the values
of those securities without market prices because of changes in
the financial condition of the issuer.
(f) Exchange-rate risks
Insofar as one of our primary businesses is the importation of
food products and materials from outside Japan, we face
exchange-rate risks in our business transactions denominated in
foreign currencies. To minimize these risks, we hedge by using
currency exchange forward contracts, coupon swaps, and other
types of derivatives. Nevertheless, exchange-rate fluctuations
could have a significant impact on the Group’s results.
(g) Changes in laws and regulations
In carrying out its domestic operations, the Group is subject to the
Food Sanitation Law, the Warehouse Business Law, and other
laws and regulations. In addition, in carrying out its overseas
operations, the Group is subject to the laws and regulations of
those countries. If unexpected laws and regulations are newly
enacted, the Group’s financial results could be materially affected.
events that dramatically affect supply and demand, such as import
bans imposed in response to food safety issues or the imposition
of emergency import restrictions (“safeguard measures”). In the
Processed Foods business, in which we convert the materials
mentioned above as well as other materials into finished products,
we work hard to improve production efficiency and to continually
lower our cost of sales, but we are affected by fluctuations in
crude oil and grain markets, and in the purchase prices of other
materials. Thus, fluctuations in the prices of merchandise or
materials, or in other costs, could have a significant impact on the
Group’s results.
(c) Product recalls
With the goal of earning customer trust in our products and
services, the Nichirei Group has been working to establish a
comprehensive quality assurance system that covers everything
from product development and raw materials procurement to
production and sales. With product safety and reliability as our
highest priorities, we are establishing a solid trace-back system
that allows us to track down the origin of raw materials and
setting up a team of quality and production control specialists.
Despite such precautions, a major product recall stemming from
claims against our products could have a significant impact on the
Group’s results.
(d) Risks involving long-term assets
In the Logistics business, the Nichirei Group owns many
refrigerated warehouses, which are different from ordinary
warehouses and require substantial capital investment. The recent
expansion of highway networks and increased pace of
(h) Information system security
The Group has developed appropriate system management
procedures, but the management of operations could be adversely
affected if system problems arise. The Group takes comprehensive
actions to defend against computer viruses and manage
information, but if unforeseen virus attacks hinder the management
of operations or unauthorized access by outsiders to confidential
company data and personal information results in costs and/or a
loss of public credibility, then the Group’s financial results could be
materially affected.
1.5
1.0
0.5
0’10/3 ’11/3 ’12/3 ’13/3 ’14/3
(Times)
0.51
0.63 0.64 0.61 0.64
’09/3 ’10/3 ’11/3 ’12/3 ’13/3
12,500
10,000
7,500
5,000
2,500
0
(¥ Million) (%)
0
30
20
10
40
50
0
10
20
30
40
50
’10/3 ’11/3 ’12/3 ’13/3 ’14/3
150,000
120,000
90,000
60,000
30,000
0
(¥ Million) (%)
0
30
20
10
40
50
43.140.4 40.2 41.3
41.9116,831115,058
123,077
133,298
119,468
0
30000
60000
90000
120000
150000
Shareholders’ Equity & Equity Ratio* 2010-2014Debt-to-Equity* 2010-2014
42 43Consolidated Balance Sheets Consolidated Balance Sheets
The accompanying notes are integral parts of these statements.
$ 115,897 672,927 (1,493) 416,558 10,991 62,905 1,277,786
2,110,393 864,130 327,926 406,155 31,902 3,740,508 (2,335,813) 1,404,694
228,736 29,473 10,228 145,490 (1,701) 412,227
1,816,921$ 3,094,708
2014
Thousands of U.S. dollars
(Note 1)
2013 2014
Millions of yen
Current assets: Cash and deposits (Note 3) Notes and accounts receivable–trade Less allowance for doubtful accounts Inventories (Note 4) Deferred tax assets (Note 12) Other current assetsTotal current assets
Fixed assets:Property, plant and equipment (Notes 6, 7 and 8): Buildings and structures Machinery and equipment Land Leased assets Construction in progress Less accumulated depreciation Property, plant and equipment, net
Investments and other assets: Investment securities (Note 5) Investment in affiliates Deferred tax assets (Note 12) Other (Note 6) Less allowance for doubtful accounts Total investments and other assets
Total fixed assetsTotal assets
¥ 14,938 68,226 (180) 34,698 1,558 4,567 123,809
206,449 81,080 31,282 44,647 3,109 366,568 (233,370) 133,197
23,758 3,172 1,126 13,122 (283) 40,896
174,093¥ 297,903
¥ 11,928 69,257 (153) 42,872 1,131 6,474 131,509
217,201 88,936 33,750 41,801 3,283 384,973 (240,401) 144,571
23,541 3,033 1,052 14,973 (175) 42,426
186,997¥ 318,507
Assets
Current liabilities: Short-term bank loans Commercial paper Current portion of long-term debt Accounts payables Leased obligations Income taxes payable Accrued expenses Accrued directors’ bonuses Other current liabilitiesTotal current liabilities
Long-term liabilities: Bonds Long-term debt Accrued employees’ retirement benefits (Note 15) Accrued directors’ and statutory auditors’ retirement benefits Net defined benefit liability (Note 15) Leased obligations Deferred tax liabilities (Note 12) Asset retirement obligations (Note 8) OtherTotal long-term liabilitiesTotal liabilities
Net assets:Shareholders’ equity (Notes 9 and 10): Common stock, with no par value Authorized–720,000,000 shares Issued and outstanding–295,851,065 shares Capital surplus Retained earnings Less treasury stock, at cost Total shareholders’ equityAccumulated other comprehensive income: Net unrealized holding gain on available-for-sale securities Net deferred gain on hedges Foreign currency translation adjustments Remeasurements of defined benefit plans Total accumulated other comprehensive incomeMinority interests Total net assets Total liabilities and net assets
The accompanying notes are integral parts of these statements.
$ 152,309 77,730 57,663 265,347 36,308 20,732 212,408 1,870 103,900 928,272
291,488 253,677 – 1,841 13,923 161,694 38,117 30,229 45,819 836,791 1,765,064
294,479 177,076 791,519 (49,831) 1,213,244
61,142 4,488 16,512 (219) 81,923 34,475 1,329,643 $ 3,094,708
2014
Thousands of U.S. dollars
(Note 1)
2013 2014
Millions of yen
¥ 12,720 6,000 15,507 29,400 3,586 2,752 21,722 206 8,788 100,685
20,000 21,175 1,416 276 – 17,892 3,465 2,401 5,269 71,897 172,582
30,307 18,224 75,424 (5,100) 118,856
5,916 73 (1,768) – 4,220 2,243 125,320¥ 297,903
¥ 15,675 8,000 5,934 27,309 3,736 2,133 21,861 192 10,693 95,537
30,000 26,108 – 189 1,433 16,641 3,923 3,111 4,715 86,122 181,660
30,307 18,224 81,463 (5,128) 124,867
6,292 461 1,699 (22) 8,431 3,548 136,846 ¥ 318,507
Liabilities and net assets
Consolidated Balance Sheets (Unaudited)Nichirei Corporation and Consolidated SubsidiariesAs of March 31, 2013 and 2014
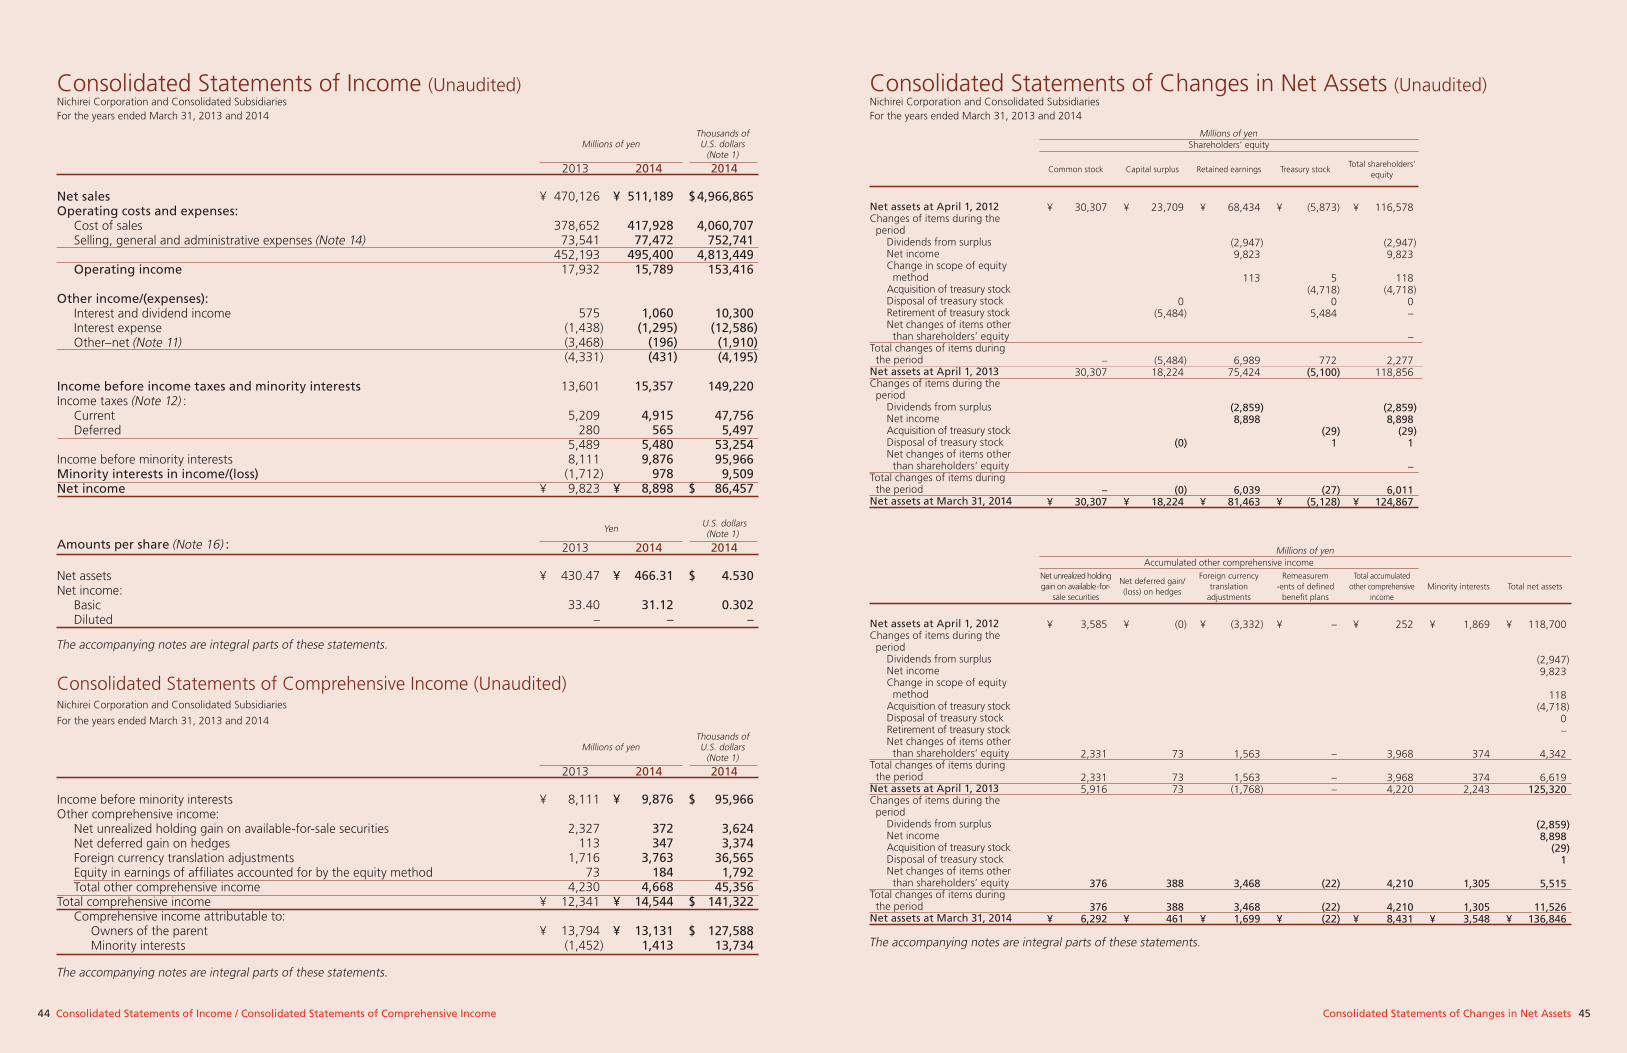
44 45Consolidated Statements of Income / Consolidated Statements of Comprehensive Income Consolidated Statements of Changes in Net Assets
The accompanying notes are integral parts of these statements.
The accompanying notes are integral parts of these statements.
$ 4,966,865
4,060,707 752,741 4,813,449 153,416
10,300 (12,586) (1,910) (4,195)
149,220
47,756 5,497 53,254 95,966 9,509 $ 86,457
$ 95,966
3,624 3,374 36,565 1,792 45,356$ 141,322
$ 127,588 13,734
$ 4.530
0.302 –
2014
2014
2014
Thousands of U.S. dollars
(Note 1)
Thousands of U.S. dollars
(Note 1)
U.S. dollars(Note 1)
2013
2013
2013
2014
2014
2014
Millions of yen
Millions of yen
Yen
Net salesOperating costs and expenses: Cost of sales Selling, general and administrative expenses (Note 14) Operating income Other income/(expenses): Interest and dividend income Interest expense Other–net (Note 11)
Income before income taxes and minority interestsIncome taxes (Note 12) : Current Deferred Income before minority interests Minority interests in income/(loss)Net income
Income before minority interestsOther comprehensive income: Net unrealized holding gain on available-for-sale securities Net deferred gain on hedges Foreign currency translation adjustments Equity in earnings of affiliates accounted for by the equity method Total other comprehensive incomeTotal comprehensive income Comprehensive income attributable to: Owners of the parent Minority interests
Net assetsNet income: Basic Diluted
¥ 470,126
378,652 73,541 452,193 17,932
575 (1,438) (3,468) (4,331)
13,601
5,209 280 5,489 8,111 (1,712)¥ 9,823
¥ 8,111
2,327 113 1,716 73 4,230¥ 12,341
¥ 13,794 (1,452)
¥ 430.47
33.40 –
¥ 511,189
417,928 77,472 495,400 15,789
1,060 (1,295) (196) (431)
15,357
4,915 565 5,480 9,876 978 ¥ 8,898
¥ 9,876
372 347 3,763 184 4,668¥ 14,544
¥ 13,131 1,413
¥ 466.31
31.12 – ¥ 118,700
(2,947) 9,823
118 (4,718) 0 –
4,342
6,619 125,320
(2,859) 8,898 (29) 1
5,515
11,526 ¥ 136,846
¥ 1,869
374
374 2,243
1,305
1,305 ¥ 3,548
¥ 116,578
(2,947) 9,823
118 (4,718) 0 –
–
2,277 118,856
(2,859) 8,898 (29) 1
–
6,011 ¥ 124,867
¥ 252
3,968
3,968 4,220
4,210
4,210 ¥ 8,431
¥ (5,873)
5 (4,718) 0 5,484
772 (5,100)
(29) 1
(27)¥ (5,128)
¥ –
–
– –
(22)
(22)¥ (22)
¥ 68,434
(2,947) 9,823
113
6,989 75,424
(2,859) 8,898
6,039 ¥ 81,463
¥ (3,332)
1,563
1,563 (1,768)
3,468
3,468 ¥ 1,699
¥ 23,709
0 (5,484)
(5,484) 18,224
(0)
(0)¥ 18,224
¥ (0)
73
73 73
388
388 ¥ 461
¥ 30,307
– 30,307
–¥ 30,307
¥ 3,585
2,331
2,331 5,916
376
376 ¥ 6,292
Total shareholders’ equity
Total accumulated other comprehensive
incomeMinority interests Total net assets
Treasury stock
Remeasurem-ents of defined
benefit plans
Retained earnings
Foreign currency translation
adjustments
Capital surplus
Net deferred gain/(loss) on hedges
Common stock
Net unrealized holding gain on available-for-
sale securities
Millions of yen
Millions of yen
Shareholders’ equity
Accumulated other comprehensive income
Net assets at April 1, 2012Changes of items during the period Dividends from surplus Net income Change in scope of equity method Acquisition of treasury stock Disposal of treasury stock Retirement of treasury stock Net changes of items other than shareholders’ equityTotal changes of items during the periodNet assets at April 1, 2013Changes of items during the period Dividends from surplus Net income Acquisition of treasury stock Disposal of treasury stock Net changes of items other than shareholders’ equityTotal changes of items during the periodNet assets at March 31, 2014
Net assets at April 1, 2012Changes of items during the period Dividends from surplus Net income Change in scope of equity method Acquisition of treasury stock Disposal of treasury stock Retirement of treasury stock Net changes of items other than shareholders’ equityTotal changes of items during the periodNet assets at April 1, 2013Changes of items during the period Dividends from surplus Net income Acquisition of treasury stock Disposal of treasury stock Net changes of items other than shareholders’ equityTotal changes of items during the periodNet assets at March 31, 2014
Amounts per share (Note 16) :
Consolidated Statements of Income (Unaudited)
Consolidated Statements of Comprehensive Income (Unaudited)
Consolidated Statements of Changes in Net Assets (Unaudited)Nichirei Corporation and Consolidated SubsidiariesFor the years ended March 31, 2013 and 2014
Nichirei Corporation and Consolidated Subsidiaries
For the years ended March 31, 2013 and 2014
Nichirei Corporation and Consolidated SubsidiariesFor the years ended March 31, 2013 and 2014
The accompanying notes are integral parts of these statements.
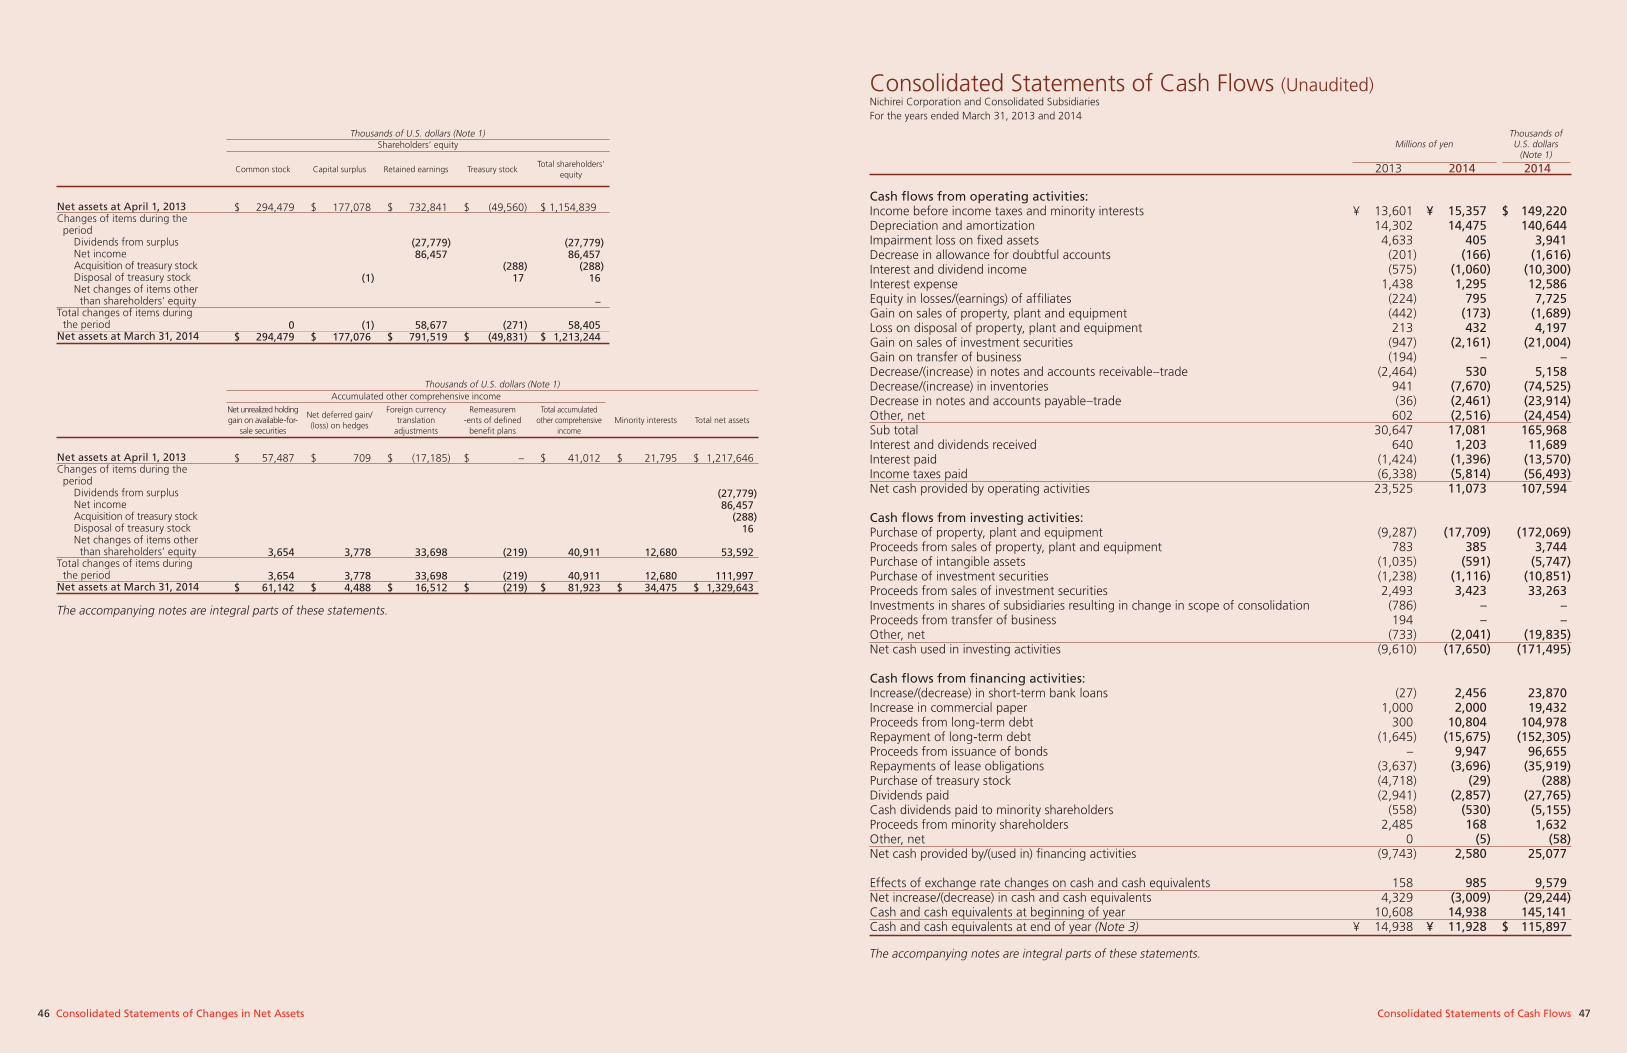
46 47Consolidated Statements of Changes in Net Assets Consolidated Statements of Cash Flows
The accompanying notes are integral parts of these statements.
$ 149,220 140,644 3,941 (1,616) (10,300) 12,586 7,725 (1,689) 4,197 (21,004) – 5,158 (74,525) (23,914) (24,454) 165,968 11,689 (13,570) (56,493) 107,594
(172,069) 3,744 (5,747) (10,851) 33,263 – – (19,835) (171,495)
23,870 19,432 104,978 (152,305) 96,655 (35,919) (288) (27,765) (5,155) 1,632 (58) 25,077
9,579 (29,244) 145,141 $ 115,897
2014
Thousands of U.S. dollars
(Note 1)
2013 2014
Millions of yen
¥ 13,601 14,302 4,633 (201) (575) 1,438 (224) (442) 213 (947) (194) (2,464) 941 (36) 602 30,647 640 (1,424) (6,338) 23,525
(9,287) 783 (1,035) (1,238) 2,493 (786) 194 (733) (9,610)
(27) 1,000 300 (1,645) – (3,637) (4,718) (2,941) (558) 2,485 0 (9,743)
158 4,329 10,608¥ 14,938
¥ 15,357 14,475 405 (166) (1,060) 1,295 795 (173) 432 (2,161) – 530 (7,670) (2,461) (2,516) 17,081 1,203 (1,396) (5,814) 11,073
(17,709) 385 (591) (1,116) 3,423 – – (2,041) (17,650)
2,456 2,000 10,804 (15,675) 9,947 (3,696) (29) (2,857) (530) 168 (5) 2,580
985 (3,009) 14,938 ¥ 11,928
Consolidated Statements of Cash Flows (Unaudited)Nichirei Corporation and Consolidated SubsidiariesFor the years ended March 31, 2013 and 2014
$ 1,217,646
(27,779) 86,457 (288) 16
53,592
111,997 $ 1,329,643
$ 21,795
12,680
12,680 $ 34,475
$ 1,154,839
(27,779) 86,457 (288) 16
–
58,405 $ 1,213,244
$ 41,012
40,911
40,911 $ 81,923
$ (49,560)
(288) 17
(271)$ (49,831)
$ –
(219)
(219)$ (219)
$ 732,841
(27,779) 86,457
58,677 $ 791,519
$ (17,185)
33,698
33,698 $ 16,512
$ 177,078
(1)
(1)$ 177,076
$ 709
3,778
3,778 $ 4,488
$ 294,479
0 $ 294,479
$ 57,487
3,654
3,654 $ 61,142
Total shareholders’ equity
Total accumulated other comprehensive
incomeMinority interests Total net assets
Treasury stock
Remeasurem-ents of defined
benefit plans
Retained earnings
Foreign currency translation
adjustments
Capital surplus
Net deferred gain/(loss) on hedges
Common stock
Net unrealized holding gain on available-for-
sale securities
Thousands of U.S. dollars (Note 1)
Thousands of U.S. dollars (Note 1)
Shareholders’ equity
Accumulated other comprehensive income
Net assets at April 1, 2013Changes of items during the period Dividends from surplus Net income Acquisition of treasury stock Disposal of treasury stock Net changes of items other than shareholders’ equityTotal changes of items during the periodNet assets at March 31, 2014
Net assets at April 1, 2013Changes of items during the period Dividends from surplus Net income Acquisition of treasury stock Disposal of treasury stock Net changes of items other than shareholders’ equityTotal changes of items during the periodNet assets at March 31, 2014
The accompanying notes are integral parts of these statements.
Cash flows from operating activities:Income before income taxes and minority interestsDepreciation and amortizationImpairment loss on fixed assetsDecrease in allowance for doubtful accountsInterest and dividend incomeInterest expenseEquity in losses/(earnings) of affiliatesGain on sales of property, plant and equipmentLoss on disposal of property, plant and equipmentGain on sales of investment securitiesGain on transfer of businessDecrease/(increase) in notes and accounts receivable–tradeDecrease/(increase) in inventoriesDecrease in notes and accounts payable–tradeOther, netSub totalInterest and dividends receivedInterest paidIncome taxes paidNet cash provided by operating activities
Cash flows from investing activities:Purchase of property, plant and equipmentProceeds from sales of property, plant and equipmentPurchase of intangible assetsPurchase of investment securitiesProceeds from sales of investment securitiesInvestments in shares of subsidiaries resulting in change in scope of consolidationProceeds from transfer of businessOther, netNet cash used in investing activities
Cash flows from financing activities:Increase/(decrease) in short-term bank loansIncrease in commercial paperProceeds from long-term debtRepayment of long-term debtProceeds from issuance of bondsRepayments of lease obligationsPurchase of treasury stockDividends paidCash dividends paid to minority shareholdersProceeds from minority shareholdersOther, netNet cash provided by/(used in) financing activities
Effects of exchange rate changes on cash and cash equivalentsNet increase/(decrease) in cash and cash equivalentsCash and cash equivalents at beginning of yearCash and cash equivalents at end of year (Note 3)
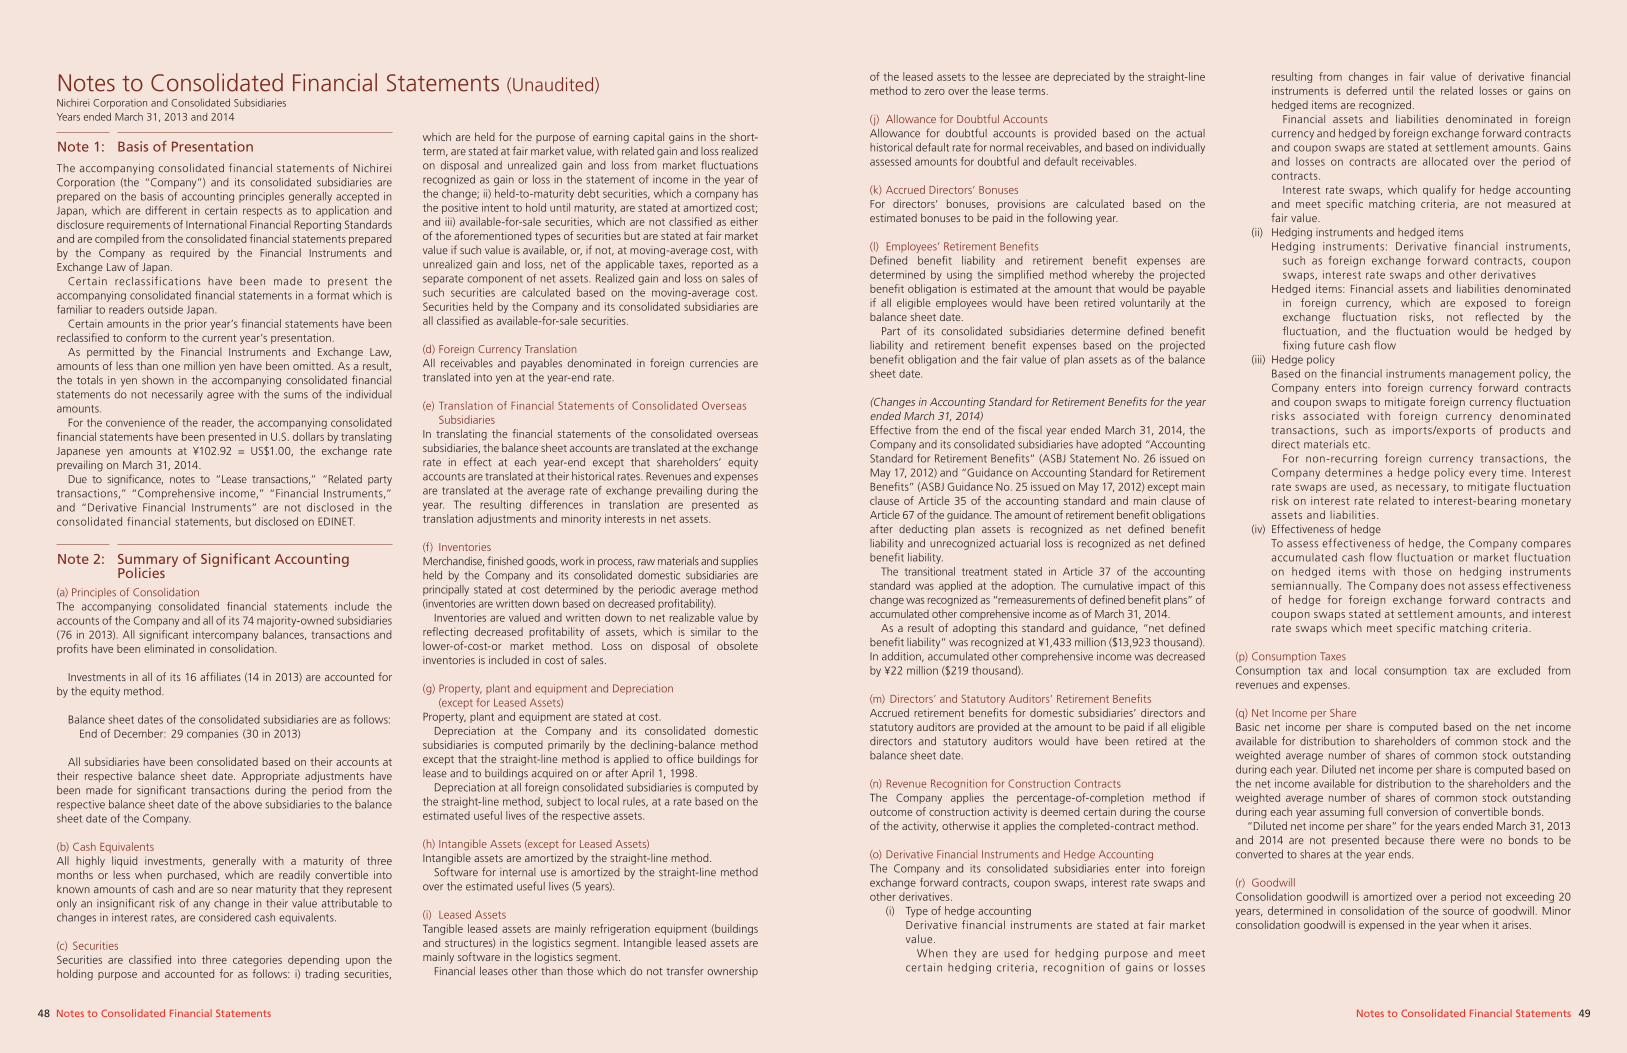
48 49Notes to Consolidated Financial Statements Notes to Consolidated Financial Statements
The accompanying consolidated financial statements of Nichirei Corporation (the “Company”) and its consolidated subsidiaries are prepared on the basis of accounting principles generally accepted in Japan, which are different in certain respects as to application and disclosure requirements of International Financial Reporting Standards and are compiled from the consolidated financial statements prepared by the Company as required by the Financial Instruments and Exchange Law of Japan.
Certain reclassifications have been made to present the accompanying consolidated financial statements in a format which is familiar to readers outside Japan.
Certain amounts in the prior year’s financial statements have been reclassified to conform to the current year’s presentation.
As permitted by the Financial Instruments and Exchange Law, amounts of less than one million yen have been omitted. As a result, the totals in yen shown in the accompanying consolidated financial statements do not necessarily agree with the sums of the individual amounts.
For the convenience of the reader, the accompanying consolidated financial statements have been presented in U.S. dollars by translating Japanese yen amounts at ¥102.92 = US$1.00, the exchange rate prevailing on March 31, 2014.
Due to significance, notes to “Lease transactions,” “Related party transactions,” “Comprehensive income,” “Financial Instruments,” and “Derivative Financial Instruments” are not disclosed in the consolidated financial statements, but disclosed on EDINET.
(a) Principles of ConsolidationThe accompanying consolidated financial statements include the accounts of the Company and all of its 74 majority-owned subsidiaries (76 in 2013). All significant intercompany balances, transactions and profits have been eliminated in consolidation.
Investments in all of its 16 affiliates (14 in 2013) are accounted for by the equity method.
Balance sheet dates of the consolidated subsidiaries are as follows:End of December: 29 companies (30 in 2013)
All subsidiaries have been consolidated based on their accounts at their respective balance sheet date. Appropriate adjustments have been made for significant transactions during the period from the respective balance sheet date of the above subsidiaries to the balance sheet date of the Company.
(b) Cash EquivalentsAll highly liquid investments, generally with a maturity of three months or less when purchased, which are readily convertible into known amounts of cash and are so near maturity that they represent only an insignificant risk of any change in their value attributable to changes in interest rates, are considered cash equivalents.
(c) SecuritiesSecurities are classified into three categories depending upon the holding purpose and accounted for as follows: i) trading securities,
which are held for the purpose of earning capital gains in the short-term, are stated at fair market value, with related gain and loss realized on disposal and unrealized gain and loss from market fluctuations recognized as gain or loss in the statement of income in the year of the change; ii) held-to-maturity debt securities, which a company has the positive intent to hold until maturity, are stated at amortized cost; and iii) available-for-sale securities, which are not classified as either of the aforementioned types of securities but are stated at fair market value if such value is available, or, if not, at moving-average cost, with unrealized gain and loss, net of the applicable taxes, reported as a separate component of net assets. Realized gain and loss on sales of such securities are calculated based on the moving-average cost. Securities held by the Company and its consolidated subsidiaries are all classified as available-for-sale securities.
(d) Foreign Currency TranslationAll receivables and payables denominated in foreign currencies are translated into yen at the year-end rate.
(e) Translation of Financial Statements of Consolidated Overseas SubsidiariesIn translating the financial statements of the consolidated overseas subsidiaries, the balance sheet accounts are translated at the exchange rate in effect at each year-end except that shareholders’ equity accounts are translated at their historical rates. Revenues and expenses are translated at the average rate of exchange prevailing during the year. The resulting differences in translation are presented as translation adjustments and minority interests in net assets.
(f) InventoriesMerchandise, finished goods, work in process, raw materials and supplies held by the Company and its consolidated domestic subsidiaries are principally stated at cost determined by the periodic average method (inventories are written down based on decreased profitability).
Inventories are valued and written down to net realizable value by reflecting decreased profitability of assets, which is similar to the lower-of-cost-or market method. Loss on disposal of obsolete inventories is included in cost of sales.
(g) Property, plant and equipment and Depreciation (except for Leased Assets)Property, plant and equipment are stated at cost.
Depreciation at the Company and its consolidated domestic subsidiaries is computed primarily by the declining-balance method except that the straight-line method is applied to office buildings for lease and to buildings acquired on or after April 1, 1998.
Depreciation at all foreign consolidated subsidiaries is computed by the straight-line method, subject to local rules, at a rate based on the estimated useful lives of the respective assets.
(h) Intangible Assets (except for Leased Assets)Intangible assets are amortized by the straight-line method.
Software for internal use is amortized by the straight-line method over the estimated useful lives (5 years).
(i) Leased AssetsTangible leased assets are mainly refrigeration equipment (buildings and structures) in the logistics segment. Intangible leased assets are mainly software in the logistics segment.
Financial leases other than those which do not transfer ownership
of the leased assets to the lessee are depreciated by the straight-line method to zero over the lease terms.
(j) Allowance for Doubtful AccountsAllowance for doubtful accounts is provided based on the actual historical default rate for normal receivables, and based on individually assessed amounts for doubtful and default receivables.
(k) Accrued Directors’ BonusesFor directors’ bonuses, provisions are calculated based on the estimated bonuses to be paid in the following year.
(l) Employees’ Retirement BenefitsDefined benefit liability and retirement benefit expenses are determined by using the simplified method whereby the projected benefit obligation is estimated at the amount that would be payable if all eligible employees would have been retired voluntarily at the balance sheet date.
Part of its consolidated subsidiaries determine defined benefit liability and retirement benefit expenses based on the projected benefit obligation and the fair value of plan assets as of the balance sheet date.
(Changes in Accounting Standard for Retirement Benefits for the year ended March 31, 2014)Effective from the end of the fiscal year ended March 31, 2014, the Company and its consolidated subsidiaries have adopted “Accounting Standard for Retirement Benefits” (ASBJ Statement No. 26 issued on May 17, 2012) and “Guidance on Accounting Standard for Retirement Benefits” (ASBJ Guidance No. 25 issued on May 17, 2012) except main clause of Article 35 of the accounting standard and main clause of Article 67 of the guidance. The amount of retirement benefit obligations after deducting plan assets is recognized as net defined benefit liability and unrecognized actuarial loss is recognized as net defined benefit liability.
The transitional treatment stated in Article 37 of the accounting standard was applied at the adoption. The cumulative impact of this change was recognized as “remeasurements of defined benefit plans” of accumulated other comprehensive income as of March 31, 2014.
As a result of adopting this standard and guidance, “net defined benefit liability” was recognized at ¥1,433 million ($13,923 thousand). In addition, accumulated other comprehensive income was decreased by ¥22 million ($219 thousand).
(m) Directors’ and Statutory Auditors’ Retirement BenefitsAccrued retirement benefits for domestic subsidiaries’ directors and statutory auditors are provided at the amount to be paid if all eligible directors and statutory auditors would have been retired at the balance sheet date.
(n) Revenue Recognition for Construction ContractsThe Company applies the percentage-of-completion method if outcome of construction activity is deemed certain during the course of the activity, otherwise it applies the completed-contract method.
(o) Derivative Financial Instruments and Hedge AccountingThe Company and its consolidated subsidiaries enter into foreign exchange forward contracts, coupon swaps, interest rate swaps and other derivatives.
(i) Type of hedge accountingDerivative financial instruments are stated at fair market value.
When they are used for hedging purpose and meet certain hedging criteria, recognition of gains or losses
resulting from changes in fair value of derivative financial instruments is deferred until the related losses or gains on hedged items are recognized.
Financial assets and liabilities denominated in foreign currency and hedged by foreign exchange forward contracts and coupon swaps are stated at settlement amounts. Gains and losses on contracts are allocated over the period of contracts.
Interest rate swaps, which qualify for hedge accounting and meet specific matching criteria, are not measured at fair value.
(ii) Hedging instruments and hedged itemsHedging instruments: Derivative financial instruments,
such as foreign exchange forward contracts, coupon swaps, interest rate swaps and other derivatives
Hedged items: Financial assets and liabilities denominated in foreign currency, which are exposed to foreign exchange fluctuation risks, not reflected by the fluctuation, and the fluctuation would be hedged by fixing future cash flow
(iii) Hedge policyBased on the financial instruments management policy, the Company enters into foreign currency forward contracts and coupon swaps to mitigate foreign currency fluctuation risks associated with foreign currency denominated transactions, such as imports/exports of products and direct materials etc.
For non-recurring foreign currency transactions, the Company determines a hedge policy every time. Interest rate swaps are used, as necessary, to mitigate fluctuation risk on interest rate related to interest-bearing monetary assets and liabilities.
(iv) Effectiveness of hedgeTo assess effectiveness of hedge, the Company compares accumulated cash flow fluctuation or market fluctuation on hedged items with those on hedging instruments semiannually. The Company does not assess effectiveness of hedge for foreign exchange forward contracts and coupon swaps stated at settlement amounts, and interest rate swaps which meet specific matching criteria.
(p) Consumption TaxesConsumption tax and local consumption tax are excluded from revenues and expenses.
(q) Net Income per ShareBasic net income per share is computed based on the net income available for distribution to shareholders of common stock and the weighted average number of shares of common stock outstanding during each year. Diluted net income per share is computed based on the net income available for distribution to the shareholders and the weighted average number of shares of common stock outstanding during each year assuming full conversion of convertible bonds.
“Diluted net income per share” for the years ended March 31, 2013 and 2014 are not presented because there were no bonds to be converted to shares at the year ends.
(r) GoodwillConsolidation goodwill is amortized over a period not exceeding 20 years, determined in consolidation of the source of goodwill. Minor consolidation goodwill is expensed in the year when it arises.
Notes to Consolidated Financial Statements (Unaudited)
Note 1: Basis of Presentation
Note 2: Summary of Significant Accounting Policies
Nichirei Corporation and Consolidated SubsidiariesYears ended March 31, 2013 and 2014
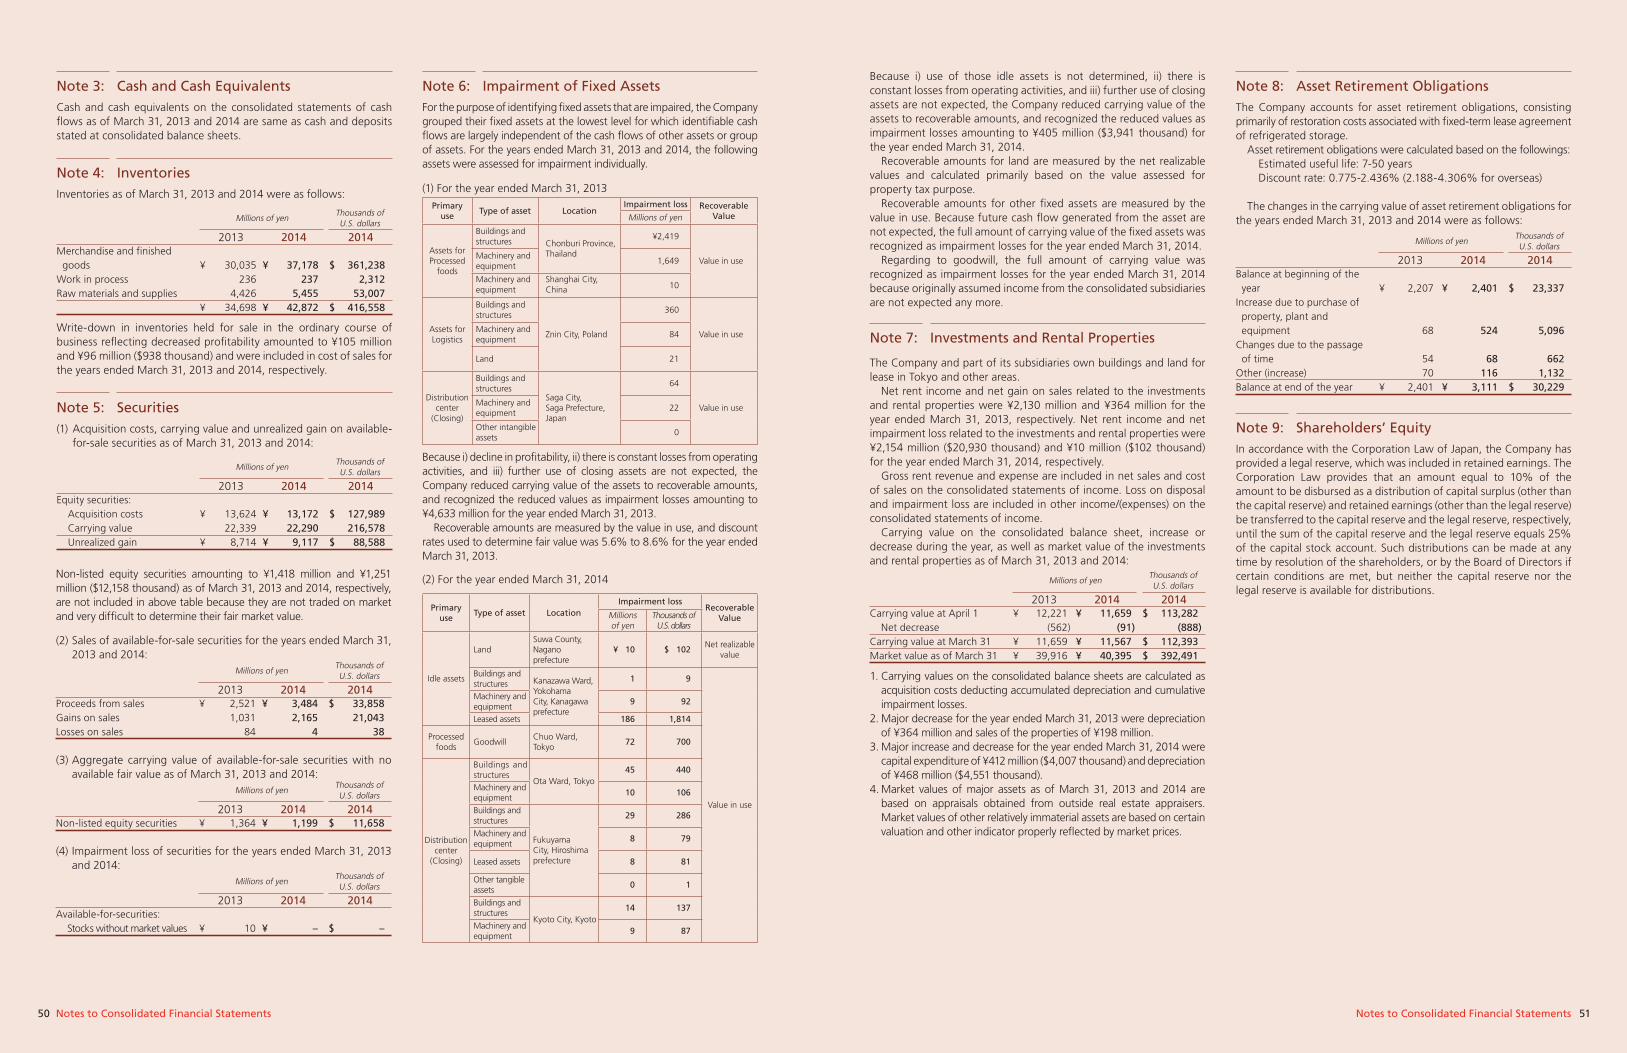
50 51Notes to Consolidated Financial Statements Notes to Consolidated Financial Statements
(1) For the year ended March 31, 2013
(2) For the year ended March 31, 2014
(4) Impairment loss of securities for the years ended March 31, 2013 and 2014:
For the purpose of identifying fixed assets that are impaired, the Company grouped their fixed assets at the lowest level for which identifiable cash flows are largely independent of the cash flows of other assets or group of assets. For the years ended March 31, 2013 and 2014, the following assets were assessed for impairment individually.
Because i) decline in profitability, ii) there is constant losses from operating activities, and iii) further use of closing assets are not expected, the Company reduced carrying value of the assets to recoverable amounts, and recognized the reduced values as impairment losses amounting to ¥4,633 million for the year ended March 31, 2013.
Recoverable amounts are measured by the value in use, and discount rates used to determine fair value was 5.6% to 8.6% for the year ended March 31, 2013.
Note 6: Impairment of Fixed Assets
Available-for-securities: Stocks without market values ¥ 10 ¥ – $ –
Thousands of U.S. dollars
2013 2014 2014
Millions of yen
In accordance with the Corporation Law of Japan, the Company has provided a legal reserve, which was included in retained earnings. The Corporation Law provides that an amount equal to 10% of the amount to be disbursed as a distribution of capital surplus (other than the capital reserve) and retained earnings (other than the legal reserve) be transferred to the capital reserve and the legal reserve, respectively, until the sum of the capital reserve and the legal reserve equals 25% of the capital stock account. Such distributions can be made at any time by resolution of the shareholders, or by the Board of Directors if certain conditions are met, but neither the capital reserve nor the legal reserve is available for distributions.
Note 9:
The Company accounts for asset retirement obligations, consisting primarily of restoration costs associated with fixed-term lease agreement of refrigerated storage.
Asset retirement obligations were calculated based on the followings: Estimated useful life: 7-50 yearsDiscount rate: 0.775-2.436% (2.188-4.306% for overseas)
The changes in the carrying value of asset retirement obligations for the years ended March 31, 2013 and 2014 were as follows:
Note 8: Asset Retirement Obligations
Shareholders’ Equity
Balance at beginning of the year Increase due to purchase of property, plant and equipmentChanges due to the passage of timeOther (increase)Balance at end of the year
¥ 2,207
68
54 70¥ 2,401
¥ 2,401
524
68 116¥ 3,111
$ 23,337
5,096
662 1,132$ 30,229
Thousands of U.S. dollars
2013 2014 2014
Millions of yen
1. Carrying values on the consolidated balance sheets are calculated as acquisition costs deducting accumulated depreciation and cumulative impairment losses.
2. Major decrease for the year ended March 31, 2013 were depreciation of ¥364 million and sales of the properties of ¥198 million.
3. Major increase and decrease for the year ended March 31, 2014 were capital expenditure of ¥412 million ($4,007 thousand) and depreciation of ¥468 million ($4,551 thousand).
4. Market values of major assets as of March 31, 2013 and 2014 are based on appraisals obtained from outside real estate appraisers. Market values of other relatively immaterial assets are based on certain valuation and other indicator properly reflected by market prices.
The Company and part of its subsidiaries own buildings and land for lease in Tokyo and other areas.
Net rent income and net gain on sales related to the investments and rental properties were ¥2,130 million and ¥364 million for the year ended March 31, 2013, respectively. Net rent income and net impairment loss related to the investments and rental properties were ¥2,154 million ($20,930 thousand) and ¥10 million ($102 thousand) for the year ended March 31, 2014, respectively.
Gross rent revenue and expense are included in net sales and cost of sales on the consolidated statements of income. Loss on disposal and impairment loss are included in other income/(expenses) on the consolidated statements of income.
Carrying value on the consolidated balance sheet, increase or decrease during the year, as well as market value of the investments and rental properties as of March 31, 2013 and 2014:
Because i) use of those idle assets is not determined, ii) there is constant losses from operating activities, and iii) further use of closing assets are not expected, the Company reduced carrying value of the assets to recoverable amounts, and recognized the reduced values as impairment losses amounting to ¥405 million ($3,941 thousand) for the year ended March 31, 2014.
Recoverable amounts for land are measured by the net realizable values and calculated primarily based on the value assessed for property tax purpose.
Recoverable amounts for other fixed assets are measured by the value in use. Because future cash flow generated from the asset are not expected, the full amount of carrying value of the fixed assets was recognized as impairment losses for the year ended March 31, 2014.
Regarding to goodwill, the full amount of carrying value was recognized as impairment losses for the year ended March 31, 2014 because originally assumed income from the consolidated subsidiaries are not expected any more.
Note 7: Investments and Rental Properties
Carrying value at April 1 Net decreaseCarrying value at March 31Market value as of March 31
¥ 12,221 (562)¥ 11,659¥ 39,916
¥ 11,659 (91)¥ 11,567 ¥ 40,395
$ 113,282 (888)$ 112,393 $ 392,491
Thousands of U.S. dollars
2013 2014 2014
Millions of yen
(2) Sales of available-for-sale securities for the years ended March 31, 2013 and 2014:
Non-listed equity securities amounting to ¥1,418 million and ¥1,251 million ($12,158 thousand) as of March 31, 2013 and 2014, respectively, are not included in above table because they are not traded on market and very difficult to determine their fair market value.
Proceeds from salesGains on salesLosses on sales
¥ 2,521 1,031 84
¥ 3,484 2,165 4
$ 33,858 21,043 38
Thousands of U.S. dollars
2013 2014 2014
Millions of yen
Cash and cash equivalents on the consolidated statements of cash flows as of March 31, 2013 and 2014 are same as cash and deposits stated at consolidated balance sheets.
Note 3: Cash and Cash Equivalents
Write-down in inventories held for sale in the ordinary course of business reflecting decreased profitability amounted to ¥105 million and ¥96 million ($938 thousand) and were included in cost of sales for the years ended March 31, 2013 and 2014, respectively.
Inventories as of March 31, 2013 and 2014 were as follows:
Note 4: Inventories
Merchandise and finished goodsWork in processRaw materials and supplies
¥ 30,035 236 4,426 ¥ 34,698
¥ 37,178 237 5,455 ¥ 42,872
$ 361,238 2,312 53,007 $ 416,558
Thousands of U.S. dollars
2013 2014 2014
Millions of yen
(1) Acquisition costs, carrying value and unrealized gain on available-for-sale securities as of March 31, 2013 and 2014:
Note 5: Securities
Equity securities: Acquisition costs Carrying value Unrealized gain
¥ 13,624 22,339¥ 8,714
¥ 13,172 22,290¥ 9,117
$ 127,989 216,578$ 88,588
Thousands of U.S. dollars
2013 2014 2014
Millions of yen
(3) Aggregate carrying value of available-for-sale securities with no available fair value as of March 31, 2013 and 2014:
Non-listed equity securities ¥ 1,364 ¥ 1,199 $ 11,658
Thousands of U.S. dollars
2013 2014 2014
Millions of yen
Primary use
Type of asset LocationImpairment loss Recoverable
ValueMillions of yen
Assets for Processed
foods
Buildings and structures Chonburi Province,
Thailand
¥2,419
Value in useMachinery and equipment
1,649
Machinery and equipment
Shanghai City,China 10
Assets for Logistics
Buildings and structures
Znin City, Poland
360
Value in useMachinery and equipment
84
Land 21
Distribution center
(Closing)
Buildings and structures
Saga City,Saga Prefecture, Japan
64
Value in useMachinery and equipment
22
Other intangible assets
0
Primary use
Type of asset LocationImpairment loss
Recoverable ValueMillions
of yenThousands of
U.S. dollars
Idle assets
LandSuwa County,Nagano prefecture
¥ 10 $ 102Net realizable
value
Buildings and structures Kanazawa Ward,
Yokohama City, Kanagawa prefecture
1 9
Value in use
Machinery and equipment
9 92
Leased assets 186 1,814
Processed foods
GoodwillChuo Ward, Tokyo
72 700
Distribution center
(Closing)
Buildings and structures
Ota Ward, Tokyo45 440
Machinery and equipment
10 106
Buildings and structures
Fukuyama City, Hiroshima prefecture
29 286
Machinery and equipment
8 79
Leased assets 8 81
Other tangible assets
0 1
Buildings and structures
Kyoto City, Kyoto 14 137
Machinery and equipment
9 87
52 53Notes to Consolidated Financial Statements Notes to Consolidated Financial Statements
(Reasons for changes)The increases in the number of shares resulted from the following: ・Request for redemption of odd-lot stock 57,343 sharesThe decrease in the number of shares resulted from the following: ・Request for additional purchase of odd-lot stock 3,504 shares
(2) Cash dividends distributedDividends paid during the year ended March 31, 2014
Dividends of which the record date falls in the current fiscal year but the effective date falls in the following fiscal year
Other income/(expenses)–Other, net for the years ended March 31, 2013 and 2014 consisted primarily of the following:
The Company and its consolidated subsidiaries are subject to a number of taxes based on income which, in the aggregate, resulted in a statutory tax rate of approximately 38.0% for the years ended March 31, 2013 and 2014. The effective tax rates reflected in the accompanying consolidated statements of income differ from the statutory tax rate for the following reasons:
Note 11:
Note 12:
Other Income/(Expenses)
Income Taxes
Gain on sales of property, plant and equipmentGain on sales of investment securitiesGain on transfer of businessLoss on sales and disposal of property, plant and equipmentImpairment loss on fixed assetsLoss on discontinued operationsEquity in earnings/(losses) of affiliatesOther, net
¥ 464
1,031 194
(399) (4,633) (258)
224 (90) ¥ (3,468)
¥ 181
2,165 –
(937) (405) (89)
(795) (315)¥ (196)
$ 1,763
21,043 –
(9,112) (3,941) (869) (7,725) (3,068)$ (1,910)
Thousands of U.S. dollars
2013 2014 2014
Millions of yen
Statutory tax rateEntertainment and other non-deductible expenses Dividends exempted for income tax purposeInhabitant per capita taxesChange in valuation allowanceTax rate differences of oversea affiliatesTax credit for research and development expensesEquity in earnings of affiliates accounted for by the equity methodUndistributed earnings of overseas affiliatesDeferred tax assets reduced amount due to the changes in tax rateOther, netEffective tax rate
38.0%
2.0 (1.3) 1.0 5.1 (2.2) (1.2)
(0.6) 0.2
– (0.7) 40.4%
38.0%
1.7 (2.1) 0.9 (5.0) (2.6)
(1.0)
2.0 0.7
0.5 2.6 35.7%
2013 2014
Deferred tax assets–current:Net operating loss carry forwardsAccrued employees’ bonus Unpaid transferring cash for defined contribution pension plan Accrued enterprise taxesOther Sub-TotalLess valuation allowanceTotalNet of deferred tax liabilities–current Total net deferred tax assets–current
Deferred tax liabilities–current :Net deferred gain on hedgesOtherTotalNet of deferred tax assets–current Total net deferred tax liabilities–current Deferred tax assets–noncurrent:Net operating loss carry forwardsAsset retirement obligationsImpairment loss on fixed assetsAccrued employees’ retirement benefitsNet defined benefit liabilityLoss on valuation of investment securitiesUnrealized gain/loss on fixed assetsDepreciationUnrealized gain/loss on asset transferImpact of applying the accounting standard for lease transactionsUnpaid transferring cash for defined contribution pension plan OtherSub-TotalLess valuation allowanceTotalNet of deferred tax liabilities– noncurrentTotal net deferred tax assets– noncurrent
Deferred tax liabilities–noncurrent:Net unrealized holding gain on available-for-sale securitiesReserve and special reserve for advanced depreciation of property, plant and equipmentFixed assets regarding to asset retirement obligationsUndistributed profitUnrealized gain/loss on asset transferInvestment securities received due to cancel of retirement benefit trustOther, netTotalNet of deferred tax assets– noncurrentTotal net deferred tax liabilities– noncurrent
¥ 39 781
251 296 331 1,699 (122) 1,577 (19) 1,558
(50) (0) (51) 19 (32)
1,742 704 883
677 –
910 490 363
403
370
249 615 7,412 (3,874) 3,538
(2,412)
¥ 1,126
¥ (2,748)
(1,752)
(408) (247) (162)
(124) (432) (5,877)
2,412
¥ (3,465)
¥ 307 292
229 188 396 1,415 (2) 1,412 (281) 1,131
(266) (15) (281) 281 (0)
1,500 1,051 814
– 704
686 565 375
364
272
– 598 6,934 (3,367) 3,566
(2,514)
¥ 1,052
¥ (2,835)
(1,696)
(603) (348) (162)
(100) (691) (6,437)
2,514
¥ (3,923)
$ 2,987 2,844
2,231 1,832 3,855 13,751 (25) 13,725 (2,734) 10,991
(2,588) (146) (2,734) 2,734 (0)
14,583 10,221 7,911
– 6,843
6,667 5,498 3,644
3,540
2,643
– 5,819 67,373 (32,716) 34,656
(24,428)
$ 10,228
$ (27,548)
(16,478)
(5,859) (3,382) (1,579)
(979) (6,719) (62,546)
24,428
$ (38,117)
Thousands of U.S. dollars
2013 2014 2014
Millions of yen
The components of deferred tax assets and deferred tax liabilities as of March 31, 2013 and 2014 were as follows:
As of March 31, 2013 and 2014, the Company and its consolidated subsidiaries had the following contingent liabilities:
Research and development expenses charged to selling, general and administrative expenses for the years ended March 31, 2013 and 2014 were ¥1,817 million and ¥1,607 million ($15,618 thousand), respectively.
The Company and part of its consolidated domestic subsidiaries have a defined contribution pension plan, a prepaid retirement plan and a lump-sum severance benefit plan, and another part of its consolidated subsidiaries have a lump-sum severance benefit plan or a defined benefit pension plan. On occasion, the Company may also provide programs that entitle employees to additional supplemental benefits as an early retirement incentive that is not subject to actuarial calculations under the accounting standard for retirement benefit.
For changes in accounting standard for retirement benefits for the year ended March 31, 2014, please refer to above Note 2 (l) Employees’ retirement benefits.
(1) For the year ended March 31, 2013(a) Funded and accrued status of the plans, and the amounts recognized in
the consolidated balance sheet for employees’ retirement benefits as of March 31, 2013:
(Changes in tax rates used to determine deferred tax assets and liabilities for the year ended March 31, 2014)Following the promulgation on March 31, 2014 of the “Act on the Partial Revision of the Income Tax Act (Act No. 10 of 2014)”, Special Income Tax for Reconstruction has been abolished from the fiscal years beginning on or after April 1, 2014. In line with these changes, the effective statutory tax rate used to measure deferred tax assets and liabilities will be changed from 38.0% to 35.6% for temporary differences expected to be reversed in the fiscal years beginning on or after April 1, 2014. As a result of this change, deferred tax assets in the consolidated balance sheet decreased by ¥65 million ($637 thousand) and income taxes deferred and net deferred gain/(loss) on hedges in the consolidated statement of income increased by ¥82 million ($805 thousand) and ¥17 million ($168 thousand), respectively.
(*) Part of its consolidated subsidiaries determines the projected benefit obligation using the simplified method.
(b) Components of retirement benefit expenses for the year ended March 31, 2013:
(c) Actuarial assumptions used for the year ended March 31, 2013: Since part of its consolidated subsidiaries determine the projected benefit
obligation by using the simplified method, no actuarial assumptions are used.
Note 13:
Note 14:
Note 15:
Contingent Liabilities
Research and Development Expenses
Retirement Benefit Plans
As guarantor of indebtedness of affiliatesAs guarantor of indebtedness of employeesAs guarantor of indebtedness of other Total
¥ 105
34
1¥ 141
¥ 121
28
–¥ 149
$ 1,179
274
–$ 1,453
Thousands of U.S. dollars
2013 2014 2014
Millions of yen
(b) For the year ended March 31, 2014
Projected retirement benefit obligation (*)Fair value of plan assets Unrecognized actuarial lossPrepaid pension costAccrued employees’ retirement benefits
Service costInterest costExpected return on plan assetsOtherRetirement benefits expenses
¥ 2,544 (1,086) (106) 65¥ 1,416
¥ 634 20 19 1,232¥ 1,906
Millions of yen
Millions of yen
2013
2013
(1) Types and number of outstanding shares and of treasury stock(a) For the year ended March 31, 2013
(Reasons for changes)(*1) Issued stock: The decrease in the number of shares resulted from retirement of treasury stock.(*2) Treasury stockThe increases in the number of shares resulted from the following: ・Acquisition by market transaction 8,843,000 shares・Request for redemption of odd-lot stock 42,283 shares・Number of shares of treasury stock issued by the Company acquired
by affiliates, adjusted for the Company’s share in equity of the affiliates 1 share
The decrease in the number of shares resulted from the following: ・Request for additional purchase of odd-lot stock 2,115 shares・Number of shares of treasury stock owned by affiliate, which was
eliminated from application of equity method 10,676 shares・Retirement of treasury stock 15,000,000 shares
Note 10: Changes in Net Assets
Type of stockAs of April 1,
2012 Increases DecreasesAs of March 31,
2013
Issued stock: (*1)Common stock 310,851,065 – 15,000,000 295,851,065
Treasury stock: (*2)Common stock 16,064,941 8,885,284 15,012,791 9,937,434
Type of stockAs of April 1,
2013 Increases DecreasesAs of March 31,
2014
Issued stock:Common stock 295,851,065 – – 295,851,065
Treasury stock:Common stock 9,937,434 57,343 3,504 9,991,273
(Number of shares)
(Number of shares)
ResolutionType of stock
Total dividends(Millions of yen
and Thousands of U.S. dollars)
Dividend per share
(Yen and U.S. dollars)
Recorddate
Effective date
General shareholders’meeting onJune 25, 2013
Commonstock
¥ 1,429$ 13,890
¥ 5$ 0.04
March 31, 2013
June 26, 2013
Directors’ meeting on October 29, 2013
Commonstock
¥ 1,429$ 13,889
¥ 5$ 0.04
September 30, 2013
December 5, 2013
ResolutionType of stock
Source of
dividends
Total dividends
(Millions of yen and Thousands of U.S. dollars)
Dividend per share
(Yen and U.S. dollars)
Recorddate
Effective date
General shareholders’ meeting on June 25, 2014
Commonstock
Retained earnings
¥ 1,429$ 13,887
¥ 5$ 0.04
March 31, 2014
June 26, 2014
54 55Notes to Consolidated Financial Statements Notes to Consolidated Financial Statements
Net defined benefit liability at beginning of the yearRetirement benefits expensesRetirement benefits paidContribution to the retirement benefit plansActuarial gain/loss arising during the yearOtherNet defined benefit liability at end of the year
¥ 1,351 179 (126) (96) 30 (42)¥ 1,295
$ 13,127 1,743 (1,231) (936) 293 (408)$ 12,587
Thousands of U.S. dollars
2014 2014
Millions of yen
(*) Defined benefit liability and defined benefit asset were netted in above table.
(b) The reconciliation of retirement benefit obligation, plan assets and net defined benefit liability and assets in the consolidated balance sheet as of March 31, 2014:
Net income per share for the years ended March 31, 2013 and 2014 are calculated based on the following:
(1) General information about reportable segmentsReportable segments are components of the Company and its consolidated subsidiaries for which separate financial information is available and whose operating results are regularly reviewed by the board of directors to make decisions about resources to be allocated to the segments and assess their performance. Reportable segments are determined by product and service as “Processed foods,” “Marine products,” “Meat and poultry products,” “Logistics,” and “Real estate.”
General information about the segments is as follows.(a) Processed foods: Production, processing and sales of
frozen cooked foods, agricultural processed foods, retort-pouch foods, wellness foods, acerola and packed ice
(b) Marine products: Processing and sales of marine products(c) Meat and poultry products: Processing and sales of meat
and poultry products, and breeding and sales of food chicken
(d) Logistics: Providing distribution/transportation service and distribution center function, logistics consulting, providing storage service, production and sales of ice, and construction work and planning
(e) Real estate: Leasing of office buildings and parking lot, management of real estate, and sales of housing land.
(2) The basis of measurement for sales, profit or loss, assets, liabilities and other items of reportable segmentsAccounting policies and methods used at operating segments are the same as those applied to the Company described on Note 2. Profit or loss of reportable segments is equal to operating income on the consolidated statements of income. Intercompany sales and transfers are based on third-party transaction prices.
(3) Sales, profit or loss, assets, liabilities and other items by reportable segment for the years ended March 31, 2013 and 2014 were summarized as follows:
Note 17: Segment Information
Net incomeNet income attributable to common stockAmounts not attributable to common shareholders Average number of common stock during the fiscal year (in thousand)
¥ 9,823
9,823
–
294,091
¥ 8,898
8,898
–
285,889
$ 86,457
86,457
–
Thousands of U.S. dollars
2013 2014 2014
Millions of yen
Retirement benefit obligation of funded plansPlan assets
Retirement benefit obligation of unfunded plansNet amount of liabilities after deducting assets in the consolidated balance sheetsNet defined benefit liabilityNet defined benefit asset (*)Net amount of liabilities after deducting assets in the consolidated balance sheets
¥ 900 (788) 112
1,183
1,295 1,433 (137)
¥ 1,295
$ 8,750 (7,657) 1,092
11,494
12,587 13,923 (1,336)
$ 12,587
Thousands of U.S. dollars
2014 2014
Millions of yen
(*) Net defined benefit asset was included in Investments and other assets, “other”.
(c) Defined contribution pension plan for the year ended March 31, 2014:
Cash for defined contribution pension plan for the Company and its consolidated subsidiaries which includes Small and Medium Enterprises Retirement Allowance Mutual Aid was ¥1,722 million ($16,736 thousand).
Net assets per share as of March 31, 2013 and 2014 are calculated based on the following:
Note 16: Per Share Information
Net assetsNet assets attributable to common stockAmounts excluded from net assets: Minority interestNumber of common stock used for the calculation of net assets per share (in thousand)
¥ 125,320
123,077
2,243
285,913
¥ 136,846
133,298
3,548
285,859
$ 1,329,643
1,295,168
34,475
Thousands of U.S. dollars
2013 2014 2014
Millions of yen
Year ended March 31, 2013 (Millions of yen)
Year ended March 31, 2014 (Millions of yen)
Year ended March 31, 2014 (Thousands of U.S. dollars )
Reportable segment
Reportable segment
Reportable segment
Sales:External salesIntercompany sales and transfers TotalSegment profitSegment assetsOther items:Depreciation Amortization of goodwill Investments in equity method investeesIncrease in property, plant and equipment and intangible assetsOutstanding balance of goodwillImpairment loss on fixed assets
Sales:External salesIntercompany sales and transfers TotalSegment profitSegment assetsOther items:Depreciation Amortization of goodwill Investments in equity method investeesIncrease in property, plant and equipment and intangible assetsOutstanding balance of goodwillImpairment loss on fixed assets
Sales:External salesIntercompany sales and transfers TotalSegment profitSegment assetsOther items:Depreciation Amortization of goodwill Investments in equity method investeesIncrease in property, plant and equipment and intangible assetsOutstanding balance of goodwillImpairment loss on fixed assets
Consolidated
Consolidated
Consolidated
¥ 470,126
– 470,126 17,932 297,903
14,302 165
3,172
13,930
2,660
¥ 4,633
¥ 511,189
– 511,189 15,789 318,507 14,475 209
3,033
24,777
3,030
¥ 405
$ 4,966,865
– 4,966,865 153,416 3,094,708
140,644 2,031
29,473
240,747
29,443
$ 3,941
Adjustment
Adjustment
Adjustment
¥ –
(19,968) (19,968) 26 18,901
552 –
929
659
–
¥ –
¥ –
(19,090) (19,090) 137 15,311
581 –
1,050
637
–
¥ –
$ –
(185,491) (185,491) 1,337 148,771
5,651 –
10,205
6,194
–
$ –
Total
Total
Total
¥ 470,126
19,968 490,094 17,905 279,001
13,750 165
2,243
13,270
2,660
¥ 4,633
¥ 511,189
19,090 530,280 15,651 303,195
13,893 209
1,983
24,140
3,030
¥ 405
$ 4,966,865
185,491 5,152,356 152,078 2,945,936
134,992 2,031
19,267
234,553
29,443
$ 3,941
Other (*1)
Other (*2)
Other (*2)
¥ 3,026
2,744 5,770 431 3,778
93 –
–
72
–
¥ –
¥ 3,210
493 3,704 400 3,397
75 –
–
125
– ¥ –
$ 31,190
4,799 35,989 3,891 33,010
730 –
–
1,218
–
$ –
Total
Total
Total
¥ 467,099
17,224 484,324 17,474 275,223
13,656 165
2,243
13,198
2,660
¥ 4,633
¥ 507,979
18,596 526,576 15,251 299,798
13,818 209
1,983
24,014
3,030
¥ 405
$ 4,935,675
180,691 5,116,366 148,186 2,912,925
134,262 2,031
19,267
233,334
29,443
$ 3,941
Real estate
Real estate
Real estate
¥ 3,644
1,095 4,740 2,285 17,817
780 –
–
359
–
¥ –
¥ 3,835
1,189 5,025 2,370 17,742
771 –
–
807
–
¥ 197
$ 37,270
11,559 48,830 23,028 172,394
7,499 –
–
7,847
–
$ 1,916
Logistics
Logistics
Logistics
¥ 142,229
14,121 156,350 8,562 131,455
8,784 73
1,426
8,271
1,131
¥ 554
¥ 153,341
15,020 168,361 8,936 139,843
9,026 78
1,035
11,966
1,341
¥ 136
$ 1,489,906
145,945 1,635,851 86,831 1,358,759
87,702 766
10,064
116,270
13,031
$ 1,323
Meat and poultry
products
Meat and poultry
products
Meat and poultry
products
¥ 74,068
1,435 75,504 524 15,835
186 –
166
226
–
¥ –
¥ 78,249
1,863 80,112 127 14,896
202 –
100
393
–
¥ –
$ 760,291
18,105 778,397 1,235 144,741
1,969 –
976
3,827
–
$ –
Marine products
Marine products
Marine products
Processedfoods
Processedfoods
Processedfoods
¥ 63,438
248 63,686 70 24,304
74 –
83
169
–
¥ –
¥ 68,446
201 68,648 419 26,057
92 –
103
111
–
¥ –
$ 665,049
1,958 667,007 4,073 253,183
896 –
1,002
1,087
–
$ –
¥ 183,718
322 184,041 6,030 85,810
3,831 91
567
4,171
1,529
¥ 4,079
¥ 204,106
321 204,427 3,398 101,257
3,725 130
743
10,734
1,689
¥ 72
$ 1,983,156
3,122 1,986,279 33,017 983,846
36,193 1,265
7,224
104,302
16,412
$ 700
Notes: (*1) “Other” represents operating segments not disclosed as reportable segments, which include production and sales of diagnostic agents, cosmetic materials and cosmetic products, finance,
accounting, human resource and general affairs services, insurance agent, tree planting management and cleaning services related to tree planting for the year ended March 31, 2013.(*2) “Other” represents operating segments not disclosed as reportable segments, which include biosciences business, human resource and payroll related services, tree planting management
and cleaning services related to tree planting for the year ended March 31, 2014.
Part of its consolidated overseas subsidiaries determine the projected benefit obligation by the actuarial calculations, but actuarial assumptions are not disclosed due to insignificance.
(2) For the year ended March 31, 2014(a) The reconciliation of defined benefit liability and defined benefit asset
at beginning and end balances adopted for the simplified method as of March 31, 2014:
About Us Our Strategy Our Governance and Responsibilities Financial Section Data Section
Major Overseas Subsidiaries and Affiliates
Nichirei Foods Inc.Nichirei do Brasil Agricola Ltda.Avenida Governador Agamenon Magalhaes, 4775 Empresarial Thomas Edison, 3 andar, Salas 303/307 Ilha do Leite, Recife/PE - Cep: 50070-160, BrazilTel: 55 (81) 2125-7410Fax: 55 (81) 2125-7411
Nichirei Australia Pty. Ltd.Suite 2, Level 6, South Tower, Chatswood Central, 1-5 Railway Street, Chatswood, NSW 2067, AustraliaTel: 61 (2) 9411-4277Fax: 61 (2) 9411-4077
Nichirei Europe S.A.Holland Office Center III Kruisweg 805B 2132 NG Hoofddorp, The NetherlandsTel: 31 (23) 555-3553Fax: 31 (23) 557-6162
Shandong Nichirei Foods Co., Ltd.No. 60 Huangshan Road, Yantai Economic & Technological Development Zone, Shandong, 264006, ChinaTel: 86 (535) 637-3847Fax: 86 (535) 637-5141
Nichirei Enterprise Management Consulting (Shanghai) Co., Ltd.Block C, Floor 3, Building 6, Kaixuanfang, No.166 Kaixuan Road, Changning District, Shanghai, China 200042Tel: 86 (21) 6209-0800Fax: 86 (21) 6209-0803
Nichirei Corporation Shanghai Ltd.Block C, Floor 3, Building 6, Kaixuanfang, No.166 Kaixuan Road, Changning District, Shanghai, China 200042Tel: 86 (21) 5272-7475Fax: 86 (21) 5272-7468
Surapon Nichirei Foods Co., Ltd.22/5 M004 Theparak Road, Bangpleeyai, Bangplee, Samutprakarn 10540, ThailandTel: 66 (2) 757-4823Fax: 66 (2) 757-5124
GFPT Nichirei (Thailand) Co., Ltd.77 Mu 4, Hang Sung, Nong Yai, ChonBuri 20190 ThailandTel: 66 (3) 893-2900Fax: 66 (3) 893-2999
(As of March 31, 2014)
Head OfficeNichirei Higashi-Ginza Building6-19-20 Tsukiji, Chuo-ku, Tokyo 104-8402 Japan
Corporate Relations:Tel : 81 (3) 3248-2167Fax: 81 (3) 3248-2237
Stock Exchange Listing Tokyo Stock Exchange (Code: 2871)
Common Stock Authorized: 720,000,000 sharesOutstanding: 295,851,065 shares(Treasury shares: 9,991,273 shares)
Number of Shareholders24,373
Shareholder Register AdministratorMizuho Trust & Banking Co., Ltd.Stock Transfer Agency Division
Annual Meeting of ShareholdersThe annual meeting of shareholders is normally held in June each year in Tokyo, Japan
Independent Auditors Ernst & Young Shin Nihon LLC
Overseas Representative Offices
Nichirei Foods Inc.BangkokRoom 1601, Vanit Building, 1126/1 New Petchburi Road, Bangkok 10400, ThailandTel: 66 (2) 253-9921
Ho Chi Minh City61-63a Vo Van Tan St., Rm. 3a 3rd Floor, District 3 Ho Chi Minh City, The Socialist Republic of Vietnam Tel: 84 (8) 3930-8082 Fax: 84 (8) 3930-8053
Website Addresshttp://www.nichirei.co.jp/english/ir/index.html
Established December 1, 1945
Paid-in Capital30,307 million yen
Number of Full-time Employees 12,970 (consolidated)
Composition of Shareholders(Thousands of shares)
Financial Institutions145,458
49.2%
Individuals47,605
16.1%
Securities Companies8,845
3.0%
Other Japanese Companies31,165
10.5%
Foreign Investors52,783
17.8%
Treasury Shares9,991
3.4%
InnovAsian Cuisine Enterprises Inc.18251 B Cascade Avenue South Tukwila, WA 98188, U.S.A. Tel: 1 (425) 251-3706 Fax: 1 (425) 251-1565
Ningbo Haitong Nichirei Foods., Ltd. No. 528 Haitong Road Cixi, Zhejiang P.C.315300, China Tel: 86(574)6303-9988 Fax: 86(574)5899-0173
Nichirei Fresh Inc.Nichirei U.S.A., LLC 2201 6th Avenue, Suite 1350 Seattle, Washington 98121, U.S.A.Tel: 1 (206) 448-7800Fax: 1 (206) 443-5800
Amazonas Industrias Alimenticias S.A.– AMASARod, Arthur Bernardes 7903, KM-14, Bairro Pratinha (Distrito de Icoaraci) Belem-Para-Brasil, CEP: 66816-000 (Caixa Postal: 1121) Tel: 55 (91) 3258-6900 Fax: 55 (91) 3258-6925
Nichirei Logistics Group Inc.Nichirei Holding Holland B.V.Abel Tasmanstraat 1, 3165 AM Rotterdam, The NetherlandsTel: 31 (10) 429-2699Fax: 31 (10) 429-7903
Nichirei Holding Holland B.V. Warszawa OfficeMarynarska Point Phase II, nr lok. 345 ul.Postepu 15C 02-674 Warszawa, PolandTel: 48 (22) 381-6131
Eurofrigo B.V.Abel Tasmanstraat 1, 3165 AM Rotterdam, The NetherlandsTel: 31 (10) 491-3100Fax: 31 (10) 429-3251
Hiwa Rotterdam Port Cold Stores B.V.Vierhavensstraat 20, 3029 BE Rotterdam, The NetherlandsTel: 31 (10) 244-5222Fax: 31 (10) 476-8099
Thermotraffic Holland B.V.Abel Tasmanstraat 1, 3165 AM Rotterdam, The NetherlandsTel: 31 (10) 428-2866Fax: 31 (10) 429-6290
Thermotraffic GmbHIm Industriegelaende 60-66, D-33775, Versmold, GermanyTel: 49 (54) 239-680Fax: 49 (54) 2396-8294
Frigo Logistics Sp. z o.o.ul. Fabryczna 4 88-400, Znin, PolandTel: 48 (52) 303-3600Fax: 48 (52) 303-1179
Transports Godfroy S.A.S27. Rue de L'avenir 14650 Carpiquet, FranceTel: 33 (2) 31-71-13-13Fax: 33 (2) 31-26-75-68
Entrepots Godfroy S.A.S27. Rue de L'avenir 14650 Carpiquet, FranceTel: 33 (2) 31-71-13-16Fax: 33 (2) 31-26-99-40
Shanghai Fresh Line Express Co., Ltd.8 Hao 3509 Nong, Hongmei Nanlu Minhang-qu, ShanghaiTel: 86 (21) 3350-5301Fax: 86 (21) 5463-3273
Nichirei Logistics Group Inc.,Shanghai RepresentativeRm 806 Xiandai Guangchang, 1 Hao Lou, 369 Nong, Xiansialu, Changning-qu, ShanghaiTel: 86 (21) 5155-9909Fax: 86 (21) 5155-9909
Nichirei Fresh Inc.Ho Chi Minh City61-63a Vo Van Tan St., Rm. 3a 3rd Floor, District 3 Ho Chi Minh City, The Socialist Republic of Vietnam Tel: 84 (8) 3930-8051 Fax: 84 (8) 3930-8053
DalianSuite 804, Dalian Asia Pacific Finance Centre, No. 55 Renmin Road, Zhong Shan District, Dalian, Liaoning 116001, ChinaTel: 86 (411) 8210-1569Fax: 86 (411) 8210-1581
BangkokRoom 1601, Vanit Building, 1126/1 New Petchburi Road, Bangkok 10400, ThailandTel: 66 (2) 253-9921Fax: 66 (2) 253-4271
Qingdao6F, 618 Crowne Plaza Qingdao 76 Xiang Gang Zhong Lu, Qingdao, ChinaTel: 86 (532) 8578-1031Fax: 86 (532) 8578-1041
Investor Information
Overseas Network
56 57Overseas NetworkInvestor Information / Overseas Network