contents - · PDF fileMRCMPU Malabar Regional Co-operative Milk Producers ... NRCC National...
85
Contents List of Boxes List of Tables List of Abbreviations Foreword Acknowledgements Executive Summary 1. Introduction 1.1 The Background 1.2 Objectives 1.3 Study Areas 1.4 Approach 1.5 Outline of the Report 2. Theoretical Orientation 2.1 Dimensions of Agricultural Extension 2.2 Public and Private Extension 2.3 Delineation of Roles 2.4 Economic Analysis 2.5 Privatisation 3. Supply of Extension Services 3.1 Types of Organisations 3.2 Performance of Organisations 3.3 Implications 4. Sources of Information 4.1 Preferred Sources of Information 4.2 Level of Satisfaction 4.3 Implications 5. Willingness to pay for Information 5.1 Present Status 5.2 Determinants of Willingnesss to Pay 5.3 Demand for Paid Services 6. Conclusions and Policy Implications 6.1 Why Privatise Extension? 6.2 Public and Private Extension-Present Status 6.3 Options for India References Annexures
Transcript of contents - · PDF fileMRCMPU Malabar Regional Co-operative Milk Producers ... NRCC National...

Contents List of Boxes
List of Tables
List of Abbreviations
Foreword
Acknowledgements
Executive Summary
1. Introduction
1.1 The Background
1.2 Objectives
1.3 Study Areas
1.4 Approach
1.5 Outline of the Report
2. Theoretical Orientation
2.1 Dimensions of Agricultural Extension
2.2 Public and Private Extension
2.3 Delineation of Roles
2.4 Economic Analysis
2.5 Privatisation
3. Supply of Extension Services
3.1 Types of Organisations
3.2 Performance of Organisations
3.3 Implications
4. Sources of Information
4.1 Preferred Sources of Information
4.2 Level of Satisfaction
4.3 Implications
5. Willingness to pay for Information
5.1 Present Status
5.2 Determinants of Willingnesss to Pay
5.3 Demand for Paid Services
6. Conclusions and Policy Implications
6.1 Why Privatise Extension?
6.2 Public and Private Extension-Present Status
6.3 Options for India
References
Annexures

Boxes 1 Economic Analysis
2 Farmers' Education in YCMOU: A new paradigm
3 Extension by Farmers' Associations
4 Extension by Producer's Co-operatives
5 Extension by Research Institutes
6 Extension by Seed Companies
7 Extension by Fertiliser Companies
8 Consultancy Services in Agriculture
9 Extension by Non-Governmental Organisations

Tables 1.1 Key features of the study states
2.1 Distribution of Extension Organisations based on FAO Survey of 113 countries
2.2 Types of private extension providers, their objectives and and target markets
2.3 A variety of experiences with privatisation and commercialisation of extension
3.1 Types of organisations providing extension services in India
3.2 Expenditure, outreach and manpower details of Department of Agriculture (1996-97)
3.3 Extension performance of Department of Agriculture
3.4 Expenditure, outreach and manpower details of Directorate of Extension (SAUs)
3.5 Extension performance of Directorate of Extension (SAUs)
3.6 Expenditure, outreach and manpower details of Krishi Vigyan Kendras
3.7 Extension performance of Krishi Vigyan Kendras
3.8 Expenditure, outreach and manpower details of farmers' associations
3.9 Extension performance of farmers associations
3.10 Expenditure, outreach and manpower details of producers' co-operatives
3.11 Extension performance of producers' co-operatives
3.12 Expenditure, outreach and manpower details of research institutes
3.13 Extension performance of research institutes
3.14 Expenditure, outreach and manpower details of seed companies
3.15 Extension performance of seed companies
3.16 Expenditure, outreach and manpower details of fertiliser companies
3.17 Extension performance of fertiliser companies
3.18 Expenditure, outreach and manpower details of consultancy firms
3.19 Extension performance of consultancy firms
3.20 Expenditure, outreach and manpower details of NGOs
3.21 Extension performance of NGOs
3.22 Expenditure, outreach and manpower details of the Rubber Board
3.23 Extension performance of the Rubber Board
3.24 Expenditure, outreach and manpower details of marketing board
3.25 Extension performance of marketing board

3.26 Expenditure, outreach and manpower details of Farm and Home Unit of AIR
3.27 Circulation of newspapers in the study states
3.28 Expenditure and circulation of farm magazines
3.29 Performance indicators of extension organisations (Average)
4.1 Preferred sources of information in the selected districts of Maharashtra (%)
4.2 Preferred sources of information in the selected districts of Rajasthan (%)
4.3 Preferred sources of information in the selected districts of Kerala (%)
4.4 Level of satisfaction of farmers to their first preferred source of information
5.1 Willingness to pay for agriculture related information (%)
5.2 Coefficients of discriminating variables for willingness to pay for extension across states
5.3 Level of satisfaction/dissatisfaction of farmers to their primary source of information on agriculture
5.4 Type of information or services for which farmers are ready to make payment and the conditions for payment in Maharashtra
5.5 Type of information or services for which farmers are ready to make payment and the conditions for payment in Rajasthan
5.6 Type of information 6r services for which farmers are ready to make payment and the conditions for payment in Kerala
5.7 Crops having high demand for paid services
5.8 Willingness to pay (Rupees)
6.1 Privatising extension- activities and conditions for success
6.2 Priorities for public sector extension

Abbreviations AAO Assistant Agricultural Officer
ADT Agricultural Development Trust, Pune
AIR All India Radio
AO Agricultural Officer
BAIF Bharatiya Agro Industries Federation
BSCLMF Bihar State Co-operative Lac Marketing Federation Ranchi
CADA Command Area Development Agency
CAPART Council for the Advancement of Peoples Action and Technology
CICR Central Institute of Cotton Research, Nagpur
CPCRI Central Plantation Crops Research Institute, Kasar
DAC Department of Agriculture and Co-operation, Minis! Agriculture, Government of India
DoA Department of Agriculture
DoAH Department of Animal Husbandry
DRDA District Rural Development Agency
El Expenditure Intensity
FACT Fertiliser and Chemicals Travancore Limited, Aiwa;
FAO Food and Agriculture Organisation, Rome
FTC Farmers Training Centre
GSSS Gayathri Shiksha Sadan Sansthan, Udaipur
ICAR Indian Council of Agricultural Research
IFFCO Indian Farmers Fertiliser Co-operative Limited
IVLP Institute Village Linkage Programme
KRIBHCO Krishak Bharati Co-operative
KMGA Kerala Mushroom Growers Association
KSK Kisan Seva Kendra
KVK Krishi Vigyan Kendra
LAMPS Large Adivasi Multi Purpose Society
MANAGE National Institute for Agricultural Extension Manage Hyderabad
MILMA Kerala Co-operative Milk Marketing Federation
MDUSS Mithila Dugdh Utpadak Sahkar Sangh Ltd, Samast
MRCMPU Malabar Regional Co-operative Milk Producers Uni Kozhicode

MRDBS Maharashtra Rajya Draksha Bagaitdar Sangh
MSAMB Maharashtra State Agricultural marketing Board
NABARD National bank for Agricultural and Rural Development
NATP National Agricultural Technology Project
NCA Net Cropped Area
NCAP National Centre for Agricultural Economics and Policy Research, New Delhi
NGO Non-Government Organisation
NHB National Horticulture Board
NORAD Norwegian Development Agency
NRCC National Research Centre on Citrus, Nagpur
ODI Overseas Development Institute, London
PEW Para Extension Worker
PRADAN Professional Assistance for Development Action
SAU State Agricultural University
SMS Subject Matter Specialist
SPRI Social Policy Research Institute, Jaipur
T&V Training and Visit (Extension)
VEGFED Chottanagpur Adivasi Co-operative Vegetable Marketing Federation, Ranchi
VEW Village Extension Worker
YCMOU Yashwantrao Chavan Maharashtra Open University, Nashik
ZRS Zonal Research Station
Foreword The role of extension systems in transferring technologies to farmers has been fairly well acknowledged. Improving its performance continues to be a challenge, though the country has experimented with several new approaches in the last five decades. The performance of public sector extension is under scrutiny for quite some time and questions are being raised on its capability to deliver goods in the rapidly changing environment. The need for involving NGO's, private sector and farmers' associations in sharing, augmenting and supplementing public sector extension efforts is being increasingly recognised. The depleting fiscal support and concerns for operational efficiency have been forcing governments to look for new institutional arrangements for providing extension services.
Alternatives such as contracting out (services to private/voluntary sector) cost recovery, cost sharing with user groups and privatisation were experimented in many countries. The feasibility of these options in the Indian context depends upon the existing status of different agencies involved and on the willingness of farmers to pay for services. This policy paper is the outcome of the study conducted at NCAP to look into the various aspects of privatisation of farm extension in India.
We hope this report to be highly useful to all those involved in the task of developing new institutional arrangements in extension.
February, 2000 New Delhi
Dayanatha Jha Director

Acknowledgements The report is the outcome of the NCAP research study on Scope of Privatising Farm Extension in India, initiated in the year 1996. Several persons have helped in the initial formulation, development and implementation of this research study. The study has been conducted under the guidance of Dr. Dayanatha Jha, Director, National Centre for Agricultural Economics and Policy Research (NCAP), New Delhi. I wish to express my sincere thanks to Dr. Jha, for his support and encouragement throughout this study. Other members of the NCAP faculty have also helped in the different stages of the project by way of concrete suggestions. Of these Dr. S. Selvarajan's contribution to the methodological improvement and analysis of data, needs special mention. Dr. P. Adhiguru collected organisational information from Bihar for this study. Mr. Khyali Ram Choudhary helped in collecting information from Rajasthan. Their efforts are duly acknowledged. I am highly obliged to Dr. P.K Joshi and Dr. Ramesh Chand for their valuable comments on the preliminary draft of this study.
Several officials of the Department of Agriculture and State Agricultural University from the states of Maharashtra, Rajasthan, Kerala and Bihar shared their knowledge and guided us in selection of organisations and study sites. The contribution of Mr. K.S. Tambolkar, Subject Matter Specialist, Commissionerate of Agriculture, Government of Maharashtra and Mr. R. J. Dubey, Ex-Jt. Director of Agriculture, Kota Division, needs special mention. Dr. R. Prakash and Dr. K.M. Sreekumar of Kerala Agricultural University provided critical support in collecting data from Kerala. Their contributions are gratefully acknowledged.
New Delhi February, 2000
Authors

EXECUTIVE SUMMARY Extension has been traditionally funded, managed and delivered by the public sector all over the world. This public sector monopoly came under increasing threat in the 1980's as many started questioning the desirability of this situation on economic and efficiency grounds. Increasing restraints on government finances and emergence of new extension arrangements offered by the private and voluntary sector (input companies, NGOs, farmers' associations, agro-processors etc) have accelerated the process of limiting the role of government in extension. Decentralisation, cost sharing, cost recovery, withdrawal from select services and contracting are some of the options exercised by various governments in privatising extension services.
Privatising extension, as one strategy for providing efficient services to farmers is finding acceptance in developing countries, including India. Many developed countries have gone far ahead with privatising extension and the outcomes have been mixed. Extension privatisation is under active consideration in India and many state governments have initiated measures to achieve this end. Some of the benefits expected through privatisation could be achieved through decentralisation of extension and adoption of group approaches by the public sector. But looking for alternative funding and delivery mechanisms has its own merits. A decision on how far India should pursue privatising its agricultural extension services, would essentially depend upon the type and quality of services made available by various agencies at present (especially those in private sector), the information needs of farmers and farmers' willingness to pay for extension services.
The analysis on expenditure, outreach and manpower ratios of various organisations revealed the presence of only three agencies seriously involved in extension, namely the state Department of Agriculture (DoA), farmers' associations and producers' co-operatives. Non-Governmental Organisations and Commodity Boards are also important in terms of activities, wherever they exist. DoA units exist in all development blocks with some variations in manpower ratios. DoA is fully dependent on government funds. Producers' cooperatives and farmers' associations exist in very few crops or commodities. They operate mostly on their own funds with little government support. Commodity boards exist in only crops such as Rubber, Coconut, Coffee and Spices. They depend on levy on the produce and government support. NCOs vary widely in terms of size, operations and technical skill. But all of them depend on funds from government or donors. Other organisations, such as Directorate of Extension of State Agricultural Universities, Krishi Vigyan Kendras, input agencies, consultants, research institutes or marketing boards) spent very little with few manpower and reach only few farmers through their operations.
The main extension function performed by DoA has been delivery of technical messages (major focus on food crops) to individual farmers or farmers' groups through visits to specific locations in his circle/area. Visit to farmers' field to provide problem solving advice rarely happens. Moreover, these visits are to a great extent affected by extension worker's preoccupation with implementation of a number of state and central sector programmes having input/subsidy delivery. Farmers' associations and producers' co-operatives provide the maximum number of extension services to their member farmers in the particular crop/commodity. But this is restricted to few crops and locations. Same is the case with commodity boards. The field extension activities of the Directorate of Extension of SAUs, agricultural colleges and research institutes are often restricted to nearby villages around its location. Training programmes for farmers are mostly organised by Krishi Vigyan Kendras, whose primary mandate is training.
NGOs are involved in a number of activities but their operations are restricted to beneficiary farmers or at the most to few villages. Their concentration of funds and efforts in small areas/groups make them successful in implementing programmes. But most of them do not have the ability to replicate their efforts on a wider scale. Consultancy services are very few and are mostly private ventures found in high value crops. The only exception being the

efforts of the Consultancy Cell, College of Agriculture, Nagpur. The potential of media such as print, radio and television in supplementing and complementing extension efforts is underutilised at present. Input companies generally do not have a full time extension staff. Marketing staff organises demonstrations, seminars or campaigns etc with the support of dealers and at times with the professional inputs of state Department of Agriculture.
State Department of Agriculture is the most important source of information for farmers, though their role in delivering technologies in non-food grain crops is limited. Farmers dependence on other farmers and input dealers as sources of information continues to be high as other organisations are not reaching him effectively. Only less than 42% of the farmers are highly satisfied with the present extension support available with them. The level of satisfaction with the primary source of information was found to be the most important factor that discriminates farmers who are willing and not willing to pay for extension services. Lower the satisfaction with the primary source of information, the more he was willing to pay. Other important variables are those related to area and income. Farmers having higher total area and higher area under non-food grains were more willing to pay for agricultural information. Per acre agricultural income was another discriminating factor.
A good number of farmers (about 50%) are willing to pay for quality extension services especially in the area of plant protection and training programmes. One important condition for paid services is the farmers' insistence on field visit based advice. Farmers of Maharashtra and Rajasthan who have expressed their willingness to pay for agricultural information have suggested sharing of costs for expert advice with other farmers as one condition for payment. The demand for paid services was more in non-food grain crops, especially, horticultural crops (fruits, vegetables, flowers and spices) and oilseeds.
Both economic and social reasons, justify public financing of extension in the Indian context. But all services need not necessarily be provided through a public machinery. As a strategy of privatisation, if the public sector extension has to be restricted, at present it could be done only in crops and locations where farmers' associations or producers' co-operatives are existing. Considerable scope exists for initiating paid extension services in agriculture. DoA and other agencies in public sector, should initiate problem solving consultancy services and need-based training programmes, especially in nonfood grain crops. To begin with, these services could be provided at district or sub-district levels on specific days, on payment basis. These services could be provided by pooling the expertise of more qualified and trained personnel available with these agencies. Public sector should also set a policy framework for encouraging private agencies in field extension activities. Opportunities for the successful integration of efforts of public agencies, private sector and farmers' groups are emerging in some areas.
The public sector should concentrate in the short run on organising educational programmes for farmers, facilitating formation of farmers' groups, building linkages with other extension agencies and initiating paid consultancy services by maintaining a cadre of qualified staff at district and sub-district levels. In the long run, it should transfer some of the extension responsibilities to farmers' groups, limit its role to only educational programmes (unattractive to private sector delivery), facilitate farmers' groups, maintain linkages with other agencies providing extension services and monitor their performance.

1 INTRODUCTION 1.1 The Background
The important contributions made by agricultural extension in promoting agricultural development and increasing food production resulted in increased interest in extension during the last few years (van den Ban and Hawkins, 1988). Methodological shortcomings not withstanding, there is enough evidence to show that returns to investment in extension education are reasonable and perhaps comparable to those on other public services (Gill, 1990). To many people, extension and government are indissolubely linked. Yet elements of privatisation and diversification in supply of extension services have been witnessed throughout the world during the past two decades (Carney, 1995). New political agendas, increased cost-consciousness and budgetary restraints, and major technical advances are contributing to significant changes such as (i) the reduction of public sector services, (ii) experimentation with new service delivery structures, including growing interest in privatisation, and (iii) decentralisation of activities and shared responsibilities between central and local governments and private user associations (Rivera and Gustafson, 1990). The economic reforms pursued in many developing countries have also accelerated the process of limiting the role of government in provision of several services including extension.
In many countries there often is a broad range of providers of agricultural advice. It is clear that a role exists for the public, semi-public and private sectors with their different purposes and approaches to information transfer (Rogers, 1987). Many extension organisations have a narrower view of extension and they see it as a process of supplying information to farmers on demand, and of introducing technical changes in agriculture which they consider to be desirable, rather than the one of promoting farmers development and independence (van den Ban and Hawkins, 1988). But the role of extension is much wider as extension needs to teach farmers management and decision making skills, help rural people develop leadership and organisational skills enabling them to organise better, operate and or participate in co-operative credit societies and other support organisations, as well as to participate more fully in the development of their local communities (Swanson and Clarr, 1984).
Farmers need information on a wide range of topics and their demand for agricultural information is not uniform across producers or regions. Information on agriculture is being provided by various agencies, but all of them may not be willing or able to undertake the activities necessary to meet the varied information needs of farmers. The information could haw the characteristic of a public good or a private good depending primarily on its technical features. There may be scope for the state to withdraw from some services with high private good characteristics where, the private sector is willing to participate or beneficiaries may be willing ti pay (Beynon et al., 1995).
After Independence, the country initiated a number of programmes and created several institutions to provide extension and other services to] farmers, starting with the Community Development (CD) programme of 1952. Till 1960's agricultural extension was purely a function performed under the guidance of state Department of Agriculture. A few voluntary] organisations were also doing effective work in the limited areas of their jurisdiction. The ICAR started getting involved in extension activities with the National Demonstration Programme of 1966. ICAR's involvement increased considerably with the initiation and spread of Krishi Vigyan Kendra's. Establishment of radio stations and initiation of rural programmes resulted in wider use of mass media for agricultural development. The print media followed suit. State Agricultural Universities initiated training programmes (for officials and farmers), demonstrations and exhibitions and these got strengthened with the establishment of the Directorate of Extension. Several new agencies created by the government to promote development in specific crops, (Commodity Boards), market operations (Marketing Boards and regions (Command Area Development Authority) are also performing some extension functions. The eighties saw more and more NCOS, agro-input industries and agro-processors taking up agricultural extension responsibilities. Farmers' associations and producers' co-

associations and producers' co-operatives are also involved in extension services in few crops/commodities.
The need for involving NGO's, private sector and farmers associations in sharing, augmenting and supplementing public sector extension efforts is being increasingly recognised in India. Some states in the country have already initiated steps towards achieving this objective. The strategies include recognition and encouragement to organisations outside the public systems, contracting out few services to these agencies and bringing more services on fee basis.
There is now a fairly broad national consensus that, although for large numbers of small and disadvantaged farmers extension needs still have to be publicly supported, it is no longer appropriate nor fiscally possible for the public sector to shoulder its past share of agricultural extension responsibilities (ICAR, 1998). Concerns for operational efficiency and depleting fiscal support require encouraging and building core competency in public, private and NGO systems, sharing of responsibilities among them, and integration of efforts of these agencies. According to Dayal (1995) a critical first step activity would therefore be an informal or formal survey of all extension activities in the private, cooperative and the non-profit sector to generate information on institutions, their areas of operation, geographical and functional base and to evaluate their strengths, capacities and potential.
To arrive at meaningful conclusions on the most effective approach and combination of the varied agencies in extension, it is essential to generate information on the various extension suppliers (in the public and private systems), information needs of farmers, and their ability and willingness to accept these new arrangements. This study is an attempt to fill this gap.
1.2 Objectives
The specific objectives of the study are to:
i. investigate the role of public, co-operative, private organisations and other information sources in extension/transfer of technology;
ii. ascertain the effectiveness of alternative extension arrangements in terms of subject content, linkages, planning, clients and costs;
iii. understand the capacity and willingness of farmers to pay for various extension services and the probable mechanisms for payment; and
iv. provide policy level inputs and guidelines for initiating structural changes in the organisational set up for developing appropriate combinations of different agencies/institutions engaged in agricultural extension/transfer of technology.
1.3 Study Area
The information on organisations was collected from Maharashtra, Rajasthan, Kerala and Bihar. These states were purposively selected to capture the regional diversity in terms of cropping systems, level of agricultural development and presence of various extension organisations outside the public sector. Table 1.1 provides the key features of these study states.
From each state, three districts were purposively selected keeping in view the above mentioned factors. The details on major crops in the study areas are given in Annexure 1. Organisations representing various types (public, private, co-operatives, NGOs etc) were identified from these districts with the help and guidance from senior officers of the state departments of agriculture. Based on their suggestions, sites were identified for farm level data collection.

Table 1.1. Key features of the study states
No Features Unit Maharashtra Rajasthan Kerala Bihar
GENERAL
1 Population (-4991) Lakh 789 100.67 290.99 863.74
2. Districts No. 30 27 14 42
3. Villages No. 43025 39810 1384 77697
4. Literacy (1991) % 64.87 38.55 89.81 38.48
5 Per capita net domestic product at current prices for 1996-97
Rs 17295 8481 9066 3835
AGRICULTURE
6. GCA (1995-96) 000 ha 21327 19672 3066 10019
7. NCA (1995-96) 000 ha 17911 16575 2265 7321
8. Area under food-grains (1995-96)
% 62.2 60.5 16.3 89.7
9. Fertiliser consumption (1997-98)
kg/ha 45.9 30.09 28.36 64.4
10. Cultivators to main workers % 32.8 58.7 12.2 43.5
11. Net irrigated area (1995-96) % 14.3 31.5 15.1 50.3
12. Average size of holding (1990-91)
Ha 2.2 4.1 0.3 0.9
13. Total holdings (1990-91) '000 Nos.
9470 9153 5419 11711
14. Share of marginal and small holdings (0-2 ha)
% 63.4 72.36 97.7 87.9
15. Area under fruits and vegetables (1995-96)
% 2.48 0.48 14.34 11.4
16 Area under plantation crops and spices (1991-92)
% 0.82 0.92 43.52 0.15
Source: CMIE (1997, 1999); CSO (1997); NHB (1998)
Information from farmers was collected only from Maharashtra, Rajasthan and Kerala. Two villages from each selected district of these three states were identified for the collection of data from farmers. These sites were selected keeping in view the earlier mentioned factors so that these villages are different from each other in terms of cropping patterns and infrastructure. From each village, 40 farmers were randomly selected. Thus 80 farmers from each district were selected as respondents for the study. The total sample consisted of 720 farmers comprising 240 from each of the selected state.

1.4 Approach
Information on organisations was collected through detailed interaction with senior managers of the selected organisations, visits to project areas and through publications such as Annual Reports. Another schedule was designed and used in this study for collecting information from farmers. From each village, 40 farmers were randomly selected. Thus 80 farmers from each district were selected as respondents for the study. The total sample consisted of 720 farmers comprising 240 from each of the selected state.
1.5 Outline of the Report
In the next chapter (Chapter 2) on Theoretical Orientation, an overview on the evolution of new institutional arrangements in extension and the theoretical issues in optimising these arrangements are discussed. In chapter 3, analysis on the performance of various organisations in the public and private sector is attempted. A brief description on extension activities performed by various organisations are also included in this chapter.
Chapter 4 of this report is on the preferred sources of information by farmers. The next chapter (Chapter 5) examines the willingness of farmers to pay for agricultural information and characterises those who are willing to pay and not willing to pay. The types of information and services for which the farmers are willing to pay are also identified in this chapter.
Chapter 6 addresses the issues regarding role delineation among agencies, privatisation of extension and its scope in the Indian context. The chapter concludes with options available for India, in privatising agricultural extension.
2 THEORETICAL ORIENTATION 2.1 Dimensions of Agricultural Extension
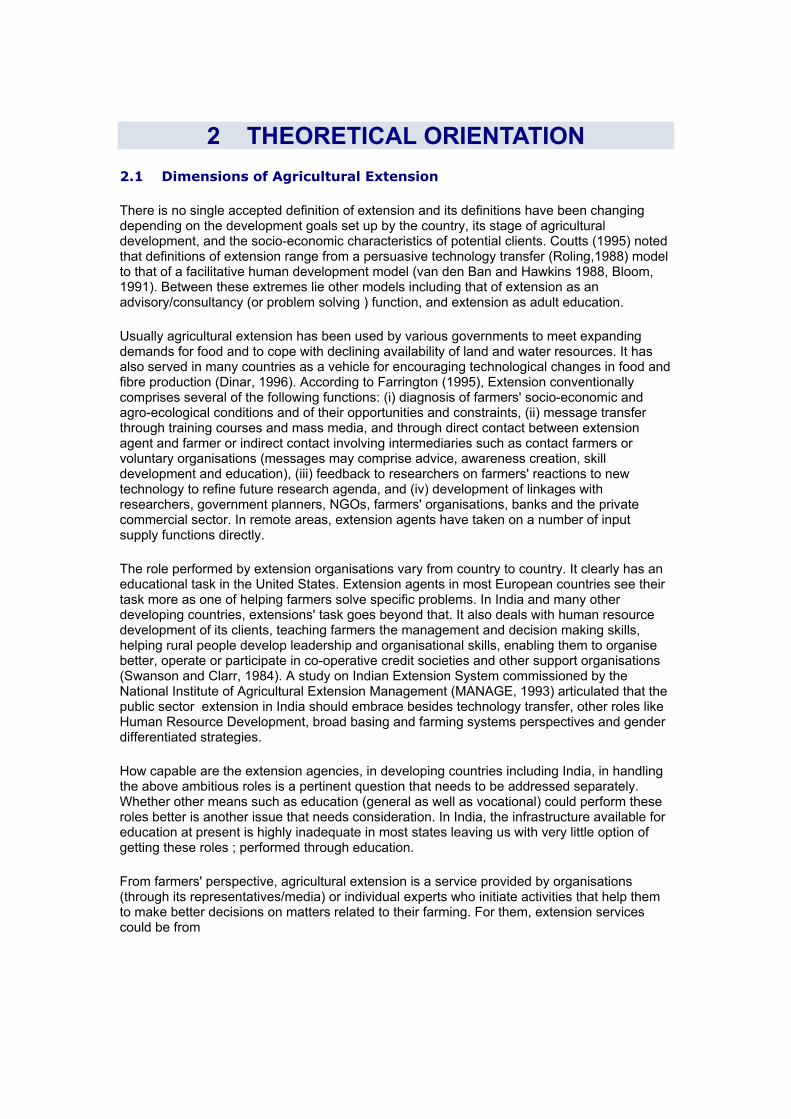
There is no single accepted definition of extension and its definitions have been changing depending on the development goals set up by the country, its stage of agricultural development, and the socio-economic characteristics of potential clients. Coutts (1995) noted that definitions of extension range from a persuasive technology transfer (Roling,1988) model to that of a facilitative human development model (van den Ban and Hawkins 1988, Bloom, 1991). Between these extremes lie other models including that of extension as an advisory/consultancy (or problem solving ) function, and extension as adult education.
Usually agricultural extension has been used by various governments to meet expanding demands for food and to cope with declining availability of land and water resources. It has also served in many countries as a vehicle for encouraging technological changes in food and fibre production (Dinar, 1996). According to Farrington (1995), Extension conventionally comprises several of the following functions: (i) diagnosis of farmers' socio-economic and agro-ecological conditions and of their opportunities and constraints, (ii) message transfer through training courses and mass media, and through direct contact between extension agent and farmer or indirect contact involving intermediaries such as contact farmers or voluntary organisations (messages may comprise advice, awareness creation, skill development and education), (iii) feedback to researchers on farmers' reactions to new technology to refine future research agenda, and (iv) development of linkages with researchers, government planners, NGOs, farmers' organisations, banks and the private commercial sector. In remote areas, extension agents have taken on a number of input supply functions directly.
The role performed by extension organisations vary from country to country. It clearly has an educational task in the United States. Extension agents in most European countries see their task more as one of helping farmers solve specific problems. In India and many other developing countries, extensions' task goes beyond that. It also deals with human resource development of its clients, teaching farmers the management and decision making skills, helping rural people develop leadership and organisational skills, enabling them to organise better, operate or participate in co-operative credit societies and other support organisations (Swanson and Clarr, 1984). A study on Indian Extension System commissioned by the National Institute of Agricultural Extension Management (MANAGE, 1993) articulated that the public sector extension in India should embrace besides technology transfer, other roles like Human Resource Development, broad basing and farming systems perspectives and gender differentiated strategies.
How capable are the extension agencies, in developing countries including India, in handling the above ambitious roles is a pertinent question that needs to be addressed separately. Whether other means such as education (general as well as vocational) could perform these roles better is another issue that needs consideration. In India, the infrastructure available for education at present is highly inadequate in most states leaving us with very little option of getting these roles ; performed through education.
From farmers' perspective, agricultural extension is a service provided by organisations (through its representatives/media) or individual experts who initiate activities that help them to make better decisions on matters related to their farming. For them, extension services could be from

• department of the state/ national government • agricultural universities or a department or its wing providing advice/information • input companies (seed/fertiliser/pesticide/farm machinery) • non-governmental organisations • agro-processors who provide technical support • private consultants • farmers' associations/co-operatives • agricultural research stations • mass media organisation (print/audio/video based)
In most of the countries, many of these organisations are present but their distribution and extension involvement vary considerably. A 113-country survey, conducted by the FAO in 1988-89, showed that national, state or provincial governments conducted approximately 81% of the extension work in the surveyed countries. Based on the responses to survey, universities, parastatals and non-governmental organisa comprised about 5 percent (Swanson, et al.,1990).
Table 2.1. Distribution of Extension Organisations based on FAO Survey of 113 countries
No Types of organisations Percentage
1. National, state, provincial governments 81.0
2. Non-governmental organisations 7.0
3. Parastatals 3.0
4. Universities 2.0
5. Private for profit sector 5.0
6. Others 2.0
Total 100.0
(Source: Swanson, et al.,1990).
2.2 Public and Private Extension
The debate concerning the role of public sector agricultural extension was initiated in the 1980s. It gathered momentum in the 1990s. Many new institutional arrangements for providing extension support to farmers emerged and have gained prominence due to following reasons:
a. the increasing inability of the government to adequately fund extension machinery and unwillingness of donors to support them
b. growing dissatisfaction with the quality of extension services available; c. increasing transformation of agriculture in several parts of the world from subsistence
to commercialised agri-business; d. gradual change of technology from being largely a public good to private good and so
the incentives for private sector to invest in its dissemination and adoption by clients; e. technological developments in mass media, f. Production of agricultural surpluses in industrial countries; and g. increased specialisation among farmers

These developments have led to the emergence of arrangements such as:
a. Cost recovery programmes by government extension departments on selected services
b. Cost sharing by farmers' groups c. Contracting services to NGOs d. Partial withdrawal of government from favourable regions/high value crops e. Willingness on the part of public systems to co-exist and co-operate with other
providers of information f. Increasing involvement of input companies and product marketing companies in
transfer of technology g. Growing number of fee-for-extension providers such as private consultancy firms,
individual consultants, media outputs (magazines video cassettes) h. Rise in number of NGOs ready to implement rural development programmes i. Arrangements made by producers' co-operatives to meet their extension and other
demands j. Involvement of agro-processing companies to provide all service (including extension)
to their contract growers.
Umali and Schwartz (1994) have summarised the objectives of the extension providers as follows:
Table 2.2. Types of private extension providers, their objectives and target markets
Type of private extension providers
Objective of the firm Target market
a. Farmer associations Increase output quantity and quality Increase member farmers' incomes
Member farmers
b. Agro-marketing and agro-processors
Backward integration to reduce input supply risks (i.e. product quality, volume and timing)
Contract growers
c. Input suppliers (agrl. machinery, chemicals, seed and plant products, animal foods and veterinary pharmaceuticals)
Product promotion Ensure proper use Preserve market share
All farmers
d. Consultancy firms Fee for service Mostly large and medium scale farmers
e. Publishing companies Return from product sales All farmers (mostly large and medium and are literate to read and understand)
(Source: Umali and Schwartz, 1994)
2.3 Delineation of Roles
In a multi-institutional environment, it would be efficient for various actors to prioritise their activities based on their inherent strengths and weaknesses. Baxter (1989) observed that when a market is developing for skilled and specific agricultural advice, government should reconsider its role in this market and evaluate its comparative advantage. It is normally sensible for a government to create conditions in which private suppliers of advice can

emerge and flourish. This view has been supported by others also who have found merit in limiting the governments' role to only those activities that are not provided by the private sector. Moris (1991) states that governments must reduce services to those it can adequately fund while supporting the private sector in the provision of the rest of the services. Zijp (1992) noted that, many governments are considering the role of the public sector, both on the level of intervention (should the government be in the business providing extension at all, and if so to whom) and on the level of policies for research, education and extension (setting conditions for the pr and public sectors to effectively exchange information).
Thus the public sector extension is coming under increasing pressure to mend its ways so that it becomes more efficient (technically and economically) and effective in performing its functions, though investments in extension has been giving good returns. A review of 47 studies by Birkhaeuser, et al., (1991) revealed a significant and positive extension effect in 33 cases. Eight studies that calculated net rates of return reported highly positive results in all cases. The rates of return to extension varies across countries and commodities, ranging from 13 to 500 % in Brazil, 75-90 % in Paraguay, 100-110 % in the United States and 14 to 15 % in two states of India. Studies on extension returns in Asia, Africa and Latin America showed returns of 34-80 % for non-staple crops. Gill (1990) in a similar review reported that methodological shortcomings notwithstanding, there is enough evidence in the review to inform public policy that returns to investment in extension education are reasonable and perhaps compare favourably with expenditure on other public services.
2.4 Economic Analysis
One approach used to decide who should provide what services, is based on the classification of services according to its economic character, using the principle of substractability and excludability. Welfare economics provides the analytical framework for examining the public and private good characteristics of agricultural information and in determining the efficiency of market forces (Box 1).
While Leonard (1985) argues that most extension work is inevitably a public good every where in the world, Wilson (1991) believes that information on a new technology is a public good but that as a certain level of technology becomes widely accepted, extension become a private good. At this stage farmers require a more individually tailored problem solving service - such information will be substractable and excludable and, so long as it is high quality, they should be willing to pay for it.
It can be argued that in countries with a shortage of basic food crops, government should do everything in their power to raise aggregate production and thus provision of all types of information should remain their hands. Indeed Wilson (1991) argues that most technology for basic food crops will remain a public good and therefore should be provided by the public sector. The implication here is that narrow goals of economic efficiency are replaced by a broader aim of enhancing general welfare in a country.

Box 1. Economic Analysis
The principles of excludability and substractability determine whether a good or service is closer to being public or private. Excludability applies when access is denied to those who have not paid for the product, while substractability (rivalry) applies when an individual's use or consumption of a good or service reduces its availability to others. Public Goods are those having low substractability and excludability, whereas private goods are those having high substractability and excludability.
Private firms are unwilling to supply services with public good characteristics because it is usually impossible to restrict the benefits only to people who pay for it (the free rider problem). Purely public and purely private goods occupy opposite ends of the economic spectrum. In between the two extremes are toll goods and common-pool goods (Fig 1).
Three related issues also have to be considered in this debate. They are
a. Externalities (spill over effects). Externalities arise when an individual's action also affects others. Theoretically if the service involves externalities, pubic intervention is justified to reduce (for negative externalities) or raise (for positive externalities) utilization to society's optimal levels.
b. Moral Hazard problems- These arise due to asymmetry of information. Consumers are unaware or are unable to assess visibly and directly the quality of the product they are purchasing. This problem could be overcome through effective regulation (either by public sector or through self-policing mechanisms by private sector).
c. Infant industry protection- This is based on the premise that the production of some goods and services is subject to economies of time. This justifies government subsidisation of particular industries in their initial stages
According to Carney (1995), assessing whether market supply of a good is theoretically feasible is just the first step. She has noted that even when this is the case, markets may either fail to develop or produce socially sub-optimal results. If the supply of non-public goods is left entirely to market mechanisms, the result will be undersupply and a loss in economic efficiency. If conversely, private goods are subsidised, they tend to be used at levels higher than the economic optimum. Public sector should determine its role also based on the performance of the markets for private goods.
Bloome (1993) observed that efforts to divide the benefits of extension into public and private categories are not helpful in pursuing the interests of either the public or agriculture. He has exhorted the public extension to reaffirm its commitment to public education. Extension is a public investment in the ability of agriculture to voluntarily incorporate public goals. Public education offers an alternate way for society to pursue its interests with agriculture, be the greater productivity and competitiveness, reduced environmental impact, increased rural employment or sustainability.

Fig 1 Economic classification of agricultural information and technology delivered by the agricultural extension system
Public goods- Non excludable agricultural information( LT) Cultural/production techniques Farm management Market information, information relayed through mass media channels
Toll Goods- Pure agricultural information short term) Cultural/production techniques Farm management Market information Specialised and /or client specific information Extension under contract farming
Common-pool goods- Modern technologies Self pollinated seeds (LT) Commonly available/used inputs
Private goods- Modern technologies (eg: new machinery, agrl chemicals*, hybrid seeds, self pollinated seeds (ST), biotechnology products, veterinary supplies and pharmaceuticals*
Note: * May involve some externalities; LT long term; ST short term Source: adapted from Umali and Schwarrtz, (1994) and Beynon et al., (1998).
Many have highlighted the undesirable impacts of privatisation of extension services. They feel that the overriding concern for profits by the private sector would affect the long term public interest. Sulaiman and Gadewar (1994), based on a review of experiences from privatisation of extension in different countries lists major implications arising out of extension privatisation as follows: (a) contradictory message flow, (b) negative impact on sustainability, (c). sidelined educational role, (d) lesser contact between farmers and extension, (e) high cost of technologies, and (f) increase in regional imbalances. Different types of experiences with privatisation / commercialisation of extension is summarised in Table 2.3.
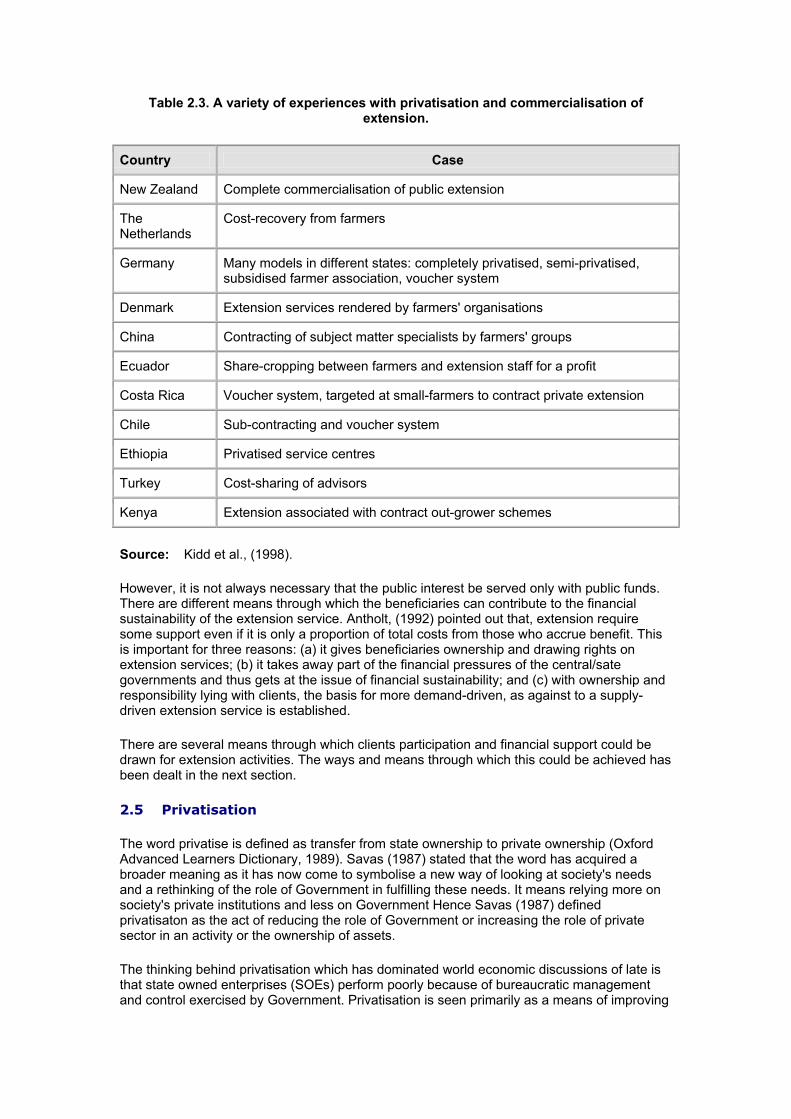
Table 2.3. A variety of experiences with privatisation and commercialisation of extension.
Country Case
New Zealand Complete commercialisation of public extension
The Netherlands
Cost-recovery from farmers
Germany Many models in different states: completely privatised, semi-privatised, subsidised farmer association, voucher system
Denmark Extension services rendered by farmers' organisations
China Contracting of subject matter specialists by farmers' groups
Ecuador Share-cropping between farmers and extension staff for a profit
Costa Rica Voucher system, targeted at small-farmers to contract private extension
Chile Sub-contracting and voucher system
Ethiopia Privatised service centres
Turkey Cost-sharing of advisors
Kenya Extension associated with contract out-grower schemes
Source: Kidd et al., (1998).
However, it is not always necessary that the public interest be served only with public funds. There are different means through which the beneficiaries can contribute to the financial sustainability of the extension service. Antholt, (1992) pointed out that, extension require some support even if it is only a proportion of total costs from those who accrue benefit. This is important for three reasons: (a) it gives beneficiaries ownership and drawing rights on extension services; (b) it takes away part of the financial pressures of the central/sate governments and thus gets at the issue of financial sustainability; and (c) with ownership and responsibility lying with clients, the basis for more demand-driven, as against to a supply-driven extension service is established.
There are several means through which clients participation and financial support could be drawn for extension activities. The ways and means through which this could be achieved has been dealt in the next section.
2.5 Privatisation
The word privatise is defined as transfer from state ownership to private ownership (Oxford Advanced Learners Dictionary, 1989). Savas (1987) stated that the word has acquired a broader meaning as it has now come to symbolise a new way of looking at society's needs and a rethinking of the role of Government in fulfilling these needs. It means relying more on society's private institutions and less on Government Hence Savas (1987) defined privatisaton as the act of reducing the role of Government or increasing the role of private sector in an activity or the ownership of assets.
The thinking behind privatisation which has dominated world economic discussions of late is that state owned enterprises (SOEs) perform poorly because of bureaucratic management and control exercised by Government. Privatisation is seen primarily as a means of improving

the efficiency of enterprises. Everyone doesn't agree with this concept Opponents cite several reasons why public provision would be more advantageous in certain countries.
Governments can withdraw from the provision of service in a variety of ways. Mariam (1993) provides some of the alternatives that have been used in the process.
(i) Contracting - Contracting out is now frequently considered to be one of the more feasible options for privatising the economies of the developing countries. This option is even more feasible when private companies prefer to act as contractors or concessionaries. Government may contract with non-profit, voluntary or neighbourhood organisations for some types of services.
(ii) Franchise agreements - Franchising is a privatisation method whereby government grants private entities authority to provide a particular service within a specific geographical area. Users receive and pay for the service directly, but the government may monitor performance with respect to the franchise in terms of price, amount or level of service and quality. Franchising has great potential for achieving cost savings when, applicable and properly implemented. The reason for this is that franchising allows government to remove itself from the actual provision and delivery of a service.
(iii) Vouchers - Government provides certificates to eligible citizens requiring a particular service. The users are then free to exchange the certificates or vouchers for services from qualified private organizations that return the vouchers to local governments for reimbursement. The voucher alternative allows the user to choose among services and providers, and generally means better monitoring and quality control of services.
(iv) Self-help - This privatisation alternative is the most underutilized. Under this approach, the government encourages individuals or groups to organise their own services; i.e. the individuals involved become their own clients. This alternative is designed to encourage individuals to find solutions to their own problems, to become more self-reliant, and to provide a service better tailored to local circumstances.
(v) Subsidy arrangements/grants - Government makes a financial or in-kind contribution to private organisations or private individuals to facilitate the provision of service at a reduced cost to consumers. The subsidy arrangements are often used for governmental activities such as public safety, health and human services, and recreation.
Mariam (1993) describes the three approaches to animal health extension in Ethiopia as follows:
i. the service co-operative/cost sharing approach, ii. the cost recovery approach and iii. the private practice approach.
Service co-operative approach (SCA) is based on farmer's co-operations and resource sharing so as to afford better animal health services for their livestock that would otherwise be too costly for them as individuals.
Cost recovery approach (CRA)- In CRA, the cost of veterinary services are recovered by making farmers pay for them. The rigidness of having to work with the cost recovery programme within the functional regulations of the government made it difficult to operate because of the bureaucratic procedures required before funds can be released. In general unless the cost recovery scheme is detached from the government financial regulations and unless staff are well trained and appropriate financial and field monitoring is instituted, it will continue to be very difficult to operate.
Private Practice Approach (PPA) entails that veterinary field services should be provided by private practitioners and not government employed animal health staff. As long as private

practitioners can make a decent living on supplying veterinary services and farmers continue to demand their services, private practice is likely not only to improve services to farmers but also reduce the veterinary service departments' budgetary requirements. The argument is that private practitioners will be more efficient than government employees and more flexible to deal with farmers needs.
In several countries, the animal health services have been privatised. Clinical and diagnostic services are easily amenable for private provision because of its high excludability and substractability. In the area of agriculture also, farmers are demanding individual problem solving advice. There is a need to identify these type of services.
Who should provide such services is the next issue. It is always not essential to earmark the provision of these type of activities (with high private good characteristics) exclusively for the private sector. Public sector can also provide these types of services on payment basis, provided manpower capable of providing these type of services are available. This may probably improve the finances of the public sector. Mariam (1993) notes that in government circles it is common to find that the financial cost of collecting the revenue is greater than the revenue itself. It is advisable to examine all these factors before the fate of cost recovery can be decided.
Another strong alternative suggested is to encourage farmers to form groups/organisations/co-operative and to share the costs of extension with them. Nowadays there is a general understanding among all concerned with rural development that authentic, strong and flexible peoples organisations are the necessary though not sufficient condition for sustainable development and for gearing development to the needs of the rural people. Training of farm volunteers of these groups to act as para extension workers is another tested option. The idea is to shift the responsibility and costs of providing extension services over time to these farmers' groups.

3 SUPPLY OF EXTENSION SERVICES 3.1 Types of Organisations
The report of the Working Group on Extension for the formulation of IX Five Year Plan describes the current status of agricultural extension services as follows: (i) Largely in the public sector, other operators (corporate, NGOs etc.) remain at the periphery without clear policy enunciation or institutional support, (ii) operate largely in an interpersonal mode of select contact farmers (largely men) without planned and optimum utilisation of the media and other modes, (iii) low level of involvement of farmers in technology development and dissemination process, (iv) substantially top-down leaving little scope for localised planning and action, (v) upward looking, therefore generate uniformity rather than specificity and focus on form rather than substance, (vi) manned by functionaries with low morale, low knowledge level and low incentives with limited exposure to recent developments in communication technology, and (vii) resulting in depleting credibility, self esteem, relevance and public support (DAC,1996a).
As discussed earlier, the number of organisations performing some extension functions have been increasing over the years. These organisations vary in their extension activities and approaches depending on their goal, finances and manpower. The details of the various types of organisations involved in extension in the country is given in Table 3.1. This is primarily based on the information collected from the study states.
3.2 Performance of Organisations
Several organisations, representing different categories, identified from the study states constitute the sample for this analysis. Broadly three indicators viz, expenditure intensity, contact intensity and technical manpower: cultivator ratio (manpower intensity) have been developed to explain and compare the effectiveness of different organisations.
Expenditure Intensity
Expenditure Intensity (El) is the expenditure incurred by an organisation on extension activities per hectare of net cropped area. Often it is difficult to get the exact expenditure on extension from an organisation, as the expenditure incurred on extension is not booked under a specific head. In such cases, total expenditure (T) and total expenditure excluding salary (T-S) are used as the numerator. In all other cases, (annual operational costs for extension (E) is the numerator.
EI = Expenditure incurred on extension activities by an organisation in its operational area Net cropped area in its operational area

Table 3.1. Types of organisations providing extension services in India
No Types Examples
1. Line Departments Departments of Agriculture, Horticulture, Animal Husbandry etc. of various state governments
2. Universities Directorate of Extension and other colleges of State Agricultural Universities and Agricultural Schools of Open University (YCMOU.Nasik)
3. Krishi Vigyan Kendras
Krishi Vigyan Kendras sponsored by the ICAR in various districts
4. Farmers' associations
Maharashtra Grape Growers Association Kerala Mushroom Growers Association
5. Producers' cooperatives
Milk Co-operatives in different parts of the country
6. Research institutions
Various research units of ICAR and SAUs mainly through their outreach programmes
7. Input industry Seed companies such as Ankur Seeds, Nagpur; Kumar Gentech, Pune; Messina Beej Pvt Ltd, Bihar ; Fertiliser Companies such as IFFCO, KRIBHCO, FACT, Indo-Gulf etc; Pesticides and farm machinery firms
8. Consultants Individual consultants and consultancy firms such as Green Plus, Nasik
9. Non-Governmental Organisations
NGOs working in the area of agriculture and rural development such as BAIF, Pune; PRADAN, Bihar; GSSS, Udaipur etc
10. Commodity Boards Rubber Board, Spices Board etc under the Ministry of Commerce
11. Marketing Boards Maharashtra State Agricultural Marketing Board
12. Media Print News papers (Agricultural pages of most language dailies) and farm magazines
13. Media -Audio and Visual
All India Radio and Doordarshan through its farm programmes and satellite channels such as E-TV (Telugu) through their farm programmes
14. Others Autonomous agencies in specific areas (Command Are Development Agency) and crops (Kerala Horticultural Development Programme); Banks through their field officers; Panchayat Samities through their Agricultural wings; Farmers Training Centres (DoA); Irrigation Management Training Centres/Water and Land Management institutes under the Irrigation Department Agro-processing Companies such as Pepsi Foods (Punjab) and ITC (Andhra Pradesh) for its contract growers; and Internet
Note: Apart from these, farmers seek advice from many other individual sources (non-organisational) such as neighbours, friends, relatives, local dealers etc.
Contact Intensity
Contact Intensity is derived based on the number/frequency of actual contacts an organisation makes with their clients in an year and the time involved with them . The product of contact numbers and time involved is divided by the target population of the organisation.
Cl = Sum total of contact achieved by the organisation (in hours) Target population/cultivators

For instance, an organisation A (having a jurisdiction of District B) has 10 field workers and each one meets 5 farmers on each working day (on an average 300 working days/year). Each farmer contact is of 30 minute (0.5 hr) duration. The organisation has also conducted 2 training programmes of 5 days (6 hr/day) each, one batch of 20 and the other for 25 farmers. The District B has 50,000 farmers who are the potential clients for this organisation.
The Contact Intensity for this organisation A, [CI (A)] is
CI (A) = (10 x 5 x 300) X 0.5 + ( 20 x 5 ) x 6 + (25 x 5) x 6 50,000
= 7500 + 600 + 750 50,000
= 0.17
One serious limitation of this indicator is that it would not give any indication on the quality of contact achieved. Some organisations concentrate their efforts on few farmers in a limited operational area to achieve maximum contact and effect, whereas, there are others which spread their efforts thinly so as to achieve maximum coverage.
Technical manpower: Cultivator Ratio (TC Ratio)
TC ratio is the ratio between the number of field level technical officer and the number of target population covered by the organisation in their operational area. The technical manpower available for extension includes only the field level functionaries directly involved in agricultural extension related tasks.
TC ratio = Target population covered Number of field level functionary available for extension
3.2.1 Line Departments-Department of Agriculture
In this context, line departments include various state departments such as agriculture, horticulture, animal husbandry, dairy development, fisheries and sericulture. Agriculture being a state subject, it is the state extension agency that implements various development programmes aimed at agricultural development and transfer of technologies farmers. (The Directorate of Extension in the Ministry of Agriculture has been playing a significant collaborative role of providing direction technical support, audio-visual-cum-information support and co-ordination at various levels of implementation of extension programmes by states.) The number of personnel employed by line departments also increased considerably over the years. The number of line department also increased during this period. (For instance, new departments of Horticulture, Soil and Water Conservation, Dairy Development etc).
Out of the 80,800 Village Extension workers, 78,000 belonged to the Department of Agriculture in 1988 (Misra,1990). Presently the state employs some 110,000 extension staff of whom around 20% are graduates (ICAR, 1998). Except Soil Conservation Departments, other did not have village level extension workers. Extension activities have been largely carried out by state Departments of Agriculture (DoA). Other line departments such as Animal Husbandry (DoAH), and Horticulture (DoH) have been primarily focussing on the provision of subsidised inputs and services to farmers with little attention and few resources being allocated to extension.
District level orgnaisational set up of DoA has been taken as the unit analysis in this case. The budget (total and excluding salary), net cropped area, population, manpower available for field extension, a contact hours achieved by DoA in the district are given in Table 3.2.
The total expenditure includes, salary, travelling expenses, office expenditure, rent and taxes, vehicle maintenance, cost of fuel etc. The total expenditure incurred by DoA in a district on an average comes to I 20 million. As the primary objective of DoA is extension, its total expenditure could be treated as its extension expenditure. This vary amount vary from as low as Rs 9 million (Patna) to as high as Rs

37 million (Trivandrum). But one factor deciding the overall effectiveness extension is the amount of operational funds available for extension. One of the major criticisms of the agricultural departments has been the heavy salary bills leaving little for operational support for extension.
Table 3.2. Expenditure, outreach and manpower details of Department of Agriculture -1996-97
No. State Organisation Expenditure ('000 Rs)
Tech manpower
Contact Achieved (hr)
Cultivators ('000)
NCA ('000 ha)
1. Maharashtra DoA, Pune T = 24806.0 T-S= 1761.0
380 190000 628.0 967.8
2. DoA Nasik T = 23137.9 T-S= 2396.8
302 151000 667.0 886.8
3. DoA Nagpur T =15326.7 T-S= 1610.3
200 124000 202.0 551.7
4. Kerala DoA Thiruvanantha-puram
T = 36820.6| T-S = 5214.0
364 272785 102 144.6
5. DoA Kottayam T = 27423.9 T-S = 3384.3
246 236005 84.3 181.2
6. DoA Kasargode
T = 15002.4 T-S= 2317.0
156 108888 41.6 141.9
7. Rajasthan DoA Jaipur T = 10983.0 T-S= 401.0
289 123500 623.0 670.7
8. DoA Udaipur T =17855.0| T-S = 883.0
246 105000 558.0 250.3
9. Bihar DoA Patna T = 9588.1 T-S = 437.4
305 21750 408.4 231.2
Note: (i) T= Total expenditure, T-S= Total expenditure excluding salary. (ii) Technical manpower includes only those involved in field level extension activities.
The operational expenditure available for extension (T-S) vary from 3.7 % in Jaipur to 15.4% in Kasargode. In other words, salary accounts for about 85-97% of the government expenditure on line departments. This has resulted in under-utilisation of the existing facilities and personnel. Macklin(1992) in his study on T and V extension in India noted that the level of operational funding has not been maintained in real terms, thus reducing the mobility of extension. Clarr and Bentz(1984) observed that extension should not commit more than 60-70% of its budgettary resources for personnel emoluments, so that it can provide sufficient funds for programme operations.
Only the field level functionaries directly involved in agricultural extension related jobs have been considered in this study as technical manpower available for extension. This includes village extension workers/ agricultural supervisors/ agricultural assistants and agricultural officers. (All other functionaries above these cadres are excluded as they are mostly involved with administrative and supervisory roles).
In the study states, except Kerala, the existing approach for agricultural extension by DoA continues to be T and V only with some minor modifications. In the T and V system, the VEWs are expected to make visits to individuals/groups to transmit technology. From 1987, with the constitution of Krishi Bhavans (offices of DoA) in each panchayat in Kerala, these have become the nodal point for contact by the farmers and the visits have become need specific. The DoA in Kerala follows the group management approach in its major crops. Rajasthan also follows a group approach and the VEW

operates mainly through Kisan Mandals comprising a group of 20 farmers. To facilitate other farmers to meet and discuss with VEWs, Kisan Seva Kendras have been opened, whereby the VEW would be available during a specified period during the day of his visit. From July 1988, the Government of Maharahstra reorganised the DoA, by implementing the single-window system by mergings its three departments, viz, Agriculture, Soil and Water Conservation, and Horticulture. The ratio of farm families per Agricultural Assistant will be 861 now in the new system as against 1500 earlier.
The contact achieved by an extension official in a district has been worked out based on the average number of farmers a field level functionary meet in an year and the time spent with them. This is multiplied by the total number of technical manpower available for extension in the district to arrive at the contact intensity of the organisation. The details on the performance of line departments based on the indicators developed for the study are given in Table 3.3.
El is the highest in Trivandrum (Rs 254.06 and Rs 36.05) and the lowest in Jaipur (Rs 16.37 and Rs 0.60). As the number of technical manpower in relation to cultivators increases, the expenditure available for extension and contact between cultivators and extension agents also increases. Kerala has the highest ratio of technical manpower (technical manpower cultivator ratio) whereas Rajasthan has a fairly low ratio (Table 3.3). This could be one of the main reasons for the variation in expenditure intensity. This is also getting reflected in the contact intensity where it is higher in Kerala. There is not much variation in contact intensity in other states.
Table 3.3. Extension performance of Department of Agriculture
Expenditure intensity (Rs /ha)
No. State Organisation
Total Total-Salary
Contact intensity hr/target
population)
Tech. Manpower: cultivator
ratio
1. Maharashtra DoA, Pune 25.63 1.82 0.30 1:1652
DoA, Nasik 26.09 2.70 0.25 1:2208
DoA, Nagpur 27.78 2.91 0.61 1:1010
Rajasthan DoA, Jaipur 16.37 0.60 0.20 1:2155
DoA, Udaipur 71.32 3.53 0.19 1:2268
Kerala DoA, Thiruvananthapuram
254.06 36.05 2.67 1.280
DoA, Kottayam 151.37 18.68 2.80 1:343
DoA, Kasargode 105.71 16.33 2.62 1:266
Bihar DoA, Patna 41.48 1.89 0.53 1:1339
The poor support for operational expenditure has been a perennial problem for the DoA in all sates. The EI figures reported in this study compares well with a similar exercise done earlier. The actual cost (including salary and all other costs) of operating T & V based extension service in India (17 states) is about Rs 4,000 million or US$ 150.0 million. This works out to about Rs 50 (US$ 2.0) per agricultural farm holding or about Rs. 27 (US$ 1.0) per ha cultivated (Macklin, 1992).
3.2.2 State Agricultural Universities
The first agricultural university was established in 1960 at Pantnagar. At present there are 27 SAUs, 1 Veterinary University and I Central Agricultural University in the country. Agricultural universities were set up on land-grant pattern of the American universities. The universities perform three major

functions namely teaching, research and extension. The major extension role of the University is to provide technical support (training) and consultative service to Government Departments engaged in agricultural development work and to farmers in special cases. In addition to SAUs, 1 open university viz, Yaswantrao Chavan Maharashtra Open University (YCMOU) at Nasik imparts agricultural education through distance education (Box 2).
In terms of priority, agricultural extension ranks low in SAUs as evident from the expenditure and manpower allocated for it. In 1991-92, SAUs spent only 5 % of its expenditure on extension education. (The corresponding figures are 17 % for Administration, 33 % for academic and 45 % for research.) In the same year, the SAUs employed only 4.7% of its manpower on extension units. The rest of the manpower was deployed in research (37.6%), academics (40.4%) and administration (17.3%) (Rao and Muralidhar,1994).
The responsibility of planning and co-ordinating all extension activities of the University lies with the Directorate of Extension. The Directorate of Extension of SAUs have three major units, viz, Communication Centre, Training Unit and Farm Advisory Service. The details on the expenditure, outreach and manpower of the Directorates of Extension are given in Table 3.4.
Table 3.4. Expenditure, outreach and manpower details of Directorates of Extension of SAUs
No. Organisation Total Expenditure ('000 Rs)
Tech. manpower
Contact achieved
(hr)
Population ('000)
Area ('000ha)
1 Dir. of Extension RAU Rajasthan
7824.0 (1995-96)
19 82506 7960.0 16232.0
2 Dir. Of Extension, RAU, Bihar
2003.3 (1995-96)
27 15933 9744.3 7612.4
3 Dir. Of Extension, KAU, Kerala
9417.4 (1997-98)
16 83712 1016.0 2249.6
The activities of the Directorate of Extension could potentially benefit the farmers of the state and so the NCA of the state, and total farming population of the state has been taken as the denominator in this analysis. Many of the activities, the Directorate does, such as training to senior officers of the departments, benefit the farmers only indirectly. In this analysis, only the activities that are directly benefiting the farmers were taken. The directorates receive a good share of money from the ICAR for disbursement to KVKs under their control. As this amount is spent at KVKs, this has been excluded from the expenditure of Directorate of Extension.

Box 2. Farmers Education in YCMOU : A New Paradigm
The Yashwantrao Chavan Maharashtra Open University (YCMOU) was established in 1989 at Nashik, Maharashtra. The School of Agricultural Sciences (SAS), one among the 7 schools of YCMOU, was established with the following major objectives: (i) to provide need based educational programmes to the practicing farmers and farm labourers in the field of agriculture, horticulture and sericulture, through a multi-media communication system in the regional language.(ii) to provide vocational training to the rural youth for self-employment and institutional finance, and (iii) to offer educational programmes in accordance with the agriculture and horticulture development policies of the Government of Maharashtra. The course-wise and year-wise enrollment of students in the various agricultural courses of YCMOU are given in Annexure 2.
The YCMOU has established study centres and sub-centres on all the Krishi Vigyan Kendras for imparting agricultural education. Total 45 study centres are identified in the state to run the agricultural programmes. The school follows the multi-media learning which includes three components viz, books, audio-video cassette and class room counselling through contact sessions. The KVK of YCMOU has further initiated and established Prayog Pariwars (Self Help group of Famers) to enhance more live and practical interaction for mutual help and development. The enrollment for this innovative programme increased from 81 in 1990-91 to about 3,000 in 1996-97 indicating the success of this programme. During the last five years, YCMOU programmes in agriculture could cater to the need of over 10,000 practicing farmers in Maharashtra. The school has 12 faculty members in agriculture and the number of staff available for this programme is much more (around 200) if the counsellors at the study centres are also included.
The Directorates spent about Rs 2-9 million for their activities. The intensity figures are slightly higher in Kerala (Table 3.5). Kerala gains in this count mainly because of its smaller size. As most of the costs of running an establishment such as Directorates are fixed and its functions similar, establishment and administrative expenditure required for running the same would not vary much. The low figures of Bihar probably indicate the extremely poor financial health of the University, which is also reflecting in the low contact intensity.
Table 3.5. Extension performance of Directorates of Extension (SAUs)
No. Organisation Expenditure intensity Total (Rs
/ha)
Contact intensity hr /target population
Tech manpower: cultivator ratio
1 Dir. of Extension, RAU, Rajasthan
0.48 0.01 1 : 41 8947
2 Dir. of Extension, RAU, Bihar
0.26 0.001 1 : 360899
3. Dir. of Extension, KAU, Kerala
4.19 0.08 1 : 63500
From farmers point of view, the Directorates may not be of immediate benefit to farmers except for those residing nearby or near to it or nearby districts of its location. The chances for constant interaction are also low because of the few technical manpower in the Directorates and the large population to be covered in their wide operational area.
3.2.3 Krishi Vigyan Kendras
The importance of farmers training was realised by the Government of India at the time of the Green Revolution itself. Farmers' Training Centres (FTCs) were established during the sixties when the extension approach emphasised farmers training in the new green revolution technologies. With the introduction of T and V system, the focus of training shifted on staff of the department at all levels. Well trained officers were expected to be more efficient in transfer of technology. The routine delivery

of messages through contact farmers didn't meet needs of majority of farmers whose training requirements for technologies related to new skills and enterprises could not be met by the T and V system. Because the NAEP supported the T and V extension approach, FTC's didn't receive any support and as a result, they have been languishing for the past two decades. In some states, these FTC's have been handed over to other departments or have been phased out (ICAR, 1988). At present, Farmers Training Centres (FTCs) exist in 186 of India's 503 rural districts.
The ICAR could be credited with visualising this scenario much earlier and initiating the Krishi Vigyan Kendras (KVKs) exclusively for training farmers (though many may consider this activity of the ICAR to be something outside its real mandate). With newer technologies becoming more knowledge based and thereby necessitating newer skills to adopt, the demand for a full fledged training centre became increasingly appreciated. By design, KVKs have an appropriate mix of multi-disciplinary expertise including specialists in agronomy (field crops), plant protection, horticulture, fisheries, livestock, home science and so forth.
Table 3.6. Expenditure, outreach and manpower details of Krishi Vigyan Kendras
Expenditure ('000 Rs)
No. Organisation
Total Total-salary
Tech manpower
Contact achieved
(hr)
Cultivators ('000)
NCA ('000ha)
1. KVK (Agricultural Development Trust), Pune, Maharashtra
2313.0 (199596)
1833.0 9 59246 628.0 967.8
2. KVK (YCMOU) Nasik, Maharashtra
1388.2 (1997)
514.7 8 22601 667.0 886.8
3. KVK, (Ramakrishna Mission), Ranchi, Bihar
2803.7 (199495)
1663.7 10 138167 374.2 261.2
4. KVK (Vidya Bhavan) Udaipur, Rajasthan
7821.0 (199596)
7221.0 14 21886 558.0 250.3
5. KVK (Pragati Trust) Jaipur, Rajasthan
1466.0 (199798)
716.0 8 21121 431.3 464.3
Currently there are 261 KVKs in the country of which 27 are in ICAR institutes, 139 in SAUs, 86 in NCOS and the remaining nine in Central Universities, agricultural colleges etc. Under NATP, it is envisaged to upgrade about 58 FTCs to KVKs. Some of the ZRS of SAUs are being identified for strengthening to take up the activities of KVKs. The details of the performance of KVKs, are given in Table 3.6.
Till 1992, KVKs had been fully supported by the ICAR. But from the Eighth Plan period, the funding is being phased out. The KVKs are presently being actively encouraged to generate additional resources. Some KVKs have started charging for their training programmes, sale of planting materials, seeds etc, For instance, the KVK of Agricultural Development Trust, Pune charges for training programmes. Planting materials in the farm and chicks from the poultry unit are also being sold to generate resources. The Vidya Bhavan, KVK, is getting resources for adaptive and socio-economic research programmes from donors abroad (Ford Foundation, Inter co-operation and NORAD). All these are expected to make many of the KVKs financially sustainable even after the complete phasing out of Government funds.
Though many KVKs have started charging for their training, this seems to have not diminished the demand for KVK training. Technical manpower: cultivator ratio is low when compared to government line departments (Table 3.7.) But then the KVKs are a different organisation all together and are not performing the same roles as the Department of Agriculture.

Table 3.7. Extension performance of Krishi Vigyan Kendras
Expenditure intensity (Rs /ha)
No. Organisation
Total Total-Salary
Contact intensity (hr/target
population)
Technical manpower:
cultivator ratio
1. KVK, (Agrl.Devt Trust) Pune, Maharashtra
2.39 1.89 0.09 1:83375
2. KVK, (YCMOU) Nasik, Maharashtra
1.57 0.58 0.03 1:69777
3. KVK, (Ramakrishna Mission), Ranchi, Bihar
10.73 6.37 0.37 1:37423
4. KVK, (Vidya Bhavan) Udaipur, Rajasthan
31.24 28.24 0.04 1:39857
5. KVK (Pragati Trust) Jaipur, Rajasthan
3.16 0.15 0.05 1:53913
One interesting factor that distinguishes it from the line departments is the higher operational support it has for field level operations. For instance, the operational support available (T-S) vary from 37.1 % (KVK, Nasik) to 92.3% (KVK, Udaipur).
The performance of KVKs vary widely and there is a need for an objective and scientific evaluation of each KVKs. Some have even argued that the KVKs are only duplicating the DoA activities. But the fact remains that, there is no other comparable organisation (infrastructure and expertise) existing at the district level and this itself is a very strong argument for KVKs to continue and expand.
3.2.4 Farmers' Associations
User groups, including farmers organisations, farmer clubs, commodity growers association, young farmer clubs, women farmers groups, special interest groups etc are expected to be effective institutional devices for the creation of client-driven agricultural research and extension system. Often farmers' associations are the starting points for the development of producers' co-operatives. Commodity specific farmers associations exist in only very few commodities in India. The need for initiating farmers associations in crops has been well recognised. Under NATP, it is proposed to use NGOs to organise farmers into groups. The idea is to encourage farmers' groups to organise different types of services for themselves, including input supply, credit and or technical services and marketing arrangements - activities that would increase their productivity and incomes, while decreasing their dependence on government (ICAR, 1998).

Table 3.8. Expenditure, outreach and manpower details of farmers' associations
No. Organisation Expenditure ('000 Rs)
Tech manpower
Contact achieved
(hr)
Cultivators ('000)
NCA ('000 ha)
1. Maharashtra State Grape Growers Association
T=1 335.5 E=988.4 (1997-98)
21 44692 17.0 (members of MSGGA)
18.7 (Area under grapes)
2. Kerala Mushroom Growers Association
E=59.0 (1995-96)
4 36619 10,000 (farmers growing mushrooms)
3.6 NCA of Mushroom growers
Note: T = Total Expenditure and E = Extension Expenditure.
Box 3. Extension by Farmers' Associations
With an estimated membership of 17,000 grape growers, the MRDBS established in 1960, has been the main force behind the development of grape cultivation in the state. The Association spent about Rs 9.8 lakhs in 1997-98 for its extension activities (divisional group discussions and annual seminar). The 20 elected members (growers) of the association work as extension functionaries for MRDBS (Table 3.8). The association has offices at Sangli, Solapur, Pune and Nasik. It organises regular group discussions and seminars and publishes leaflets, booklets and a monthly Draksha Vrutha (in marathi language). It imports plant growth regulators, dipping oil etc and distributes it to the growers at a no-loss-no profit basis. It has an independent R and D wing, own research farm, and facilities for soil, water and plant analysis. The association brings experts to tackle major problems in grape cultivation. The association had been instrumental in the creation of MAHAGRAPES, a confederation of 17 grape growers societies in 1991.
Kerala Mushroom Growers Association (KMGA), Thiruvananthapuram, was established in 1993 with the main objective of bringing mushroom growers in the state into a co-operative network to strengthen production and marketing of mushrooms in Kerala. The association is organising several study classes to its members and non-members on different aspects of mushroom cultivation and preparation of recipes. To bring awareness among farmers on mushrooms, the association participates in exhibitions and conduct demonstrations. It also supplies good quality spawns and beds to its members and arranges credit facilities to mushroom growers from banks. Several publications were brought out including a book and video cassette on mushroom cultivation. With only 220 members in 1995-96, the association doesn't have full time workers nor has any staff with higher technical qualifications. The association depends on Kerala Agicultural University and Tropical Botanical Garden and Research Institute for the necessary technical support. It is also receiving funds from NABARD, Kerala Horticulture Development Programme (KHDP) and Farm Information Bureau etc. for specific activities (seminars, publication etc.).
One of the oldest and most important farmers' organisations in the country could be the Grape Growers Association of Maharashtra (Maharashtra Rajya Draksha Bagaitdar Sangh), established in 1960. The various activities performed by the organisation are given in Box 3. Compared to the Grape Growers Association, the Kerala Mushroom Growers Association, Trivandrum, is a smaller organisation of recent origin. Even with these constraints, association has been doing several activities for spreading Awareness on prospects of mushroom cultivation in the state.
Farmers' associations are primarily accountable to its members and the expenditure intensity on extension is quite high (Table 3.9). In KMGA, all mushroom growers in the state, numbering 10,000 are considered as the target population. Other indicators on contact and manpower ratio are also high indicating the desirability of this extension approach.

Table 3.9. Extension performance of farmers' associations
No Organisation Expenditure Intensity (Agrl. Extension) (Rs /ha)
Contact intensity (hr/target
population)
Tech manpower:
cultivator ratio
1. MRDBS (Maharashtra Grape Growers Association)
52.83 2.63 1:891
2. KMGA (Kerala Mushroom Growers Association)
16.39 3.66 1:2500
3.2.5 Producers' Co-operatives
Producers' co-operatives are often formed to improve the marketing prospects in specific commodities where market operations are disadvantageous to the producers. They provide farmers the advantage of the economies of scale by bringing together produce from individual farms and marketing the same. Some of these organisations also provide extension services to its members (Box 4). The most successful among them in India being the milk co-operatives. Others include fisherman cooperatives (Kerala) and the different crop related co-operatives (cotton, sugarcane, potato). The details of the 4 producers' co-operatives are given in Table 3.10.
Table 3.10. Expenditure, outreach and manpower details of producers' co-operatives
No. Organisation Expenditure (extension ('000 Rs)
Tech manpower
Contact achieved
(hr)
Population (members)
('000)
NCA ('000 ha)
1. MRCMPU, Kozhicode, Kerala
3000 (1997-98)
158 223548 50.0 18.0
2 (VEGFED), Ranchi, Bihar
100 (1996-97)
4 15000 79.0 17.7
3 BSCLMF, Ranchi, Bihar
200 (1995-96)
3 17700 33.6 54.1
4 MDUSS Ltd Samastipur, Bihar
100 (1995-96)
34 105360 22.1 9.9

Box. 4. Extension by Producers' Co-operatives
The Malabar Regional Co-operative Milk Producers Union, Limited (MRCMPU) Kozhicode, Kerala, is one of the three regional cooperative milk producers unions in Kerala affiliated to the Kerala Co-operative Milk Marketing Federation (MILMA). Milk production, procurement, processing and marketing are the four major functions of MRCMPU. The Union has been receiving financial assistance from Swiss Government for strengthening the said functions through a project called North Kerala Dairy Project (NKDP). MRCMPU operates through the 429 producers societies (APCOS) constituted at the field level. The Procurement and Input Department of the Union has an Extension Cell which organises technical inputs, training and extension (TTE). The integrated TTE package has four major programmes namely Artificial Insemination Programme (AIP), Feeds and Fodder Programme (FFP), Women Cattle Care Programme (WCCP) and Co-operative Development Programme (CDP).
Under Al Programme, through the 111 Al centres attached to societies, insemination facility is provided at farmers' doorsteps, on cost basis. Insemination is done by trained self employed youth selected from the same village. Fertility clinics are also being organised by the union, where the farmers have to pay Rs 50 per case. The fodder project aimed at production of green fodder of good quality at farmers level is also implemented through trained farmers called fodder promoters. To strengthen faith in co-operative principles and thereby strengthen the functioning of milk societies, the Co-operative Development Programme is implemented. A trained team is deployed to conduct classes on technical and non-technical subjects for the farmers in the village. Trainings to society staff and management are also being done periodically. The Union also brings out a magazine, Gokulapatham (in malayalam language). The union supplies about 900 MT milma cattle feed per month to farmers through societies. Free accident insurance for farmers, cattle insurance, subsidy for construction of society building and for cattle shed, scholarship for education of children etc. are some of the other farmer welfare programmes extended by the MRCMPU.
In the Women Cattle Care Training Programme, a lady selected among the farm families in the village is trained to become a promoter who works as a change agent in the village. She conducts regular informal meetings to discuss different topics related to dairying and individual/societal development and forms 4-5 women groups (each with 20 to 25 women farmers) and take classes on the topics related to dairying. They are paid Rs 50 per class and Rs 10 per house visit. So, on an average they earn Rs 400-500 out of which 20% is borne by the society and the remaining by the Union.

At present the programme directly benefits 8,000 farm women spread over 100 APCOS villages. The topics include, clean milk production, calf rearing, feeding of dairying animals, disease prevention and control in animals, artificial insemination, family counselling, child psychology, income generating activities, consumer rights, home management, health and hygine . One supervisor is incharge of 20-25 societies. There are 158 technically trained persons available for extension. This includes 39 supervisors and 91 lady promoters.
The Mithila Dugdh Utpadak Sahkar Sangh (MDUSS) Ltd, Samastipur, is affiliated to the Bihar State Co-operative Milk Producers Federation (COMPFED). Sangh operates in Samastipur, Darbhanga and Madhubani districts of Bihar. Its objectives include organisation of amul pattern dairy co-operatives, providing technical input services for milk production enhancement, processing and marketing. The sangh procures milk through the 415 dairy co-operative societies in these districts. The extension activities include training to dairy farmers on management of dairy animals, fodder production technology, demonstrations on fodder varieties and urea straw treatment, artificial insemination services etc. The sangh gets financial support from the apex society COMPFED, NDDB and from Government of Bihar. The sangh also trains the staff and management committee members of the dairy societies on functioning of societies.
The Chottanagpur Adivasi Co-operative Vegetable Marketing Federation, Ltd, (VEGFED), Ranchi was constituted in 1987 for the marketing of fruits and vegetables grown by the adivasis of the sub-plains covering 10 districts of Bihar. It procures vegetables from tribal farmers and sells to vegetable markets in Ranchi and Calcutta. Apart from that the procurement is made through large sized Adivasi Multi-purpose Co-operative Societies (LAMPS), vegetable growers cooperative societies and mahila societies. The extension activities include, training programmes on mushroom production and marketing, demonstration on newer hybrids of tomato and organising vegetable growers' groups. VEGFED supplies seeds and fertilisers to vegetable growers on payment basis.
Bihar State Co-operative Lac Marketing Federation, (BSCLMF) Ranchi, was established primarily to purchase lac from farmers at a fair price and thereby to protect farmers from exploitation by the middle man. The organisation purchases lac either directly or through other societies such as LAMPS, primary agricultural co-operative societies, lac growers co-operative societies. It organises training and demonstration programmes in lac cultivation.
Among producers' co-operatives, milk co-operatives have been investing heavily for providing extension services to its members (Table 3.11). They also provide diverse services to its members. Expenditure intensity (exclusively for agricultural extension) is high in all cases, compared to the performance of many line departments. In all the above cases, only the member farmers are considered as the target population. Technical manpower for extension is high at MRCMPU, Kerala, because of trained lady promoters (100) employed for extension activities.
Table 3.11. Extension performance of producers' co-operatives
No. Organisation Expenditure intensity (Rs /ha)
Contact intensity (hr /target population)
Technical manpower: cultivator ratio
1. MRCMPU, Kozhicode, Kerala
166.67 4.47 1:316
2. VEGFED, Ranchi, Bihar
5.6 0.19 1:19750
3. BSCLMF Ranchi, Bihar
3.7 0.53 1:11200
4. MDUSS Ltd, Samastipur Bihar
10.07 4.7 1:649
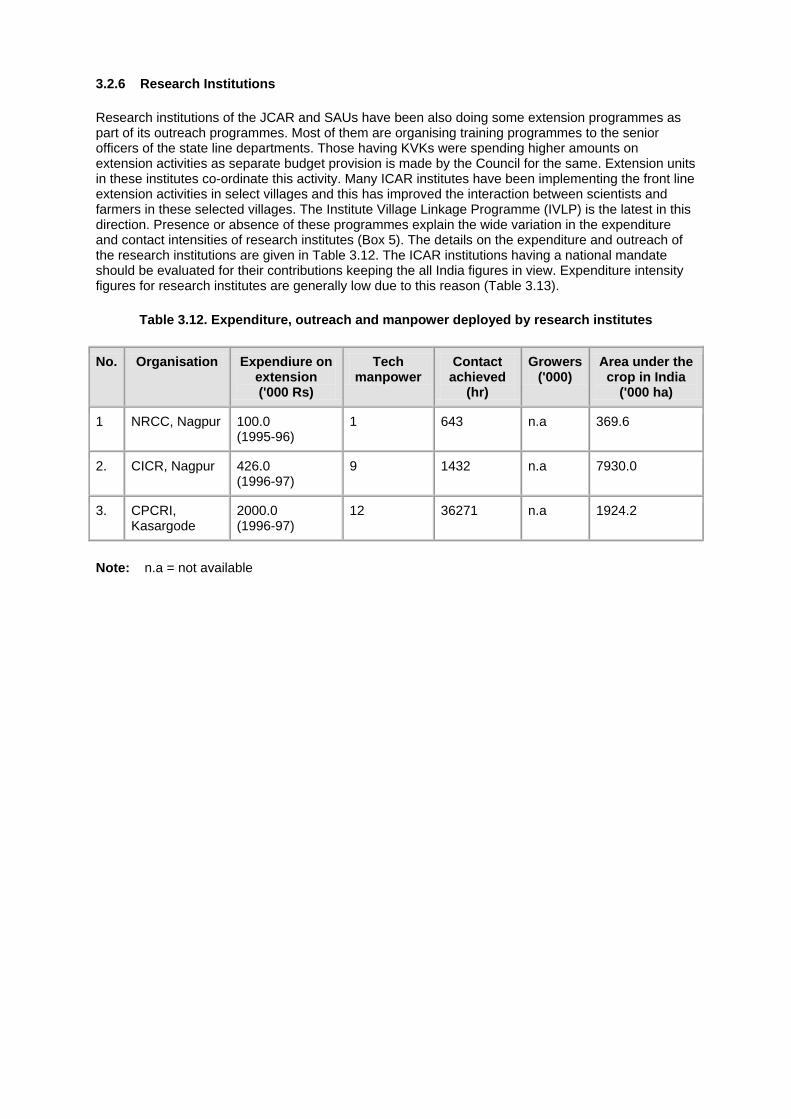
3.2.6 Research Institutions
Research institutions of the JCAR and SAUs have been also doing some extension programmes as part of its outreach programmes. Most of them are organising training programmes to the senior officers of the state line departments. Those having KVKs were spending higher amounts on extension activities as separate budget provision is made by the Council for the same. Extension units in these institutes co-ordinate this activity. Many ICAR institutes have been implementing the front line extension activities in select villages and this has improved the interaction between scientists and farmers in these selected villages. The Institute Village Linkage Programme (IVLP) is the latest in this direction. Presence or absence of these programmes explain the wide variation in the expenditure and contact intensities of research institutes (Box 5). The details on the expenditure and outreach of the research institutions are given in Table 3.12. The ICAR institutions having a national mandate should be evaluated for their contributions keeping the all India figures in view. Expenditure intensity figures for research institutes are generally low due to this reason (Table 3.13).
Table 3.12. Expenditure, outreach and manpower deployed by research institutes
No. Organisation Expendiure on extension ('000 Rs)
Tech manpower
Contact achieved
(hr)
Growers ('000)
Area under the crop in India
('000 ha)
1 NRCC, Nagpur 100.0 (1995-96)
1 643 n.a 369.6
2. CICR, Nagpur 426.0 (1996-97)
9 1432 n.a 7930.0
3. CPCRI, Kasargode
2000.0 (1996-97)
12 36271 n.a 1924.2
Note: n.a = not available
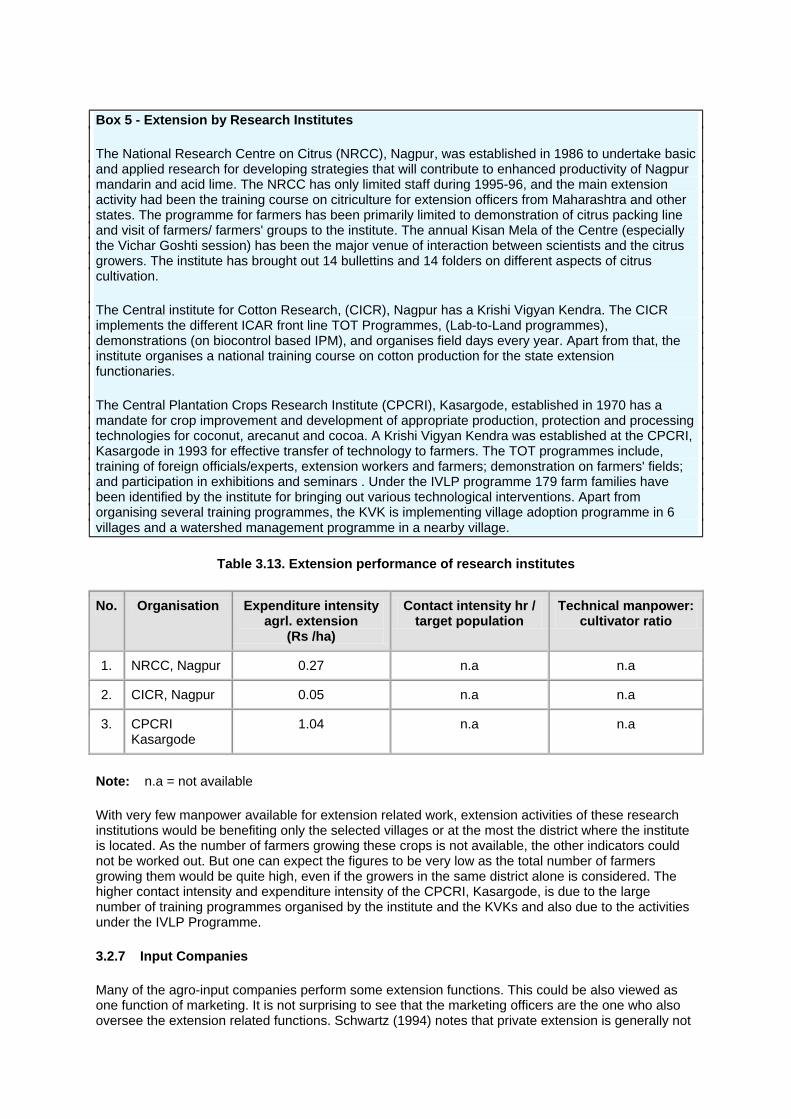
Box 5 - Extension by Research Institutes
The National Research Centre on Citrus (NRCC), Nagpur, was established in 1986 to undertake basic and applied research for developing strategies that will contribute to enhanced productivity of Nagpur mandarin and acid lime. The NRCC has only limited staff during 1995-96, and the main extension activity had been the training course on citriculture for extension officers from Maharashtra and other states. The programme for farmers has been primarily limited to demonstration of citrus packing line and visit of farmers/ farmers' groups to the institute. The annual Kisan Mela of the Centre (especially the Vichar Goshti session) has been the major venue of interaction between scientists and the citrus growers. The institute has brought out 14 bullettins and 14 folders on different aspects of citrus cultivation.
The Central institute for Cotton Research, (CICR), Nagpur has a Krishi Vigyan Kendra. The CICR implements the different ICAR front line TOT Programmes, (Lab-to-Land programmes), demonstrations (on biocontrol based IPM), and organises field days every year. Apart from that, the institute organises a national training course on cotton production for the state extension functionaries.
The Central Plantation Crops Research Institute (CPCRI), Kasargode, established in 1970 has a mandate for crop improvement and development of appropriate production, protection and processing technologies for coconut, arecanut and cocoa. A Krishi Vigyan Kendra was established at the CPCRI, Kasargode in 1993 for effective transfer of technology to farmers. The TOT programmes include, training of foreign officials/experts, extension workers and farmers; demonstration on farmers' fields; and participation in exhibitions and seminars . Under the IVLP programme 179 farm families have been identified by the institute for bringing out various technological interventions. Apart from organising several training programmes, the KVK is implementing village adoption programme in 6 villages and a watershed management programme in a nearby village.
Table 3.13. Extension performance of research institutes
No. Organisation Expenditure intensity agrl. extension
(Rs /ha)
Contact intensity hr / target population
Technical manpower: cultivator ratio
1. NRCC, Nagpur 0.27 n.a n.a
2. CICR, Nagpur 0.05 n.a n.a
3. CPCRI Kasargode
1.04 n.a n.a
Note: n.a = not available
With very few manpower available for extension related work, extension activities of these research institutions would be benefiting only the selected villages or at the most the district where the institute is located. As the number of farmers growing these crops is not available, the other indicators could not be worked out. But one can expect the figures to be very low as the total number of farmers growing them would be quite high, even if the growers in the same district alone is considered. The higher contact intensity and expenditure intensity of the CPCRI, Kasargode, is due to the large number of training programmes organised by the institute and the KVKs and also due to the activities under the IVLP Programme.
3.2.7 Input Companies
Many of the agro-input companies perform some extension functions. This could be also viewed as one function of marketing. It is not surprising to see that the marketing officers are the one who also oversee the extension related functions. Schwartz (1994) notes that private extension is generally not

a stand-alone activity but will be provided where three conditions hold. First, purchased inputs must be necessary to achieve desired production results. Second, these purchased inputs must be cost effective relative to output prices. Third, there should be a fairly high degree of competition between input suppliers for the same market share. In many countries, much extension work is done by companies selling pesticides and other agro-chemicals and animal feed companies (van den Ban, 2000).
Major categories of agro-input companies include, those dealing with seeds, fertilisers, pesticides and agro-machinery. Of these, only the seed and fertiliser companies are the important one as far as the extension functions are concerned.
3.3.7a. Input Companies-Seeds
The seed companies spent a considerable amount of money on advertisements, mainly to boost the sale of its products. It could vary from billboards, wall paintings, leaflets and media advertisements. As many of these activities also serve as an impetus for adoption of improved technology, we have included these also under extension expenditure in this analysis. They also take up few demonstration plots to publicise the new varieties they may have in the season. Some companies also sponsor the costs of some extension activities of line departments such as agricultural seminars. Some companies also train their seed growers. The companies do not provide any extension support to individual growers or farmers groups as they employ only limited manpower in their target area (Table 3.14).
Table 3.14. Expenditure, outreach and manpower details of seed companies
No. Organisation Expenditure on extension
('000 Rs)
Tech manpower
Contact achieved
(Hrs)
Population ('000)
Area ('000Ha)
1 Ankur Seeds, Nagpur, Maharashtra
E=30175.0 (1996-97)
805* 90900 38567.8 153Dts of 7 states
49758.5
2 Messina Beej Pvt Ltd, Samastipur Bihar
E=914.0 (1995-96)
31 20530 9772.6 8366.4
Note: * it comprises 40 permanent staff and 765 field assistants recruited on ad-hoc basis during the crop season (3-7 field assistants per district).
Big seed companies have one marketing officer to take care of its products (liasing with the dealers, create demand and match supply with demand) for a district or group of districts and one or two marketing assistants to help them. The companies prefer graduates in agriculture for this type of job, but it is is not an essential qualification. Pushing sales, being their primary mandate, the marketing officers/assistants seldom deal directly with farmers. Rarely they find time to provide any information to farmers or visit the fields of farmers who had purchased seed of the company.
But in high value crops such as flowers, there are input firms which provide total extension support to their growers (Box 6). This includes advice from site selection to technological guidance throughout the growing period and advice on marketing. The cost of this service forms a part of the input cost. Growing high value flowers is a risky option, because of high capital investments required and little experience of farmers in growing them. Moreover, the capability of other extension agencies such as line departments or universities is poor in this area. Unless supported by the companies, farmers are not likely to accept them. The expenditure intensity figures are low, though the actual figures may appear to be impressive (Table 3.15). The limited manpower and that too concentrating primarily on marketing limits the effectiveness of extension activities of seed companies.

Box 6. Extension by Seed Companies I
Ankur Seeds Private Limited, Nagpur, deals with production and marketing of hybrid seeds of cotton, oilseeds and a broad range of vegetables. The company operates in 153 districts of the country spread in 6 states, namely, Andhra Pradesh, Maharashtra, Karnataka, West Bengal, Gujarat and Punjab. Most of its marketing officers are agricultural graduates. One marketing officer is in charge of 2-3 districts. One or two marketing representatives (depending on the potential of that district) assist the marketing officers in each district. The company also recruits field assistants for 6 months (in the season) in selected districts to improve sales of its seeds during the season. The company selects few farmers' fields for demonstration of their varieties, and conducts field days at the demonstration site. The company arranges with the help of dealers, the visit of farmers from different parts of the district during the field day. About 25% of the turnover of company is being spent for marketing operations. This includes, extension, market operations, publicity, advertisements, printing of literature etc.
Messina Beej Private Limited, Samastipur, is a private seed company operating in the 27 districts of North Bihar. The company deals in production and marketing of seeds of major cereals, pulses and vegetables. The company organises few demonstrations on farmers' fields on new varieties of crops, especially maize. The company brings out leaflets, posters and advertisements in dailies and magazines.
Kumar Gentech and Tissue Culture Co, Pune, is a private company specialising in the production and supply of flower plants viz, gerbera, carnations, gladiolus, (ilium and tissue culture banana which are marketed in the domestic and in the international market. The company also specialises in marketing of various flower bulbs and cuttings through its partnership with various Dutch companies. The company provides total extension support which includes advice from site selection to technological guidance throughout the growing period (on-site consultancy) and advice up to marketing. The company participates in exhibitions and give advertisements in agricultural magazines to reach potential clients. The company has 7 highly qualified professional staff to provide these services to farmers and have established more than 150 greenhouses, of which 100 are in Maharashtra. The company doesn't charge extra for providing these services as the costs involved is already embedded in the cost of the input. The company spent about 9.4 lacs in 1997-98 for their activities related to marketing, advertisement and sales promotion.
Table 3.15. Extension Performance of seed companies
No. Organisation Expenditure intensity agrl. extension
(Rs Iha1)
Contact intensity hr/target population
Tech manpower, cultivator ratio
1. Ankur Seeds, Nagpur 0.61 0.002 1:47910
2 Messina Beej Pvt Ltd., Samastipur
0.17 0.002 1:315247
3.2.7b. Input Companies-Fertilisers
Perhaps no other input company invests so heavily on extension, as fertiliser companies. As in seeds, it is very difficult to differentiate out market promotion and extension costs. But the activites of fertiliser companies are more visible and diverse than that of seed companies. All fertiliser companies undertake demonstrations on fertiliser use, distributes leaflets on fertiliser use, cultivation practices etc, conduct farmers' meetings, crop seminars etc, and arrange soil testing facilities. Some also go for village adoption programme. Though the technical manpower available with them is limited, they arrange several programmes through close collaboration with agricultural departments and universities. For farmers' meetings, seminars etc, the company arranges services of experts from line departments.

For extension activities, the company entrusts certain amount of expenses to their regional sales officers, who in turn finalises the programme in consultation with state level managers. Field level arrangements are made through the dealers. Some companies also train their dealers in basic principles of fertiliser use.
In terms of geographical coverage and diversity of operations, IFFCO tops the list of fertiliser companies (Box 7). FACT spent in 1997-98, Rs 81,500/- for its extension activities in Kasargode District (Table 3.16). KRIBHCO spent Rs 20,000/- in Nagpur District during the year 1995-96 and was found spending Rs 10,000 on an average in the districts of Bihar. IFFCO spent Rs 4,00,000 for the entire Kota Region comprising 6 districts (about Rs 67,000 per district) in the year 1997-98. Indo-Gulf Fertilisers and Chemicals spent Rs. 240,000 for the 37 districts of Bihar (Rs. 6500 per district).
Box 7. Extension by Fertiliser Companies
Indian Farmers Fertiliser Co-operative Limited (IFFCO), has a strong team of 500 field professionals at the grassroots level currently engaged in its agricultural service activities spread across 16 states. The extension activities of the IFFCO could be broadly grouped under four heads namely, (i) demonstrations, (ii) field programmes (seminars, visit of farmers to research stations, soil testing etc.) (iii) seed multiplication, and (iv) village adoption. IFFCO promoted trust Co-operative Rural Development Trust (CORDET) with units at Kalol (Gujarat) and Phulpur (Uttar Pradesh), provide education and training to farmers on crop production, animal husbandry, farm machinery etc. IFFCO has worked in 503 villages in 1997-98 under the village adoption programme. Soil testing, plant protection, fumigation, weed control, seed treatment, tree plantation, medical check up and veterinary check up are undertaken in these villages. To enhance the financial, infrastructural and managerial capacities of village level co-operative societies, IFFCO has adopted 500 village level co-operative societies in different states in 1997-98. IFFCO has also established Farmers Service Centres (Kisan Seva Kendras) to supply inputs at reasonable prices, disseminate latest technical know-how and supply farm implements and equipment like sprayers and dusters for community use.
Krishak Bhararthi Co-operative (KRIBHCO) also undertakes educational activities such as demonstrations, crop seminars, farmers' meetings, distribution of leaflets on scientific management of crops and visit to agricultural universities as part of its extension and sales promotion activities. The company also implements village adoption programme and several community services are provided in such villages.
Indo-Gulf Fertiliser and Chemicals Corporation Limited, is a private sector fertiliser company having its operations in North India (Uttar Pradesh, Bihar, West Bengal, Punjab and Haryana). The company conducts crop demonstrations, farmers meetings, farmers' conducted tours etc. The company's main promotional activity is the Jeep Campaign in villages. The company has initiated 40 Shaktiman Krishi Seva Kendras in 1995-96, each with an outlay of Rs.6,000.
Fertilisers and Chemicals Travancore Limited (FACT) is a major fertiliser company having strong market presence in South India. Its field level operations are concentrated in Kerala, Tamil Nadu, Karnataka and Andhra Pradesh. The company conducts crop campaigns in important crops during the season in select districts. FACT organises study classes by experts from DoA and agricultural universities. During the campaign period, the company employs squad boys to visit houses of farmers to distribute leaflets and to explain to them on the company, its products and its scientific use. The company has adopted 4 tribal villages (1 village in each state) in 1997-98 and has allocated Rs~ 4 lakh for each village to boost the socio-economic infrastructure of these villages

Table 3.16. Expenditure, outreach and manpower details of fertiliser companies
No. Organisation Expenditure (extension)
(000 Rs)
Tech Manpower
Contact achieved
(hr)
Population ('000)
NCA ('000ha)
1 KRIBHCO, Nagpur, Maharashtra
20.0 (1996-97)
1 525 202.0 551.7
2. IFFCO, Kota, Rajasthan
417.9 (1996-97)
2 6000 976.0 1723.9
3. Indo-Gulf Fertilisers & Chemicals, Patna, Bihar
240.0 (1995-96)
29 68620 12204.7 11321.1
4. KRIBHCO, Patna, Bihar
200.0 (1995-96)
6 237018 7702.9 6307.7
5. Fertilisers & Chemicals Travancore Ltd (FACT), Kochi, Kerala
81.5 (1997-98)
1 1700 41.6 1411.9
Table 3.17. Performance indicators of fertiliser companies
No. Organisation Expenditure intensity agricultural
extension (Rs /ha)
Contact intensity (hr/ target
population)
Tech manpower: cultivator ratio
1. KRIBHCO, Nagpur, Maharashtra
0.04 0.003 1:202000
2. IFFCO, Kota, Rajasthan 0.24 0.006 1:488000
3. Indo-Gulf Fertilisers and Chemicals Corp. Ltd., Patna, Bihar
0.02 0.006 1:420851
4. KRIBHCO, Patna, Bihar 0.05 0.03 1:1283819
5. Fertilisers and Chemicals Travancore Ltd., (FACT) Kochi, Kerala
0.57 0.04 1:41562
Though the sales officers/marketing officers are mostly technical graduates in agriculture, their nature of work (being on tour all the days) makes them unavailable for any systematic extension support to farmers. So farmers do not consider the companies as an important source of information. The next chapter on sources of information illustrates this aspect.
3.2.8 Consultancy Services
Emergence of paid extension services in agriculture is a recent phenomenon in agriculture. Farmers, during the course of this study, reported instances where they have availed services of experts from the public sector (research and extension) on payment basis in specific crops such as fig and grapes. Many professionals after retirement from the public system have also been providing consultancy (free/paid) to the farmers. The farmers often meet the travel expenditure or arrange vehicle for the expert. Farmers at Narayangav told that in grapes, consultants charge Rs 1,000 per acre as consultancy fees and during the season, they make 3-4 visits to advise the farmer on measures to be

adopted. As paid consultancy by the public system was not officially permitted and its incidence few, the nature and extent of such arrangements were difficult to assess.
Box 8. Consultancy services in agriculture
Green Plus- Agro Laboratories and Consultancy was established in 1995 at Pimpalgaon, Nasik District. The firm conducts soil and water analysis, provides consultancy to farmers (on plant protection, fertilisers, irrigation equipment, etc) and sells pesticides and irrigation equipment. Five agricultural post-graduates own the company and provide these services. They also visit farmers' field on request. The company has been organising seminars and demonstrations (mostly sponsored by input companies) for the benefit of farmers. The cost of one consultancy is Rs 20. On an average, 20 farmers approach them for consultancy daily. According to the firm, the fees is not compulsory, but they expect these farmers to buy agro-inputs from them. The area of operation is Nasik District. Table 3.19 reveals its performance on the indicators. The outreach is very limited as obvious from the very low contact intensity and technical manpower :cultivator ratio.
Consultancy Cell, College of Agriculture, Nagpur, started the consultancy cell in 1996, by forming a team of 4 senior professors of the College from departments of Agronomy, Entomology, Plant Pathology and Horticulture. The cell has been organising Agro-poly clinic with a clear mandate to provide quality services and generate resources. The Agro-poly Clinic meets every monday at the College to provide technical solutions to queries and problems of farmers. While most of the consultation had been free, some of them had been charged at the rate of Rs 20. The cell has also decided on the rates for training programmes and generated about Rs 53,000 by way of technical consultancy and training in 1997-98 (Annexure 3). The cell could also generate about Rs 7 lakh through sale of publications and planting materials.
The farmers have also joined together in certain instances to avail the benefits of consultants. Exotic vegetable growers around Delhi have come together to hire professionals on a retainer ship basis. Similarly small growers of grape, poultry, angora rabbits, mushroom have also joined collectively to hire technical advisory and plant/animal protection services (MANAGE, 1993). Many have reported about such instances in the country. Knowing fully well the scope for such services and the revenue it may generate, some organisations are presently opening up their facilities for paid consultancy services (Box 8).
With an intention to provide free consultancy to farmers, state agricultural departments initiated the programme of Agro-poly Clinic. In Kerala, the programme was mainly intended for rice growing areas, where a site is located and the VEW/AOs are expected to be available at the place on the same day every week for a minimum of two hours. The objective of Krishi Seva Kendra in Rajasthan and Agro-poly clinic of DoA in Maharashtra have been also similar. This should have definitely helped in increasing the contact between farmers and the DoA. But the general constraints of the DoA, related to lack of specialised technical expertise and limited time available for performing these tasks affected the functioning of these programmes.
Young technically qualified professionals have also now entered into the fray, by starting their own consultancy firms. There are also few big firms in the market willing to offer their technical expertise in farm development, glass house erection, micro irrigation systems, tissue culture etc. With the spurt in agro-exports, especially in fruits and vegetables, many foreign consultants are providing their services to Indian companies and farmers. Input companies engaged in floriculture are also providing consultancy services to growers who buy inputs from them (Box 6).
The details of two organisations providing consultancy services to farmers are given in Table 3.18.

Table 3.18. Expenditure, outreach and manpower details of consultancy firms
No. Organisation Extension expenditure
'000 Rs
Tech Manpower
Contact achieved
(hr)
Cultivators ('000)
NCA ('000ha)
1 Green Plus, Nasik, Maharashtra
100 (1994-95)
5 1873 667.0 886.8
2. Consultancy Cell, College of Agriculture, Nagpur, Maharashtra
n.a 4 9522 202.0 551.7
Even farmers from neighbouring districts have been coming to avail the services of the consultancy cell at Nagpur. The overwhelming response to the consultancy services initiated at the College has brought to light the market for quality advice in agriculture. The expenditure of the Consultancy cell could not be derived as the College is using only the existing expertise available and no specific budgetary outlay to cover the expenditure of this cell is provided. The TC ratio could not be correctly estimated as the College uses expertise of many of its staff in the training programmes occasionally. As even these four professors are also not working full time for the cell, the figures would in any case be low. The services benefitted about 21,000 farmers in an year reveals the potential of such services (Annexure 3).
Table 3.19. Extension performance of consultancy firms
No. Organisation Expenditure Intensity
(extension) (Rs /ha)
Contact intensity hr/target
population
Tech manpower: cultivator ratio
1. Green Plus, Nasik, Maharashtra
0.15 0.003 1:135400
2. Consultancy Cell, Agro-poly Clinic, College of Agriculture, Nagpur
n.a 0.047 1:50500
Note: n.a = not available
3.2.9 Non-Governmental Organisations
Estimates of the number of NGO's active in rural development in India range from fewer than 10,000 to several hundred thousand depending on the type of classification used. Some 15,000-20,000 are actively engaged in rural development. Wide variations in the densities of NGOs exist among states. Within these states, certain districts have high densities of NGOs, which overlap and compete for clients, while in other areas there are hardly any NGOs active on the ground. Annual NGO revenue from abroad is in the region of Rs 9 billion (Farrington and Lewis, 1993).
The eighties saw a spurt in the growth of NGOs working in rural development, especially in watershed development. To increase the involvement of NGOs in efforts to strengthen the research-extension delivery system, a pilot central government scheme, agricultural extension through voluntary organisations, was launched in 1994-95. Initially this scheme is being implemented on pilot basis by involving 14 NGOs from 8 states. Experience has been encouraging both in terms of physical targets and in integrating NGO efforts with those of the main extension system (DAC,1996b).The number of NGOs under this programme is proposed to be increased to 50 in the Ninth Plan covering more number of states in a phased manner.
States are also encouraging the NGOs to take up extension activities. The Department of Agriculture, Rajasthan, has extended an invitation to NGOs to take up extension work in any defined extension

unit such as a cluster or an Assistant Agricultural Officer Circle. Under Agricultural Development Project, the functioning of three Assistant Agricultural Officer (AAO) circles were handed over to NGOs. For instance, the AAO Circle Nawalgarh (Jhujhunu District) was handed over to M R Morarka, GDC
Box 9. Extension by Non-Governmental Organisations
Bhartiya Agro Industries Federation (BAIF), a non-profit development research foundation, was established in 1967, at Urlikanchen near Pune. Started with a dairy cattle production programme, BAIF diversified to embrace animal health, nutrition, afforestation, wasteland development and tribal rehabilitation. BAIF is operating 645 cattle breeding centres in 7 states and employs currently a staff of almost 3,000. A large number of international donors support the activities of BAIF. It also receives funding support from ICAR, CAPART, DRDA, NABARD, Dept. of Social Welfare, Department of Biotechnology, Department of Science and Technology, Department of Wasteland Development, Central Silk Board, BAIF is probably the largest and highly organised NGO in India and have proved that in livestock service delivery, they are more efficient than the government machinery (Satish and Prem Kumar, 1993).
Society for Rural Industrialisation (SRI) operates in Ranchi, Bihar, with the avowed objective of agricultural and rural development. The subject matter areas include energy and environment, watershed development, agro-forestry, processing farm and non-farm production, and conduct training programmes for farmers in these areas. It receives funds from CAPART, DRDA and Ministry of HRD (Government of India).
The major objective of Mahila Bal Yuva Kendra, Patna, is development of agriculture and allied action for improving economic status. The subject matter areas include dairy management, mushroom cultivation, biogas, vegetable cultivation etc. It provides training and arranges demonstrations on the above topics. It receives funding support from Central Social Welfare Board; Ministry of Environment and Forests; Ministry of Health and Family Welfare; Indo-Canadian Co-operation Office, India; Rashtriya Gramin Vikas Nidhi, Delhi, etc.
Professional Assistance for Development Action (PRADAN) is an NGO working primarily in agriculture. In Bihar it is operating schemes in 8 districts. PRADAN provides services to other voluntary agencies and small village groups in the technical and management aspects of programme design and implementation. Subject matter areas dealt with include, micro lift irrigation, sericulture, water harvesting and management. PRADAN has been organising farmers groups (SHGs) in savings and credit, lift irrigation, micro watersheds, sericulture etc.
Social Policy Research Institute (SPRI), Jaipur was sanctioned the Agricultural Extension Project for AAO Circle Sivadaspura in July 1995, for an annual cost of Rs 463,500. The project was extended twice up to March 1997 and then up to March 1999 by the Government. The NGO selected and appointed one AAO and 7 Agricultural supervisors. The NGO has since then been doing the extension project at Sivadaspura and implementing all the programmes of the Department of Agriculture. The AAO works under the administrative control of the Assistant Director of Agriculture, Sanganeer.
Kuriakose Elias Service Society (KESS), Trichur, was established in the year 1974, by the Catholic Church. Its objectives are (i). to perform charity and (ii). to provide social services to the poor. It is operating in 4 states, namely Madhya Pradesh, Maharashtra, Tamil Nadu and Kerala. It provides training to rural poor in making clay products, house wiring, tailoring, electronics, plumbing, typewriting, carpentry, welding etc. The society has a 13 acre model agricultural farm at Trichur, supplying good planting materials and two agricultural experts guide farmers who come for specific advice. The main source of funding for the society comes from abroad, mainly from Germany.
Changanacherry Social Service Society, Kottayam was established in 1966. Its objectives is the integrated development of the people with special emphasis on the needs of the poor and marginalised. It operates in the five southern districts of Kerala and one district in Tamil Nadu. The subject areas include, vegetable cultivation, flower cultivation, beekeeping, backyard poultry and fish farming. The society provides trainings, conducts demonstrations and provides free consultancy to rural people in these areas. The society has one subject matter expert for each of these areas. Planting materials, chicks, bee colonies and fish seedlings are also provided by the society.

Gayatri Shiksha Sadan Samsthan, Udaipur is an NGO mainly involved in education. The samsthan has a number of educational institutions in Rajasthan. The Samsthan was sanctioned a Heifer project in the village Saarda (Udaipur District) to benefit 250 families. The Samsthan provided training to farmers on heifer maintenance, made the funds available from different departments to them for buying heifers, provided veterinary support to them by establishing a veterinary clinic nearby and initiated organised marketing of milk in the village. The project is partly funded by World Bank Agricultural Development Project (ADP). The heifer project also involves NABARD, CAPART, DoAH and TAD as donors and has attracted much attention from senior government officials
Research Foundation, Jaipur in April 1995. AAO Circle Shivadaspura (Jaipur District) was handed over to Social Policy Research institute, (SPRI) Jaipur and AAO Circle, Todaraisingh (Tonk district), was handed over to Jandhara Trust, Jaipur. Till February 1998, the Government of Rajasthan has given Rs 855,000 to Morarka Foundation and Rs 695,250 for SPRI. Funding for Jhandahra trust was discontinued after the initial payment of Rs 106,895 as their work was unsatisfactory by the review committee of DoA. Though many other NGOs were also given sanction for similar projects they were subsequently withdrawn on account of staff union intervention. Many NGOs were given grants by the government for specific projects such as Heifer Project, integrated watershed development etc.
Table 3.20. Expenditure, outreach and manpower details of NGOs
Expenditure ('000 Rs)
No. Organisation
Total Extension
Tech manpower
Contact achieved
(hr)
Cultivators ('000)
NCA ('000 ha)
1. Social Policy Research Institute, Jaipur, Rajasthan
463.5 (1996-97)
n.a 8 13722 14.6 15.7 (I AAO Circle)
2 Gayatri Siksha Sadan Samsthan, Udaipur, Rajasthan
1653.0 (1996-97)
n.a 5 8705 190 families
2.2 (16 villages)
3 Kuriakose Elias Service Society, Kottayam, Kerala
n.a 150.0 (1995-96)
2 1000 74.1 154.7
4. Changanacherry Social Service Society, Kottayam, Kerala
n.a 21.3 (1995-96)
5 13470 481.7 760.3
5. Mahila Bal Yuv Kendra, Patna, Bihar
1000 (1995-96)
n.a 3 57806 82.0 16.8 (3 blocks)
6 Society for Rural Industries, Ranchi, Bihar
809.9 (1995-96)
n.a 25 489720 374.2 261.2
7 Professional Assistance for Development Action (PRADAN) Ranchi, Bihar
6430.0 (1995-96)
n.a 53 106955 374.2 261.2
Note: n.a = not available
The TC ratio of NGOs are generally low (Table 3.21). But then they normally operate with only few selected group of clients. In the case of GSSS, the work was restricted to only 16 villages in a block and so they could achieve higher intensities. The total expenditure mentioned here includes the total

project cost which comprise mostly loans to farmers to purchase heifer. For all NGOs, the funds come from foreign donors or government departments. Several Ministries of the Government of India have separate provision to fund specific projects and NGOs are availing these opportunities. Mostly NGOs operate independently in their own areas, with less than optimal linkages with the government departments working in the area.
Table 3.21. Extension performance of NGOs
Expenditure intensity (Rs /ha)
No.
Organisation
Total Extension
Contact intensity (hr/target
population)
Tech manpower: cultivator
ratio
1. Social Policy Research Institute, Jaipur
29.58 n.a 0.94 1:1819
2. Gayatri Sikhsha Sadan Samsthan, Udaipur
735.6 n.a 45.82 1:38
3. Kuriakose Elias Service Society, Trichur
n.a 0.97 0.01 1:37032
4. Changanacherry Social Service Society, Kottayam
n.a 0.03 0.03 1:96331
5. Mahila Bal Yuv Kendra, Patna 59.52 n.a 0.71 1:27333
6. Society for Rural Industries, Ranchi 3.1 n.a 1.3 1:14969
7. Professional Assistance for Development Action (PRADHAN), Ranchi
2.36 n.a 0.61 1:33064
Efforts to foster collaboration between the Government Organisations (GO) and NGOs in agricultural research and extension were initiated in Udaipur district of Rajsthan in 1994. This was a new beginning and both have learnt several lessons out of that. This collaboration has been extensively documented by the Vidya Bhavan KVK, Udaipur. The experiences out of this were reviewed in 1996 by the Overseas Development Institute. Two important issues that constrained the effectiveness of this collaboration are:
1. Suspicion on the motives and competence of NGOs by the government departments resulting in non-cooperation in activities at the field level and active resistance by the employees who find in this a threat of loosing jobs in the long run.
2. Lack of staff and experience in agricultural research and extension by most NGOs.
But these constraints are not insurmountable and a lot of scope exists for active collaboration between the two so that the efficiency and effectiveness of both systems could be enhanced.
3.2.10 Commodity Boards
The Commodity Boards and other agencies under the Ministry of Commerce have been doing pioneering promotion work to give some of India's major commodities the competitive edge. There are now six commodity boards, 20 export promotion councils and two authorities, to promote production, marketing and export of various commodities.
The Rubber Board was constituted by the Government of India, as a body corporate primarily to promote natural rubber production under the Rubber Act, 1974. In order to undertake scientific, technological and economic research, the Board established the Rubber Research Institute of India (RRII) in 1955. With sustained research and development activities coupled with extension and advisory services for transfer of technology, the rubber producing sector had a quick changeover from

traditional methods to modern cultivation practices. Field services are rendered through zonal, supervisory, regional and field offices spread all over the country.
Kerala accounts for about 86% of the rubber area in the country and contributes 94% production of rubber (1996-97). Activities of the Board are thus mostly concentrated in Kerala. 324 field officers of the Board implement its extension activities. The activities include, visit to fields, demonstrations, training to growers (cultivation and processing, nursery establishment and maintenance), tappers (on scientific methods of tapping, mainly through 20 Tappers Training Schools) and rubber goods manufactures (on processing and product development), seminars, campaigns and publication of the farm magazine on rubber in 5 languages. Expenditure intensity of the board is quite high compared to many other organisations, even though this figure represents the total (Table 3.23). It also include amount spent on subsidies. The board has been giving a lot of subsidies for expanding area under rubber. The board conducts a number of extension and training activities and have a reasonably good TC ratio. As the activities are concentrated in only one crop, the board could conduct its activities more effectively.
Table 3.22. Expenditure, outreach and manpower details of the Rubber Board
Organisation Expenditure* ('000 Rs)
Tech man-power
(field officers)
Contact achieved
(hr)
Rubber growers
('000)
Area under rubber
('000 ha)
Rubber Board
T=439500 324 532018 932 533.2
Note: * Total expenditure, excluding money spent on research
Table 3.23. Extension performance of Rubber Board
Organisation Expenditure intensity total
(Rs /ha)
Contact intensity (hr/target
population)
Tech manpower: cultivator ratio
Rubber Board, Kottayam
824.2 0.57 1 :2876.
3.2.11 Marketing Boards
Farmers need information on existing and future market situations in a season and the potential prices that could be realised. Extension advice on marketing, be it prices, quality or demand at various centres are often not known to the producers and they often have to believe the middlemen who invents innumerable reasons for low prices.
Marketing societies are specifically formed for marketing commodities where the market for produce are largely imperfect, farmers have very limited alternative choice of crops, and they are incapable of confronting input risk, output risk and marketing risk because of their inadequate access to markets for various complementary inputs like irrigation, credit, agro-processing facilities, extension and even information. Marketing societies need infrastructural, technical and monetary support for their efficient functioning. Marketing Boards are constituted essentially to serve the cause of these marketing societies.
Maharashtra State Agricultural Marketing Board (MSAMB), was established at Pune in 1986 to promote programmes for the development of market committees (MC) and co-ordinate its functions. It also has a mandate to arrange propaganda and publicity on matters relating to agricultural produce through seminars, workshops, exhibitions etc. The programmes are co-ordinated through the Five Divisional H.Qs (Pune, Nasik, Aurangabad, Amravati and Nagpur) and implemented through the 254 established market committees in the state. The Board provides loans and consultancy services to the MCs, and also trains their officials.

Table 3.24. Expenditure, outreach and manpower details of Marketing Board( 1995-96)
Organisation Total extension expenditure ('000
Rs)
Tech manpower
Contact achieved
(hr)
Cultivators ('000)
NCA ('000ha)
Maharashtra State Agricultural Marketing Board, Pune
3340.0 20 18121 9856 17896.8
MSAMB has been organising a number of seminars on production and marketing of fruits and flowers every year. To motivate farmers and their organisations for production and marketing of agricultural products more competitively, MSAMB organised one motivational camp in every district in 1995-96. The Board has initiated a number of steps in identifying the domestic and international markets for horticultural products in the state. It was instrumental in the establishment of farmers co-operatives in grapes, mango and banana. The Board organised the Floriculture Cooperative Development Society at Pune, for providing guidance to farmers interested to grow flowers and also started a Floriculture Training Centre at Talegaon Dabhade at its own farm. Through an ambitious programme, MARKNET, the Board has started networking the different market committees with the Headquarters so that the market situation could be monitored.
Table 3.25. Extension performance of Marketing Boards
Organisation Expenditure intensity Total
(Rs./ha)
Contact intensity hr /target population
Tech manpower: cultivator ratio
Maharashtra State Agricultural Marketing Board, Pune
0.19 0.002 1:492800
MSAMB has been undertaking activities for the development of markets, especially for the non-traditional agricultural produce of Maharashtra. In fruits and cut flowers, there is a lot of demand for information which has not been adequately addressed by any organisation. The line departments do not have the necessary expertise on these aspects. Extension activities of, MSAMB in fruits and cut flowers is a major step towards addressing the extension needs of farmers willing to diversify their crop mix. As the number of technical persons are few and its operational area spread throughout the state, its outreach is limited which is reflected in the very low contact intensity (Table 3.25). Effectiveness of its activities could be increased considerably, if it takes steps to train officials of line departments such as DoA who in turn would transmit these information at the grassroot level.
3.2.12 Media-AIR
There has been an unprecedented expansion of radio and television network in the country in recent past. This strong and cost effective medium of mass communication could play an effective role in disseminating agricultural technology among farmers for increasing agricultural production and productivity. "Rural broadcasting started in India as early as in 1935. But full fledged farm units were established only in 1966 for broadcasting programmes for farmers and farm women on a regular basis. At present there are 81 All India Radio stations producing and broadcasting agricultural and rural programmes" (Kaurani, 1995). All Doordarshan Kendras regularly telecast rural development programmes. The main thrust is on agriculture.
For effective linkage between the Ministry of Agriculture and Ministry of Information and Broadcasting, a three-tier mechanism for media coordination (national, state and kendra level) has existed since 1994. The total expenditure for the Farm and Home Unit/Agricultural and Rural programmes varies from Rs 3-5 lakhs per year (Table 3.26). The expenditure varies from 20 paise to 54 paise /ha. The agricultural programmes are aired in the morning and evening. Other programmes covering rural life namely programme on women and child development, nutrition and health are broadcast during noon.

The Farm School on air, the programme was initiated for the first time in the country at AIR, Trichur in 1972. AIR, Trichur, has also published the contents of some of these programmes as books . Recently two books, one on cashew (Kanakam Koyyan Kashumavu) and another on fisheries (Kadalekum Kanivukalum) were released. With only two persons to look after all the farm programmes, the unit has difficulties in preparing farm programmes very effectively. The other major constraint is the inability of the outside experts in the preparation of the script and proper presentation .
Stations at Patna and Jaipur have constraints on manpower side. There are only 3 officials to look after the Farm and Home Unit, which is highly inadequate keeping in view the work load of the unit. Earlier, at both Trichur and Patna, the Farm and Home Units had 6 staff members. But over the years, the Farm and Home Units have been marginalised. At Patna, the number of outdoor recorded programmes have become less and less, due to scarcity of transport facilities.
Table 3.26. Expenditure, outreach and manpower details of Farm and Home (F and H) unit of All India Radio
No Organisation Expenditure of Farm and Home Unit ('000 Rs)
Tech man
power
Broadcasting Hours
Cultivators ('000)
NCA ('000 ha)
Expenditure intensity
1. AIR, Jaipur, Rajasthan -
500.0 3 338 / year (1 .05 hrs/day)
2535.0 4236.9 (7 Dts)
0.20
2 AIR, Trichur, Kerala
300.0 2 342/ year (0.94 hrs/day)
252.6 555.4 (3 Dts)
0.54
3 AIR, Patna, Bihar
500.0 3 446/ year (1.25 hrs/day)
5585.5 4065.8 (16 Dts)
0.12
A review of the rural programmes of AIR and Doordarshan by Kaurani (1995) revealed e heavy emphasis on studio-based programmes in radio and television, mainly because of constraints in transport and inadequate recording equipment for preparing field-based programmes. To make programmes, interesting and useful, the emphasis should shift to field based programmes. He suggested following steps: (i) the monthly workshops held by SAUs for training SMSs on production recommendations specific to particular areas may be recorded for broadcast by AIR/Doordarshan, (ii) stories about project or programme successes and cases highlighting individual farmers and farmers' groups should also be broadcast, and (iii) the media should also cover problems of farmers and their solutions, and should provide timely information on input availability, weather conditions etc.
3.2.13 Media-Print
Organised attempts to use print media for extension work started with the initiation of Farm Information Bureaus/information Units in DoA of states. Almost all state line departments, especially the DoA, brings out farm magazines, in respective state language. The folders/leaflets produced by them are often distributed free. The SAUs and ICAR are also bringing out magazines and extension bulletins in selected crops.
With rise in rural literacy levels, the vernacular newspapers started giving more importance to matters related to agriculture and rural development. This became essential as the number and circulation of vernacular newspapers increased and competition for new subscribers narrowed down to rural areas. Newspapers are published in as many as 100 languages/dialects during 1995. The circulation of newspapers in the four states of this study is given in Table 3.27.

Table 3.27. Circulation of newspapers in the study states
SI.No States Number of newspapers Published check Circulation (in thousands)
1. Maharashtra 329 7163
2. Rajasthan 510 4166
3. Kerala 147 7668
4. Bihar 100 2718
Source: Mo I &B (1996)
Almost all the vernacular newspapers (dailies) are presently devoting one page once in a week exclusively for matters related to agricultural development. New periodicals, exclusively covering agriculture and animal husbandry also came into circulation (Annexure 4 and 5).
Being a highly literate state, the percentage of newspaper reading population is quite high in Kerala. Newspapers and farm magazines are considered as an important source of agricultural information by farmers of Kerala (Chapter IV). The important farm magazines in Kerala are, Karshakan, Karshakasree and Kerala Karshakan. Karshakan (monthly) belongs to the Deepika Group of newspapers, Karshakasree (monthly) to Malayala Manorama group and the Kerala Karshakan (fortnightly) to the Farm Information Bureau of the DoA. The annual subscription rates are Rs 80, Rs.120 and Rs. 50 respectively. Out of these, Karshakan has the maximum circulation. Details of this publication are given in Table 3.28.
Table: 3.28 Expenditure and circulation of farm magazines
State Magazine Expenditure total
(000 Rs)
Tech manpower
No. of copies
Area Copies : cultivator
ratio
Kerala Karshakan (monthly)
3900.0 3 35,000 All over Kerala
1:29
The increase in the number and circulation of farm magazines indicate 'm the increasing willingness of farmers for paid printed information. There is a lot of scope for print media to get involved in agri-publishing. Almost all I publications of DoA and SAUs are either highly subsidised or free. Even 1 then only few copies are being sold, many are under-subscribed. The articles are mostly of inferior quality and low readability. There are instances wherein the free leaflets are not distributed down the line from the HQs. The DoA and SAUs need to come up with a media plan and should make improvements in the layout and printing quality of their publications, and initiate steps for charging at least its cost of production.
3.2.14 Others
Apart from organisations mentioned above, several corporations, boards, authorities etc constituted by the government provide services in specific crops and areas. They are not covered under this study. The important among them is the Command Area Development Authority (CADA). There are 54 CADAs in the country and each of them have an Extension Wing. Apart from routine visits and distribution of inputs for demonstrations, the CAD/^ has been organising farmers in the command areas. Wherever the water user associations are formed, extension activities are organised with their co-operation. Some agro-processing companies such as Pepsi Foods, Punjab and ITC, Hyderabad are also providing extension support to their contract growers.

3.3 Implications
a. Extension performance
To compare the performance of these different groups of organisations, their average values were found out. These are given in Table 3.29.
Table 3.29. Performance indicators of extension organisations (Average)
Extension expenditure (Rs/ha)
No. Organisation
Total Total-Salary
Extension
Contact intensity
(hr/ target population)
Tech manpower: cultivator ratio
1. Department of Agriculture
44.94 4.57 -- 0.40 1:1332
2. Directorate of Extension SAUs)
0.74 - - 0.01 1:63500
3. Krishi Vigyan Kendras
5.58 4.21 - 0.09 1:54255
4. Farmers Associations
- - 46.97 3.01 1:1080
5. Producers' Cooperatives
- - 34.10 1.96 1:928
6. Research Institutes - - 0.24 - -
7. Input companies-Seeds
-- - 0.53 0.002 1:57823
8. Input Companies-Fertiliser
-- -- 0.47 0.014 1:5,41723
9. NGOs 18.59 - - 0.49 1:13871
10. Consultancy Services
-- -- - 0.013 1:96555
11. Commodity Board 824.2 *
- - 0.57 1:2876
12. Marketing Boards 0.19 -- - 0.002 1:492800
13. Media-AIR 0.15 - - - -
14. Media-Print 1.73 -- - - -
* A good amount of this goes as subsidies and administrative expenses
As the Department of Agriculture, Directorate of Extension and Krishi Vigyan Kendras are exclusively meant for providing extension services, their total expenditure (T) has to be considered as the actual extension expenditure.
In terms of expenditure intensity on extension, the farmers associations (Rs 46.97) and the Department of Agriculture (Rs 44.94) are spending the maximum amount per hectare of net cropped area. Producers' cooperatives comes third with an average expenditure of Rs 34.10, followed by
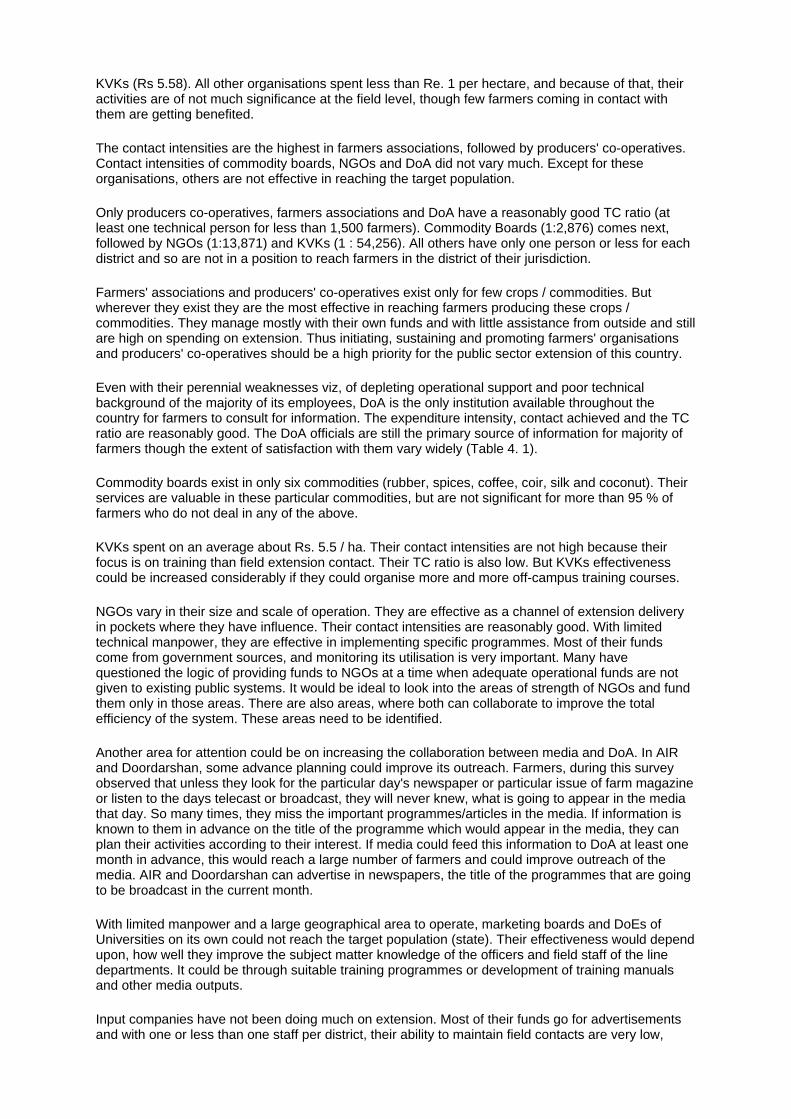
KVKs (Rs 5.58). All other organisations spent less than Re. 1 per hectare, and because of that, their activities are of not much significance at the field level, though few farmers coming in contact with them are getting benefited.
The contact intensities are the highest in farmers associations, followed by producers' co-operatives. Contact intensities of commodity boards, NGOs and DoA did not vary much. Except for these organisations, others are not effective in reaching the target population.
Only producers co-operatives, farmers associations and DoA have a reasonably good TC ratio (at least one technical person for less than 1,500 farmers). Commodity Boards (1:2,876) comes next, followed by NGOs (1:13,871) and KVKs (1 : 54,256). All others have only one person or less for each district and so are not in a position to reach farmers in the district of their jurisdiction.
Farmers' associations and producers' co-operatives exist only for few crops / commodities. But wherever they exist they are the most effective in reaching farmers producing these crops / commodities. They manage mostly with their own funds and with little assistance from outside and still are high on spending on extension. Thus initiating, sustaining and promoting farmers' organisations and producers' co-operatives should be a high priority for the public sector extension of this country.
Even with their perennial weaknesses viz, of depleting operational support and poor technical background of the majority of its employees, DoA is the only institution available throughout the country for farmers to consult for information. The expenditure intensity, contact achieved and the TC ratio are reasonably good. The DoA officials are still the primary source of information for majority of farmers though the extent of satisfaction with them vary widely (Table 4. 1).
Commodity boards exist in only six commodities (rubber, spices, coffee, coir, silk and coconut). Their services are valuable in these particular commodities, but are not significant for more than 95 % of farmers who do not deal in any of the above.
KVKs spent on an average about Rs. 5.5 / ha. Their contact intensities are not high because their focus is on training than field extension contact. Their TC ratio is also low. But KVKs effectiveness could be increased considerably if they could organise more and more off-campus training courses.
NGOs vary in their size and scale of operation. They are effective as a channel of extension delivery in pockets where they have influence. Their contact intensities are reasonably good. With limited technical manpower, they are effective in implementing specific programmes. Most of their funds come from government sources, and monitoring its utilisation is very important. Many have questioned the logic of providing funds to NGOs at a time when adequate operational funds are not given to existing public systems. It would be ideal to look into the areas of strength of NGOs and fund them only in those areas. There are also areas, where both can collaborate to improve the total efficiency of the system. These areas need to be identified.
Another area for attention could be on increasing the collaboration between media and DoA. In AIR and Doordarshan, some advance planning could improve its outreach. Farmers, during this survey observed that unless they look for the particular day's newspaper or particular issue of farm magazine or listen to the days telecast or broadcast, they will never knew, what is going to appear in the media that day. So many times, they miss the important programmes/articles in the media. If information is known to them in advance on the title of the programme which would appear in the media, they can plan their activities according to their interest. If media could feed this information to DoA at least one month in advance, this would reach a large number of farmers and could improve outreach of the media. AIR and Doordarshan can advertise in newspapers, the title of the programmes that are going to be broadcast in the current month.
With limited manpower and a large geographical area to operate, marketing boards and DoEs of Universities on its own could not reach the target population (state). Their effectiveness would depend upon, how well they improve the subject matter knowledge of the officers and field staff of the line departments. It could be through suitable training programmes or development of training manuals and other media outputs.
Input companies have not been doing much on extension. Most of their funds go for advertisements and with one or less than one staff per district, their ability to maintain field contacts are very low,

leaving them with a very low contact intensity. Private consultancy services operate in few crops and that too in few locations. But the experience of Agricultural College Nagpur, shows the potential of the consultancy service. Consultancy services by SAU units would go a long way in initiating paid services in farm extension, improve the availability of quality services the farming community, and improve the financial situation of the SAU units.
b. Services provided-
DoA staff makes routine visits and pass technical messages on what needs to be done in important crops, especially food crops and ha been organising farmers groups. In Rajasthan, groups were formed widen the uptake of VEW messages, whereas in Kerala, the group were formed around crops and the focus is on self-help. DoA activities all states are constrained by inadequate operational funds and partly inadequate subject matter knowledge/training of majority of the staff Most of their time goes on implementation of a number of State and Central sector programmes that have some input/subsidy delivery Almost all services are free.
Directorate of Extension of SAUs organises few training programmes and provides communication support (publications, exhibitions etc) to its units living in the nearby districts. Their activities are mostly benefitting farmers living in the nearby areas/districts of its location. For SAU research and teaching are of higher priority. Extension on an average gets only 5% resources and manpower.
KVKs have the infrastructure and subject matter expertise for organism a wide range of training programmes. Training is their first priority and number of them are organised. Few KVKs have started charging for the training programmes
Farmers' associations and producers' co-operatives provide th maximum number of extension services to their member farmers. This includes training programmes, diagnostic and consultancy support supply of production inputs and assistance in marketing. However, the activities are restricted to few selected crops/commodities and an generally available to their members only.
Research institutes provide extension services to selected villages when their field programmes are implemented. Contact is mostly restricted to specific days when scientists visit the field or during annual filed days The institutes provide training to senior officers of line departments or technologies related to their mandated crops/commodities.
Among input companies, fertiliser firms have a wide range o programmes ranging from printed literature on agronomic practices fertiliser demonstrations, seminars, fertiliser campaigns etc to socio-economic development of adopted villages. They focus their activities around fertiliser use. Seed companies concentrate their activities or publicity and demonstration of new varieties. But with very few personnel whose primary responsibility is marketing, their contact with farmers is limited. In floriculture, micro-irrigation, tissue culture, etc, there are organisations that provide consultancy services. Only large farmers or industrial concerns can afford their services. Input companies dealing with floriculture and irrigation systems provide total consultancy support to those who buy products from them (as a package).
Consultancy provided by private individuals or organisations is mostly found in high value crops such as grapes. Experience of the College of Agriculture reveals the demand for quality advice and the potential for paid consultancy services even in other crops. The number of consultants and consultancy organisations are at present very few and are available in only few locations, mainly in and around cities.
There are a number of NGOs in this country. Most of them concentrate on implementation of programmes sponsored by the government or donors. They concentrate their activities in few selected villages and that too with the selected beneficiaries of programmes they are implementing. They have been generally successful due to these reasons, in managing specific projects. In terms of coverage, they are generally weak. Many NGOs also lack qualified technical manpower.
Commodity boards because of their concentration in few selected crops have been successful in providing extension support to farmers delaing in those commodities. The main objective of marketing boards is market promotion and development, but to maximise beneifts to farmers from developed

markets, the boards are implementing awareness and training programmes in newly introduced crops. But they do not have the manpower to provide extension advice to farmers at the field level.
Print media (mainly newspapers and farm magazines) is becoming an important medium of transmitting agricultural information. Its' utility is more in states or districts having high rural literacy. Except for one or two magazines from information directorates of DoA or SAUs, all other initiatives are from the private sector. Print media widens the horizons of farmers and is a cost effective media in transmitting routine messages and guiding farmers on general cultural practices.
Farm programmes in radio and TV are also cost effective in transmitting agricultural information. There are serious operational and resource constraints affecting their performance. This may have to be corrected. The present study shows that radio and television are not rated as important sources of information by farmers. Perhaps the programmes may have to be produced more imaginatively. Except for few satellite channels such as E-TV in Andhra Pradesh, all other initiatives are from public sector.

4 SOURCES OF INFORMATION 4.1 Preferred Sources of Information
Due to changing nature of agriculture, farmers have to make a number of complex decisions now. Most relevant of them are as follows:
a. What technological options could be used profitably in his/her situation keeping in view the potential resource constraints in terms of land, labour and knowledge?
b. How to manage the various technologies? (eg.: how to make optimal use of new inputs in his farm?)
c. How and when to change his farming systems? (e.g. diversifying from crop production to mixed farming or vegetable or animal production)
d. For which type of products, is there a good demand in the market? e. What are the quality specifications he should achieve to get good value for his produce and
how to achieve them? (e.g. for export markets, organic farming) f. How, when and where to buy inputs and sell products? g. How to make decisions collectively on resource use and marketing? h. How to find quickly the most relevant and reliable knowledge and information? i. What are the feasible off-farm income generation options available for him and how far he
could depend on them? j. What are going to be the implications for his farming if the input subsidies are phased out and
/or if the trade in agriculture is liberalised ? (van den Ban, 1998)
To make good decisions, farmers need information from different sources and often need help to integrate them. Several organisations are functioning in a district and can potentially meet their demand for extension support. But the ability of the organisations to reach farmers vary considerably due to wide variations in contact intensity and TC ratio. Because of these reasons, many of these organisations are beyond the reach of farmers, when they need advice to solve specific problems. For short duration crops, he has to act fast, because the delay would increase his risk of crop loss. Thus many a times farmers prefer the easiest available source of information (need not be the best or reliable) to solve his problems. His satisfaction with that source would depend upon his experience with the solutions suggested and other characteristics he perceive in that source of information.
An exhaustive list of different sources of information (22 sources) was given to the respondent farmers to indicate his / her order of preference. They were asked to chose their five important sources and to rank them in the order of preference. A matrix was constructed for each district with 80 farmers and 22 sources of information. For prioritising the preferred sources, the scoring 1, 2 and 3 given by the farmers were converted to cumulative rankings by progressively adding the scores from first rank. While doing so, each score was given one point.
Maharashtra
Table 4.1 provides the details of the preferred sources of information and level of satisfaction with these sources in the selected districts of Maharashtra.
The three important sources of information for farmers in Maharashtra are officials of the Department of Agriculture, other farmers and dealers. The only difference being the order in which they come in the different districts. Department of Agriculture is the most important source of information only at Pune district. In the other two districts, Nasik and Nagpur it ranks as the third and second preferred sources respectively.

Table 4.1. Preferred Sources of information in the selected districts of Maharashtra (%)
District Preferred Source of Information* (in the order of ranking)
I . Officials of the DoA (VEW/AAO)
II. Other farmers (relatives/friends)
Pune
III. Dealers
I. Other farmers (relatives/friends)
II. Dealers
Nasik
III. Officials of the DoA (VEW/AAO)
I. Dealers
II. Officials of the DoA (VEW/AAO)
Nagpur
III. Other farmers (relatives/friends)
I. Dealers
II. Other farmers (relatives/friends)
State (Pooled)
III. Officials of the DoA (VEW/AAO)
* For each farmer, his first preferred source of information was assigned rank 1, second preferred as 2 respectively. The number of such 1's, 2's, 3's, 4's and 5's obtained against each source was then tabulated. To check the consistency of ranking, the number of 1s, (1+2)'s, (1+2+3)'s , (1+2+3+4)'s and (1+2+3+4+5)'s were found out against each source. The actual ranking of preferred sources across sample was based on the scores obtained at the (1+2+3+4+5)'s level.
Farmers continue to depend on other farmers and dealers for information in all the selected districts of the state, may be due to the non availability of advice from the officials of the Department of Agriculture as few farmers have reported less satisfaction with the DoA. The satisfaction levels (high and medium) are generally high for the DoA in all the districts.
Farmers reported that it is difficult to meet the VEWs whenever they want them to get advice on a specific problem. To meet them they have to wait sometime for a fortnight. Moreover, even if one meets him, it is often difficult to get them to visit one's field unless it is nearby. So the farmers often discuss among the neighbouring farmers and based on their advice take decisions. The local input dealers also has a greater say in his decision as he sells the inputs (pesticides/fertilisers/growth regulators etc) and he often gives it on credit till the end of season. Farmers expect the dealers to know more on use of p.p chemicals and fertilisers (though it need not be so in reality).
Rajasthan
The situation in Rajasthan is also similar as could be seen from Table 4.2.

Table 4.2. Preferred Sources of information in the selected districts of Rajasthan (%)
District Preferred Source of Information (in the order of ranking)
I. Officials of DoA (VEW/AAO)
II. Other farmers (relatives/friends)
Jaipur
III. Dealers
I. Officials of DoA (VEW/AAO)
II. Other farmers (relatives/friends)
Kota
III. Dealers
I. Other farmers (relatives/friends)
II. Dealers
Udaipur
III. Officials of DoA (VEW/AAO)
I. Officials of DoA (VEW/AAO)
II. Other farmers (relatives/friends)
State Pooled
III. Dealers
Though Department of Agriculture is the first preferred source in Jaipur and Kota, it ranks third in Udaipur. It should be noted here that about 50% of the positions of VEWs remain vacant in Udaipur district throughout the year. Farmers dependence on other farmers and dealers for getting extension advice is also heavy in other districts, the reason could be the non availability of the officials of the department of agriculture for consultations when the need arises. The TC Ratio of the department of agriculture is also low.
Kerala
In the highly literate state, Kerala, the newspapers and farm magazines have been playing an important role in the dissemination of agricultural information (Table 4.3). This is reflected in the preference of farmers. The DoA is the most important source of information in the two districts. The TC ratio of DoA is the highest in Kerala as the state has one office of the DoA in every panchayat. Unlike the situation in other states, dealers are not an important source of information in Kerala.

Table 4.3. Preferred Sources of information in the selected districts of Kerala (%)
District Preferred Source of Information (in the order of ranking)
I. Officials of DoA (VEW/AO)
II. News paper
Kasargode
III. Other farmers (relatives/friends)
I . Officials of DoA (VEW/AO)
II. News paper
Kottayam
III. Farm Magazines
I. News paper
II . Officials of DoA (VEW/AO)
Trivandrum
III. Farm magazines
I . Officials of DoA (VEW/AO
II. News paper
State pooled
III. Farm magazines
Agriculture pages of newspapers are rated as important source of information in all the three districts and farm magazines in the two districts. Farmers are more or less satisfied with the information available from the print media as none reported low satisfaction for these two categories. Dinar (1996) reported studies that has found the press as the most important source for professional information, by the farmers in United Kingdom and United States.
4.2 Level of Satisfaction
Identifying farmers' preferred sources of information is important, but to get the complete picture, one should know their level of satisfaction to these sources. Table 4.4 shows the level of satisfaction of those farmers (who have ranked the three important preferred sources in the particular state) to their first preferred source of information.
Irrespective of the order of preference, in all the three states, percentage of farmers highly satisfied with DoA are more, compared to other sources. The percentage of farmers with medium levels of satisfaction to DoA vary between 40-47%. The percentage of farmers with low satisfaction are generally high in the case of dealers, though dealers are important sources of information in Maharashtra and Rajasthan. Farmers are still depending on these sources, may be because the other reliable sources such as DoA are not efficient either in reaching them or providing information relevant to them.

Table 4.4 Level of satisfaction of farmers to their first preferred source of information
Level of satisfaction State Preferred source of Level of satisfaction information (in
the order of ranking) High Medium Low
I. Dealers 27.1 61.4 11.4
II. Other farmers 28.6 60.7 10.7
Maharashtra
III. Officials of the DoA 44.4 46.6 8.8
I. Officials of the DoA 33.3 46.4 20.2
II. Other farmers 26.7 57.7 15.5
Rajasthan
III. Dealers 17.4 58.7 23.9
I. Officials of the DoA 42.2 40.6 17.2
II. News paper 38.1 54.8 7.1
Kerala
III. Farm magazines 41.4 58.6 0.0
Only few farmers are highly satisfied with the information available at present. This shows that for many farmers, their information needs are not adequately met by the existing extension arrangements. Many new opportunities are opening up for farmers in the area of horticulture. The existing systems are not fully geared to meet these needs. The next chapter looks at those information demands of farmers.
4.3 Implications
It should be noted that among the organisations rated high (DoA, farmers' associations and producers co-operatives) in terms of expenditure, outreach and manpower, only the DoA is figuring as the important source of information in all the cases. As mentioned earlier, farmers associations and producers co-operatives exist in only few crops and locations and they meet the extension needs in these crops and commodities only. The other organisations such as research institutions and input agencies are unable to reach the majority of the farmers because of their poor logistics.
Though the majority of DoA staff are weak in technical qualifications, (more than 80% reported as less than graduation at the all India level) they are still the preferred source of information and more often contacted by the farmers. According to Christoplus(1996), rather than providing technical advice in all subject matter areas, the field extension agents would act as link people or 'vectors' pointing enquiries in the right direction, to the appropriate department or individual. Probably, the field extension agents are better in these areas and hardly there exists any other organisation who can compete with them in terms of sheer numbers and activities. Similar results are quoted by Dinar (1996) on contact between extension advisors and small holder farmers in the Rehovot region in Israel. These farmers found extension advisors as the most important source of practical agricultural information (compared with other sources such as neighbours, agricultural press, TV, radio, professional organisations and commercial companies).
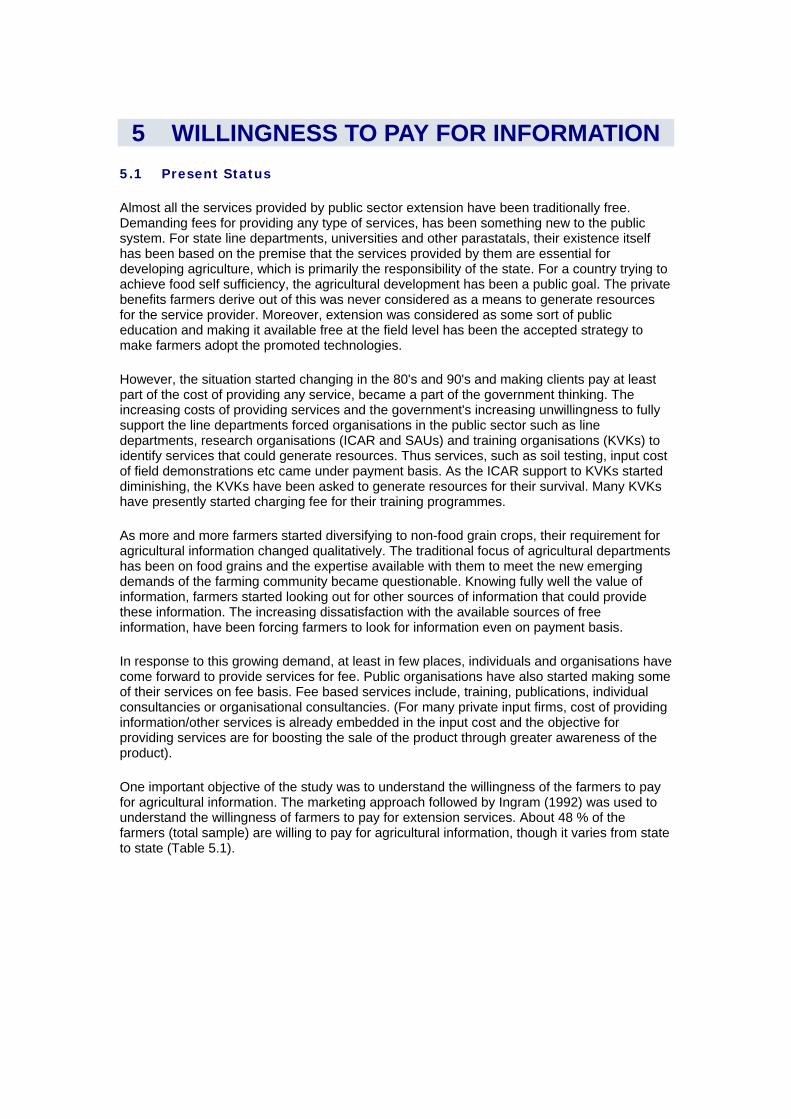
5 WILLINGNESS TO PAY FOR INFORMATION 5.1 Present Status
Almost all the services provided by public sector extension have been traditionally free. Demanding fees for providing any type of services, has been something new to the public system. For state line departments, universities and other parastatals, their existence itself has been based on the premise that the services provided by them are essential for developing agriculture, which is primarily the responsibility of the state. For a country trying to achieve food self sufficiency, the agricultural development has been a public goal. The private benefits farmers derive out of this was never considered as a means to generate resources for the service provider. Moreover, extension was considered as some sort of public education and making it available free at the field level has been the accepted strategy to make farmers adopt the promoted technologies.
However, the situation started changing in the 80's and 90's and making clients pay at least part of the cost of providing any service, became a part of the government thinking. The increasing costs of providing services and the government's increasing unwillingness to fully support the line departments forced organisations in the public sector such as line departments, research organisations (ICAR and SAUs) and training organisations (KVKs) to identify services that could generate resources. Thus services, such as soil testing, input cost of field demonstrations etc came under payment basis. As the ICAR support to KVKs started diminishing, the KVKs have been asked to generate resources for their survival. Many KVKs have presently started charging fee for their training programmes.
As more and more farmers started diversifying to non-food grain crops, their requirement for agricultural information changed qualitatively. The traditional focus of agricultural departments has been on food grains and the expertise available with them to meet the new emerging demands of the farming community became questionable. Knowing fully well the value of information, farmers started looking out for other sources of information that could provide these information. The increasing dissatisfaction with the available sources of free information, have been forcing farmers to look for information even on payment basis.
In response to this growing demand, at least in few places, individuals and organisations have come forward to provide services for fee. Public organisations have also started making some of their services on fee basis. Fee based services include, training, publications, individual consultancies or organisational consultancies. (For many private input firms, cost of providing information/other services is already embedded in the input cost and the objective for providing services are for boosting the sale of the product through greater awareness of the product).
One important objective of the study was to understand the willingness of the farmers to pay for agricultural information. The marketing approach followed by Ingram (1992) was used to understand the willingness of farmers to pay for extension services. About 48 % of the farmers (total sample) are willing to pay for agricultural information, though it varies from state to state (Table 5.1).

Table 5.1. Willingness to pay for agriculture related information (%)
No. District Yes No Undecided
1 Pune 61.3 32.5 6.2
2. Nasik 55.0 43.8 1.2
3. Nagpur 56.2 38.8 5.0
Total (Maharashtra) 57.5 38.3 4.2
4. Jaipur 35.0 57.5 7.5
5. Kota 46.3 45.0 8.7
6. Udaipur 33.7 62.5 3.8
Total (Rajasthan) 38.8 55.0 6.7
7. Kasargode 40.0 60.0 0.0
8 Kottayam 57.5 42.5 0.0
9. Trivandrum 47.5 51.3 1.2
Total (Kerala) 48.3 51.3 0.4
Total (3 States) 48.2 48.2 3.6
Out of all the selected districts, farmers of Pune stand first in terms of their willingness to pay. When compared to other states, more farmers in Maharashtra are willing to pay for agriculture related information. More than 50% of the farmers in all the three districts of Maharashtra have expressed their willingness to pay. In each state, higher proportion of farmers in the following districts namely Pune (Maharashtra), Kota (Rajasthan) and Kottayam (Kerala) have expressed their willingness to 1pay for agriculture related information.
5.2 Determinants of willingness to pay
Famers' willingness to pay for information was not uniform across producers. It would be useful to characterise farmers who are willing and not willing to pay, so that, it is easy to plan for commercialisation of extension services. To identify the variables that discriminate farmers into those willing-to-pay (Group 1) and not-willing-to-pay (Group 0), the linear discriminant function was used. The discriminant function can also be used to predict whether a farmer would be willing to pay or not for agricultural information. The high values of Z correspond to willingness to pay and low value for those not willing to pay. The magnitude of the coefficients is an indication of the relative importance. Variables with large coefficients are thought to contribute more to the overall discriminant function. The percentage of cases classified correctly is an indicator of the effectiveness of the discriminant function.
This tool has been extensively used in agricultural finance especially in discriminating defaulters and non-defaulters of farm credit (Pandey and Muraleedharan, 1977). The variables were selected in such a manner that those related to demography, literacy, occupation, agriculture and information use are included in the analysis. How far the cases have been correctly predicted by this function is given in Annexure 6.

The following discriminant function was used-
n Z= ∑ Ιi Xi i=1
Where Z = total discriminant score for farmers willing to pay and not willing to pay X1 = primary source of information (1=Department of Agriculture, >1= other sources X2 = age of farmer (in years) X3= educational level (illiterate=0; can read only=1; can read and write=2; up to primary level=3; up to secondary level=4; up to high school=5; above high school =6) X4 = main occupation: (non-agriculture=0; agriculture=1) X5 = total area (acres) X6 = irrigated area (percentage) X7 = income from agriculture (Rupees) X8 = total Income (Rupees) X9 = area under non-food grains (percentage) X10 = level of input use (low=0;high=1) X11 = satisfaction with the primary source of information
li' s are the coefficients of the variables estimated from the data.
The results for the three states are given below.
Maharashtra
The results of the step-wise selection revealed that the variables such as satisfaction with the primary source of information (X11), total income (X8), primary source of Information^), percentage area under non-food grains (X9), total area (X5), and age (X2) are important in the same order of sequence, in characterising the farmers into willing and not willing to pay groups. Thus only these 6 variables were the significant discriminators between those willing and not willing to pay for agricultural information. Other characteristics did not have any significant influence on discriminating between the two groups.
When these six variables were included, the relevant discriminant function was of the following form:
Z= 0.56371X1 -0.22754X2 0.39572X5 0.32952X8 0.46399X9 0.50826X11
Z values are as follows For Group 0 = -.65376 Group 1 = +.53353
The signs of Ii's in the Z equation suggests that, in Maharashtra, a farmer with lower satisfaction with the primary source of information, higher total income, having more dependence on sources other than the department of agriculture, more percentage area under non-food grains and less age, the more it would contribute to the Z value and so more he would be willing to pay for agricultural information.
Rajasthan
The results of the step-wise selection revealed that the variables such as satisfaction with the primary source of information (X11), percentage irrigated area (X6), percentage area under non-food grains (X9), primary source of information (X1,), total area (X5) income from agriculture (X7) and main occupation (X4) are important in the same order of sequence in

characterising the farmers into willing and not willing to pay groups. Thus only these 7 variables were the significant discriminators with respect to farmers of Rajasthan. Other characteristics did not have any significant influence on discriminating between the two groups.
When these seven variables were included , the relevant discriminant function was of the following form:
Z= -0.2128X1 -0.20218X4 -0.43764X5 0.33128X6 0.311623X7 0.39549X9 0.82007X11
Z values are as follows For Group 0= -.50795 Group 1 = +.69396
The signs of li's in the Z equation suggests that, in Rajasthan, a farmer having lower satisfaction with the primary source of information, higher percentage irrigated area, higher area under non-food grains, having more dependence on the department of agriculture as the primary source of information, having less area, higher agricultural income and non agriculture being the primary occupation, more he would contribute to the Z value and so more he would be willing to pay for agricultural information.
Kerala
The results of the step-wise selection revealed that the variables such as satisfaction with the primary source of information (X11) and income from agriculture (X7) are to be included in the respective order. Thus only these 2 variables were the significant discriminators between those willing and not willing to pay for agricultural information. Other characteristics did not have any significant influence on discriminating between the two groups.
When these two variables were included , the relevant discriminant function was of the following form:
Z= 0.9233379X1 0.39272X7
Z values are as follows For Group 0= -.35742 Group 1 = +.32493
The signs of Ii's in the Z equation suggests that, in Kerala, a farmer having lower satisfaction with the primary source of information, and higher agricultural income, more he would contribute to the Z value and so more he would be willing to pay for agricultural information.
The coefficients of discriminating variables for willingness to pay in the three states are given in Table 5.2.

Table 5.2. Coefficients of discriminating variables for willingness to pay for extension services across states
Discriminant function Coefficients No Discriminating Characteristics
Maharashtra Rajasthan Kerala
1 Demography related
Age -0.22754
II Literacy related
Educational Level
III Occupation related
Main occupation -0.20218
Income from agriculture 0.311623 0.39272
Total income 0.32952
IV Information use related
Primary source of information 0.56371 -0.2128
Satisfaction with primary source of information 0.50826 0.82007 0.92379
V Farming related
Irrigated area(%) 0.33128
Area under non-food grains(%) 0.39549
Total area 0.39572 -0.43764
Level of input use
Z values
Group 0 -0.65376 -0.50795 -0.35742
Group 1 +0.53353 +0.69396 +0.32493
The results from the 3 states reveal, that satisfaction with the primary source of information remained the common characteristics of farmers and thus the most important variable in discriminating farmers into those willing and not willing to pay. Lower the satisfaction with the primary source of information, the more a farmer would be willing to pay. The satisfaction levels of farmers in the three selected states are given in Table 5.3.

Table 5.3. Level of satisfaction/dissatisfaction of farmers to their primary source of information on agriculture.
Level of satisfaction (%) No States
Highly satisfied Moderately satisfied Highly dissatisfied
1 Maharashtra 31.9 58.3 9.6
2 Rajasthan 26.2 55.0 18.8
3 Kerala 41.3 43.2 15.4
Only about 32-41% of the farmers are highly satisfied with their present information availability (Table 5.3). The satisfaction levels of the majority of farmers are either medium or low. This indicates the huge potential of the market for quality extension services.
Other important variables emerging from the analysis are those related to area and income. Total area and area under non-food grains are important discriminating farmers in Maharashtra and Rajasthan. Farmers having higher total area and higher area under non-food grains are more willing to pay for agricultural information. This could be because only large scale farmers can take advantage of economies of scale in using paid extension services (Umali and Schwartz, 1994). As the cost of information is uniform, the per unit cost of information is low for farmers having larger area and those growing high value crops (mostly non-food crops). Moreover the level of technical support for non-food crops provided by the most important public sector organisation (state department of agriculture) has been low, due to its pre-occupation with food crops. Percentage area under irrigation is another important variable in Rajasthan. Farmers having more area under irrigation are more likely to pay for agricultural related information.
Among variables related to income, per acre agricultural income is important in Rajasthan and Kerala. Higher the per acre agricultural income, farmers are more willing to pay for agricultural related information. As the cost of information is uniform, its share on per acre farm income is low for those having higher per acre farm income. Thus farmers, having higher agricultural income per acre and more area under non-food crops are the probable candidates willing to pay for agricultural information. Education is another important discriminating variable in Rajasthan and Kerala. More the educational level, more willingness to pay for information. Evidence from a number of studies have shown a positive relationship between education and adoption behavior of farmers (Rogers, 1983). Educated farmers generally look for technological innovations to adopt and so they would be willing to pay for such information.
5.3 Demand for Paid Services
Farmers who had expressed their willingness to pay for agricultural information were asked to indicate the types of services/information for which they would be willing to pay. Farmers would like to pay for certain selected services/information only that are probably not met effectively by the existing sources of information. Farmers had agreed to pay for services only under certain conditions (Tables 5.4., 5.5., and 5.6). This section illustrates these possible areas for paid extension delivery and the conditions that would make these attempts successful.
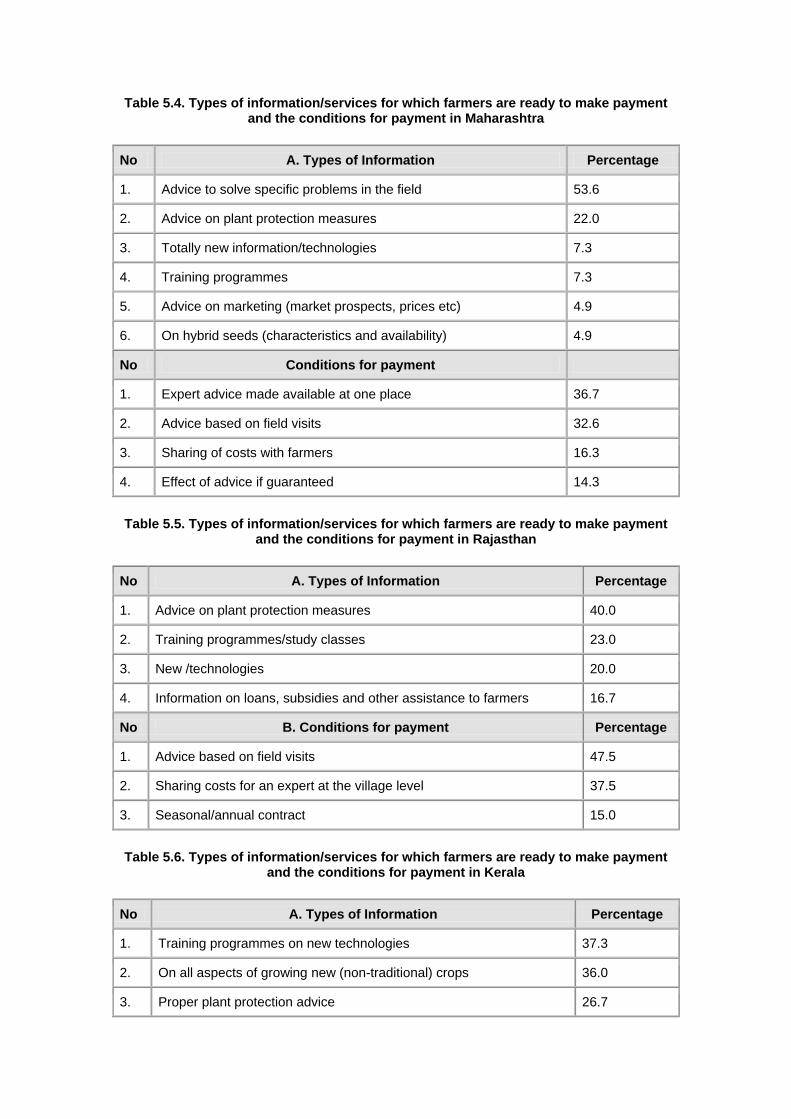
Table 5.4. Types of information/services for which farmers are ready to make payment and the conditions for payment in Maharashtra
No A. Types of Information Percentage
1. Advice to solve specific problems in the field 53.6
2. Advice on plant protection measures 22.0
3. Totally new information/technologies 7.3
4. Training programmes 7.3
5. Advice on marketing (market prospects, prices etc) 4.9
6. On hybrid seeds (characteristics and availability) 4.9
No Conditions for payment
1. Expert advice made available at one place 36.7
2. Advice based on field visits 32.6
3. Sharing of costs with farmers 16.3
4. Effect of advice if guaranteed 14.3
Table 5.5. Types of information/services for which farmers are ready to make payment and the conditions for payment in Rajasthan
No A. Types of Information Percentage
1. Advice on plant protection measures 40.0
2. Training programmes/study classes 23.0
3. New /technologies 20.0
4. Information on loans, subsidies and other assistance to farmers 16.7
No B. Conditions for payment Percentage
1. Advice based on field visits 47.5
2. Sharing costs for an expert at the village level 37.5
3. Seasonal/annual contract 15.0
Table 5.6. Types of information/services for which farmers are ready to make payment and the conditions for payment in Kerala
No A. Types of Information Percentage
1. Training programmes on new technologies 37.3
2. On all aspects of growing new (non-traditional) crops 36.0
3. Proper plant protection advice 26.7

No B. Conditions for payment Percentage
1. Advice based on field visits 38.7
2. The charges should be reasonable 24.0
3. Firms to be brought under the purview of consumer court 21.3
4. The firms to provide receipts for the payments made 16.0
The two services that are common in the above states are (i) advice on plant protection measures and (ii) training programmes. Pests and diseases are a major problem in all crops. The current crop loss in India estimated on this account is about Rs.60 Million. One fallout of the implementation of the T and V system had been the neglect of farmers' training programmes. It is quite natural that these two areas emerged as the most important for paid extension delivery.
One important condition for paid services is the farmers' insistence on field visit based advice. In actual field situation, perhaps this is not happening. Farmers often meet the VEW at the Kisan Seva Kendras or at selected contact points or at their offices. Under T and V, visit to contact farmers was his important duty. Even meeting all contact farmers in his circle in the pre-determined visit day has even been difficult in many situations due to poor road network and transport facilities in rural areas. Transport allowances are meager and VEWs are not sure when they are going to get his claim. Moreover, they are even otherwise burdened with the implementation of a number of development schemes that takes almost all their time. Visit of DoA officials to farmers fields, especially to those lying away from the contact points, have not been happening due to the above reasons. Advice on field problems has been often based on how best the farmer conveys the conditions in his farm/symptoms he has noticed in his field. This partly explains the unhappiness of the majority of the farmers who do not have high levels of satisfaction with the officials of the department of agriculture, though they could still rate them as their primary source of information.
The demand for paid services are not uniform cross crops. The demand was more in non-food grain crops (Table 5.7), especially, horticultural crops (fruits, vegetables, flowers and spices) and oilseeds.

Table 5.7. Crops having high demand for paid services
State. Crops Farmers willing to pay (%)
I. Vegetables 45.4
II. Flower cultivation 22.7
III. Grapes 20.4
Maharashtra
IV. Citrus 9.1
I. Oilseeds (groundnut, mustard) 54.3
II. Vegetables 31.4
Rajasthan
III. Flower cultivation 14.9
I. Vegetables 46.8
II. Flower cultivation 29.0
Kerala
III. Spices (Pepper etc) 24.2
Paid services should be initiated first in these crops. Cost sharing strategies can also be initiated with farmers' groups involved in these crops.
Those who had agreed to pay for agricultural information were asked the maximum amounts, they would be willing to pay. The findings are given in Table 5.8.
Table 5.8. Willingness to pay (Rupees)
Willingness to Pay (Rupees) Percentage
10 27.3
20 11.2
25 30.2
50 21.0
100 10.3
Thus farmers are willing to pay for quality services, if they are made available by extension agencies. It is up to the extension system to decide how best it could utilise this opportunity. The actual potential (in monetary terms) of paid services in a district could be worked out keeping in view the characteristics of farmers, the nature of crops grown, the information demands of farmers and quality of services provided at present.
6 CONCLUSIONS AND POLICY IMPLICATIONS Why privatise extension?
The word 'privatisation' broadly refers to a process by which the government reduces its role in an activity and encourages private sector to take up these roles. World-wide, traditionally, extension has been funded, managed and delivered by the public sector. This public sector monopoly came under severe criticism in the 1980s as more people started questioning the desirability of this situation on economic and efficiency grounds.
In many developed countries, the private sector, became an important segment in the delivery of some of the extension services. The emergence of this situation and the increasing costs of extension delivery by the public sector forced the governments in developed countries to examine their role in the new environment. Governments responded in several ways, by limiting its role in providing extension services. Sharing costs with farmers' groups and initiating cost recovery for selected services were initiated. The outcomes have been mixed.
The developing countries also started looking for alternative mechanisms for extension delivery mainly because of financial reasons. Though extension gave high returns to investments, the ability of the state to sustain present investment levels came under increasing stress. With the decline in external financial support (World Bank) through the T and V programme, the developing countries found it difficult to maintain the infrastructure created under the T and V system. Reduction of government funding (and thereby activities) and the search for alternative delivery mechanisms became imperative upon them, though the development of the private sector has not been uniform in these countries.
Poor image of public sector extension in developing countries also facilitated the search for 9ther providers who can deliver extension services effectively and efficiently. Public sector extension in developing countries had been suffering from many ills which were not attended to by the government. Effectiveness of extension has always been constrained by inadequate operational funds. While partly agreeing to this, Baxter (1989) noted that while governments can be blamed for giving inadequate attention to extension, extension itself has often much to account for in this regard. He cited weak leadership of extension managers and lack of performance appraisal in the system as the main reasons for this poor image.
Through the process of privatisation, extension effectiveness is expected to improve by:
a. reorienting public sector extension with limited and well focussed functions, b. more number of extension providers (institutional pluralism) resulting from active
encouragement by the public sector to initiate, operate and expand, c. more private participation leading to the availability of specialised services hitherto
not available from the public system, d. user contributions to extension leading to improved financial sustainability, and e. support and control by clients leading to client orientation.
The idea of privatising extension, is finding a lot of takers in India and several measures to achieve this has already been implemented. The Government of Maharashtra constituted a committee in 1995 to look into different aspects of privatising extension. DoA of Rajasthan has gone ahead in contracting out some of its services to the private sector, especially to the NGOs. Costs of services such as soil testing and cost of inputs distributed through various programmes are being recovered at least partially, in many states. The need for establishing collaborative linkages with other extension providers is being increasingly emphasised by central and state governments. Extension component of NATP is also promoting these in the pilot districts. The point is that, privatisation as a strategy for improving the effectiveness and efficiency of the extension system is under active consideration with the Central and state governments.

Whether privatisation is the only means to achieve overall effectiveness and efficiency in extension can be further debated. Some have questioned the distributional impacts, the dependence on private providers would result in extension. The threat of 'market failure' looms large in many parts of the country. Apart from looking at the nature of goods and services provided by extension, governments have to examine the feasibility of its provision through the markets. To protect the interests of the clients resulting due to 'adverse selection' the governments may have to monitor and regulate the activities of the private extension providers. Many governments have limited capacity in this area but this could be upgraded. The ability and willingness to pay for various services is also a very important factor. No doubt, some of the benefits expected through privatisation could be achieved through decentralisation of extension and through adoption of group approaches by the public sector. But looking for alternative funding and delivery mechanisms has its own merits. A decision on how far India should go on the road to privatisation should have to be taken keeping in view the above mentioned factors.
6.2 Public and Private Extension - Present Status
One way of deciding, who should provide what, is by identifying the roles being performed by various agencies at present and limiting government's role in areas/activities where competitive markets do or could exist. The public system should focus on areas where the market is least likely to provide adequate solutions and where the government action has the greatest potential to improve outcomes (World Bank, 1999). The status of extension in India, as revealed by this study, is as follows:
Performance indicators Our analysis on expenditure, outreach and manpower ratios of organisations revealed that only the Department of Agriculture (DoA), farmers' associations and producers' co-operatives, are seriously involved in extension functions. NGOs and commodity boards are also important in terms of intensity of activities, wherever they exist. DoA exists everywhere, with some variations in manpower ratios. DoA is fully dependent on government funds. Producers' co-operatives and farmers' associations exist in very few crops or commodities. They operate mostly with their own funds with little government support. Commodity boards exist in only crops such as rubber, coconut, coffee and spices. They depend on produce levy and government support. NGOs vary widely in terms of size, operations and technical skill. But all of them depend mostly on project funds from government or donors. Directorate of Extension of SAUs, input agencies, media, consultants, research institutes and marketing boards, spent very little and with limited manpower, they could reach only few farmers through their operations.
Services provided The main extension function performed by DoA has been the delivery of technical messages (major focus on food crops) to individual farmers or farmers' groups through visits to specific locations in his circle/area. Visit to farmers' fields for providing problem solving advice rarely happens. Moreover these visits are to a great extent affected by his pre-occupation with implementation of a number of state and central sector programmes having input/subsidy delivery. Farmers' associations and producers co-operatives provide a wide range of extension services to their member farmers producing the particular crop/commodity. But their activities are restricted to few crops/commodities and locations. Same is the case with commodity boards. The field activities of the Directorate of Extension of SAUs, agricultural colleges and (CAR research institutes are often restricted to nearby villages around its location. Training programmes for farmers are mostly organised by Krishi Vigyan Kendras (KVKs), whose primary mandate is training. Some KVK's also conduct training programmes for field extension personnel of DoA and other line departments.
NGOs are involved in a number of activities but their operations are restricted to beneficiary farmers or at the most to few selected villages. Their concentration of funds and efforts in small areas/groups make them generally successful in implementing programmes. But most of them do not have the ability to replicate their efforts on a wider scale. Consultancy services are very few and are mostly private ventures found in high value crops. The only exception being the efforts of the consultancy cell at College of Agriculture, Nagpur. The potential of media such as print, radio and television in supplementing and complementing extension
efforts is under-utilised at present. Input companies generally do not have full time extension staff. Marketing staff organises demonstrations, seminars, campaigns etc., with the support of dealers and at times with professional inputs from line departments, agricultural colleges and research institutes.
The above analysis revealed that:
Within public sector
a. The public sector state department of agriculture is the only organisation at the field level available throughout the country, providing general extension function of technical message delivery at individual/group level. They also distribute inputs/subsidies related to specific schemes, arrange demonstrations and facilitate formation of farmers' groups.
b. SAU establishments (colleges, research institutes, zonal research stations) and KVKs are the important sources of specialised information available at the district level whose potential to provide quality extension support has not been tapped fully.
c. Media has not been used to the fullest possible extent in delivery of information.
Within private sector
d. Farmers' associations and producers' co-operatives, though found in few crops/locations are the important organisations that provide a wide range of services to its members.
e. Other organisations do not have full-time field personnel for extension. Their activities are restricted to one or two demonstrations and farmers meetings in a district in an year, as in the case of input companies, tied to implementation of few programmes in selected villages by NGOs; and highly restricted to few locations/crops as in the case of consultants.
f. Newspapers and farm magazines are emerging as important sources of information in agriculture in high literacy states such as Kerala.
the three important sources of information. Except in Kerala, where newspapers and farm magazines are also important, none of the other public or private organisations are an important source of information for farmers.
Private sector participation in agricultural extension in India at present is very limited. As one of the important strategy of privatisation, if the public sector extension has to be restricted, at present it could be done only in crops and locations where farmers' associations or producers' cooperatives are existing. DoA has to initiate and sustain farmers' groups, if some extension functions have to be transferred from the public sector. Moreover, farmers of Maharashtra and Rajashtan have expressed their willingness to share costs with DoA for making expert advice available to them. Hence, initiating farmers groups should form an important agenda of the public sector extension in India.
It would be interesting to understand the probable reasons for 'market failure' (absence of private extension providers in this case) in extension. Some of the theoretical explanations support this phenomenon in the Indian context. For, instance, markets normally do not develop for the provision of public goods. According to Wilson (1991), most technology for basic food-crops will remain public goods. Food grains occupy 66.5 % of the Gross Cropped Area of the country. Opportunities to appropriate profits are low in the case of food grain crops, (where technologies are of public good nature) as it is difficult to exclude persons who are not willing to pay (the 'free rider' problem). As seen earlier, farmers are more willing to pay for information in non-food grain crops. Theoretically, private extension providers should be thus concentrating only in non-food grains. As the private (profit) sector may not be coming forward for providing technologies in food grains, either the public sector or the private non-profit sector (such as membership organisations) have to continue providing these services.

Wilson (1991) believes that as a certain level of technology becomes widely accepted, extension becomes a private good. At this stage farmers require a more individually tailored problem solving service-such information will be substractable and excludable and so long as it is high quality, they should be willing to pay for it. The empirical evidence of this study supports this observation. Farmers have expressed their willingness to pay for quality advice from experts, if they are based on visit to their fields, this is one condition for payment in all the study states (Maharashtra, Rajasthan and Kerala). Farmers are also willing to pay for advice related to plant protection advice and training programmes which are essentially excludable services (toll goods). Theoretically, these services should have attracted private sector attention. But unfortunately, this has not happened in the Indian context.
Except for a few consultants in fruit crops, no organisation in the private or public sector is making efforts to meet the specific consultancy needs of farmers for which he is willing to pay. Problem solving on-farm consultancy services (free or paid) are not provided by the public sector organisations. VEWs of DoA neither have the time nor the necessary technical qualification to provide problem solving consultancy services in crops, especially in non-foodgrain crops. DoA could initiate strategies to meet this need by pooling the more qualified (post-graduates) and trained staff of the Department. To begin with, these services could be provided at district and sub-district levels on specific days. Measures to bring in more qualified and trained personnel (preferably post graduates) in the field of agro-consultancy have to be initiated to tap this potential.
Except KVKs, no other organisation is providing training programmes to farmers. More KVKs are now charging for their training programmes, but this doesn't seem to have reduced farmers' enthusiasm in availing these training. If KVKs can organise more number of off-farm training programmes, this may meet to some extent, farmers' need for various training programmes. Within public sector, SAD establishments (colleges, and research stations) have facilities and manpower to organise training programmes. This needs to be exploited. Steps for encouraging qualified private agencies in training programmes could also be initiated.
6.3 Options for India
Both economic and social reasons, justify public financing of extension in the Indian context. But all the services need not necessarily be provided through a public machinery. Opportunities for successful integration of the efforts of public agencies, private sector and farmers groups are emerging in some areas. The need for evolving location based strategies are more relevant than ever before. Varied combinations of financing and providing extension would work best in different situations. Over the years, with more diverse organisations emerging on the extension scene, many of the services currently provided by the public sector machinery would move out to these new organisations. Capacity of the public sector to perform effectively and efficiently in a pluralistic institutional environment needs upgradation.
Keeping in view, the analysis of the present extension environment in the country, the options presently available for India are limited. These are summarised in Table 6.1.

Table 6.1. Privatising extension-activities and conditions for success
No Activity Conditions for success
1. Initiating and sustaining Self Help Groups of farmers
a. Prioritise activities to give group formation more importance
b. Limit implementation of schemes having input and subsidy distribution in selected blocks only
c. Officials of the department well trained in the approaches of group formation
2. Contracting extension services to non-profit, voluntary organisations in remote and difficult areas
a. Identification of potential collaborators b. Evolving transparent mechanisms of selection
and funding them c. Monitoring performance
3. Franchising private agencies for input delivery
a. Identification of private agencies for providing these services
b. Evolving transparent mechanisms for awarding franchise
c. Monitoring performance
4. Initiate consultancy services a. Encourage private individuals or firms to register as consultancy firms with the government
b. Provide assistance to initiate the same c. DoA to initiate consultancy services at
district/block levels by availing the services of SAU staff and trained and qualified staff preferably in plant protection
d. SAU units to start the same in the respective units
5. Expand training programmes a. KVKs to organise more training programmes (more off campus)
b. Provide assistance to farmers groups to avail these services
c. Support KVKs, NGOs or SAU units in arranging more number of farmers trainings
d. Encourage input industries to initiate farmers training programmes by offering incentives/concessions
6. Cost recovery a. Training programmes and consultancy activities to be charged atleast nominally.
b. Cost of inputs supplied to be recovered fully or the maximum possible extent.
The public sector extension has to set the environment for more active private sector participation in extension and should prioritise its activities to become more efficient and
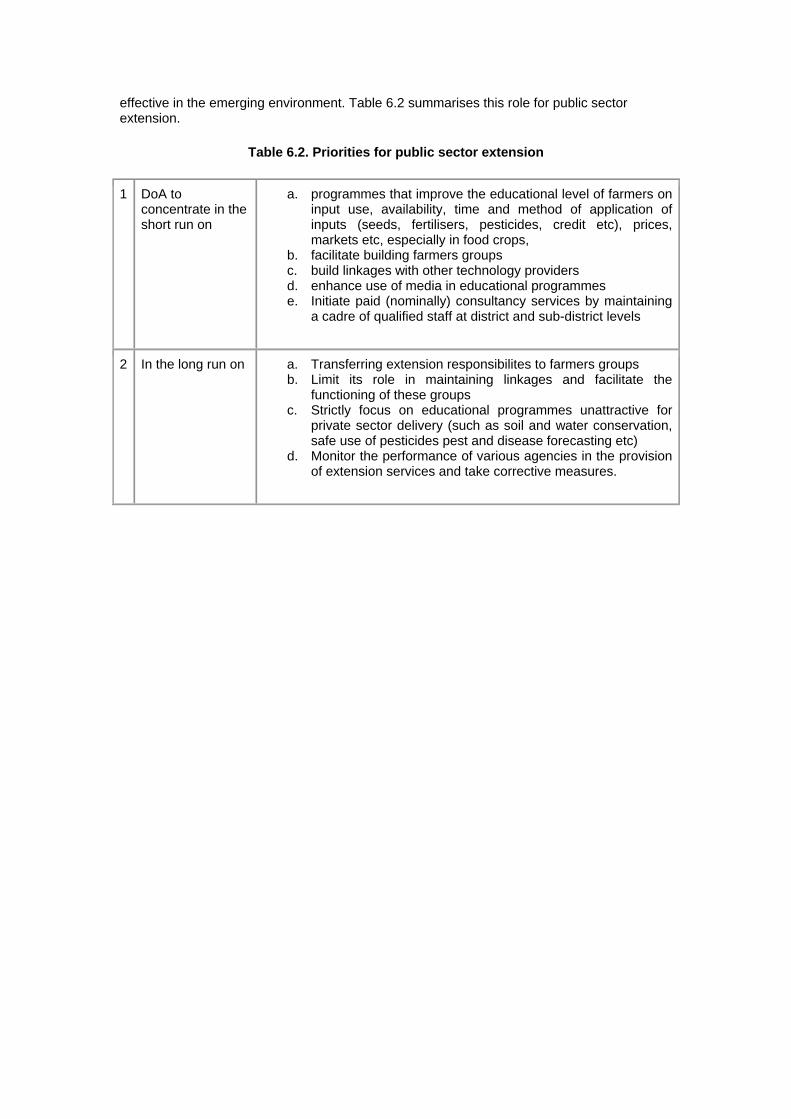
effective in the emerging environment. Table 6.2 summarises this role for public sector extension.
Table 6.2. Priorities for public sector extension
1 DoA to concentrate in the short run on
a. programmes that improve the educational level of farmers on input use, availability, time and method of application of inputs (seeds, fertilisers, pesticides, credit etc), prices, markets etc, especially in food crops,
b. facilitate building farmers groups c. build linkages with other technology providers d. enhance use of media in educational programmes e. Initiate paid (nominally) consultancy services by maintaining
a cadre of qualified staff at district and sub-district levels
2 In the long run on a. Transferring extension responsibilites to farmers groups b. Limit its role in maintaining linkages and facilitate the
functioning of these groups c. Strictly focus on educational programmes unattractive for
private sector delivery (such as soil and water conservation, safe use of pesticides pest and disease forecasting etc)
d. Monitor the performance of various agencies in the provision of extension services and take corrective measures.

REFERENCES Antholt ,C.H. (1992), Relevancy, Responsiveness and Cost effectiveness: Issues for Agricultural Extension in 21st Century, J. Extension Systems, 8: 37-44.
Antholt, C.H. (1994), Agricultural Extension in Asia: Modernisation for the 21st Century, INTERPAKS Digest, 2(1): 4-5
Ameur.C (1994), Agricultural Extension: A step beyond the next step, World Bank Technical Paper, No 247, World Bank, Washington D.C.
Beynon.J, Stephen Akroyd, Alex Duncan and Stephen Jones (1998), Financing the Future-Options for Agricultural Research and Extension in Sub-Saharan Africa, Oxford Policy Management, Oxford, England.
Birkhaeuser.D, Evenson R.E and Feder.G (1991), The Economic Impact of Agricultural Extension-A Review, Economic Development and Cultural Change, Vol 39(3),pp 607-50.
Bloom, P.O. (1991), The Changing Social Contract for Agricultural Research and Extension, Address to the Australian Institute of Agricultural Sciences, Brisbane, AlAS.No 341, October 1991.
Bloom,P (1993) Privatisation Lessons for US Extension from New Zealand and Tasmania, J of Extension , Spring.
Carney.D (1995), Changing Public and Private Roles in Agriculture Service Provision: A Literature Survey, Working paper 81, Overseas Development Institute, London, UK.
Carney.D (1995), The Changing Public Role in Services to Agriculture: a framework for analysis, Food Policy, 20(6) pp 521-528
Carney.D (1998), Changing Public and Private Roles in Agriculture Service Provision, Overseas Development Institute, London, U.K
Christoplos, I (1996) Rural Extension: Guidelines for Sida Support, Paper presented to the second Informal Consultation on International Support to Agricultural Extension systems in Africa, Rome, Italy.
CMIE (1993) Profile of Districts, Centre for Monitoring .Indian Economy, Bombay.
CMIE (1997), Directory of Indian Agriculture, Centre for Monitoring Indian Economy, Bombay.
CMIE (1999), Agriculture (September, 1999) Centre for Monitoring Indian Economy, Bombay.
Courts, J.A.(1995), Agricultural Extension Policy as a Framework for Change, European Jornal of Agricultural Education and Extension Vol2(1).
CSO (1997), Statistical Abstracts of India-1997, Central Statistical Organisation, Government of India, New Delhi.
DAC (1996a), Report of the working Group on Critical Agricultural inputs-for the formulation of Ninth Five Year Plan - Extension, Department of Agriculture and Co-operation, Ministry of Agriculture, New Delhi.

DAC(1996b), Agenda notes for the Review Workshop on Agricultural Extension through Voluntary Organisations, 12-13 September, Department of Agriculture and Co-operation, Ministry of Agriculture, Government of India.
Dayal, P (1995) Agricultural Extension Services in India: A Perspective for the National Agricultural Technology Project, Department of Agricultural Extension, Ministry of Agriculture, Government of India, New Delhi (mimeo).
Dinar, A (1996), Extension Commercialisation: How Much to Charge for Extension Services, American Journal of Agricultural Eonomics, Vol 78, pp1-12.
Farrington, J (1995),The Changing Public Role in Agricultural Extension, Food Policy, 20(6) pp 537-544
Farrington J, Sulaiman V.R and Pal, S (1998), Improving the Effectiveness of Agricultural Research and Extension in India, Policy Paper 8, National Centre for Agricultural Economics and Policy Research, New Delhi.
Gill.D.S. (1991), Economic Returns to Expenditure on Agricultural Extension System, J of Extension Systems, 7:44-61.
Gujjal, S (1997), Agricultural Education and Rural Development through Distance Education in Maharashtra Yashwantrao Chavan Maharashtra Open University, Nashik.
ICAR and DAC (1995), National Agricultural Technology Project-Concept Paper, Indian Council of Agricultural Research and Department of Agriculture and Co-operation, Government of India, New Delhi. '
ICAR (1988), National Agricultural Technology Project, Main Document, Indian Council of Agricultural Research, New Delhi.
Kidd, A, John Lamers and Valker Hoffman (1988), Towards Pluralism in Agricultural Extension-A growing challenge to the public and private sectors, Agriculture + Rural Development, V(1), 1998.
Kaurani, M.D.(1995), Media Support to Agriculture, Occasional paper 4, National Institute of Agricultural Extension Management, Hyderabad.
Leonard, D (1985), The supply of veterinary services, Discussion Paper 191, Havard Institute for International Development,. Cambridge.
Macklin.M (1992) Agricultural Extension in India, World Bank Technical Paper 190, World Bank, Washington D.C.
MANAGE (1993) Farmers Participation in Agricultural Research and Extension Systems, National Institute of Agricultural Extension Management, Hyderabad, India.
Mariam, T.H (1993), Privatisation- Alternative approach to develop and sustain veterinary services in Ethiopia, M.Sc Agricultural Extension Dissertation, Agricultural Extension and Rural Development Department, Reading University, Reading U.K
Misra.D.C (1990), New Directions in Extension Training-A Conceptual Framework, Directorate of Extension, Occasional Paper 3, Directorate of Extension, Ministry of Agriculture, New Delhi, India.
Mol&B (1996), Press in India-1996, 40th Annual Report of the Registrar of , Newspapers for India, Ministry of Information and Broadcasting, Government of India, New Delhi.

Moris J (1991), Extension Alternatives in Tropical Africa, Overseas Development Institute, London, UK.
NHB (1999), Indian Horticultyre Database, National Horticultural Board, Minstry of Agriculture, Government of India, New Delhi.
Pal,S and Singh A (1997) Agricultural Research and Extension in India: Institutional Structure and Investments, Policy Paper 7, National Centre for Agricultural Economics and Policy Research, New Delhi.
Pandey U.K and M.A. Muraleedharan (1977), An application of discriminant function in Agricultural finance, Indian Journal of Agricultural Economics, Vol 32,(2) pp 41-51.
Rao.D.R. and Muralidhar, U (1994), AGRIUNIS, National Academy of Agricultural Research Management, Hyderabad
Rivera, W.M.(1991), Agricultural Extension Worldwide: A critical Point, in Rivera.W.M and D.J Gustafson, Agricultural Extension-Worldwide Institutional Evolution and Forces for Change, Elsevier Publishers, Amsterdam.
Rogers E.M. (1983) Diffusion of innovations, 3rd Edition, Free press, New York, pp 260-261.
Rogers, W.L (1987), The Private sector: its extension systems and public-private coordination in Rivera, W,M and Schram (eds) Agricultural Extension Worldwide, Groom Helm, London.
Rolling, N (1988), Extension Sciences-Information Systems in Agricultural Development, Cambridge University Press, Cambridge, UK
Sathish S and Premkumar, N (1993) Are NGOs More Cost Effective than Government in Livestock Delivery? A study of artificial insemination in India, In Farrington, J and Lewis J (Eds) A/on Governmental Organisations and the State in Asia, Routledge, London.
Savas, E.S.(1987) Privatisation: the key to better Government, Chatham House Publisher Inc, New Jersey, pp 3-10.
Swanson, B.E and Clarr, J.B (1984) Agricutural Extension-a Reference Manual, 2nd Edition, FAO.Rome.
Sulaiman V,R and Gadewar, A.U. (1994), Privatisation of Extension Services-Implications in the Indian Context, J Rural Reconstruction, 27(2).
Swanson, B.E, Farmer, B.J and Behal.R (1990), The current status of Agricultural extension worldwide in FAO Report of the Global Consultation on Agricultural Extension, 4-8 December, 1989, Rome.
Umali, D.L and Schwartz, L (1994), Public and Private Agricultural Extension: Beyond Traditional Frontiers, World Bank Discussion Paper No.236. World Bank, Washington D.C.
van den Ban, A.W and Hawkins, H.S (1998) Agricultural Extension, Longman Scientific and Technical, Longman Group, UK Ltd.
van den Ban, A.Wand Hawkins.H.S (1998), Agricultural Extension (second edition), CBS Publishers and Distributors, New Delhi.
van den Ban,A.W.(2000), personal communication

Wilson,M. (1991), Reducing the Costs of Public Extension Services: Initiatives in Latin America in Rivera.W.M and D.J Gustafson, Agricultural Extension-Worldwide Institutional Evolution and Forces for Change, Elsevier Publishers, Amsterdam.
Zijp, W (1992) From Agricultural Extension to Rural Information Management, in Jack R. Anderson and Cornelis de Hann (Eds) Public and Private Roles in Agricultural Development-^ Agricultural Sector Symposium, World Bank, Washington.

Annexures Annexure 1. Important crops in the selected districts
No Districts Important crops grown and its area as % of the Gross Cropped Area
MAHARASHTRA
1. Pune Jowar(51.08), Bajra (17.83), Rice (5.76) Wheat, (4.78), Groundnuts (4.57)
2 Nashik Bajra (46.69), Jowar (10.91), Wheat (1 0.17) Ragi (5.74), Groundnuts (5.01)
3 Nagpur Jowar (31 .38), Wheat (1 1 .04), Cotton (1 0.87) Arhar (8.91), Soyabeans (8.37)
RAJASTHAN
4. Jaipur Bajra (37.07), Wheat (20.70), Rapeseed (10.38) Gram(7.41), BarleyJ6.99)
5. Kota Wheat 21. 52),Coriander (16.22), Jowar (15.94), Gram (14.15), Rapeseed (9.27)
6. Udaipur Maize(56.26), Wheat (14.12 ) Jowar (7.34) Barley (5.19), Rapessed (3.01)
KERALA
7. Thiruvananthapuram Coconuts (55.47), Tapioca (20.89), Rice (15.71) .Bananas (3.85), Pepper (2.67)
8. Kottayam Rubber (45.66), Coconuts (23.10), Rice (14.57) Tapioca (7.51), Banana(2.42)
9. Kasargode Coconuts (38.73), Rice (27.69) Arecanuts (12.94) Pepper (10.71), Tapioca(3.56)
BIHAR
10. Patna Rice(52.53), Wheat (29.90), Gram (7.24) Maize (4.38), Potatoes (1 .87)
11. Samastipur 1 Rice (35.44), Wheat (27.30), Maize (22.57) Potatoes (2.53), Tobacco (2.02)
12. Ranchi Rice (80.63), Ragi (7.33), Nigerseed (2.71) Maize (1.94), Potatoes (1 .87)
Source: CMIE, (1993)

Annexure 2. Course-wise and year-wise enrollment of students at the School of Agricultural Sciences (YCMOU)
Year No. Programme
1993 -94
1994- 95
1995- 96
1996- 97
1997- 98
Total
1. Certificate in Gardening - - - 147* 188 335
2. Foundation in Agriculture 488* 790 830 1115 1467 4690
3. Diploma in Fruit Production - 402 687 958 1389 3436
4. Diploma in Vegetable Production
- " 224* 365 674 1263
5. Diploma in Floriculture and Landscape Gardening
- - - 334 399 733
6. Bachelor of Horticulture Science (B.H.Sc)
145 145
Grand Total 498 1192 1741 2919 4262 10602
* indicate the programme launched during the year. Source: Gunial,S(1997)

Annexure 3. Activities of the Consultancy Cell, College of Agriculture, Naqpur (1997-98)
No Activity Charges No of farmers
benefitted
Amount collected
1. Agro-poly clinic consultancy Rs.20/- 86 1720
2. Training to farmers Rs.5O/cultivator/ Day
238 11900
3. Crop-wise consultancy (soybean, cotton, sugarcane and fruit crops)
Rs.800/- Rs.3000/-
2 1
1600 3000
4. Trainings organised (IO) 1 hrs Rs.2500/- 2 hrs Rs.4000/- 3 hrs Rs.5000/- + conveyance
1900 35300
5. Transfer of new agricultural technology (on-campus) through Agro-poly Clinic
Free 3000 ------------
6. Transfer of technology through field visits, krishi mela, field day etc.(1997-98)
------------ 5600
7. Sale and Publicity of university publications/seeds; biofertilisers etc, through poly clinic:
a. Krishi margadarshik-97 5800 232000
b. Krishi margadarshik-98 4000 165000
c. Bokks on cultivation of cotton, sugarcane etc
700 4300
d. Sale of university produce like seeds
250 300000
TOTAL 21517 854820

Annexure 4 Number of periodicals dealing in agriculture and animal husbandry in India (1995) periodicity-wise
No. Periodicity Number
1. Week 32
2. Fortnight 35
3. Month 232
4. Quarter 107
5. Others 57
6. Annual 16
7. TOTAL 479
Source: Mo I&B (1996).

Annexure 5. Number of periodicals dealing in agriculture and animal husbandry in lndia-(1995) -language wise
No Language Number
1. English 177
2. Hindi 117
3. Assamese 1
4. Bengali 18
5. Gujrati 15
6. Kannada 12
7. Malayalam 14
8. Marathi 25
9. Oriya 5
10. Punjabi 17
11. Tamil 12
12. Telugu 13
13. Bi-lingual 47
14. Multi-lingual 5
15. Others 1
TOTAL 479
Source: Mol&B(1996)

Annexure 6. Classification of results
Maharashtra Rajasthan Kerala
Predicted group membership
Predicted group membership
Predicted Group Membership
Actual Group
No of Cases
Willing to pay
Not Willing to Pay
No of Cases
Willing to pay
Not Willing to Pay
No of Cases
Willing to Pay
Not willing to pay
Willing to Pay
89 59 (66.3%)
30 (33.7%)
72 52 (72.2%)
20 (27.8%)
79 55 (69.6%)
24 (30.4%)
Not willing to Pay
72 24 (33.3%)
48 (66.7%)
105 30 (28.6%
75 (71.4%)
71 23 (32.4%)
48 (67.6%)
Group cases correctly classified
66.46% 71.75% 68.67%