Contents€¦ · from: Intergovernmental Panel on Climate Change (IPCC) fifth Assessment report –...
62
1 Climate Leadership Discussion Document CLIMATE LEADERSHIP Discussion Document
Transcript of Contents€¦ · from: Intergovernmental Panel on Climate Change (IPCC) fifth Assessment report –...

1Climate Leadership Discussion Document
Climate leadership
discussion document

2 Climate Leadership Discussion Document
Minister’s Message ............................................................................................. 1
Climate Leadership Discussions ...................................................................... 2
Effects of Climate Change .................................................................................. 5
Health and the Environment ........................................................................... 6
Alberta’s Vision .................................................................................................... 8
Alberta’s Challenge ............................................................................................. 9
Alberta’s Emissions Profile ............................................................................... 14
Oil and Gas .................................................................................................. 20
Electricity ...................................................................................................... 27
Transportation .............................................................................................. 35
Buildings and Houses .................................................................................. 41
Other Industrial Emitters, Manufacturing and Construction ........................ 47
Agriculture, Forestry and Waste .................................................................... 52
Next Steps .......................................................................................................... 57
Contents
1Climate Leadership Discussion Document
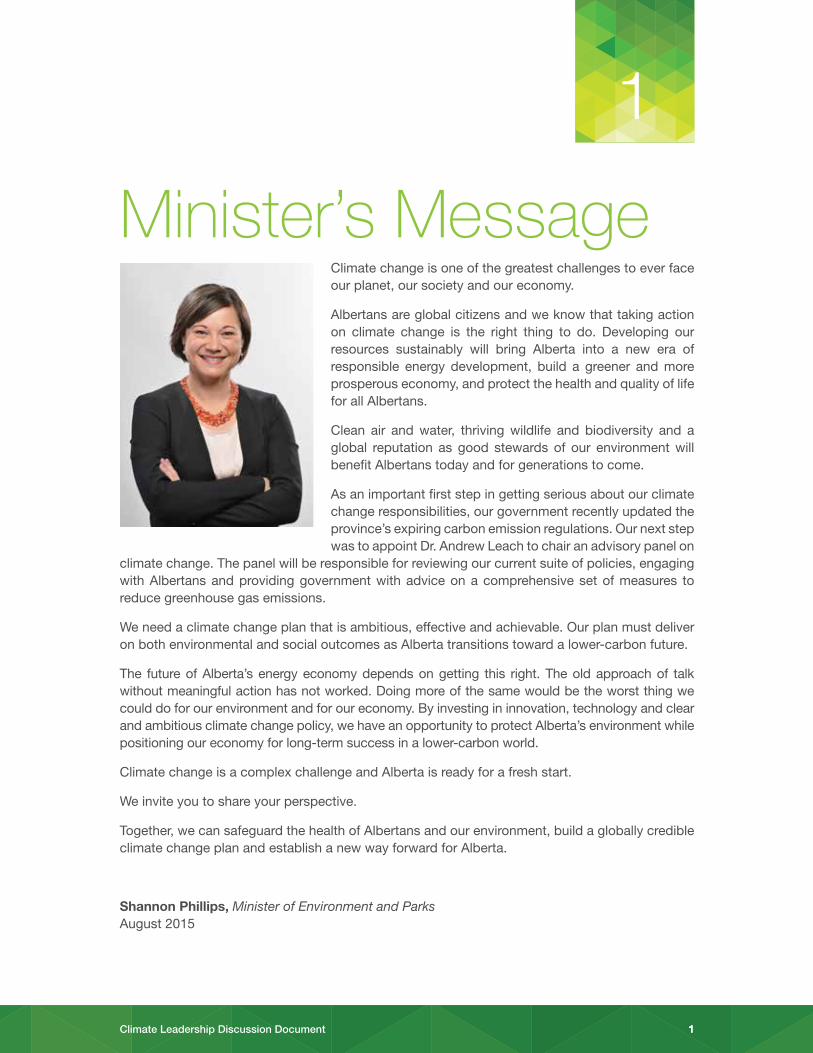
Climate change is one of the greatest challenges to ever face our planet, our society and our economy.
Albertans are global citizens and we know that taking action on climate change is the right thing to do. Developing our resources sustainably will bring Alberta into a new era of responsible energy development, build a greener and more prosperous economy, and protect the health and quality of life for all Albertans.
Clean air and water, thriving wildlife and biodiversity and a global reputation as good stewards of our environment will benefit Albertans today and for generations to come.
As an important first step in getting serious about our climate change responsibilities, our government recently updated the province’s expiring carbon emission regulations. Our next step was to appoint Dr. Andrew Leach to chair an advisory panel on
climate change. The panel will be responsible for reviewing our current suite of policies, engaging with Albertans and providing government with advice on a comprehensive set of measures to reduce greenhouse gas emissions.
We need a climate change plan that is ambitious, effective and achievable. Our plan must deliver on both environmental and social outcomes as Alberta transitions toward a lower-carbon future.
The future of Alberta’s energy economy depends on getting this right. The old approach of talk without meaningful action has not worked. Doing more of the same would be the worst thing we could do for our environment and for our economy. By investing in innovation, technology and clear and ambitious climate change policy, we have an opportunity to protect Alberta’s environment while positioning our economy for long-term success in a lower-carbon world.
Climate change is a complex challenge and Alberta is ready for a fresh start.
We invite you to share your perspective.
Together, we can safeguard the health of Albertans and our environment, build a globally credible climate change plan and establish a new way forward for Alberta.
Shannon Phillips, Minister of Environment and Parks August 2015
Minister’s Message
1
1

2 Climate Leadership Discussion Document
2
Alberta’s Climate Leadership Discussions are intended to inform a comprehensive action plan on climate change. This discussion document lays the foundation for these important conversations with Albertans. It sets out the challenges we face, presents considerations and options for action and poses crucial questions that Albertans will have the opportunity to explore.
An advisory panel will guide the Climate Leadership Discussions and provide advice to inform government’s development of a new action plan. The panel’s advice will consider environmental, social and economic factors, and ensure that interactions with related policies, such as Alberta’s royalty review, are fully understood.
Alberta’s Climate Change Advisory Panel will guide the public and stakeholder engagement process, facilitate discussion and debate, consider the input received and provide advice to Alberta’s Minister of Environment and Parks in the fall of 2015.
Climate Leadership Discussions
Climate Leadership Discussion Document
Public Engagement(Online and Community)
Aboriginal Engagement
Technical Engagement
Climate Change Advisory Panel Advice to the Minister of Environment and Parks (Summary of feedback received and considerations for government)

3Climate Leadership Discussion Document
MeMbers of AlbertA’s ClIMAte CHANGe ADVIsorY PANel
Chair - Dr. Andrew Leach, Associate Professor and Academic Director of Energy Programs at the University of Alberta School of Business
Gordon Lambert, the President and Chief Collaboration Officer of GRL Collaboration for Sustainability
Linda Coady, Chief Sustainability Officer, Enbridge Inc
Stephanie Cairns, Principal of Wrangellia Consulting and Director of Carbon Pricing with Sustainable Prosperity
Angela Adams, Director of Education, Unifor

4 Climate Leadership Discussion Document
MessAGe froM tHe CHAIr
We want to hear your thoughts on what Alberta’s goals should be and how they can be achieved. Action to reduce greenhouse gas emissions goes far beyond the most talked-about industries. All Albertans must be part of the solution. We look forward to hearing about ways Albertans can reduce emissions in their day-to-day lives, about new technologies and the opportunities for success they bring and about how the province can continue to prosper in a lower-carbon future.
We will learn from Alberta’s citizens, labour, industry, communities, other jurisdictions, scientists, economists, traditional knowledge shared
by Indigenous Peoples and experts in a variety of emerging and already prominent industries to provide the government with a comprehensive set of options to inform a new action plan on climate change.
Dr. Andrew Leach, Advisory Panel Chair
Get INVolVeD!Albertans are invited to participate in Alberta’s Climate leadership Discussions. these conversations will inform government’s climate change action plan, which will affect all Albertans – from large industry to individual home owners.
Visit: http://alberta.ca/climate-leadership.cfm for more information, to learn more about the engagement process and opportunities to attend public meetings, or to take the online survey.

5Climate Leadership Discussion Document
3
Climate change is real and it is having a tangible effect locally, globally and nationally.
The effects of climate change are wide reaching and scientific evidence overwhelmingly suggests that, without significant action on a global scale, the consequences will be severe.
The rate of observed changes in the world’s climate since the 1950s is unprecedented. The concentrations of greenhouse gases in the atmosphere have increased, leading to a warming atmosphere; diminishing snow and ice in many regions; warming oceans and rising sea levels; and more extreme weather events, including floods and droughts.1
Human influence on the climate system is clear, and recent anthropogenic emissions of greenhouse gases are the highest in history. Recent climate changes have had widespread impacts on human and natural systems. from: Intergovernmental Panel on Climate Change (IPCC) fifth Assessment report – synthesis report2
Since 1900, the global average surface temperature has increased by about 0.8 °C (1.4 °F). This has been accompanied by warming of the ocean, a rise in sea level, a strong decline in Arctic sea ice, and many other associated climate effects. Much of this warming has occurred in the last four decades. from: Climate Change: evidence and Causes - An overview from the royal society and the Us National Academy of sciences3
In Canada, over 80% of total national greenhouse gas emissions are associated with the production or consumption of fossil fuels for energy purposes. from: Canada’s Action on Climate Change4
Effects of Climate Change
1. https://www.ipcc.ch/pdf/assessment-report/ar5/syr/AR5_SYR_FINAL_SPM.pdf IPCC, 2014: Climate Change 2014: Synthesis Report. Contribution of Working Groups I, II and III to the Fifth Assessment Report of the Intergovernmental Panel on Climate Change [Core Writing Team, R.K. Pachauri and L.A. Meyer (eds.)]. IPCC, Geneva, Switzerland, 151 pp.
2. http://www.ipcc.ch/report/ar5/syr/ IPCC, 2014: Climate Change 2014: Synthesis Report. Contribution of Working Groups I, II and III to the Fifth Assessment Report of the Intergovernmental Panel on Climate Change [Core Writing Team, R.K. Pachauri and L.A. Meyer (eds.)]. IPCC, Geneva, Switzerland, 151 pp.
3. https://royalsociety.org/policy/projects/climate-evidence-causes/
6 Climate Leadership Discussion Document
HeAltH AND tHe eNVIroNMeNt
Reducing greenhouse gas emissions can have very real benefits to the health of Albertans and to people around the world. Action on climate change can help ensure Albertans today, and for generations to come, have clean air to breathe, clean water to drink and a healthy environment to enjoy.
Carbon emissions from electricity generation, especially from burning coal, from industry and from the tail pipes of cars and trucks can pose real dangers to human health. Each of these emissions sources release harmful pollutants into the atmosphere - into the air that Albertans breathe.
But Alberta can do something about it, by taking action to reduce emissions and transition toward a greener economy. Action in all of the province’s emission sources - from oil, gas and electricity production to using energy more efficiently in day-to-day life - will be necessary to protect the environment, safeguard human health and ensure Alberta’s future as a great place to grow up, live, work and play.
4. http://www.climatechange.gc.ca/default.asp?lang=En&n=F2DB1FBE-1

7Climate Leadership Discussion Document
Global climate change can also create local impacts, such as the serious threat to Alberta’s forests due to the spread of the mountain pine beetle.
Alberta’s strong economy, employment rate and population growth all demonstrate the benefits of a thriving energy economy. However, Alberta has much more to offer Canada, and the world, than its energy products. Alberta is home to some of the finest post-secondary and research institutions in the world and has decades of experience in solving energy problems. That same expertise can be applied to solving the energy challenges of today. By investing in innovation, technology and new ways of approaching old problems, Alberta can transition to a greener, more environmentally responsible province with a knowledge-based, lower-carbon economy.
Beyond the health and environmental benefits to Albertans, there is a global benefit of action on climate change. Albertans have seen the devastating impact of pollution on cities and countries around the world - from smog to contaminated water to rising sea levels and animal species in danger of extinction. Albertans know that taking action on climate change is about doing the right thing, standing up to these challenges and acknowledging the province’s responsibility as part of the global community. Climate change is truly a global challenge and everyone needs to do their part to protect the planet, its ecosystems and the health of future generations.

8 Climate Leadership Discussion Document
4
Alberta’s vision is of a healthy and prosperous province that is a leader in environmental stewardship and enjoys sustained economic growth, steady job creation and a great quality of life.
This vision belongs to all Albertans and all Albertans will play a role in achieving it.
The province’s new approach to climate change will:
• serve as an important commitment to protect the health of Albertans and our ecosystem;
• make a significant and meaningful contribution to Canada’s greenhouse gas reduction commitments and the global effort to mitigate climate change;
• ensure the continued strength and competitiveness of the province’s economy in a lower-carbon world;
• advance innovation, encourage adoption of new technologies and support more renewable and cleaner sources of energy and conservation;
• acknowledge the interactions and coordinate with other related policy initiatives, including the royalty review, land-use plans, infrastructure planning and investment;
• provide open and transparent monitoring and regular reporting to Albertans on progress toward emissions reductions;
• foster partnerships with municipalities, provinces, territories, the federal government and First Nations and Métis communities; and
• ensure Albertans are engaged and part of the solution.
Alberta’s Vision

9Climate Leadership Discussion Document
5
Alberta’s Challenge
0
50
100
150
200
250
300Agriculture, Forestry and Waste
Buildings and Houses
Other Industrial, Manufacturing and Construction
Transportation
Electricity Generation
Other Oil and Gas
Oil Sands
1990
1991
1992
1993
1994
1995
1996
1997
1998
1999
2000
2001
2002
2003
2004
2005
2006
2007
2008
2009
2010
2011
2012
2013
Em
issi
ons
(Mill
ion
tonn
es C
O2e
)
Alberta’s challenge is to be a leader in a world that is taking action on climate change.
AlbertA HIstorIC eMIssIoNs bY seCtor
Alberta’s economy is fueled by natural resources. Energy production and use in the province has grown significantly and that growth has resulted in increased greenhouse gas emissions.
Reducing emissions does not mean halting economic activity – Alberta must grow its economy sustainably and in a way that is more responsive to a changing global market.
Alberta’s energy industry recognizes the need to reduce emissions and is already taking action.
For example, new technologies and improved operational practices drove a 20% reduction in emissions per barrel of bitumen produced at regulated Alberta in situ oil sands extraction facilities between 2007 and 20145, and Alberta’s oil sands industry is the main developer of cogeneration in the province. Cogeneration, the combined production of heat and electricity from a single fuel source, is more energy efficient than separate electricity and heat production and, as of September 2014, made up 30% of Alberta’s total installed generation capacity.
5. Regulatory reporting results for in situ oil sands facilities under the Specified Gas Emitters Regulation, excluding facilities with integrated upgraders.

10 Climate Leadership Discussion Document
Emission Reduction Targets
In 2008, Alberta set greenhouse gas reduction targets for 2020 and 2050 based on reductions from a “business as usual” emissions forecast. this forecast anticipated ongoing growth in provincial emissions. emission reduction targets were set to reduce growth, but not achieve reductions in total provincial emissions for some time. Alberta’s targets were based on emissions rising to a peak in 2020, and then reduce, post-2020, from those levels.
this is in contrast to most other jurisdictions, where it is common to set emission reduction targets from historic levels, typically 1990 or 2005 based on international agreements – for example, reducing jurisdiction total emissions by 20% compared to 2005 levels. these targets result in more immediate absolute emissions reductions.
Emission Reduction Tools
Alberta’s specified Gas emitters regulation requires large industrial facilities to reduce their emissions intensity. reducing emissions intensity means reducing the per-unit greenhouse gas output – for example, reducing emissions by 20% per barrel of oil produced. In practical terms, this means that Alberta can meet its intensity-based regulatory requirement – reducing per-unit product emissions – but produce more units overall, leading to higher total provincial emissions.
Intensity-based tools can drive lower total emissions, but only if there are sufficient reduction requirements.
• the current requirements apply to large industry, which accounts for approximately 45% of Alberta’s emissions.
• the current requirements ask these large industries to reduce their emissions intensity by 12% below a historical baseline. this means that each facility can continue to emit most of its emissions (88% per of its emissions intensity).
• the current requirements offer wide compliance flexibility, including unlimited ability to pay into a fund for excess emissions (currently set in Alberta as $15/tonne).
the coverage, reduction requirement and carbon price would have to be set much higher to drive the level of effort that would be required to achieve absolute provincial emission reductions under increasing growth in Alberta.
11Climate Leadership Discussion Document
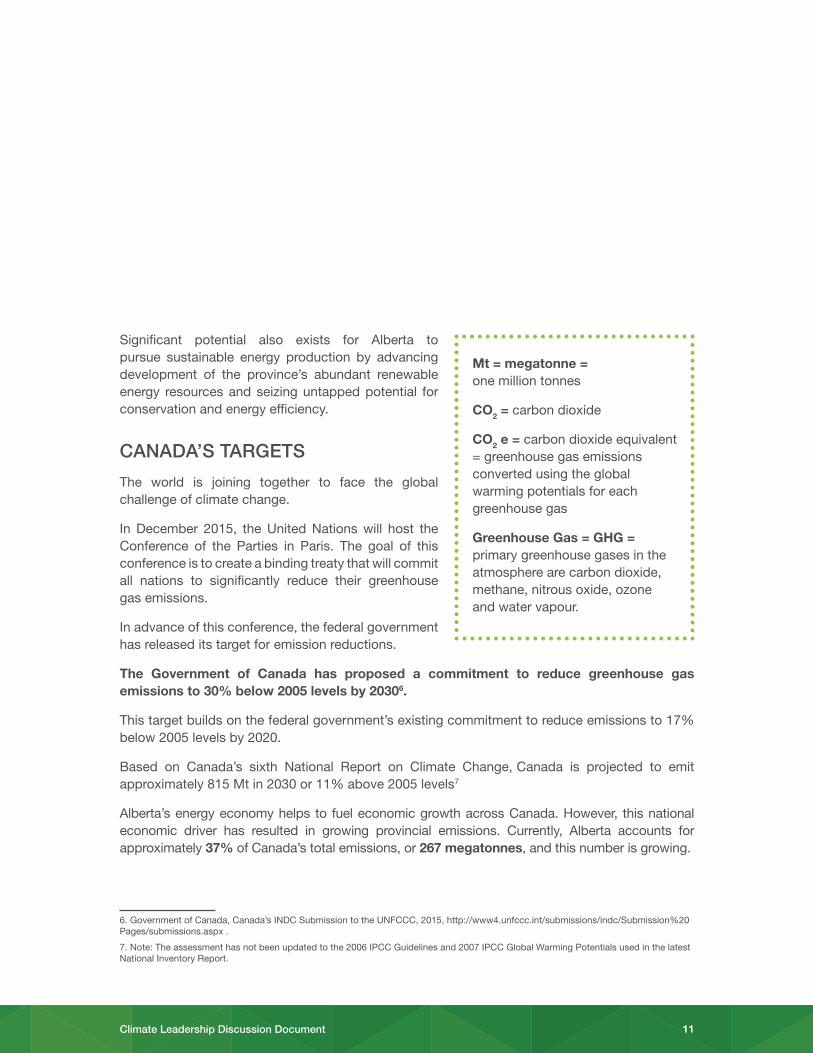
Mt = megatonne = one million tonnes
CO2 = carbon dioxide
CO2 e = carbon dioxide equivalent = greenhouse gas emissions converted using the global warming potentials for each greenhouse gas
Greenhouse Gas = GHG = primary greenhouse gases in the atmosphere are carbon dioxide, methane, nitrous oxide, ozone and water vapour.
Significant potential also exists for Alberta to pursue sustainable energy production by advancing development of the province’s abundant renewable energy resources and seizing untapped potential for conservation and energy efficiency.
CANADA’s tArGets
The world is joining together to face the global challenge of climate change.
In December 2015, the United Nations will host the Conference of the Parties in Paris. The goal of this conference is to create a binding treaty that will commit all nations to significantly reduce their greenhouse gas emissions.
In advance of this conference, the federal government has released its target for emission reductions.
The Government of Canada has proposed a commitment to reduce greenhouse gas emissions to 30% below 2005 levels by 20306.
This target builds on the federal government’s existing commitment to reduce emissions to 17% below 2005 levels by 2020.
Based on Canada’s sixth National Report on Climate Change, Canada is projected to emit approximately 815 Mt in 2030 or 11% above 2005 levels7
Alberta’s energy economy helps to fuel economic growth across Canada. However, this national economic driver has resulted in growing provincial emissions. Currently, Alberta accounts for approximately 37% of Canada’s total emissions, or 267 megatonnes, and this number is growing.
6. Government of Canada, Canada’s INDC Submission to the UNFCCC, 2015, http://www4.unfccc.int/submissions/indc/Submission%20Pages/submissions.aspx .
7. Note: The assessment has not been updated to the 2006 IPCC Guidelines and 2007 IPCC Global Warming Potentials used in the latest National Inventory Report.

12 Climate Leadership Discussion Document
In the most recent Environment Canada projection, Alberta emissions were projected to grow to 294 Mt by 2020, 39% of Canada’s total emissions.9
This 2020 forecast was created in the fall of 2014 and, though it is the most current available, it does not reflect the recent drop in oil prices, the resulting change in production forecast and subsequent emission reductions, nor the increased regulatory requirements introduced in Alberta in June 2015.
A meaningful contribution from all provinces and territories will be needed to help Canada meet its targets. However, as the province has already experienced, the reputational impact of Canada’s action on climate change is likely to fall heavily on Alberta.
Reducing emissions in Alberta will be a complex challenge, but credible climate change policies are essential to securing Alberta’s future as a prosperous energy economy in a global marketplace.
Energy is the driving force of Alberta’s, and Canada’s, economy. Energy accounts for about 30% of the province’s Gross Domestic Product (GDP) directly, and energy influences demand in most other sectors of the economy in Alberta and across the country. In the 2014/15 fiscal year, non-renewable resource revenue, the vast majority of which comes from oil and gas royalties, totaled $8.95 billion or about 18% of Alberta’s total government revenue. This does not include the $5.6 billion in corporate income taxes and $11 billion in personal income taxes collected in the same year, much of which is driven by energy company income and employment.
Action on climate change is crucial to the future of the province’s economy.
The value of Alberta’s energy products comes from trade in the global marketplace. Alberta exports approximately 75% of its oil and 50% of its natural gas. Alberta’s energy economy depends on its ability to reach and sell its resources to markets in North America and around the world.
throughout this discussion guide, you will see sections that put a ‘Spotlight on Innovation’, profiling promising initiatives that are already underway.
Alberta can build on these innovations as the province moves toward a lower- carbon future.
9. Ibid.

13Climate Leadership Discussion Document
As nations around the world join the fight against climate change, demand is growing for cleaner forms of energy. Global policies are increasingly putting more emissions-intensive energy sources at a disadvantage. For example, California’s Low-Carbon Fuel Standard calls for a reduction of at least 10% in the carbon intensity of transportation fuels by 2020, meaning fuels made from crude sources with emissions-intensive production methods will be at a disadvantage in one of North America’s largest transportation fuel markets.
In the absence of strong climate change policies, Alberta’s energy production has increasingly come under the microscope, drawing domestic and international criticism. Alberta’s resources have become a symbol of the challenge of climate change. International and domestic resistance to energy infrastructure projects, including pipelines, highlights the increasing importance of environmental performance to customers and regulators alike.
Albertans, Canadians and nations across the world are demanding a greener product. A lower-carbon energy industry can help Alberta meet that demand, allowing the province’s economy to thrive for generations to come.
All AlbertANs HAVe A role to PlAY
Any ambitious climate change policy will involve significant contributions from Alberta’s energy industries, creating both challenges and opportunities, but these industries cannot be the only focus.
The day-to-day lives of Albertans also contribute to greenhouse gas emissions. Alberta’s policies must address emissions from all sources – oil and gas, electricity, transportation, buildings and houses, industry, construction, manufacturing, agriculture, forestry and waste.
MEETiNG THE CHALLENGE
The world is demanding energy products that are less emissions-intensive.
Canada has set a reduction target for 2030 - 30% below 2005 levels - requiring significant emissions reductions.
Alberta must move toward a greener future, with strong commitments and a globally credible climate change action plan.
14 Climate Leadership Discussion Document
6
Alberta’s emissions come from sectors across the economy, as well as the day-to-day lives of Albertans. Alberta may choose to adopt a single, economy-wide policy or a set of policies as the basis for its approach to climate change.
Alberta will need to take action in all sectors in order to drive emissions reductions, protect the health of Albertans and establish the province as a globally credible environmental leader.
eMIssIoNs ProfIle:
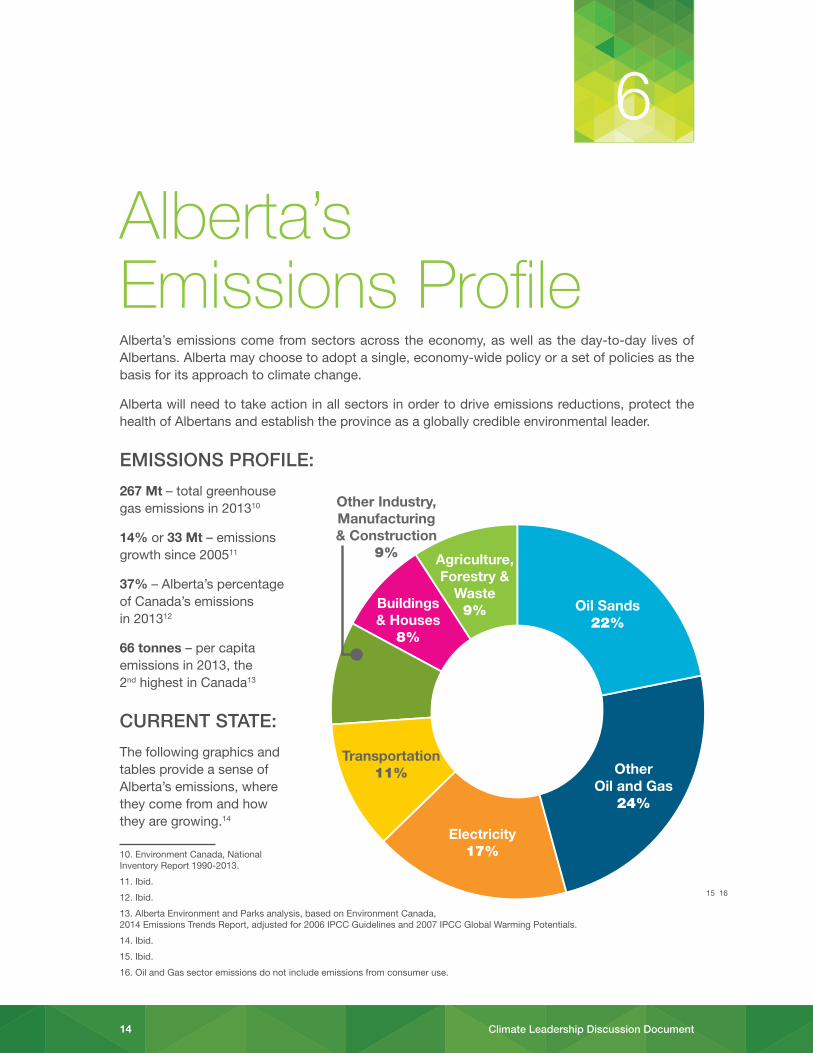
267 Mt – total greenhouse gas emissions in 201310
14% or 33 Mt – emissions growth since 200511
37% – Alberta’s percentage of Canada’s emissions in 201312
66 tonnes – per capita emissions in 2013, the 2nd highest in Canada13
CUrreNt stAte:
The following graphics and tables provide a sense of Alberta’s emissions, where they come from and how they are growing.14
Alberta’s Emissions Profile
Other Oil and Gas
24%
Oil Sands22%
Electricity 17%
Transportation11%
Other Industry, Manufacturing & Construction
9%
Buildings & Houses
8%
Agriculture, Forestry &
Waste9%
10. Environment Canada, National Inventory Report 1990-2013.
11. Ibid.
12. Ibid.
13. Alberta Environment and Parks analysis, based on Environment Canada, 2014 Emissions Trends Report, adjusted for 2006 IPCC Guidelines and 2007 IPCC Global Warming Potentials.
14. Ibid.
15. Ibid.
16. Oil and Gas sector emissions do not include emissions from consumer use.
15 16

15Climate Leadership Discussion Document
AlbertA HIstorIC AND ProjeCteD eMIssIoNs (as of 2014)
Historical Emissions19
Emission Projections20 21
Alberta emissions sector breakdown (2013) 1990 2005 2013 2020 2030
Oil and Gas 69 96 122 145 174
Electricity Generation 40 50 45 42 33
Transportation 18 27 30 31 31
Other Industry, Manufacturing and Construction
19 19 24 30 35
Buildings and Houses 12 16 21 24 29
Agriculture, Forestry and Waste 17 25 25 23 25
total 175 233 267 294 326
AlbertA eMIssIoNs seCtor breAkDowN
0
10
20
30
40
50
60Industrial Natural Gas Fired Generation (Mt)*
Utility Natural Gas Fired Generation (Mt)
Coal Fired Generation (Mt)
0
5
10
15
20
25
30
35Other Transport
Passenger Transport
Freight Transport
0
5
10
15
20
25
30Commercial and Institutional Buildings
Residential Buildings
0
5
10
15
20
25
30
35Construction
Light Manufacturing
Metals, Cement, Lime and Gypsum
Chemicals and Fertilizers
Mining
0
5
10
15
20
25Forest Resources
Waste
Agriculture
0
50
100
150
200Petroleum Re�ning
Oil and Gas Transmission and Distribution
Oil Sands (Mining, In-situ & Upgrading)
Conventional Oil Production
Natural Gas Production and Processing
Oil and Gas
1990
2000
2010
2020
2030 0
50
100
150
200Petroleum Re�ning
Oil and Natural Gas Transmission
Oil Sands In Situ Extraction
Oil Sands Upgrading
Oil Sands Mining and Extraction
Conventional Oil Production
1990
2000
2010
2020
2030
1990
2000
2010
2020
2030
1990
2000
2010
2020
2030
1990
2000
2010
2020
2030
1990
2000
2010
2020
2030
1990
2000
2010
2020
2030
0
10
20
30
40
50
60Industrial Natural Gas Fired
Utility Natural Gas Fired Generation (Mt)
Coal Fired generation (Mt)
1990
2000
2010
2020
2030
Mt
CO
2eM
t C
O2e
Mt
CO
2eM
t C
O2e
Mt
CO
2eM
t C
O2e
0
5
10
15
20
25
30
35Other Transport
Passenger Transport
Freight Transport
Transportation
1990
2000
2010
2020
2030
Mt
CO
2e
0
5
10
15
20
25
30Commercial and Institutional
Residential
Buildings & Houses19
90
2000
2010
2020
2030
Mt
CO
2e
0
5
10
15
20
25
30
35Construction
Light Manufacturing
Metals, Cement, Lime and Gypsum
Chemicals & Fertilizers
Mining
Other Industry, Manufacturing and Construction
1990
2000
2010
2020
2030
Mt
CO
2e
0
5
10
15
20
25Forest Resources
Waste
Agriculture
Agriculture, Forestry and Waste
1990
2000
2010
2020
2030
Mt
CO
2e
0
50
100
150
200
250
300
350
Mt
CO
2e
1990
2000
2010
2020
2030
0
50
100
150
200
250
300
350
0
50
100
150
200
250
300
350
1990
2000
2010
2020
2030
0
50
100
150
200
250
300Agriculture, Forestry and Waste
Buildings and Houses
Other Industry, Manufacturing and Construction
Transportation
Electricity
Oil and Gas
0
50
100
150
200
250
300Agriculture, Forestry and Waste
Buildings and Houses
Other Industrial Emitters, Manufacturing and Construction
Transportation
Electricity
Oil and Gas
1990
1991
1992
1993
1994
1995
1996
1997
1998
1999
2000
2001
2002
2003
2004
2005
2006
2007
2008
2009
2010
2011
2012
2013
Em
issi
ons
(Mill
ion
tonn
es C
O2e
)
Natural Gas Production and Processing
17 18
19. Alberta Environment and Parks analysis, based on Environment Canada, 2014 Emissions Trends Report, adjusted for 2006 IPCC Guidelines and 2007 IPCC Global Warming Potentials.
20. Note: this forecast was created in the fall of 2014, and though it is the most current available, it does not reflect the recent drop in oil prices, the resulting change in production forecast and subsequent reduction in emissions, nor the increased regulatory requirements introduced in Alberta in June 2015.
21. Ibid.
17. Alberta Environment and Parks analysis, based on Environment Canada, 2014 Emissions Trends Report, adjusted for 2006 IPCC Guidelines and 2007 IPCC Global Warming Potentials
18. Note: this forecast was created in the fall of 2014, and though it is the most current available, it does not reflect the recent drop in oil prices, the resulting change in production forecast and subsequent reduction in emissions, nor the increased regulatory requirements introduced in Alberta in June 2015.

16 Climate Leadership Discussion Document
GoAls AND objeCtIVes
When creating a policy to reduce greenhouse gas emissions, it is important to be clear about goals and objectives. Climate change is a global challenge with local, national and international implications. The same applies to the goals and objectives of any climate change mitigation plan.
Internationally, the most common means to measure climate change performance is through comparisons of emissions in future years to some base year (typically 2005 or 1990). Alberta is one of only a few jurisdictions that uses a hypothetical business-as-usual scenario, which is a reduction target against projected growth.
Within such frameworks, policies can be:
• designed to generate the same emission reductions, either in absolute, per capita, or per unit GDP terms across jurisdictions (with different jurisdictions paying different pricing per tonne of reduction); or,
• designed to harmonize carbon policies, be they price-based or equivalent regulatory requirements for emission reductions or technology adoption across jurisdictions (with differing emissions implications).
In any case, policies should be revisited over time to ensure they continue to meet objectives.
Other approaches to frame goals and objectives might include:
• targeting a specific global temperature target;
• targeting a significant phase-out of carbon emissions over time; or
• strengthening all policies to match the most ambitious policy currently in place within a given country or region.
In all cases, it is important that policies are designed to achieve desired outcomes and that specific goals be supported by concrete policies and action plans. Alberta will need to carefully consider how its goals fit with Canada’s emission reduction targets.
17Climate Leadership Discussion Document
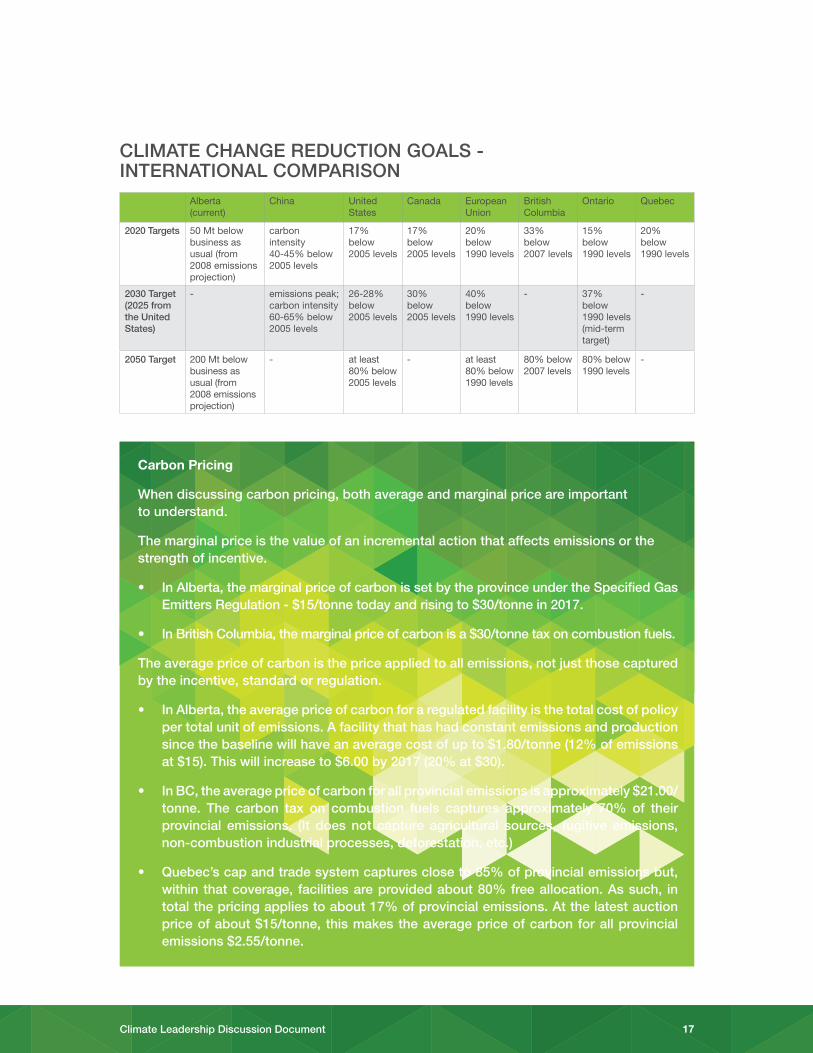
Carbon Pricing
when discussing carbon pricing, both average and marginal price are important to understand.
the marginal price is the value of an incremental action that affects emissions or the strength of incentive.
• In Alberta, the marginal price of carbon is set by the province under the specified Gas emitters regulation - $15/tonne today and rising to $30/tonne in 2017.
• In british Columbia, the marginal price of carbon is a $30/tonne tax on combustion fuels.
the average price of carbon is the price applied to all emissions, not just those captured by the incentive, standard or regulation.
• In Alberta, the average price of carbon for a regulated facility is the total cost of policy per total unit of emissions. A facility that has had constant emissions and production since the baseline will have an average cost of up to $1.80/tonne (12% of emissions at $15). this will increase to $6.00 by 2017 (20% at $30).
• In bC, the average price of carbon for all provincial emissions is approximately $21.00/tonne. the carbon tax on combustion fuels captures approximately 70% of their provincial emissions. (It does not capture agricultural sources, fugitive emissions, non-combustion industrial processes, deforestation, etc.)
• Quebec’s cap and trade system captures close to 85% of provincial emissions but, within that coverage, facilities are provided about 80% free allocation. As such, in total the pricing applies to about 17% of provincial emissions. At the latest auction price of about $15/tonne, this makes the average price of carbon for all provincial emissions $2.55/tonne.
ClIMAte CHANGe reDUCtIoN GoAls - INterNAtIoNAl CoMPArIsoN
Alberta (current)
China United States
Canada European Union
British Columbia
Ontario Quebec
2020 targets 50 Mt below business as usual (from 2008 emissions projection)
carbon intensity 40-45% below 2005 levels
17% below 2005 levels
17% below 2005 levels
20% below 1990 levels
33% below 2007 levels
15% below 1990 levels
20% below 1990 levels
2030 target (2025 from the United states)
- emissions peak; carbon intensity 60-65% below 2005 levels
26-28% below 2005 levels
30% below 2005 levels
40% below 1990 levels
- 37% below 1990 levels (mid-term target)
-
2050 target 200 Mt below business as usual (from 2008 emissions projection)
- at least 80% below 2005 levels
- at least 80% below 1990 levels
80% below 2007 levels
80% below 1990 levels
-

18 Climate Leadership Discussion Document
CArboN PolICY APProACHes
Carbon policy approaches include incentive structures driven by pricing and mandating behaviours or outcomes, through performance standards. These approaches could be applied to the economy as a whole, as part of a suite of policies, or to specific sectors of the economy.
Carbon pricing is a catch-all term for policies that establish a price on greenhouse gas emissions. Economic research suggests that carbon pricing, when applied broadly to emissions across the economy, allows for the most cost-effective (lowest cost per tonne) emissions reductions.
A price on carbon provides a financial incentive for emitters to reduce their emissions. This can spur the adoption of technology, efficiency and conservation, and provides emitters with flexibility to reduce emissions in a way that best suits their individual processes, abilities and circumstances.
The following are approaches to carbon pricing that have been employed in various jurisdictions:
Carbon Tax System – A tax is levied based on a set price per tonne of emissions. This price can be applied to all emissions or to a portion of them. A carbon tax has the benefit of providing certainty in terms of cost. One tonne = a set price (e.g. $30/tonne). Companies, and consumers in many cases, have the choice to pay the tax or to avoid emissions. However, there is no certainty in the environmental outcome, as one could simply choose to pay the tax instead of reducing emissions. The price of a carbon tax can be adjusted over time to achieve desired environmental outcomes.
In British Columbia, combustion emissions face a price of $30 per tonne, for all emitters including consumers. Many European nations have long relied on carbon taxation as a means of both generating revenue and reducing emissions. For example, Sweden currently has a price of US$130 per tonne.
Cap and Trade System – Government sets a cap on total emissions and establishes allowances to emit up to the cap. Emitters are allowed to buy, sell or bank allowances to meet the emission cap. A cap and trade system has an environmental outcome that is certain (based on the cap). However, the cost of emitting depends on the demand for permits relative to the cap (or supply). Many cap and trade systems introduce price controls (i.e. price ceilings and/or floors) to provide more certainty of the economic impacts of the policy. However, this reduces emissions certainty.
The European Union has a long-standing cap and trade system. More recently, a linked cap and trade program was implemented by California and Quebec, with an escalating set price floor and ceiling in an effort to manage cost uncertainty. The auction price in May 2015 was US$12.39. In addition to covering large emitters, the cap and trade program in Quebec and California also impacts consumers, since fuel and natural gas distributors are required to purchase emissions permits for the eventual combustion emissions of the fuel they sell. Cap and trade programs also formed the centerpiece of legislation to combat acid rain in North America.
Performance standard approaches focus on establishing requirements related to technology or outcomes. Performance standards can be in the form of bans or restrictions on use of, or requirements to use, particular technologies or classes of product.
In Canada, federal government regulations mean that coal-fired power plants must, at the end of their lifespans, either be shut down or retrofitted to perform at an emissions intensity roughly equivalent to that of a natural gas-fired power plant. Other examples of performance standard approaches are vehicle emissions regulations; requirements for a minimum share of renewable electricity generation; bans or limits on products such as incandescent light bulbs, certain pesticides and ozone-depleting chlorofluorocarbons (CFCs); and building codes setting requirements for energy efficiency and insulation for buildings and houses.
Alberta’s Current System can be considered a hybrid of a carbon pricing system and a performance standard. The Specified Gas Emitters Regulation is a trading system based on emissions intensity reductions. It has elements similar to a tax and elements similar to cap and trade. The regulation requires facilities that emit 100,000 tonnes of CO2e or more per year to reduce their emissions intensity by 12% below a historical baseline. This reduction requirement will increase to 15% in 2016 and to 20% in 2017. Facilities that reduce emissions below their target are able to generate emissions performance credits, which are tradable or may be banked for future years. Facilities that are unable to meet their annual intensity target may comply by using performance credits, purchasing emissions offsets or by paying into a fund at a set price per tonne of carbon dioxide.
Carbon Offsets are a voluntary reduction in greenhouse gas emissions, which can then be purchased by another party to ‘offset’ their emissions levels.

19Climate Leadership Discussion Document
CONVERSATiON STARTERS1. What should Alberta’s emissions reduction goals be?
2. What tools should Alberta consider to reduce emissions?
a. How could those tools evolve over time?
b. Should the same tools be applied to the entire economy or differ by sector?
c. Should all emitters, producers and consumers be included?
d. How can Alberta minimize the impact of costs associated with emission reductions on low-income Albertans?
20 Climate Leadership Discussion Document
oIl AND GAs
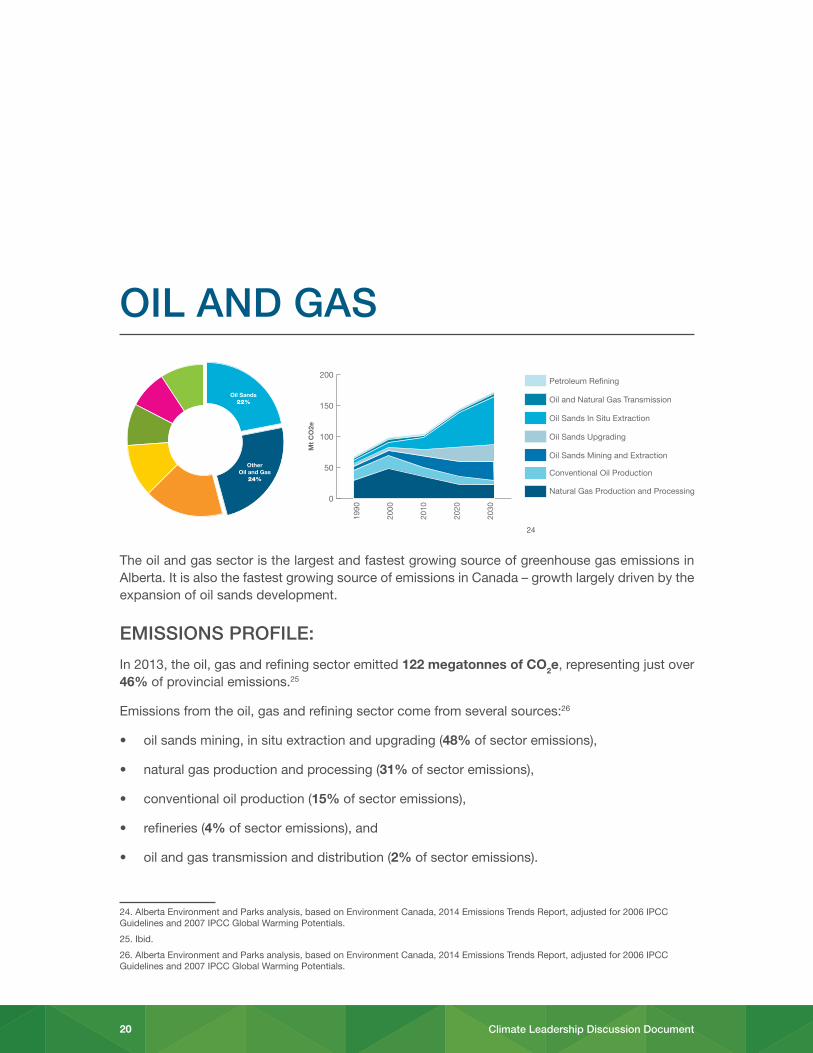
The oil and gas sector is the largest and fastest growing source of greenhouse gas emissions in Alberta. It is also the fastest growing source of emissions in Canada – growth largely driven by the expansion of oil sands development.
eMIssIoNs ProfIle:
In 2013, the oil, gas and refining sector emitted 122 megatonnes of CO2e, representing just over 46% of provincial emissions.25
Emissions from the oil, gas and refining sector come from several sources:26
• oil sands mining, in situ extraction and upgrading (48% of sector emissions),
• natural gas production and processing (31% of sector emissions),
• conventional oil production (15% of sector emissions),
• refineries (4% of sector emissions), and
• oil and gas transmission and distribution (2% of sector emissions).
Other Oil and Gas
24%
Oil Sands22%
ElectricityGeneration
17%
Transportation11%
Other Industrial Emitters, Manufacturing
& Construction9%
Buildings & Houses
8%
Agriculture, Forestry &
Waste9%
Oil Sands22%
Other Oil and Gas
24%
ElectricityGeneration
17%
Transportation11%
Buildings & Houses
8%
Agriculture, Forestry &
Waste9%
Other Industry, Manufacturing & Construction
9%
Other Oil and Gas
24%
0
10
20
30
40
50
60Industrial Natural Gas Fired Generation (Mt)*
Utility Natural Gas Fired Generation (Mt)
Coal Fired Generation (Mt)
0
5
10
15
20
25
30
35Other Transport
Passenger Transport
Freight Transport
0
5
10
15
20
25
30Commercial and Institutional Buildings
Residential Buildings
0
5
10
15
20
25
30
35Construction
Light Manufacturing
Metals, Cement, Lime and Gypsum
Chemicals and Fertilizers
Mining
0
5
10
15
20
25Forest Resources
Waste
Agriculture
0
50
100
150
200Petroleum Re�ning
Oil and Gas Transmission and Distribution
Oil Sands (Mining, In-situ & Upgrading)
Conventional Oil Production
Natural Gas Production and Processing
Oil and Gas
1990
2000
2010
2020
2030 0
50
100
150
200Petroleum Re�ning
Oil and Natural Gas Transmission
Oil Sands In Situ Extraction
Oil Sands Upgrading
Oil Sands Mining and Extraction
Conventional Oil Production
1990
2000
2010
2020
2030
1990
2000
2010
2020
2030
1990
2000
2010
2020
2030
1990
2000
2010
2020
2030
1990
2000
2010
2020
2030
1990
2000
2010
2020
2030
0
10
20
30
40
50
60Industrial Natural Gas Fired
Utility Natural Gas Fired Generation (Mt)
Coal Fired generation (Mt)
1990
2000
2010
2020
2030
Mt
CO
2eM
t C
O2e
Mt
CO
2eM
t C
O2e
Mt
CO
2eM
t C
O2e
0
5
10
15
20
25
30
35Other Transport
Passenger Transport
Freight Transport
Transportation
1990
2000
2010
2020
2030
Mt
CO
2e
0
5
10
15
20
25
30Commercial and Institutional
Residential
Buildings & Houses
1990
2000
2010
2020
2030
Mt
CO
2e
0
5
10
15
20
25
30
35Construction
Light Manufacturing
Metals, Cement, Lime and Gypsum
Chemicals & Fertilizers
Mining
Other Industry, Manufacturing and Construction
1990
2000
2010
2020
2030
Mt
CO
2e
0
5
10
15
20
25Forest Resources
Waste
Agriculture
Agriculture, Forestry and Waste
1990
2000
2010
2020
2030
Mt
CO
2e
0
50
100
150
200
250
300
350
Mt
CO
2e
1990
2000
2010
2020
2030
0
50
100
150
200
250
300
350
0
50
100
150
200
250
300
350
1990
2000
2010
2020
2030
0
50
100
150
200
250
300Agriculture, Forestry and Waste
Buildings and Houses
Other Industry, Manufacturing and Construction
Transportation
Electricity
Oil and Gas
0
50
100
150
200
250
300Agriculture, Forestry and Waste
Buildings and Houses
Other Industrial Emitters, Manufacturing and Construction
Transportation
Electricity
Oil and Gas
1990
1991
1992
1993
1994
1995
1996
1997
1998
1999
2000
2001
2002
2003
2004
2005
2006
2007
2008
2009
2010
2011
2012
2013
Em
issi
ons
(Mill
ion
tonn
es C
O2e
)
Natural Gas Production and Processing
24. Alberta Environment and Parks analysis, based on Environment Canada, 2014 Emissions Trends Report, adjusted for 2006 IPCC Guidelines and 2007 IPCC Global Warming Potentials.
25. Ibid.
26. Alberta Environment and Parks analysis, based on Environment Canada, 2014 Emissions Trends Report, adjusted for 2006 IPCC Guidelines and 2007 IPCC Global Warming Potentials.
24

21Climate Leadership Discussion Document
CUrreNt stAte:
Under the Specified Gas Emitters Regulation, emissions intensity reductions are required at facilities that emit 100,000 tonnes or more of carbon dioxide equivalent per year.
• In 2013, 100 facilities, across all sectors, were captured by the regulation, which represent approximately 45% of total provincial emissions. Of these, 56 were oil and gas facilities, capturing 54% of total oil and gas sector emissions.
• Facilities that emit more than 50,000 tonnes or CO2e per year must report their emissions annually as per the Specified Gas Reporting Regulation. In 2013, 147 facilities in Alberta were captured by this regulation, including 90 oil and gas facilities, accounting for 61% of oil and gas sector emissions.
QUICk fACts:
Oil sands development is the main driver of emissions growth in the province. Production from the ‘in-situ’ sub-sector is the fastest growing source of greenhouse gas emissions in Alberta and Canada.
Almost all emissions from the in situ oil sands sub-sector are associated with burning natural gas to produce steam for injection into the wells.

22 Climate Leadership Discussion Document
For oil sands mining operations, emissions are primarily from heating water for extraction, mine fleet vehicles, fugitive emissions from mine faces and tailings ponds. For upgraders, the majority of emissions are associated with fuel combustion for process heat and industrial process emissions.
Fugitives, venting and flaring make up 30% of total emissions in the oil and gas sector (from oil and gas production and processing).28 They represent a significant opportunity for reductions, as methane is a key component of these emissions and has high global warming impacts.
Emissions from the combustion of natural gas to produce heat or electricity represent more than 75% of emissions from the oil sands sector.29 Many existing facilities are exploring solvent co-injection, as well as optimized drilling and steaming techniques. These approaches have begun to show reductions in emissions intensity and water intensity as a result.30
Lifecycle Analysis – Wells-to-wheels accounting considers emissions that are created during the entire lifecycle of a fuel, from the wellhead where the oil is extracted to the vehicles or other end-uses where the fuel is consumed. Emissions occur throughout the lifecycle of a fuel - during production, processing and refining, transport to market and consumption (e.g. operating a vehicle). As demonstrated by the chart below, the vast majority of emissions from fuels come from vehicle use.
tYPICAl ProPortIoN of totAl CrUDe oIl fUel lIfeCYCle eMIssIoNs 31
Crude extraction
12%
transport and Delivery
3%
Crude refining 11%
Combustion from operating a vehicle
74%
28. Environment Canada, National Inventory Report 1990-2013.
29. Alberta Environment and Parks, data collected under the Specified Gas Reporting Regulation, 2013.
30. Ibid.
31. Adapted from Jacobs Consultancy – EU Pathway Study: Life Cycle Assessment of Crude Oils in a European Context, March 2012.

23Climate Leadership Discussion Document
sPotlIGHt oN INNoVAtIoN:
Alberta is part of the World Bank’s Global Gas Flaring Reduction Partnership, which shares Alberta’s best practices and regulatory approach on flaring management with the world. Under Alberta’s current system, more than 95% of solution gas, which is produced during oil production, is conserved.32 Saskatchewan and British Columbia have modelled their approach to solution gas conservation after Alberta’s approach.
In the conventional oil and gas industry, the majority of greenhouse gases are produced during combustion of fuel in natural gas engines or through venting, flaring and fugitive sources. Spartan Controls has taken action to reduce emissions from both sources by increasing fuel efficiency and capturing methane that would otherwise be vented emissions from engine packing, casing, etc., and using it as fuel. These technologies have resulted in 550,000 tonnes of greenhouse gases emissions being eliminated from the atmosphere as of 2014.
In 2011, the Shell Scotford Refinery started sending off-gasses to the nearby Aux Sable plant for processing. As a result, valuable products such as hydrogen and ethane are recovered. This new process resulted in a reduction of about 125,000 tonnes of CO2e annually.
32. Alberta Energy Regulator, ST60B-2014 Upstream Petroleum Industry Flaring and Venting Report, 2014.
24 Climate Leadership Discussion Document
GlossArY
Venting is the direct release of natural gas, which is predominately methane, into the atmosphere without burning. Methane is over 20 times more potent in global warming potential, over a 100-year period, than carbon dioxide. Venting largely occurs during crude oil production but it also occurs throughout the entire oil and gas industry.
Flaring is the controlled burning of gases in the course of oil and natural gas production, in maintenance or in emergency circumstances requiring a release of pressure by removing the gas. Flaring converts methane emissions contained in the gas largely into carbon dioxide. Flaring and venting most often occur where there is a lack of facilities to otherwise capture the natural gas.
Fugitive emissions are unintentional leaks of greenhouse gases from equipment or pipelines.
Natural gas is a mixture of hydrocarbons. While mainly methane, other hydrocarbons include ethane, propane and butane. Water, oil, sulphur, carbon dioxide, nitrogen and other impurities may be contained in the gas when it is produced.
Crude oil is a naturally occurring mixture of hundreds of different hydrocarbon compounds. Crude oils are generally differentiated by the size of the hydrogen-rich hydrocarbon molecules they contain.
Conventional crude oil usually refers to light, medium and heavy hydrocarbons like those produced from the Western Canadian Sedimentary Basin, an area that includes Alberta.
Unconventional oil and gas are essentially the same as conventional oil and gas, but the difference is the types of source rock that they are found in and the methods used to develop them. Unconventional resources do not flow naturally through rock formations and require special production methods or technologies to ‘crack’ or ‘fracture’ the rock to allow oil and gas to flow through to a well.
Oil sands or bituminous sands are a naturally occurring mixture of sand, clay or other minerals, water and bitumen. Bitumen is a heavy and extremely viscous oil that is too thick to flow in its natural state and requires special methods to bring it to the surface.
in situ production is used for bitumen deposits buried too deep for surface mining. Steam, solvents or thermal energy is injected through a well into the bitumen deposit to make the bitumen flow to the point it can be pumped to the surface.
Upgrading is the process of converting heavy oil or bitumen into synthetic crude oil so it can be handled by conventional light oil refineries. Upgrading often includes reducing viscosity so that it can be pumped through pipelines, separating out the heaviest hydrocarbons and reducing sulfur, nitrogen and metals.
Refining is the process of converting conventional and synthetic crude oil into oil-based products and petrochemical feedstock. Refining also provides a bridge to other energy processing opportunities, like off-gas production, that enables Alberta to diversify its resource-based economy.

25Climate Leadership Discussion Document
oIl AND GAs PolICY APProACHes
Various approaches have been used in Alberta and elsewhere to reduce greenhouse gas emissions associated with oil and gas production, processing and transmission.
Pricing Approach Examples
Carbon Pricing: A price on carbon provides a financial incentive for emitters to reduce their emissions. This can spur the adoption of technology, efficiency and conservation, and provides emitters with flexibility to reduce emissions in a way that best suits their individual processes, abilities and circumstances.
Technology incentives and Subsidies: Government can support research, development and demonstration of technologies that reduce greenhouse gas emissions. In Alberta, regulated emitters are allowed to pay into a dedicated fund, which has been invested to advance green technology and innovation. Once the technology is proven, jurisdictions can opt to require it to be applied (technology standards). In Alberta, regulated oil sands and gas processing facilities that incorporate cogeneration of electricity and heat receive a credit towards achieving their reduction requirement as recognition of the efficiency.
Performance Standards Approach Examples
Product and Sector Emission Performance Standards: Performance standards mandate specific outcomes or equipment and can be applied at the equipment, facility, product or sector level. Performance standards can improve emissions intensity, by increasing costs at the worst performing facilities while rewarding the best performing facilities. Performance standards can also result in the phase-out of certain products, practices or facilities, such as Alberta’s requirements to conserve solution gas where economic, eliminating the need for venting and flaring. Flexibility in meeting the standard can help manage the potential impacts on competitiveness and allow for more cost effective emission reduction solutions overall. For example, British Columbia’s regulation for liquefied natural gas establishes an emissions performance standard for any new facility, and allows compliance flexibility including the use of offsets and payment into a fund.
Technology Standards: Several environmental regulations and requirements are founded in technology standards such as ensuring maximum achievable control technology or best available technology economically achievable. Technology requirements can also be applied as requiring or banning given applications. For example, the United States limits the gas bleed rate of pneumatic controllers, thus requiring low-bleed pneumatic controllers at new oil and gas well sites.
Fuel Standards: These include restrictions on burning certain types of fuel sources for steam and electricity production within the oil and gas sector, or increased renewable fuel content requirements for fuels used in boilers and vehicles. Canada’s renewable fuels standard covers large mining vehicles and requires biofuels to be used to help reduce fossil fuel use and emissions.
Sector Limits: A limit or cap on absolute emissions allowable from a sector or sub-sector in a given year can be established. An example of such an approach is Alberta’s provincial limit for solution gas flaring based on natural gas volume, which translates into an emissions limit on a specific activity within the oil and gas sector.
26 Climate Leadership Discussion Document
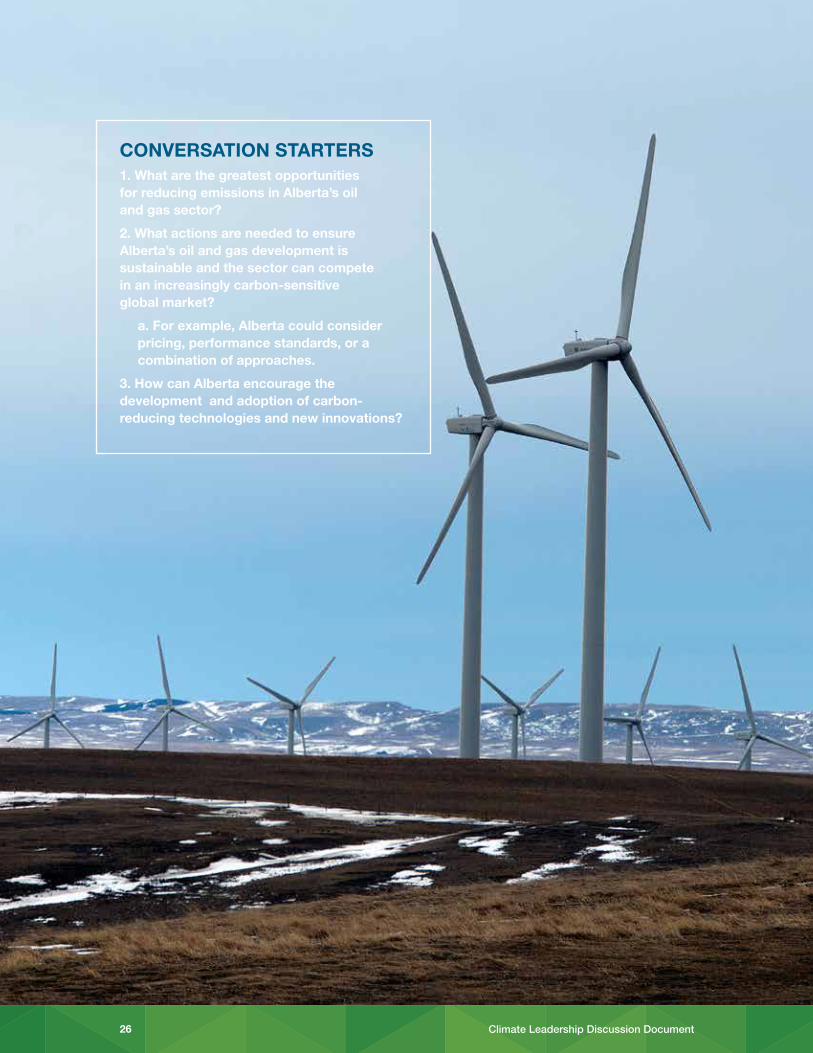
CONVERSATiON STARTERS1. What are the greatest opportunities for reducing emissions in Alberta’s oil and gas sector?
2. What actions are needed to ensure Alberta’s oil and gas development is sustainable and the sector can compete in an increasingly carbon-sensitive global market?
a. For example, Alberta could consider pricing, performance standards, or a combination of approaches.
3. How can Alberta encourage the development and adoption of carbon-reducing technologies and new innovations?

27Climate Leadership Discussion Document
eleCtrICItY
Electricity is an important part of the day-to-day lives of Albertans – whether it is turning on a light or powering the province’s schools, hospitals and industry. Coal has been Alberta’s traditional low-cost and reliable source of electricity. However, coal-fired electricity has a significant environmental impact, including greenhouse gas emissions, as well as other pollutants that reduce air quality and impact human health.
eMIssIoNs ProfIle:
Electricity generation is the second largest source of emissions in Alberta, responsible for 17%, or 45 megatonnes of the province’s greenhouse gas emissions in 2013.34 Coal-fired generation represents 85% of total emissions from the electricity sector.35 Alberta currently produces the most coal-fired electricity in Canada. In 2013, Alberta accounted for approximately 65% of all coal power production in the country.36 Coal
55%Natural Gas
(co-gen)31%
Natural Gas (other)4%
Hydro2%
Wind4%
Biomass & Biogas 3%Other<1%
Other Oil and Gas
24%
Oil Sands22%
ElectricityGeneration
17%
Transportation11%
Other Industrial Emitters, Manufacturing
& Construction9%
Buildings & Houses
8%
Agriculture, Forestry &
Waste9%
Oil Sands22%
Other Oil and Gas
24%
ElectricityGeneration
17%
Transportation11%
Buildings & Houses
8%
Agriculture, Forestry &
Waste9%
Other Industry, Manufacturing & Construction
9%
Other Oil and Gas
24%
0
10
20
30
40
50
60Industrial Natural Gas Fired Generation (Mt)*
Utility Natural Gas Fired Generation (Mt)
Coal Fired Generation (Mt)
0
5
10
15
20
25
30
35Other Transport
Passenger Transport
Freight Transport
0
5
10
15
20
25
30Commercial and Institutional Buildings
Residential Buildings
0
5
10
15
20
25
30
35Construction
Light Manufacturing
Metals, Cement, Lime and Gypsum
Chemicals and Fertilizers
Mining
0
5
10
15
20
25Forest Resources
Waste
Agriculture
0
50
100
150
200Petroleum Re�ning
Oil and Gas Transmission and Distribution
Oil Sands (Mining, In-situ & Upgrading)
Conventional Oil Production
Natural Gas Production and Processing
Oil and Gas
1990
2000
2010
2020
2030 0
50
100
150
200Petroleum Re�ning
Oil and Natural Gas Transmission
Oil Sands In Situ Extraction
Oil Sands Upgrading
Oil Sands Mining and Extraction
Conventional Oil Production
1990
2000
2010
2020
2030
1990
2000
2010
2020
2030
1990
2000
2010
2020
2030
1990
2000
2010
2020
2030
1990
2000
2010
2020
2030
1990
2000
2010
2020
2030
0
10
20
30
40
50
60Industrial Natural Gas Fired
Utility Natural Gas Fired Generation (Mt)
Coal Fired generation (Mt)
1990
2000
2010
2020
2030
Mt
CO
2eM
t C
O2e
Mt
CO
2eM
t C
O2e
Mt
CO
2eM
t C
O2e
0
5
10
15
20
25
30
35Other Transport
Passenger Transport
Freight Transport
Transportation
1990
2000
2010
2020
2030
Mt
CO
2e
0
5
10
15
20
25
30Commercial and Institutional
Residential
Buildings & Houses
1990
2000
2010
2020
2030
Mt
CO
2e
0
5
10
15
20
25
30
35Construction
Light Manufacturing
Metals, Cement, Lime and Gypsum
Chemicals & Fertilizers
Mining
Other Industry, Manufacturing and Construction
1990
2000
2010
2020
2030
Mt
CO
2e
0
5
10
15
20
25Forest Resources
Waste
Agriculture
Agriculture, Forestry and Waste
1990
2000
2010
2020
2030
Mt
CO
2e
0
50
100
150
200
250
300
350
Mt
CO
2e
1990
2000
2010
2020
2030
0
50
100
150
200
250
300
350
0
50
100
150
200
250
300
350
1990
2000
2010
2020
2030
0
50
100
150
200
250
300Agriculture, Forestry and Waste
Buildings and Houses
Other Industry, Manufacturing and Construction
Transportation
Electricity
Oil and Gas
0
50
100
150
200
250
300Agriculture, Forestry and Waste
Buildings and Houses
Other Industrial Emitters, Manufacturing and Construction
Transportation
Electricity
Oil and Gas
1990
1991
1992
1993
1994
1995
1996
1997
1998
1999
2000
2001
2002
2003
2004
2005
2006
2007
2008
2009
2010
2011
2012
2013
Em
issi
ons
(Mill
ion
tonn
es C
O2e
)
Natural Gas Production and Processing
33. Alberta Environment and Parks analysis, based on Environment Canada, 2014 Emissions Trends Report, adjusted for 2006 IPCC Guidelines and 2007 IPCC Global Warming Potentials.
34. Estimate based on coal emissions from Specified Gas Emitters Regulation and Specified Gas Reporting Regulation reporting, estimates for natural gas generation, and total provincial emissions from Environment Canada,1990-2013 National Inventory Report.
35. Estimate based on Specified Gas Reporting Regulation and Specified Gas Emitters Regulation reporting.
36. National Inventory Report and the Alberta Utilities Commission.
33
Actual Electricity Generated by Type (2014)

28 Climate Leadership Discussion Document
Air Quality and Public Health
Public health is an important benefit of reducing coal-fired electricity emissions.
Alberta’s Electricity Emissions Management Framework requires that all coal units meet more stringent emission standards at the plant end-of-design-life, either physically or through flexibility mechanisms. improved air pollutant standards are expected to have a co-benefit of greenhouse gas reductions.
Multiple agencies and groups have completed assessments about the impacts of air quality on public health.
“The combustion of coal pollutes the air, causing illness and death in more people than any other method of energy generation.” John Howard, MD, Chair of Canadian Association of Physicians for the Environment, 2013, A Costly Diagnosis: Subsidizing Coal Power with Albertans’ Health (Asthma Society of Canada, Canadian Association of Physicians for the Environment, The Lung Association of Alberta & NWT, Pembina institute).
in 2000, the Ontario Medical Association reported that poor air quality costs the Ontario economy approximately $1 billion per year in lost worker productivity and health care services. These costs informed the Government of Ontario in their phase out of coal-fired electricity generation by demonstrating the cost-benefits to the health care system and citizens.
The Canadian Medical Association did the last assessment of air quality impacts for Alberta in 2008. This report predicted that the cost of poor air quality was approximately $549 million per year.

29Climate Leadership Discussion Document
CUrreNt stAte:
Alberta has a deregulated, energy-only wholesale electricity market. This means that electricity production is undertaken by private companies who are not guaranteed a rate of return on their capital investments as they would be in a regulated system. They sell power at market prices determined by supply and demand. This differentiates Alberta from some other jurisdictions, where government, or its agencies, drive the majority of electricity generation development and play a direct role in price-setting. As a result, the costs involved in building large scale clean generating facilities may be a barrier to investors in this sector.
Key policies currently in place in Alberta’s electricity sector:
• The Specified Gas Emitters Regulation applies to large emitters in the electricity sector. Large facilities are required to reduce their emissions in accordance with the regulation. The regulation captures all 8 coal-fired power generation facilities in Alberta. It also captures 16 gas-fired power generation facilities, including cogeneration facilities that service Alberta’s electricity grid, which represents 82% of emissions from these gas-fired power generation facilities.
• For coal-fired electricity generation, federal regulations require generators to reduce their emissions to ‘clean as gas’ (420 kilograms of CO2e per megawatt hour) or retire when they reach roughly 45 to 50 years of operation. This end-of-life performance standard will apply to approximately 60% of Alberta’s coal-fired capacity by 2030.
• Alberta’s Electricity Emissions Management Framework manages air quality pollutants (nitrogen oxides, sulphur dioxide, particulate matter and mercury). By 2020, half of all coal-fired units in Alberta will reach the end-of-design life, where the framework requires them to improve their air emission technology and equipment or shut down. The control technology requires modern equipment standards and is comparable to that required in other jurisdictions in Canada. The framework will also likely yield co-benefits of greenhouse gas reductions.
• The Micro-generation Regulation enables Albertans to generate their own alternative or renewable electricity (e.g., solar installations) by simplifying the process to connect to the electricity grid. As of July 2015, Alberta has nearly 1,300 micro-generation sites, with a combined capacity of over 9 megawatts.
Using Electricity Efficiently
for more information on ways to be more efficient with electricity, go to page 41 to learn more about energy efficiency and conservation.

30 Climate Leadership Discussion Document
QUICk fACts:
Alberta is unique within Canada because of its continued heavy reliance on coal. There are growing concerns about the effects of coal-fired generation on climate change, air quality and human health.
Renewables – The economics of renewable energy are constantly improving. It is estimated that all-in project costs will come down by an average of 32% for wind and 48% for solar by 2040. Some analysts expect that, globally, wind will be the least-cost option for new power generation by 2026, and utility-scale solar is likely to take that mantle by 2030.37
While there are many environmental, economic and social benefits to increased renewable energy generation, this transition also comes with challenges.
Limiting cost impacts to electricity consumers and taxpayers, and ensuring system reliability, are a few of the major considerations Alberta must keep in mind when discussing options for reducing our reliance on coal-fired generation and increasing renewable power generation.
Although Alberta has some of the best solar potential in Canada, there are no commercial-scale solar projects currently in operation. At the end of 2014, Alberta had 5 MW of solar generation capacity representing less than 0.1% of total installed capacity in Alberta. By comparison, Ontario had 1,543 MW of installed solar capacity representing 4% of the province’s total installed capacity. Ontario has made use of financial incentives to drive solar generation.38
37. Bloomberg New Energy Finance (BNEF) New Energy Outlook 2015. Long term projections of the global energy sector. Global Overview, June 2015.
38. Alberta Statistics: AESO Micro-generation Summary Statistics prepared for Alberta Energy Ontario Statistics: Ontario Energy Report Q4, 2014. Statistics include grid-connected and IESO contracted solar. Distributed Generation totals include wind and solar only.
Renewable Potential
• over one-third of Alberta’s land base has wind energy sources suitable for wind energy production.
• Alberta has some of the best solar resources in Canada.
• Alberta has undeveloped hydroelectric capacity at more than 20 sites across the province.
• Alberta has biomass potential in the agriculture, forestry and municipal sectors.
• Alberta has potential for production of electricity from deep underground geothermal resources.

31Climate Leadership Discussion Document
Action on Electricity Emissions
Ontario
from 2003 to 2014, ontario phased out all of its coal-fired electricity, replacing this electricity generation with nuclear, natural gas, biomass, hydro, wind, and solar. they implemented a feed-in-tariff policy in 2009, which subsidizes prices for renewable electricity produced and feeds into the electricity grid.
California
In 2002, California implemented a renewable Portfolio standard with the goal of having 33% renewable energy capacity by 2020. the program has reduced emissions and water use, and has created jobs in the renewable energy sector.
39. Alberta Utilities Commission Annual Electricity Data, http://www.auc.ab.ca/market-oversight/Annual-Electricity-Data-Collection/Pages/default.aspx].
Alberta’s installed wind energy capacity ranks third in Canada, with a capacity of 1,459 MW. Between 2010 and 2014, Alberta’s wind production has more than doubled.39
Some renewable energy sources, like wind and solar, are intermittent, meaning they don’t provide a steady or continuous supply of electricity – sometimes the wind doesn’t blow and the sun doesn’t shine. To maintain reliability, these generation sources need to be backed up by generation from sources that are available at all times, like hydro-electricity, geothermal, biomass and natural gas.
As of the end of 2014, renewable energy sources accounted for 18% of Alberta’s installed electric generation capacity (where installed generation capacity is the maximum amount of electricity that can be generated by each fuel source). However, due to its intermittent nature, renewable energy only accounted for about 9% of total electricity generated in 2014.
Geothermal energy draws upon the natural heat stored in the Earth to produce electricity. Although Alberta does not generate geothermal electricity, it has the potential to do so. Geothermal generation can occur any time throughout the day, producing electricity when it is needed.
32 Climate Leadership Discussion Document
sPotlIGHt oN INNoVAtIoN:
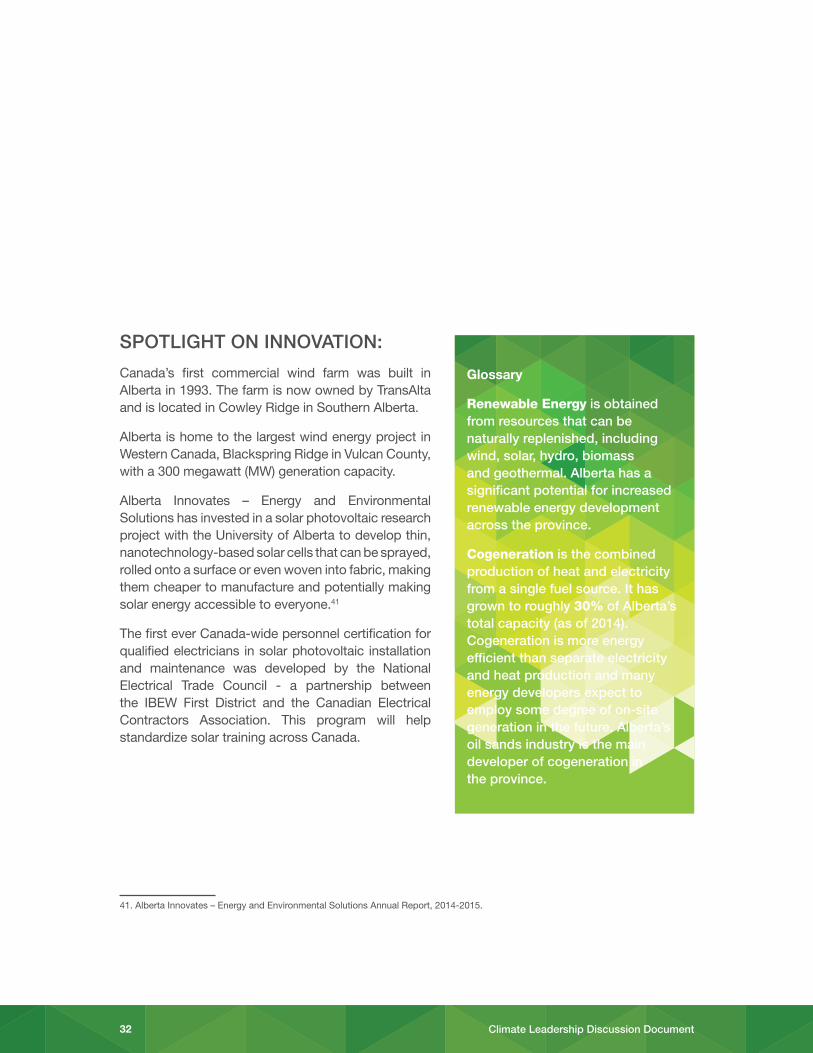
Canada’s first commercial wind farm was built in Alberta in 1993. The farm is now owned by TransAlta and is located in Cowley Ridge in Southern Alberta.
Alberta is home to the largest wind energy project in Western Canada, Blackspring Ridge in Vulcan County, with a 300 megawatt (MW) generation capacity.
Alberta Innovates – Energy and Environmental Solutions has invested in a solar photovoltaic research project with the University of Alberta to develop thin, nanotechnology-based solar cells that can be sprayed, rolled onto a surface or even woven into fabric, making them cheaper to manufacture and potentially making solar energy accessible to everyone.41
The first ever Canada-wide personnel certification for qualified electricians in solar photovoltaic installation and maintenance was developed by the National Electrical Trade Council - a partnership between the IBEW First District and the Canadian Electrical Contractors Association. This program will help standardize solar training across Canada.
Glossary
Renewable Energy is obtained from resources that can be naturally replenished, including wind, solar, hydro, biomass and geothermal. Alberta has a significant potential for increased renewable energy development across the province.
Cogeneration is the combined production of heat and electricity from a single fuel source. It has grown to roughly 30% of Alberta’s total capacity (as of 2014). Cogeneration is more energy efficient than separate electricity and heat production and many energy developers expect to employ some degree of on-site generation in the future. Alberta’s oil sands industry is the main developer of cogeneration in the province.
41. Alberta Innovates – Energy and Environmental Solutions Annual Report, 2014-2015.

33Climate Leadership Discussion Document
eleCtrICItY PolICY APProACHes
Many approaches have been used in Alberta and elsewhere to reduce greenhouse gas emissions associated with electricity production.
Pricing Approach Examples
Feed-in Tariff (FiT): A feed-in tariff sets a long-term (e.g. 20 years) contracted price based on the cost of producing renewable energy, plus a reasonable rate of return. Best practices see FIT prices regularly reviewed for new projects as technology costs decline. FITs can be applied to large-scale wind and solar farms or to smaller sources like roof-top solar installations.
Green Power Call: Some jurisdictions have used a method similar to an auction, where prospective renewable energy providers compete to fill a demand for renewable energy.
Tax Credits or Subsidies: Rather than fixing a sale price for renewable electricity, these policies may reward producers via tax credits or direct payments toward capital costs or for generation over and above market prices. Tax subsidies can also come in the form of accelerated capital cost depreciation rather than credits tied to generation.
Carbon Offsets: Alberta, like some other jurisdictions, allows renewable energy projects to be credited for the implied reduction in greenhouse gas emissions that their generation provides.
Renewable Energy Certificates (REC): Renewable energy facilities generate RECs when they produce electricity. RECs are sold on a voluntary market where buyers get to claim the environmental benefits associated with the RECs they purchase. Some jurisdictions allow utilities to use RECs to comply with greenhouse gas emissions reductions targets.
Government-backed Loan Guarantees and Power Purchase Agreements (PPAs): One barrier to renewable deployment is the ability for proponents to attract investment. Government could provide greater certainty for investors by directly purchasing renewable power at a set rate through PPAs or by providing loan guarantees.
Performance Standards Approach Examples
Renewable Portfolio Standard (RPS): An RPS is a regulation that can apply to electricity suppliers or retailers that requires a minimum amount, or share, of renewable energy by a specified date. RPS mechanisms can vary depending on which renewables qualify, but typically include wind, solar, biomass, geothermal energy and run-of-river hydro.
Emissions performance standards: Canada’s regulations to mitigate greenhouse gas emissions from coal-fired generation units require generators to reduce their emissions to ‘clean as gas’ or 420 kilograms of CO2e per megawatt hour when they reach their end of life, or shut down. Alberta’s air quality Electricity Emissions Management Framework also sets specific standards for nitrogen oxides, sulphur dioxide, particulate matter and mercury at the end of design life.

34 Climate Leadership Discussion Document
CONVERSATiON STARTERS1. Should government encourage more renewables in Alberta’s electricity system?
a. How aggressively should Alberta move towards a more renewable electricity mix?
b. How quickly?
2. What is the right mix of sources to generate electricity for Alberta?
a. How much electricity should Alberta generate through coal, natural gas, renewables, etc?
b. How should Alberta weigh factors such as reliability, price, pollution and sustainability in that mix?
c. What policy approaches should Alberta consider achieve this mix? Pricing, performance, or a combination of approaches?
3. is some level of price increase acceptable in order achieve Alberta’s emission reduction and public health goals?
a. How much?

35Climate Leadership Discussion Document
trANsPortAtIoN
Everyone knows that cars and trucks produce emissions – tailpipes are a visible reminder of transportation’s contributions to greenhouse gas emissions. In the life cycle of a barrel of oil, nearly 80% of emissions occur when cars and trucks use the oil.
eMIssIoNs ProfIle:
Transportation was responsible for 11%, or 30 megatonnes of Alberta’s greenhouse gas emissions in 2013.43 Emissions from the transportation sector have steadily increased since 1990 - the result of significant growth in the number of vehicles on Alberta’s roads.44
Off road vehicles used in industrial application, such as mining trucks, are captured in their host sector (for mining trucks, oil and gas).
42. Alberta Environment and Parks analysis, based on Environment Canada, 2014 Emissions Trends Report, adjusted for 2006 IPCC Guidelines and 2007 IPCC Global Warming Potentials.
43. Alberta Environment and Parks analysis, based on Environment Canada, 2014 Emissions Trends Report, adjusted for 2006 IPCC Guidelines and 2007 IPCC Global Warming Potentials.
44. Ibid.
Other Oil and Gas
24%
Oil Sands22%
ElectricityGeneration
17%
Transportation11%
Other Industrial Emitters, Manufacturing
& Construction9%
Buildings & Houses
8%
Agriculture, Forestry &
Waste9%
Oil Sands22%
Other Oil and Gas
24%
ElectricityGeneration
17%
Transportation11%
Buildings & Houses
8%
Agriculture, Forestry &
Waste9%
Other Industry, Manufacturing & Construction
9%
Other Oil and Gas
24%
0
10
20
30
40
50
60Industrial Natural Gas Fired Generation (Mt)*
Utility Natural Gas Fired Generation (Mt)
Coal Fired Generation (Mt)
0
5
10
15
20
25
30
35Other Transport
Passenger Transport
Freight Transport
0
5
10
15
20
25
30Commercial and Institutional Buildings
Residential Buildings
0
5
10
15
20
25
30
35Construction
Light Manufacturing
Metals, Cement, Lime and Gypsum
Chemicals and Fertilizers
Mining
0
5
10
15
20
25Forest Resources
Waste
Agriculture
0
50
100
150
200Petroleum Re�ning
Oil and Gas Transmission and Distribution
Oil Sands (Mining, In-situ & Upgrading)
Conventional Oil Production
Natural Gas Production and Processing
Oil and Gas
1990
2000
2010
2020
2030 0
50
100
150
200Petroleum Re�ning
Oil and Natural Gas Transmission
Oil Sands In Situ Extraction
Oil Sands Upgrading
Oil Sands Mining and Extraction
Conventional Oil Production
1990
2000
2010
2020
2030
1990
2000
2010
2020
2030
1990
2000
2010
2020
2030
1990
2000
2010
2020
2030
1990
2000
2010
2020
2030
1990
2000
2010
2020
2030
0
10
20
30
40
50
60Industrial Natural Gas Fired
Utility Natural Gas Fired Generation (Mt)
Coal Fired generation (Mt)
1990
2000
2010
2020
2030
Mt
CO
2eM
t C
O2e
Mt
CO
2eM
t C
O2e
Mt
CO
2eM
t C
O2e
0
5
10
15
20
25
30
35Other Transport
Passenger Transport
Freight Transport
Transportation
1990
2000
2010
2020
2030
Mt
CO
2e
0
5
10
15
20
25
30Commercial and Institutional
Residential
Buildings & Houses
1990
2000
2010
2020
2030
Mt
CO
2e
0
5
10
15
20
25
30
35Construction
Light Manufacturing
Metals, Cement, Lime and Gypsum
Chemicals & Fertilizers
Mining
Other Industry, Manufacturing and Construction
1990
2000
2010
2020
2030
Mt
CO
2e
0
5
10
15
20
25Forest Resources
Waste
Agriculture
Agriculture, Forestry and Waste
1990
2000
2010
2020
2030
Mt
CO
2e
0
50
100
150
200
250
300
350
Mt
CO
2e
1990
2000
2010
2020
2030
0
50
100
150
200
250
300
350
0
50
100
150
200
250
300
350
1990
2000
2010
2020
2030
0
50
100
150
200
250
300Agriculture, Forestry and Waste
Buildings and Houses
Other Industry, Manufacturing and Construction
Transportation
Electricity
Oil and Gas
0
50
100
150
200
250
300Agriculture, Forestry and Waste
Buildings and Houses
Other Industrial Emitters, Manufacturing and Construction
Transportation
Electricity
Oil and Gas
1990
1991
1992
1993
1994
1995
1996
1997
1998
1999
2000
2001
2002
2003
2004
2005
2006
2007
2008
2009
2010
2011
2012
2013
Em
issi
ons
(Mill
ion
tonn
es C
O2e
)
Natural Gas Production and Processing
42

36 Climate Leadership Discussion Document
CUrreNt stAte:
Alberta’s transportation sector includes passenger vehicles, public transit, freight trucks and rail.
Key policies currently in place in the transportation sector:
• Alberta’s Renewable Fuels Standard requires commercial fuel producers to blend renewable products into their fuels sold in Alberta - an average of 5% renewable alcohol in gasoline and 2% renewable diesel in diesel fuel. All renewable fuels must emit at least 25% fewer greenhouse gas emissions than the fossil fuel they are replacing.
• Canada’s On-Road Vehicle and Engine Emission Regulations introduced more stringent national emission standards for on-road vehicles and engines and a new regulatory framework under the Canadian Environmental Protection Act, 1999 (CEPA 1999).45 The regulations align Canadian emission standards with those of the U.S. Environmental Protection Agency for light-duty passenger vehicles, light-duty trucks (such as vans, pickup trucks and sport utility vehicles), heavy-duty vehicles (such as heavy trucks and buses) and motorcycles.46
• The Alberta Fuel Tax Act is a direct tax on consumers for the purchase of all unmarked fuel in Alberta. This includes gasoline, diesel and propane, except where the fuel is delivered and consumed outside Alberta. The current tax is $0.13/litre for all grades of gasoline.
Renewable Fuel Standards across Canada
Ontario• 5% ethanol (as of jan 2007)• 2% biodiesel (as of April 2014)• the regulation provides additional
recognition for every litre of cellulosic ethanol that is sold in ontario (i.e., 1 litre of cellulosic ethanol is equivalent to 2.5 litres of ethanol produced from other feedstocks for compliance purposes).
British Columbia • 5% renewable gasoline (as of jan 2012)• 4% renewable diesel (originally 3%)• Additional requirement: 10% reduction
in carbon intensity by 2020
Saskatchewan • 7.5% ethanol (as of Nov 2005)• 2% renewable diesel (as of july 2012)• the Government of saskatchewan was
the first jurisdiction in Canada to pass a law requiring ethanol in its gasoline.
Manitoba• 8.5% ethanol (as of jan 2008)• 2% biodiesel (as of Nov 2009)
Federal Canadian government • 5% renewable gasoline (Dec 2010)• 2% renewable diesel (july 2011)
45. http://www.ec.gc.ca/lcpe-cepa/default.asp?lang=En&n=DA55B8B1-1&wsdoc=906E23B8-D41E-91F9-E2E8-B209DDCC1524
46. http://www.ec.gc.ca/lcpe-cepa/default.asp?lang=En&n=DA55B8B1-1&wsdoc=906E23B8-D41E-91F9-E2E8-B209DDCC1524

37Climate Leadership Discussion Document
QUICk fACts:
In Alberta, there were 1.16 vehicles per licenced driver in 2013.
While much of the transportation sector has become more fuel-efficient over time, the growing number of vehicles in the province has offset many of the efficiency gains. Between 2004 and 2015, the total number of vehicles in Alberta (registered in all classes) has risen by 50%.47
Increasing use of public transit, encouraging car-pooling, fuel taxes, clean vehicle technology and transportation design techniques that minimize vehicle use and promote active transportation can all be employed to reduce transportation emissions.
47. http://www.transportation.alberta.ca/3119.htm
48. Statistics Canada, CANSIM (database), Table 405-0004 - “Road motor vehicles, registrations”, accessed: 2015-08-12.
49. https://en.wikipedia.org/wiki/Motor_fuel_taxes_in_Canada
2015 Gasoline tax (cents/l)
BC AB SK MB ON QC NB NS PEI NL NV NWT YK
Provincial Gasoline tax
14.5 13 15 14 14.7 19.2 13.6 15.5 13.1 16.5 10.7 10.7 6.2
Carbon tax 6.67 - - - - - - - - - - - -
NflD 651,010
PeI 106,649
Ns 752,524
Nb 724,432
QC 8,179,374
oN 11,438,574
Mb 1,093,696
sk 1,124,929
Ab 4,952,037
bC 3,448,480
GAsolINe tAx rAtes (cents per litre)49
totAl VeHICles reGIstereD ACross CANADA:
48

38 Climate Leadership Discussion Document
sPotlIGHt oN INNoVAtIoN:
In October 2014, Ferus Natural Gas Fuels opened the first commercial liquefied natural gas fueling station in Canada. Natural gas is a lower-emissions alternative fuel to diesel and gasoline. Located in Elmworth, Alberta, 65 km north of Grande Prairie, it serves oil and gas activities in the region. Currently, the facility can produce up to 50,000 gallons per day of LNG and has capacity to expand up to 250,000 gallons per day.50
Glossary
Active transportation includes any form of human-powered transportation – walking, cycling, in-line skating or skateboarding. Active transportation could mean walking to a store or to the bus stop, or riding a bike to school or work.
Clean Vehicle Technology includes hybrid, electric, natural gas, and hydrogen fuel cell vehicles.
Air quality and Public Health
Vehicles release air pollutants such as particulate matter, oxides of nitrogen and volatile organic compounds and contribute to smog and general air pollution.
Air pollution from vehicle emissions has been clearly linked to poor health in numerous Canadian and international studies. recent research on the negative health effects of living near major roadways has found that exposure to traffic-related air pollution is associated with a number of health issues, such as asthma in children and other respiratory diseases, heart disease, cancer and increased rates of premature death in adults.
Health researchers are especially concerned about ultrafine particles, which are able to penetrate deep within the lungs.
(http://www.hc-sc.gc.ca/ewh-semt/air/out-ext/sources/transport-eng.php )
50. http://www.ferus.com/ferus-natural-gas-fuels-makes-canadian-energy-history-by-commissioning-the-first-merchant-lng-facility-in-canada/

39Climate Leadership Discussion Document
trANsPortAtIoN PolICY APProACHes
Various approaches have been used in Alberta and elsewhere to reduce greenhouse gas emissions associated with transportation.
Pricing Approach Examples
Carbon Taxes: Several jurisdictions have applied a carbon tax on aspects of the transport system to improve consumer awareness and reduce emissions. Carbon taxes can be applied on transport fuels, where the tax reflects the carbon content of the fuel type. Carbon taxes can also be applied through vehicle registration, where differentiation can occur based on vehicle size, fuel efficiency or mileage.
infrastructure investment: Various policy approaches exist to invest in the infrastructure and systems required for green transport, including public transit, alternate vehicles, alternate fuel generation and infrastructure. These can include direct investment or subsidies from governments to initiate the transformation. Alberta has previously offered incentives to commercial vehicles for aerodynamic aids and auxiliary power units as well as the purchase of hybrid taxis.
Performance Standards Approach Examples
Renewable Fuel Standard: A renewable fuel standard requires fuel suppliers to blend renewable fuels into gasoline and diesel sold to consumers. Several jurisdictions, including Alberta, have such regulations in place.
Low Carbon Fuel Standard: Similar to a renewable fuel standard, low carbon fuels standards are broader policies that promote all low carbon fuels (such as natural gas) instead of only biologically-based fuels. California and British Columbia employ this type of standard, which requires refiners to progressively reduce the carbon content of their fuels over time.
Technology Standards: Emission standards for cars and trucks are set federally, however some jurisdictions have mandated standards over and above the national levels. Other standards that exist include requiring commercial vehicles to maintain original equipment manufacturer standards for emission controls; requiring speed limiters on commercial vehicles; and banning older, less efficient vehicles.
Green Procurement Requirements: Governments can set purchasing requirements to support conversion of fleets to alternative and renewable energy sources. These fleets can be directly owned and operated by the government or areas of government investment (e.g. public transit).
Education and Outreach approaches are also commonly applied in the transportation sector as these tools aim to inform consumers and their choices. The federal government has developed the ecoENERGY Efficiency for Vehicles program, which includes information on vehicle efficiency, fuel-efficient driving tips and the SmartWay program for commercial fleets. The Alberta Motor Association offers courses on fuel-efficient driving while Alberta’s commercial driver license training now includes a section on fuel efficiency.

40 Climate Leadership Discussion Document
CONVERSATiON STARTERS1. How can government, communities, industry, businesses and Albertans reduce emissions from transportation?
2. How should sustainable transportation be integrated into community and regional planning?
a. What policies could best support reduced vehicle use and sustainable transportation?
b. How could government support public transit and active transportation in Alberta?
3. What role should alternative fuels and new vehicle technologies in Alberta, such as electric or natural gas vehicles, play in Alberta’s emission reduction goals?

41Climate Leadership Discussion Document
bUIlDINGs AND HoUses: oPPortUNItIes for eNerGY effICIeNCY AND CoNserVAtIoN
Climate change is a global challenge, but many of the solutions can be found close to home. When it comes to buildings and houses, energy efficiency and conservation have an important role to play.
eMIssIoNs ProfIle:
Emissions from Alberta houses and buildings were responsible for 21 megatonnes of CO2e emissions in 2013. This represents approximately 8% of Alberta’s 2013 emissions.52
Emissions from electricity production and transportation are not included in these statistics.
Other Oil and Gas
24%
Oil Sands22%
ElectricityGeneration
17%
Transportation11%
Other Industrial Emitters, Manufacturing
& Construction9%
Buildings & Houses
8%
Agriculture, Forestry &
Waste9%
Oil Sands22%
Other Oil and Gas
24%
ElectricityGeneration
17%
Transportation11%
Buildings & Houses
8%
Agriculture, Forestry &
Waste9%
Other Industry, Manufacturing & Construction
9%
Other Oil and Gas
24%
0
10
20
30
40
50
60Industrial Natural Gas Fired Generation (Mt)*
Utility Natural Gas Fired Generation (Mt)
Coal Fired Generation (Mt)
0
5
10
15
20
25
30
35Other Transport
Passenger Transport
Freight Transport
0
5
10
15
20
25
30Commercial and Institutional Buildings
Residential Buildings
0
5
10
15
20
25
30
35Construction
Light Manufacturing
Metals, Cement, Lime and Gypsum
Chemicals and Fertilizers
Mining
0
5
10
15
20
25Forest Resources
Waste
Agriculture
0
50
100
150
200Petroleum Re�ning
Oil and Gas Transmission and Distribution
Oil Sands (Mining, In-situ & Upgrading)
Conventional Oil Production
Natural Gas Production and Processing
Oil and Gas
1990
2000
2010
2020
2030 0
50
100
150
200Petroleum Re�ning
Oil and Natural Gas Transmission
Oil Sands In Situ Extraction
Oil Sands Upgrading
Oil Sands Mining and Extraction
Conventional Oil Production
1990
2000
2010
2020
2030
1990
2000
2010
2020
2030
1990
2000
2010
2020
2030
1990
2000
2010
2020
2030
1990
2000
2010
2020
2030
1990
2000
2010
2020
2030
0
10
20
30
40
50
60Industrial Natural Gas Fired
Utility Natural Gas Fired Generation (Mt)
Coal Fired generation (Mt)
1990
2000
2010
2020
2030
Mt
CO
2eM
t C
O2e
Mt
CO
2eM
t C
O2e
Mt
CO
2eM
t C
O2e
0
5
10
15
20
25
30
35Other Transport
Passenger Transport
Freight Transport
Transportation
1990
2000
2010
2020
2030
Mt
CO
2e
0
5
10
15
20
25
30Commercial and Institutional
Residential
Buildings & Houses
1990
2000
2010
2020
2030
Mt
CO
2e
0
5
10
15
20
25
30
35Construction
Light Manufacturing
Metals, Cement, Lime and Gypsum
Chemicals & Fertilizers
Mining
Other Industry, Manufacturing and Construction
1990
2000
2010
2020
2030
Mt
CO
2e
0
5
10
15
20
25Forest Resources
Waste
Agriculture
Agriculture, Forestry and Waste
1990
2000
2010
2020
2030
Mt
CO
2e
0
50
100
150
200
250
300
350
Mt
CO
2e
1990
2000
2010
2020
2030
0
50
100
150
200
250
300
350
0
50
100
150
200
250
300
350
1990
2000
2010
2020
2030
0
50
100
150
200
250
300Agriculture, Forestry and Waste
Buildings and Houses
Other Industry, Manufacturing and Construction
Transportation
Electricity
Oil and Gas
0
50
100
150
200
250
300Agriculture, Forestry and Waste
Buildings and Houses
Other Industrial Emitters, Manufacturing and Construction
Transportation
Electricity
Oil and Gas
1990
1991
1992
1993
1994
1995
1996
1997
1998
1999
2000
2001
2002
2003
2004
2005
2006
2007
2008
2009
2010
2011
2012
2013
Em
issi
ons
(Mill
ion
tonn
es C
O2e
)
Natural Gas Production and Processing
51
51. Alberta Environment and Parks analysis, based on Environment Canada 2014, Emissions Trends Report, adjusted for 2006 IPCC Guidelines and 2007 IPCC Global Warming Potentials.
52. Ibid.
53. University of Calgary, Canadian Energy Systems Analysis Research http://www.cesarnet.ca/
N�d PE
I
NS
NB
Que Ont
Man
Sas
k
Alta
BC
Can
ada0
10
20
30
40
50
60
Residential
GJ
per
cap
itaG
J p
er c
apita
11.7
5%
16.7
7%
25.6
5%
30.2
2%
2.79
%
-0.3
6% 20.1
5% 33.1
4%
% Compared to Canada
N�d PE
I
NS
NB
Que Ont
Man
Sas
k
Alta
BC
Can
ada0
10
20
30
40
50
Commercial
-0.6
8%
10.0
7% 33.6
9%
39.8
6%
% Compared to Canada
-10.
90%
-17.
39%
-21.
01%
-6.2
7%
-10.
71%
-6.9
8%
-6.7
2%
-9.5
2%
Residential Sector Energy Use per capita
Residential - includes lighting, heating, cooking, plug loads, etc. for where people live in 201053

42 Climate Leadership Discussion Document
N�d PE
I
NS
NB
Que Ont
Man
Sas
k
Alta
BC
Can
ada0
10
20
30
40
50
60
Residential
GJ
per
cap
itaG
J p
er c
apita
11.7
5%
16.7
7%
25.6
5%
30.2
2%
2.79
%
-0.3
6% 20.1
5% 33.1
4%
% Compared to CanadaN
�d PE
I
NS
NB
Que Ont
Man
Sas
k
Alta
BC
Can
ada0
10
20
30
40
50
Commercial
-0.6
8%
10.0
7% 33.6
9%
39.8
6%
% Compared to Canada
-10.
90%
-17.
39%
-21.
01%
-6.2
7%
-10.
71%
-6.9
8%
-6.7
2%
-9.5
2%
Commercial and institutional Sector Energy Use per capita
Commercial and institutional - includes lighting, heating and cooling in all commercial and institutional buildings (warehouses, stores, office buildings, universities, schools, etc.) in 201054
CUrreNt stAte:
Alberta is one of very few jurisdictions in North America without an energy efficiency program currently in place.
Alberta’s building sector includes:
• residential buildings - single attached and single detached houses, apartments and mobile homes;
• commercial buildings - a broader spectrum of building types, including wholesale trade, retail trade, transportation and warehousing, information and cultural industries, offices, social assistance, arts, entertainment and recreation, accommodation and food services, and other services; and
• institutional buildings - municipal government, universities, hospitals and schools.
54. University of Calgary, Canadian Energy Systems Analysis Research http://www.cesarnet.ca/
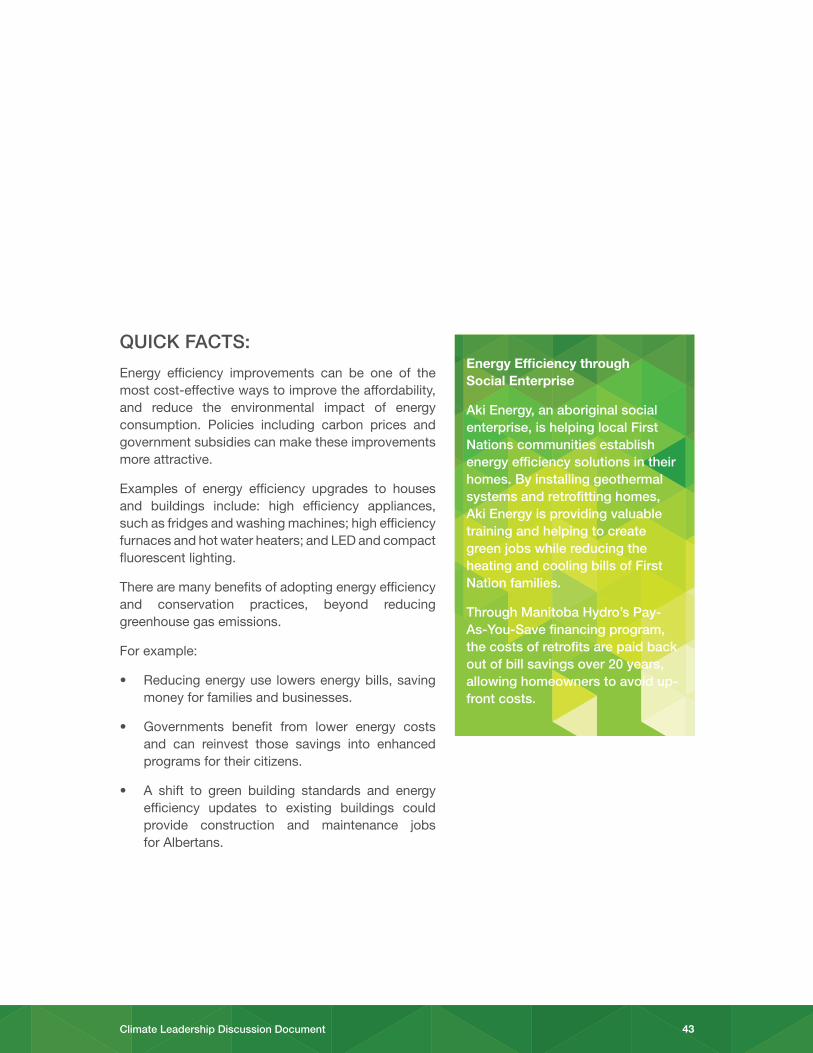
43Climate Leadership Discussion Document
QUICk fACts:
Energy efficiency improvements can be one of the most cost-effective ways to improve the affordability, and reduce the environmental impact of energy consumption. Policies including carbon prices and government subsidies can make these improvements more attractive.
Examples of energy efficiency upgrades to houses and buildings include: high efficiency appliances, such as fridges and washing machines; high efficiency furnaces and hot water heaters; and LED and compact fluorescent lighting.
There are many benefits of adopting energy efficiency and conservation practices, beyond reducing greenhouse gas emissions.
For example:
• Reducing energy use lowers energy bills, saving money for families and businesses.
• Governments benefit from lower energy costs and can reinvest those savings into enhanced programs for their citizens.
• A shift to green building standards and energy efficiency updates to existing buildings could provide construction and maintenance jobs for Albertans.
Energy Efficiency through Social Enterprise
Aki energy, an aboriginal social enterprise, is helping local first Nations communities establish energy efficiency solutions in their homes. by installing geothermal systems and retrofitting homes, Aki energy is providing valuable training and helping to create green jobs while reducing the heating and cooling bills of first Nation families.
through Manitoba Hydro’s Pay-As-You-save financing program, the costs of retrofits are paid back out of bill savings over 20 years, allowing homeowners to avoid up-front costs.
44 Climate Leadership Discussion Document
sPotlIGHt oN INNoVAtIoN:
With funding support from Alberta’s Climate Change and Emissions Management Corporation, ATCO Gas is helping to offset the cost of incorporating Combined Heat and Power technology in commercial and institutional buildings. This form of energy uses natural gas to accomplish two jobs – provide electricity and heat – thereby reducing greenhouse gas emissions and lowering energy costs for consumers.55
The first LEED Gold greenhouse in Canada is located in Brooks, Alberta. The Brooks Crop Diversification Centre South Greenhouse includes research bays, production greenhouses and administrative, training, storage and plant management work areas. This Alberta Infrastructure and Alberta Agriculture and Forestry research facility is powered by 100% green power.56
Edmonton is home to the first Natural Resource Canada certified net-zero house – a house that produces as much energy per year as it consumes.
55. http://ccemc.ca/project/combined-heat-and-power-for-commercial-and-institutional-buildings/#sthash.hShrSD29.dpuf
56. Alberta Focus, Spring 2015, Alberta Chapter of the Canadian Association of Green Builders, http://issuu.com/sabmagazine/docs/digital_alberta_focus_spring_2015
45Climate Leadership Discussion Document
bUIlDINGs AND HoUses PolICY APProACHes
Various approaches have been used in Alberta and elsewhere to reduce greenhouse gas emissions associated with buildings and houses.
Pricing Approach Examples
incentive Programs: Whether direct financial (grants or loans) or indirect (tax breaks), incentives assist the adoption of newer more efficient technologies, where the upfront capital costs associated with improvements are a barrier. Incentives can also be helpful for low-income households to ensure that energy efficiency savings are accessible to all Albertans.
Carbon Pricing: Carbon fees can be imposed on utilities (electricity and natural gas bills), as set monthly charges or based on amount consumed. Energy use fees can be collected by governments or utility providers, and revenue distribution tends to include investment in energy efficiency measures.
Performance Standards Approach Examples
Building Codes and Performance Requirements: Equipment-based standards, building codes and energy performance requirements, can be put in place to ensure that a minimum level of energy efficiency is maintained. For example, Alberta is adopting the National Energy Codes for buildings and houses over the next year, which raises the minimum building efficiency for new builds. Other examples of performance requirements include appliance and equipment standards or bans to eliminate inefficient equipment.
Green Procurement Requirements: Governments can demonstrate leadership by setting purchasing or leasing requirements for building efficiency. These standards can apply to governments and institutions such as municipal buildings, universities, hospitals and schools. Standards such as LEED (Leadership in Energy & Environmental Design) could be applied.
Education and Outreach: A significant barrier to the implementation of energy efficiency improvements is a lack of knowledge on what actions will be cost effective. A number of jurisdictions and utilities have information on websites to help inform people on suitable choices. The federal government EnerGuide program helps homeowners measure the energy efficiency of their home. Building labelling programs in the commercial sector can assist building owners improve their energy efficiency and showcase their efforts.

46 Climate Leadership Discussion Document
CONVERSATiON STARTERS1. What action can be taken by government, industry, businesses and Albertans to use energy more efficiently in houses and buildings?
2. What information do Albertans need to make better informed decisions about cost-effective energy efficiency opportunities?
a. What are the barriers, including costs and availability, to making energy efficiency investments? For families? For businesses?
b. Are new government programs and supports required to assist with upfront financing?
3. How can Alberta help develop a skilled workforce to advance energy efficiency in Alberta houses and buildings?

47Climate Leadership Discussion Document
otHer INDUstrIAl eMItters, MANUfACtUrING AND CoNstrUCtIoN
Alberta has many industrial sectors with large facilities, including: production of cement and other minerals, chemical production, coal mining (metallurgical and thermal), fertilizers, and metals. These industries generally produce products for export, with prices determined by global markets.
Beyond the large industrial emitters, this sector also includes emissions from smaller industry, manufacturing facilities and construction. Many light industry, manufacturing and construction facilities have direct on-site emissions including: stationary combustion for process heating and cooling; on site transportation; and heavy equipment and process emissions.
Many of the industries in this sector represent an important part of Alberta’s supply chain and support the province’s growing economy with links to oil and gas, forestry, agriculture and electricity production.
eMIssIoNs ProfIle
The balance of Alberta’s industrial sectors (excluding electricity and oil and gas) accounted for 9%, or 24 megatonnes of Alberta’s total emissions in 2013.58
57
Other Oil and Gas
24%
Oil Sands22%
ElectricityGeneration
17%
Transportation11%
Other Industrial Emitters, Manufacturing
& Construction9%
Buildings & Houses
8%
Agriculture, Forestry &
Waste9%
Oil Sands22%
Other Oil and Gas
24%
ElectricityGeneration
17%
Transportation11%
Buildings & Houses
8%
Agriculture, Forestry &
Waste9%
Other Industry, Manufacturing & Construction
9%
Other Oil and Gas
24%
0
10
20
30
40
50
60Industrial Natural Gas Fired Generation (Mt)*
Utility Natural Gas Fired Generation (Mt)
Coal Fired Generation (Mt)
0
5
10
15
20
25
30
35Other Transport
Passenger Transport
Freight Transport
0
5
10
15
20
25
30Commercial and Institutional Buildings
Residential Buildings
0
5
10
15
20
25
30
35Construction
Light Manufacturing
Metals, Cement, Lime and Gypsum
Chemicals and Fertilizers
Mining
0
5
10
15
20
25Forest Resources
Waste
Agriculture
0
50
100
150
200Petroleum Re�ning
Oil and Gas Transmission and Distribution
Oil Sands (Mining, In-situ & Upgrading)
Conventional Oil Production
Natural Gas Production and Processing
Oil and Gas
1990
2000
2010
2020
2030 0
50
100
150
200Petroleum Re�ning
Oil and Natural Gas Transmission
Oil Sands In Situ Extraction
Oil Sands Upgrading
Oil Sands Mining and Extraction
Conventional Oil Production
1990
2000
2010
2020
2030
1990
2000
2010
2020
2030
1990
2000
2010
2020
2030
1990
2000
2010
2020
2030
1990
2000
2010
2020
2030
1990
2000
2010
2020
2030
0
10
20
30
40
50
60Industrial Natural Gas Fired
Utility Natural Gas Fired Generation (Mt)
Coal Fired generation (Mt)
1990
2000
2010
2020
2030
Mt
CO
2eM
t C
O2e
Mt
CO
2eM
t C
O2e
Mt
CO
2eM
t C
O2e
0
5
10
15
20
25
30
35Other Transport
Passenger Transport
Freight Transport
Transportation
1990
2000
2010
2020
2030
Mt
CO
2e
0
5
10
15
20
25
30Commercial and Institutional
Residential
Buildings & Houses
1990
2000
2010
2020
2030
Mt
CO
2e
0
5
10
15
20
25
30
35Construction
Light Manufacturing
Metals, Cement, Lime and Gypsum
Chemicals & Fertilizers
Mining
Other Industry, Manufacturing and Construction
1990
2000
2010
2020
2030
Mt
CO
2e
0
5
10
15
20
25Forest Resources
Waste
Agriculture
Agriculture, Forestry and Waste
1990
2000
2010
2020
2030
Mt
CO
2e
0
50
100
150
200
250
300
350
Mt
CO
2e
1990
2000
2010
2020
2030
0
50
100
150
200
250
300
350
0
50
100
150
200
250
300
350
1990
2000
2010
2020
2030
0
50
100
150
200
250
300Agriculture, Forestry and Waste
Buildings and Houses
Other Industry, Manufacturing and Construction
Transportation
Electricity
Oil and Gas
0
50
100
150
200
250
300Agriculture, Forestry and Waste
Buildings and Houses
Other Industrial Emitters, Manufacturing and Construction
Transportation
Electricity
Oil and Gas
1990
1991
1992
1993
1994
1995
1996
1997
1998
1999
2000
2001
2002
2003
2004
2005
2006
2007
2008
2009
2010
2011
2012
2013
Em
issi
ons
(Mill
ion
tonn
es C
O2e
)
Natural Gas Production and Processing
57. Alberta Environment and Parks analysis, based on Environment Canada, 2014 Emissions Trends Report, adjusted for 2006 IPCC Guidelines and 2007 IPCC Global Warming Potentials.
58. Alberta Environment and Parks analysis, based on Environment Canada, 2014 Emissions Trends Report, adjusted for 2006 IPCC Guidelines and 2007 IPCC Global Warming Potentials.
48 Climate Leadership Discussion Document
In 2013:
• The largest share of emissions in this sector came from the production of petrochemicals and fertilizers, with 15 Mt;
• Mining and coal production accounted for 3 Mt;
• Metals, cement, lime and gypsum manufacturing accounted for 3 Mt;
• Light manufacturing accounted for 3 Mt of emissions; and
• Construction accounted for 1 Mt of emissions.
CUrreNt stAte:
Alberta’s Specified Gas Emitters Regulation applies to large emitters within this sector. Large facilities are required to reduce their emissions in accordance with the regulation. These industries accounted for about 15 of the 25 megatonnes emitted in 2013.59
Given the diversity of this sector, there are a variety of other regulations that affect different sub-sectors or sources.
QUICk fACts:
Coal mining produces raw product for electricity or steel production, while mineral, chemical, cement and fertilizer manufacturing add value to Alberta’s produced resources in the form of petrochemicals, polyethylene and resins, agriculture additives, concrete products and more.
Alberta’s Industrial Heartland, northeast of Edmonton, is home to Canada’s largest concentration of petroleum refining, petrochemical, and chemical processors.60
59. Alberta Environment and Parks, data collected under the Specified Gas Emitters Regulation.
60. http://www.albertacanada.com/business/industries/rpb-about-the-industry.aspx

49Climate Leadership Discussion Document
Alberta is a leading petrochemical manufacturing province, home to four major ethylene plants with a combined annual production capacity of 3.9 million metric tonnes. Two of these plants - in Joffre and Fort Saskatchewan - are among the world’s largest.61
In addition, Alberta’s diverse manufacturing industry includes food and beverage processing as well as metals processing, metal fabrication and equipment manufacturing industries. The construction industry includes emissions from both large mobile sources and stationary combustion for heating construction projects.
sPotlIGHt oN INNoVAtIoN:
In 2008 and 2012, Orica Canada Inc. installed dedicated secondary catalysts to drastically reduce the emissions of nitrous oxide (a potent greenhouse gas with a global warming potential 298 times that of CO2) from the Nitric Acid Production Facility near Carseland, Alberta. Since adding the secondary catalysts, the facility’s emissions have been reduced by about 500,000 tonnes of CO2e per year.62
61. http://www.albertacanada.com/business/industries/refining-petrochemicals-biochemicals.aspx
62. Alberta Emission Offset Registry: http://www.csaregistries.ca/albertacarbonregistries/eor_listing.cfm

50 Climate Leadership Discussion Document
INDUstrIAl AND MANUfACtUrING PolICY APProACHes
Various approaches have been used in Alberta and elsewhere to reduce greenhouse gas emissions associated with industrial and manufacturing.
Pricing Approach Examples
Carbon prices: A price on carbon can encourage innovation and make sure that a competitive advantage exists for low-emissions means of production.
Technology incentives and Subsidies: Various policies that provide additional benefits (financial or non-financial) to encourage adoption of lower-emitting technologies.
Performance Standards Approach Examples
Product and Sector Emission Performance Standards: Performance standards mandate specific outcomes or equipment and can be applied at the equipment, facility, product or sector level. Performance standards can improve emissions intensity, where they can increase costs at the worst performing facilities while rewarding the best performing facilities. Performance standards can also result in the phase-out of certain products or facilities. Canada is advancing sector-based emission performance standards, and is committed to developing new manufacturing sector regulations to reduce emissions from the production of chemicals and nitrogen fertilizers as well as for other sectors. Performance standards can also incorporate benchmarking relative to national and internationally comparable facilities since many facilities in this sector produce globally traded products.
Technology Standards: Several environmental regulations and requirements are founded in technology standards such as ensuring maximum achievable control technology or best available technology economically achievable. Technology requirements can also be applied as requiring or banning given application. For example, catalyst performance standards can be set in manufacturing processes.
Fuel Standards: These include restrictions on burning certain types of fuel sources for steam and electricity production, or increased renewable fuel content requirements for fuels used in boilers and vehicles. For example, standards to switch to alternate fuels to heat cement manufacturing kilns, such as biomass and waste-derived fuels (e.g. sewage sludge and municipal solid wastes).
Education and Outreach
Certification or Sustainability Standards: Many sectors have established standards to identify the environment (and economic and social) footprint of their products. For example, the Responsible Care® program for the chemistry industry focuses on environmentally friendly products and processes and the elimination of harm throughout the entire life cycle of their products. While these are voluntary programs, they create market demand for better performance

51Climate Leadership Discussion Document
CONVERSATiON STARTERS1. This sector has several unique characteristics. Should emissions reduction policies be different for this sector than other types of emitters?
a. Should policies and standards be customized for different types of emitters in this sector?
2. How can carbon-reducing innovation and technology be advanced in this sector?

52 Climate Leadership Discussion Document
AGrICUltUre, forestrY AND wAste
Agriculture and forestry are important parts of Alberta’s economy. While they produce emissions, they can also absorb carbon that would otherwise enter the atmosphere. Together with municipal waste management, these sectors can help Alberta reduce and remove greenhouse gas emissions, using biological sources of energy, land management and improved operational practices.
eMIssIoNs ProfIle:
In Alberta, emissions from agriculture were 22 megatonnes or 8% of provincial emissions, and forestry (including pulp and paper) and municipal waste account for 3 megatonnes or 1% in 2013.64
Emissions from soil management practices, including irrigation, tilling and application of fertilizer and manure, account for almost half of Alberta’s agricultural emissions.65
CUrreNt stAte:
In Alberta, these sectors are grouped together because their emission reductions are currently driven voluntarily through the ability to generate and sell carbon offset credits.
63
Other Oil and Gas
24%
Oil Sands22%
ElectricityGeneration
17%
Transportation11%
Other Industrial Emitters, Manufacturing
& Construction9%
Buildings & Houses
8%
Agriculture, Forestry &
Waste9%
Oil Sands22%
Other Oil and Gas
24%
ElectricityGeneration
17%
Transportation11%
Buildings & Houses
8%
Agriculture, Forestry &
Waste9%
Other Industry, Manufacturing & Construction
9%
Other Oil and Gas
24%
0
10
20
30
40
50
60Industrial Natural Gas Fired Generation (Mt)*
Utility Natural Gas Fired Generation (Mt)
Coal Fired Generation (Mt)
0
5
10
15
20
25
30
35Other Transport
Passenger Transport
Freight Transport
0
5
10
15
20
25
30Commercial and Institutional Buildings
Residential Buildings
0
5
10
15
20
25
30
35Construction
Light Manufacturing
Metals, Cement, Lime and Gypsum
Chemicals and Fertilizers
Mining
0
5
10
15
20
25Forest Resources
Waste
Agriculture
0
50
100
150
200Petroleum Re�ning
Oil and Gas Transmission and Distribution
Oil Sands (Mining, In-situ & Upgrading)
Conventional Oil Production
Natural Gas Production and Processing
Oil and Gas
1990
2000
2010
2020
2030 0
50
100
150
200Petroleum Re�ning
Oil and Natural Gas Transmission
Oil Sands In Situ Extraction
Oil Sands Upgrading
Oil Sands Mining and Extraction
Conventional Oil Production
1990
2000
2010
2020
2030
1990
2000
2010
2020
2030
1990
2000
2010
2020
2030
1990
2000
2010
2020
2030
1990
2000
2010
2020
2030
1990
2000
2010
2020
2030
0
10
20
30
40
50
60Industrial Natural Gas Fired
Utility Natural Gas Fired Generation (Mt)
Coal Fired generation (Mt)
1990
2000
2010
2020
2030
Mt
CO
2eM
t C
O2e
Mt
CO
2eM
t C
O2e
Mt
CO
2eM
t C
O2e
0
5
10
15
20
25
30
35Other Transport
Passenger Transport
Freight Transport
Transportation
1990
2000
2010
2020
2030
Mt
CO
2e
0
5
10
15
20
25
30Commercial and Institutional
Residential
Buildings & Houses
1990
2000
2010
2020
2030
Mt
CO
2e
0
5
10
15
20
25
30
35Construction
Light Manufacturing
Metals, Cement, Lime and Gypsum
Chemicals & Fertilizers
Mining
Other Industry, Manufacturing and Construction
1990
2000
2010
2020
2030
Mt
CO
2e
0
5
10
15
20
25Forest Resources
Waste
Agriculture
Agriculture, Forestry and Waste
1990
2000
2010
2020
2030
Mt
CO
2e
0
50
100
150
200
250
300
350
Mt
CO
2e
1990
2000
2010
2020
2030
0
50
100
150
200
250
300
350
0
50
100
150
200
250
300
350
1990
2000
2010
2020
2030
0
50
100
150
200
250
300Agriculture, Forestry and Waste
Buildings and Houses
Other Industry, Manufacturing and Construction
Transportation
Electricity
Oil and Gas
0
50
100
150
200
250
300Agriculture, Forestry and Waste
Buildings and Houses
Other Industrial Emitters, Manufacturing and Construction
Transportation
Electricity
Oil and Gas
1990
1991
1992
1993
1994
1995
1996
1997
1998
1999
2000
2001
2002
2003
2004
2005
2006
2007
2008
2009
2010
2011
2012
2013
Em
issi
ons
(Mill
ion
tonn
es C
O2e
)
Natural Gas Production and Processing
63. Alberta Environment and Parks analysis, based on Environment Canada, 2014 Emissions Trends Report, adjusted for 2006 IPCC Guidelines and 2007 IPCC Global Warming Potentials.
64. Alberta Environment and Parks analysis, based on Environment Canada, 2014 Emissions Trends Report, adjusted for 2006 IPCC Guidelines and 2007 IPCC Global Warming Potentials.
65. Environment Canada, National Inventory Report 1990-2013.

53Climate Leadership Discussion Document
Alberta’s Specified Gas Emitters Regulation captures one landfill and four pulp and paper mills, representing 0.7 Mt of emissions in 2014 (excluding CO2 from biomass).66 An additional six waste treatment and disposal facilities and five wood products manufacturing facilities reported under the Specified Gas Reporting Regulation in 2013, for total reported emissions of 1.2 Mt.67
QUICk fACts:
The United Nations recognizes agriculture and forestry as emissions sources as well as sink opportunities for emission sequestration. There are 55 million hectares of managed forestry and agricultural land in Alberta, which provide a significant opportunity for emission reductions.
• Globally, agriculture is the third largest contributor to global emissions by sector, following the burning of fossil fuels for power and heat, and transportation.
• In Alberta, methane (from digestion by livestock, predominantly cattle) accounts for just under 50%, and nitrous oxide accounts for approximately 30% of total agricultural emissions. Both these gases have high global warming potentials.
• The largest source of emissions in this sector is enteric fermentation, from digestion by livestock, predominantly cattle, accounting for 10 Mt.68
• Emissions related to soil management such as fertilizer use, manure management and tillage practices, accounted for 9 Mt of agricultural emissions in 2013, and are the fastest growing emissions source in agriculture.
Germany and Norway
the United Nation’s Intergovernmental Panel on Climate Change estimates that soil carbon sequestration, through improved cropland and grazing land management, as well as the restoration of degraded lands, offers the greatest potential in agriculture for climate change mitigation. the UN’s food and Agriculture organization is working with Germany and Norway to create a global knowledge base that will identify best opportunities to mitigate climate change through improved farming practices.
(http://www.un.org/apps/news/story.asp?NewsID=37536#.VZ6HZ89Vhbc)
66. Alberta Environment and Parks 2015. Data collected under the Specified Gas Emitters Regulation.
67. Alberta Environment and Parks, data collected under the Specified Gas Reporting Regulation.
68. Environment Canada, National Inventory Report 1990-2013.
54 Climate Leadership Discussion Document
In 2012, about 1.2 Mt of residential waste was disposed in Alberta, while the non-residential sources accounted for 2.7 Mt.69 Alberta currently has provincial stewardship programs for some materials, including electronics, tires, used oil, and beverage containers. Using recycled materials in place of virgin materials in the production of goods can reduce greenhouse gas emissions.
Alberta’s agriculture, forestry and municipal waste sectors generate material that can be used for renewable bioenergy and bioproducts that replace fossil fuels. In some cases, agriculture and forestry residuals (materials that were previously thought of as waste) can be removed sustainably and can become new sources of energy.
sPotlIGHt oN INNoVAtIoN:
The Edmonton Waste Management Centre of Excellence encompasses the world’s largest variety of leading-edge waste management facilities within a small geographic area. It is one of the world’s most advanced biological wastewater treatment plants and North America’s largest co-composting plant. Edmonton is planning to add an anaerobic digestion facility to process food waste and create biofuel and a soil amendment. Waste that cannot be composted or recycled can be processed at the City of Edmonton’s waste-to-natural gas and chemicals facility which, when fully operational, can convert 100,000 tonnes of waste into 38 million litres of biofuels and chemicals annually. Waste-based biofuels can reduce emissions by more than 60% compared to fossil fuel production and landfill operations.
Glossary
Biosequestration: the capture and storage of carbon dioxide through biological sink processes, including increased photosynthesis through practices such as reforestation, preventing deforestation and land degredation, genetic engineering, enhanced soil carbon storage in agriculture or enhanced production of algae.
Biomass: organic materials made from living organisms such as crops, crop residue, trees, wood and animal residue that have stored sunlight in the form of chemical energy. Biomass can be used directly to produce biofuels or other products or it can be burned to create heat or electricity.
Bioenergy: renewable energy derived from biomass.
69. Statistics Canada, Waste Management Industry Survey, 2012, http://www.statcan.gc.ca/daily-quotidien/150610/dq150610a-eng.htm?cmp=mstatcan.
55Climate Leadership Discussion Document
AGrICUltUre, forestrY AND wAste PolICY APProACHes
Various approaches have been used in Alberta and elsewhere to reduce greenhouse gas emissions associated with agriculture, forestry and waste.
Pricing Approach Examples
Carbon Pricing and incentives: Voluntary emission reductions encouraged through carbon offsets, technology or system investment and other incentives have been applied in these sectors. For example, Alberta’s Bioenergy Producer Credit Program offers financial support to encourage the development of bioenergy, renewable fuels and wood pellets; Canada’s Investments in Forest Industry Transformation Program supports new bioproduct establishment; and funding support to municipalities to design and operate waste management facilities.
Performance Standards Approach Examples
Performance Requirements: Requirements for operational practices or equipment standards can be imposed. For example, British Columbia’s Zero Net Deforestation Act, which is not currently in force, requires an equal area of trees be planted for carbon storage to offset any forest land that is permanently cleared for another use. Other examples include requiring landfill gas capture and use, banning the landfilling organic waste, imposing crop fertilization practice standards and controlling manure management to recover and use methane.
Certification or Sustainability Standards: Many sectors have established principles, practices and/or standards to identify the environment (and economic and social) footprint of their products. For example, the Green Gold Label (GGL) program is a certification system for sustainable biomass, where the GGL label provides standards for parts of the supply chain including production, processing, transport and final energy transformation. Some food companies are now including emissions as buying criteria.
Education and Outreach approaches are also applied, where there are numerous initiatives that focus on providing information to improve knowledge and operational practices in these sectors. The development and communication of best management practices to initiate a change in behaviour or practices is common. Examples of outreach programs include: the AgSTAR Program in the United States - a voluntary outreach and education program that promotes recovery and use of methane from animal manure; Canada’s forest accounting system, which includes a model for estimating emissions related to carbon in harvested wood products; and local compost education programs.
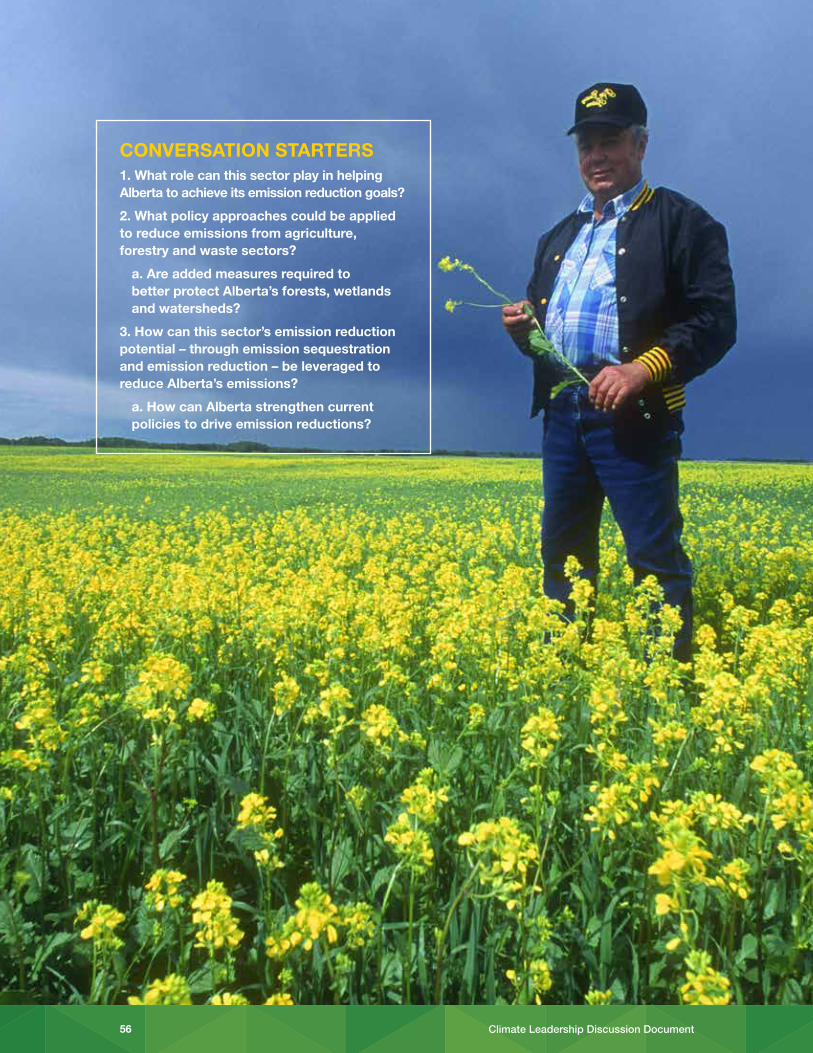
56 Climate Leadership Discussion Document
CONVERSATiON STARTERS1. What role can this sector play in helping Alberta to achieve its emission reduction goals?
2. What policy approaches could be applied to reduce emissions from agriculture, forestry and waste sectors?
a. Are added measures required to better protect Alberta’s forests, wetlands and watersheds?
3. How can this sector’s emission reduction potential – through emission sequestration and emission reduction – be leveraged to reduce Alberta’s emissions?
a. How can Alberta strengthen current policies to drive emission reductions?
57Climate Leadership Discussion Document
7
Next StepsAlbertA’s ACtIoN PlAN oN ClIMAte CHANGe
Following the Climate Leadership Discussions in the summer and early fall of 2015, advice from the advisory panel will inform Alberta’s new government’s action plan on climate change. Input from the public, labour, industry and business, First Nations and Métis communities, environmental organizations, academics and municipal government will be carefully considered as part of this process.
Alberta’s new government is also committed to developing a provincial adaptation strategy to help ensure the province is better prepared for and more resilient to a changing climate. The strategy will be developed with input from Albertans through a separate engagement process that recognizes the unique challenges and opportunities of adaptation.
PArtNersHIPs
Climate change is a global challenge. Working with the right partners will improve policy outcomes and garner much better external understanding of Alberta’s new approach to climate change and emission reductions.
Alberta’s future success in addressing emissions will be best realized by strong support and partnerships within Canada and around the world.
As jurisdictions around the world establish their own approaches to climate change, new ideas, policies and strategies have been created. Taking a global approach to a global problem, Alberta will actively learn from others while sharing its own expertise.
Alberta’s Climate Leadership Discussions - Get involved!
Visit: http://alberta.ca/climate-leadership.cfm for more information, to learn more about the engagement process and opportunities
to attend public meetings, or to take the online survey.


59Climate Leadership Discussion Document