Contents · Actigraphy, actigraph(s), actimetry, actigraph, accelerometer, actigraphic,...
30
1 Contents Literature Search Terms .......................................................................................................................................................... 2 Summary of Study Sample Characteristics ............................................................................................................................. 2 Insomnia in Adult Populations ...................................................................................................................................................................... 5 Figure S1a ............................................................................................................................................................................... 5 Figure S1b - ............................................................................................................................................................................. 6 Figure S2a - ............................................................................................................................................................................. 7 Figure S2b ............................................................................................................................................................................... 8 Figure S3a ............................................................................................................................................................................... 9 Figure S3b ............................................................................................................................................................................. 10 Figure S4a ............................................................................................................................................................................. 11 Figure S4b ............................................................................................................................................................................. 12 Table S1a .............................................................................................................................................................................. 12 Table S1b .............................................................................................................................................................................. 13 Figure S5a ............................................................................................................................................................................. 14 Figure S5b ............................................................................................................................................................................. 14 Figure S6a ............................................................................................................................................................................. 15 Figure S6b ............................................................................................................................................................................. 15 Figure S7a ............................................................................................................................................................................. 16 Figure S7b ............................................................................................................................................................................. 16 Figure S8a ............................................................................................................................................................................. 17 Figure S8b ............................................................................................................................................................................. 17 Table S2a .............................................................................................................................................................................. 18 Table S2b .............................................................................................................................................................................. 18 Insomnia in Pediatric Populations .............................................................................................................................................................. 19 Figure S9 ............................................................................................................................................................................... 19 Figure S10 ............................................................................................................................................................................. 19 Figure S11 ............................................................................................................................................................................. 19 Figure S12 ............................................................................................................................................................................. 19 Figure S13 ............................................................................................................................................................................. 20 Figure S14 ............................................................................................................................................................................. 20 Table S3 ................................................................................................................................................................................ 20 Table S4 ................................................................................................................................................................................ 21 Circadian Rhythm Sleep Wake Disorders in Adult Populations .............................................................................................................. 21 Figure S15 ............................................................................................................................................................................. 21 Figure S16 ............................................................................................................................................................................. 21 Figure S17 ............................................................................................................................................................................. 21 Figure S18 ............................................................................................................................................................................. 21 Table S5 ................................................................................................................................................................................ 22 Table S6 ................................................................................................................................................................................ 22 Circadian Rhythm Sleep Wake Disorders in Pediatric Populations ........................................................................................................ 22 Figure S19 ............................................................................................................................................................................. 22 Figure S20 ............................................................................................................................................................................. 23 Figure S21 ............................................................................................................................................................................. 23 Figure S22 ............................................................................................................................................................................. 23 Figure S23 ............................................................................................................................................................................. 23 Figure S24 ............................................................................................................................................................................. 24 Figure S25 ............................................................................................................................................................................. 24 Figure S26 ............................................................................................................................................................................. 24
Transcript of Contents · Actigraphy, actigraph(s), actimetry, actigraph, accelerometer, actigraphic,...

1
Contents Literature Search Terms .......................................................................................................................................................... 2 Summary of Study Sample Characteristics ............................................................................................................................. 2
Insomnia in Adult Populations ...................................................................................................................................................................... 5 Figure S1a ............................................................................................................................................................................... 5 Figure S1b - ............................................................................................................................................................................. 6 Figure S2a - ............................................................................................................................................................................. 7 Figure S2b ............................................................................................................................................................................... 8 Figure S3a ............................................................................................................................................................................... 9 Figure S3b ............................................................................................................................................................................. 10 Figure S4a ............................................................................................................................................................................. 11 Figure S4b ............................................................................................................................................................................. 12 Table S1a .............................................................................................................................................................................. 12 Table S1b .............................................................................................................................................................................. 13 Figure S5a ............................................................................................................................................................................. 14 Figure S5b ............................................................................................................................................................................. 14 Figure S6a ............................................................................................................................................................................. 15 Figure S6b ............................................................................................................................................................................. 15 Figure S7a ............................................................................................................................................................................. 16 Figure S7b ............................................................................................................................................................................. 16 Figure S8a ............................................................................................................................................................................. 17 Figure S8b ............................................................................................................................................................................. 17 Table S2a .............................................................................................................................................................................. 18 Table S2b .............................................................................................................................................................................. 18
Insomnia in Pediatric Populations .............................................................................................................................................................. 19 Figure S9 ............................................................................................................................................................................... 19 Figure S10 ............................................................................................................................................................................. 19 Figure S11 ............................................................................................................................................................................. 19 Figure S12 ............................................................................................................................................................................. 19 Figure S13 ............................................................................................................................................................................. 20 Figure S14 ............................................................................................................................................................................. 20 Table S3 ................................................................................................................................................................................ 20 Table S4 ................................................................................................................................................................................ 21
Circadian Rhythm Sleep Wake Disorders in Adult Populations .............................................................................................................. 21 Figure S15 ............................................................................................................................................................................. 21 Figure S16 ............................................................................................................................................................................. 21 Figure S17 ............................................................................................................................................................................. 21 Figure S18 ............................................................................................................................................................................. 21 Table S5 ................................................................................................................................................................................ 22 Table S6 ................................................................................................................................................................................ 22
Circadian Rhythm Sleep Wake Disorders in Pediatric Populations ........................................................................................................ 22 Figure S19 ............................................................................................................................................................................. 22 Figure S20 ............................................................................................................................................................................. 23 Figure S21 ............................................................................................................................................................................. 23 Figure S22 ............................................................................................................................................................................. 23 Figure S23 ............................................................................................................................................................................. 23 Figure S24 ............................................................................................................................................................................. 24 Figure S25 ............................................................................................................................................................................. 24 Figure S26 ............................................................................................................................................................................. 24

2
Table S7 ................................................................................................................................................................................ 24 Table S8 ................................................................................................................................................................................ 25
Non-specific Sleep Disorders in Pediatric Populations ............................................................................................................................ 25 Figure S27 ............................................................................................................................................................................. 25 Figure S28 ............................................................................................................................................................................. 25 Figure S29 ............................................................................................................................................................................. 25 Figure S30 ............................................................................................................................................................................. 26
Sleep Disordered Breathing in Adult Populations .................................................................................................................................... 26 Figure S31 ............................................................................................................................................................................. 26 Table S9 ................................................................................................................................................................................ 26
Central Disorders of Hypersomnolence in Adult Populations ................................................................................................................. 27 Figure S32a ........................................................................................................................................................................... 27 Figure S32b ........................................................................................................................................................................... 27 Table S10a ............................................................................................................................................................................ 27 Table S10b ............................................................................................................................................................................ 28
Insufficient Sleep Syndrome in Adult Populations ................................................................................................................................... 28 Figure S33 ............................................................................................................................................................................. 28 Figure S34 ............................................................................................................................................................................. 28 Table S11 .............................................................................................................................................................................. 29 Table S12 .............................................................................................................................................................................. 29
PLMD Adult and Pediatric Populations ...................................................................................................................................................... 29 Figure S35 ............................................................................................................................................................................. 29 Table S13 .............................................................................................................................................................................. 30
Literature Search Terms
Summary of Study Sample Characteristics
Study Sleep Disorder(s) Comorbidities Gender M:F
Age M (SD) Intervention
Clinical Question 1 – Insomnia Alessi 2016 Insomnia Multiple, non-specific 154:5 72 (8) CBT
Buysse 2011 Insomnia Common for older adults 25:54 72 (7) Brief behavioral treatment for insomnia
Actigraphy, actigraph(s), actimetry, actigraph, accelerometer, actigraphic, actigraphical, actigraphically, actigraphies, actigraphyic, actometer(s), sleep deprivation, intrinsic sleep disorders, nocturnal myoclonus syndrome, electromyography actigraphy, paradoxical insomnia, sleep state misperception(s), subjective insomnia, subjective sleepiness, pseudo-insomnia, insomnia without objective findings, sleep hypochondriasis, subjective sleep complaint, periodic limb movement disorder, periodic limb movements of sleep, PLMD, PLMS, periodic limb movement(s), periodic leg movement(s), sleep leg movement(s), periodic movements of sleep, PLM, leg jerks, leg motor activity, sleep myoclonus, nocturnal myoclonus, myoclonic hyperkinesias, sleep myoclonus syndrome(s), periodic movement disorder, sleep-related movement disorder(s), sleep-related movement disorder(s), electromyograph, electromyogram, EMG, electromyography, insufficient sleep syndrome, behaviorally induced insufficient sleep syndrome, insufficient nocturnal sleep, insufficient sleep disorder, sleep curtailment, sleep reduction, sleep restriction, sleep deprivation, sleep log(s), sleep diary, sleep diaries, sleep journal(s), caregiver report(s), caregiver report of sleep, accuracy, validity, diagnostic accuracy, diagnostic test accuracy study, validation study, instrument validation, accurate, accurately, accurateness, valid, validly, validate(s), validated, and validating.
3
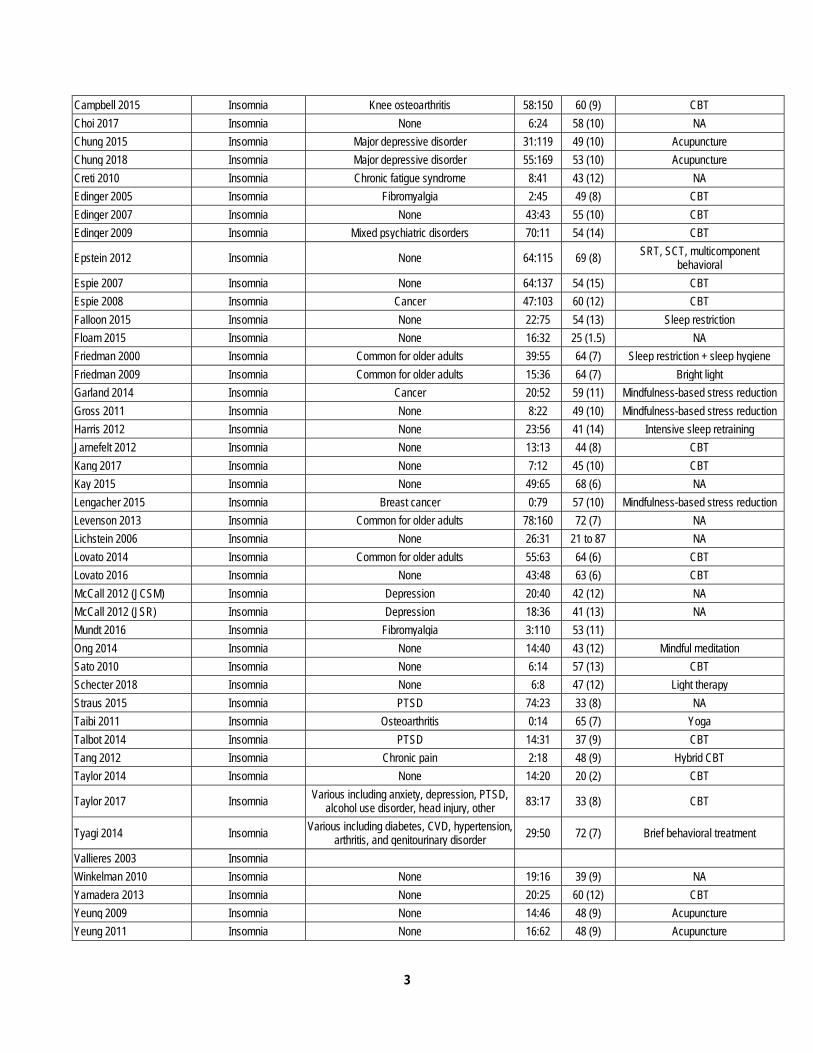
Campbell 2015 Insomnia Knee osteoarthritis 58:150 60 (9) CBT Choi 2017 Insomnia None 6:24 58 (10) NA Chung 2015 Insomnia Major depressive disorder 31:119 49 (10) Acupuncture Chung 2018 Insomnia Major depressive disorder 55:169 53 (10) Acupuncture Creti 2010 Insomnia Chronic fatigue syndrome 8:41 43 (12) NA Edinger 2005 Insomnia Fibromyalgia 2:45 49 (8) CBT Edinger 2007 Insomnia None 43:43 55 (10) CBT Edinger 2009 Insomnia Mixed psychiatric disorders 70:11 54 (14) CBT
Epstein 2012 Insomnia None 64:115 69 (8) SRT, SCT, multicomponent behavioral
Espie 2007 Insomnia None 64:137 54 (15) CBT Espie 2008 Insomnia Cancer 47:103 60 (12) CBT Falloon 2015 Insomnia None 22:75 54 (13) Sleep restriction Floam 2015 Insomnia None 16:32 25 (1.5) NA Friedman 2000 Insomnia Common for older adults 39:55 64 (7) Sleep restriction + sleep hygiene Friedman 2009 Insomnia Common for older adults 15:36 64 (7) Bright light Garland 2014 Insomnia Cancer 20:52 59 (11) Mindfulness-based stress reduction Gross 2011 Insomnia None 8:22 49 (10) Mindfulness-based stress reduction Harris 2012 Insomnia None 23:56 41 (14) Intensive sleep retraining Jarnefelt 2012 Insomnia None 13:13 44 (8) CBT Kang 2017 Insomnia None 7:12 45 (10) CBT Kay 2015 Insomnia None 49:65 68 (6) NA Lengacher 2015 Insomnia Breast cancer 0:79 57 (10) Mindfulness-based stress reduction Levenson 2013 Insomnia Common for older adults 78:160 72 (7) NA Lichstein 2006 Insomnia None 26:31 21 to 87 NA Lovato 2014 Insomnia Common for older adults 55:63 64 (6) CBT Lovato 2016 Insomnia None 43:48 63 (6) CBT McCall 2012 (JCSM) Insomnia Depression 20:40 42 (12) NA McCall 2012 (JSR) Insomnia Depression 18:36 41 (13) NA Mundt 2016 Insomnia Fibromyalgia 3:110 53 (11) Ong 2014 Insomnia None 14:40 43 (12) Mindful meditation Sato 2010 Insomnia None 6:14 57 (13) CBT Schecter 2018 Insomnia None 6:8 47 (12) Light therapy Straus 2015 Insomnia PTSD 74:23 33 (8) NA Taibi 2011 Insomnia Osteoarthritis 0:14 65 (7) Yoga Talbot 2014 Insomnia PTSD 14:31 37 (9) CBT Tang 2012 Insomnia Chronic pain 2:18 48 (9) Hybrid CBT Taylor 2014 Insomnia None 14:20 20 (2) CBT
Taylor 2017 Insomnia Various including anxiety, depression, PTSD, alcohol use disorder, head injury, other 83:17 33 (8) CBT
Tyagi 2014 Insomnia Various including diabetes, CVD, hypertension, arthritis, and genitourinary disorder 29:50 72 (7) Brief behavioral treatment
Vallieres 2003 Insomnia Winkelman 2010 Insomnia None 19:16 39 (9) NA Yamadera 2013 Insomnia None 20:25 60 (12) CBT Yeung 2009 Insomnia None 14:46 48 (9) Acupuncture Yeung 2011 Insomnia None 16:62 48 (9) Acupuncture

4
Clinical Question 2 – Circadian rhythm sleep-wake disorders de Rui 2014 CRSWD Decompensated cirrhosis 9:3 59 (15) Light therapy Pickering 2014 CRSWD Craniopharyngioma 15:15 51 (12) NA
Clinical Question 3 – Sleep-related breathing disorders
Choi 2017 Sleep-disordered breathing None 6:24 58 (10) NA
Elbaz 2002 OSA None 15:5 52 (15) NA
Garcia-Diaz 2007 Sleep apnea/hypopnea syndrome None 54:8 54 (10) NA
Kim 2013 OSA None 84:17 49 (11) NA Pallin 2014 OSA None 84:19 55 (14) NA Sharif 2013 OSA None 83:24 45 (14) NA
Clinical Question 4 – Hypersomnia Bradshaw 2007 Hypersomnia None 47:7 31 (10) NA
Clinical Question 5 – Periodic limb movement disorder Gschliesser 2009 PLMD None 18:6 58 (12) NA Kobayashi 2014 RLS, PLMD None 14:27 52 (16) NA Montgomery-Downs 2005 PLMD None 42:57 8 (2) NA Rogers 2012 PLMD Sickle cell disease 10:10 10 (4) NA Sforza 2005 RLS None 7:4 57 (13) NA
Clinical Question 6 – Insufficient sleep syndrome Barger 2014 Insufficient sleep None 54:10 46 (4.5) Hypnotic drug Bjorvatn 2007 Insufficient sleep None 16:1 42 (13) Bright light and melatonin Fietz 2009 Insufficient sleep None 9:15 27 (5) NA Forberg 2010 Insufficient sleep None 25:0 44 (9) NA Gohar 2009 Insufficient sleep None 12:27 28 (4) NA Kim 2011 Insufficient sleep None 10:48 27 (2) NA Rose 2008 Insufficient sleep None 16:15 29 Change in work schedule Rosekind 2006 Insufficient sleep None 29:0 41 Alertness management program Signal 2005 Insufficient sleep None 21:0 42 (9) NA Simons 2011 Insufficient sleep None 21:3 37 (8) NA Thorne 2008 Insufficient sleep None 7:0 41 (12) NA
Clinical Question 7 – Pediatric sleep disorders Appleton 2012 Non-specific Neurodevelopmental disorders 97:49 9 (3) Melatonin Conroy 2017 Insomnia Depression 3:8 17 (2) Modified CBT-I de Bruin 2015 Insomnia None 3:10 15 (2) CBT-I Dayyat 2011 Insomnia None 169:158 6 (1) NA Gringras 2014 Non-specific Neurodevelopmental disorder 54:67 9 (3) Weighted blankets Paine 2011 Insomnia None 24:18 9 (2) CBT-I Palmero 2017 Insomnia Physical and psychiatric 10:30 15 (2) Brief CBT-I Saxvig 2014 DSPWD None 12:28 21 (3) Bright light and melatonin Van Maanen 2017 DSPWD Neurodevelopmental disorders 51:33 9 Melatonin Wasdell 2008 DSPWD Neurodevelopmental disorders 31:19 7 (4) Melatonin

5
Insomnia in Adult Populations Figure S1a - Comparison of actigraphy to sleep logs for baseline total sleep time (min) in patients with suspected or diagnosed insomnia (all studies)

6
Figure S1b - Comparison of actigraphy to PSG for baseline total sleep time (min) in patients with suspected or diagnosed insomnia (all studies)

7
Figure S2a - Comparison of actigraphy to sleep logs for baseline sleep latency (min) in patients with suspected or diagnosed insomnia (all studies)
8
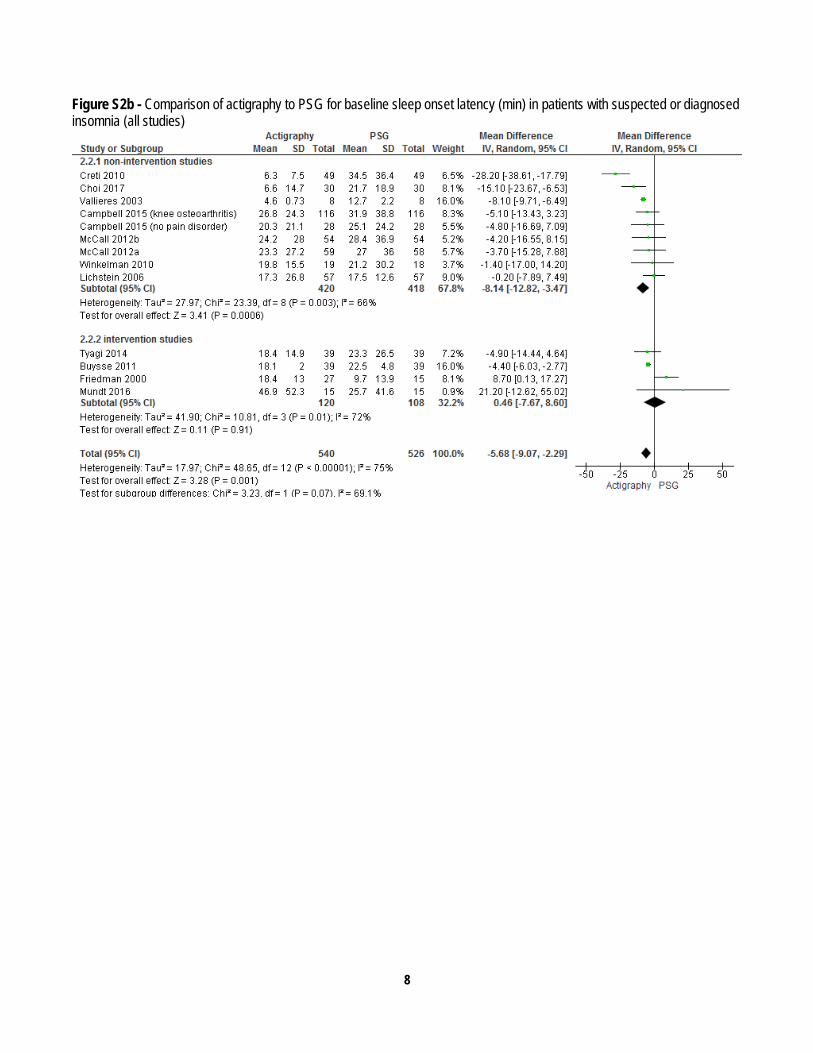
Figure S2b - Comparison of actigraphy to PSG for baseline sleep onset latency (min) in patients with suspected or diagnosed insomnia (all studies)

9
Figure S3a - Comparison of actigraphy to sleep logs for baseline wake after sleep onset (min) in patients with suspected or diagnosed insomnia (all studies)

10
Figure S3b - Comparison of actigraphy to PSG for baseline wake after sleep onset (min) in patients with suspected or diagnosed insomnia (all studies)

11
Figure S4a - Comparison of actigraphy to sleep logs for baseline sleep efficiency (%) in patients with suspected or diagnosed insomnia (all studies)

12
Figure S4b - Comparison of actigraphy to PSG for baseline sleep efficiency (%) in patients with suspected or diagnosed insomnia (all studies)
Table S1a – Summary of Findings table for actigraphy compared to sleep logs (all studies) for the assessment of sleep parameters in patients with suspected or diagnosed insomnia References: Alessi 2016 (A); Buysse 2011 (B); Campbell 2015 (C); Choi 2017 (D); Chung 2015 (E); Chung 2018 (F); Creti 2010 (G); Edinger 2007 (H); Edinger 2005 (I); Edinger 2009 (J); Espie 2007 (K); Espie 2008 (L); Falloon 2015 (M); Floam 2015 (N); Friedman 2009 (O); Friedman 2000 (P); Garland 2014 (Q); Gross 2011 (R); Harris 2012 (S); Jarnefelt 2012 (T); Kay 2015 (U); Lengacher 2014 (V); Levenson 2013 (W); Lichstein 2006 (X); Lovato 2014 (Y); Lovato 2016 (Z); McCall 2012a (AA); McCall 2012b (BB); Mundt 2016 (CC); Ong 2014 (DD); Sato 2010 (EE); Straus 2015 (FF); Taibi 2011 (GG); Talbot 2014 (HH); Tang 2012 (II); Taylor 2014 (JJ); Taylor 2017 (KK); Tyagi 2014 (LL); Vallieres 2003 (MM); Winkelman 2010 (NN); Yamadera 2013 (OO); Yeung 2011 (PP); Yeung 2009 (QQ) Outcomes Quality of the evidence
(GRADE) Absolute Difference Actigraphy vs Sleep logs
No of Participants (studies)
TST* (see Figure S1a)
⨁⨁⨁◯
MODERATE a
The mean difference in TST measured by actigraphy was 37.40 minutes higher1 (22.14 higher to 52.67 higher) as compared to sleep logs
1996 (40 studies) B-D,F-J,L- QQ
SOL* (see Figure S2a)
⨁⨁⨁⨁
HIGH
The mean difference in SOL measured by actigraphy was 23.99 minutes lower1 (27.29 lower to 20.69 lower) as compared to sleep logs
1835 (36 studies) B-E,G-N,P-X,Z-
CC,EE,GG,II-QQ WASO* (see Figure S3a)
⨁⨁⨁⨁
HIGH
The mean difference in WASO measured by actigraphy was 5.65 minutes lower2 (14.81 lower to3.51 higher) as compared to sleep logs
1795 (34 studies) B,C,E,G,I-U,W-
CC,FF-MM,PP,QQ SE* (see Figure S4a)
⨁⨁⨁⨁
HIGH
The mean difference in SE measured by actigraphy was 7.49 % higher1 (5.05 higher to 9.94 higher) as compared to sleep logs
2036 (34 studies) A-C,E-M,O-U,W-
Z,CC,DD,FF,GG,II-MM,PP,QQ
* Critical Outcome a. 95% CI crosses clinical significance threshold 1. Meets clinical significance threshold 2. Does not meet clinical significance threshold

13
Table S1b – Summary of Findings table for actigraphy compared to PSG (all studies) for the assessment of sleep parameters in patients with suspected or diagnosed insomnia References: Buysse 2011 (A); Campbell 2015 (B); Choi 2017 (C); Creti 2010 (D); Friedman 2000 (E); Friedman 2009 (F); Lichstein 2006 (G); McCall 2012a (H); McCall 2012b (I); Mundt 2016 (J); Ong 2014 (K); Talbot 2014 (L); Tyagi 2014 (M); Vallieres 2003 (N); Winkelman 2010 (O) Outcomes Quality of the evidence
(GRADE) Absolute Difference Actigraphy vs PSG
No of Participants (studies)
TST* (see Figure S1b)
⨁⨁⨁⨁
HIGH
The width of the 95% CI of the mean difference in TST measured by actigraphy as compared to PSG was 35.12 minutes1
659 (15 studies) A-O
SOL* (see Figure S2b)
⨁⨁⨁⨁
HIGH
The width of the 95% CI of the mean difference in SOL measured by actigraphy as compared to PSG was 6.78 minutes1
540 (12 studies) A-E,G-J, M-O
WASO* (see Figure S3b)
⨁⨁⨁◯
MODERATE a
The width of the 95% CI of the mean difference in WASO measured by actigraphy as compared to PSG was 33.22 minutes2
624 (12 studies) A,B,D-J,L-N
SE* (see Figure S4b)
⨁⨁⨁◯
MODERATE a
The width of the 95% CI of the mean difference in SE measured by actigraphy as compared to PSG was 7.84 %2
416 (9 studies) A,B,D,E,G,J,K,M,N
* Critical Outcome a. 95% CI of subgroups exceeds limits 1. Within clinical significance limits 2. Exceeds clinical significance limits

14
Figure S5a - Comparison of actigraphy to sleep logs for post-treatment total sleep time (min) in patients with suspected or diagnosed insomnia (intervention studies only)
Figure S5b - Comparison of actigraphy to PSG for post-treatment total sleep time (min) in patients with suspected or diagnosed insomnia (intervention studies only)

15
Figure S6a - Comparison of actigraphy to sleep logs for post-treatment sleep onset latency (min) in patients with suspected or diagnosed insomnia (intervention studies only)
Figure S6b - Comparison of actigraphy to PSG for post-treatment sleep onset latency (min) in patients with suspected or diagnosed insomnia (intervention studies only)

16
Figure S7a - Comparison of actigraphy to sleep logs for post-treatment wake after sleep onset (min) in patients with suspected or diagnosed insomnia (intervention studies only)
Figure S7b - Comparison of actigraphy to PSG for post-treatment wake after sleep onset (min) in patients with suspected or diagnosed insomnia (intervention studies only)

17
Figure S8a - Comparison of actigraphy to sleep logs for post-treatment sleep efficiency (%) in patients with suspected or diagnosed insomnia (intervention studies only)
Figure S8b - Comparison of actigraphy to PSG for post-treatment sleep efficiency (%) in patients with suspected or diagnosed insomnia (intervention studies only)

18
Table S2a – Summary of Findings table for actigraphy compared to sleep logs (intervention studies) for the assessment of treatment response in patients with suspected or diagnosed insomnia References: Alessi 2016 (A); Buysse 2011 (B); Chung 2015 (C); Chung 2018 (D); Edinger 2005 (E); Edinger 2007 (F); Edinger 2009 (G); Epstein 2012 (H); Espie 2007 (I); Espie 2008 (J); Falloon 2015 (K); Friedman 2000 (L); Friedman 2009 (M); Garland 2014 (N); Gross 2011 (O); Harris 2012 (P); Jarnefelt 2012 (Q); Kang 2017 (R); Kay 2015 (S); Lengacher 2014 (T); Lovato 2014 (U); Lovato 2016 (V); Mundt 2016 (W); Ong 2014 (X); Sato 2010 (Y); Shechter 2018 (Z); Taibi 2011 (AA); Talbot 2014 (BB); Tang 2012 (CC); Taylor 2014 (DD); Taylor 2017 (EE); Tyagi 2014 (FF); Yamadera 2013 (GG); Yeung 2009 (HH); Yeung 2011 (II) Outcomes Quality of the evidence
(GRADE) Absolute Difference Actigraphy vs Sleep logs
No of Participants (studies)
TST* (see Figure S5a)
⨁⨁⨁◯
MODERATE a
The mean difference in TST measured by actigraphy was 8.10 minutes higher2 (9.23 lower to 25.42 higher) as compared to sleep logs
1520 (30 studies) B,D-H,J-Q,S-II
SOL* (see Figure S6a)
⨁⨁⨁⨁
HIGH
The mean difference in SOL measured by actigraphy was 10.55 minutes lower2 (12.90 lower to 8.20 lower) as compared to sleep logs
1190 (27 studies) B,C,E-G,I-L,N-
Q,S,T,V,W,Y-AA,CC-II WASO* (see Figure S7a)
⨁⨁⨁◯
MODERATE a
The mean difference in WASO measured by actigraphy was 11.47 minutes higher2 (0.58 lower to 23.51 higher) as compared to sleep logs
1314 (27 studies) B,C,E,G-Q,S,U-
W,Z,AA -FF,HH,II SE* (see Figure S8a)
⨁⨁⨁◯
MODERATE a
The mean difference in SE measured by actigraphy was 2.08 % higher2 (0.60 lower to 4.76 higher) as compared to sleep logs
1692 (30 studies) A-S,U-X,AA,CC-
FF,HH,II
* Critical Outcome a. 95% CI crosses clinical significance threshold. 1. Meets clinical significance threshold 2. Does not meet clinical significance threshold
Table S2b – Summary of Findings table for actigraphy compared to PSG (intervention studies) for the assessment of treatment response in patients with suspected or diagnosed insomnia References: Buysse 2011 (A); Friedman 2000 (B); Friedman 2009 (C); Mundt 2016 (D); Ong 2014 (E); Talbot 2014 (F); Tyagi 2014 (G) Outcomes Quality of the evidence
(GRADE) Absolute Difference Actigraphy vs PSG
No of Participants (studies)
TST* (see Figure S5b)
⨁⨁⨁◯
MODERATE a
The width of the 95% CI of the mean difference in TST measured by actigraphy as compared to PSG was 83.40 minutes2
237 (7 studies) A-G
SOL* (see Figure S6b)
⨁⨁⨁◯
MODERATE b
The width of the 95% CIs of the mean difference in SOL measured by actigraphy as compared to PSG ranged from 4.12 to 29.84 minutes1
120 (4 studies) A,B,D,G
WASO* (see Figure S7b)
⨁⨁⨁◯
MODERATE a
The width of the 95% CI of the mean difference in WASO measured by actigraphy as compared to PSG was 86.02 minutes2
237 (6 studies) A-D,F,G
SE* (see Figure S8b)
⨁⨁⨁◯
MODERATE a,b
The width of the 95% CI of the mean difference in SE measured by actigraphy as compared to PSG was 7.92 %2
195 (5 studies) A,B,D,E,G
* Critical Outcome a. 95% CI exceeds clinical significance limits. b. Imprecision due to small sample size. 1. Within clinical significance limits 2. Exceeds clinical significance limits

19
Insomnia in Pediatric Populations Figure S9 - Comparison of actigraphy to sleep logs for baseline total sleep time (min) in pediatric patients with suspected or diagnosed insomnia (all studies)
Figure S10 - Comparison of actigraphy to sleep logs for baseline sleep onset latency (min) in pediatric patients with suspected or diagnosed insomnia (all studies)
Figure S11 - Comparison of actigraphy to sleep logs for baseline wake after sleep onset (min) in pediatric patients with suspected or diagnosed insomnia (all studies)
Figure S12 - Comparison of actigraphy to sleep logs for post-treatment total sleep time (min) in pediatric patients with suspected or diagnosed insomnia (intervention studies)

20
Figure S13 - Comparison of actigraphy to sleep logs for post-treatment sleep onset latency (min) in pediatric patients with suspected or diagnosed insomnia (intervention studies)
Figure S14 - Comparison of actigraphy to sleep logs for post-treatment wake after sleep onset (min) in pediatric patients with suspected or diagnosed insomnia (intervention studies)
Table S3 – Summary of Findings table for actigraphy compared to sleep logs (all studies) for the assessment of baseline sleep parameters in pediatric patients with suspected or diagnosed insomnia References: Conroy 2017 (A); Dayyat 2011 (B); de Bruin 2015 (C); Palmero 2017 (D) Outcomes Quality of the evidence
(GRADE) Absolute Difference Actigraphy vs Sleep logs
No of Participants (studies)
TST* (see Figure S9)
⨁⨁⨁◯
MODERATE a
The mean difference in TST measured by actigraphy ranged from 27.0 minutes lower to 119.8 minutes lower1 as compared to sleep logs
454 (3 studies) A,B,C
SOL* (see Figure S10)
⨁⨁⨁◯
MODERATE a
The mean difference in SOL measured by actigraphy ranged from 10.0 minutes lower to 2.9 minutes higher2 as compared to sleep logs
454 (3 studies) A,B,C
WASO* (see Figure S11)
⨁⨁⨁◯
MODERATE b The mean difference in WASO measured by actigraphy ranged from 23.0 to 46.0 minutes higher1 as compared to sleep logs
167 (3 studies) A,C,D
* Critical Outcome a. 95% CI crosses clinical significance threshold b. Imprecision due to small sample size 1. Meets clinical significance threshold 2. Does not meet clinical significance threshold

21
Table S4 – Summary of Findings table for actigraphy compared to sleep logs (intervention studies) for the assessment of treatment response in pediatric patients with suspected or diagnosed insomnia References: Conroy 2017 (A); de Bruin 2015 (B); Paine 2011 (C); Palmero 2017 (D) Outcomes Quality of the evidence
(GRADE) Absolute Difference Actigraphy vs Sleep logs
No of Participants (studies)
TST* (see Figure S12)
⨁⨁⨁◯
MODERATE a,b,c
The mean difference in TST measured by actigraphy was 19.14 minutes lower2 (46.41 lower to 8.13 higher) as compared with sleep logs
149 (4 studies) A-D
SOL* (see Figure S13)
⨁⨁⨁◯
MODERATE b
The mean difference in SOL measured by actigraphy was 2.94 minutes lower2 (13.10 lower to 7.21 higher) as compared with sleep logs
109 (3 studies) A,B,C
WASO* (see Figure S14)
⨁⨁⨁◯
MODERATE b,c
The mean difference in WASO measured by actigraphy was 45.72 minutes higher1 (18.46 higher to 72.97 higher) as compared with sleep logs
149 (4 studies) A-D
* Critical Outcome a. 95% CI crosses clinical significance threshold. b. Small sample size. c. 1 of 4 studies fell below the clinical significance threshold 1. Meets clinical significance threshold 2. Does not meet clinical significance threshold
Circadian Rhythm Sleep Wake Disorders in Adult Populations Figure S15 - Comparison of actigraphy to sleep logs for baseline sleep onset time (h) in patients with suspected or diagnosed CRSWD (all studies)
Figure S16 - Comparison of actigraphy to sleep logs for baseline sleep offset time (h) in patients with suspected or diagnosed CRSWD (all studies)
Figure S17 - Comparison of actigraphy to sleep logs for post-treatment sleep onset time (h) in patients with suspected or diagnosed CRSWD (intervention studies)
Figure S18 - Comparison of actigraphy to sleep logs for post-treatment sleep offset time (h) in patients with suspected or diagnosed CRSWD (intervention studies)

22
Table S5 – Summary of Findings table for actigraphy compared to sleep logs (all studies) for the assessment of sleep parameters in patients with suspected or diagnosed CRSWD References: Pickering 2014 (A) Outcomes Quality of the evidence
(GRADE) Absolute Difference Actigraphy vs Sleep logs
No of Participants (studies)
Sleep onset time* (see Figure S15)
⨁◯◯◯
VERY LOW a
The mean difference in sleep onset time measured by actigraphy as compared to sleep logs 0.3 hours later2 (0.8 earlier to 1.4 later)
15 (1 study) A
Sleep offset time* (see Figure S16)
⨁◯◯◯
VERY LOW a
The mean difference in sleep offset time measured by actigraphy as compared to sleep logs was 0.2 hours later2 (1.02 earlier to 0.62 later)
15 (1 study) A
* Critical Outcome a. 95% CI crosses the clinical significance threshold; very small sample size 1. Meets clinical significance threshold 2. Does not meet clinical significance threshold
Table S6 – Summary of Findings table for actigraphy compared to sleep logs (intervention studies) for the assessment of treatment response in patients with suspected or diagnosed CRSWD References: De Rui 2015 (A) Outcomes Quality of the evidence
(GRADE) Absolute Difference Actigraphy vs Sleep logs
No of Participants (studies)
Sleep-onset time* (see Figure S17)
⨁◯◯◯
VERY LOW a
The mean sleep-onset time measured by actigraphy was 0.6 hours earlier1 (0.07 to 1.13 hours earlier) as compared to sleep logs
5 (1 study) A
Sleep-offset time* (see Figure S18)
⨁◯◯◯
VERY LOW a
The mean sleep-offset time measured by actigraphy was 0.40 hours earlier1 (0.88 earlier to 0.08 later) as compared to sleep logs
5 (1 study) A
* Critical Outcome a. 95% CI crosses clinical significance threshold, and very small sample size 1. Meets clinical significance threshold 2. Does not meet clinical significance threshold
Circadian Rhythm Sleep Wake Disorders in Pediatric Populations Figure S19 - Comparison of actigraphy to sleep logs for baseline total sleep time (min) in pediatric patients with suspected or diagnosed CRSWD (all studies)

23
Figure S20 - Comparison of actigraphy to sleep logs for baseline sleep onset latency (min) in pediatric patients with suspected or diagnosed CRSWD (all studies)
Figure S21 - Comparison of actigraphy to sleep logs for baseline sleep onset (h) in pediatric patients with suspected or diagnosed CRSWDs (all studies)
Figure S22 - Comparison of actigraphy to sleep logs for baseline sleep offset (h) in pediatric patients with suspected or diagnosed CRSWDs (all studies)
Figure S23 - Comparison of actigraphy to sleep logs for post-treatment total sleep time (min) in pediatric patients with suspected or diagnosed CRSWD (intervention studies)

24
Figure S24 - Comparison of actigraphy to sleep logs for post-treatment sleep onset latency (min) in pediatric patients with suspected or diagnosed CRSWD (intervention studies)
Figure S25 - Comparison of actigraphy to sleep logs for post-treatment sleep onset (h) in pediatric patients with suspected or diagnosed CRSWDs (all studies)
Figure S26 - Comparison of actigraphy to sleep logs for post-treatment sleep offset (h) in pediatric patients with suspected or diagnosed CRSWDs (all studies)
Table S7 – Summary of Findings table for actigraphy compared to sleep logs (all studies) for the assessment of baseline sleep parameters in pediatric patients with suspected or diagnosed CRSWD References: Saxvig 2014 (A); Wasdell 2008 (B); van Maanen 2017 (C) Outcomes Quality of the evidence
(GRADE) Absolute Difference Actigraphy vs Sleep logs
No of Participants (studies)
TST* (see Figure S19)
⨁⨁◯◯
LOW a,b
The mean difference in TST measured by actigraphy was 47.5 minutes lower1 (30.5 lower to 73.1 lower) as compared to sleep logs
348 (3 studies) A-C
SOL* (see Figure S20)
⨁⨁◯◯
LOW a,b
The mean difference in SOL measured by actigraphy was 3.0 minutes lower2 (20.8 lower to 14.9 higher) as compared to sleep logs
164 (3 studies) A-C
Sleep onset (see Figure S21)
⨁◯◯◯
VERY LOW a,b The mean difference in Sleep onset measured by actigraphy was 0.0 hours earlier2 as compared to sleep logs
84 (1 study) C
Sleep offset (see Figure S22)
⨁◯◯◯
VERY LOW a,b The mean difference in Sleep offset measured by actigraphy was 1.4 hours earlier1 as compared to sleep logs
84 (1 study) C
* Critical Outcome a. Small sample size. b. 95% CI crosses clinical significance threshold 1. Meets clinical significance threshold 2. Does not meet clinical significance threshold

25
Table S8 – Summary of Findings table for actigraphy compared to sleep logs (intervention studies) for the assessment of treatment response in patients with suspected or diagnosed CRSWD References: Saxvig 2014 (A); van Maanen 2017 (B); Wasdell 2008 (C) Outcomes Quality of the evidence
(GRADE) Absolute Difference Actigraphy vs Sleep logs
No of Participants (studies)
TST* (see Figure S23)
⨁⨁◯◯
LOW a,b
The mean difference in TST measured by actigraphy was 52.7 minutes lower1 (20.8 lower to 84.5 lower) as compared to sleep logs
136 (3 studies) A-C
SOL* (see Figure S24)
⨁⨁◯◯
LOW a,b
The mean difference in SOL measured by actigraphy was 1.1 minutes lower2 (11.1 lower to 9.0 higher) as compared to sleep logs
136 (3 studies) A-C
Sleep onset (see Figure S25)
⨁◯◯◯
VERY LOW a,b The mean difference in Sleep onset measured by actigraphy was 0.0 hours earlier2 as compared to sleep logs
84 (1 study) D
Sleep offset (see Figure S26)
⨁◯◯◯
VERY LOW a,b The mean difference in Sleep offset measured by actigraphy was 1.7 hours earlier1 as compared to sleep logs
84 (1 study) D
* Critical Outcome a. 95% CI crosses clinical significance threshold. b. Small sample size. 1. Meets clinical significance threshold 2. Does not meet clinical significance threshold
Non-specific Sleep Disorders in Pediatric Populations Figure S27 - Comparison of actigraphy to sleep logs for baseline total sleep time (min) in pediatric patients with suspected non-specific sleep disorders (all studies)
Figure S28 - Comparison of actigraphy to sleep logs for baseline sleep onset latency (min) in pediatric patients with suspected non-specific sleep disorders (all studies)
Figure S29 - Comparison of actigraphy to sleep logs for post-treatment total sleep time (min) in pediatric patients with suspected non-specific sleep disorders (intervention studies)

26
Figure S30 - Comparison of actigraphy to sleep logs for post-treatment sleep onset latency (min) in pediatric patients with suspected non-specific sleep disorders (intervention studies)
Sleep Disordered Breathing in Adult Populations Figure S31 - Comparison of actigraphy to PSG for total sleep time (min) in patients with suspected or diagnosed sleep disordered breathing (all studies; non-RCTs)
*Note: Data provided by Kim 2013 for individual algorithms has been pooled into a single estimate Table S9 – Summary of Findings table for actigraphy compared to PSG (all studies) for the assessment of sleep parameters in patients with suspected or diagnosed sleep disordered breathing References: Choi 2017 (A); Elbaz 2002 (B); García-Díaz 2007 (C); Kim 2013 (D); Pallin 2014 (E); Sharif 2013 (F) Outcomes Quality of the evidence
(GRADE) Absolute Difference Actigraphy vs PSG
No of Participants (studies)
TST* (see Figure S31)
⨁⨁⨁◯
MODERATE a
The mean difference in TST measured by actigraphy as compared to PSG was 14.54 minutes1 higher (20.7 lower to 49.8 higher) The width of the 95% CI of the mean difference in TST measured by actigraphy as compared to PSG was 70.47 minutes2
367 (5 studies) A,B,D-F
Accuracy of AHI ⨁⨁◯◯
LOW b, c Sensitivity and specificity of AHI calculated with actigraphy-estimated TST in moderate to severe SDB cases ranged from 84%1-100%1 and 88%1-100%1, respectively.
186 (3 studies) B,C, E
* Critical Outcome a. 95% CI of exceeds limits b. Very small sample size c. Indirect comparison of HSAT with actigraphy vs PSG (instead of HSAT with and without actigraphy) 1. Within clinical significance limit 2. Exceeds clinical significance limit

27
Central Disorders of Hypersomnolence in Adult Populations Figure S32a - Comparison of actigraphy to sleep logs for total sleep time (min) the weeks prior to MSLT in patients with suspected or diagnosed hypersomnia (all studies; non-RCTs)
Figure S32b - Comparison of actigraphy to PSG for total sleep time (min) the night prior to MSLT in patients with suspected or diagnosed hypersomnia (all studies; non-RCTs)
Table S10a – Summary of Findings table for actigraphy compared to sleep logs (all studies) for the assessment of TST in weeks prior to MSLT in patients with suspected or diagnosed hypersomnia References: Bradshaw 2007 (A) Outcomes Quality of the evidence
(GRADE) Absolute Difference Actigraphy vs Sleep logs
No of Participants (studies)
TST* (see Figure S32a)
⨁⨁⨁◯
MODERATE a
The mean difference in TST measured by actigraphy was 86.0 minutes lower1 (113.6 to 58.4 minutes lower) as compared to sleep logs
54 (1 study) A
* Critical Outcome a. Imprecision due to small sample size 1. Meets clinical significance threshold

28
Table S10b – Summary of Findings table for actigraphy compared to PSG (all studies) for the assessment of sleep parameters in patients with suspected or diagnosed hypersomnia References: Bradshaw 2007 (A) Outcomes Quality of the evidence
(GRADE) Absolute Difference Actigraphy vs PSG
No of Participants (studies)
TST* (see Figure S32b)
⨁⨁⨁◯
MODERATE a
The mean difference in TST measured by actigraphy as compared to PSG was 15.6 minutes1 lower (40 lower to 9 higher) The width of the 95% CI of the mean difference in TST measured by actigraphy as compared to PSG was 49.4 minutes2
54 (1 study) A
* Critical Outcome a. 95% CI exceeds clinical exceeds clinical significance limit and small sample size 1. Meets clinical significance threshold
2. Exceeds clinical significance limit
Insufficient Sleep Syndrome in Adult Populations Figure S33 - Comparison of actigraphy to sleep logs for baseline total sleep time (min) in patients with risk of insufficient sleep syndrome (all studies)
Figure S34 - Comparison of actigraphy to sleep logs for post-treatment total sleep time (min) in patients with risk of insufficient sleep syndrome (intervention studies)

29
Table S11 – Summary of Findings table for actigraphy compared to sleep logs (all studies) for the assessment of baseline sleep parameters in patients with risk of insufficient sleep syndrome References: Barger 2014 (A); Fietze 2009 (B); Forberg (C); Gohar 2009 (D); Kim 2011 (E); Rose 2008 (F); Rosekind 2006 (G); Signal 2005 (H); Simons 2011 (I); Thorne 2008 (J) Outcomes Quality of the evidence
(GRADE) Absolute Difference Actigraphy vs Sleep logs
No of Participants (studies)
TST* (see Figure S33)
⨁⨁⨁⨁
HIGH
The mean difference in TST measured by actigraphy was 38.5 minutes lower1 (49.2 lower to 27.8 lower) as compared to sleep logs
371 (10 studies) A-J
* Critical Outcome 1. Meets clinical significance threshold 2. Does not meet clinical significance threshold
Table S12 – Summary of Findings table for actigraphy compared to sleep logs (intervention studies) for the assessment of treatment response in patients with risk of insufficient sleep syndrome References: Barger 2014 (A); Bjorvatn 2007 (B); Rosekind 2006 (C) Outcomes Quality of the evidence
(GRADE) Absolute Difference Actigraphy vs Sleep logs
No of Participants (studies)
TST* (see Figure S34)
⨁⨁◯◯
LOW a,b, c
The mean difference in TST measured by actigraphy ranged from 57.0 minutes lower to 38.0 minutes higher2 as compared to sleep logs
143 (3 studies) A-C
* Critical Outcome a. CI crosses the clinical significance threshold b. Imprecision due to small sample size c. Heterogeneity of the studies 1. Meets clinical significance threshold 2. Does not meet clinical significance threshold
PLMD Adult and Pediatric Populations Figure S35 - Comparison of actigraphy to PSG for periodic limb movement index (PLMI) in patients with suspected or diagnosed PLMD (all studies)

30
Table S13 – Summary of Findings table for actigraphy compared to PSG (all studies) for the assessment of periodic limb movements in patients with suspected or diagnosed periodic limb movement disorder References: Gschliesser 2009 (A); Kobayashi 2014 (B); Montgomery-Downs 2005 (C); Rogers 2012 (D); Sforza 2005 (E) Outcomes Quality of the evidence
(GRADE) Absolute Difference Actigraphy vs PSG
No of Participants (studies)
PLMI* (see Figure S35)
⨁⨁⨁◯
MODERATE a,b
The mean difference in PLMI measured by actigraphy as compared to EMG ranged from 3.5 lower1 to 26.6 higher2 for adults, and was 2.85 higher2 for pediatric patients The width of the 95% CIs of the mean difference in PLMI measured by actigraphy as compared to PSG range from 27.52 to 58.142 for adults, and was 3.542 for pediatric patients
175 (4 studies) A,B,C,E
Accuracy of PLMSI ⨁⨁⨁◯
MODERATE b Sensitivity and specificity of PLMSI calculated with actigraphy ranged from 82.4-100%1 and 8-70.8%2, respectively.
61 (2 studies) B,D
* Critical Outcome a. 95% CI exceeds clinical exceeds clinical significance limit b. Small sample size 1. Within clinical significance limit 2. Exceeds clinical significance limit