

Content gap analysis for SEO - Digital Olympus 2016
27
Content gap analysis for SEO Stephen Kenwright @stekenwright @Branded_3
Transcript of Content gap analysis for SEO - Digital Olympus 2016
Content gap analysis for SEO
Stephen Kenwright@stekenwright @Branded_3
“~80% of B2C marketers plan to produce more content in 2016…regardless of effectiveness [or]
clarity of success.”
Source: Content Marketing Institute
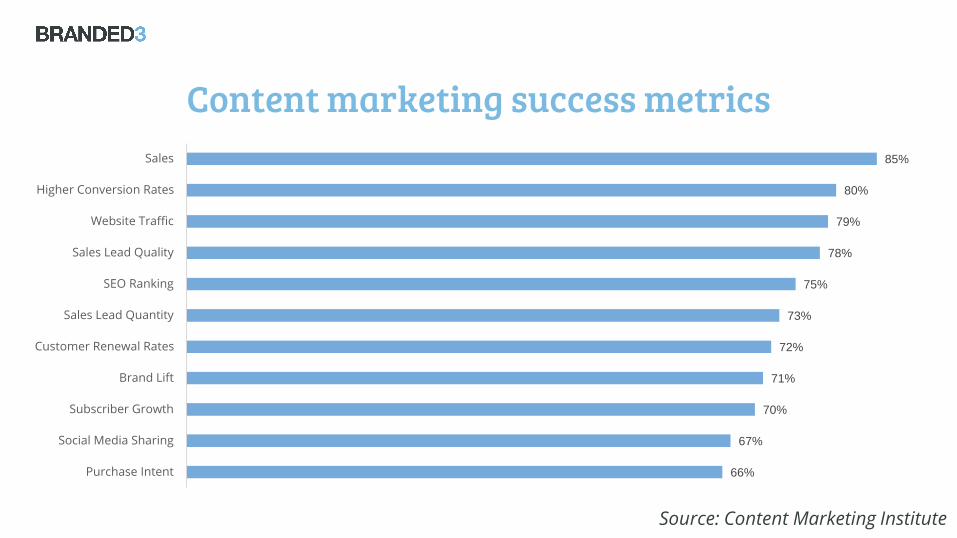
Source: Content Marketing Institute
85%
80%
79%
78%
75%
73%
72%
71%
70%
67%
66%
Sales
Higher Conversion Rates
Website Traffic
Sales Lead Quality
SEO Ranking
Sales Lead Quantity
Customer Renewal Rates
Brand Lift
Subscriber Growth
Social Media Sharing
Purchase Intent
Content marketing success metrics
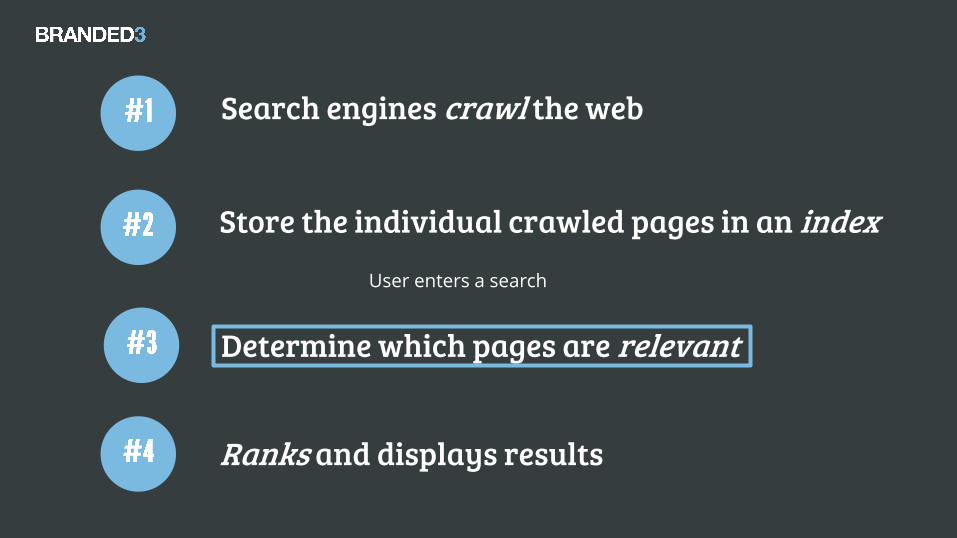
Search engines crawl the web
Store the individual crawled pages in an index
Determine which pages are relevant
User enters a search
Ranks and displays results
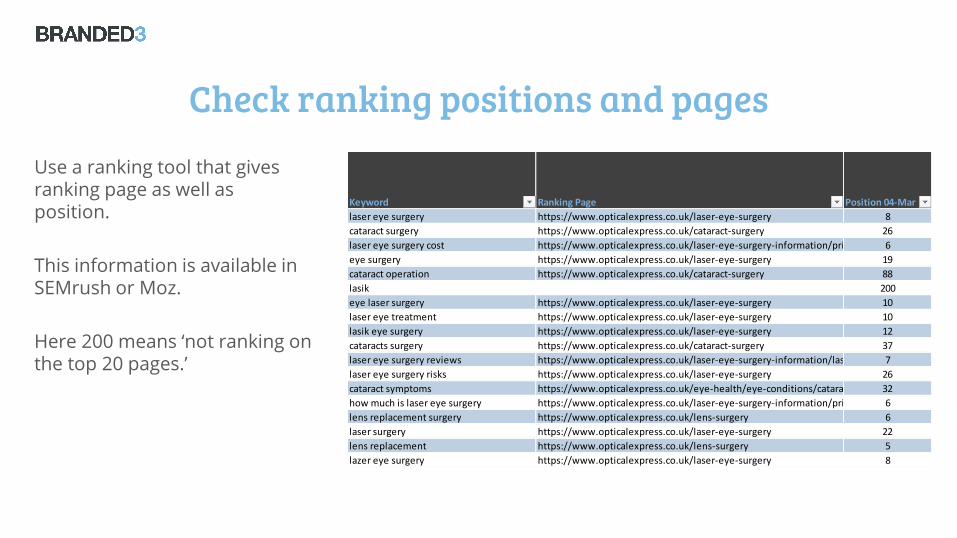
Check ranking positions and pagesUse a ranking tool that gives ranking page as well as position.
This information is available in SEMrush or Moz.
Here 200 means ‘not ranking on the top 20 pages.’
Keyword Ranking Page Position 04-Mar
laser eye surgery https://www.opticalexpress.co.uk/laser-eye-surgery 8
cataract surgery https://www.opticalexpress.co.uk/cataract-surgery 26
laser eye surgery cost https://www.opticalexpress.co.uk/laser-eye-surgery-information/prices-and-finance6
eye surgery https://www.opticalexpress.co.uk/laser-eye-surgery 19
cataract operation https://www.opticalexpress.co.uk/cataract-surgery 88
lasik 200
eye laser surgery https://www.opticalexpress.co.uk/laser-eye-surgery 10
laser eye treatment https://www.opticalexpress.co.uk/laser-eye-surgery 10
lasik eye surgery https://www.opticalexpress.co.uk/laser-eye-surgery 12
cataracts surgery https://www.opticalexpress.co.uk/cataract-surgery 37
laser eye surgery reviews https://www.opticalexpress.co.uk/laser-eye-surgery-information/laser-eye-surgery-reviews7
laser eye surgery risks https://www.opticalexpress.co.uk/laser-eye-surgery 26
cataract symptoms https://www.opticalexpress.co.uk/eye-health/eye-conditions/cataracts 32
how much is laser eye surgery https://www.opticalexpress.co.uk/laser-eye-surgery-information/prices-and-finance6
lens replacement surgery https://www.opticalexpress.co.uk/lens-surgery 6
laser surgery https://www.opticalexpress.co.uk/laser-eye-surgery 22
lens replacement https://www.opticalexpress.co.uk/lens-surgery 5
lazer eye surgery https://www.opticalexpress.co.uk/laser-eye-surgery 8
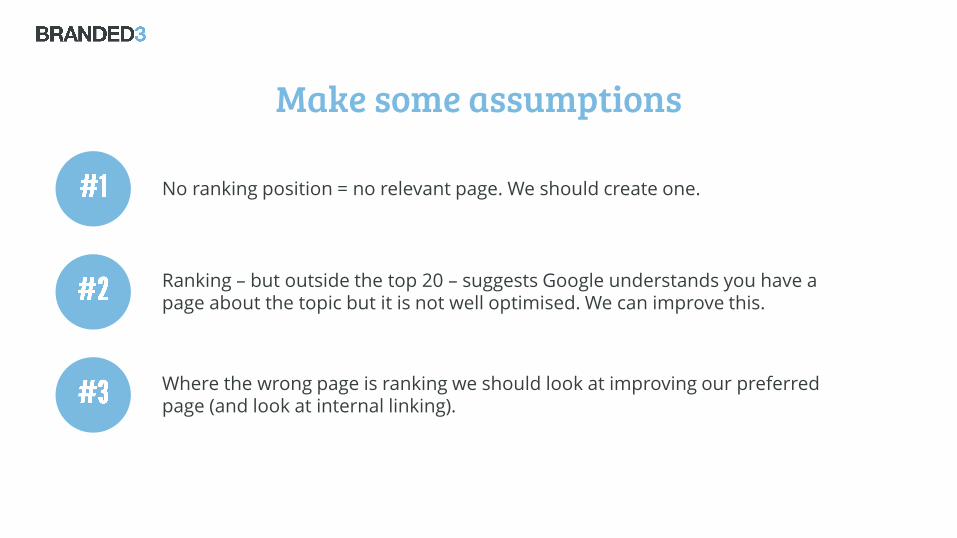
Make some assumptions
No ranking position = no relevant page. We should create one.
Ranking – but outside the top 20 – suggests Google understands you have a page about the topic but it is not well optimised. We can improve this.
Where the wrong page is ranking we should look at improving our preferred page (and look at internal linking).
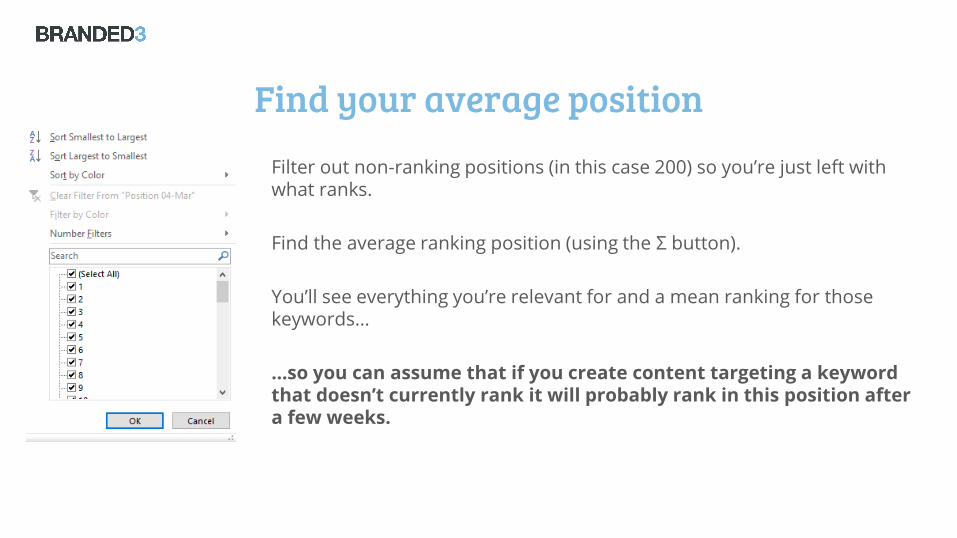
Find your average positionFilter out non-ranking positions (in this case 200) so you’re just left with what ranks.
Find the average ranking position (using the Σ button).
You’ll see everything you’re relevant for and a mean ranking for those keywords…
…so you can assume that if you create content targeting a keyword that doesn’t currently rank it will probably rank in this position after a few weeks.
Do the same with competitors (using the same keywords) to demonstrate the authority of their
content vs. your own.
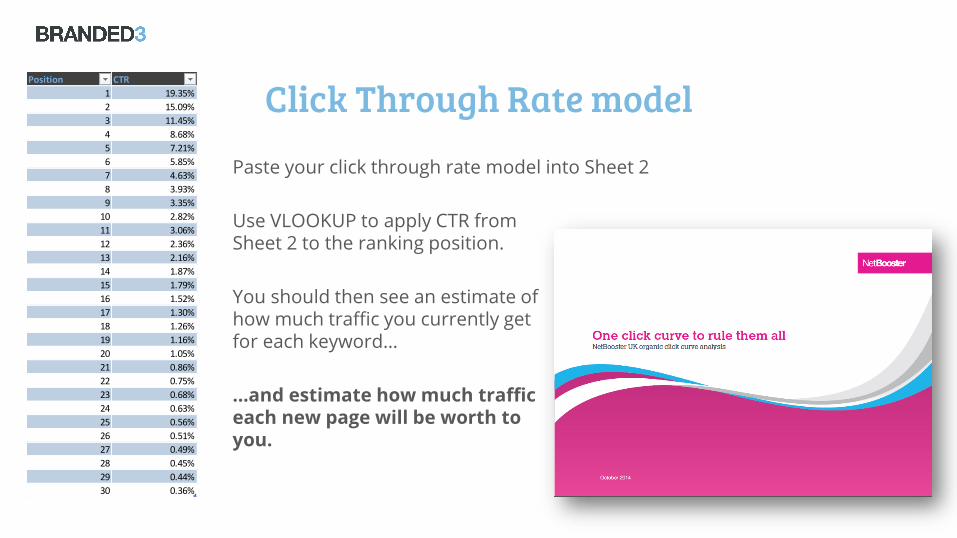
Click Through Rate modelPaste your click through rate model into Sheet 2
Use VLOOKUP to apply CTR fromSheet 2 to the ranking position.
You should then see an estimate ofhow much traffic you currently get for each keyword…
…and estimate how much trafficeach new page will be worth toyou.
Position CTR
1 19.35%
2 15.09%
3 11.45%
4 8.68%
5 7.21%
6 5.85%
7 4.63%
8 3.93%
9 3.35%
10 2.82%
11 3.06%
12 2.36%
13 2.16%
14 1.87%
15 1.79%
16 1.52%
17 1.30%
18 1.26%
19 1.16%
20 1.05%
21 0.86%
22 0.75%
23 0.68%
24 0.63%
25 0.56%
26 0.51%
27 0.49%
28 0.45%
29 0.44%
30 0.36%
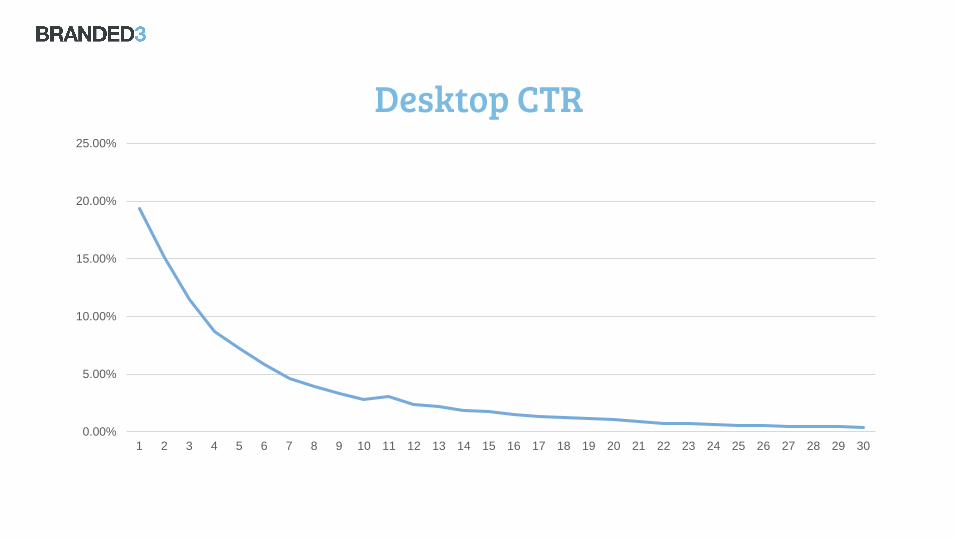
0.00%
5.00%
10.00%
15.00%
20.00%
25.00%
1 2 3 4 5 6 7 8 9 10 11 12 13 14 15 16 17 18 19 20 21 22 23 24 25 26 27 28 29 30
Desktop CTR
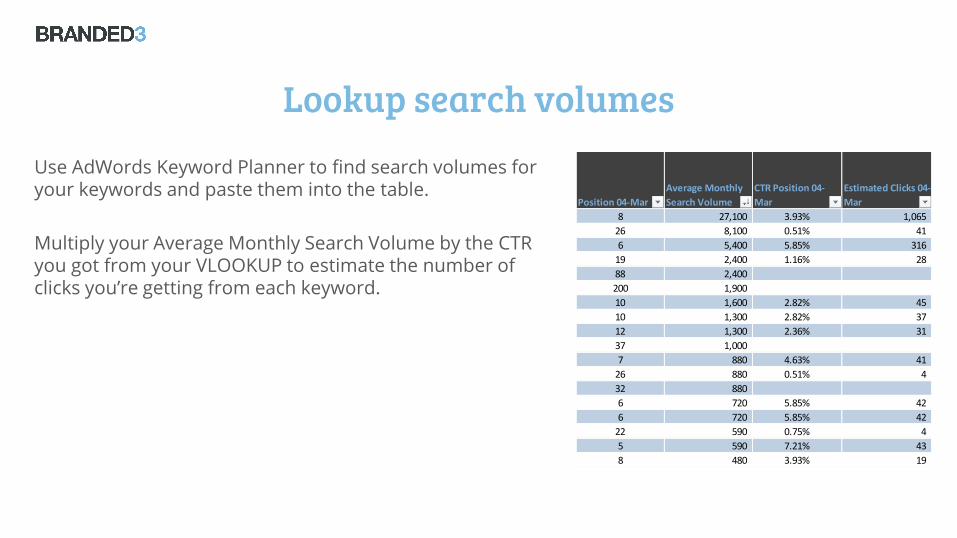
Lookup search volumesUse AdWords Keyword Planner to find search volumes for your keywords and paste them into the table.
Multiply your Average Monthly Search Volume by the CTR you got from your VLOOKUP to estimate the number of clicks you’re getting from each keyword.
Position 04-Mar
Average Monthly
Search Volume
CTR Position 04-
Mar
Estimated Clicks 04-
Mar
8 27,100 3.93% 1,065
26 8,100 0.51% 41
6 5,400 5.85% 316
19 2,400 1.16% 28
88 2,400
200 1,900
10 1,600 2.82% 45
10 1,300 2.82% 37
12 1,300 2.36% 31
37 1,000
7 880 4.63% 41
26 880 0.51% 4
32 880
6 720 5.85% 42
6 720 5.85% 42
22 590 0.75% 4
5 590 7.21% 43
8 480 3.93% 19
If your business is particularly seasonal do this several times – once with each month’s search
volume (e.g. Jan and Feb for typical travel sites)
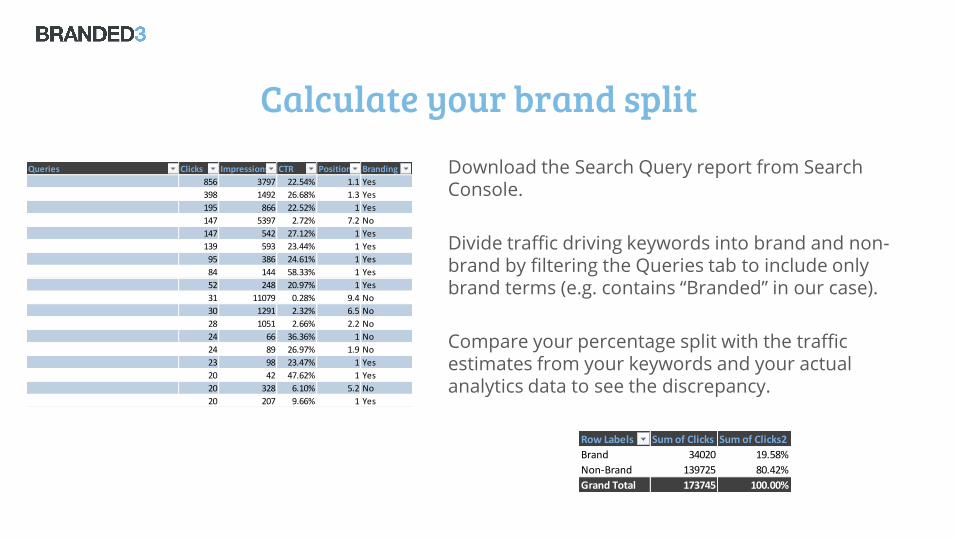
Calculate your brand splitDownload the Search Query report from Search Console.
Divide traffic driving keywords into brand and non-brand by filtering the Queries tab to include only brand terms (e.g. contains “Branded” in our case).
Compare your percentage split with the traffic estimates from your keywords and your actual analytics data to see the discrepancy.
Queries Clicks Impressions CTR Position Branding
856 3797 22.54% 1.1 Yes
398 1492 26.68% 1.3 Yes
195 866 22.52% 1 Yes
147 5397 2.72% 7.2 No
147 542 27.12% 1 Yes
139 593 23.44% 1 Yes
95 386 24.61% 1 Yes
84 144 58.33% 1 Yes
52 248 20.97% 1 Yes
31 11079 0.28% 9.4 No
30 1291 2.32% 6.5 No
28 1051 2.66% 2.2 No
24 66 36.36% 1 No
24 89 26.97% 1.9 No
23 98 23.47% 1 Yes
20 42 47.62% 1 Yes
20 328 6.10% 5.2 No
20 207 9.66% 1 Yes
Row Labels Sum of Clicks Sum of Clicks2
Brand 34020 19.58%
Non-Brand 139725 80.42%
Grand Total 173745 100.00%
If your brand split/non-brand keyword traffic estimates don’t add up you need to be more
comprehensive with your keyword research.
0
50,000
100,000
150,000
200,000
250,000
300,000
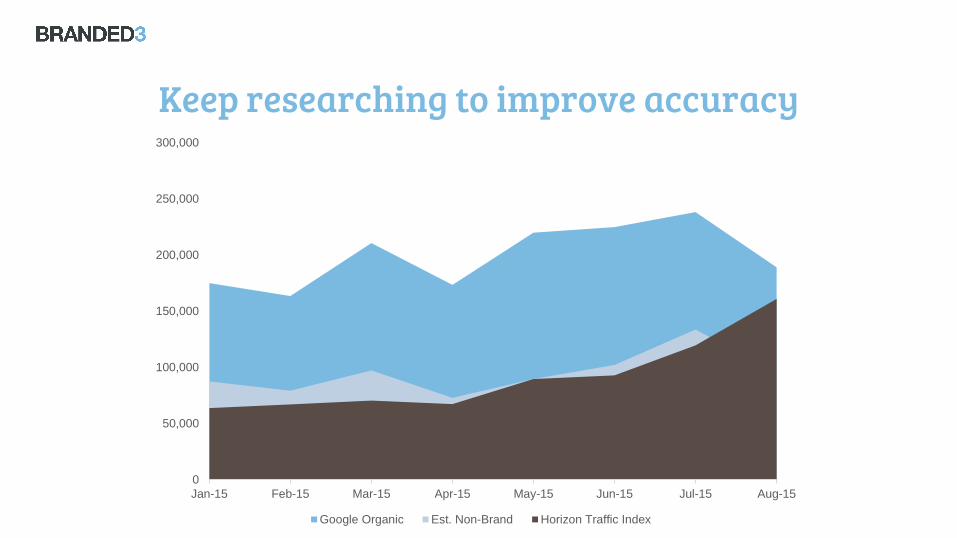
Jan-15 Feb-15 Mar-15 Apr-15 May-15 Jun-15 Jul-15 Aug-15
Google Organic Est. Non-Brand Horizon Traffic Index
Keep researching to improve accuracy
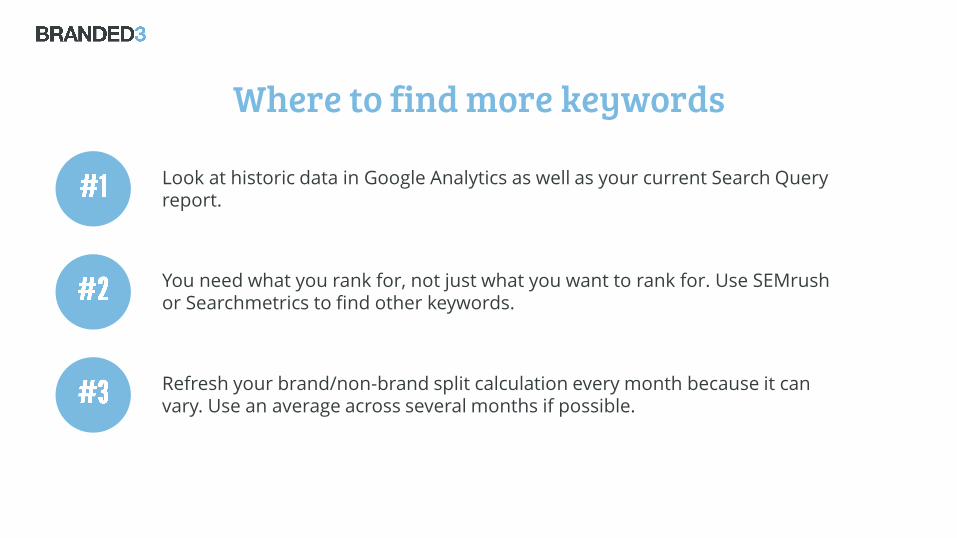
Where to find more keywords
Look at historic data in Google Analytics as well as your current Search Query report.
You need what you rank for, not just what you want to rank for. Use SEMrush or Searchmetrics to find other keywords.
Refresh your brand/non-brand split calculation every month because it can vary. Use an average across several months if possible.
Average
Conversion Rate Enquiries
Enquiry-to-
Conversion Rate Conversions AOV
Estimated Non-
Brand Organic
Revenue
2.00% 21 2.00% 0 £500.00 £213.01
2.00% 1 2.00% 0 £500.00 £8.26
2.00% 6 2.00% 0 £500.00 £63.18
2.00% 1 2.00% 0 £500.00 £5.57
2.00% 0 2.00% 0 £500.00 £0.00
2.00% 0 2.00% 0 £500.00 £0.00
2.00% 1 2.00% 0 £500.00 £9.02
2.00% 1 2.00% 0 £500.00 £7.33
2.00% 1 2.00% 0 £500.00 £6.14
2.00% 0 2.00% 0 £500.00 £0.00
2.00% 1 2.00% 0 £500.00 £8.15
2.00% 0 2.00% 0 £500.00 £0.90
2.00% 0 2.00% 0 £500.00 £0.00
2.00% 1 2.00% 0 £500.00 £8.42
2.00% 1 2.00% 0 £500.00 £8.42
2.00% 0 2.00% 0 £500.00 £0.89
2.00% 1 2.00% 0 £500.00 £8.51
2.00% 0 2.00% 0 £500.00 £3.77
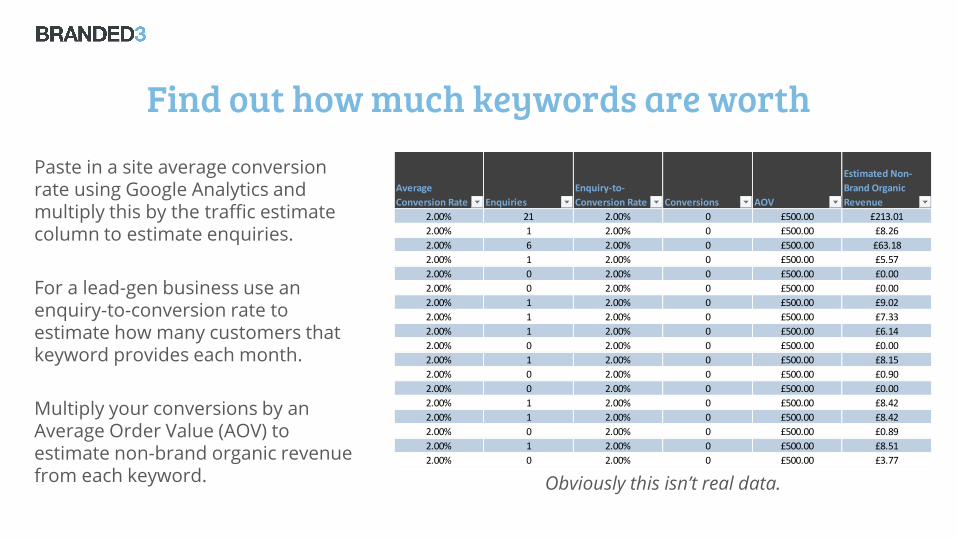
Find out how much keywords are worthPaste in a site average conversion rate using Google Analytics and multiply this by the traffic estimate column to estimate enquiries.
For a lead-gen business use an enquiry-to-conversion rate to estimate how many customers that keyword provides each month.
Multiply your conversions by an Average Order Value (AOV) to estimate non-brand organic revenue from each keyword. Obviously this isn’t real data.
If you’re looking for gaps in a certain product (e.g. “car insurance”) use your conversion rate/AOV for
that specific product for accurate projections.
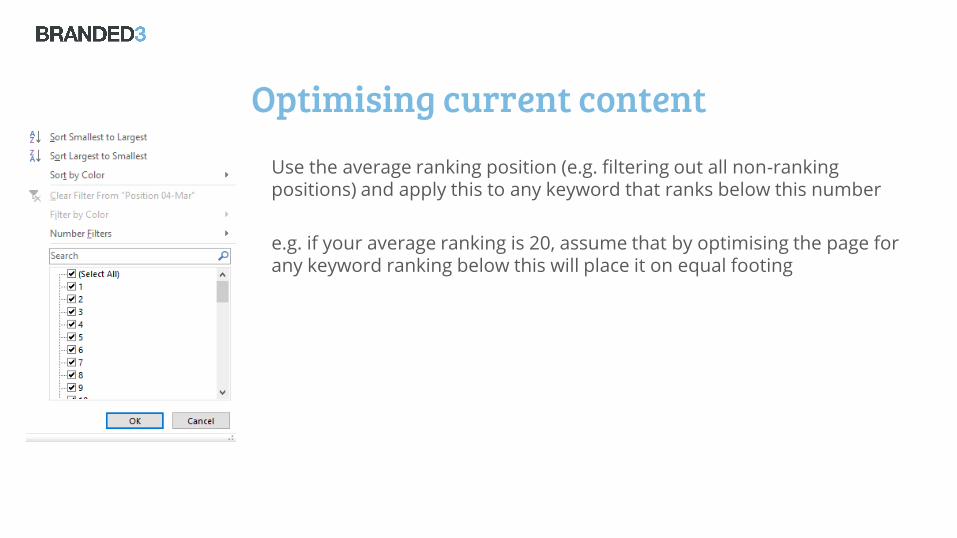
Optimising current contentUse the average ranking position (e.g. filtering out all non-ranking positions) and apply this to any keyword that ranks below this number
e.g. if your average ranking is 20, assume that by optimising the page for any keyword ranking below this will place it on equal footing
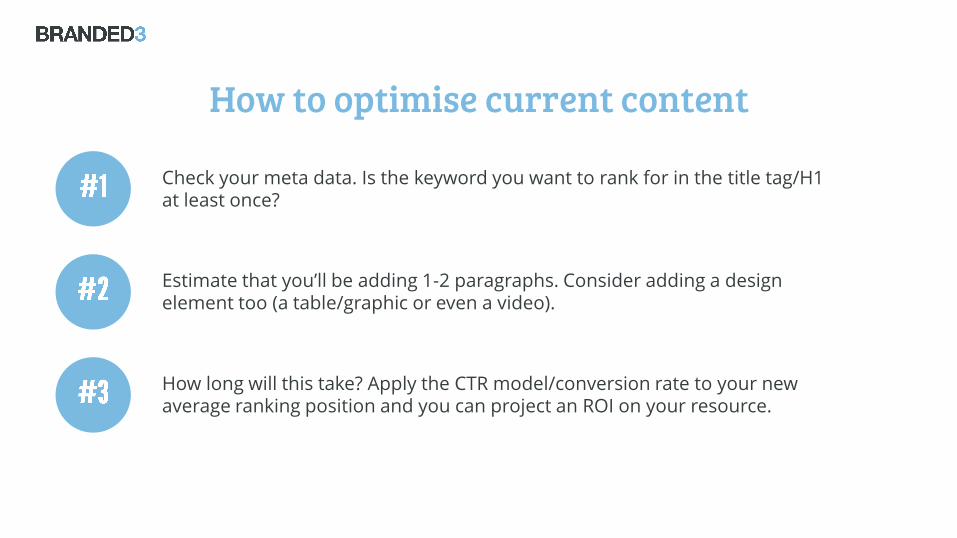
How to optimise current content
Check your meta data. Is the keyword you want to rank for in the title tag/H1 at least once?
Estimate that you’ll be adding 1-2 paragraphs. Consider adding a design element too (a table/graphic or even a video).
How long will this take? Apply the CTR model/conversion rate to your new average ranking position and you can project an ROI on your resource.
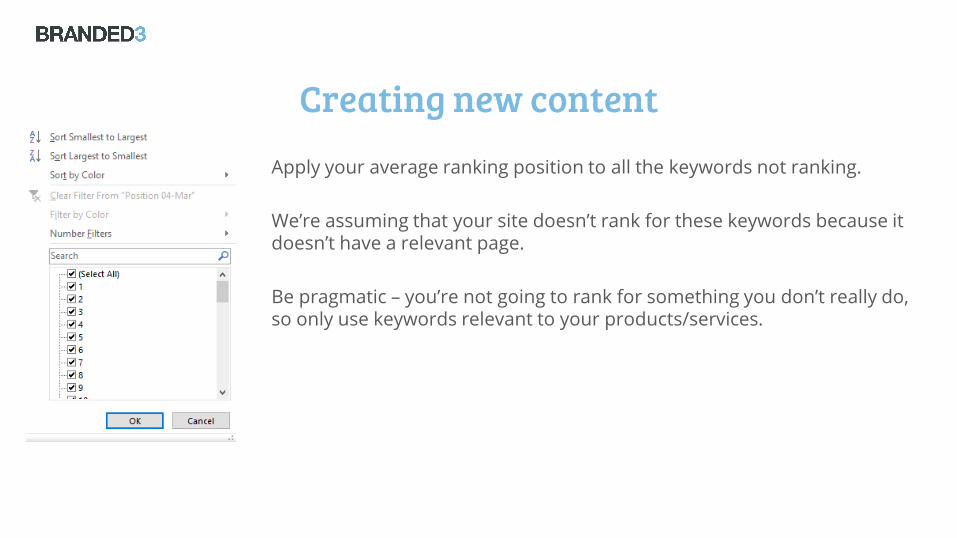
Creating new contentApply your average ranking position to all the keywords not ranking.
We’re assuming that your site doesn’t rank for these keywords because it doesn’t have a relevant page.
Be pragmatic – you’re not going to rank for something you don’t really do, so only use keywords relevant to your products/services.
Creating new content
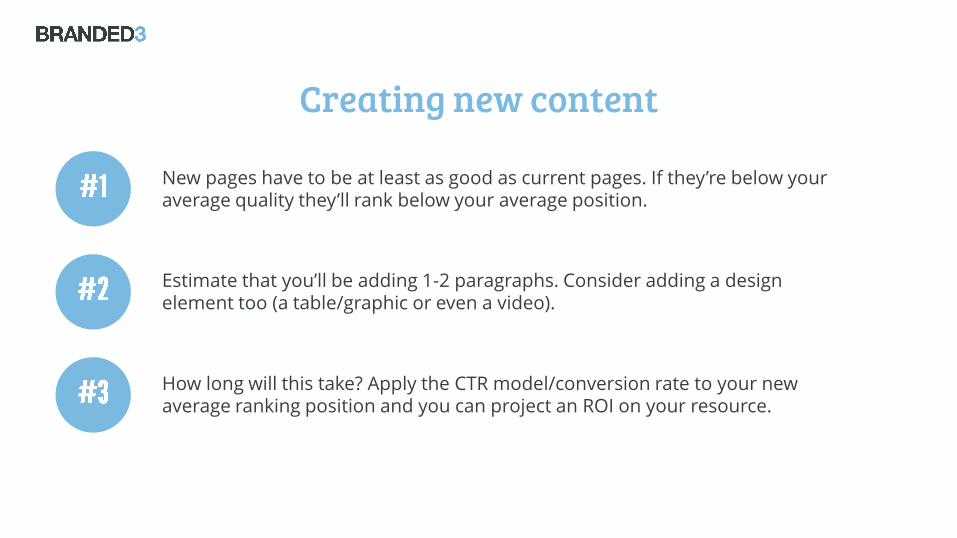
New pages have to be at least as good as current pages. If they’re below your average quality they’ll rank below your average position.
Estimate that you’ll be adding 1-2 paragraphs. Consider adding a design element too (a table/graphic or even a video).
How long will this take? Apply the CTR model/conversion rate to your new average ranking position and you can project an ROI on your resource.

I’m showing you how to make something average because your current page is below your average.
It’s up to you if you can make it awesome.
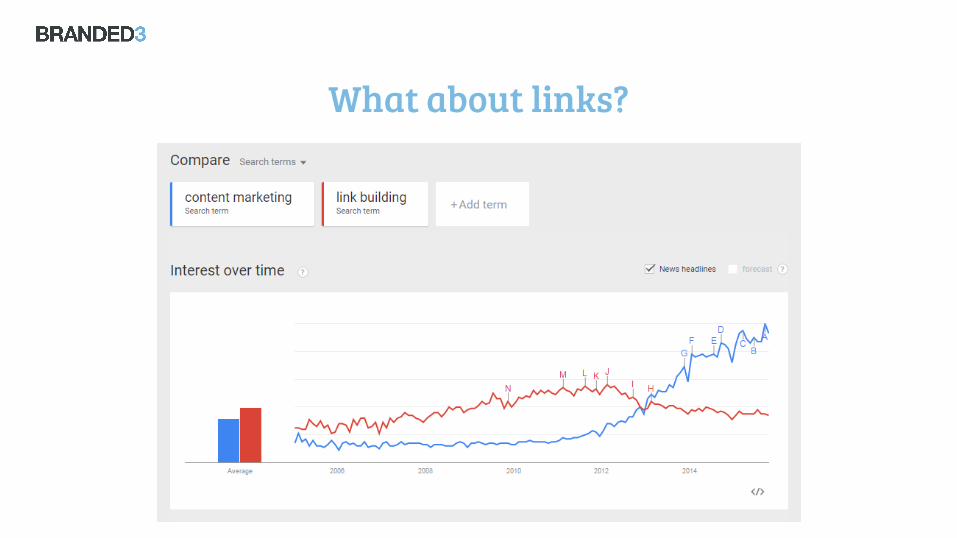
What about links?
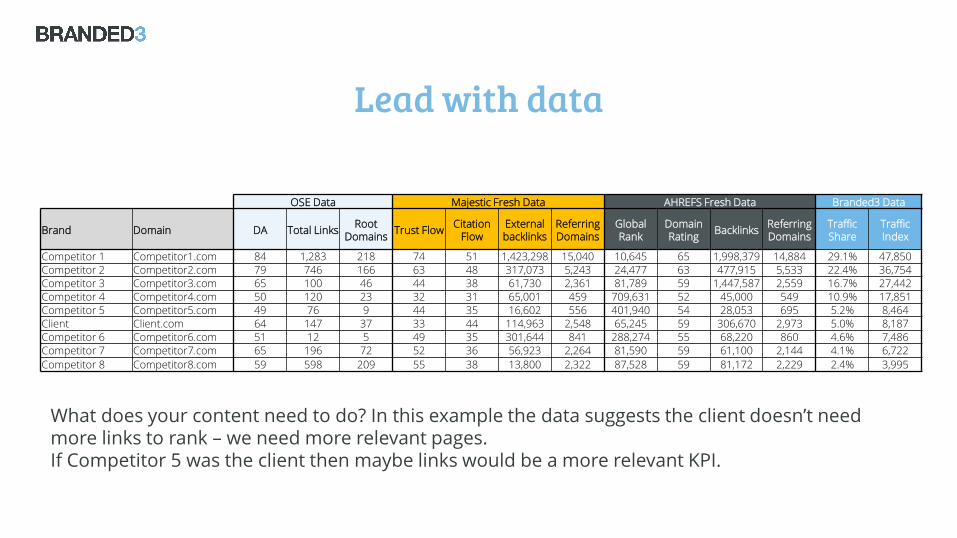
OSE Data Majestic Fresh Data AHREFS Fresh Data Branded3 Data
Brand Domain DA Total LinksRoot
DomainsTrust Flow
Citation Flow
External backlinks
Referring Domains
Global Rank
Domain Rating
BacklinksReferring Domains
Traffic Share
Traffic Index
Competitor 1 Competitor1.com 84 1,283 218 74 51 1,423,298 15,040 10,645 65 1,998,379 14,884 29.1% 47,850
Competitor 2 Competitor2.com 79 746 166 63 48 317,073 5,243 24,477 63 477,915 5,533 22.4% 36,754
Competitor 3 Competitor3.com 65 100 46 44 38 61,730 2,361 81,789 59 1,447,587 2,559 16.7% 27,442
Competitor 4 Competitor4.com 50 120 23 32 31 65,001 459 709,631 52 45,000 549 10.9% 17,851
Competitor 5 Competitor5.com 49 76 9 44 35 16,602 556 401,940 54 28,053 695 5.2% 8,464Client Client.com 64 147 37 33 44 114,963 2,548 65,245 59 306,670 2,973 5.0% 8,187
Competitor 6 Competitor6.com 51 12 5 49 35 301,644 841 288,274 55 68,220 860 4.6% 7,486
Competitor 7 Competitor7.com 65 196 72 52 36 56,923 2,264 81,590 59 61,100 2,144 4.1% 6,722
Competitor 8 Competitor8.com 59 598 209 55 38 13,800 2,322 87,528 59 81,172 2,229 2.4% 3,995
Lead with data
What does your content need to do? In this example the data suggests the client doesn’t need more links to rank – we need more relevant pages.If Competitor 5 was the client then maybe links would be a more relevant KPI.
Use the right KPIs, not all the KPIs.