CONTEMPORARY MUSKELLUNGE GENETIC RESOURCES IN …
132
CONTEMPORARY MUSKELLUNGE GENETIC RESOURCES IN NORTHERN WISCONSIN: IMPACTS OF SUPPLEMENTAL STOCKING AND GENETIC MANAGEMENT ZONES by Edward Lancaster Murphy A Thesis submitted in partial fulfillment of the requirements of the degree of MASTER OF SCIENCE IN NATURAL RESOURCES (FISHERIES) College of Natural Resources UNIVERSITY OF WISCONSIN Stevens Point, Wisconsin
Transcript of CONTEMPORARY MUSKELLUNGE GENETIC RESOURCES IN …

CONTEMPORARY MUSKELLUNGE GENETIC RESOURCES IN NORTHERN
WISCONSIN: IMPACTS OF SUPPLEMENTAL STOCKING AND GENETIC
MANAGEMENT ZONES
by
Edward Lancaster Murphy
A Thesis
submitted in partial fulfillment of the
requirements of the degree of
MASTER OF SCIENCE
IN
NATURAL RESOURCES (FISHERIES)
College of Natural Resources
UNIVERSITY OF WISCONSIN
Stevens Point, Wisconsin

APPROVED BY THE GRADUATE COMMITTEE OF
Dr. Brian L. Sloss (Chair) Wisconsin Cooperative Fishery Research Unit
College of Natural Resources University of Wisconsin- !evens Point
Stevens Point 5 481
Wisconsin ooperative Fishery Research Unit College of Natural Resources
University of Wisconsin- Stevens Point Stevens Point, WI 54481
Dr. Eri~ Anderson College of Natural Resources
University of Wisconsin - Stevens Point Stevens Point, WI 54481
~y-~/1 Dr. Martin J. Jennings
Wisconsin Department of Natural Resources 810 W Maple Street Spooner, WI 54801
11

iii
ABSTRACT
Since the 1930s, muskellunge (Esox masquinongy) have been propagated
extensively in Wisconsin as part of a comprehensive management plan aimed at
providing a range of angling opportunities including trophy fisheries. Concerns exist
about the effects of propagation on the genetic integrity of Wisconsin’s muskellunge
populations. Understanding and delineating contemporary stock structure is a
prerequisite to refining propagation practices by selecting appropriate brood sources and
defining operational management units to meet the goal of conserving muskellunge
genetic integrity. The objectives of this study are to: 1) evaluate the temporal genetic
dynamics of the Lac Courte Oreilles (LCO) muskellunge population to determine if two
stocking events disrupted the genetic integrity of the population, and 2) determine if
genetic population structuring occurs among muskellunge populations in northern
Wisconsin and to provide an initial genetic stock model including measures of the degree
of stock isolation.
Archived scale and spine samples from LCO, Big Spider Lake, and Mud-Callahan
Lake were used to assess temporal changes in the LCO population following stocking of
Big Spider Lake and Mud-Callahan Lake muskellunge (perceived small growth strain
fish) into LCO. Significant genetic differences between the three populations were
discerned yet no significant changes in LCO attributable to mixing of exogenous genes
were observed over a 50-year timeframe (1953-2003). These findings suggest no
significant impact of the two stocking events occurred in the genetic integrity of LCO
muskellunge.

iv
Twenty-four naturally recruiting and presumed native muskellunge populations
with limited to no stocking history were genetically characterized at 14 microsatellite
loci. Genetic stock identification, employing a hierarchical approach of cluster analyses
and analysis of molecular variance (AMOVA), was used to delineate groupings of
populations corresponding to genetic stocks and/or genetic management units. Basic
diversity measures showed high levels of genetic variance between populations. The
populations used in this study revealed significant genetic structure loosely corresponding
to two major watersheds of Wisconsin: Wisconsin River and Chippewa River. The
inclusion of additional populations outside these two watersheds showed that the
structure was an approximate east/west geographic split. AMOVA tests showed little
genetic significance between the currently employed management zones and the observed
distribution of genetic diversity in muskellunge. The observed genetic structure is most
likely explained by natural processes and muskellunge life history such as genetic drift,
small population size, and low survival rates of stocked muskellunge.

v
ACKNOWLEDGEMENTS
I would like to thank the members of my committee for their help, insight and
support through this process. This research was funded by the Wisconsin Department of
Natural Resources through the Sportfish Restoration Fund. I would like to thank the
Wisconsin Department of Natural Resources personnel for collecting the samples for this
project and teaching me to fyke net, especially Jeff Kampa and Steve Avelallemant. I
would like to thank my fellow UWSP graduate students (Lauren Williamson, Andrea
Musch, Ryan Franckowiak, Josh Raabe, Mike Hughes, Justin Vandehey, Jeremy
Hammen, Ben Mann, Luke Roffler, Ben Cross, and Rachel Koehler) for all their help and
friendship while at Stevens Point. I would like to thank my family and friends. Thank all
of you for your support, understanding, and patience. I truly could not have done it
without you.

vi
TABLE OF CONTENTS
TITLE PAGE ....................................................................................................................... i
COMMITTEE SIGNATURES ........................................................................................... ii
ABSTRACT ....................................................................................................................... iii
ACKNOWLEDGEMENTS .................................................................................................v
TABLE OF CONTENTS ................................................................................................... vi
LIST OF TABLES ............................................................................................................. ix
LIST OF FIGURES .............................................................................................................x
LIST OF APPENDICES ................................................................................................... xii
GENERAL INTRODUCTION ............................................................................................1
Literature Review .......................................................................................................3
Life history ...................................................................................................3
Taxonomy and intraspecific variation .........................................................7
Muskellunge management in Wisconsin ....................................................10
Muskellunge management and genetic resources ......................................15
LITERATURE CITED ......................................................................................................22
CHAPTER 1: TEMPORAL GENETIC INTEGRITY OF LAC COURTE OREILLES’
MUSKELLUNGE POPULATION: IMPLICATIONS FOR MUSKELLUNGE
MANAGEMENT PRACTICES
ABSTRACT ..................................................................................................................33
INTRODUCTION ........................................................................................................35
METHODS ...................................................................................................................38
Study Site ..................................................................................................................38
Study Design ............................................................................................................38
Lab Methods.............................................................................................................40

vii
Statistical Analysis ...................................................................................................41
Basic diversity measures ............................................................................41 Measures of intrapopulation genetic diversity 23
Population differentiation ..........................................................................41
RESULTS .....................................................................................................................43
Basic Diversity Measures ........................................................................................43
Evaluation of Stocking Events .................................................................................43
The 1956 Spider Lake stocking event.........................................................43
The 1980s Mud-Callahan Lake stocking event ..........................................43
Lac Courte Oreilles genetic stability from 1950 to present .......................44
DISCUSSION ..............................................................................................................45
LITERATURE CITED ................................................................................................50
CHAPTER 2: GENETIC STOCK IDENTIFICATION OF MUSKELLUNGE IN
NORTHERN WISCONSIN
ABSTRACT ..................................................................................................................64
INTRODUCTION ........................................................................................................66
METHODS ...................................................................................................................70
Study Area and Sampling Design ............................................................................70
Genetic Analysis.......................................................................................................71
Statistical Analysis ...................................................................................................72
Usefulness of markers ................................................................................72
Genetic stock identification........................................................................73
Potential influences of stocked populations ...............................................76
Test of contemporary management units ...................................................76
RESULTS .....................................................................................................................77
Usefulness of the Markers ........................................................................................77
Genetic Stock Identification ....................................................................................78
Tests of Contemporary Units ...................................................................................80
DISCUSSION ..............................................................................................................81
Usefulness of the Markers ........................................................................................81
Genetic Structure of Muskellunge in Wisconsin ......................................................83

viii
Management Implication .........................................................................................88
Future Research .......................................................................................................89
LITERATURE CITED ................................................................................................91

ix
LIST OF TABLES
CHAPTER 1
Table 1. Microsatellite loci used in the current study and description of primer size
range, and number of alleles for each locus (Sloss et al. 2008) ..........................55
Table 2. Descriptive statistics for all sampled populations including sample size (n),
number of loci genotyped (Loci), unbiased heterozygosity (He) and standard
deviation (He SD), observed heterozygosity (Ho) and standard deviation (Ho
SD), and allelic richness (Ar) ..............................................................................56
Table 3. Genic differentiation p-values for all temporal pairwise comparisons ...............57
Table 4. Pairwise FST values (above diagonal) and their corresponding p-values (below
diagonal) for all temporal pairwise comparisons. ...............................................58
CHAPTER 2
Table 1. Microsatellite loci used in the current study and description of primer sequence,
size range, and number of alleles for each locus (Sloss et al 2008) ....................97
Table 2. Class 1 and Class 2 populations listed with county, class and last stocking date
according to the WDNR fish stocking database. Classes are based on
reproductive status of the population: 0 = unknown recruitment, 1 = natural
recruitment, 2 = natural recruitment with additional stocking, 3 = no natural
recruitment ..........................................................................................................98
Table 3. Population statistics for all 24 sampled populations including sample size (N),
number of loci genotyped (Loci), unbiased heterozygosity (He) and standard
deviation (He SD), observed heterozygosity (Ho) and standard deviation (Ho
SD), and allelic richness (Ar). .............................................................................99
Table 4. Population pairwise comparison of allele frequency distributions across all loci.
The genic differentiation p-value is below the diagonal and the FST values are
above the diagonal. Bold values are values that were significant after sequential
Bonferroni correction (Rice 1989) ....................................................................100
Table 5. Analysis of molecular variance groupings, sum of squares, percent variation,
and p-values. GIS approach used was based on the topography of the
phylogenetic tree. The first two group AMOVA (a) showed the highest among-
group variation. Subsequent AMOVA tests (b), (c), and (d) failed to yield
higher among-group variation...........................................................................102
Table 6. AMOVA groupings, sum of squares, percent variation, and p-values of the
current management units (Group 1 = Upper Chippewa; Group 2 = Lake
Superior; Group 3 = Upper Wisconsin; Group 4 = Green Bay) .......................106

x
LIST OF FIGURES
GENERAL INTRODUCTION
Figure 1. Native range of muskellunge in Wisconsin according to Becker (1983) ..........29
Figure 2. Three hatcheries involved with muskellunge propagation in Wisconsin and
their relative location in the state. (1) Governor Tommy G. Thompson State
Fish Hatchery, (2) Art Oehmcke State Fish Hatchery, and (3) Wild Rose State
Fish Hatchery. ...................................................................................................30
Figure 3. Current genetic management zones suggested by Fields et al. (1997) based
partially on allozyme and mtDNA data .............................................................31
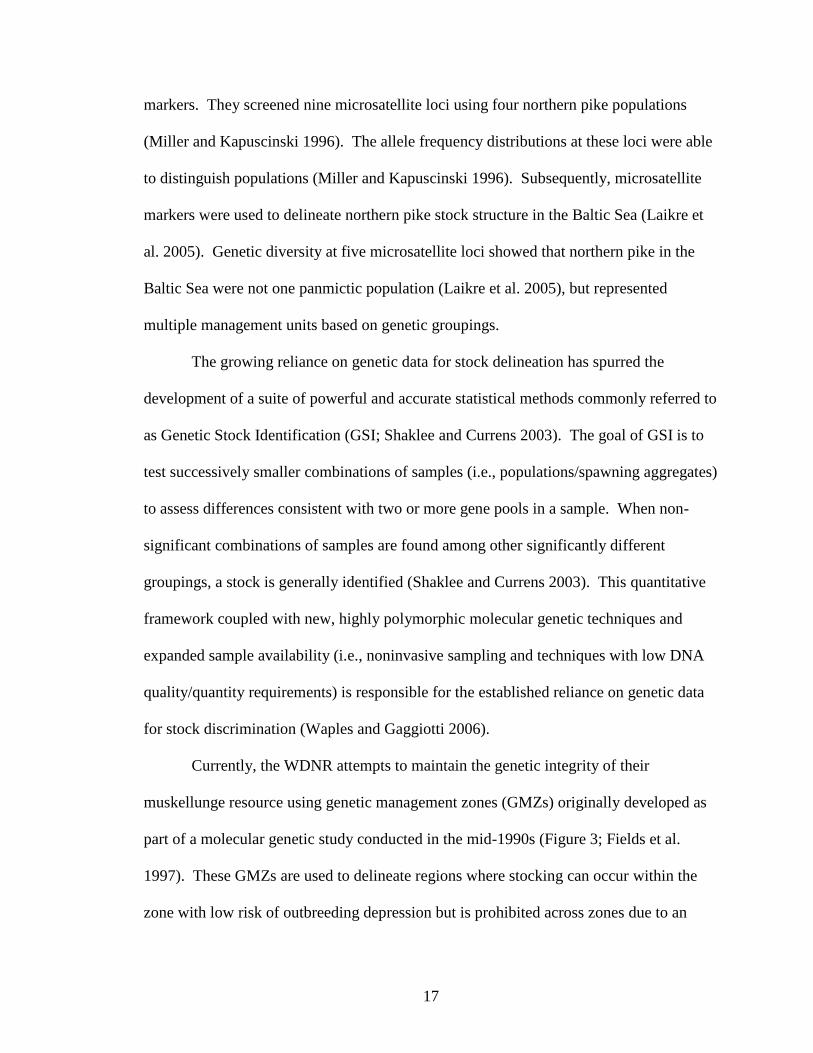
Figure 4. Major watersheds in northern Wisconsin: (A) Lake Superior, (B) Upper St.
Croix, (C) Upper Chippewa, (D) Upper Wisconsin, and (E) Green Bay (Lake
Michigan). .........................................................................................................32
CHAPTER 1
Figure1. Geographic location of the three study sites in Sawyer County, WI. The lakes
are (A) LCO, (B) MC, and (C) SPI.. .................................................................59
Figure 2. Timeline representing the sampling strategy for the project: circles represent
LCO samples, the square is the SPI sample, and the triangle is the 1980 MC
sample. The bars are the two documented stocking events 1) 1956 – SPI and
2) 1981 – MC. ...................................................................................................60
Figure 3. Unrooted NJ tree showing population clustering based on Cavalli-Sforza and
Edwards (1967) genetic distance. Node support represents the percent
resolution of that node in 1,000 bootstrap pseudoreplicates .............................61
CHAPTER 2
Figure 1. Current genetic management zones suggested by Fields et al. (1997) based
partially on allozyme and mtDNA data. ..........................................................107
Figure 2. Major watersheds in northern Wisconsin: (A) Lake Superior, (B) Upper St.
Croix, (C) Upper Chippewa, (D) Upper Wisconsin, and (E) Green Bay (Lake
Michigan) ........................................................................................................108
Figure 3. Three hatcheries involved with muskellunge propagation in Wisconsin and
their relative location in the state. (1) Governor Tommy G. Thompson State
Fish Hatchery, (2) Art Oehmcke State Fish Hatchery, and (3) Wild Rose State

xi
Fish Hatchery. The black line represents State Highway 29, which was chosen
as the southern boundary of the study. ............................................................109
Figure 4. Native range of muskellunge in Wisconsin according to Becker (1983) ........110
Figure 5. Relative distribution and location of sampled populations in this study. The
inset map shows the counties containing sampled populations .....................111
Figure 6. Unrooted NJ tree of all sampled populations created using Cavalli-Sforza and
Edwards (1967) chord distance .......................................................................112
Figure 7. Unrooted NJ tree of all populations that have not been stocked since 1990
created using Cavalli-Sforza and Edwards (1967) chord distance. Node
support based on 500 bootstrap pseudoreplicates. Nodes with support <50%
are not labeled. ................................................................................................113

xii
LIST OF APPENDICES
CHAPTER 1
Appendix 1. Allele frequencies for each microsatellite locus used to assess the genetic
integrity of LCO’s muskellunge population ................................................62
CHAPTER 2
Appendix 1. Standard operating protocol for field collection of fin-clips .....................114
Appendix 2. Allele frequency data for all sampled muskellunge populations ..............115

1
GENERAL INTRODUCTION
Muskellunge (Esox masquinongy) are apex predatory fish that are important to
both the aquatic ecology and economy of Wisconsin. Within Wisconsin, there are over
700 recognized waters containing muskellunge; most are lakes, but some populations
inhabit slow moving rivers and artificial reservoirs (Simonson 2002). Muskellunge are
renowned as voracious feeders generally preying on yellow perch (Perca flavescens) and
white sucker (Catostomus commersoni) (Bozek et al. 1999) but also known to
opportunistically predate waterfowl and small mammals. Muskellunge are among the
largest inland freshwater fish in North America reaching sizes in excess of 127 cm (>50
in).
Muskellunge are a favored species among North American anglers and are a
significant part of Wisconsin‘s economy and tourism. They are targeted as a trophy fish
among a select group of avid anglers and as a cultural component of Native American
fisheries. The number of anglers fishing for Wisconsin‘s muskellunge has steadily
increased since the 1950s, currently estimated at nearly 400,000 anglers (Simonson
2002). A majority of the revenue from muskellunge fishing occurs in the northern half of
Wisconsin where ~90% of the muskellunge populations are found (Simonson 2002).
With the high level of resource use, the muskellunge fisheries in Wisconsin are actively
managed through a combination of harvest restrictions and propagation.
The Wisconsin Department of Natural Resources‘ (WDNR) muskellunge
propagation program recently underwent a series of strategic modifications aimed at
protecting the contemporary genetic integrity of populations (Sloss 2005). The focus of
the modifications was to minimize the risk to naturally recruiting, native populations of

2
muskellunge. Among the key recommendations of Sloss (2005) were to: 1) restrict
brood sources to native, naturally recruiting populations, 2) use a 3-5 population rotation
of brood sources to account for alternate year stocking strategies, and 3) optimize
effective population sizes by spawning 1 female to 3 males with a minimum of 19
females and 57 males per hatchery facility per year.
To meet the goals of this strategic plan, it is necessary to understand the
contemporary genetic resources within and among muskellunge populations in the state
and to determine, where possible, the impact of past and current management activities
on the genetic integrity of muskellunge populations. Technological advances in
molecular biology (Reading 2003; Sloss et al. 2008) have allowed more effective use of
genetic techniques in resolving muskellunge spatial and temporal genetic diversity.
These same advances have drastically reduced the amount of tissue required for genetic
analysis. Non-lethal sampling (fin-clips) and the use of archived scales, spines, and other
hard parts (cleithra and otoliths), once collected for aging, have made it logistically
possible to analyze a wide distribution and large number of muskellunge populations as
well as any temporal changes in response to natural and anthropogenic actions.
Taking into account the importance of the Wisconsin muskellunge resource to the
state, and the goals of the muskellunge management plan, this project was focused on
looking at the contemporary muskellunge genetic resources as they relate to past
propagation practices and future propagation plans. The overall goals of this research
were to provide a critical evaluation of suspect stocking events from the 1950s and 1980s
into Lac Courte Oreilles (LCO) and to examine the contemporary genetic diversity within
and among naturally recruiting Wisconsin muskellunge populations in the species‘ native

3
range. My first objective was to evaluate the temporal genetic dynamics of the LCO
muskellunge population to determine if two stocking events that used perceived
slow/small growth strains of muskellunge disrupted the genetic integrity of the
population. This was achieved by comparing pre-stocking samples to post-stocking
samples, specifically comparing Big Spider Lake and Mud/Callahan Lake samples (brood
source populations) to Lac Courte Oreilles (recipient population) samples to determine if
an admixture (i.e., introgression or gene flow) could be detected. My second objective
was to determine if genetic population structuring occurred among muskellunge
populations in northern Wisconsin.
Literature Review
Life history.—The native range of muskellunge is limited to lakes and slow
moving rivers in the eastern portion of the United States, including the Mississippi River,
Missouri River, and Ohio River drainages, and the Great Lakes (Crossman 1978;
Dombeck 1986; Inskip 1986), and the Canadian provinces of Manitoba, Ontario, and
Quebec (Becker 1983; Inskip 1986). Muskellunge have been introduced in other states
outside their native range such as North and South Dakota, Nebraska, Texas, and
California (Cook and Solomon 1987). In Wisconsin, the native range of muskellunge
was identified by Becker (1983) as limited to the headwaters of the Chippewa,
Wisconsin, and Flambeau Rivers (Figure 1). Muskellunge have been introduced outside
their native range in Wisconsin and are now found throughout the state.
Muskellunge prefer, but are not limited to, large bodies of clear water containing
both shallow areas with macrophyte beds and deep areas with abundant cover (Becker

4
1983). Cook and Solomon (1987) developed a habitat suitability index model that
compiled optimal lake characteristics for muskellunge. Specific characteristics
contributing to the model included water transparency, forage fish abundance, size
diversity of forage fish, winter dissolved oxygen, water temperature, and ratio of
spawning habitat to summer habitat. Secchi disk measurements have been correlated
with muskellunge activity in numerous studies; as ambush hunters, muskellunge are
believed to be more active when water transparency levels are higher (Miller and Menzel
1986). Oehmcke et al. (1965) found that muskellunge were also more tolerant of low
oxygen conditions compared to other sport fish. It has also been shown that while
muskellunge avoid areas where dissolved oxygen is low, they can over-winter at oxygen
levels as low as 3.0 mg/L (Gilbertson 1986; Cook and Solomon 1987). The muskellunge
has a preferred temperature range of 0.6-25.6ºC, but can survive maximum water
temperatures of 32.2ºC (Dombeck 1979; Becker 1983; Cook and Solomon 1987).
Muskellunge typically spawn in shallow bays (<1 m) with a muck substrate and
large woody structure (Nevin 1901; Oehmcke 1974; Becker 1984). Dombeck et al.
(1984) classified spawning habitat while analyzing eight naturally recruiting muskellunge
lakes in northern Wisconsin and found spawning took place over a variety of substrates
near-shore. The commonly observed substrates included gravel, muck, emergent and
submergent vegetation, and large woody structure (Dombeck et al. 1984). In some cases,
muskellunge spawning areas were located near an inflowing stream (Dombeck 1979).
Muskellunge have also been observed moving up and spawning in streams (Eddy and
Underhill 1976). River-dwelling muskellunge usually spawn in slow moving portions of
the river with similar substrate such as muck and large woody debris (Brewer 1969).

5
Scott and Crossman (1973) reported that muskellunge first spawn between 3-5
years of age. They spawn in the spring soon after ice-out as water temperatures reach
9.4-15.6oC. Generally, males home to spawning sites and are followed by females and
may even cross deep, open water to get to shallow spawning sites (Becker 1983; Strand
1986). Typical spawning includes one female and two males isolating themselves from
other spawning muskellunge. Males compete for position while releasing their gametes
simultaneously with eggs released by the female and fertilized eggs are then dispersed
over the substrate. Alternative spawning strategies have been observed where
muskellunge and northern pike (E. lucius) are sympatric, specifically in the northern
lakes of Minnesota and the Great Lakes. In these cases, offshore spawning in deeper
water has been observed (Haas 1978; Strand 1986).
Muskellunge use a wide variety of habitat types depending on their life stage and
the time of year. Eggs incubate 10-21 days based on the water temperature (Klingbiel
1986). After hatching, the fry (< 10 days) remain sedentary among aquatic vegetation
and detritus until the yolk sack is absorbed (Scott and Crossman 1973; Craig and Black
1986). Muskellunge fry utilize both the previous summer‘s decaying aquatic vegetation
and new emergent aquatic plants, such as arrowhead (Alismaceae), sedges (Cyperaceae),
and water lilies (Nymphaeaceae), for cover while resting and foraging (Dombeck 1979;
Craig and Black 1986). Young-of-year muskellunge remain in areas with abundant
vegetation while feeding on small forage fish (Oehmcke et al 1958; Craig and Black
1986; Cook and Solomon 1987; Murray and Ferrell 2007). Miller and Menzel (1986)
studied adult muskellunge habitat throughout the course of the year and found that after
ice-out, muskellunge used both the littoral zone and deeper water portions of lakes. In

6
mid- to late-summer, habitat use was primarily restricted to the littoral zone, while
muskellunge over-wintered in deeper water (Miller and Menzel 1986). From spring
through fall, adult muskellunge established a large home range presumably to maximize
predation activities (Strand 1986). Home ranges were often associated with submerged
structures like weed beds, large woody debris, or rocky substrate (Miller and Menzel
1986; Strand 1986). Similar to the northern pike, muskellunge utilized habitat associated
with the edges of macrophyte beds (Cook and Solomon 1987).
As apex aquatic predators, muskellunge forage on a variety of different prey
species throughout the year. Muskellunge are voracious piscivores with common prey
items including catostomids, cyprinids, and percids (Bozek et al. 1999). In addition,
there have been anecdotal accounts of muskellunge feeding on water fowl, amphibians,
and small aquatic mammals (Oehmcke 1965). Engstrom-Heg et al. (1986) studied the
prey selection of esocids in laboratory experiments and found muskellunge were a
―lurking‖ predator, remaining sedentary and making short, quick strikes. In their study,
no prey species preference was observed, but rather prey selection was based on size
(Engstrom-Heg et al. 1986).
Muskellunge have been observed to change feeding habits based on available
cover and forage (Engstrom-Heg et al. 1986; Bozek et al. 1999). Bozek et al. (1999)
studied muskellunge feeding habits in northern lakes of Wisconsin. They sampled
muskellunge stomach contents from 31 lake populations from April to October.
Muskellunge were concluded to be opportunistic predators with 31 different species of
fish being consumed (Bozek et al 1999). These feeding habits and needs have become
integral considerations in muskellunge management.

7
Taxonomy and intraspecific variation.—Muskellunge are members of Esocidae
(Esociformes; Nelson 2006) which contains a single extant genus, Esox. Worldwide, five
species of Esox occur: muskellunge, northern pike, Amur pike (E. reicherti), chain
pickerel (E. niger), and two recognized subspecies of E. americanus: the redfin pickerel
(E. a. americanus) and the grass pickerel (E. a. vermiculatus) (Casselman et al. 1986;
Grande et al. 2004; Nelson 2006). North America contains three endemic species
(muskellunge and the pickerels) and the circumpolar northern pike. The Amur pike is the
only species that does not occur in North America (Siberia). The muskellunge fossil
record goes back 25 million years and the species is thought to have evolved in North
America most likely from a northern pike-like ancestor (Casselman et al. 1986).
Phylogenetic evidence suggests the closest living relatives of muskellunge are the
northern pike and the Amur pike (López et al. 2004).
Muskellunge and northern pike hybrids (collectively referred to as the tiger
muskellunge; Inskip 1986) have been observed in nature (Oehmcke 1969; Casselman et
al. 1986; Casselman and Crossman 1986; Wingate 1986) and employed in management
of esocid fisheries. Background natural hybridization likely occurs wherever the two
species are sympatric (Scott and Crossman 1973; Inskip 1986). The tiger muskellunge
has been employed in fisheries management programs because of lower cost of
propagation, better return to creel, higher growth rates (Casselman and Crossman 1986),
and their assumed sterility (Wingate 1986). However, recent trends away from tiger
muskellunge use, especially in areas with native muskellunge waters, have occurred for
several reasons, including angler preferences for pure-strain trophy fish and concerns

8
over lower, but significant, levels of reproductive success posing a threat to the genetic
integrity of native muskellunge populations (Wingate 1986).
Designation of subspecies of muskellunge has been suggested based on numerous
morphological, ecological, meristic and partial genetic analyses (Scott and Crossman
1973; Crossman 1986; Lebeau 1992). However, these subspecies are currently not
recognized by the scientific community (Koppelman and Philipp 1986). The presence of
different muskellunge strains, a term most commonly used in the propagation/culture of
fish species to designate a lineage of fish originating from either a single source (e.g.,
Spirit Lake strain of muskellunge) and/or exhibiting clear-cut physiological but not
morphological differences from other strains (Merriam-Webster 2008), is commonly
accepted among fisheries professionals and anglers. In Wisconsin and Minnesota,
various muskellunge strains have been proposed. Based on several paired stocking
studies, strains of muskellunge differing in morphology, performance, and/or
physiological attributes have been shown including the Leech Lake (MN) strain,
Shoepack (MN) strain, and multiple potential strains in WI (e.g., LCO, Mud-Callahan,
etc.) are well-accepted (Johnson 1971; Lyons and Margenau 1986; Younk and Strand
1992; Margenau and Hanson 1996).
Minnesota‘s muskellunge management program has benefited greatly by
identifying different strains in the state (Wingate and Younk 2007). During the 1900s,
Minnesota saw a decline of trophy muskellunge (>127 cm). Minnesota Department of
Natural Resources (MNDNR) fish biologists reacted by reducing bag limits, increasing
the minimum length limit, and restricting the length of the season (Wingate and Younk
2007). Minnesota‘s muskellunge propagation program also responded by propagating

9
muskellunge exclusively from Shoepack Lake because, at the time, that population was
an accepted representative of Minnesota muskellunge populations and egg collection
quotas were easily met (Eddy and Surber 1943; Eddy and Underhill 1974; Younk and
Strand 1992; Wingate and Younk 2007). However, after 30 years of stocking Shoepack
Lake progeny in Minnesota, trophy-sized muskellunge had not increased and growth
rates of stocked (Shoepack Lake) muskellunge were found to be slower compared to the
naturally recruited muskellunge (Wingate and Younk 2007). This observation sparked
concern that Shoepack Lake was not an ideal muskellunge brood stock population for the
state‘s propagation program. Leech Lake was chosen as a potential alternative to
Shoepack Lake because trophy muskellunge were still being caught there and the lake
was a native muskellunge system (Wingate and Younk 2007). Genetic research
supported the assumption that fish in the two systems were divergent (Hanson et al.
1983), and historical growth rates and paired stocking studies subsequently confirmed
that Shoepack Lake muskellunge had a slower growth rate than Leech Lake muskellunge
(Wingate and Younk 2007). After concluding that two strains were present, the MNDNR
decided to switch brood sources and exclusively use Leech Lake muskellunge in their
propagation program. Since the switch, Minnesota has become a major destination of
anglers seeking trophy muskellunge.
Multiple strains of muskellunge are suspected to occur in Wisconsin. Johnson
(1971) concluded that Big Spider Lake (Sawyer County) muskellunge stocked into Lac
Courte Oreilles (LCO; Sawyer County) performed poorly because of an unknown
heredity factor. In 1971, a life history study of muskellunge in Wisconsin showed that
different stocks/strains performed differently when stocked in different waters (Lyons

10
and Margenau 1986). In addition, Margenau and Hanson (1996) observed that
Mud/Callahan Lake (Sawyer County) strain muskellunge showed higher survival than
LCO strain when both were stocked in Mud/Callahan Lake, suggesting local adaptation
was, in part, responsible for strain-specific survival. The presence of perceived strains
and local adaptation of muskellunge suggested more research was needed in Wisconsin to
manage the genetic integrity of this historically and economically important resource.
Muskellunge management in Wisconsin.—Muskellunge harvest has a long and
fabled history throughout its range as an important resource to anglers and the
commercial fishing industry. Muskellunge were targeted by commercial anglers from the
mid-1800s to the early-1900s, but commercial harvest was soon concentrated to small
pockets in Ontario and Quebec (Crossman 1986). Angler pressure on the resource
increased when northern expansion of the railroad made northern Wisconsin muskellunge
lakes more accessible to the public (Nevin 1901; Crossman 1986) and the number of
anglers using Wisconsin‘s muskellunge resources has steadily increased since the 1950s
(Simonson 2002). Millions of dollars are spent on food, lodging, and equipment each
year, making the muskellunge industry a significant part of Wisconsin tourism. Much of
the revenue from muskellunge fishing is generated in the northern half of Wisconsin
because nearly 90% of muskellunge populations are found there (Simonson 2002).
Habitat preservation is an important part of muskellunge management in
Wisconsin. Key habitat types for muskellunge include shallow mucky bays, weed beds,
and coarse woody structure (Cook and Solomon 1987). The main source of habitat
disruption is human manipulation of lakeshore habitats, dredging wetlands, and weed
removal (Margenau 2008). Jennings et al. (1999) measured cumulative effects of

11
shoreline development associated with fish assemblages. Their results suggested
effective habitat preservation takes place at the landscape level; however, protecting
small sections of habitat, such as private lake front properties, helps maintain habitat
diversity and, subsequently, the species richness of a lake (Jennings et al. 1999).
Jennings et al. (2003) also showed that shoreline development resulted in ―simplified‖
habitat that is not conducive to fish, especially ambush predators such as muskellunge.
These studies have helped government agencies educate lake associations and anglers in
how to take an active role in maintaining critical habitats used by muskellunge and other
fish (Margenau et al. 2008).
Over-exploitation of muskellunge resources has historically been a major concern
addressed through regulations and encouragement of catch-and-release practices. Where
over-exploitation has been observed in muskellunge populations, the likely cause has
been a ―relaxed‖ or non-existent regulation of size and bag limits (Nevin 1901; Graff
1986). In the 1970s, the WDNR instituted strict muskellunge regulations, including
specific length limits, aimed at protecting mature fish of a minimum size and low bag
limits aimed at ensuring a low annual harvest thus protecting Wisconsin‘s muskellunge
fisheries (Simonson and Hewett 1999). In addition, the various state agencies and private
angling groups, such as Muskies, Inc., dramatically changed muskellunge management
by encouraging catch-and-release (Simonson and Hewett 1999). A study by Dent (1986)
examined the impacts of catch-and-release on Pomme de Terre Lake, Missouri, and
showed that catch-and-release could benefit muskellunge populations. The lake had been
stocked since 1966 when a local chapter of Muskies, Inc. became active in maintaining
the population through voluntary catch-and-release. Dent (1986) saw the number of legal

12
muskellunge caught increase, and the study showed that, with catch-and release, a
muskellunge population can remain viable as angling pressure increases.
In Wisconsin, anglers and angling groups have enthusiastically adopted a catch-
and-release ethic. The WDNR has published safe muskellunge release techniques both in
the fishing regulations booklet and on their website to educate and encourage catch-and-
release fishing (www.muskiesinc.org). Muskies, Inc. has also encouraged a catch-and-
release ethic among its members by claiming that releasing muskellunge benefits both
natural reproduction and supplemental stocking (www.muskiesinc.org). This attitude
change has been perceived as benefitting Wisconsin‘s goal to produce trophy
muskellunge (Simonson and Hewett 1999).
Despite the catch-and-release mentality, harvest of muskellunge does occur,
which requires management regulations to protect and maintain the population‘s
viability. Regulations are coupled with supplemental stocking to manage the resource.
The WDNR‘s primary minimum size limit for muskellunge is 86.4 cm with a one fish
total daily bag limit that is specifically aimed to help sustain natural recruitment and to
protect large muskellunge until they reach trophy size (Simonson 2002). Recently, some
lakes in northern Wisconsin have instituted large minimum length limits (101.6 – 127.0
cm) in an attempt to protect spawning fish (thus increasing the overall production the
system) and to produce more trophy fish by minimizing mortality (Simonson 2002).
Muskellunge propagation is a prominent management tool used in conjunction
with regulations by the WDNR and local fishing clubs to maintain or supplement
populations throughout the state. Muskellunge stocking began in Wisconsin near the
turn-of-the-century (Nevin 1901; Margenau 1999). The original intent of muskellunge

13
stocking in Wisconsin was to alleviate the impacts of overexploitation by simply
augmenting the number of muskellunge available. In early fish management, it was
thought that supplementing a muskellunge population with propagated fish would only
enhance the resource (Margenau 1999). As propagation practices and efficiency became
more refined, stocking was also used to restore extirpated populations, expand the natural
range, and supplement populations without sufficient natural recruitment (Simonson and
Hewett 1999).
Early muskellunge propagation primarily used fry and was mainly performed on a
regional and convenience basis (Nevin 1901). Much of this early stocking was poorly
recorded and evidence for success of the program was anecdotal at best. More recently,
stocking using fingerlings (~11.6 cm) and extended-growth fingerlings (~22.9 cm) from
two main hatcheries, the Governor Tommy G. Thompson State Fish Hatchery in
Woodruff and the Art Oehmcke State Fish Hatchery in Spooner (Figure 2), has become
standard practice in Wisconsin (Margenau 1999). These two hatcheries serve northeast
Wisconsin and northwest Wisconsin, respectively.
Research in muskellunge propagation has included studies aimed at determining
the effectiveness of stocking in relation to age at stocking (Hanson et al. 1986; Serns and
Andrews 1986; Margenau 1992; Wahl 1999) and survival/performance of stocked fish
(Hanson and Margenau 1992; Margenau 1992; Wahl 1999). Wahl (1999) found that
survival rates increased when larger muskellunge were stocked into waters with similar
temperature profiles. Predation, starvation, and stress have also been shown to be major
factors in survival of stocked fish (Hanson and Margenau 1992).

14
As discussed previously, strain performance in Wisconsin has also been
researched (Johnson 1971; Lyons and Margenau 1986; Margenau and Hanson 1996) to
examine, in part, the potential influences of supplementally stocked fish on the genetic
integrity and performance of a muskellunge fishery. Margenau and Hanson (1996) used
paired-strain stockings to compare differences between lakes that are used as brood
sources in Wisconsin by observing short term (<60 days) and long-term survival and
growth rates based on length. Results showed that the Mud/Callahan muskellunge out-
competed the LCO strain when both were stocked in Mud/Callahan Lake. The short-term
survival of fingerlings showed that Mud/Callahan strain fingerlings likely outcompeted
LCO fingerlings when both were present; however, the LCO strain grew to greater
lengths faster than the smaller, slow growing Mud/Callahan strain (Margenau and
Hanson 1996). However, by evaluating growth of tagged fish, Johnson (1971) was able
to conclude that Big Spider Lake muskellunge stocked in LCO were outcompeted by the
native muskellunge likely because of an unknown hereditary factor. Margenau and
Hanson (1996) concluded these performance differences were the result of some
combination of environmental and genetic factors.
In 2002, the WDNR established a muskellunge management plan outlining goals
and measures that the state can use to monitor muskellunge resources. Two of the major
goals of the current muskellunge management plan are to: (1) provide anglers with a
variety of unique fishing opportunities, including trophy muskellunge (defined as >127
cm), and (2) ―protect and enhance Wisconsin‘s naturally reproducing muskellunge
populations‖ (Simonson 2002). Recently, the WDNR‘s muskellunge propagation
program underwent a series of strategic modifications aimed at meeting the goal of

15
protecting the genetic integrity of local, naturally reproducing populations (Sloss 2004).
The focus of these modifications was minimizing the risk to naturally recruiting,
putatively native populations of muskellunge. To further these efforts and effectively
manage Wisconsin‘s muskellunge populations into the future, a more resolved pattern of
genetic stock structure is needed.
Muskellunge management and genetic resources.—A key concept in managing
the genetic integrity of fishery resources is the stock concept (Kutkuhn 1981; STOCS
1981). A fishery stock is defined as an intraspecific group of randomly mating
individuals that is reproductively isolated, shares a common gene pool, and has temporal
and spatial stability (modified from Larkin 1972; Ihssen et al. 1981). The fishery stock
concept is based on the idea that managing for the long-term sustainability of the
component stocks will lead to long term stability of the entire resource (STOCS 1981).
The use of the stock concept in fishery management programs allows multiple
populations to be grouped for management purposes while still managing a biologically
cohesive unit (Dizon et al. 1992). In recent years, a fishery stock in this sense has
become synonymous with the management unit (MU). A MU is formally defined as the
ecological component of larger evolutionary significant units that are diagnosed as a
population(s) that exhibit significant allele frequency differences (Moritz 1999).
A critical assumption of any stock management approach is that the stocks being
managed have been identified in a standardized, reliable, biologically relevant manner
(Laikre et al. 2005). In practice, fisheries managers often recognize stocks as a group of
organisms harvested in a particular area. This approach is dependent on what and how
much information is available including data on age structure, life history, and other

16
phenotypic and demographic estimates. Collecting these data requires extensive field-
based efforts that are often not feasible (Carvalho and Hauser 1994). Furthermore,
meristic, morphological, and life history data can converge and/or diverge due to
environmental effects, thereby not measuring isolation/separation of gene pools and/or
populations (Shaklee and Currens 2003). However, it is preferable to base stock
identification on more definable measures. Genetic data has become a favored method
for stock identification due to the large amount of data that can be generated quickly from
small, non-lethal amounts of tissue (Miller and Kapuscinski 1996) and the ability of
genetic data to statistically assess the level of connectivity between populations, and thus,
the degree of isolation between populations (Shaklee and Currens 2003).
Recently, a large body of research has emerged showing superior resolution of
genetic data for stock delineation compared to geologic, geographic, and/or phenotypic
approaches (Angers et al. 1995; Petit 1998; Potvin and Bernatchez 2001; Arnand-Haond
et al. 2004; Laikre et al. 2005). For instance, Angers et al. (1995) looked at brook trout
(Salvelinus fontinalis) population structure across five lakes in La Mauricie National
Park, Quebec, Canada. Variation in microsatellite DNA showed large amounts of
interpopulation genetic variation not seen with other genetic markers, such as
mitochondrial DNA. This structure was resolved despite a geographically small region
(536 km2). The observed genetic diversity allowed Angers et al. (1995) to identify a
quantitatively delineated stock structure for brook trout in the park.
Stock structure of northern pike has also been successfully studied using
microsatellites. Miller and Kapuscinski (1996) tested newly developed northern pike
microsatellite loci in hopes of finding greater genetic diversity than previous molecular
17
markers. They screened nine microsatellite loci using four northern pike populations
(Miller and Kapuscinski 1996). The allele frequency distributions at these loci were able
to distinguish populations (Miller and Kapuscinski 1996). Subsequently, microsatellite
markers were used to delineate northern pike stock structure in the Baltic Sea (Laikre et
al. 2005). Genetic diversity at five microsatellite loci showed that northern pike in the
Baltic Sea were not one panmictic population (Laikre et al. 2005), but represented
multiple management units based on genetic groupings.
The growing reliance on genetic data for stock delineation has spurred the
development of a suite of powerful and accurate statistical methods commonly referred to
as Genetic Stock Identification (GSI; Shaklee and Currens 2003). The goal of GSI is to
test successively smaller combinations of samples (i.e., populations/spawning aggregates)
to assess differences consistent with two or more gene pools in a sample. When non-
significant combinations of samples are found among other significantly different
groupings, a stock is generally identified (Shaklee and Currens 2003). This quantitative
framework coupled with new, highly polymorphic molecular genetic techniques and
expanded sample availability (i.e., noninvasive sampling and techniques with low DNA
quality/quantity requirements) is responsible for the established reliance on genetic data
for stock discrimination (Waples and Gaggiotti 2006).
Currently, the WDNR attempts to maintain the genetic integrity of their
muskellunge resource using genetic management zones (GMZs) originally developed as
part of a molecular genetic study conducted in the mid-1990s (Figure 3; Fields et al.
1997). These GMZs are used to delineate regions where stocking can occur within the
zone with low risk of outbreeding depression but is prohibited across zones due to an

18
unacceptable risk of outbreeding depression. Fields et al. (1997) sampled ten
muskellunge populations (n = 26-30 individuals/population) from four major watersheds
in northern Wisconsin (Upper Chippewa River , St. Croix River, Upper Wisconsin River,
and Lake Superior; Figure 4) and analyzed allozyme and mitochondrial DNA (mtDNA)
diversity to describe stock structure. The mtDNA data showed no variability among
populations; thus, no stock structure was resolved. The allozyme analysis showed only
two polymorphic loci and resolved little to no genetic structure among Wisconsin
muskellunge populations. Despite the overall lack of resolution, five stocks of Wisconsin
muskellunge were conservatively suggested based on watershed boundaries within the
state: Lake Superior, Chippewa River/St. Croix River, Lower (WI) Mississippi River,
Upper Wisconsin River, and Lake Michigan; these five stocks represent the current
GMZs used to manage Wisconsin‘s muskellunge. The Lower Mississippi River GMZ
does not possess native muskellunge fisheries and as such, is currently given wide-
latitude by the WDNR in terms of sources of stocked fish where lakes that have no
immediate access to native range muskellunge populations are designated universal
acceptor lakes. The Lake Superior GMZ is not managed with a unique brood source but
instead is stocked with fish from the St. Croix/Upper Chippewa River GMZ (Tommy
Thompson State Fish Hatchery, Spooner, WI). Despite the conservative resolution of
five GMZs in Fields et al. (1997), a confidently resolved genetic structure among
muskellunge populations was not recovered for several reasons. The study was
confounded by low genetic variability among sampled loci (both allozyme and mtDNA),
relatively low sample sizes (both number of populations and number of
individuals/population), and related low statistical power. Only two allozyme loci (out of

19
61 originally surveyed for muskellunge variation) showed any polymorphism within
Wisconsin populations, and the levels of polymorphism were low, resulting in limited
resolution of genetic structure. Secondly, sample sizes employed by Fields et al. were
below most contemporary standards for confident resolution of genetic structure. Ryman
et al. (2006) showed that the use of a small number of loci, such as in Fields et al. (1997),
coupled with low variability (number of alleles = 2-3 in Fields et al. 1997) requires
sample sizes of at least 50 individuals to achieve even moderate power (1-β ≈ 0.5).
Further, Ruzzante (1998) found similar sample size and polymorphism requirements in
simulations examining the ability of highly polymorphic loci to discern population
differentiation.
The small number of Wisconsin muskellunge populations included in the study
was a concern in delineating Wisconsin genetic structure; Wisconsin has >700
muskellunge populations throughout the state. Although their study focused on
muskellunge throughout the Midwest, only 10 populations were sampled in the northern
third of Wisconsin, representing a small proportion (<2.0%) of the total muskellunge
populations in this region. Therefore, concluding no genetic structure exists based solely
on this small population sampling, relatively small number of individuals/population, and
a small number of genetic loci would risk missing underlying differences among
populations within or between current watershed boundaries. For these reasons, the
GMZs as outlined by Fields et al. (1997) should be considered conservative management
zones. Recent developments in methods for conservation genetic studies, such as highly
polymorphic microsatellite loci and non-lethal sampling techniques, could provide
valuable data and potential clarity to the resolution of muskellunge GMZs in Wisconsin.

20
The long-term genetic integrity of Wisconsin muskellunge cannot be assured
despite the use of these GMZs mainly because of past stocking practices. Unfortunately,
much of the early stocking in Wisconsin was poorly documented and believed to have
occurred across the current GMZs, raising questions about past impacts such as
outbreeding depression and contemporary issues about current stock structure and
propagation management. Each of the three Wisconsin hatcheries (Oehmcke =
Wisconsin River, Thompson = St. Croix/Mississippi, and Wild Rose = Lake Michigan)
mainly serves one GMZ and currently use brood fish only from their respective zones.
However, known exceptions to this restriction have regularly occurred over the past 30-
40 years. If current GMZs do not represent the natural genetic stocks, this approach
could disrupt the genetic integrity it is trying to preserve.
Local adaptation is a genetic change that occurs in isolated populations because of
natural selection driven by local environmental factors (Hallerman 2003). Fish
populations in lakes, such as lake-dwelling muskellunge populations, are generally
isolated from one another with limited or no migration between them. Isolation, caused
by geological features or geographic distance between populations, can lead to genetic
changes in the population via genetic drift (random events) and natural selection. Over
time, selection pressures can result in populations that are locally adapted to their
specific, isolated environment. Local adaptation often leads to coadaptations resulting in
combinations of alleles from various loci that perform best (i.e., fitness) in the presence
of other specific alleles. In time, coadaptations form coadapted gene complexes whereby
translocation and/or recombination physically link the loci and the specific alleles in
close proximity on a chromosome or a few chromosomes (Meselson and Radding 1975;

21
Chatti et al. 1999; Hallerman 2003; Swain et al. 2005). The result is a locally adapted
population that exhibits, theoretically, higher fitness within its current, native
environment.
Once local adaptation and gene complexes are formed, any disruption of local
adaptations and/or gene complexes (i.e., disruption of the genetic integrity) can
negatively affect fitness (Lynch and Walsh 1998). The most common fisheries practice
that can disrupt genetic integrity is the stocking of genetically divergent fish potentially
resulting in a phenomenon known as outbreeding depression (Philipp and Whitt 1991;
Philipp and Claussen 1995; Hallerman 2003). Outbreeding depression is formally
defined as the loss of fitness due to the disruption of locally adapted characteristics or
coadaptive gene complexes (Dobzhansky 1948; Templeton 1986; Lynch 1991). Classic
examples in fisheries science are studies of hybridization between the northern
largemouth bass (Micropterus salmoides salmoides) and the Florida largemouth bass (M.
s. floridanus; Philipp and Whitt 1991; Philipp and Claussen 1995; Philipp et al. 2002).
Several crosses between the northern and southern strains were stocked into Midwestern
waters to assess the performance of each strain and the crosses. Phillip and Whitt (1991)
found that the southern bass and the various crosses involving southern bass had poor
survival rates when compared to native bass in northern study in pond. They concluded
their findings were caused by outbreeding depression in the various crosses and
suggested that stocking Florida bass in northern climes would lower mean fitness of the
receiving (northern) populations, contradicting sound, science-based management goals.

22
LITERATURE CITED
Angers, B., L. Bernatchez, A. Angers, and L. Desgroseillers. 1995. Specific
microsatellite loci for brook charr (Salvelinus fontinalis, Salmonidae) reveal
strong population subdivision on a microgeographical scale. Journal of Fish
Biology 47: 177-185.
Arnaud-Haond, S., V. Vonau, F. Bonhomme, P. Boudry, F. Blanc, J. Prou, T. Seaman,
and E. Goyard. 2004. Spatio-temporal variation in the genetic composition of
wild populations of pearl oyster (Pinctada margaritifera cumingii) in French
Polynesia following 10 years of juvenile translocation. Molecular Ecology 13:
2001-2007.
Becker, G.C. 1983. Fishes of Wisconsin. The University of Wisconsin Press, Madison,
Wisconsin.
Bozek, M.A., T.M. Burri, R.V. Frie. 1999. Diets of muskellunge in northern Wisconsin.
North American Journal of Fisheries Management 19: 258-270.
Carvalho, G.R. and L. Hauser. 1994. Molecular genetics and the stock concept in
fisheries. Reviews in Fish Biology and Fisheries 4: 326-350.
Casselman, J.M. and E.J. Crossman. 1986. Size, age, and growth of trophy muskellunge
and muskellunge-northern pike hybrids: The Cleithrum Project, 1979-1983.
American Fisheries Society Special Publication 15: 93-110.
Casselman, J.M., E.J. Crossman, P.E. Ihssen, J.D. Reist, H.E. Booke. 1986. Identification
of muskellunge, northern pike, and their hybrids. American Fisheries Society
Special Publication 15: 14-46.
Chatti, N., K. Said, J Catalan, J. Britton- Davidian, and J.C. Auffray. 1999.
Developmental instability in wild chromosomal hybrids of the house mouse.
Evolution 53: 1268-1279.
Cook, M.F. and R.C. Solomon. 1987. Habitat suitability index models: muskellunge. U.S.
Fish and Wildlife Service Biological Report. 82(10.148) 33 pp.
Craig, R.E. and R.M. Black. 1986. Nursery habitat of muskellunge in southern Georgian
Bay, Lake Huron, Canada. American Fisheries Society Special Publication 15:
79-86.
Crossman, E.J. 1978. Taxonomy and distribution of North American esocids. American
Fisheries Society Special Publication 11: 13-26.
Crossman, E.J. 1986. The noble muskellunge: a review. American Fisheries Society
Special Publication 15: 1-13.

23
Dent, R.J. 1986. A case history of voluntary catch-and-release of muskellunge with
management implications for fisheries programs. American Fisheries Society
Special Publication 15: 316-322.
Dizon, A.E., C. Lockyer, W.F. Perrin, D.P. Demater, J. Sisson. 1992. Rethinking the
stock concept. Conservation Biology 6: 24-36.
Dobzhansky, T. 1948. Genetics of natural populations. XVI. Altitudinal and seasonal
changes in certain populations of Drosophila pseudoobscura and Drosophila
persimilis. Genetics 33: 158-176.
Dombeck, M.P. 1979. Movement and behavior of the muskellunge determined by radio-
telemetry. Wisconsin Department of Natural Resources Technical Bulletin. 113.
19 pp.
Dombeck, M.P, B.W. Menzel, and P.N. Hinz. 1984. Muskellunge spawning habitat and
reproducitve success. Transactions of the American Fisheries Society 113:205-
216.
Dombeck, M.P. 1986. Muskellunge habitat with guidelines for habitat management.
American Fisheries Society Special Publication 15: 208-215.
Engstrom-Heg, R., R.T. Colesante, G.A. Stillings. 1986. Prey selection by three esocid
species and a hybrid esocid. American Fisheries Society Special Publication 15:
189-194.
Fields, R.D., M.D.G. Desjardins, J.M. Hudson, T.W. Kassler, J.B. Ludden, J.V.
Tranquilli, C.A. Toline, and D.P. Philipp. 1997. Genetic analysis of fish species in
the Upper Midwest. Illinois Natural History Survey, Aquatic Ecology Technical
Report 97/5, Champaign, Illinois.
Fergerson, R.G. 1958. The preferred temperature of fish and their midsummer
distribution in temperate lakes and streams. Journal of Fisheries Research Board
of Canada.
Gilbertson, B. 1986. Winter rescue of juvenile muskellunge from shallow winterkill
lakes. American Fisheries Society Special Publication 15: 74-78.
Graff, D.R. 1986. Muskellunge management – A changing perspective from past to
present. American Fisheries Society Special Publication 15: 195-198.
Haas, R.C. 1978. The muskellunge in Lake St. Clair. American Fisheries Society Special
Publication 11: 224-339.

24
Hallerman, E.M. 2003. Genetic stock identification and risk assessment. Pages 291-328
in E.M. Hallerman, editor. Population genetics: principles and applications for
fisheries scientists. American Fisheries Society, Bethesda, Maryland.
Hanson, D. R.F. Strand, D.D. Post, W.H. Legrande, and S. Filbach. 1983. Muskellunge
electrophoresis study. Muskie 17: 9-13.
Hanson, D.A. and T.L. Margenau. 1992. Movement, habitat selection, behavior, and
survival of stocked muskellunge. North American Journal of Fisheries
Management 12: 474-483.
Hanson, D.A., M.D. Staggs, S.L. Serns, L.D. Johnson, and L.M. Andrews. 1986. Survival
of stocked muskellunge eggs, fry, and fingerlings in Wisconsin lakes. American
Fisheries Society Special Publication 15: 216-228.
Ihssen, P.E., H.E. Booke, J.M. Casselman, J.M. McGlade, N.R. Payne, and F.M. Utter.
1981. Stock identification: materials and methods. Canadian Journal of Fisheries
and Aquatic Sciences 38: 1838-1855.
Inskip, P.D. 1986. Negative association between abundances of muskellunge and
northern pike: evidence and possible explanations. American Fisheries Society
Special Publication 15: 135-150.
Jennings, M.J., J.M. Kampa, G.R. Hatzenbeler, E.E. Emmons. 2005. Evaluation of
supplemental walleye stocking in northern Wisconsin lakes. North American
Journal of Fisheries Management 25: 1171-1178.
Jennings, M.J., E.E. Emmons, G.R. Hatzenbeler, C. Edwards, and M.A. Bozek. 2003. Is
littoral habitat affected by residential development and land use in watersheds of
Wisconsin lakes? Lake and Reservoir Management 19: 272-279.
Jennings, M.J., M.A. Bozek, G.R. Hatzenbeler, E.E. Emmons, M.D. Staggs. 1999.
Cumulative effects of incremental shoreline habitat modification on fish
assemblages in north temperate lakes. North American Journal of Fisheries
Management 19: 18-27.
Johnson, L.D. 1971. Growth of known-age muskellunge in Wisconsin and validation of
age and growth determination methods. Wisconsin Department of Natural
Resources Technical Bulletin 49. 24pp.
Klingbiel, J.H. 1986. Culture of purebred muskellunge. American Fisheries Society
Special Publication. 15: 273-278.
Koppelman, J.B. and D.P. Philipp. 1986. Genetic application in muskellunge
management. American Fisheries Society Special Publication 15: 111-121.

25
Kutkuhn, J.H. 1981. Stock definition as a necessary basis for cooperative management of
great lakes fish resources. Canadian Journal of Fisheries and Aquatic Sciences 38:
1476-1478.
Laikre, L., S. Palm, and N. Ryman. 2005. Genetic population structure of fishes:
implication for coastal zone management. Ambio 34: 111-119.
Larkin, P.A. 1972. The stock concept and management of Pacific salmon. Pages 11-15. in
R.C. Simon and P.A. Larkin editors. H.R. MacMillan Lectures in Fisheries.
University of British Columbia. Vancouver, BC.
Lebeau, B. 1992. Historical ecology of pike Esox lucius, muskellunge Esox masquinongy,
and maskinonge a new species of Esox (subgenus mascalongus) from North
America. Doctoral dissertation. University of Toronto, Ontario, Canada.
López, J.A., W.J. Chen, and G. Orti. 2004. Esociform phylogeny. Copeia 2004 3: 449-
464.
Lynch, M. 1991. The genetic interpretation of inbreeding depression and outbreeding
depression. Evolution 45: 622-629.
Lynch, M. and B. Walsh. 1998. Genetics and analysis of quantitative traits. Sinauer
Assocs., Inc., Sunderland, MA.
Lyons, J. and Margenau, T.L. 1986. Population dynamics of stocked adult muskellunge
(Esox masquinongy) in Lac Court Oreilles, Wisconsin 1961-1977. Wisconsin
Department of Natural Resources Technical Bulletin 160. 11pp.
Margenau, T.L. 1992. Survival and cost-effectivness of stocked fall fingerlings and
spring yearling muskellunge in Wisconsin. North American Journal of Fisheries
Management 12: 484-493.
Margenau, T.L. 1999. Muskellunge stocking strategies in Wisconsin: the first century and
beyond. North American Journal of Fisheries Management 19: 223-229.
Margenau, T.L., S.P. Avelallemant, D. Giehtbrock, and S.T. Schram. 2008. Ecology and
management of northern pike in Wisconsin. Hydrobiologia. 601: 111-123.
Margenau, T.L. and D.A. Hanson. 1996. Survival and growth of stocked muskellunge:
effects of genetic and environmental factors. Wisconsin Department of Natural
Resources, Research Report 172, Madison.
Meselson, M.S. and C.M. Radding. 1975. A general model for genetic recombination.
Proceedings of the National Academy of Sciences 72: 358-361.

26
Miller, L.M. and A.R. Kapuscinski. 1996. Microsatellite DNA markers reveal new levels
of genetic variation in northern pike. Transactions of the American Fisheries
Society 125: 971-977.
Miller, M.L. and B.W. Menzel. 1986. Movement, activity, and habitat use patterns of
muskellunge in West Okoboji Lake, Iowa. American Fisheries Society Special
Publication 15: 51-61.
Murray, B.A. and J.M. Ferrell. 2007. Quantification of native muskellunge nursery
habitat: influence of body size, fish community composition, and vegetation
structure. Environmental Biology of Fishes 79: 27-47
Nevin J. 1901. The propagation of muskellunge in Wisconsin. Transactions of the
American Fisheries Society 30: 90-93.
Nelson, J.S. 2006. Fishes of the World. Wiley and Sons, Inc., Hoboken, NJ, USA.
Oehmcke, A.A., L. Johnson, J. Klingbiel, and C. Wistrom. 1965. The Wisconsin
muskellunge, its life history, ecology, and management. Wisconsin Conservation
Department Publication 225.
Oehmcke, A.A. 1969. Muskellunge management in Wisconsin. Department of Natural
Resources, Bureau of Fish Management, Management Report 19, Madison.
Petit, R.J., A. El Mousadik, and O. Pons 1998. Identifying populations for conservation
on the basis of genetic markers. Conservation Biology 12: 844-855.
Philipp, D.P. and G.S. Whitt. 1991. Survival and growth of northern, Florida, and
reciprocal F1 hybrid largemouth bass in central Illinois. Transactions of the
American Fisheries Society 120: 58-64.
Philipp, D.P. and J.E. Claussen. 1995. Fitness and performance differences between two
stocks of largemouth bass from different river drainages within Illinois.
American Fisheries Society Symposium 15: 236-243.
Philipp D.P., J.E. Claussen, T.W. Kassler, and J.M. Epifanio. 2002. Mixing stocks of
largemouth bass reduces fitness through outbreeding depression. Symposium 31
American Fisheries Society Bethesda, MD. 349-363.
Potvin, C. and L. Bernatchez. 2001. Lacustrine spatial distribution of landlocked Atlantic
salmon populations assessed across generations by multilocus individual
assignment and mixed-stock analyses. Molecular Ecology 10: 2375-2388.
Reading, B.J., P.S. Wills, R.C. Heidinger, and E.J. Heist. 2003. Development of
microsatellite markers for muskellunge (Esox masquinongy) and cross species
amplification in two other esocids. Molecular Ecology Notes 3: 447-449.

27
Ruzzante, D.E. 1998. A comparison of several measures of genetic distance and
population structure with microsatellite data: bias and sampling variance.
Canadian Journal of Fisheries and Aquatic Sciences 55: 1-14.
Ryman N., S. Palm, C. André, G.R. Carvalho, T.G. Dahlgren, P.E. Jorde, L. Laikre, L.C.
Larson, A. Palmé, D.E. Ruzzante. 2006. Power for detecting genetic divergence:
differences between statistical methods and marker loci. Molecular Ecology. 15:
2031-2045.
Scott, W.B. and E.J. Crossman. 1973. Freshwater Fishes of Canada. Journal of Fisheries
Research Board of Canadian Bulletin. 194. 966 pp.
Serns, S.L. and L.M Andrews. 1986. Comparative survival and growth of three sizes of
muskellunge fingerlings stocked in four northern Wisconsin lakes. American
Fisheries Society Special Publication 15: 229-237.
Shaklee, J.B. and K.P. Currens. 2003. Genetic stock identification and risk assessment.
Pages 291-328 in E.M. Hallerman, editor. Population genetics: principles and
applications for fisheries scientists. American Fisheries Society, Bethesda,
Maryland.
Simonson, T. 2002. Muskellunge Management Update. Publication FH-508-2002,
Bureau of Fisheries Management and Habitat Protection. Wisconsin Department
of Natural Resources. Madison, Wisconsin.
Simonson, T.D. and S.W. Hewett. 1999. Trends in Wisconsin‘s muskellunge fishery.
North American Journal of Fisheries Management 19: 291-299.
Sloss, B.L. 2004. Recommendations for broodstock selection, handling, and hatchery
strategies within the Wisconsin muskellunge propagation program. Technical
Report issued to Wisconsin Department of Natural Resources. 15 pp.
STOCS. 1981. Stock concept international symposium. Canadian Journal of Aquatic
Science 38: 1457-1921.
Strand, R.F. 1986. Identification of principle spawning areas and seasonal distribution
and movements of muskellunge in Leech Lake, Minnesota. American Fisheries
Society Special Publication 15: 62-73.
Swain D.P., J.A. Hutchings, and C.J. Foote. 2005. Environmental and genetic influences
on stock identification characters. Pages 45-85. in S.X. Cardrin, K.D. Friedland,
and J.R. Waldman editors. Stock Identifications Methods Applications in
Fisheries Science. Elsevier Academic Press, London, UK.

28
Templeton, A.R. 1986. Coadaptation and outbreeding depression. Pages 105-116. in M.E.
Soule´, editor. Conservation Biology: the science of scarcity and diversity.
Sinauer Assocs., Inc., Sunderland, MA.
Waples, R.S. and O.R. Gaggiotti. 2006. What is a population? An empirical evaluation of
some genetic methods for identifying the number of gene pools and their degree
of connectivity. Molecular Ecology 15: 1419-1439.
Wingate, P.J. 1986. Philosophy of muskellunge management. American Fisheries Society
Special Publication 15: 199-202.
Wingate, P.J. and J.A. Younk. 2007. A recipe for successful muskellunge management –
a Minnesota success story. Environmental Biology of Fishes 79: 125-136.
Younk, J.A. and R.F. Strand. 1992. Performance evaluation of four muskellunge Esox
masquinongy strains in two Minnesota lakes. Minnesota Department of Natural
Resources, Division of Fisheries Investigational Report 418.

29
Figure 1. Native range of muskellunge in Wisconsin according to Becker (1983).

30
Figure 2. Three hatcheries involved with muskellunge propagation in Wisconsin and
their relative location in the state. (1) Governor Tommy G. Thompson State Fish
Hatchery, (2) Art Oehmcke State Fish Hatchery, and (3) Wild Rose State Fish Hatchery.
1
3
2

31
Figure 3. Current genetic management zones suggested by Fields et al. (1997) based
partially on allozyme and mtDNA data.
32
Figure 4. Major watersheds in northern Wisconsin: (A) Lake Superior, (B) Upper St.
Croix, (C) Upper Chippewa, (D) Upper Wisconsin, and (E) Green Bay (Lake Michigan).
A
B C D E

33
Chapter 1:
TEMPORAL GENETIC INTEGRITY OF LAC COURTE OREILLES’
MUSKELLUNGE POPULATION: IMPLICATIONS FOR MUSKELLUNGE
MANAGEMENT PRACTICES
Abstract–The muskellunge is the state fish of Wisconsin and plays a major role
in Wisconsin‘s sport fishery. Since the 1930s, muskellunge have been propagated
extensively in the state. The traditional brood source for northwest WI has been Lac
Courte Oreilles (LCO), a 2,015.5 ha lake in the Chippewa River drainage favored
because of its production of trophy-sized fish (>127 cm). However, stocking from other
populations into LCO has occurred in the past. Concerns exist regarding the impacts on
the genetic integrity of LCO muskellunge in light of these past stocking events and,
subsequently, potential negative impacts of using LCO as a brood source for stocking in
Wisconsin. The objective of this research was to determine if two suspect stocking
events that used perceived slow/small growth strains of muskellunge disrupted the
genetic integrity of the LCO population by evaluating the temporal genetic stability of
LCO. Archived scale samples from all lakes (pre-stocking), from LCO 1966 and 1976,
and contemporary samples from all lakes (LCO and both brood sources) were used to
assess the genetic characteristics at nine microsatellite loci from each sampled population
over time. The ability to distinguish among populations with microsatellite genetic
diversity is critical to assessing stocking impacts; the assumption that sources of stocked
fish (from waters within the Chippewa R. drainage) are from reproductively isolated
populations has not been tested. Genetic and allelic diversity comparisons between the
three muskellunge populations showed significant differences existed both pre-stocking
and post-stocking. The muskellunge population in LCO changed through time but no

34
significant impact associated with introgression of genetic material from the two source
populations or other admixture scenarios were observed. No observed impact from the
two suspect stocking events was found suggesting these two events had no long-term
genetic impact on the temporal integrity of LCO.

35
INTRODUCTION
Muskellunge propagation is a prominent management tool used by the Wisconsin
Department of Natural Resources (WDNR) and local fishing clubs to maintain or
supplement populations throughout the state. Muskellunge stocking began in Wisconsin
near the turn of the 20th
century (Nevin 1901; Margenau 1999) with the intent of
alleviating the impacts of overexploitation by simply augmenting the number of available
muskellunge. As propagation practices and efficiency have become more refined,
stocking has been used to restore extirpated populations, expand the range of the species,
and supplement populations without sufficient natural recruitment (Simonson and Hewett
1999).
In 1939, the Lac Courte Oreilles (LCO; Sawyer Co.) muskellunge population was
first used as a brood source by the Wisconsin Department of Natural Resources (WDNR)
for propagation. The lake contained a prominent muskellunge fishery renowned for large
trophy fish. Recently, concerns have risen regarding a perceived lack of growth potential
in LCO muskellunge. These concerns focus on potential genetic impacts of two suspect
stocking events that have occurred in LCO over the past 50 years. In particular, LCO
was supplementally stocked with fish from Big Spider Lake (SPI; Sawyer Co.) in 1956
and Mud/Callahan Lake (MC; Sawyer Co.) in the early 1980s. These two lake systems
contain muskellunge that exhibit slow growth rates and/or small growth (i.e., size)
potential (Lyons and Margenau 1986; Margenau and Hanson 1996). These studies
implicated a genetic/hereditary factor as a contributing cause to the low growth potential
in these populations.

36
Because growth attributes are, at least in part, heritable, the growth differences
among these three populations may likely be the partial result of local adaptation to local
conditions. Local adaptation is a genetic change (such as growth attributes) that occurs in
isolated populations because of natural selection driven by local environmental factors
(Shaklee and Currens 2003). Lake-dwelling muskellunge populations are generally
isolated from one another (i.e., no migration between them); therefore, the populations
are subjected to genetic changes via genetic drift (random events) and natural selection.
Over time, selection pressures lead to populations that are locally adapted to their
specific, isolated environment, and lead to coadapted gene complexes (Meselson and
Radding 1975; Chatti et al. 1999; Hallerman 2003; Swain et al. 2005). Ultimately, this
process results in a locally adapted population that is, theoretically, genetically superior
within its current, native environment.
The supplemental stocking of LCO with SPI and MC muskellunge could have
negatively affected the genetic integrity and, subsequently, the growth performance of
LCO muskellunge if slow growing stocked fish introgressed with the native stock. Once
local adaptation and gene complexes are formed, any disruption of local adaptations
and/or gene complexes (i.e., disruption of the genetic integrity) can negatively affect
fitness (Lynch and Walsh 1998). The most common fisheries practice that can disrupt
genetic integrity is the stocking of genetically divergent sources. Two potential causes of
disruption are: 1) outbreeding depression and 2) introgression. Outbreeding depression
is formally defined as the loss of fitness because of disruption of locally adapted
characteristics or coadaptive gene complexes (Dobzhansky 1948; Templeton 1986;
Lynch 1991; Hallerman 2003). Diminished performance consistent with outbreeding

37
depression has been shown in largemouth bass (Micropterus salmoides; Philipp and
Whitt 1991; Philipp and Claussen 1995). Introgression is the movement of alleles from
one population/species to another through hybridization. As such, introgression has the
can introduce genetic variants and, subsequently, heritable characteristics of one
population into another. Since LCO, SPI, and MC have shown different growth
attributes, the two supplemental stocking events in question could have resulted in
heritable changes in the growth potential of LCO muskellunge.
The goal of this study was to examine the impacts of two supplemental stocking
events on the genetic integrity of LCO. The specific objective was to evaluate the
temporal genetic dynamics of the LCO muskellunge population to determine if
significant genetic changes were observed in samples representing pre-stocking samples
and post-stocking samples.

38
METHODS
Study Site
The primary study site for this project was Lac Courte Oreilles (LCO), a 2,015.5
ha soft water, drainage lake located in Sawyer County and connected to both Grindstone
Lake and Whitefish Lake (Sather and Threinen 1968). Two secondary study sites were
Mud Lake/Callahan Lake (MC) and Spider Lake (SPI), also located in Sawyer County.
(Figure 1). Mud Lake and Callahan Lake are connected, soft water drainage lakes that
collectively cover 218 ha (Sather and Threinen 1968) and are well known for their
network of bays and inlets. Spider Lake is a 581.7 ha hard water drainage lake comprised
of three main basins: Big Spider Lake, Little Spider Lake, and Clear Lake (Sather and
Threinen 1968), and connected to Fawn Lake and North Lake (Sather and Threinen
1968).
Study Design
Archived scale and spine samples and contemporary fin clips preserved in 95%
ethanol comprised the majority of samples in this study. The scales and spines were
collected over the past 50+ years during spring lake surveys by the WDNR. Samples
(target n = 50/temporal sample) were obtained from all three sites including multiple
temporal samples from LCO (Figure 2). LCO samples consisted of individuals from
1956 (LCO56), 1966 (LCO66), 1976 (LCO76), 1990 (LCO90), and 2006 (LCO06).
Samples for SPI were from 1956 (SPI56; the same year fish were taken from SPI for
brood source) and the MC sample was from 1979 (MC79; just prior to the MC stocking
event). These samples were specifically chosen to represent pre- and post-stocking event

39
samples and to characterize the genetic diversity of the historic SPI and MC populations
that served as brood sources for the two supplemental stockings of concern (Figure 2).
Tests were conducted in a linear time fashion such that LCO56 was compared to LCO66,
LCO66 was then compared to LCO76, etc. All LCO samples were tested against the
single SPI and MC samples to test for similarity in any temporal sample to the other
populations. Three experimental assumptions/prerequisites were necessary for this study.
First, it was necessary for genetic differences to be present between the LCO population
at the time of supplementation and the two source populations (SPI and MC). Second,
significant disruption of the genetic integrity of the LCO population was necessary for a
change in performance characteristics to occur. Third, the suite of molecular markers
employed was capable of detecting an admixture event as well as, any disruption in
genetic integrity.
The first stocking event of interest occurred in 1956 and used brood stock from
SPI. The LCO56 and SPI56 were used as pre-stocking samples and the remainder of the
LCO samples acted as post-stocking samples. The two pre-stocking samples (LCO56
and SPI56) were compared to each other to measure genetic differences between the two
populations. The samples were then tested in the linear temporal fashion described
previously. If no differences were observed between the pre- and post-stocking samples,
no impact of the stocking event would be inferred. The MC stocking event was evaluated
by first comparing the LCO76 to MC79 samples to measure genetic differences between
the two populations. Samples from LCO56, LCO66, LCO76, and MC79 were used as
pre-stocking samples and post-stocking samples from LCO90 and LCO06 were evaluated
to determine if genetic integrity was impacted. Differences between the pre-stocking

40
LCO samples and the post-stocking LCO samples were evaluated as potential signals of
disruption of the LCO genetic integrity due to these two events.
Lab Methods
DNA was extracted from the fin-clip samples using the Wizard®
Promega
Genomic DNA purification kit (Promega Corporation, Madison, WI) and from the
archived scale and spine samples using the QIAGEN DNeasy®
extraction kit (QIAGEN
Inc., Valencia, CA). Both extraction methods followed the manufacturer‘s suggested
protocol except the final elution of extracted DNA, which was in 200 µl of Tris-low-
EDTA buffer. DNA quality was evaluated by electrophoresing the DNA in a 1% agarose
gel in the presence of ethidium bromide, visualized with UV light, and compared to a
molecular weight ladder BioLine Hyperladder™ I (Bioline USA Inc., Randolph, MA).
DNA quantities were measured with a NanoDrop® ND-1000 spectrophotometer
(NanoDrop Technologies, Wilmington, DE). All samples were normalized to equal DNA
concentrations (25 ng/μl) to ensure consistent results between samples.
Nine microsatellite loci developed (Sloss et al. 2008) for the genetic analysis of
muskellunge (Table 1) were used to genotype all sampled individuals. Multiplex PCR
reactions (three loci/reaction; Table 1) were conducted to optimize time, effort, and cost
while genotyping samples (Sloss et al. 2008). Loci were PCR amplified with
fluorescently labeled primers and analyzed on an ABI Prism® 377XL automated DNA
sequencer (Applied Biosystems Inc., Foster City, CA). Allele sizes were determined by
comparison to an internal size standard (GeneFlo™ 625, Chimerx Inc., Milwaukee, WI)
using GeneScan® (Applied Biosystems, Inc.).
41
Statistical Analysis
Basic diversity measures.—Basic genetic diversity measures were calculated for
comparisons among temporal samples. Allelic richness (Ar), a measure of the number of
alleles/locus, was estimated based on the rarefaction method of Kalinowski (2004) to
account for unequal sample sizes using HP-Rare (Kalinowski 2005). The observed
heterozygosity (Ho) and expected heterozygosity (He) of each temporal sample was
calculated using GenAlEx v6 (Peakall and Smouse 2006). Each temporal sample was
tested for conformance to Hardy-Weinberg Equilibrium (HWE) using the exact test of
Guo and Thompson (1992) as implemented in GENEPOP 3.4 (Raymond and Rousset
1995) that uses a Markov Chain with 1,000 dememorization steps, 100 batches and 1,000
iterations. Due to known issues with low expected genotype frequencies and exact tests
of HWE, loci/population tests showing significant deviation from HWE underwent
pooling of rare genotypes (all genotypes with expected frequency <1% were pooled) and
re-testing using a chi-square test (Crisp et al. 1978; Hedrick 2000). A gametic
disequilibrium (GD) test for independence of each locus was conducted in GENEPOP 3.4
(Raymond and Rousset 1995) using 1,000 dememorization steps, 100 batches and 1,000
iterations. For both the HWE and the GD tests, alpha (0.05) was corrected for multiple
pairwise tests using a sequential Bonferroni correction (Rice 1989).
Population differentiation.—Tests of differentiation between temporal samples
were conducted using three primary approaches to ensure consistent findings. First, an
analog of Wright‘s FST, theta (θ; Weir and Cockerham 1984), was calculated and tested
for deviation from zero (i.e., no genetic difference) using Arlequin v3.1 (Excoffier et al.
2005). A sequential Bonferroni correction was used to correct alpha (α1 = 0.05) for

42
multiple pairwise comparisons. Second, a test of genic differentiation was used to test
pairwise differences among all temporal samples. This test evaluates whether allele
frequency distributions are significantly different among samples. This was conducted
using the genic differentiation option in GENEPOP v3.4 (Raymond and Rousset 1995)
with 1,000 dememorization steps, 100 batches and 1,000 iterations. A final test of
population differentiation was performed using genetic distance measures and an
unrooted neighbor-joining (NJ; Saitou and Nei 1987) clustering method. Cavalli-Sforza
and Edwards (1967) chord distance was chosen because it is appropriate when looking at
random changes caused by genetic drift (Shaklee and Currens 2003), it has been shown to
be efficient and reliable in obtaining the correct tree topology (Takezaki and Nei 1996),
and it is commonly used and accepted for microsatellite genetic data (Allendorf and
Luikart 2007). A pairwise matrix of chord distance values was used to construct
unrooted NJ trees in POWERMARKER (Liu and Muse 2005). Confidence in tree
topology was inferred using 1,000 bootstrap pseudoreplicates performed in
POWERMARKER. A majority rule consensus was constructed using the CONSENSE
routine in PHYLIP v3.67 (Felsenstein 2007). A node was considered moderately
resolved if the bootstrap values were ≥50% and highly resolved at bootstrap values
≥85%.

43
RESULTS
Basic Diversity Measures
In total, 321 muskellunge samples were genotyped to evaluate the temporal
stability of LCO with the smallest sample (n = 36) from LCO06 and the largest (n = 50)
from LCO76, LCO90, and MC79 (Table 2). Mean diversity measures were mostly
consistent across populations with the LCO56 and SPI56 sample showing lower diversity
than the other samples (Table 2). For example, allelic richness for LCO56 and SPI56
was 3.921 and 4.187, respectively, whereas the next lowest mean value was 4.317
(MC79). Initial tests of HWE showed 12 loci out of 63 tests (total of 9 loci and 7
populations with one locus monomorphic) were significantly different from HWE
expectations. Following sequential Bonferroni correction and the pooling of rare
genotypes, all loci and populations conformed to HWE.
Evaluation of Stocking Events
The 1956 Spider Lake stocking event.—The first step in evaluating the 1956-
stocking event was to test whether significant population differences existed between the
LCO56 sample and the SPI56 sample. The two samples were significantly divergent.
Genic differentiation tests showed significant differences between LCO56 and SPI56 (p-
value = <0.001; Table 3). The two samples had an FST = 0.107 that was significantly
different from zero (p < 0.0001; Table 4). Therefore, a key assumption (divergence
among source population and LCO) was met.
The 1980s Mud-Callahan Lake stocking event.—The same approach was taken
when investigating the MC stocking event. Pairwise FST values comparing MC79 and

44
LCO66 showed significant divergence with an FST value of 0.0612 (p-value = <0.0001;
Table 4). The NJ tree showed that MC was different from all LCO samples (Figure 3).
This showed that MC and LCO were genetically different at the time MC was used as a
brood source. Genic differentiation confirmed significant differences between MC and
pre- and post- stocking LCO samples (Table 3). These three tests showed that LCO was
different from MC both before and after the stocking event. In addition, pre- and post-
stocking samples of LCO showed no genetic changes caused by stocking.
Lac Courte Oreilles genetic stability from 1950 to present.—The second step in
evaluating the 1956 and 1980s stocking events was to test for temporal genetic change
among pre-stocking samples of LCO and post-stocking samples of LCO. Tests of
differentiation based on FST and genic differentiation appeared to yield different results.
The only significant difference among the FST tests was between LCO66 and LCO76, a
period with no stocking. Genic differentiation comparisons showed genetic stability of
LCO; however, the LCO90 versus LCO06 comparison was statistically significant using
genic differentiation. When the unrooted NJ tree is considered in this portion of the
analysis, it appears there is relative stability among the LCO samples and no evidence of
impact from the SPI56 stocking (Figure 3). The genic differentiation test used in this
portion of the analysis examines the allele distribution of the study populations.
Therefore, this test can be more sensitive to shifts in dominant alleles and/or small
sample sizes that show less allelic diversity (Raymond and Rousset 1995).

45
DISCUSSION
This study examined the muskellunge population of LCO using archived scale
samples to evaluate the temporal genetic dynamics in light of two stocking events that
used perceived smaller, slower growing strains of muskellunge. The ability to distinguish
among three populations in a relatively small geographic area using microsatellites was
expected even with the stocking history of these lakes due to the relatively isolated nature
of muskellunge populations, small population sizes, and the high levels of diversity
observed at microsatellite loci. Studies similar to this have been successful in finding
differences among populations on a micro-geographical scale (Adams and Hutchings
2003; Brunner et al. 1998; Beacham and Wood 1999; Angers et al 1995).
The genetic integrity of LCO‘s muskellunge population was unaffected by either
the SPI stocking event or the MC stocking event. This could be due to low survival rates
of stocked fish and/or low reproductive success of stocked fish that reach maturity. The
apparent conflict between the results of FST and genic differentiation tests was likely a
result of genetic drift and the sensitivity of genic differentiation to changes consistent
with genetic drift. The results showed that LCO, SPI, and MC were genetically distinct
before and after stocking. In addition, the genetic stability of LCO was shown through
FST values, genic differentiation, and the distance-based NJ tree. These findings suggest
that neither the SPI nor the MC stocking events affected the genetic stability of the LCO
muskellunge population.
Many studies have looked at the survival of stocked fish, particularly sport fish
such as muskellunge and walleye (Hanson and Margenau 1992; Margenau 1992; Wahl
1999; Parsons and Pereira 2001; Jennings et al. 2005). Wahl (1999) found that survival

46
rates increased when larger muskellunge were stocked into waters with similar
temperatures. It was also shown that predation, starvation, and stress are major factors in
survival of stocked fish (Hanson and Margenau 1992). In addition, Margenau (1992)
found overwinter survival rates were low in stocked muskellunge. This suggests the
suspect stocking events did not result in genetic impact because the probability of stocked
fish reaching reproductive maturity was low, and if the stocked fish failed to reproduce
and pass on their genetic material, the genetic integrity of the receiving population would
not be affected by the supplemental stockings. Nevertheless, the potential genetic risk of
such activities existed and continues to exist. For example, a current study in Minnesota
has shown significant admixture in the Moose Lake muskellunge population with a
minimum of three distinct genetic strains mixing over the past 40+ years (Loren Miller,
Univ. of Minnesota, personal communication).
Philopatry may have played a major role in the failure of stocked fish to influence
the long-term genetic integrity of LCO. Philopatry can cause reproductive isolation in
large populations (Gharrett and Zhivotosky 2003) and natal philopatry (or homing) has
been well documented in anadromous fish species, particularly the Pacific salmonids
(Oncorhynchus spp.), but also documented in some freshwater species. For example,
lake whitefish (Coregonus clupeaformis) are suggested to home to natal spawning
grounds throughout Lake Michigan (Ebener 1980; Ebener and Copes 1985). Miller et al.
(2001) found that northern pike returned to spawning sites based on a mark-recapture
study done in Kabetogama Lake, in Voyageurs National Park, Minnesota. This study
also found, using microsatellites, that the study lake had multiple spawning aggregates
suggesting that northern pike show natal philopatry (Miller et al 2001). Crossman (1990)

47
found that muskellunge also return to the same spawning sites. In his study, nets were set
every year during egg collection for muskellunge propagation in Stony Lake, Ontario,
Canada. Fish were marked as they were caught and recaptures were recorded. Because
of the large number of recaptured spawning fish in the same net year after year,
Crossman (1990) concluded that the study population was philopatric. If muskellunge
exhibit natal philopatry, stocking a self-sustaining population such as LCO may result in
augmenting the population‘s numbers but failure of the adult, stocked fish to contribute to
the gene pool of the population. In essence, the stocked fish may not have the correct
cues to find the proper spawning location. Other studies have observed lack of homing
ability in stocked and transplanted fish, which lead to low survival of stocked fish (Bams
1976; Gharrett and Smoker 1991; Gilk et al. 2004). The theory that stocked fish fail to
home to spawning sites and thus fail to reproduce may be a factor for the lack of
observed impact in this study.
It is possible some stocked fish reached a size that was sampled in the creel or
population estimate surveys over the timeframe of this study. The 1976 LCO sample is a
likely example of this. The LCO sample from 1976 was found to be genetically different
from all other LCO samples. One hypothesis was there was an undocumented stocking
event that essentially created a ―put-grow-take‖ fishery that disrupted the 1976 LCO
sample. These stocked fish could have grown to a size that was susceptible to the
sampling gear (e.g., fyke nets) and were subsequently included in the current study. Over
time, they would have slowly been removed through either natural mortality and/or
angler harvest. More importantly, they failed to reproduce and, thus, had no lasting
genetic effect on the LCO population‘s genetic integrity. This hypothesis was supported

48
when a stocking receipt confirmed a 1972-stocking event where surplus fish from the Art
Oehmcke State Fish Hatchery (Woodruff, WI) were stocked into both Grindstone and
Whitefish Lakes which have water connections with LCO. The Oehmcke State Fish
Hatchery serves northeastern Wisconsin and represents a genetically different
management zone in the state. Therefore, it was likely that genetically divergent fish
(compared to LCO) were stocked into these two lakes. Additionally, this finding
incidentally validated the approach used for this study since it identified a previously
undocumented stocking event through genetic analysis and showed that it failed to have
any long-term genetic effect on LCO‘s genetic integrity.
The findings in this current study are consistent with previous research conducted
on a northern pike population by Larsen et al. (2005) to evaluate possible impacts or
introgression from supplemental stockings over the past 50 years. Larsen et al. (2005)
distinguished between brood sources, receiving populations, and archived samples. Their
study showed no significant differences between archived and contemporary samples
from the receiving populations; however, they did find significant differences between
study populations (Larsen et al. 2005). By analyzing possible admixtures, they found no
stocked fish were present in contemporary samples, which led the authors to conclude
stocked fish failed to influence the receiving populations.
In conclusion, no genetic impact of either of the two documented LCO
supplemental stocking events in question was found. Through genetic analysis, the two
brood sources and LCO were distinguishable, implying discrete gene pools prior to
stocking. Little genetic change was observed in LCO over the 50-year period of this
study. The muskellunge population of LCO was not significantly impacted by

49
introgression or outbreeding depression likely due to low survival rates of stocked
fingerlings and/or low reproductive success of stocked fish.

50
LITERATURE CITED
Adams, B.K. and J.A. Hutchings. 2003. Microgeographic population structure of brook
charr: a comparison of microsatellite and mark and recapture data. Journal of Fish
Biology 62: 517-533.
Allendorf, F.W. and G. Luikart. 2007. Conservation and the Genetics of Populations.
Blackwell Publishing Company. Malden, Massachusetts
Angers, B., L. Bernatchez, A. Angers, and L. Desgroseillers. 1995. Specific
microsatellite loci for brook charr (Salvelinus fontinalis, Salmonidae) reveal strong
population subdivision on a microgeographical scale. Journal of Fish Biology 47:
177-185.
Bams, R.A. 1976. Survival and propensity for homing as affected by presence or absence
of locally adapted paternal genes in two transplanted populations of pink salmon
(Oncorynchus gorbuscha). Journal of the Fisheries Research Board of Canada 33:
2716-2725.
Beacham, T.D. and C.C. Wood. 1999. Application of microsatellite DNA variation to
estimation of stock composition and escapement of Nass River sockeye salmon
(Oncorhychus nerka). Canadian Journal of Fisheries and Aquatic Sciences 56: 297-
310.
Brunner, P.C., M.R. Douglas, and L. Bernatchez. 1998. Microsatellite and mitochondrial
DNA assessment of population structure and stocking effects in artic charr
Salvelinus alpinus (Teleostei: Salmonidae) from central alpine lakes. Molecular
Ecology 7: 209-223.
Cavalli-Sforza, L. L. and A.W. F. Edwards. 1967. Phylogenetic analysis: models and
estimation procedures. Evolution 21: 550–570.
Chatti, N., K. Said, J. Catalan, J. Britton-Davidian, and J.C. Auffray. 1999.
Developmental instability in wild chromosomal hybrids of the house mouse.
Evolution 53: 1268-1279.
Crisp, D. J., Beaumoni, A. R., Flowerdew, M. W., Vardy, A. (1978). The Hardy-
Weinberg test – a correction. Marine Biology 46: 181-183.
Crossman, E.J. 1990. Reproductive homing in muskellunge, Esox masquinongy.
Canadian Journal of Fisheries and Aquatic Science 47: 1803-1812.
Dobzhansky, T. 1948. Genetics of natural populations. XVI. Altitudinal and seasonal
changes in certain populations of Drosophila pseudoobscura and Drosophila
persimilis. Genetics 33: 158-176

51
Ebener, M.P. 1980. Population dynamics of lake whitefish, Coregonus clupeaformis, in
Green Bay and Lake Michigan east of Door County, Wisconsin. M.S. thesis
University of Wisconsin Stevens Point.
Ebener, M.P. and F.A. Copes. 1985. Population statistics, yield estimates, and
management considerations for two lake whitefish stocks in Lake Michigan. North
American Journal of Fisheries Management 5: 435:448.
Excoffier, L., P.E. Smouse, and J.M. Quattro. 1992. Analysis of molecular variance
inferred from metric distances among DNA haplotypes: application to human
mitochondrial DNA restriction data. Genetics 131: 479-491.
Excoffier, L., G. Laval, and S. Schneider. 2005. Arlequin version 3.1: An integrated
software package for population genetics data analysis. Evolutionary
Bioinformatics Online 1: 47-50.
Felsenstein, J. 2007. PHYLIP (Phylogeny Inference Package) version 3.67. Distributed
by the author. Department of Genome Sciences, University of Washington, Seattle.
Gharrett, A.J. and W.W. Smoker. 1991. Two generations of hybrids between even- and
odd-year pink salmon (Oncorhynchus gorbuscha). Genetica 111: 259-267.
Gharrett, A.J. and L.A. Zhivotovsky. 2003. Migration. Pages 141-174. in E.M.
Hallerman, editor. Population Genetics: Principles and Applications for Fisheries
Scientists. American Fisheries Society, Bethesda, Maryland.
Gilk, S.E., I.A. Wang, C.L. Hoover, W.W. Smoker, S.G. Taylor, A.K. Gray, and A.J.
Gharrett. 2004. Outbreeding depression in hybrids between spatially separated pink
salmon, Oncorhychus gorbuscha, populations: marine survival, homing ability, and
variability in family size. Environmental Biology of Fishes 69: 287-197
Guo, S.W., E.A. Thompson. 1992. Performing the exact test of the Hardy-Weinberg
proportions for multiple alleles. Biometrics 48: 361-372.
Hallerman, E.M. 2003. Genetic stock identification and risk assessment. Pages 291-328
in E.M. Hallerman, editor. Population genetics: principles and applications for
fisheries scientists. American Fisheries Society, Bethesda, Maryland.
Hanson, D.A. and T.L. Margenau. 1992. Movement, habitat selection, behavior, and
survival of stocked muskellunge. North American Journal of Fisheries Management
12: 474-483.
Hedrick, P.W. 2000. Genetics of Populations. Jones and Bartlett Publishers. Boston,
Massachusetts.

52
Jennings, M.J., J.M. Kampa, G.R. Hatzenbeler, E.E. Emmons. 2005. Evaluation of
supplemental walleye stocking in northern Wisconsin lakes. North American
Journal of Fisheries Management 25: 1171-1178.
Kalinowski, S.T. 2004. Counting alleles with rarefaction: private alleles and hierarchical
sampling designs. Conservation Genetics 5: 539-543.
Kalinowski, S.T. 2005. HP-Rare: a computer program for performing rarefaction on
measures of allelic diversity. Molecular Ecology Notes. 5: 187-189.
Larson, P.F., M.M. Hanson, E.E. Nielsen, L.F. Jensen, V. Loeschcke. 2005. Stocking
impact and temporal stability of genetic composition in brackish northern pike
population (Esox lucius L.), assessed using microsatellite DNA analysis of
historical and contemporary samples. Heredity 95: 136-143.
Liu, K. and S.V. Muse. 2005. PowerMarker: an integrated analysis environment for
genetic marker analysis. Bioinformatics 21: 2128-2129.
Lynch, M. 1991. The genetic interpretation of inbreeding depression and outbreeding
depression. Evolution 45: 622-629.
Lynch, M. and B. Walsh. 1998. Genetics and analysis of quantitative traits. Sinauer
Associates, Inc., Sunderland, MA.
Lyons, J. and Margenau, T.L. 1986. Population dynamics of stocked adult muskellunge
(Esox masquinongy) in Lac Court Oreilles, Wisconsin 1961-1977. Wisconsin
Department of Natural Resources Technical Bulletin 160. 11p.
Margenau, T.L. 1992. Survival and cost-effectiveness of stocked fall fingerlings and
spring yearling muskellunge in Wisconsin. North American Journal of Fisheries
Management 12: 484-493.
Margenau, T.L. 1999. Muskellunge stocking strategies in Wisconsin: the first century and
beyond. North American Journal of Fisheries Management 19: 223-229.
Margenau, T.L. and D.A. Hanson. 1996. Survival and growth of stocked muskellunge:
effects of genetic and environmental factors. Wisconsin Department of Natural
Resources, Research Report 175, Madison.
Meselson, M.S. and C.M. Radding. 1975. A general model for genetic recombination.
Proceedings of the National Academy of Sciences 72: 358-361
Miller, L.M., L. Kallemeyn, and W. Senanan. 2001. Spawning-site and natal-site fidelity
by northern pike in a large lake: mark-recapture and genetic evidence. Transactions
of the American Fisheries Society 130: 307-316.

53
Nevin, J. 1901. The propagation of muskellunge in Wisconsin. Transactions of the
American Fisheries Society 30: 90–93.
Parsons, B.G. and D.L. Pereira. 2001. Relationship between walleye stocking and year-
class strength in three Minnesota lakes. North American Journal of Fisheries
Management 21: 801-808.
Peakall, R., Smouse, P.E., 2006. GENALEX 6: genetic analysis in Excel. Population
genetic software for teaching and research. Molecular Ecology Notes 6: 288-295.
Philipp, D.P. and G.S. Whitt. 1991. Survival and growth of northern, Florida, and
reciprocal F1 hybrid largemouth bass in central Illinois. Transactions of the
American Fisheries Society 120: 58-64.
Philipp, D.P. and J.E. Claussen. 1995. Fitness and performance differences between two
stocks of largemouth bass from different river drainages within Illinois. American
Fisheries Society Symposium 15: 236-243.
Raymond, M. and Rousset, F. 1995. GENEPOP (version 1.2): population genetics
software for exact tests and ecumenicism. Journal of Heredity 86: 248-249.
Rice, W.R. 1989. Analyzing tables of statistical tests. Evolution 43: 223-225.
Saitou, N., and M. Nei. 1987. The neighbor-joining method: a method for reconstructing
phylogenetic trees. Molecular Biology and Evolution 4: 406-425.
Sather, L.M. and C.W. Threinen. 1968. Surface water of Sawyer county. Department of
Natural Resources. Madison, WI.
Shaklee, J.B. and K.P. Currens. 2003. Genetic stock identification and risk assessment.
Pages 291-328 in E.M. Hallerman, editor. Population genetics: principles and
applications for fisheries scientists. American Fisheries Society, Bethesda,
Maryland.
Simonson, T.D. and S.W. Hewett. 1999. Trends in Wisconsin‘s muskellunge fishery.
North American Journal of Fisheries Management 19: 291-299.
Sloss, B.L., R.P. Franckowiak, and E.L. Murphy. 2008. Development of new
microsatellite loci and multiplex reactions for muskellunge (Esox masquinongy).
Molecular Ecology Notes 8: 811-813.
Swain D.P., J.A. Hutchings, and C.J. Foote. 2005. Environmental and genetic influences
on stock identification characters. Pages 45-85. in S.X. Cardrin, K.D. Friedland, and
J.R. Waldman editors. Stock Identifications Methods Applications in Fisheries
Science. Elsevier Academic Press, London, UK.

54
Takezaki, N., and M. Nei. 1996. Genetic distances and reconstruction of phylogenetic
trees from microsatellite DNA. Genetics 144: 389-399.
Templeton, A.R. 1986. Coadaptation and outbreeding depression. Pages 105-116. in M.E.
Soule´, editor. Conservation Biology: the Science of Scarcity and Diversity. Sinauer
Associates, Inc., Sunderland, MA.
Wahl, D.H. 1999. An ecological context for evaluating the factors influencing
muskellunge stocking success. North American Journal of Fisheries Management
19: 238-248.
Weir, B.S. and C.C. Cockerham. 1984. Estimating F-statistics for the analysis of
population structure. Evolution 38: 1358-1370.
Wingate, P.J. and J.A. Younk. 2007. A recipe for successful muskellunge management –
a Minnesota success story. Environmental Biology of Fishes 79: 125-136.

55
Table 1. Microsatellite loci used in the current study and description of primer size
range, and number of alleles for each locus (Sloss et al. 2008).
Locus Primer Sequence (5'-3')
Number
of Alleles
Allele Size
(bp)
Ema A10 GCCAGATGTTCCTCTTCG 6 152-164
TGGTCCAGAAAGCGTTATG
Ema A102 GGAACAGGTAGTGGGCAGAG 4 131-139
CTTGGTGTGGGGTTTTGTG
Ema A104 TGCAGTCTGGAACGACATC 4 161-167
TGCTCACAGCAATCTCATG
Ema B120 TGTTCCTGAAAGAGTTTTGTTG 2 234-236
CGAGGGAGATGGAGACTG
Ema C1 CATTGTCTGCCTGAGGTATCT 4 205-221
AAATCCAGTGTGACAGAAGTTG
Ema D5 CCGTAGACGCACAAAAAC 25 201-285
TGGTTATCTGGCATCATTG
Ema D12a CGTATGAACAGTAGGTTTTGTCTG 11 181-229
GATGGTGGATTGTGCCTATC
Ema D116 GCAAAAGGACACAACACTG 14 239-295
CGAGCAGAGGGAAACTAAG
Ema D126a CCAATCAGAATGTGGCATTT 3 128-136
AAAGGAACCCTGAAGTCAG

56
Table 2. Descriptive statistics for all sampled populations including sample size (n),
number of loci genotyped (Loci), unbiased heterozygosity (He) and standard deviation
(He SD), observed heterozygosity (Ho) and standard deviation (Ho SD), and allelic
richness (Ar).
Population n Loci He He SD Ho Ho SD Ar
LCO56 30 9 0.5221 0.0781 0.3486 0.0319 4.00
SPI56 18 9 0.5378 0.0941 0.3961 0.0439 4.22
LCO66 41 9 0.5502 0.0793 0.5213 0.0277 5.00
LCO76 50 9 0.5659 0.0862 0.5331 0.0246 5.11
MC79 48 9 0.5453 0.0915 0.5338 0.0262 4.89
LCO90 47 9 0.5635 0.0840 0.5823 0.0246 4.89
LCO06 35 9 0.5877 0.0799 0.5895 0.0278 5.33

57
Table 3. Genic differentiation p-values for all temporal pairwise comparisons.
LCO56 SPI76 LCO66 LCO76 MC79 LCO90 LCO06
LCO56 *
SPI76 <0.0001 *
LCO66 0.0009 <0.0001 *
LCO76 <0.0001 <0.0001 <0.0001 *
MC79 <0.0001 0.0091 <0.0001 <0.0001 *
LCO90 0.0006 <0.0001 0.0683 0.0040 <0.0001 *
LCO06 0.0064 <0.0001 0.0842 0.0002 <0.0001 0.4125 *
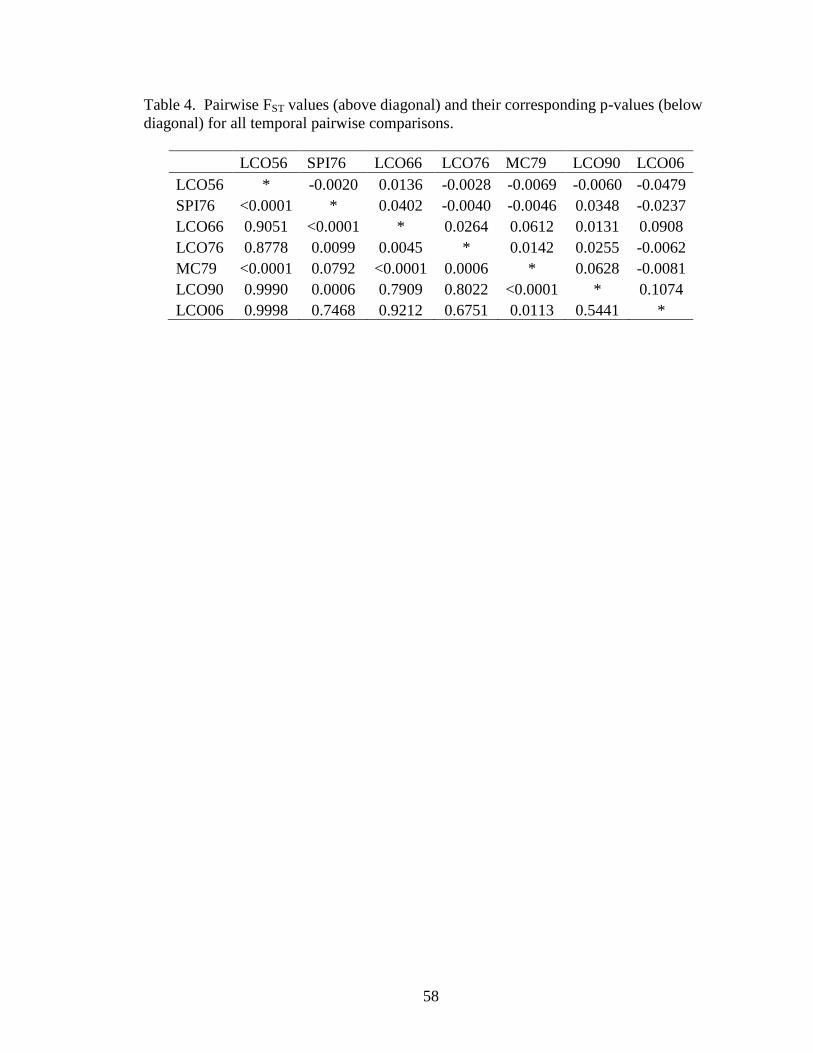
58
Table 4. Pairwise FST values (above diagonal) and their corresponding p-values (below
diagonal) for all temporal pairwise comparisons.
LCO56 SPI76 LCO66 LCO76 MC79 LCO90 LCO06
LCO56 * -0.0020 0.0136 -0.0028 -0.0069 -0.0060 -0.0479
SPI76 <0.0001 * 0.0402 -0.0040 -0.0046 0.0348 -0.0237
LCO66 0.9051 <0.0001 * 0.0264 0.0612 0.0131 0.0908
LCO76 0.8778 0.0099 0.0045 * 0.0142 0.0255 -0.0062
MC79 <0.0001 0.0792 <0.0001 0.0006 * 0.0628 -0.0081
LCO90 0.9990 0.0006 0.7909 0.8022 <0.0001 * 0.1074
LCO06 0.9998 0.7468 0.9212 0.6751 0.0113 0.5441 *
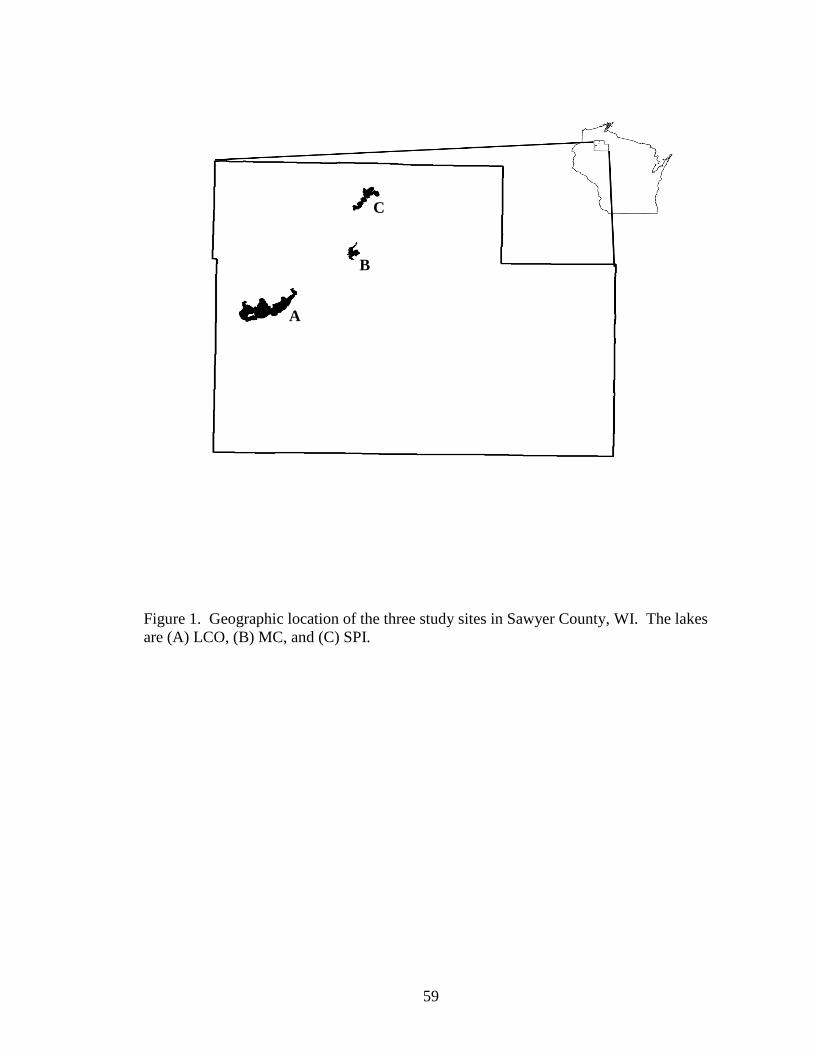
59
Figure 1. Geographic location of the three study sites in Sawyer County, WI. The lakes
are (A) LCO, (B) MC, and (C) SPI.
A
B
C
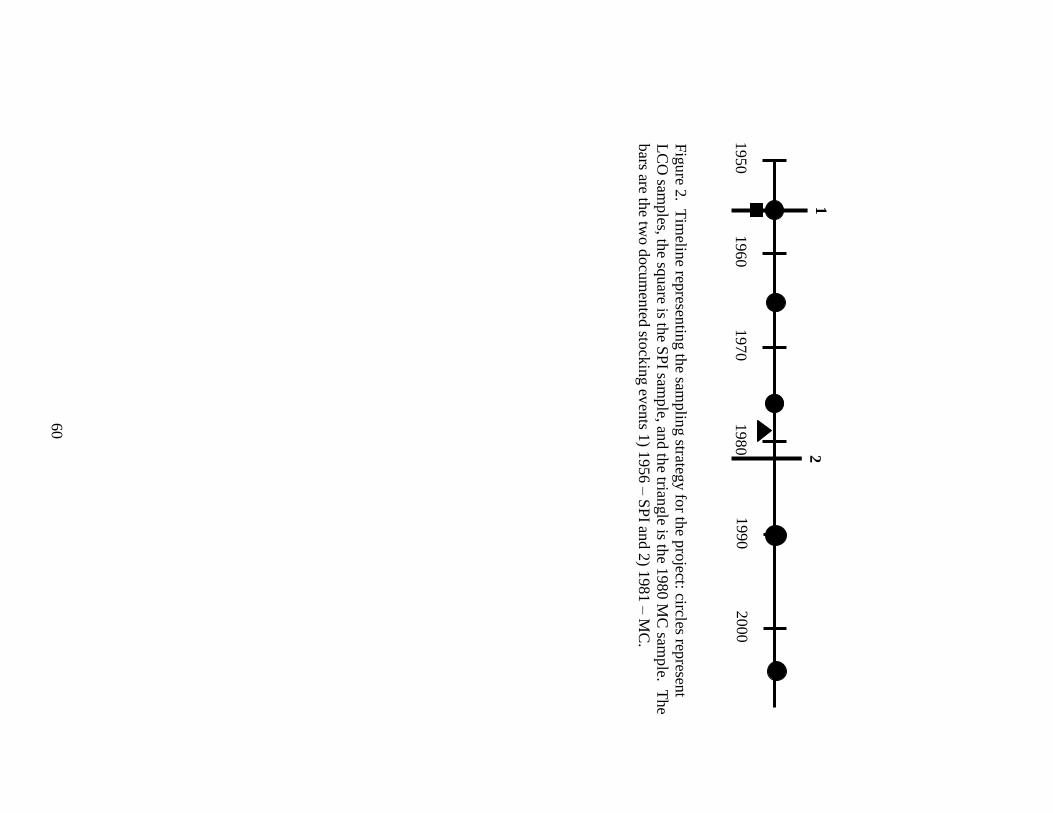
60
Fig
ure 2
. Tim
eline rep
resentin
g th
e samplin
g strateg
y fo
r the p
roject: circles rep
resent
LC
O sam
ples, th
e squ
are is the S
PI sam
ple, an
d th
e triangle is th
e 1980 M
C sam
ple. T
he
bars are th
e two d
ocu
men
ted sto
ckin
g ev
ents 1
) 1956 –
SP
I and 2
) 1981 –
MC
.
1950
1960
1970
1980
1990
2000
1
2
►-

61
Figure 3. Unrooted NJ tree showing population clustering based on Cavalli-Sforza and
Edwards (1967) genetic distance. Node support represents the percent resolution of that
node in 1,000 bootstrap pseudoreplicates.
LCO76
MC79
SPI56
LCO90
LCO56
LCO06
LCO66
60%
100%

62
Appendix 1. Allele frequencies for each microsatellite locus used to assess the genetic
integrity of LCO‘s muskellunge population.
Locus/Allele Population
D126 LCO56 SPI56 LCO66 LCO76 MUD79 LCO90 LCO06
128 0.2625 0.0741 0.2045 0.1224 0.2347 0.2551 0.3000
132 0.0125 0.2778 0.0909 0.3163 0.2653 0.1633 0.0857
136 0.7250 0.6481 0.7045 0.5612 0.5000 0.5816 0.6143
A104
161 0.1250 0.0172 0.0714 0.0625 0.1000 0.0851 0.0694
163 0.5625 0.7414 0.5833 0.5625 0.7111 0.5319 0.5000
165 0.3125 0.1724 0.3333 0.3750 0.1778 0.3830 0.4306
167 0.0000 0.0690 0.0119 0.0000 0.0111 0.0000 0.0000
C1
205 0.0000 0.0333 0.0128 0.0521 0.0227 0.0300 0.0286
209 0.0000 0.3667 0.0769 0.0000 0.3295 0.0600 0.0857
213 1.0000 0.6000 0.8974 0.8750 0.5909 0.8900 0.8429
217 0.0000 0.0000 0.0128 0.0729 0.0568 0.0200 0.0429
B120
234 0.2353 0.4444 0.5000 0.4643 0.8621 0.5116 0.4722
236 0.7647 0.5556 0.5000 0.5357 0.1379 0.4884 0.5278
A102
135 0.6310 0.3889 0.5652 0.5104 0.4783 0.5745 0.4306
137 0.3690 0.6111 0.4348 0.4896 0.5217 0.4255 0.5694
A10
156 0.0000 0.0000 0.0000 0.0000 0.0000 0.0000 0.0143
158 0.8243 0.9464 0.8421 0.9082 0.9796 0.8830 0.8429
164 0.1757 0.0536 0.1579 0.0918 0.0204 0.1170 0.1429
D5
201 0.0000 0.0000 0.0000 0.0104 0.0000 0.0000 0.0000
209 0.0000 0.0000 0.0000 0.0417 0.0000 0.0125 0.0147
213 0.4583 0.0417 0.0469 0.2083 0.1034 0.1625 0.1176
221 0.0833 0.0417 0.1563 0.0208 0.0517 0.0000 0.0588
225 0.0000 0.0000 0.0781 0.0625 0.0345 0.0000 0.0588
229 0.0000 0.0000 0.0313 0.0208 0.0000 0.0500 0.0441
233 0.0833 0.1667 0.0000 0.1250 0.0517 0.0500 0.0147
237 0.0000 0.0417 0.0000 0.0208 0.3276 0.0000 0.0000
241 0.0000 0.1250 0.0313 0.0729 0.0690 0.0625 0.0735
245 0.0833 0.0000 0.0781 0.0938 0.0862 0.1250 0.1029
249 0.1250 0.2500 0.1250 0.0417 0.0345 0.1000 0.1324
253 0.0833 0.0833 0.1406 0.0833 0.0517 0.1750 0.1029
257 0.0000 0.1250 0.1250 0.0313 0.1724 0.1375 0.0882
261 0.0000 0.0417 0.0156 0.0000 0.0000 0.0125 0.0735

63
Appendix 1. (Continued).
Locus/Allele Populations
D5 (Cont.) LCO56 SPI56 LCO66 LCO76 MUD79 LCO90 LCO06
265 0.0417 0.0417 0.0781 0.0938 0.0172 0.0500 0.1029
269 0.0417 0.0417 0.0469 0.0208 0.0000 0.0250 0.0000
273 0.0000 0.0000 0.0313 0.0521 0.0000 0.0250 0.0147
277 0.0000 0.0000 0.0156 0.0000 0.0000 0.0000 0.0000
281 0.0000 0.0000 0.0000 0.0000 0.0000 0.0125 0.0000
D12a
181 0.0000 0.0000 0.0135 0.0111 0.0000 0.0000 0.0147
193 0.0000 0.0000 0.0000 0.0222 0.0000 0.0000 0.0147
197 0.0000 0.0000 0.0000 0.0222 0.0000 0.0556 0.0294
201 0.1600 0.0625 0.1757 0.1778 0.1778 0.1111 0.1912
205 0.4400 0.1875 0.4459 0.3000 0.2000 0.3778 0.2353
209 0.1200 0.3542 0.2027 0.1667 0.2778 0.1222 0.2059
213 0.1200 0.2083 0.0811 0.2333 0.2222 0.1556 0.1765
217 0.1400 0.1667 0.0270 0.0556 0.0778 0.1333 0.1176
221 0.0200 0.0208 0.0270 0.0111 0.0444 0.0333 0.0147
225 0.0000 0.0000 0.0270 0.0000 0.0000 0.0111 0.0000
D116
233 0.0000 0.0000 0.0000 0.0106 0.0000 0.0000 0.0000
239 0.0000 0.0000 0.0000 0.0213 0.0000 0.0244 0.0143
243 0.0000 0.0000 0.1471 0.0638 0.0333 0.0854 0.0571
247 0.4231 0.2000 0.2353 0.2553 0.2667 0.2561 0.2571
251 0.3077 0.1000 0.2794 0.1809 0.0500 0.2439 0.1286
255 0.1923 0.0500 0.0735 0.0213 0.0333 0.0854 0.1571
259 0.0000 0.0000 0.0147 0.0213 0.0000 0.0244 0.0286
263 0.0000 0.1500 0.0000 0.0213 0.0167 0.0000 0.0286
267 0.0000 0.2000 0.0735 0.1064 0.1667 0.0732 0.0429
271 0.0769 0.0500 0.0147 0.1277 0.2167 0.0610 0.0571
275 0.0000 0.0000 0.0294 0.0851 0.0167 0.0610 0.1000
279 0.0000 0.2500 0.1324 0.0745 0.1667 0.0488 0.0714
283 0.0000 0.0000 0.0000 0.0106 0.0333 0.0122 0.0000
287 0.0000 0.0000 0.0000 0.0000 0.0000 0.0000 0.0429
291 0.0000 0.0000 0.0000 0.0000 0.0000 0.0244 0.0143

64
Chapter 2:
CONTEMPORARY GENETIC STOCK IDENTIFICATION OF MUSKELLUNGE
IN NORTHERN WISCONSIN
Abstract –The Wisconsin Department of Natural Resources (WDNR) has
managed muskellunge populations through a combination of regulations and stocking.
Wisconsin‘s specific management goals include providing a range of angling
opportunities, including trophy fisheries and protecting the genetic integrity of native
populations. Defining existing stock structure, which is the result of natural processes
and past introductions, is a prerequisite to selecting appropriate brood sources and
defining operational stock boundaries to ensure adequate protection of genetic integrity in
supplementally stocked fish. Presently, Wisconsin manages within zones representing a
composite of genetic data and hydrology data that correlates with major watersheds.
Nevertheless, the current management zones have been questioned and identification of
stock boundaries within the state would allow more scientifically stringent management
of the muskellunge in WI. The main objective of this study was to determine if genetic
structure exists among naturally recruiting muskellunge populations in Wisconsin.
Samples (~50/population) were collected by the WDNR during the spring of 2006.
Genetic diversity at 14 microsatellite loci was used to delineate the genetic structure
among 24 populations from throughout the native range of muskellunge in the state.
Genetic stock identification, clustering approaches, and analysis of molecular variance
(AMOVA) were used to delineate groupings of populations corresponding to genetic
stocks and/or genetic management units. All populations were genetically distinct likely
due to genetic drift. Despite the high level of population diversity, structure consistent

65
with major watershed boundaries (eastern and western Wisconsin) existed. These results
show management of muskellunge on genetically defined population structure is feasible
in Wisconsin.

66
INTRODUCTION
The WDNR‘s muskellunge propagation program recently underwent a series of
strategic modifications aimed at meeting the goal of protecting the genetic integrity of
local, naturally reproducing populations (Sloss 2004). The focus of these modifications
was minimizing the risk to naturally recruiting, putatively native populations of
muskellunge. To further these efforts and effectively manage Wisconsin‘s muskellunge
populations into the future, a more resolved pattern of genetic stock structure is needed.
A key concept in managing the genetic integrity of fishery resources is the stock
concept and how populations are distributed across the landscape (Kutkuhn 1981;
STOCS 1981). A fishery stock is defined as an intraspecific group of randomly mating
individuals that is reproductively isolated, shares a common gene pool, and has temporal
and spatial stability (modified from Larkin 1972; Ihssen et al. 1981). The fishery stock
concept is based on the idea that managing for the long-term sustainability of the
component stocks will lead to long term stability of the entire resource (STOCS 1981).
The use of the stock concept in fishery management programs allows multiple
populations to be grouped for management purposes while still managing a biologically
cohesive unit (Dizon et al. 1992). In recent years, a fishery stock has become somewhat
synonymous with the management unit (MU). An MU is formally defined as the
ecological component of larger evolutionary significant units that are diagnosed as a
population(s) that exhibit significant allele frequency differences (Moritz 1999).
A critical assumption of any stock management approach is that the stocks being
managed have been identified in a standardized, reliable, and biologically relevant
manner (Laikre et al. 2005). In practice, fisheries managers often recognize stocks as a

67
group of organisms harvested in a particular area. This approach is dependent on what
and how much information is available including data on age structure, life history, and
other phenotypic and demographic estimates. Collecting these data requires extensive
field-based efforts that are often not feasible (Carvalho and Hauser 1994), particularly
with less abundant apex predators. Furthermore, meristic, morphological, and life history
data can converge and/or diverge due to environmental effects thereby not measuring
isolation/separation of gene pools and/or populations (Shaklee and Currens 2003).
However, it is preferable to base stock identification on more definable measures.
Genetic data has become a favored method for stock identification due to the large
amount of data that can be quickly generated from small non-lethal amounts of tissue
(Miller and Kapuscinski 1996) and the ability of genetic data to statistically assess the
level of connectivity between populations, and thus, the degree of isolation between
populations (Shaklee and Currens 2003).
The WDNR currently attempts to maintain the genetic integrity of their
muskellunge resource using genetic management zones (GMZs) originally developed as
part of a molecular genetic study conducted in the mid-1990s (Figure 1; Fields et al.
1997). These GMZs are used for delineating regions where stocking can occur within the
zone with lower risk of outbreeding depression but is prohibited across zones due to the
potential risk of outbreeding depression. Fields et al. (1997) sampled ten muskellunge
populations (n = 26-30 individuals/population) from four major watersheds within
northern Wisconsin (Upper Chippewa, St. Croix, Upper Wisconsin River, and Lake
Superior; Figure 2) and analyzed allozyme and mitochondrial DNA (mtDNA) diversity to
describe stock structure. The mtDNA data showed no variability among populations, so
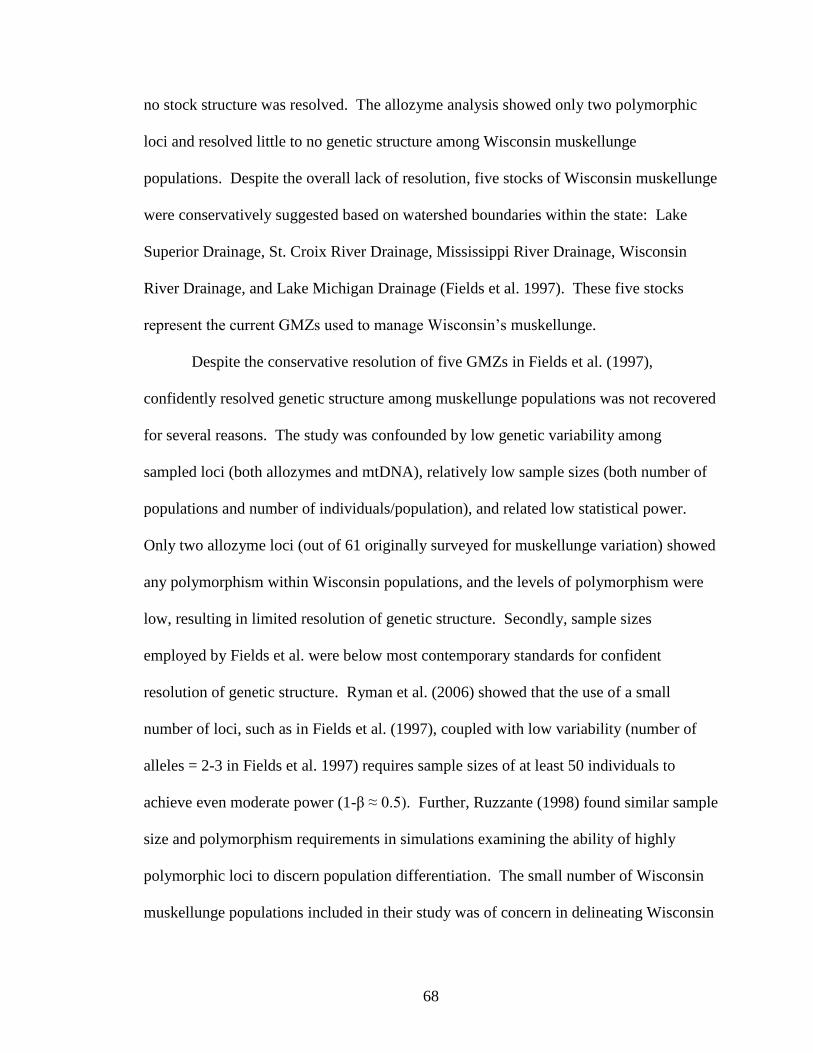
68
no stock structure was resolved. The allozyme analysis showed only two polymorphic
loci and resolved little to no genetic structure among Wisconsin muskellunge
populations. Despite the overall lack of resolution, five stocks of Wisconsin muskellunge
were conservatively suggested based on watershed boundaries within the state: Lake
Superior Drainage, St. Croix River Drainage, Mississippi River Drainage, Wisconsin
River Drainage, and Lake Michigan Drainage (Fields et al. 1997). These five stocks
represent the current GMZs used to manage Wisconsin‘s muskellunge.
Despite the conservative resolution of five GMZs in Fields et al. (1997),
confidently resolved genetic structure among muskellunge populations was not recovered
for several reasons. The study was confounded by low genetic variability among
sampled loci (both allozymes and mtDNA), relatively low sample sizes (both number of
populations and number of individuals/population), and related low statistical power.
Only two allozyme loci (out of 61 originally surveyed for muskellunge variation) showed
any polymorphism within Wisconsin populations, and the levels of polymorphism were
low, resulting in limited resolution of genetic structure. Secondly, sample sizes
employed by Fields et al. were below most contemporary standards for confident
resolution of genetic structure. Ryman et al. (2006) showed that the use of a small
number of loci, such as in Fields et al. (1997), coupled with low variability (number of
alleles = 2-3 in Fields et al. 1997) requires sample sizes of at least 50 individuals to
achieve even moderate power (1-β ≈ 0.5). Further, Ruzzante (1998) found similar sample
size and polymorphism requirements in simulations examining the ability of highly
polymorphic loci to discern population differentiation. The small number of Wisconsin
muskellunge populations included in their study was of concern in delineating Wisconsin

69
genetic structure; Wisconsin has >700 muskellunge populations throughout the state.
Although their study focused on muskellunge throughout the Midwest, only 10
populations were sampled in the northern third of Wisconsin, representing a small
proportion (<2.0%) of the total muskellunge populations in this region. The GMZs as
outlined by Fields et al. (1997) should be considered conservative management zones.
Recent developments in methods for conservation genetic studies, such as highly
polymorphic microsatellite loci and non-lethal sampling techniques, could provide
valuable data and potential clarity to the resolution of muskellunge GMZs in Wisconsin.
The goal of this study was to determine an initial genetic stock structure
prediction for naturally recruiting populations of muskellunge in northern Wisconsin.
The specific objectives of this study were (1) to determine the utility of newly developed
microsatellite DNA markers (Sloss et al. 2008) to estimate population differentiation and
underlying genetic structure among muskellunge populations, (2) to determine if genetic
structure occurs among muskellunge populations, and (3) to test whether any observed
structure was consistent with contemporary management units.

70
METHODS
Study Area and Sampling Design
The study area was northern Wisconsin, defined for this study as all waters north
of State Highway 29 (Figure 4). This area included the ceded territory, which contains
the majority of Wisconsin‘s muskellunge waters (623/711; Simonson 2002), and includes
the bulk of the muskellunge‘s native range in Wisconsin (Figure 5; Becker 1983). Since
such a large area and number of populations were considered, populations were chosen in
consultation with the WDNR Fisheries and Science Services personnel. To be included
in the study, populations ideally met three criteria: 1) natural recruitment, 2) perceived
native population, and 3) no recent stocking events (i.e., >10 years since last recorded
stocking). The target number of populations was 25, distributed across the geographical
area of this study. Criteria three was relaxed to allow for better geographical coverage
and to meet the target goal of 25 populations. Fifty individuals per population were
sampled based on the suggestions of Ruzzante (1998), a study that examined the effects
of sample size on genetic structure among simulated populations. This sample size,
coupled with the number and distribution of populations, provided a high probability of
identifying stock structure if it existed across the muskellunge‘s contemporary
distribution.
The majority of the muskellunge populations were sampled in conjunction with
the WDNR‘s spring fyke net surveys. In addition to the target sample populations, tissue
samples and phenotypic data were also collected from the lakes that the WDNR considers
possible brood lakes for Wisconsin‘s propagation program (Sloss 2004). Phenotypic data
collected included total length (cm), weight (g), and sex (when possible). Genetic

71
samples consisted of a fin clip preserved in individually labeled vials with 95% EtOH or
fin clips, scales, and/or spines dried and stored in individually labeled scale envelopes.
Scales and fin rays were collected with the standard WDNR protocol whereas fin clips
were collected with the standard operating procedure of the Molecular Conservation
Genetics Laboratory (MCGL; Appendix 1).
Genetic Analysis
DNA was extracted from the fin-clip samples using the Wizard®
Promega
Genomic DNA purification kit (Promega Corporation, Madison, WI) and from the
archived scale and fin ray samples using the QIAGEN DNeasy® extraction kit (QIAGEN
Inc., Valencia, CA). Both extraction methods followed the manufacturer‘s suggested
protocol except the final elution of extracted DNA was in 200 µl of Tris-low-EDTA
buffer. DNA quality was evaluated by electrophoresing the DNA in a 1% agarose gel in
the presence of ethidium bromide, visualized with UV light, and compared to a molecular
weight ladder BioLine Hyperladder™ I (Bioline USA Inc., Randolph, MA). DNA
quantities were measured with a NanoDrop® ND-1000 spectrophotometer (NanoDrop
Technologies, Wilmington, DE). All samples were normalized to equal DNA
concentrations (25 ng/μl) to ensure consistent results in subsequent genotype procedures.
Fourteen microsatellite loci developed (Sloss et al. 2008) for the genetic analysis
of muskellunge (Table 1) were used to genotype all sampled individuals. Multiplex PCR
reactions (3 loci/reaction; Table 1) were used to optimize time, effort, and cost while
genotyping samples (Sloss et al. 2008). Loci were PCR amplified with fluorescently
labeled primers and analyzed on an ABI Prism® 377XL automated DNA sequencer

72
(Applied Biosystems Inc., Foster City, CA). Allele sizes were determined by comparison
to an internal size standard (GeneFlo™ 625, Chimerx Inc., Milwaukee, WI) using
GeneScan® (Applied Biosystems, Inc.).
Statistical Analysis
Usefulness of markers.—Several basic diversity measures were calculated for
evaluating the differences among populations and to estimate the overall usefulness of the
microsatellite markers employed to estimate genetic structure. Three primary measures
of genetic diversity were used to assess the utility of the markers based on
recommendations of Ruzzante (1998) and direct comparison with the previous genetic
study of Fields et al. (1997). Measures of allelic diversity, the number of alleles/locus in
a population, were used to determine diversity differences between populations. Allelic
richness (Ar) was estimated based on the rarefaction method of Kalinowski (2004) to
account for unequal sample sizes using HP-Rare (Kalinowski 2005). Heterozygosity was
also used to determine basic genetic differences between populations. Both expected
heterozygosity (He) and observed heterozygosity (Ho) were used to estimate the level of
genetic diversity within populations and can be used to determine genetic differences
between populations (Allendorf and Luikart 2007). Expected heterozygosity (He) is the
frequency of heterozygotes expected in a population with random mating (Frankham et
al. 2002; Allendorf and Luikart 2007). Observed heterozygosity (Ho) was directly
measured as the proportion of sampled individuals that were heterozygotes (Allendorf
and Luikart 2007). The Ho and He of each population was calculated in GenAlEx v6
(Peakall and Smouse 2006).

73
Genetic stock identification.—Genetic stock identification uses a series of
hierarchical tests of population structure to establish stable groups of populations that
account for significant genetic similarities within the groups and significant genetic
differences among groups (Shaklee and Currens 2003). The general approach of GSI is
to 1) establish the ability of the allelic frequencies to describe the genotypic distributions
observed within and between samples (similar to the basic diversity measures), 2)
examine the distribution of genetic diversity across samples to identify potential
patterns/structure in the data, and 3) test competing hypotheses that could explain the
observed patterns of genetic diversity (Shaklee and Currens 2003).
The initial tests of GSI consist of testing the population/loci samples for
conformance to Hardy-Weinberg equilibrium (HWE) expectations and independence of
loci using a gametic disequilibrium test. Population samples were tested for conformance
to HWE using the exact test of Guo and Thompson (1992) as implemented in GENEPOP
3.4 (Raymond and Rousset 1995) that uses a Markov Chain with 1,000 dememorization
steps, 100 batches and 1,000 iterations. Due to known issues with low expected genotype
frequencies and exact tests of HWE, locus/population tests showing significant deviation
from HWE underwent pooling of rare genotypes (all genotypes with expected frequency
<1% were pooled) and re-testing using a chi-square test (Crisp et al. 1978; Hedrick
2000). A gametic disequilibrium test for independence of each locus was conducted in
GENEPOP 3.4 (Raymond and Rousset 1995) using 1,000 dememorization steps, 100
batches and 1,000 iterations. For both the HWE and the gametic disequilibrium tests,
alpha (initial 0.05) was corrected for multiple pairwise tests using a sequential Bonferroni
correction (Rice 1989).

74
The next phase of GSI consists of testing for the presence of significant genetic
structure among the sampled populations. This phase tests a null hypothesis of panmixia
across all sampled populations. A test of genic differentiation that assumes that divergent
populations have different allele frequency distributions was performed (Ho= all
distributions equal; Raymond and Rousset 1995). The test of global genic differentiation
was conducted in GENEPOP 3.4 (Raymond and Rousset 1995) using default settings
(1,000 dememorization steps, 100 batches and 1,000 iterations). An alternative estimate
of differentiation, theta (θ; Weir and Cockerham 1984), was estimated for all pairwise
population comparisons. Theta is an FST analog that estimates the degree of genetic
subdivision between two populations such that values of θ close to zero are essentially no
genetic difference and increasing values (to a maximum of one) are indicative of
increasing differentiation. Estimation of θ was performed in Arlequin 3.11 (Excoffier et
al. 2005) with 5,000 permutations of the data to test the null hypothesis that θ equals zero.
Following the confirmation of genetic structure among samples, estimates of
genetic relations among populations was performed to develop a series of putative groups
that are subsequently tested in a series of hierarchical tests (Shaklee and Currens 2003).
An unrooted neighbor joining (NJ; Saitou and Nei 1987) tree based on Cavalli-Sforza and
Edwards‘ (CSE; 1967) chord distance was used as a heuristic tool for identifying putative
groups of populations. The confidence of the recovered NJ tree topologies was
determined using 500 bootstrap pseudoreplicates. All genetic distance measures, NJ
trees, and bootstrap confidence values were constructed using POWER MARKER (Liu
and Muse 2005) and the CONSENSE program in PHYLIP v3.67 (Felsenstein 2007). The
resulting unrooted trees were visualized in TREEVIEW (Page 1996).

75
The final phase of GSI consists of hierarchical tests assessing the genetic
significance of groups estimated from the proceeding step (Shaklee and Currens 2003).
An analysis of molecular variance (AMOVA) is essentially analogous to a nested
ANOVA except that it tests the distribution of molecular variance components within and
among groups as opposed to mean variance (Excoffier et al. 1992). AMOVA examines
the total molecular variance (calculated as a series of Euclidean distances) and estimates
the molecular variance attributable to various ‗hierarchical levels‘ in the analysis. To test
the putative groups derived from heuristically examining the unrooted NJ trees, the level
of variance attributed to differences among groups (i.e., putative population groups from
the NJ trees) and among populations within groups (i.e., the populations found inside a
single putative group) was estimated in Arlequin v3.11 (Excoffier et al. 2005). The
significance of the variance estimates (within populations, among groups, and among
populations within groups) was calculated using 5,000 permutations of the original allelic
data according to Arlequin v3.11 (Excoffier et al. 2005). Significant among group
genetic variance was evidence of biologically relevant groups being tested. However,
when significant within-group variance was also observed, additional AMOVAs were
performed by testing less inclusive groups (i.e., more groups with less populations within
each).
Alternatively, the presence of significant within-group variance was examined by
conducting pairwise tests of population differentiation (θ; Weir and Cockerham 1984) to
determine where specific differences occurred. Pairwise values of θ were estimated using
FSTAT v2.9.3.2 (Goudet 1995) with significance estimated using a locus bootstrap

76
procedure and a combined locus p-value within FSTAT (Goudet 1995; Petit et al. 2001).
For all pairwise tests, alpha was adjusted using the sequential Bonferroni (Rice 1989).
Potential influences of stocked populations.—Despite the desire to only include
populations with no or limited stocking history, some populations were included in the
original analysis that violated this prerequisite. Because these populations could result in
conflicting signal if admixed fish were included in the analysis, two additional series of
GSI tests were performed using a) only currently recognized Class I (i.e., naturally
reproducing) muskellunge waters (Simonson 2002) and b) populations that have no
recorded stocking events since 1990. These two criteria were chosen to provide the best
possible resolution of genetic structure among Wisconsin‘s muskellunge populations and
to allow a comparison with the GSI results with all sampled populations included.
Test of contemporary management units—Contemporary management units were
tested to determine if they constituted significant biological (genetic) units. Groups of
sampled populations were constructed based on their current management unit
designation and analyzed using AMOVA. If the groups are biologically significant, the
AMOVA should produce a significant among group variance. All tests were conducted
in Arlequin v3.11 (Excoffier et al. 2005) as previously described.

77
RESULTS
Twenty-four muskellunge populations were sampled in conjunction with the
WDNR‘s spring 2006 fyke netting surveys (Table 2; Figure 6). Fin clips were collected
from lakes that met the first two inclusion criteria (natural recruitment and suspected
native population). Sample sizes per population ranged from 21 (Lower Clam, Sawyer
County) to 50 (several populations) fish (Table 4). Lake Chippewa, a flowage on the
Chippewa River, is thought to have an east and a west spawning aggregate; as such, they
were sampled and analyzed as two different samples. Three populations (Ghost Lake,
Sawyer County; Spider Lake, Ashland County; Towanda Lake, Vilas County) were
excluded from the study because they had fewer than 20 sampled individuals. One
thousand thirteen individual muskellunge samples representing 23 populations were
genotyped at 14 microsatellite loci to analyze genetic diversity and examine muskellunge
genetic structure in northern Wisconsin.
Usefulness of the Markers
A total of 114 alleles across 14 loci were observed with a mean of 71.4 alleles per
population (SD = 8.08; range 90 alleles in Caldron Falls, Marinette County and 55 alleles
in Pine Lake, Iron County). The mean number of alleles/locus ranged widely among
populations 3.93 (Pine Lake, Iron County) to 6.43 (Caldron Falls, Marinette County)
(Table 3) and among loci (2 in Ema B110 to 25 in Ema D5; Appendix 2). Allele
frequencies also showed high levels of variation (Appendix 2). For example, Ema D6
exhibited large differences in the most common allele between populations with allele
165 varying from a high frequency of 44.79% (Mud Lake/Callahan Lake, Sawyer

78
County) to a low frequency of 3.03% (Pine Lake, Iron County). A second allele at Ema
D6 (229) was also present in all populations and ranged from a high frequency of 51.09%
(North Nokomis Lake, Oneida County) to a low of 1.04% (Mud Lake/Callahan Lake,
Sawyer County). Heterozygosity varied among populations with He ranging from 0.4914
(Pine Lake, Iron County) to 0.6150 (Big Crooked Lake, Vilas County) and Ho ranging
from 0.4893 (Big Crooked Lake, Vilas County) to 0.6061 (Birch Lake, Vilas County)
(Table 3). Private alleles were observed in five sampled populations (Butternut Lake,
Price County; Tomahawk Lake, Oneida County; Kentuck Lake, Nicolet/Vilas County;
Spider Lake, Sawyer County; Seven Island Lake, Lincoln County).
Genetic Stock Identification
All loci conformed to HWE and exhibited no significant gametic disequilibrium.
Of the 336 HWE calculations, 29 tests were initially significant at the 0.05 alpha-level,
and all comparisons were non-significant following rare allele pooling (Hedrick 2000)
and sequential Bonferroni correction of alpha (Rice 1989). Initial tests of gametic
disequilibrium showed 29 out of 336 comparisons were significant at the 0.05 level.
Following sequential Bonferroni correction (Rice 1989), 10 comparisons remained
significant. Given the low number (2.9% of all tests) that were significant and the lack of
consistent loci combinations at disequilibrium, all loci combinations were considered to
be in equilibrium; therefore, all loci were considered independent for subsequent
analyses.
A global test of genic differentiation showed significant (p = <0.00001) genetic
structure existed among the sampled populations, essentially rejecting the null hypothesis

79
of panmixia across all sampled populations. Pairwise tests of genic differentiation
showed a high degree of uniqueness among muskellunge populations with only 17 of the
276 comparisons (6.16%) showing similar allele frequency distributions (Table 5)
following sequential Bonferroni correction. Genetic subdivision among populations, as
estimated by θ, showed 36 of 276 comparisons (13.04%) were not significantly different
from zero following sequential Bonferroni correction.
A spatial representation of population relationships (NJ tree of CSE distance)
showed a geographical east/west split among populations (Figure 6). Because of the
inclusion of several recently stocked populations in the final data, an alternative NJ tree
was constructed using only populations not stocked since 1990 (Figure 7). The east/west
split observed in the initial tree (all populations; Figure 6) was more pronounced in the
alternative tree, that included only populations that have not been stocked since before
1990 (Figure 7).
An abbreviated GSI approach was used in this study to estimate a preliminary
genetic structure of muskellunge in Wisconsin. The GSI approach (described previously)
was truncated at a maximum of five groups (as opposed to complete delineation of gene
pools). Analysis of molecular variance tests showed significant genetic structure among
the sampled populations consistent with genic differentiation results. Groups were
chosen based on groupings observed in the CSE-based NJ trees. Five AMOVA tests
were performed (Table 5). The first AMOVA (two groups: east/west split) had the
largest between group variance (2.0%). The majority of variance came from differences
between individuals within groups (≈ 94%). Subsequent AMOVAs attempting to
delineate additional genetic structure within each of these two groups, consistently

80
produced significant among group variances (p = <0.001 – 0.015) but did not find
significant within-group patterns of variance.
Tests of Contemporary Units
Contemporary management units (per Fields et al. 1997) failed to explain the
distribution of genetic variation observed among the sampled populations (Table 6). The
AMOVA results showed that contemporary management units did not account for
significant genetic variance among the groups (% variance = -0.06%; p = 0.4781). The
observed within group variance (5.08% of total variance) was significant (p < 0.0001)
suggesting the populations within these groups had a significant level of heterogeneity.
These data showed contemporary management units do not represent genetically
definable groupings.

81
DISCUSSION
Usefulness of Genetic Markers
Microsatellite markers have become a commonly used molecular marker when
delineating stock boundaries because of their higher levels of polymorphism compared to
other markers (e.g. allozymes and mtDNA), small tissue requirements, and ability to
generate large amounts of data (Hallerman 2003). The microsatellite markers developed
by Sloss et al. (2008) showed similar basic diversity values as microsatellite markers
developed for other species (Miller and Kapuscinski 1996; Schable et al. 2002;
Hauswaldt and Glenn 2003; Keeney and Heist 2003; Reading et al. 2003). Microsatellite
variation was also higher than that seen in studies looking at population structuring of
another esocid, northern pike (Esox lucius; Miller and Kapuscinski 1996; Laikre et al.
2005).
The microsatellite markers used in this study showed enough variation to
delineate genetic structure, if it exists, based on the combination of number of usable loci
(14), number of alleles (114) at all loci, and the sample sizes per population (N = 21-50).
Kalinowski (2002) concluded that genetic markers that show high levels of
polymorphism are better suited when calculating genetic distances. His recommendation
for detecting slight genetic difference between populations was a minimum of 33
independent alleles for 100 diploid individuals. The loci in the present study showed
more than double this number in most populations, suggesting adequate sampling of
allelic diversity. Kalinowski (2005) further showed polymorphic loci do not necessarily
require a large sample size when calculating genetic distances (including Cavalli-Sforza
and Edwards chord distance and FST). In fact, large sample sizes can disrupt the

82
coefficient of variation by revealing too much variability between study groups
(Kalinowski 2005). Ruzzante (1998) further supports the use of a moderate number of
samples (20-50) given expected FST values > 0.01-0.02. Therefore, the sample sizes and
levels of diversity observed among the suite of 14 microsatellite markers used in the
present study are sufficient to predict genetic structure among Wisconsin‘s muskellunge
population.
The predicted level of resolution for the present study was higher than that of the
previous genetic structure predictions by Fields et al. (1997) because of the
aforementioned higher polymorphism of the microsatellite markers and increased sample
sizes compared to Fields et al. (1997). Fields et al (1997) found only two polymorphic
allozyme loci (out of 61 originally surveyed for muskellunge variation) within Wisconsin
populations with low levels of polymorphism (A = 2-3) resulting in limited resolution of
genetic structure (Kalinowski 2002; Kalinowski 2005). In their study, these markers
yielded enough information to delineate conservative management zones; however, with
the development of multiple, polymorphic microsatellite markers more defined stock
structure is achievable. Sample coverage of the present study was superior to the
previous study of Fields et al. (1997) in terms of coverage of the native muskellunge
range in Wisconsin and number of samples per population. Sample sizes in the present
study were chosen to maximize statistical power during analysis (Ruzzante 1998; Ryman
et al. 2006). Sample sizes employed by Fields et al. (1997) were below most
contemporary standards for confident resolution of genetic structure (N =18-30).
Therefore, based on larger population sampling, larger individuals/population, and a

83
larger number of genetic loci, this study has identified underlying differences among
populations within or between current watershed boundaries.
Genetic Structure of Muskellunge in Wisconsin
Significant structure exists among sampled populations of muskellunge in
Wisconsin based on both genic differentiation tests and AMOVA. The degree of
difference among populations was striking given 93.84% of all pairwise genic
differentiation comparisons and 86.96% of θ comparisons were significant. This level of
divergence among populations was somewhat expected given the natural history and
distribution of muskellunge in this region such as small population size and relative
isolation of populations on the landscape.
Small effective population sizes result in high levels of genetic drift and,
subsequently, high levels of divergence among even close geographic populations.
Muskellunge population density in Wisconsin is typically <1 fish/acre (Simonson 2002);
most systems in this study were <1,000 acres in size (however, Chippewa Flowage ≈
15,000 acres). The effective size of a population is often ~10-11% of the census size in
wildlife populations (Frankham 1995). Applying this reduction to the populations of
muskellunge in this study suggests the effective population size of most populations in
Wisconsin are <100 fish/population. This level of divergence should be detectable by
polymorphic genetic markers such as microsatellites (Miller and Senanan 2003). A
similar pattern of divergence and differentiation was observed in northern pike that, like
muskellunge, exhibit low genetic variation and small populations (Senanan and
Kapuscinski 2000; Miller and Senanan 2003; Laikre et al. 2005). Senanan and

84
Kapuscinski (2000) were able to distinguish between pike populations across the northern
hemisphere based mainly on FST values. In addition, Small et al. (2007) observed
significant differences between rainbow trout (Oncorhynchus mykiss) populations in the
Spokane River drainage based on FST comparisons. The differences observed among
muskellunge populations are likely because the sampled populations are small, isolated
muskellunge populations with relatively rapid allele frequency changes due to genetic
drift.
Despite high levels of diversity between populations, the NJ tree showed
hierarchical contemporary structure present in northern Wisconsin. The study
populations were grouped into an eastern and a western group, which loosely relates to
the Upper Chippewa River and the Upper Wisconsin River genetic management zones
(sensu Fields et al. 1997). Hierarchical AMOVAs supported this basic split of the
populations into two major groupings. The initial east/west AMOVA (Table 5a) showed
the highest proportion of variance explained among groups (2%; p < 0.00001) of all
AMOVA analyses conducted. Subsequent AMOVA analyses failed to yield higher
proportions of among group variance. Therefore, the initial baseline prediction of genetic
structure among muskellunge population in Wisconsin consists of two primary genetic
units, a western unit mostly consistent with the Upper Chippewa River watershed minus
the headwater regions and western Lake Superior drainage, and the eastern unit
consistent with the Upper Wisconsin River watershed, including the Upper Chippewa
River headwater populations, eastern Lake Superior drainage and Lake Michigan
drainage.

85
Genetic structure consistent with river drainages is well documented in a number
of aquatic species (O‘Connell et al 1996; Brunner et al. 1998; Wenburg et al. 1998;
Beacham et al. 1999; Carlsson et el 1999; Beacham et al. 2000; King et al. 2001; Wilson
et al. 2004; Beacham et al. 2005). Senanan and Kapuscinski (2000) found differences
among northern pike populations mostly consistent with drainage patterns across the
northern hemisphere. The observed muskellunge genetic structure in this study was
mostly consistent with the a priori prediction that we would see genetic differences
between major drainages with one major exception: samples in the Lac du Flambeau
region of the Upper Chippewa River drainage were consistently resolved as part of the
Upper Wisconsin River system. This finding of differences consistent with watersheds
was also consistent with Fields et al. (1997) who observed differences among the
Midwest watersheds in their study.
Contemporary management units in Wisconsin are based on the watershed
designations of Fields et al. (1997). The AMOVA of contemporary management zones
showed no significant variance explained by the current scenario (p = 0.1437).
Therefore, the contemporary management units fail to account for a significant
proportion of genetic variance and should be adjusted based on the current genetic data.
The major disjunction between the genetic structure resolved in the present study
and the contemporary management units was in the resolution of Upper Chippewa River
headwater populations and the Lake Superior drainage being split into east and west
components. Disruptions in the resolution of genetic structure compared to geographical
distribution are generally due to either geological events or anthropogenic causes such as
stocking.

86
The major geological impact on fish species in the upper Midwest was the
Wisconsin glaciation (~9-10,000 ybp; Crossman 1986). Following colonization of
Wisconsin‘s waters, the muskellunge likely had undergone a period of relatively isolated
divergence resulting in the standing genetic diversity observed in this study. Poissant et
al. (2005) found that stream-dwelling brook charr (Salvelinus fontinalis) of Gros Morne
National Park (Newfoundland, Canada) exhibited genetic structure mostly consistent with
genetic drift acting on populations isolated by the historic geological features and historic
colonization of the area. Historical muskellunge colonization of upper Midwest rivers
and subsequent lake systems could explain the east-west genetic split if contemporary
watershed boundaries are not consistent with historical boundaries. If this were the case,
consistent patterns of resolution would be expected in other fish species. A similar study
on walleye (Sander vitreus) in Wisconsin found a disjunction in the contemporary
watershed boundaries and the genetic structure similar to that observed in the present
study (Hammen 2009). However, stocking of muskellunge and walleye could also
explain such disjunction.
The 100+ year stocking history in the state of Wisconsin could be driving the
results observed in the present study. The observed east-west grouping occurs around the
logistical range of stocking for the Governor Tommy G. Thompson State Fish Hatchery
(Spooner, WI) and the Art Oehmcke State Fish Hatchery (Woodruff, WI). The Oehmcke
hatchery traditionally uses brood sources from the Upper Wisconsin watershed and the
Thompson hatchery uses Upper Chippewa watershed sources. The populations in the
Upper Chippewa River headwater regions are in much closer proximity to the Oehmcke
hatchery than the Thompson hatchery. Continued stocking in the immediate proximity of

87
these two hatcheries over time would predictably result in similarities among populations
stocked from a single hatchery, regardless of their contemporary management unit
designation. The probability of such cross-management unit stockings is high, especially
prior to the completion of Fields et al. (1997).
The inclusion of stocked populations in this study introduced a potentially
confounding factor. Since stocked fish are generally not physically marked for easy
detection, any population that had been stocked in recent years could have had stocked
fish sampled as representative of the native fishery. Furthermore, the current study may
show populations in various states of transition (Poissant et al. 2005) because stocked fish
could be successfully reproducing with the native populations creating introgressed
populations. Over time, these populations could become a representative of artificial
genetic structure caused in part by stocking. However, survival rates of supplementary
stocked fish are generally poor (Hanson and Margenau 1992; Jennings et al. 2005).
Predation, starvation, and stress are major factors in survival of stocked fish (Hanson and
Margenau 1992). In addition, Margenau (1992) found overwinter survival rates to be
quite low in muskellunge. A second factor in the reproductive success of stocked fish is
homing, or a fish‘s tendency to return to its natal spawning grounds. Crossman (1990)
found that muskellunge home during spring spawning during a mark-recapture study in
Stony Lake in Ontario, Canada. Other studies have observed lack of homing ability in
stocked and transplanted fish, which led to low survival of stocked fish (Bams 1976;
Gharrett and Smoker 1991; Gilk 2004). Low reproductive success of stocked fish, the
distinctiveness of each population observed (FST values and genic differentiation), and the

88
genetic distances observed between populations in the NJ trees essentially eliminates
genetic structure based solely on stocking regimes.
Whether geology or human-based means are responsible for the disjunction in
contemporary genetic structure from watershed boundaries, significant genetic structure
still appears to exist among muskellunge in Wisconsin. This structure is likely based on
natural patterns of genetic divergence, population founding, and general population
dynamics. The failure of contemporary genetic management units to significantly
explain the observed genetic variance strongly suggests adjustments be made to the
muskellunge management units.
Management Implications
This study provides an initial estimate of genetic diversity within and among
Wisconsin‘s naturally recruiting muskellunge populations and an initial estimate of
genetic structure within Wisconsin‘s muskellunge resources. However, more information
can and will be gathered during the second portion of this four-year study. The stock
concept is based on the theory that managing the component stocks of the entire
population in an area will maximize genetic diversity and health of the entire population.
In this study, two groups of muskellunge were found based on the Upper Chippewa and
Upper Wisconsin River drainages, suggesting these two groups can be managed and
monitored as two different stocks to improve management effectiveness. Currently, the
WDNR monitors muskellunge populations based on ―abundance, size structure, and
relative abundance of the associated fish community,‖ (Simonson 2002). Since a
minimum of two stocks have been identified, the WDNR can tailor their monitoring

89
efforts to these two separate groups to better understand the biological and ecological
functions of these populations.
Future Research
This project was the first half of a four-year project, and more work is necessary
to fully understand the genetic structure of muskellunge in northern Wisconsin. The first
and foremost need is more population samples representing the Lake Superior and Lake
Michigan Basins. The Lake Superior Basin is especially important because the sampled
populations from that area are under-represented compared to the number of suspected
naturally recruiting populations. This area is also managed as a genetic management
zone; however, currently this zone does not appear to be a viable genetic management
zone. By adding more populations to the current dataset, it may be possible to identify a
viable Superior management zone with confidence. More samples are also needed in
areas outside of the main muskellunge areas (Sawyer and Vilas counties). This will also
allow a better test of the management boundaries and, ultimately, allow a refined genetic
stock model of Wisconsin muskellunge.
In addition to more samples, the impact of stocking on the genetic diversity and
integrity of muskellunge populations needs to be assessed; especially in terms of impacts
on the resolved boundaries of this study. Since improved resolution using only
populations that had not been stock since 1990, analysis of historical brood sources and
their potential admixture with populations in the study could allow a better idea of the
impact of stocking across the study region. This can be done by viewing the sampled
populations as potential admixtures and seeing how the brood stocks potentially

90
introgressed into the native populations using maximum likelihood and Bayesian
assignment tests.

91
LITERATURE CITED
Allendorf, F.W. and G. Luikart. 2007. Conservation and the genetics of populations.
Blackwell Publishing Company. Malden, Massachusetts.
Bams, R.A. 1976. Survival and propensity for homing as affected by presence or absence
of locally adapted paternal genes in two transplanted populations of pink salmon
(Oncorynchus gorbuscha). Journal of the Fisheries Research Board of Canada 33:
2716-2725.
Beacham, T.D. and C.C. Wood. 1999. Application of microsatellite DNA variation to
estimation of stock composition and escapement of Nass River sockeye salmon
(Oncorhychus nerka). Canadian Journal of Fisheries and Aquatic Sciences 56:
297-310.
Beacham, T.D., S. Pollard, and K.D. Le. 2000. Microsatellite DNA population structure
and stock identification of steelhead trout (Oncorhynchus mykiss) in the Nass and
Skeena Rivers in northern British Columbia. Marine Biotechnology 2: 587-600.
Beacham, T.D., J.R. Candy, B. McIntosh, C. MacConnachie, A. Tabata, K. Kaukinen, L.
Deng, K.M. Miller, R. E. Withler, and N. Varnavskya. 2005. Estimation of stock
composition and individual identification of sockeye salmon on a Pacific Rim
basis using microsatellite and major histocompatibility complex variation.
Transaction of the American Fisheries Society 134: 1124-1146.
Becker, G.C. 1983. Fishes of Wisconsin. The University of Wisconsin Press, Madison,
Wisconsin.
Brunner, P.C., M.R. Douglas, and L. Bernatchez. 1998. Microsatellite and mitochondrial
DNA assessment of population structure and stocking effects in artic charr
Salvelinus alpinus (Teleostei: Salmonidae) from central alpine lakes. Molecular
Ecology 7: 209-223.
Carlsson, J., K.H. Olsen, J. Nilsson, Ø. Øverli, and O.B. Stabell. 1999. Microsatellites
reveal fine-scale genetic structure in stream-living brown trout. Journal of Fish
Biology 55: 1290-1303.
Carvalho, G.R. and Hauser, L. 1994. Molecular genetics and the stock concept in
fisheries. Reviews in Fish Biology and Fisheries 4: 326-350.
Cavalli-Sforza, L. L. and A.W. F. Edwards. 1967. Phylogenetic analysis: models and
estimation procedures. Evolution 21: 550-570.
Crisp, D. J., Beaumoni, A. R., Flowerdew, M. W., Vardy, A. (1978). The Hardy-
Weinberg test – a correction. Marine Biology 46: 181-183.

92
Crossman, E.J. 1986. The noble muskellunge: a review. American Fisheries Society
Special Publication 15: 1-13.
Crossman, E.J. 1990. Reproductive homing in muskellunge, Esox masquinongy.
Canadian Journal of Fisheries and Aquatic Science 47:1803-1812.
Dizon, A.E., C. Lockyer, W.F. Perrin, D.P. Demater, J. Sisson. 1992. Rethinking the
stock concept. Conservation Biology 6: 24-36.
Excoffier, L., P.E. Smouse, and J.M. Quattro. 1992. Analysis of molecular variance
inferred from metric distances among DNA haplotypes: application to human
mitochondrial DNA restriction data analysis. Evolutionary Bioinfomatics Online
1: 47-50.
Excoffier, L., G. Laval, and S. Schneider. 2005. Arlequin ver. 3.0: An integrated software
package for population genetics data analysis. Evolutionary Bioinformatics
Online 1: 47-50.
Felsenstein, J. 2007. PHYLIP (Phylogeny Inference Package) version 3.67. Distributed
by the author. Department of Genome Sciences, University of Washington, Seattle.
Fields, R.D., M.D.G. Desjardins, J.M. Hudson, T.W. Kassler, J.B. Ludden, J.V.
Tranquilli, C.A. Toline, and D.P. Philipp. 1997. Genetic analysis of fish species in
the Upper Midwest. Illinois Natural History Survey, Aquatic Ecology Technical
Report 97/5, Champaign, Illinois.
Frankham, R. 1995. Effective population size/adult population size ratios in wildlife: a
review. Genetical Research 66: 95-107.
Frankham, R., J.D. Ballou, and D.A.Briscoe. 2002: Introduction to Conservation
Genetics. Cambridge University Press, Cambridge, New York.
Gharrett, A.J. and W.W. Smoker. 1991. Two generations of hybrids between even- and
odd-year pink salmon (Oncorhynchus gforbuscha). Genetica 111: 259-267.
Gilk, S.E., I.A. Wang, C.L. Hoover, W.W. Smoker, S.G. Taylor, A.K. Gray, and A.J.
Gharrett. 2004. Outbreeding depression in hybrids between spatially separated
pink salmon, Oncorhychus gorbuscha, populations: marine survival, homing
ability, and variability in family size. Environmental Biology of Fishes 69, 287-
197.
Goudet J. 1995. Fstat version 1.2: a computer program to calculate Fstatistics. Journal of
Heredity 86: 485-486
Guo, S.W., E.A. Thompson. 1992. Performing the exact test test of the Hardy-Weinberg
proportions for multiple alleles. Biometrics 48: 361-372.

93
Hallerman, E.M. 2003. Genetic stock identification and risk assessment. Pages 291-328
in E.M. Hallerman, editor. Population genetics: principles and applications for
fisheries scientists. American Fisheries Society, Bethesda, Maryland.
Hammen, J.R. 2009. Genetic structure of Wisconsin‘s naturally recruiting walleye
populations. Masters Thesis. University of Wisconsin – Stevens Point, Stevens
Point, Wisconsin.
Hanson, D.A. and T.L. Margenau. 1992. Movement, habitat selection, behavior, and
survival of stocked muskellunge. North American Journal of Fisheries
Management 12: 474-483.
Hauswaldt, J.S. and T.C. Glenn. 2003. Microsatellite DNA loci from the diamondback
terrapin (Malaclemys terrapin). Molecular Ecology Notes 3: 174-176.
Hedrick, P.W. 2000. Genetics of Populations. Jones and Bartlett Publishers, Boston,
Massachusetts
Ihssen, P.E., H.E. Booke, J.M. Casselman, J.M. McGlade, N.R. Payne, and F.M. Utter.
1981. Stock identification: materials and methods. Canadian Journal of Fisheries
and Aquatic Sciences 38: 1838-1855.
Jennings, M.J., J.M. Kampa, G.R. Hatzenbeler, E.E. Emmons. 2005. Evaluation of
supplemental walleye stocking in northern Wisconsin lakes. North American
Journal of Fisheries Management 25: 1171-1178.
Kalinowski, S.T. 2002. How many alleles per locus should be used to estimate genetic
distances? Heredity 88: 62-65.
Kalinowski, S.T. 2004. Counting alleles with rarefaction: private alleles and hierarchical
sampling designs. Conservation Genetics 5: 539-543.
Kalinowski, S.T. 2005. Do polymorphic loci require large sample sizes to estimate
genetic distances? Heredity 94: 33-36.
Kalinowski, S.T. 2005. HP-Rare: a computer program for performing rarefaction on
measures of allelic diversity. Molecular Ecology Notes. 5: 187-189.
Keeney, D.B. and E.J. Heist. 2003. Characterization of microsatellite loci isolated from
the blacktip shark and their utility in requiem and hammerhead sharks. Molecular
Ecology Notes 3: 501-504.
Kutkuhn, J.H. 1981. Stock definition as a necessary basis for cooperative management of
great lakes fish resources. Canadian Journal of Fisheries and Aquatic Sciences
38: 1476-1478.

94
Laikre, L., S. Palm, and N. Ryman. 2005. Genetic population structure of fishes:
implication for coastal zone management. Ambio 34: 111-119.
Larkin, P.A. 1972. The stock concept and management of Pacific salmon. Pages 11-15. in
R.C. Simon and P.A. Larkin editors. H.R. MacMillan Lectures in Fisheries.
University of British Columbia. Vancouver, BC.
Liu, K. and S.V. Muse. 2005. PowerMarker: an integrated analysis environment for
genetic marker analysis. Bioinformatics 21: 2128-2129.
Margenau, T.L. 1992. Survival and cost-effectivness of stocked fall fingerlings and
spring yearling muskellunge in Wisconsin. North American Journal of Fisheries
Management 12: 484-493.
Miller, L.M. and A.R. Kapuscinski. 1996. Microsatellite DNA markers reveal new levels
of genetic variation in northern pike. Transactions of the American Fisheries
Society 125: 971-977.
Miller, L.M. and W. Senanan. 2003. A review of northern pike population genetic
research and its implications for management. North American Journal of
Fisheries Management 23: 297-306.
Moritz, C. 1999. Conservation units and translocations: strategies for conserving
evolutionary processes. Hereditas 130: 217-228.
O‘Connell, M., D.O.F Skibinski, and J.A. Beardmore. 1996. Allozyme and mtDNA
divergence between Atlantic salmon populations in North Wales. Journal of Fish
Biology 48: 1023-1026.
Page, R. D. M. 1996. TREEVIEW: An application to display phylogenetic trees on
personal computers. Computer Applications in the Biosciences 12: 357-358.
Peakall, R., Smouse, P.E., 2006. GENALEX 6: genetic analysis in Excel. Population
genetic software for teaching and research. Molecular Ecology Notes 6: 288-295.
Petit, E., F. Balloux, and J. Goudet. 2001. Sex biased dispersal in a migratory bat: a
characterization using sex-specific demographic parameters. Evolution 55: 635-
640.
Poissant, J., T.W. Knight and M.M. Ferguson. 2005. Nonequalibrium conditions
following landscape rearrangement: the relative contribution of past and current
hydrological landscapes on the genetic structure of a stream-dwelling fish.
Molecular Ecology 14: 1321-1331.

95
Raymond, M. and Rousset, F. 1995. GENEPOP (version 1.2): population genetics
software for exact tests and ecumenicism. Journal of Heredity 86: 248-249.
Reading, B.J., P.S. Wills, R.C. Heidinger, E.J. Heist. 2003. Development of
microsatellite markers for muskellunge (Esox masquinongy) and cross species
amplication in two other esocids. Molecular Ecology Notes 3: 447-449.
Rice, W.R. 1989. Analyzing tables of statistical tests. Evolution 43: 223-225.
Ruzzante, D.E. 1998. A comparison of several measures of genetic distance and
population structure with microsatellite data: bias and sampling variance.
Canadian Journal of Fisheries and Aquatic Sciences 55: 1-14.
Ryman N., S. Palm, C. André, G.R. Carvalho, T.G. Dahlgren, P.E. Jorde, L. Laikre, L.C.
Larson, A. Palmé, D.E. Ruzzante. 2006. Power for detecting genetic divergence:
differences between statistical methods and marker loci. Molecular Ecology. 15:
2031-2045.
Saitou, N., and M Nei. 1987. The neighbor-joining method: a method for reconstructing
phylogenetic trees. Molecular Biology and Evolution 4: 406-425.
Schable, N.A., R.U. Fischer, and T.C. Glenn. 2002. Tetranucleotide microsatellite DNA
loci from the dollar sunfish (Lepomis marginatus). Molecular Ecology Notes 2:
509-511.
Senanan, W. and A.R. Kapuscinski. 2000. Genetic relationships among populations of
northern pike (Esox lucius). Canadian Journal of Fisheries and Aquatic Science
57: 391-404.
Shaklee, J.B. and K.P. Currens. 2003. Genetic stock identification and risk assessment.
Pages 291-328 in E.M. Hallerman, editor. Population genetics: principles and
applications for fisheries scientists. American Fisheries Society, Bethesda,
Maryland.
Simonson, T. 2002. Muskellunge Management Update. Publication FH-508-2002,
Bureau of Fisheries Management and Habitat Protection. Wisconsin Department
of Natural Resources. Madison, Wisconsin.
Sloss, B.L. 2004. Recommendations for broodstock selection, handling, and hatchery
strategies within the Wisconsin muskellunge propagation program. Technical
Report issued to Wisconsin Department of Natural Resources. 15 pp.
Sloss, B.L., R.P. Franckowiak, and E.L. Murphy. 2008. Development of new
microsatellite loci and multiplex reactions for muskellunge (Esox masquinongy).
Molecular Ecology Notes 8: 811-813.
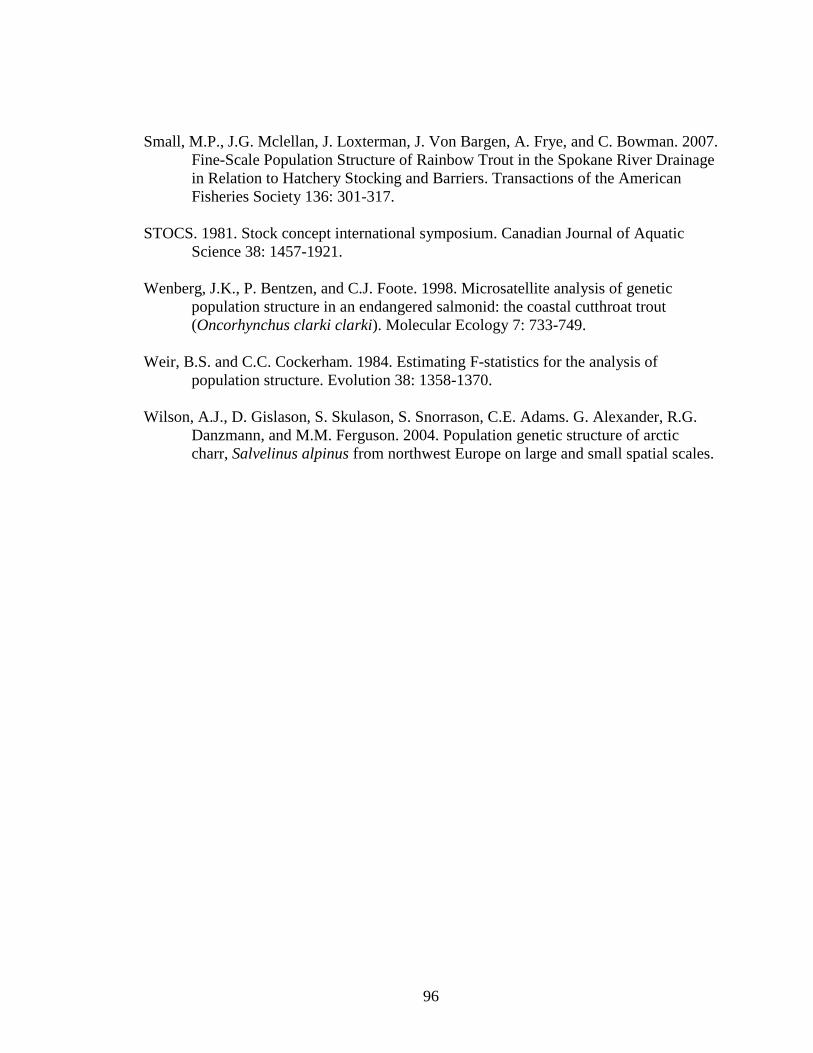
96
Small, M.P., J.G. Mclellan, J. Loxterman, J. Von Bargen, A. Frye, and C. Bowman. 2007.
Fine-Scale Population Structure of Rainbow Trout in the Spokane River Drainage
in Relation to Hatchery Stocking and Barriers. Transactions of the American
Fisheries Society 136: 301-317.
STOCS. 1981. Stock concept international symposium. Canadian Journal of Aquatic
Science 38: 1457-1921.
Wenberg, J.K., P. Bentzen, and C.J. Foote. 1998. Microsatellite analysis of genetic
population structure in an endangered salmonid: the coastal cutthroat trout
(Oncorhynchus clarki clarki). Molecular Ecology 7: 733-749.
Weir, B.S. and C.C. Cockerham. 1984. Estimating F-statistics for the analysis of
population structure. Evolution 38: 1358-1370.
Wilson, A.J., D. Gislason, S. Skulason, S. Snorrason, C.E. Adams. G. Alexander, R.G.
Danzmann, and M.M. Ferguson. 2004. Population genetic structure of arctic
charr, Salvelinus alpinus from northwest Europe on large and small spatial scales.

97
Table 1. Microsatellite loci used in the current study and description of primer sequence,
size range, and number of alleles for each locus (Sloss et al. 2008).
Locus Primer Sequence (5'-3')
Number of
Alleles Allele Size (bp)
Ema A5 TGGGACATTTGCCTCAAG 4 216-230
CCATTGGTTCCATTTATTGC
Ema A10 GCCAGATGTTCCTCTTCG 6 152-164
TGGTCCAGAAAGCGTTATG
Ema A11 TACCGTCACACACAGATGC 5 136-146
TGGTTCTCAAACTTTTTACACC
Ema A102 GGAACAGGTAGTGGGCAGAG 4 131-139
CTTGGTGTGGGGTTTTGTG
Ema A104 TGCAGTCTGGAACGACATC 4 161-167
TGCTCACAGCAATCTCATG
Ema B110 TGCCCCGTATCTCTCAAC 4 183-191
GGGTCTGTGTGGAAATAAATG
Ema B120 TGTTCCTGAAAGAGTTTTGTTG 2 234-236
CGAGGGAGATGGAGACTG
Ema C1 CATTGTCTGCCTGAGGTATCT 4 205-221
AAATCCAGTGTGACAGAAGTTG
Ema D4 TCCCTATCGTAAATTACACACG 5 196-212
CAGAATGTGGCATTTTTAACAG
Ema D5 CCGTAGACGCACAAAAAC 25 201-285
TGGTTATCTGGCATCATTG
Ema D6 TCACTCTCGCAATTTCTATCTG 20 165-269
GGGGACAGGTAATTTGTAACTG
Ema D12a CGTATGAACAGTAGGTTTTGTCTG 11 181-229
GATGGTGGATTGTGCCTATC
Ema D114 TGATCCACAAACACCTGAGTAG 9 270-302
CAAATCCTTCCTCAACAGATTC
Ema D116 GCAAAAGGACACAACACTG 14 239-295
CGAGCAGAGGGAAACTAAG
Ema D126a CCAATCAGAATGTGGCATTT 3 128-136
AAAGGAACCCTGAAGTCAG

98
Table 2. Class 1 and Class 2 populations listed with abbreviation, county, class and last
stocking date according to the WDNR fish stocking database. Classes are based on
reproductive status of the population: 0 = unknown recruitment, 1 = natural
recruitment, 2 = natural recruitment with additional stocking, 3 = no natural
recruitment.
Population Class County Last Stocked
Amnicon Lake (AM) 2 Douglas 1997
Big Arbor Vitae Lake (BA) 2 Vilas 2004
Big Crooked Lake (BI) 2 Vilas No Record
Birch Lake (BC) 1 Vilas 1980
Butternut Lake (BN) 2 Price 1999
Day Lake (DAY) 1 Ashland 1990
Ghost Lake (GH) 2 Sawyer 1993
Harris Lake (HA) 1 Vilas 1978
Horsehead Lake (HH) 1 Vilas No Record
Kentuck Lake (KT) 1 Nicolet/Vilas No Record
Lake Chippewa (WCF/EC) 2 Sawyer 2005
Lake Tomahawk (TH) 2 Oneida 2000
Lower Calm Lake (LC) 2 Sawyer No Record
Mineral Lake (MN) 1 Ashland 1976
Moose Lake (MO) 1 Sawyer No Record
Mud Lake/Callahan Lake (MC) 1 Sawyer 1982
North/South Twin Lake (NT) 2 Vilas 1995
North Nokomis Lake (NN) 2 Oneida 1996
Pine Lake (PI) 1 Iron 1975
Plum Lake (PM) 2 Vilas 1999
Seven Island Lake (SI) 2 Lincoln 1976
Spider Lake (SA) 2 Ashland 1992
Spider Lake (SS) 1 Sawyer 1984
Towanda Lake (TO) 1 Vilas 1984
Wolf Lake (WO) 2 Vilas No Record

99
Table 3. Population statistics for all 24 sampled populations including sample size (N),
number of loci genotyped (Loci), unbiased heterozygosity (He) and standard deviation
(He SD), observed heterozygosity (Ho) and standard deviation (Ho SD), and allelic
richness (Ar).
Population N Loci He He SD Ho Ho SD Ar
BN 45 14 0.5694 0.0584 0.5408 0.0206 5.57
AM 50 14 0.5719 0.0609 0.5649 0.0188 5.86
MC 49 14 0.5357 0.0637 0.5266 0.0192 5.79
WCF 40 14 0.5870 0.0595 0.5902 0.0209 5.57
TH 49 14 0.5671 0.0641 0.5715 0.0189 5.57
BC 40 14 0.4989 0.0771 0.4893 0.0211 4.93
DAY 50 14 0.5567 0.0612 0.5471 0.0188 5.64
PM 34 14 0.5911 0.0566 0.5897 0.0226 5.57
BA 50 14 0.5745 0.0633 0.5471 0.0188 5.86
KT 41 14 0.5517 0.0677 0.5363 0.0208 5.21
EC 49 14 0.5794 0.0597 0.5795 0.0189 6.21
SS 43 14 0.5288 0.0704 0.5280 0.0207 5.64
LC 21 14 0.5725 0.0594 0.5578 0.0290 5.07
NN 46 14 0.5547 0.0511 0.5661 0.0199 5.00
HA 37 14 0.5382 0.0662 0.4901 0.0223 4.71
HH 23 14 0.5353 0.0582 0.5589 0.0277 4.21
SI 48 14 0.5544 0.0665 0.5939 0.0190 4.86
NT 34 14 0.5742 0.0532 0.5905 0.0226 5.50
MN 51 14 0.5336 0.0603 0.5444 0.0188 5.07
BI 33 14 0.6129 0.0536 0.6061 0.0227 4.93
MO 40 14 0.5183 0.0698 0.4994 0.0211 5.29
CF 48 14 0.5837 0.0617 0.5956 0.0190 6.43
PI 38 14 0.4871 0.0675 0.4960 0.0229 3.93
WO 50 14 0.5367 0.0627 0.5504 0.0189 5.07

Table 4. Population pairwise comparison of allele frequency distributions across all loci. The genic differentiation p-value is below
the diagonal and the FST values are above the diagonal. Bold values are values that were significant after sequential Bonferroni
correction (Rice 1989).
BN AM MC WCF TH BC DAY PM BA KT EC SS
BN * 0.026 0.053 0.013 0.023 0.114 0.014 0.028 0.017 0.084 0.009 0.029
AM <0.001 * 0.086 0.028 0.029 0.151 0.015 0.043 0.041 0.105 0.020 0.046
MC <0.001 <0.001 * 0.050 0.069 0.078 0.065 0.068 0.065 0.091 0.036 0.049
WCF <0.001 <0.001 <0.001 * 0.009 0.077 0.010 0.016 0.005 0.053 -0.001 0.046
TH <0.001 <0.001 <0.001 <0.001 * 0.063 0.015 0.009 0.010 0.059 0.012 0.061
BC <0.001 <0.001 <0.001 <0.001 <0.001 * 0.113 0.063 0.066 0.067 0.069 0.158
DAY 0.002 <0.001 <0.001 <0.001 <0.001 <0.001 * 0.023 0.023 0.069 0.011 0.043
PM <0.001 <0.001 <0.001 <0.001 0.023 <0.001 <0.001 * -0.002 0.029 0.009 0.086
BA <0.001 <0.001 <0.001 <0.001 <0.001 <0.001 <0.001 0.408 * 0.033 0.006 0.069
KT <0.001 <0.001 <0.001 <0.001 <0.001 <0.001 <0.001 <0.001 <0.001 * 0.047 0.135
EC <0.001 <0.001 <0.001 0.004 <0.001 <0.001 <0.001 0.003 <0.001 <0.001 * 0.036
SS <0.001 <0.001 <0.001 <0.001 <0.001 <0.001 <0.001 <0.001 <0.001 <0.001 <0.001 *
LC 0.006 0.027 <0.001 <0.001 <0.001 <0.001 0.063 <0.001 <0.001 <0.001 0.001 <0.001
NN <0.001 <0.001 <0.001 <0.001 <0.001 <0.001 <0.001 <0.001 <0.001 <0.001 <0.001 <0.001
HA <0.001 <0.001 <0.001 <0.001 <0.001 <0.001 <0.001 <0.001 <0.001 <0.001 <0.001 <0.001
HH <0.001 <0.001 <0.001 <0.001 <0.001 <0.001 <0.001 <0.001 <0.001 <0.001 <0.001 <0.001
SI <0.001 <0.001 <0.001 <0.001 <0.001 <0.001 <0.001 <0.001 <0.001 <0.001 <0.001 <0.001
NT <0.001 <0.001 <0.001 0.002 0.002 <0.001 <0.001 0.052 0.041 <0.001 0.046 <0.001
MN <0.001 <0.001 <0.001 <0.001 <0.001 <0.001 <0.001 <0.001 <0.001 <0.001 <0.001 <0.001
BI <0.001 <0.001 <0.001 <0.001 <0.001 <0.001 <0.001 <0.001 <0.001 <0.001 <0.001 <0.001
MO <0.001 <0.001 <0.001 <0.001 <0.001 <0.001 <0.001 <0.001 <0.001 <0.001 <0.001 <0.001
CF 0.004 <0.001 <0.001 <0.001 <0.001 <0.001 <0.001 0.023 0.011 <0.001 <0.001 <0.001
PI <0.001 <0.001 <0.001 <0.001 <0.001 <0.001 <0.001 <0.001 <0.001 <0.001 <0.001 <0.001
WO <0.001 <0.001 <0.001 <0.001 <0.001 <0.001 <0.001 <0.001 <0.001 <0.001 <0.001 <0.001
100

Table 4. Continued.
LC NN HA HH SI NT MN BI MO CF PI WO
BN 0.009 0.075 0.074 0.139 0.063 0.008 0.035 0.081 0.061 0.008 0.123 0.072
AM 0.007 0.077 0.068 0.134 0.077 0.013 0.029 0.078 0.097 0.009 0.150 0.093
MC 0.046 0.115 0.098 0.140 0.098 0.038 0.108 0.112 0.012 0.072 0.153 0.082
WCF 0.011 0.042 0.044 0.097 0.036 0.006 0.050 0.038 0.056 0.008 0.075 0.044
TH 0.016 0.044 0.033 0.095 0.048 0.013 0.035 0.040 0.077 0.008 0.066 0.044
BC 0.118 0.098 0.073 0.139 0.081 0.086 0.138 0.083 0.086 0.105 0.069 0.049
DAY 0.000 0.060 0.052 0.104 0.074 0.018 0.042 0.073 0.072 0.004 0.105 0.073
PM 0.020 0.028 0.036 0.056 0.025 0.012 0.027 0.035 0.079 0.014 0.038 0.014
BA 0.016 0.027 0.044 0.091 0.016 0.008 0.034 0.041 0.065 0.012 0.049 0.018
KT 0.063 0.020 0.054 0.077 0.035 0.059 0.098 0.050 0.082 0.069 0.054 0.030
EC 0.007 0.044 0.034 0.087 0.036 -0.003 0.030 0.051 0.044 0.006 0.075 0.032
SS 0.023 0.137 0.133 0.183 0.131 0.026 0.080 0.127 0.057 0.039 0.215 0.119
LC * 0.050 0.071 0.109 0.062 0.000 0.030 0.067 0.051 0.002 0.126 0.058
NN <0.001 * 0.043 0.076 0.027 0.053 0.073 0.051 0.104 0.056 0.054 0.027
HA <0.001 <0.001 * 0.097 0.051 0.059 0.060 0.073 0.107 0.054 0.080 0.061
HH <0.001 <0.001 <0.001 * 0.099 0.097 0.109 0.084 0.160 0.100 0.083 0.061
SI <0.001 <0.001 <0.001 <0.001 * 0.039 0.064 0.049 0.090 0.058 0.056 0.027
NT 0.016 <0.001 <0.001 <0.001 <0.001 * 0.022 0.048 0.046 0.005 0.101 0.037
MN <0.001 <0.001 <0.001 <0.001 <0.001 <0.001 * 0.098 0.122 0.024 0.124 0.066
BI <0.001 <0.001 <0.001 <0.001 <0.001 <0.001 <0.001 * 0.108 0.050 0.058 0.057
MO <0.001 <0.001 <0.001 <0.001 <0.001 <0.001 <0.001 <0.001 * 0.080 0.153 0.079
CF 0.005 <0.001 <0.001 <0.001 <0.001 0.137 <0.001 <0.001 <0.001 * 0.103 0.057
PI <0.001 <0.001 <0.001 <0.001 <0.001 <0.001 <0.001 <0.001 <0.001 <0.001 * 0.032
WO <0.001 <0.001 <0.001 <0.001 <0.001 <0.001 <0.001 <0.001 <0.001 <0.001 <0.001 *
101
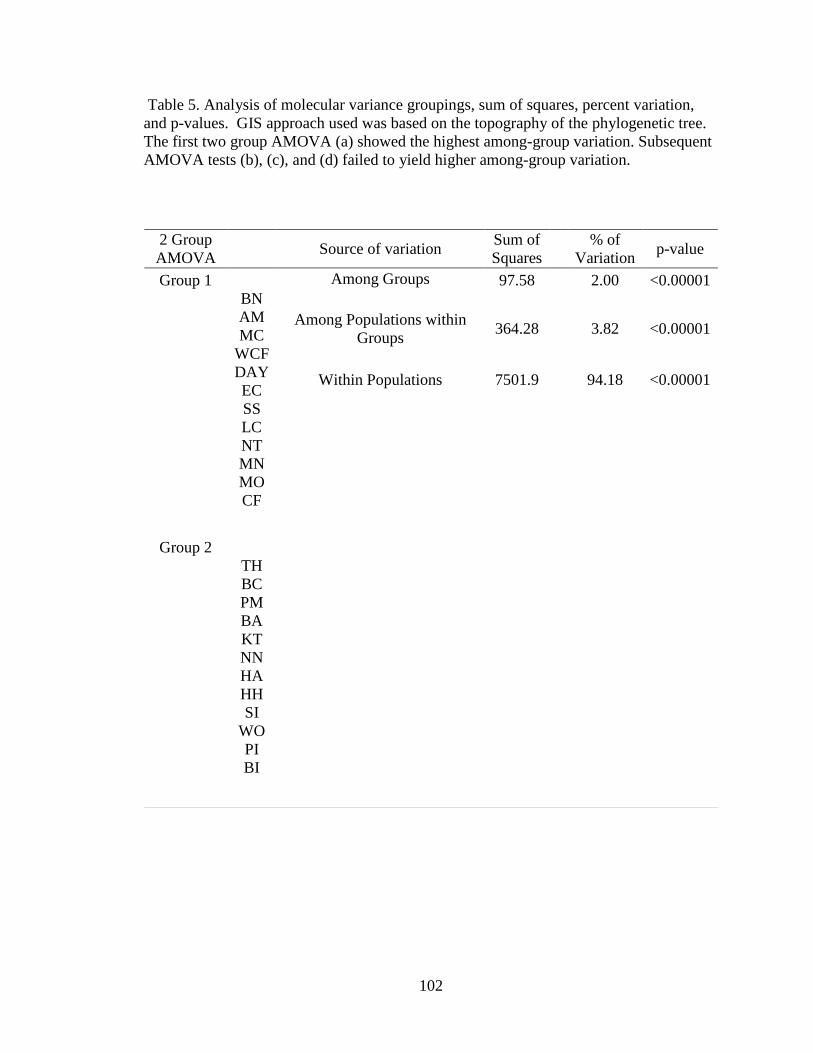
102
Table 5. Analysis of molecular variance groupings, sum of squares, percent variation,
and p-values. GIS approach used was based on the topography of the phylogenetic tree.
The first two group AMOVA (a) showed the highest among-group variation. Subsequent
AMOVA tests (b), (c), and (d) failed to yield higher among-group variation.
2 Group
AMOVA Source of variation
Sum of
Squares
% of
Variation p-value
Group 1 Among Groups 97.58 2.00 <0.00001
BN
AM
MC
WCF
DAY
EC
SS
LC
NT
MN
MO
CF
Among Populations within
Groups 364.28 3.82 <0.00001
Within Populations 7501.9 94.18 <0.00001
Group 2
TH
BC
PM
BA
KT
NN
HA
HH
SI
WO
PI
BI

103
Table 5 (b). Continued
3 Group
AMOVA Source of variation
Sum of
Squares
% of
Variation p-value
Group 1 Among Groups 107.61 1.53 0.00020
BN
AM
MC
DAY
SS
LC
MN
MO
CF
Among Populations
within Groups 354.28 3.93 <0.00001
Within Populations 7501.92 94.54 <0.00001
Group 2
TH
BC
PM
BA
KT
NN
HA
HH
SI
WO
PI
BI
Group 3
WCF
EC
NT

104
Table 5 (c). Continued
4 Group
AMOVA Source of variation
Sum of
Squares
% of
Variation p-value
Group 1 Among Groups 133.28 1.48 0.00020
BN
AM
MC
DAY
SS
LC
MN
MO
CF
Among Populations within
Groups 328.58 3.81 <0.00001
Within Populations 7501.92 94.71 <0.00001
Group 2
BC
KT
NN
HA
HH
SI
WO
PI
Group 3
WCF
EC
NT
Group 4
TH
PM
BA
BI

105
Table 5 (d). Continued
5 Group
AMOVA Source of variation
Sum of
Squares
% of
Variation p-value
Group 1 Among Groups 167.74 1.66 <0.00001
BN
MC
DAY
SS
LC
MO
Among Populations within
Groups 294.12 3.56 <0.00001
Within Populations 7501.92 94.78 <0.00001
Group 2
BC
KT
NN
HA
HH
SI
WO
PI
Group 3
WCF
EC
NT
Group 4
TH
PM
BA
BI
Group 5
CF
MN
AM

106
Table 6. AMOVA groupings, sum of squares, percent variation, and p-values of the
current management units (Group 1 = Upper Chippewa; Group 2 = Lake Superior; Group
3 = Upper Wisconsin; Group 4 = Green Bay).
4 Group
AMOVA Source of variation
Sum of
Squares
% of
Variation p-value
Group 1 Among Groups 72.74 0.33 0.14370
BC
BI
BN
DAY
EC
MC
WCF
SS
LC
MO
WO
Among Populations within
Groups 361.43 4.82 <0.00001
Within Populations 3371.59 -1.02 0.93842
Group 2
AM
HA
HH
MN
PI
TH
PM
BA
NN
SI
NT
KT
CF
Group 3
Group 4

107
Figure 1. Current genetic management zones suggested by Fields et al. (1997) based
partially on allozyme and mtDNA data.

108
Figure 2. Major watersheds in northern Wisconsin: (A) Lake Superior, (B) Upper St.
Croix, (C) Upper Chippewa, (D) Upper Wisconsin, and (E) Green Bay (Lake Michigan).
A
B C D E

109
Figure 3. Three hatcheries involved with muskellunge propagation in Wisconsin and
their relative location in the state. (1) Governor Tommy G. Thompson State Fish
Hatchery, (2) Art Oehmcke State Fish Hatchery, and (3) Wild Rose State Fish Hatchery.
The black line represents State Highway 29, which was chosen as the southern boundary
of the study.
1
3
2

110
Figure 4. Native range of muskellunge in Wisconsin according to Becker (1983).

111
Figure 5. Relative distribution and location of sampled populations in this study. The
inset map shows the counties containing sampled populations.
...... .... ... ~-.--L_ _ _j ...
... ...

112
0.1
TH
PM
BA
BI
HA
HHPIBC
WO
SI
NN
KT
NT
WCFEC
MN
CF
AM
DAYLC
SS
MO
MC
BN
Figure 6. Unrooted NJ tree of all sampled populations created using Cavalli-Sforza and
Edwards (1967) chord distance.
■
•
■
-•
I

113
Figure 7. Unrooted NJ tree of all populations that have not been stocked since 1990
created using Cavalli-Sforza and Edwards (1967) chord distance. Node support based on
500 bootstrap pseudoreplicates. Nodes with support <50% are not labeled.
0.1
HA
MN
LC DAY
SS
MO
MC
SI
PI
HH BI
WO
KT
BC
70%

114
Appendix 1. Standard operating protocol for field collection of fin-clips.
Items Needed for this Procedure:
1) Labeled screw cap tubes in tube rack
2) Forceps and tissue scissors
3) Clipboard with datasheet and writing utensil
4) Squeeze bottle filled with 95% ethanol
Procedure:
1) Organize work space to maximize fish handling efficiency.
2) Collect morphological data (i.e., length, weight, etc.).
3) Before releasing fish, collect tissue sample.
4) Cut a ―nickel‖ size piece of fin tissue usually from the caudal or pelvic fin using
scissors.
5) Using forceps, place tissue in the labeled screw cap tube (Note: place tissue in
tubes in consecutive order beginning with the smallest number to minimize
confusion).
6) Fill tubes with ethanol and screw on cap securely to prevent the ethanol from
evaporating (Note: if handling a large number of fish, you can wait for a pause in
sampling to add ethanol; just make sure the lids are put back on the tubes to
prevent mixing tubes and lids).
7) Place tubes in tube rack in sequential order.
8) Record tube number on the data sheet so tissue samples can be matched up with
morphological data collected for each individual.
9) Rinse scissors and forceps in water between samples to minimize contamination
risk (Note: lake/river water is sufficient; no visible blood, ‗slime‘, or tissue should
be present between samples).
10) Label tube box with site specific information (location, date, range of sample
numbers, and name of individuals collecting sample).

115
Appendix 2. Allele frequency data for all sampled muskellunge populations.
Locus/Alleles Populations
D5 BN AM MC WCF TH BC DAY PM BA KT EC SS
201 0.012 0.000 0.000 0.000 0.000 0.013 0.000 0.000 0.000 0.000 0.000 0.000
205 0.000 0.000 0.000 0.000 0.000 0.300 0.000 0.000 0.000 0.013 0.000 0.000
209 0.000 0.000 0.000 0.025 0.041 0.050 0.000 0.059 0.050 0.100 0.000 0.012
213 0.047 0.100 0.063 0.088 0.143 0.025 0.190 0.147 0.120 0.050 0.071 0.061
217 0.012 0.040 0.021 0.013 0.020 0.075 0.010 0.029 0.020 0.000 0.020 0.000
221 0.012 0.090 0.042 0.088 0.071 0.100 0.040 0.044 0.060 0.063 0.071 0.012
225 0.035 0.050 0.052 0.013 0.031 0.125 0.050 0.044 0.010 0.013 0.051 0.000
229 0.023 0.020 0.042 0.050 0.000 0.000 0.010 0.015 0.010 0.050 0.020 0.000
233 0.058 0.050 0.021 0.025 0.010 0.000 0.030 0.015 0.020 0.025 0.041 0.073
237 0.023 0.010 0.115 0.075 0.020 0.025 0.000 0.059 0.040 0.100 0.102 0.110
241 0.047 0.020 0.188 0.125 0.061 0.038 0.010 0.029 0.090 0.050 0.051 0.037
245 0.198 0.090 0.135 0.075 0.153 0.075 0.180 0.132 0.190 0.088 0.133 0.073
249 0.128 0.110 0.010 0.100 0.102 0.050 0.190 0.132 0.120 0.100 0.092 0.134
253 0.093 0.090 0.083 0.088 0.061 0.100 0.100 0.132 0.110 0.150 0.102 0.146
257 0.128 0.060 0.188 0.050 0.071 0.025 0.050 0.074 0.040 0.113 0.010 0.085
261 0.000 0.050 0.000 0.000 0.000 0.000 0.000 0.015 0.020 0.000 0.051 0.024
265 0.058 0.080 0.010 0.038 0.153 0.000 0.060 0.044 0.050 0.000 0.082 0.073
269 0.012 0.030 0.000 0.063 0.020 0.000 0.030 0.000 0.010 0.050 0.010 0.061
273 0.081 0.110 0.021 0.088 0.041 0.000 0.050 0.029 0.000 0.013 0.031 0.024
277 0.000 0.000 0.010 0.000 0.000 0.000 0.000 0.000 0.010 0.025 0.051 0.000
281 0.000 0.000 0.000 0.000 0.000 0.000 0.000 0.000 0.010 0.000 0.000 0.000
285 0.035 0.000 0.000 0.000 0.000 0.000 0.000 0.000 0.020 0.000 0.010 0.037
289 0.000 0.000 0.000 0.000 0.000 0.000 0.000 0.000 0.000 0.000 0.000 0.024
291 0.000 0.000 0.000 0.000 0.000 0.000 0.000 0.000 0.000 0.000 0.000 0.000
295 0.000 0.000 0.000 0.000 0.000 0.000 0.000 0.000 0.000 0.000 0.000 0.012
D6
165 0.267 0.200 0.448 0.238 0.235 0.375 0.170 0.206 0.190 0.317 0.255 0.295
213 0.000 0.020 0.000 0.000 0.000 0.000 0.000 0.000 0.000 0.000 0.010 0.000
217 0.000 0.000 0.000 0.013 0.010 0.000 0.010 0.000 0.000 0.000 0.000 0.000
221 0.000 0.000 0.000 0.000 0.020 0.000 0.000 0.044 0.000 0.000 0.041 0.013
225 0.023 0.020 0.052 0.025 0.000 0.000 0.080 0.000 0.020 0.000 0.112 0.000
229 0.256 0.200 0.010 0.200 0.214 0.025 0.380 0.250 0.280 0.134 0.184 0.115
233 0.093 0.080 0.115 0.163 0.102 0.113 0.050 0.074 0.070 0.110 0.092 0.064
237 0.116 0.180 0.146 0.113 0.194 0.038 0.140 0.162 0.200 0.049 0.122 0.269
241 0.093 0.090 0.073 0.200 0.092 0.088 0.060 0.103 0.090 0.293 0.041 0.064
245 0.047 0.020 0.010 0.000 0.051 0.113 0.030 0.044 0.070 0.012 0.061 0.064
249 0.023 0.110 0.052 0.000 0.031 0.063 0.050 0.088 0.030 0.049 0.010 0.064
253 0.035 0.030 0.021 0.000 0.031 0.038 0.000 0.029 0.050 0.024 0.031 0.013
257 0.047 0.040 0.042 0.013 0.020 0.000 0.020 0.000 0.000 0.000 0.031 0.026
261 0.000 0.010 0.000 0.013 0.000 0.000 0.000 0.000 0.000 0.000 0.010 0.000
265 0.000 0.000 0.031 0.025 0.000 0.013 0.000 0.000 0.000 0.000 0.000 0.013
269 0.000 0.000 0.000 0.000 0.000 0.138 0.010 0.000 0.000 0.000 0.000 0.000
277 0.000 0.000 0.000 0.000 0.000 0.000 0.000 0.000 0.000 0.012 0.000 0.000
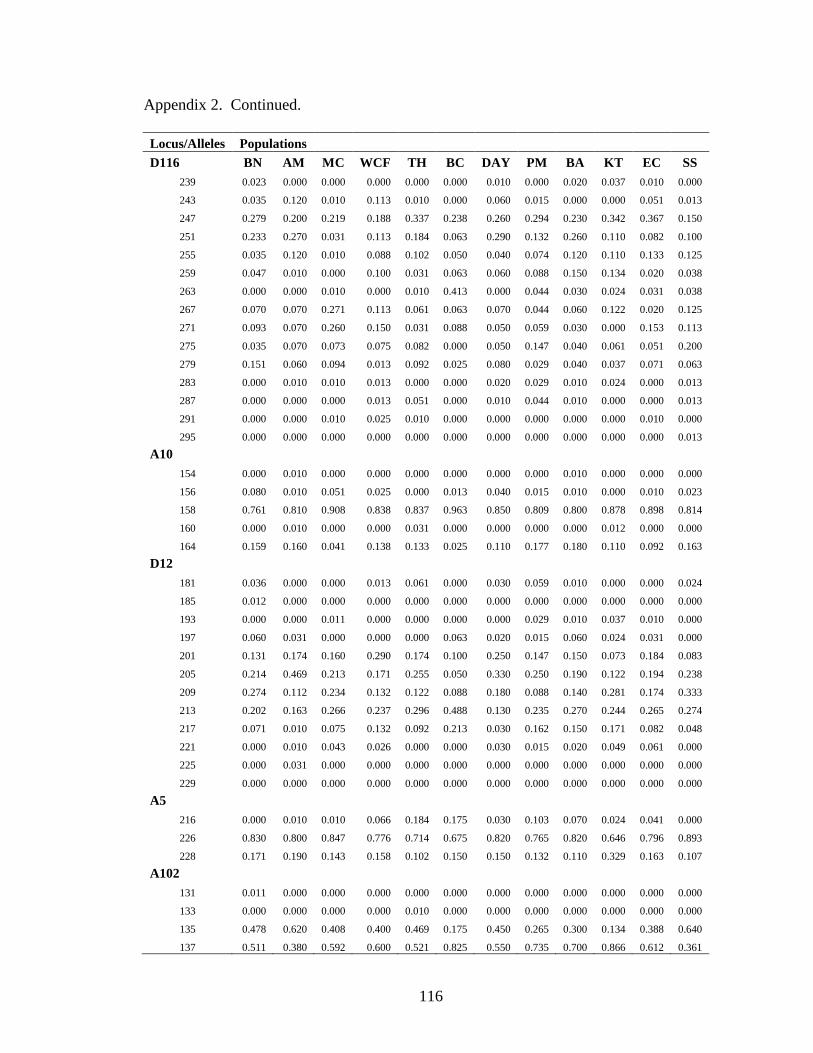
116
Appendix 2. Continued.
Locus/Alleles Populations
D116 BN AM MC WCF TH BC DAY PM BA KT EC SS
239 0.023 0.000 0.000 0.000 0.000 0.000 0.010 0.000 0.020 0.037 0.010 0.000
243 0.035 0.120 0.010 0.113 0.010 0.000 0.060 0.015 0.000 0.000 0.051 0.013
247 0.279 0.200 0.219 0.188 0.337 0.238 0.260 0.294 0.230 0.342 0.367 0.150
251 0.233 0.270 0.031 0.113 0.184 0.063 0.290 0.132 0.260 0.110 0.082 0.100
255 0.035 0.120 0.010 0.088 0.102 0.050 0.040 0.074 0.120 0.110 0.133 0.125
259 0.047 0.010 0.000 0.100 0.031 0.063 0.060 0.088 0.150 0.134 0.020 0.038
263 0.000 0.000 0.010 0.000 0.010 0.413 0.000 0.044 0.030 0.024 0.031 0.038
267 0.070 0.070 0.271 0.113 0.061 0.063 0.070 0.044 0.060 0.122 0.020 0.125
271 0.093 0.070 0.260 0.150 0.031 0.088 0.050 0.059 0.030 0.000 0.153 0.113
275 0.035 0.070 0.073 0.075 0.082 0.000 0.050 0.147 0.040 0.061 0.051 0.200
279 0.151 0.060 0.094 0.013 0.092 0.025 0.080 0.029 0.040 0.037 0.071 0.063
283 0.000 0.010 0.010 0.013 0.000 0.000 0.020 0.029 0.010 0.024 0.000 0.013
287 0.000 0.000 0.000 0.013 0.051 0.000 0.010 0.044 0.010 0.000 0.000 0.013
291 0.000 0.000 0.010 0.025 0.010 0.000 0.000 0.000 0.000 0.000 0.010 0.000
295 0.000 0.000 0.000 0.000 0.000 0.000 0.000 0.000 0.000 0.000 0.000 0.013
A10
154 0.000 0.010 0.000 0.000 0.000 0.000 0.000 0.000 0.010 0.000 0.000 0.000
156 0.080 0.010 0.051 0.025 0.000 0.013 0.040 0.015 0.010 0.000 0.010 0.023
158 0.761 0.810 0.908 0.838 0.837 0.963 0.850 0.809 0.800 0.878 0.898 0.814
160 0.000 0.010 0.000 0.000 0.031 0.000 0.000 0.000 0.000 0.012 0.000 0.000
164 0.159 0.160 0.041 0.138 0.133 0.025 0.110 0.177 0.180 0.110 0.092 0.163
D12
181 0.036 0.000 0.000 0.013 0.061 0.000 0.030 0.059 0.010 0.000 0.000 0.024
185 0.012 0.000 0.000 0.000 0.000 0.000 0.000 0.000 0.000 0.000 0.000 0.000
193 0.000 0.000 0.011 0.000 0.000 0.000 0.000 0.029 0.010 0.037 0.010 0.000
197 0.060 0.031 0.000 0.000 0.000 0.063 0.020 0.015 0.060 0.024 0.031 0.000
201 0.131 0.174 0.160 0.290 0.174 0.100 0.250 0.147 0.150 0.073 0.184 0.083
205 0.214 0.469 0.213 0.171 0.255 0.050 0.330 0.250 0.190 0.122 0.194 0.238
209 0.274 0.112 0.234 0.132 0.122 0.088 0.180 0.088 0.140 0.281 0.174 0.333
213 0.202 0.163 0.266 0.237 0.296 0.488 0.130 0.235 0.270 0.244 0.265 0.274
217 0.071 0.010 0.075 0.132 0.092 0.213 0.030 0.162 0.150 0.171 0.082 0.048
221 0.000 0.010 0.043 0.026 0.000 0.000 0.030 0.015 0.020 0.049 0.061 0.000
225 0.000 0.031 0.000 0.000 0.000 0.000 0.000 0.000 0.000 0.000 0.000 0.000
229 0.000 0.000 0.000 0.000 0.000 0.000 0.000 0.000 0.000 0.000 0.000 0.000
A5
216 0.000 0.010 0.010 0.066 0.184 0.175 0.030 0.103 0.070 0.024 0.041 0.000
226 0.830 0.800 0.847 0.776 0.714 0.675 0.820 0.765 0.820 0.646 0.796 0.893
228 0.171 0.190 0.143 0.158 0.102 0.150 0.150 0.132 0.110 0.329 0.163 0.107
A102
131 0.011 0.000 0.000 0.000 0.000 0.000 0.000 0.000 0.000 0.000 0.000 0.000
133 0.000 0.000 0.000 0.000 0.010 0.000 0.000 0.000 0.000 0.000 0.000 0.000
135 0.478 0.620 0.408 0.400 0.469 0.175 0.450 0.265 0.300 0.134 0.388 0.640
137 0.511 0.380 0.592 0.600 0.521 0.825 0.550 0.735 0.700 0.866 0.612 0.361

117
Appendix 2. Continued.
Locus/Alleles Populations
A11 BN AM MC WCF TH BC DAY PM BA KT EC SS
132 0.000 0.000 0.000 0.000 0.000 0.000 0.000 0.000 0.000 0.012 0.000 0.000
136 0.182 0.230 0.092 0.125 0.112 0.038 0.060 0.212 0.190 0.061 0.184 0.049
138 0.000 0.000 0.010 0.000 0.000 0.000 0.000 0.000 0.000 0.000 0.010 0.000
140 0.046 0.020 0.010 0.000 0.020 0.013 0.010 0.030 0.000 0.000 0.041 0.000
144 0.739 0.750 0.878 0.838 0.847 0.950 0.920 0.758 0.810 0.927 0.745 0.939
146 0.034 0.000 0.010 0.038 0.020 0.000 0.010 0.000 0.000 0.000 0.020 0.012
B110
165 0.012 0.000 0.000 0.000 0.000 0.000 0.000 0.000 0.000 0.000 0.000 0.000
183 0.607 0.663 0.592 0.564 0.388 0.275 0.540 0.409 0.510 0.476 0.602 0.854
185 0.143 0.112 0.327 0.244 0.255 0.400 0.200 0.106 0.110 0.146 0.163 0.110
191 0.238 0.225 0.082 0.192 0.357 0.325 0.260 0.485 0.380 0.378 0.235 0.037
D114
270 0.000 0.052 0.021 0.026 0.020 0.000 0.010 0.000 0.020 0.012 0.010 0.013
274 0.553 0.438 0.362 0.577 0.582 0.388 0.520 0.470 0.370 0.390 0.520 0.218
278 0.105 0.188 0.106 0.103 0.122 0.100 0.140 0.121 0.240 0.342 0.102 0.269
282 0.316 0.260 0.362 0.244 0.194 0.113 0.230 0.318 0.290 0.207 0.265 0.359
286 0.026 0.042 0.043 0.013 0.020 0.238 0.000 0.000 0.040 0.049 0.051 0.051
290 0.000 0.010 0.075 0.039 0.051 0.050 0.050 0.030 0.030 0.000 0.031 0.051
294 0.000 0.010 0.021 0.000 0.010 0.113 0.050 0.061 0.010 0.000 0.020 0.000
298 0.000 0.000 0.011 0.000 0.000 0.000 0.000 0.000 0.000 0.000 0.000 0.039
A104
161 0.022 0.200 0.112 0.250 0.122 0.238 0.060 0.103 0.140 0.122 0.194 0.058
163 0.689 0.410 0.755 0.438 0.449 0.550 0.490 0.441 0.460 0.317 0.490 0.616
165 0.267 0.380 0.122 0.313 0.429 0.213 0.430 0.427 0.380 0.561 0.306 0.267
167 0.022 0.010 0.010 0.000 0.000 0.000 0.020 0.029 0.020 0.000 0.010 0.058
169 0.000 0.000 0.000 0.000 0.000 0.000 0.000 0.000 0.000 0.000 0.000 0.000
C1
205 0.047 0.020 0.031 0.050 0.000 0.025 0.120 0.029 0.000 0.000 0.020 0.037
209 0.012 0.060 0.388 0.063 0.031 0.063 0.030 0.118 0.050 0.110 0.092 0.195
213 0.895 0.910 0.551 0.813 0.949 0.838 0.820 0.794 0.890 0.683 0.806 0.768
217 0.047 0.000 0.031 0.063 0.020 0.075 0.030 0.059 0.060 0.207 0.082 0.000
221 0.000 0.010 0.000 0.013 0.000 0.000 0.000 0.000 0.000 0.000 0.000 0.000
D126
128 0.211 0.300 0.214 0.225 0.194 0.138 0.250 0.235 0.280 0.402 0.214 0.035
132 0.356 0.160 0.204 0.375 0.286 0.200 0.220 0.235 0.340 0.171 0.235 0.372
136 0.433 0.540 0.582 0.400 0.520 0.663 0.530 0.529 0.380 0.427 0.551 0.593
B120
234 0.583 0.540 0.827 0.600 0.677 0.975 0.500 0.662 0.690 0.829 0.635 0.631
236 0.417 0.460 0.174 0.400 0.323 0.025 0.500 0.338 0.310 0.171 0.365 0.369

118
Appendix 2. Continued.
Locus/Alleles Populations
D5 LC NN HA HH SI NT MN BI MO CF PI WO
201 0.000 0.000 0.000 0.000 0.000 0.000 0.000 0.000 0.000 0.000 0.000 0.000
205 0.000 0.000 0.015 0.000 0.000 0.015 0.000 0.000 0.000 0.000 0.000 0.010
209 0.000 0.063 0.000 0.000 0.104 0.029 0.020 0.000 0.000 0.021 0.000 0.051
213 0.119 0.113 0.044 0.000 0.115 0.074 0.080 0.000 0.075 0.135 0.000 0.092
217 0.000 0.000 0.177 0.000 0.031 0.044 0.000 0.091 0.050 0.021 0.000 0.061
221 0.071 0.063 0.044 0.023 0.031 0.059 0.030 0.091 0.225 0.073 0.133 0.041
225 0.024 0.025 0.000 0.000 0.000 0.015 0.040 0.015 0.075 0.021 0.017 0.031
229 0.000 0.025 0.088 0.000 0.083 0.015 0.010 0.000 0.000 0.031 0.000 0.031
233 0.071 0.038 0.044 0.000 0.000 0.074 0.010 0.015 0.025 0.042 0.000 0.010
237 0.024 0.025 0.015 0.182 0.031 0.015 0.030 0.015 0.013 0.021 0.067 0.051
241 0.000 0.013 0.265 0.182 0.177 0.044 0.030 0.121 0.113 0.042 0.100 0.112
245 0.095 0.263 0.088 0.114 0.073 0.221 0.200 0.197 0.088 0.094 0.000 0.082
249 0.286 0.125 0.118 0.068 0.125 0.177 0.150 0.046 0.025 0.115 0.067 0.143
253 0.071 0.138 0.044 0.136 0.115 0.074 0.120 0.182 0.025 0.115 0.367 0.153
257 0.000 0.038 0.015 0.205 0.031 0.074 0.160 0.000 0.050 0.031 0.150 0.020
261 0.024 0.000 0.015 0.046 0.010 0.000 0.010 0.030 0.075 0.042 0.050 0.031
265 0.071 0.000 0.000 0.046 0.031 0.029 0.070 0.061 0.050 0.073 0.033 0.051
269 0.024 0.025 0.015 0.000 0.000 0.015 0.000 0.136 0.063 0.010 0.017 0.000
273 0.119 0.038 0.015 0.000 0.000 0.029 0.030 0.000 0.000 0.073 0.000 0.031
277 0.000 0.013 0.000 0.000 0.000 0.000 0.010 0.000 0.050 0.021 0.000 0.000
281 0.000 0.000 0.000 0.000 0.010 0.000 0.000 0.000 0.000 0.010 0.000 0.000
285 0.000 0.000 0.000 0.000 0.010 0.000 0.000 0.000 0.000 0.010 0.000 0.000
289 0.000 0.000 0.000 0.000 0.000 0.000 0.000 0.000 0.000 0.000 0.000 0.000
291 0.000 0.000 0.000 0.000 0.021 0.000 0.000 0.000 0.000 0.000 0.000 0.000
295 0.000 0.000 0.000 0.000 0.000 0.000 0.000 0.000 0.000 0.000 0.000 0.000
D6
165 0.143 0.141 0.333 0.283 0.208 0.364 0.367 0.273 0.263 0.344 0.030 0.230
213 0.071 0.000 0.014 0.000 0.000 0.000 0.000 0.000 0.000 0.000 0.000 0.000
217 0.000 0.000 0.014 0.000 0.000 0.000 0.010 0.000 0.000 0.000 0.000 0.000
221 0.000 0.033 0.014 0.000 0.010 0.015 0.000 0.046 0.000 0.000 0.000 0.000
225 0.000 0.000 0.014 0.000 0.000 0.015 0.000 0.015 0.000 0.010 0.000 0.000
229 0.310 0.511 0.125 0.065 0.292 0.227 0.235 0.121 0.025 0.240 0.121 0.090
233 0.048 0.054 0.056 0.000 0.125 0.030 0.031 0.121 0.225 0.083 0.015 0.040
237 0.095 0.065 0.111 0.022 0.115 0.197 0.143 0.212 0.100 0.073 0.091 0.370
241 0.048 0.087 0.125 0.152 0.198 0.091 0.102 0.136 0.025 0.146 0.303 0.260
245 0.024 0.098 0.153 0.196 0.052 0.015 0.020 0.030 0.000 0.073 0.000 0.000
249 0.143 0.011 0.000 0.261 0.000 0.030 0.051 0.046 0.025 0.021 0.152 0.000
253 0.024 0.000 0.042 0.000 0.000 0.015 0.041 0.000 0.138 0.000 0.136 0.000
257 0.024 0.000 0.000 0.022 0.000 0.000 0.000 0.000 0.150 0.010 0.000 0.000
261 0.048 0.000 0.000 0.000 0.000 0.000 0.000 0.000 0.013 0.000 0.000 0.000
265 0.024 0.000 0.000 0.000 0.000 0.000 0.000 0.000 0.038 0.000 0.136 0.010
269 0.000 0.000 0.000 0.000 0.000 0.000 0.000 0.000 0.000 0.000 0.015 0.000
277 0.000 0.000 0.000 0.000 0.000 0.000 0.000 0.000 0.000 0.000 0.000 0.000

119
Appendix 2. Continued.
Locus/Alleles Populations
D116 LC NN HA HH SI NT MN BI MO CF PI WO
239 0.000 0.035 0.000 0.022 0.000 0.000 0.020 0.000 0.000 0.031 0.000 0.000
243 0.095 0.000 0.000 0.000 0.000 0.059 0.000 0.000 0.025 0.031 0.000 0.061
247 0.167 0.221 0.216 0.239 0.219 0.324 0.140 0.242 0.338 0.281 0.547 0.429
251 0.381 0.419 0.216 0.152 0.229 0.177 0.410 0.106 0.038 0.188 0.250 0.041
255 0.095 0.058 0.027 0.130 0.115 0.162 0.060 0.076 0.025 0.125 0.078 0.194
259 0.000 0.151 0.108 0.174 0.240 0.074 0.050 0.091 0.050 0.104 0.000 0.071
263 0.000 0.000 0.054 0.283 0.010 0.029 0.100 0.106 0.113 0.031 0.000 0.051
267 0.048 0.081 0.311 0.000 0.146 0.044 0.130 0.030 0.013 0.094 0.000 0.020
271 0.071 0.000 0.068 0.000 0.000 0.000 0.070 0.015 0.288 0.031 0.078 0.061
275 0.048 0.000 0.000 0.000 0.042 0.044 0.020 0.076 0.025 0.042 0.000 0.000
279 0.048 0.023 0.000 0.000 0.000 0.059 0.000 0.167 0.013 0.031 0.047 0.061
283 0.000 0.000 0.000 0.000 0.000 0.015 0.000 0.091 0.013 0.010 0.000 0.010
287 0.000 0.012 0.000 0.000 0.000 0.015 0.000 0.000 0.000 0.000 0.000 0.000
291 0.048 0.000 0.000 0.000 0.000 0.000 0.000 0.000 0.050 0.000 0.000 0.000
295 0.000 0.000 0.000 0.000 0.000 0.000 0.000 0.000 0.013 0.000 0.000 0.000
A10
154 0.024 0.000 0.000 0.000 0.021 0.000 0.000 0.000 0.000 0.000 0.000 0.031
156 0.119 0.022 0.000 0.022 0.000 0.044 0.177 0.000 0.063 0.031 0.066 0.000
158 0.762 0.880 0.944 0.957 0.854 0.809 0.745 0.636 0.863 0.750 0.934 0.908
160 0.000 0.022 0.000 0.000 0.021 0.015 0.000 0.000 0.000 0.010 0.000 0.000
164 0.095 0.076 0.056 0.022 0.104 0.132 0.078 0.364 0.075 0.208 0.000 0.061
D12
181 0.024 0.000 0.000 0.000 0.000 0.000 0.000 0.000 0.000 0.010 0.000 0.000
185 0.000 0.000 0.000 0.000 0.000 0.000 0.000 0.000 0.000 0.000 0.000 0.000
193 0.000 0.000 0.000 0.000 0.000 0.000 0.000 0.015 0.000 0.031 0.000 0.000
197 0.000 0.174 0.043 0.044 0.010 0.015 0.010 0.000 0.000 0.094 0.000 0.122
201 0.119 0.198 0.271 0.522 0.219 0.132 0.088 0.303 0.231 0.156 0.378 0.163
205 0.405 0.233 0.171 0.130 0.177 0.279 0.373 0.091 0.103 0.208 0.068 0.143
209 0.119 0.070 0.114 0.022 0.073 0.235 0.177 0.106 0.256 0.125 0.041 0.061
213 0.214 0.279 0.343 0.109 0.219 0.206 0.226 0.333 0.385 0.188 0.500 0.388
217 0.071 0.047 0.057 0.109 0.229 0.132 0.128 0.136 0.000 0.156 0.014 0.102
221 0.048 0.000 0.000 0.065 0.052 0.000 0.000 0.015 0.026 0.021 0.000 0.020
225 0.000 0.000 0.000 0.000 0.000 0.000 0.000 0.000 0.000 0.010 0.000 0.000
229 0.000 0.000 0.000 0.000 0.021 0.000 0.000 0.000 0.000 0.000 0.000 0.000
A5
216 0.000 0.067 0.029 0.022 0.053 0.076 0.010 0.258 0.013 0.031 0.176 0.031
226 0.881 0.678 0.729 0.630 0.681 0.833 0.902 0.424 0.850 0.813 0.595 0.837
228 0.119 0.256 0.243 0.348 0.266 0.091 0.088 0.318 0.138 0.156 0.230 0.133
A102
131 0.000 0.000 0.000 0.000 0.000 0.000 0.000 0.015 0.000 0.010 0.000 0.000
133 0.000 0.000 0.000 0.000 0.000 0.000 0.000 0.000 0.000 0.000 0.000 0.000
135 0.524 0.283 0.278 0.239 0.219 0.485 0.461 0.379 0.400 0.510 0.053 0.190
137 0.476 0.717 0.722 0.761 0.781 0.515 0.539 0.606 0.600 0.479 0.947 0.810

120
Appendix 2. Continued.
Locus/Alleles Populations
A11 LC NN HA HH SI NT MN BI MO CF PI WO
132 0.000 0.000 0.000 0.000 0.000 0.000 0.000 0.000 0.000 0.000 0.000 0.030
136 0.071 0.148 0.292 0.239 0.333 0.191 0.430 0.121 0.013 0.128 0.136 0.150
138 0.000 0.000 0.000 0.000 0.000 0.000 0.000 0.000 0.000 0.000 0.000 0.000
140 0.024 0.102 0.000 0.000 0.000 0.044 0.000 0.000 0.038 0.032 0.000 0.090
144 0.905 0.750 0.708 0.761 0.667 0.735 0.570 0.879 0.950 0.840 0.864 0.730
146 0.000 0.000 0.000 0.000 0.000 0.029 0.000 0.000 0.000 0.000 0.000 0.000
B110
165 0.000 0.000 0.000 0.000 0.000 0.000 0.000 0.015 0.000 0.011 0.000 0.000
183 0.643 0.466 0.375 0.348 0.575 0.632 0.560 0.394 0.738 0.553 0.183 0.470
185 0.095 0.159 0.472 0.044 0.075 0.074 0.060 0.121 0.188 0.106 0.067 0.050
191 0.262 0.375 0.153 0.609 0.351 0.294 0.380 0.470 0.075 0.330 0.750 0.480
D114
270 0.000 0.024 0.028 0.065 0.032 0.015 0.022 0.030 0.100 0.053 0.000 0.000
274 0.476 0.619 0.111 0.174 0.426 0.559 0.711 0.258 0.513 0.426 0.283 0.460
278 0.143 0.143 0.403 0.239 0.372 0.177 0.133 0.167 0.163 0.170 0.133 0.280
282 0.238 0.131 0.319 0.500 0.085 0.221 0.089 0.515 0.175 0.255 0.517 0.240
286 0.048 0.012 0.000 0.000 0.000 0.029 0.000 0.000 0.050 0.021 0.000 0.000
290 0.095 0.024 0.139 0.000 0.085 0.000 0.044 0.000 0.000 0.011 0.067 0.010
294 0.000 0.048 0.000 0.000 0.000 0.000 0.000 0.000 0.000 0.064 0.000 0.010
298 0.000 0.000 0.000 0.022 0.000 0.000 0.000 0.030 0.000 0.000 0.000 0.000
A104
161 0.071 0.120 0.095 0.065 0.219 0.235 0.049 0.394 0.088 0.128 0.189 0.210
163 0.500 0.217 0.324 0.217 0.385 0.471 0.392 0.242 0.713 0.447 0.392 0.350
165 0.429 0.663 0.581 0.717 0.396 0.294 0.529 0.333 0.200 0.404 0.419 0.440
167 0.000 0.000 0.000 0.000 0.000 0.000 0.010 0.030 0.000 0.011 0.000 0.000
169 0.000 0.000 0.000 0.000 0.000 0.000 0.020 0.000 0.000 0.011 0.000 0.000
C1
205 0.024 0.033 0.000 0.022 0.000 0.015 0.000 0.000 0.175 0.021 0.000 0.000
209 0.143 0.000 0.000 0.391 0.031 0.147 0.029 0.121 0.213 0.042 0.000 0.130
213 0.738 0.728 0.946 0.522 0.927 0.794 0.961 0.773 0.588 0.896 0.924 0.740
217 0.095 0.239 0.054 0.065 0.042 0.044 0.010 0.106 0.025 0.031 0.076 0.130
221 0.000 0.000 0.000 0.000 0.000 0.000 0.000 0.000 0.000 0.010 0.000 0.000
D126
128 0.286 0.424 0.324 0.022 0.406 0.206 0.137 0.318 0.325 0.208 0.265 0.170
132 0.262 0.294 0.054 0.239 0.302 0.265 0.235 0.212 0.175 0.240 0.309 0.330
136 0.452 0.283 0.622 0.739 0.292 0.529 0.628 0.470 0.500 0.552 0.427 0.500
B120
234 0.619 0.796 0.722 0.761 0.883 0.706 0.633 0.742 0.925 0.542 0.736 0.888
236 0.381 0.205 0.278 0.239 0.117 0.294 0.367 0.258 0.075 0.458 0.264 0.112