Classic and contemporary approaches to modeling biochemical ...
Upload
franckiko2Category
view
227download
0
8/18/2019 (Contemporary Approaches to Research
http://slidepdf.com/reader/full/contemporary-approaches-to-research 1/284
APPLICATION OF STRUCTURAL EQUATION MODELING
IN EDUCATIONAL RESEARCH AND PRACTICE

8/18/2019 (Contemporary Approaches to Research
http://slidepdf.com/reader/full/contemporary-approaches-to-research 2/284
CONTEMPORARY APPROACHES TO RESEARCH
IN LEARNING INNOVATIONS
Volume 7
Series Editors:
Myint Swe Khine – Curtin University, Australia Lim Cher Ping – Hong Kong Institute of Education, China Donald Cunningham – Indiana University, USA
International Advisory Board
Jerry Andriessen – University of Utrecht, the Netherlands Kanji Akahori – Tokyo Institute of Technology, Japan Tom Boyles – London Metropolitan University, United Kingdom Thanasis Daradoumis – University of Catalonia, Spain Arnold Depickere – Murdoch University, Australia Roger Hartley – University of Leeds, United Kingdom Victor Kaptelinin – Umea University, Sweden Paul Kirschner – Open University of the Netherlands, the Netherlands Konrad Morgan – University of Bergen, Norway Richard Oppermann – University of Koblenz-Landau, Germany Joerg Zumbach - University of Salzburg, Austria
Rationale:
Learning today is no longer confined to schools and classrooms. Modern information
and communication technologies make the learning possible any where, any time.
The emerging and evolving technologies are creating a knowledge era, changingthe educational landscape, and facilitating the learning innovations. In recent years
educators find ways to cultivate curiosity, nurture creativity and engage the mindof the learners by using innovative approaches.
Contemporary Approaches to Research in Learning Innovations explores appro-
aches to research in learning innovations from the learning sciences view. Learning
sciences is an interdisciplinary field that draws on multiple theoretical perspectives
and research with the goal of advancing knowledge about how people learn. Thefield includes cognitive science, educational psychology, anthropology, computer
and information science and explore pedagogical, technological, sociological and
psychological aspects of human learning. Research in this approaches examine thesocial, organizational and cultural dynamics of learning environments, construct
scientific models of cognitive development, and conduct design-based experiments.
Contemporary Approaches to Research in Learning Innovations covers research indeveloped and developing countries and scalable projects which will benefit
everyday learning and universal education. Recent research includes improving
social presence and interaction in collaborative learning, using epistemic games to
foster new learning, and pedagogy and praxis of ICT integration in school curricula.

8/18/2019 (Contemporary Approaches to Research
http://slidepdf.com/reader/full/contemporary-approaches-to-research 3/284
Application of Structural EquationModeling in Educational Research
and Practice
Edited by
Myint Swe Khine
Science and Mathematics Education Centre
Curtin University, Perth, Australia
SENSE PUBLISHERS
ROTTERDAM / BOSTON / TAIPEI

8/18/2019 (Contemporary Approaches to Research
http://slidepdf.com/reader/full/contemporary-approaches-to-research 4/284
A C.I.P. record for this book is available from the Library of Congress.
ISBN 978-94-6209-330-0 (paperback)
ISBN 978-94-6209-331-7 (hardback)
ISBN 978-94-6209-332-4 (e-book)
Published by: Sense Publishers,
P.O. Box 21858, 3001 AW Rotterdam, The Netherlands
https://www.sensepublishers.com/
Printed on acid-free paper
All rights reserved © 2013 Sense Publishers
No part of this work may be reproduced, stored in a retrieval system, or transmitted in any form or by
any means, electronic, mechanical, photocopying, microfilming, recording or otherwise, without written
permission from the Publisher, with the exception of any material supplied specifically for the purpose
of being entered and executed on a computer system, for exclusive use by the purchaser of the work.

8/18/2019 (Contemporary Approaches to Research
http://slidepdf.com/reader/full/contemporary-approaches-to-research 5/284
v
TABLE OF CONTENTS
Part I – Theoretical Foundations
Chapter 1
Applying Structural Equation Modeling (SEM) in EducationalResearch: An Introduction 3
Timothy Teo, Liang Ting Tsai and Chih-Chien Yang
Chapter 2
Structural Equation Modeling in Educational Research:A Primer 23
Yo In’nami and Rie Koizumi
Part II – Structural Equation Modeling in Learning Environment Research
Chapter 3
Teachers’ Perceptions of the School as a Learning Environment forPractice-based Research: Testing a Model That Describes Relations
between Input, Process and Outcome Variables 55
Marjan Vrijnsen-de Corte, Perry den Brok, Theo Bergen and Marcel Kamp
Chapter 4Development of an English Classroom Environment Inventory
and Its Application in China 75 Liyan Liu and Barry J. Fraser
Chapter 5The Effects of Psychosocial Learning Environment on Students’
Attitudes towards Mathematics 91
Ernest Afari
Chapter 6
Investigating Relationships between the Psychosocial Learning
Environment, Student Motivation and Self-Regulation 115
Sunitadevi Velayutham, Jill Aldridge and Ernest Afari
Chapter 7
In/Out-of-School Learning Environment and SEM Analyses on
Attitude towards School 135 Hasan Ş eker

8/18/2019 (Contemporary Approaches to Research
http://slidepdf.com/reader/full/contemporary-approaches-to-research 6/284
TABLE OF CONTENTS
vi
Chapter 8
Development of Generic Capabilities in Teaching and LearningEnvironments at the Associate Degree Level 169
Wincy W.S. Lee, Doris Y. P. Leung and Kenneth C.H. Lo
Part III – Structural Equation Modeling in Educational Practice
Chapter 9
Latent Variable Modeling in Educational Psychology: Insights
from a Motivation and Engagement Research Program 187Gregory Arief D. Liem and Andrew J. Martin
Chapter 10Linking Teaching and Learning Environment Variables to
Higher Order Thinking Skills: A Structural Equation
Modeling Approach 217
John K. Rugutt
Chapter 11
Influencing Group Decisions by Gaining Respect of Group
Members in E-Learning and Blended Learning Environments:A Path Model Analysis 241
Binod Sundararajan, Lorn Sheehan, Malavika Sundararajan and
Jill Manderson
Chapter 12
Investigating Factorial Invariance of Teacher Climate Factors
across School Organizational Levels 257
Christine DiStefano, Diana Mîndril ă and Diane M. Monrad
Part IV – Conclusion
Chapter 13
Structural Equation Modeling Approaches in Educational
Research and Practice 279 Myint Swe Khine
Author Biographies 285

8/18/2019 (Contemporary Approaches to Research
http://slidepdf.com/reader/full/contemporary-approaches-to-research 7/284
PART I
THEORETICAL
FOUNDATIONS

8/18/2019 (Contemporary Approaches to Research
http://slidepdf.com/reader/full/contemporary-approaches-to-research 8/284
M.S. Khine (ed.), Application of Structural Equation Modeling in Educational Research and
Practice, 3–21.
© 2013 Sense Publishers. All rights reserved.
TIMOTHY TEO, LIANG TING TSAI AND CHIH-CHIEN YANG
1. APPLYING STRUCTURAL EQUATION MODELING
(SEM) IN EDUCATIONAL RESEARCH:
AN INTRODUCTION
INTRODUCTION
The use of Structural Equation Modeling (SEM) in research has increased in
psychology, sociology, education, and economics since it was first conceived by
Wright (1918), a biometrician who was credited with the development of path
analysis to analyze genetic theory in biology (Teo & Khine, 2009). In the 1970s,
SEM enjoyed a renaissance, particularly in sociology and econometrics(Goldberger & Duncan, 1973). It later spread to other disciplines, such as
psychology, political science, and education (Kenny, 1979). The growth and
popularity of SEM was generally attributed to the advancement of softwaredevelopment (e.g., LISREL, AMOS, Mplus, Mx) that have increased the
accessibility of SEM to substantive researchers who have found this method to be
appropriate in addressing a variety of research questions (MacCallum & Austin,2000). Some examples of these software include LISREL (LInear Structural
RELations) by Joreskog and Sorbom (2003), EQS (Equations) (Bentler, 2003),
AMOS (Analysis of Moment Structures) by Arbuckle (2006), and Mplus byMuthén and Muthén (1998-2010).
Over the years, the combination of methodological advances and improvedinterfaces in various SEM software have contributed to the diverse usage of SEM.
Hershberger (2003) examined major journals in psychology from 1994 to 2001 and
found that over 60% of these journals contained articles using SEM, more thandoubled the number of articles published from 1985 to 1994. Although SEM
continues to undergo refinement and extension, it is popular among applied
researchers. The purpose of this chapter is to provide a non-mathematicalintroduction to the various facets of structural equation modeling to researchers in
education.
What Is Structural Equation Modeling?
Structural Equation Modeling is a statistical approach to testing hypotheses about
the relationships among observed and latent variables (Hoyle, 1995). Observed
variables also called indicator variables or manifest variables. Latent variables also
denoted unobserved variables or factors. Examples of latent variables in educationare math ability and intelligence and in psychology are depression and self-
8/18/2019 (Contemporary Approaches to Research
http://slidepdf.com/reader/full/contemporary-approaches-to-research 9/284
TEO ET AL.
4
confidence. The latent variables cannot be measured directly. Researchers must
define the latent variable in terms of observed variables to represent it. SEM is also
a methodology that takes a confirmatory (i.e. hypothesis-testing) approach to the
analysis of a theory relating to some phenomenon. Byrne (2001) compared SEM
against other multivariate techniques and listed four unique features of SEM:
(1) SEM takes a confirmatory approach to data analysis by specifying the
relationships among variables a priori. By comparison, other multivariate
techniques are descriptive by nature (e.g. exploratory factor analysis) so thathypothesis testing is rather difficult to do.
(2) SEM provides explicit estimates of error variance parameters. Other
multivariate techniques are not capable of either assessing or correcting for
measurement error. For example, a regression analysis ignores the potential error
in all the independent (explanatory) variables included in a model and this raises
the possibility of incorrect conclusions due to misleading regression estimates.
(3) SEM procedures incorporate both unobserved (i.e. latent) and observed
variables. Other multivariate techniques are based on observed measurements only.
(4) SEM is capable of modeling multivariate relations, and estimating direct and
indirect effects of variables under study.
Types of Models in SEMVarious types of structural equation models are used in research. Raykov and
Marcoulides (2006) listed four that are commonly found in the literature.
(1) Path analytic models (PA)
(2) Confirmatory factor analysis models (CFA)
(3) Structural regression models (SR)
(4) Latent change model (LC)
Path analytic (PA) models are conceived in terms of observed variables.
Although they focus only on observed variables, they form an important part of the
historical development of SEM and employ the same underlying process of modeltesting and fitting as other SEM models. Confirmatory factor analysis (CFA)
models are commonly used to examine patterns of interrelationships amongvarious constructs. Each construct in a model is measured by a set of observedvariables. A key feature of CFA models is that no specific directional relationships
are assumed between the constructs as they are correlated with each other only.
Structural regression (SR) models build on the CFA models by postulating specificexplanatory relationship (i.e. latent regressions) among constructs. SR models are
often used to test or disconfirm proposed theories involving explanatory
relationships among various latent variables. Latent change (LC) models are used

8/18/2019 (Contemporary Approaches to Research
http://slidepdf.com/reader/full/contemporary-approaches-to-research 10/284
APPLYING SEM IN EDUCATIONAL RESEARCH
5
to study change over time. For example, LC models are used to focus on patterns
of growth, decline, or both in longitudinal data and enable researchers to examine
both intra- and inter-individual differences in patterns of change. Figure 1 showsan example of each type of model. In the path diagram, the observed variables are
represented as rectangles (or squares) and latent variables are represented as circles
(or ellipses).
PA model
LC model
CFA model
SR model
Figure 1. Types of SEM models.
Example Data
Generally, SEM undergoes five steps of model specification, identification,
estimation, evaluation, and modifications (possibly). These five steps will beillustrated in the following sections with data obtained as part of a study to
examine the attitude towards computer use by pre-service teachers (Teo, 2008,
2010). In this example, we provide a step-by- step overview and non-mathematicalusing with AMOS of the SEM when the latent and observed variables are
Observed
Variable
Observed
Variable
Observed
Variable
Observed
Variable
Latent
Variable
Latent
Variable
Observed
Variable
Observed
Variable
Observed
Variable
E1
1
E2
1
E3
1
Latent
Variable
Observed
Variable
latent
variable
1
1
Observed
Variable
latent
variable
1
Observed
Variable
latent
variable
1
Latent
Variable
Latent
Variable
Latent
Variable
Latent
Variable
Latent
Variable
8/18/2019 (Contemporary Approaches to Research
http://slidepdf.com/reader/full/contemporary-approaches-to-research 11/284
TEO ET AL.
6
continuous. The sample size is 239 and, using the Technology Acceptance Model
(Davis, 1989) as the framework data were collected from participants who
completed an instrument measuring three constructs: perceived usefulness (PU), perceived ease of use (PEU), and attitude towards computer use (ATCU).
Measurement and Structural Models
Structural equation models comprise both a measurement model and a structuralmodel. The measurement model relates observed responses or ‘indicators’ to latent
variables and sometimes to observed covariates (i.e., the CFA model). The
structural model then specifies relations among latent variables and regressions oflatent variables on observed variables. The relationship between the measurement
and structural models is further defined by the two-step approach to SEM proposed by James, Mulaik and Brett (1982). The two-step approach emphasizes the analysis
of the measurement and structural models as two conceptually distinct models.
This approach expanded the idea of assessing the fit of the structural equationmodel among latent variables (structural model) independently of assessing the fit
of the observed variables to the latent variables (measurement model). The
rationale for the two-step approach is given by Jöreskog and Sörbom (2003) whoargued that testing the initially specified theory (structural model) may not be
meaningful unless the measurement model holds. This is because if the chosen
indicators for a construct do not measure that construct, the specified theory should be modified before the structural relationships are tested. As such, researchers
often test the measurement model before the structural model.
A measurement model is a part of a SEM model which specifies the relations between observed variables and latent variables. Confirmatory factor analysis is
often used to test the measurement model. In the measurement model, the
researcher must operationally decide on the observed indicators to define the latent
factors. The extent to which a latent variable is accurately defined depends on howstrongly related the observed indicators are. It is apparent that if one indicator is
weakly related to other indicators, this will result in a poor definition of the latent
variable. In SEM terms, model misspecification in the hypothesized relationships
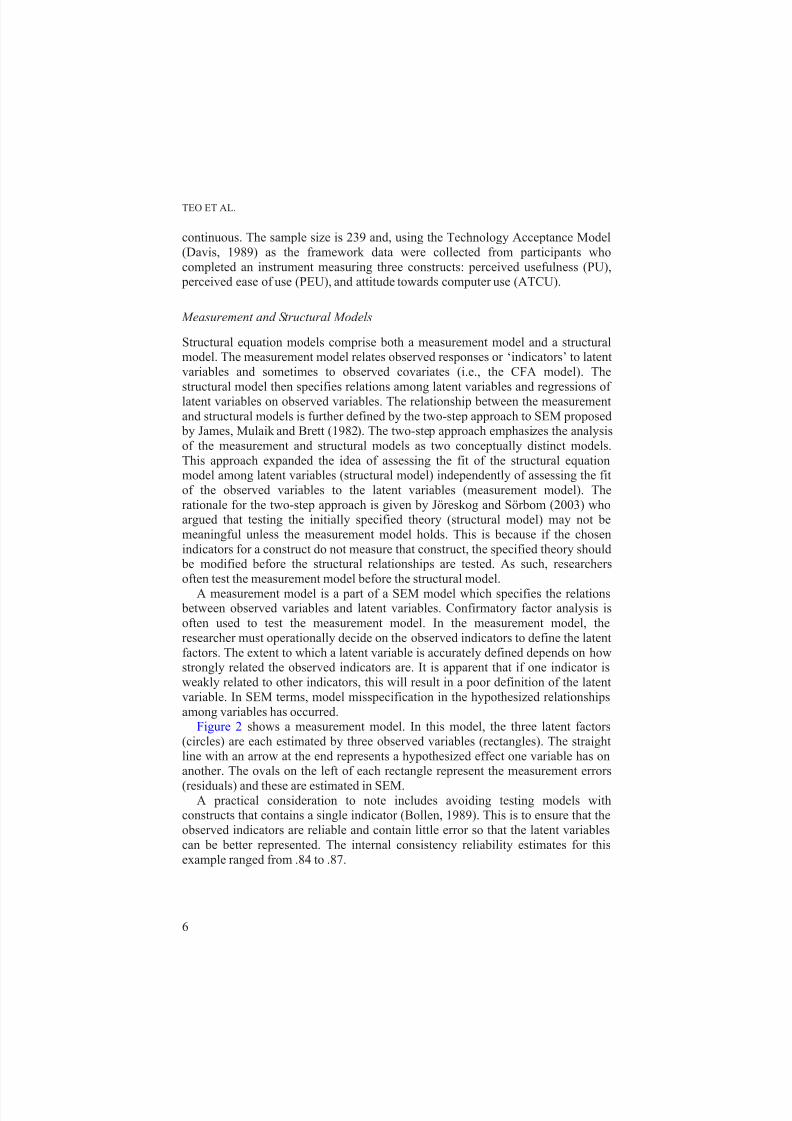
among variables has occurred.Figure 2 shows a measurement model. In this model, the three latent factors
(circles) are each estimated by three observed variables (rectangles). The straight
line with an arrow at the end represents a hypothesized effect one variable has onanother. The ovals on the left of each rectangle represent the measurement errors
(residuals) and these are estimated in SEM.A practical consideration to note includes avoiding testing models with
constructs that contains a single indicator (Bollen, 1989). This is to ensure that the
observed indicators are reliable and contain little error so that the latent variables
can be better represented. The internal consistency reliability estimates for this
example ranged from .84 to .87.

8/18/2019 (Contemporary Approaches to Research
http://slidepdf.com/reader/full/contemporary-approaches-to-research 12/284
APPLYING SEM IN EDUCATIONAL RESEARCH
7
Figure 2. An example of a measurement model.
Structural models differ from measurement models in that the emphasis moves
from the relationship between latent constructs and their measured variables to thenature and magnitude of the relationship between constructs (Hair et al., 2006). Inother words, it defines relations among the latent variables. In Figure 3, it was
hypothesized that a user’s attitude towards computer use (ATCU) is a function of
perceived usefulness (PU) and perceived ease of use (PEU). Perceived usefulness(PU) is, in turn influenced by the user’s perceived ease of use (PEU). Put
differently, perceived usefulness mediates the effects of perceived ease of use on
attitude towards computer use.
Effects in SEM
In SEM two types of effects are estimates: direct and indirect effects. Direct
effects, indicated by a straight arrow, represent the relationship between one latent
variable to another and this is indicated using single-directional arrows (e.g. between PU and ATCU in Figure 2). The arrows are used in SEM to indicate
directionality and do not imply causality. Indirect effects, on the other hand, reflectthe relationship between an independent latent variable (exogenous variable) (e.g.
PEU) and a dependent latent variable (endogenous variable) (e.g. ATCU) that is
mediate by one or more latent variable (e.g. PU).
Perceived
Ease of Use
PEU3er6
1
1
PEU2er5
1
PEU1er4
1
Attitude
Towards
Computer Use
ATCU3er9
ATCU2er8
ATCU1er7
1
1
1
1
Perceived
Usefulness
PU3er3
PU2er2
PU1er1
1
1
1
1

8/18/2019 (Contemporary Approaches to Research
http://slidepdf.com/reader/full/contemporary-approaches-to-research 13/284
TEO ET AL.
8
Figure 3. An example of a structural model
Note: An asterisk is where parameter has to be estimated
STAGES IN SEM
From the SEM literature, there appears an agreement among practitioners andtheorists that five steps are involved in testing SEM models. These five steps are
model specification, identification, estimation, evaluation, and modification (e.g.,
Hair et al., 2006; Kline, 2005; Schumacker & Lomax, 2004).
Model Specification
At this stage, the model is formally stated. A researcher specifies the hypothesized
relationships among the observed and latent variables that exist or do not exist in
the model. Actually, it is the process by the analyst declares which relationshipsare null, which are fixed to a constant, and which are vary. Any relationshipsamong variables that are unspecified are assumed to be zero. In Figure 3, the effect
of PEU on ATCU is mediated by PU. If this relationship is not supported, then
misspecification may occur.Relationships among variables are represented by parameters or paths. These
relationships can be set to fixed, free or constrained. Fixed parameters are not
estimated from the data and are typically fixed at zero (indicating no relationship
Attitude
Towards
Computer
Use
ATCU1 er1*1
1
ATCU2 er2**
1
ATCU3 er3**1
Perceived
Usefulness
PU1
er4*
PU2
er5*
PU3
er6*
1
1
*
1
*
1
Perceived
Ease of
Use
PEU3
er9*
PEU2
er8*
PEU1
er7*
1
1
*
1
*
1
*
*
*
er10*1
er11*
1

8/18/2019 (Contemporary Approaches to Research
http://slidepdf.com/reader/full/contemporary-approaches-to-research 14/284
APPLYING SEM IN EDUCATIONAL RESEARCH
9
between variables) or one. In this case where a parameter is fixed at zero, no path
(straight arrows) is drawn in a SEM diagram. Free parameters are estimated from
the observed data and are assumed by the researcher to be non-zero (these areshown in Figure 3 by asterisks). Constrained parameters are those whose value is
specified to be equal to a certain value (e.g. 1.0) or equal to another parameter in
the model that needs to be estimated. It is important to decide which parameters are
fixed and which are free in a SEM because it determines which parameters will be
used to compare the hypothesized diagram with the sample population variance
and covariance matrix in testing the fit of the model. The choice of which parameters are free and which are fixed in a model should be guided by the
literature.There are three types of parameters to be specified: directional effects,
variances, and covariances. Directional effects represent the relationships between
the observed indicators (called factor loadings) and latent variables, andrelationships between latent variables and other latent variables (called path
coefficients). In Figure 3, the directional arrows from the latent variable, PU to
PU2 and PU3 are examples of factor loading to be estimated while the factorloading of PU1 has been set at 1.0. The arrow from PU to ATCU is an example of
path coefficient showing the relationship between one latent variable (exogenous
variable) to another (endogenous variable). The directional effects in Figure 3 aresix factor loadings between latent variables and observed indicators and three path
coefficients between latent variables, making a total of nine parameters.
Variances are estimated for independent latent variables whose path loading has been set to 1.0. In Figure 3, variances are estimated for indicator error (er1~er9)
associated with the nine observed variables, error associated with the twoendogenous variables (PU and ATCU), and the single exogenous variable (PEU).
Covariances are nondirectional associations among independent latent variables(curved double-headed arrows) and these exist when a researcher hypothesizes that
two factors are correlated. Based on the theoretical background of the model in
Figure 3, no covariances were included. In all, 21 parameters (3 path coefficients, 6
factor loadings, and 12 variances) in Figure 3 were specified for estimation.
Model Identification
At this stage, the concern is whether a unique value for each free parameter can be
obtained from the observed data. This is dependent on the choice of the model andthe specification of fixed, constrained and free parameters. Schumacker and
Lomax (2004) indicated that three identification types are possible. If all the parameters are determined with just enough information, then the model is ‘just-identified’. If there is more than enough information, with more than one way of
estimating a parameter, then the model is ‘overidentified’. If one or more
parameters may not be determined due to lack of information, the model is ‘under-
identified’. This situation causes the positive degree of freedom. Models need to be
overidentified in order to be estimated and in order to test hypotheses about therelationships among variables. A researcher has to ensure that the elements in the
8/18/2019 (Contemporary Approaches to Research
http://slidepdf.com/reader/full/contemporary-approaches-to-research 15/284
TEO ET AL.
10
correlation matrix (i.e. the off-diagonal values) that is derived from the observed
variables are more than the number of parameters to be estimated. If the difference
between the number of elements in the correlation matrix and the number of parameters to be estimated is a positive figure (called the degree of freedom), the
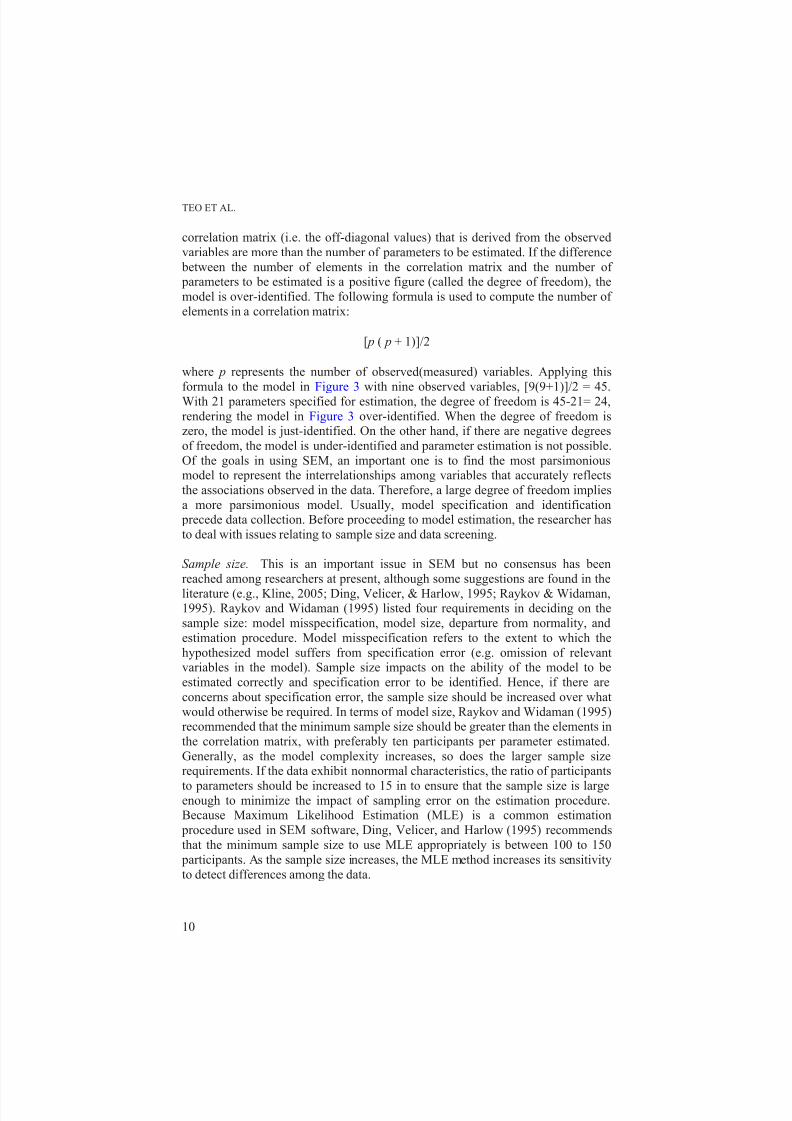
model is over-identified. The following formula is used to compute the number of
elements in a correlation matrix:
[ p ( p + 1)]/2
where p represents the number of observed(measured) variables. Applying this
formula to the model in Figure 3 with nine observed variables, [9(9+1)]/2 = 45.With 21 parameters specified for estimation, the degree of freedom is 45-21= 24,
rendering the model in Figure 3 over-identified. When the degree of freedom iszero, the model is just-identified. On the other hand, if there are negative degrees
of freedom, the model is under-identified and parameter estimation is not possible.
Of the goals in using SEM, an important one is to find the most parsimoniousmodel to represent the interrelationships among variables that accurately reflects
the associations observed in the data. Therefore, a large degree of freedom implies
a more parsimonious model. Usually, model specification and identification precede data collection. Before proceeding to model estimation, the researcher has
to deal with issues relating to sample size and data screening.
Sample size. This is an important issue in SEM but no consensus has been
reached among researchers at present, although some suggestions are found in the
literature (e.g., Kline, 2005; Ding, Velicer, & Harlow, 1995; Raykov & Widaman,1995). Raykov and Widaman (1995) listed four requirements in deciding on the
sample size: model misspecification, model size, departure from normality, and
estimation procedure. Model misspecification refers to the extent to which the
hypothesized model suffers from specification error (e.g. omission of relevantvariables in the model). Sample size impacts on the ability of the model to be
estimated correctly and specification error to be identified. Hence, if there are
concerns about specification error, the sample size should be increased over what
would otherwise be required. In terms of model size, Raykov and Widaman (1995)recommended that the minimum sample size should be greater than the elements in
the correlation matrix, with preferably ten participants per parameter estimated.
Generally, as the model complexity increases, so does the larger sample sizerequirements. If the data exhibit nonnormal characteristics, the ratio of participants
to parameters should be increased to 15 in to ensure that the sample size is largeenough to minimize the impact of sampling error on the estimation procedure.Because Maximum Likelihood Estimation (MLE) is a common estimation
procedure used in SEM software, Ding, Velicer, and Harlow (1995) recommends
that the minimum sample size to use MLE appropriately is between 100 to 150
participants. As the sample size increases, the MLE method increases its sensitivity
to detect differences among the data.

8/18/2019 (Contemporary Approaches to Research
http://slidepdf.com/reader/full/contemporary-approaches-to-research 16/284
APPLYING SEM IN EDUCATIONAL RESEARCH
11
Kline (2005) suggested that 10 to 20 participants per estimated parameter would
result in a sufficient sample. Based on this, a minimum of 10 x 21=210 participants
is needed to test the model in Figure 3. The data set associated with Figure 3 contains 239 cases so this is well within the guidelines by Kline. Additionally,
Hoelter’s critical N is often used as the standard sample size that would make the
obtained fit (measured by χ 2) significant at the stated level of significance (Hoelter,
1983). Hoelter’s critical N is a useful reference because it is found in most SEM
software (e.g., AMOS).
Multicollinearity. This refers to situations where measured variables (indicators)
are too highly related. This is a problem in SEM because researchers use relatedmeasures as indicators of a construct and, if these measures are too highly related,
the results of certain statistical tests may be biased. The usual practice to check for
multicollinearity is to compute the bivariate correlations for all measured variables.Any pair of variables with a correlations higher than r = .85 signifies potential
problems (Kline, 2005). In such cases, one of the two variables should be excluded
from further analysis.
Multivariate normality. The widely used methods in SEM assume that the
multivariate distribution is normally distributed. Kline (2005) indicated that all theunivariate distributions are normal and the joint distribution of any pair of the
variables is bivariate normal. The violation of these assumptions may affect the
accuracy of statistical tests in SEM. For example, testing a model withnonnormally distributed data may incorrectly suggest that the model is a good fit to
the data or that the model is a poor fit to the data. However, this assumption ishardly met in practice. In applied research, multivariate normality is examinedusing Mardia’s normalized multivariate kurtosis value. This is done by comparing
the Mardia’s coefficient for the data under study to a value computed based on the
formula p( p+2) where p equals the number of observed variables in the model(Raykov & Marcoulides, 2008). If the Mardia’s coefficient is lower than the value
obtained from the above formula, then the data is deemed as multivariate normal.As with the Hoelter’s critical N , the Mardia’s coefficient is found most SEM
software (e.g., AMOS).
Missing data. The presence of missing is often due to factors beyond the
researcher’s control. Depending on the extent and pattern, missing data must beaddressed if the missing data occur in a non-random pattern and are more than ten
percent of the overall data (Hair et al., 2006). Two categories of missing data aredescribed by Kline (2005): missing at random (MAR) and missing completely at
random (MCAR). These two categories are ignorable, which means that the patternof missing data is not systematic. For example, if the absence of the data occurs in
X variable and this absence occur by chance and are unrelated to other variables;
the data loss is considered to be at random.A problematic category of missing data is known as not missing at random
(NMAR), which implies a systematic loss of data. An example of NMAR is a

8/18/2019 (Contemporary Approaches to Research
http://slidepdf.com/reader/full/contemporary-approaches-to-research 17/284
TEO ET AL.
12
situation where participants did not provide data on the interest construct because
they have few interests and chose to skip those items. Another NMAR case is
where data is missing due to attrition in longitudinal research (e.g., attrition due todeath in a health study). To deal with MAR and MCAR, users of SEM employ
methods such as listwise deletion, pairwise deletion, and multiple imputations. As
to which method is most suitable, researchers often note the extent of the missing
data and the randomness of its missing. Various comprehensive reviews on
missing data such as Allison (2003), Tsai and Yang (2012), and Vriens and Melton
(2002) contain details on the categories of missing data and the methods fordealing with missing data should be consulted by researchers who wish to gain a
fuller understanding in this area.
Model Estimation
In estimation, the goal is to produce a (θ ) (estimated model-implied covariance
matrix) that resembles S (estimated sample covariance matrix) of the observed
indicators, with the residual matrix (S - (θ )) being as little as possible. When S -
(θ ) = 0, then χ 2 becomes zero, and a perfect model is obtained for the data. Modelestimation involves determining the value of the unknown parameters and the error
associated with the estimated value. As in regression, both unstandardized and
standardized parameter values and coefficients are estimated. The unstandardized
coefficient is analogous to a Beta weight in regression and dividing theunstandardized coefficient by the standard error produces a z value, analogous to
the t value associated with each Beta weight in regression. The standardized
coefficient is analogous to β in regression.Many software programs are used for SEM estimation, including LISREL
(Linear Structural Relationships; Jöreskog & Sörbom, 1996), AMOS (Analysis of
Moment Structures; Arbuckle, 2003), SAS (SAS Institute, 2000), EQS (Equations;
Bentler, 2003), and Mplus (Muthén & Muthén, 1998-2010). These software programs differ in their ability to compare multiple groups and estimate parameters
for continuous, binary, ordinal, or categorical indicators and in the specific fit
indices provided as output. In this chapter, AMOS 7.0 was used to estimate the
parameters in Figure 3. In the estimation process, a fitting function or estimation procedure is used to obtain estimates of the parameters in θ to minimize the
difference between S and (θ ). Apart from the Maximum Likelihood Estimation(MLE), other estimation procedures are reported in the literature, including
unweighted least squares (ULS), weighted least squares (WLS), generalized least
squares (GLS), and asymptotic distribution free (ADF) methods.In choosing the estimation method to use, one decides whether the data are
normally distributed or not. For example, the ULS estimates have no distributional
assumptions and are scale dependent. In other words, the scale of all the observed
variables should be the same in order for the estimates to be consistent. On theother hand, the ML and GLS methods assume multivariate normality although they
are not scale dependent.

8/18/2019 (Contemporary Approaches to Research
http://slidepdf.com/reader/full/contemporary-approaches-to-research 18/284
APPLYING SEM IN EDUCATIONAL RESEARCH
13
When the normality assumption is violated, Yuan and Bentler (1998)
recommend the use of an ADF method such as the WLS estimator that does not
assume normality. However, the ADF estimator requires very large samples (i.e., n= 500 or more) to generate accurate estimates (Yuan & Bentler, 1998). In contrast,
simple models estimated with MLE require a sample size as small as 200 for
accurate estimates.
Estimation example. Figure 3 is estimated using the Maximum Likelihood
estimator in AMOS 7.0 (Arbuckle, 2006). Figure 4 shows the standardized resultsfor the structural portion of the full model. The structural portion also call
structural regression models (Raykov & Marcoulides, 2000). AMOS provides thestandardized and unstandardized output, which are similar to the standardized betas
and unstandardized B weights in regression analysis. Typically, standardized
estimates are shown but the unstandardized portions of the output are examined forsignificance. For example, Figure 4 shows the significant relationships (p < .001
level) among the three latent variables. The significance of the path coefficient
from perceived ease of use (PEU) to perceived usefulness (PU) was determined byexamining the unstandardized output, which is 0.540 and had a standard error of
0.069.
Although the critical ratio (i.e., z score) is automatically calculated and providedwith the output in AMOS and other programs, it is easily determined whether the
coefficient is significant (i.e., z ≥ 1.96 for p ≤ .05) at a given alpha level by
dividing the unstandardized coefficient by the standard error. This statistical test isan approximately normally distributed quantity (z-score) in large samples (Muthén
& Muthén, 1998-2010). In this case, 0.540 divided by 0.069 is 7.826, which isgreater than the critical z value (at p = .05) of 1.96, indicating that the parameter is
significant.
* p < .001
Figure 4. Structural model with path coefficients
Perceived
Usefulness
PerceivedEase of Use
Attitude
Towards
Computer
Use
.44*
.43*
.60*

8/18/2019 (Contemporary Approaches to Research
http://slidepdf.com/reader/full/contemporary-approaches-to-research 19/284
TEO ET AL.
14
Model Fit
The main goal of model fitting is to determine how well the data fit the model.
Specifically, the researcher wishes to compare the predicted model covariance
(from the specified model) with the sample covariance matrix (from the obtaineddata). On how to determine the statistical significance of a theoretical model,
Schumacker and Lomax (2004) suggested three criteria. The first is a non-
statistical significance of the chi-square test and. A non-statistically significant chi-square value indicates that sample covariance matrix and the model-implied
covariance matrix are similar. Secondly, the statistical significance of each
parameter estimates for the paths in the model. These are known as critical values
and computed by dividing the unstandardized parameter estimates by theirrespective standard errors. If the critical values or t values are more than 1.96, theyare significant at the .05 level. Thirdly, one should consider the magnitude and
direction of the parameter estimates to ensure that they are consistent with the
substantive theory. For example, it would be illogical to have a negative parameter between the numbers of hours spent studying and test scores. Although addressing
the second and third criteria is straightforward, there are disagreements over what
constitutes acceptable values for global fit indices. For this reason, researchers arerecommended to report various fit indices in their research (Hoyle, 1995, Martens,
2005). Overall, researchers agree that fit indices fall into three categories: absolute
fit (or model fit), model comparison (or comparative fit), and parsimonious fit(Kelloway, 1998; Mueller & Hancock, 2004; Schumacker & Lomax, 2004).
Absolute fit indices measure how well the specified model reproduces the data.
They provide an assessment of how well a researcher’s theory fits the sample data(Hair et al., 2006). The main absolute fit index is the χ
2 (chi-square) which tests for
the extent of misspecification. As such, a significant χ2 suggests that the model
does not fit the sample data. In contrast, a non-significant χ2 is indicative of a
model that fits the data well. In other word, we want the p-value attached to the χ2
to be non-significant in order to accept the null hypothesis that there is no
significant difference between the model-implied and observed variances and
covariances. However, the χ2 has been found to be too sensitive to sample size
increases such that the probability level tends to be significant. The χ2also tends to
be greater when the number of observed variables increases. Consequently, a non-
significant p-level is uncommon, although the model may be a close fit to the
observed data. For this reason, the χ2 cannot be used as a sole indicator of model fit
in SEM. Three other commonly used absolute fit indices are described below.
The Goodness-of-Fit index (GFI) assesses the relative amount of the observedvariances and covariances explained by the model. It is analogous to the R2 in
regression analysis. For a good fit, the recommended value should be GFI > 0.95
(1 being a perfect fit). An adjusted goodness-of-fit index (AGFI) takes into accountdiffering degree of model complexity and adjusts the GFI by a ratio of the degrees
of freedom used in a model to the total degrees of freedom. The standardized root
mean square residual (SRMR) is an indication of the extent of error resulting from
the estimation of the specified model. On the other hand, the amount of error or
8/18/2019 (Contemporary Approaches to Research
http://slidepdf.com/reader/full/contemporary-approaches-to-research 20/284
APPLYING SEM IN EDUCATIONAL RESEARCH
15
residual illustrates how accurate the model is hence lower SRMR values (<.05)
represents a better model fit. The root mean square error of approximation
(RMSEA) corrects the tendency of the χ 2 to reject models with large same size or
number of variables. Like SRMR, a lower RMSEA (<.05) value indicates a good
fit and it is often reported with a confidence level at 95% level to account for
sampling errors associated with the estimated RMSEA.
In comparative fitting, the hypothesized model is assessed on whether it is betterthan a competing model and the latter is often a baseline model (also known as a
null model), one that assumes that all observed variables is uncorrelated. A widely-
used index example is the Comparative Fit Index (CFI) which indicates the relative
lack of fit of a specified model versus the baseline model. It is normed and variesfrom 0 to 1, with higher values representing better fit. The CFI is widely used
because of its strengths, including its relative insensitivity to model complexity. Avalue of > .95 for CFI is associated with a good model. Another comparative fit
index is the Tucker-Lewis Index (TLI), also called the Bentler-Bonnet NNFI
(nonnormed fit index) by Bentler and Bonnet (1980) is used to compare a proposedmodel to the null model. Since the TLI is not normed, its values can fall below 0 or
above 1. Typically, models with a good fit have values that approach 1.0.
Parsimonious indices assess the discrepancy between the observed and impliedcovariance matrix while taking into account a model’s complexity. A simple model
with fewer estimated parameters will always get a parsimony fit. This is because
although adding additional parameters (thus increasing the complexity of a model)will always improve the fit of a model but it may not improve the fit enough to
justify the added complexity. The parsimonious indices are computed using the
parsimony ratio (PR), which is calculated as the ratio of degrees of freedom used by the model to the total degrees of freedom available (Marsh, Balla, & McDonald,1988). An example of parsimony fit indices is the parsimony comparative-of-fit
index (PCFI), which adjust the CFI using the PR. The PCFI values of a model
range from 0 to 1 and is often used in conjunction with the PCFI of another model
(e.g. null model). Because the AGFI and RMSEA adjust for model complexity,they may be also used as indicators of model parsimony.
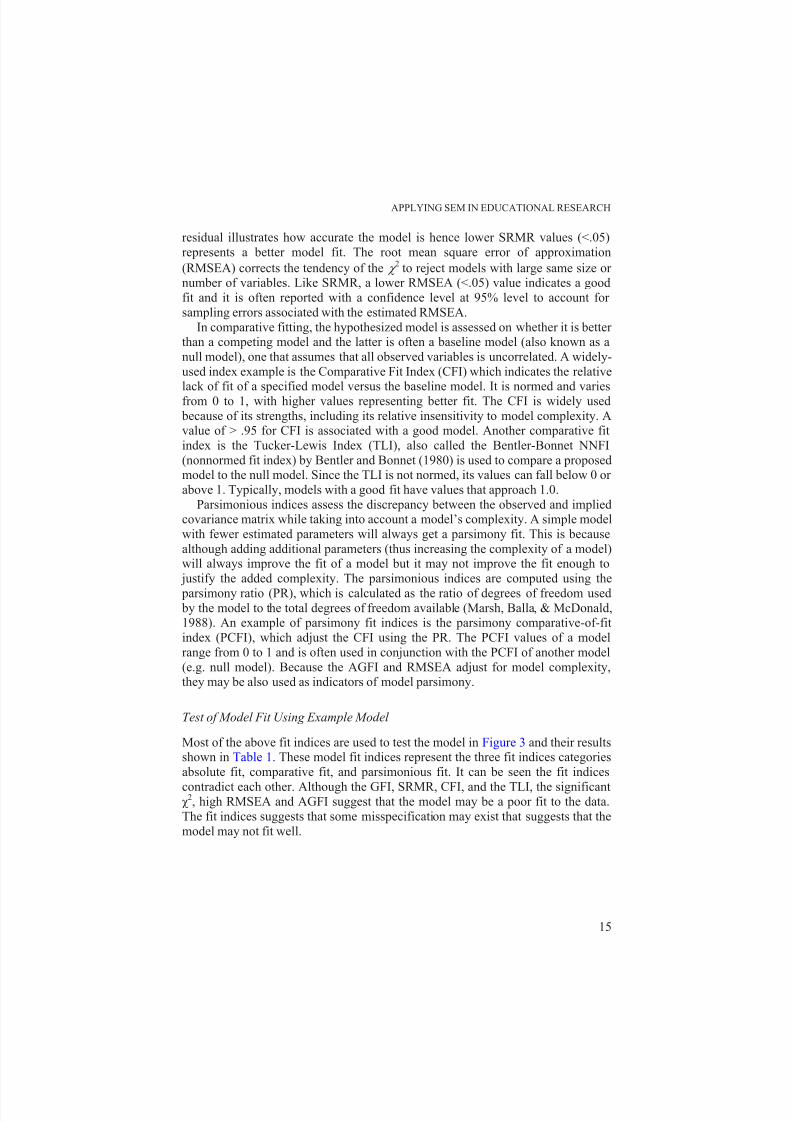
Test of Model Fit Using Example Model
Most of the above fit indices are used to test the model in Figure 3 and their resultsshown in Table 1. These model fit indices represent the three fit indices categories
absolute fit, comparative fit, and parsimonious fit. It can be seen the fit indices
contradict each other. Although the GFI, SRMR, CFI, and the TLI, the significantχ 2, high RMSEA and AGFI suggest that the model may be a poor fit to the data.
The fit indices suggests that some misspecification may exist that suggests that the
model may not fit well.

8/18/2019 (Contemporary Approaches to Research
http://slidepdf.com/reader/full/contemporary-approaches-to-research 21/284
TEO ET AL.
16
Table 1. Model fit for Figure 3
Fit Index Model in Figure 3 Recommended level Reference
χ2 61.135, significant Non-significant Hair et al. (2006)
GFI .94 < .95 Schumacker & Lomax(2004)
AGFI .89 < .95 Schumacker & Lomax(2004)
SRMR .04 < .08 Hu & Bentler (1998) RMSEA .08 < .07 Hair et al. (2006)
CFI .97 > .95 Schumacker & Lomax
(2004)TLI .95 > .95 Schumacker & Lomax(2004)
Note: GFI= Goodness-of-Fit; AGFI=Adjusted Goodness-of-Fit; SRMR=Standardized Root Mean Residual; RMAES= Root Mean Square Error of Approximation; CFI=Comparative
Fit Index; TLI=Tucker-Lewis Index
Parameter estimates. Having considered the structural model, it is important to
consider the significance of estimated parameters. As with regression, a model that
fits the data well but has few significant parameters is not desirable. From thestandardized estimates in Figure 4 (the path coefficients for the observed indicators
are not shown here because they would have been examined for significance
during the confirmatory factor analysis in the measurement model testing stage), it
appears that there is a stronger relationship between perceived ease of use (PEU)and perceived usefulness (PU) (β = .60) than between perceived ease of use (PEU)
and attitude towards computer use (ATCU) (β = .43). However, the relationship
between PEU and ATCU is also mediated by PU, so two paths from PEU and
ATCU can be traced in the model (PEU → PU → ATCU). Altogether, PU andPEU explain 60.8% of the variance in ATCU. This is also known as squared
multiple correlations and provided in the AMOS output.
Model Modification
If the fit of the model is not good, hypotheses can be adjusted and the model
retested. This step is often called re-specification (Schumacker & Lomax, 2004). In
modifying the model, a researcher either adds or removes parameters to improve
the fit. Additionally, parameters could be changed from fixed to free or from freeto fixed. However, these must be done carefully since adjusting a model after
initial testing increases the chance of making a Type I error. At all times, any
changes made should be supported by theory. To assist researchers in the process
of model modification, most SEM software such as AMOS compute themodification indices (MI) for each parameter. Also called the Lagrange Multiplier
(LM) Index or the Wald Test, these MI report the change in the χ2 value when
parameters are adjusted. The LM indicates the extent to which addition of free

8/18/2019 (Contemporary Approaches to Research
http://slidepdf.com/reader/full/contemporary-approaches-to-research 22/284
APPLYING SEM IN EDUCATIONAL RESEARCH
17
parameters increases model fitness while the Wald Test asks whether deletion of
free parameters increases model fitness. The LM and Wald Test follow the logic of
forward and backward stepwise regression respectively.The steps to modify the model include the following:
• Examine the estimates for the regression coefficients and the specified
covariances. The ratio of the coefficient to the standard error is equivalent to a z
test for the significance of the relationship, with a p < .05 cutoff of about 1.96. In
examining the regression weights and covariances in the model you originally
specified, it is likely that one will find several regression weights or covariancesthat are not statistically significant.
• Adjust the covariances or path coefficients to make the model fit better. This isthe usual first step in model fit improvement.
• Re-run the model to see if the fit is adequate. Having made the adjustment, it
should be noted that the new model is a subset of the previous one. In SEM
terminology, the new model is a nested model. In this case, the difference in the χ2
is a test for whether some important information has been lost, with the degrees of
freedom of this χ2 equal to the number of the adjusted paths. For example, if the
original model had a χ2 of 187.3, and you remove two paths that were not
significant. If the new χ2 has a value of 185.2, with 2 degrees of freedom (not
statistically significant difference), then important information has not been lostwith this adjustment.
• Refer to the modification indices (MI) provided by most SEM programs if the
model fit is still not adequate after steps 1 to 3. The value of a given modification
index is the amount that the χ2 value is expected to decrease if the corresponding
parameter is freed. At each step, a parameter is freed that produces the largestimprovement in fit and this process continues until an adequate fit is achieved (see
Figure 5). Because the SEM software will suggest all changes that will improve
model fit, some of these changes may be nonsensical. The researcher must always be guided by theory and avoid making adjustments, no matter how well they may
improve model fit. Figure 5 shows an example of a set of modification indices
from AMOS 7.0.
Martens (2005) noted that model modifications generally result in a better-fitting model. Hence researchers are cautioned that extensive modifications may
results in data-driven models that may not be generalizable across samples (e.g.,
Chou & Bentler, 1990; Green, Thompson, & Babyak, 1998). This problem is likely
to occur when researchers (a) use small samples, (b) do not limit modifications tothose that are theoretically acceptable, and (c) severely misspecify the initial model
(Green et al., 1998). Great care must be taken to ensure that models are modifiedwithin the limitations of the relevant theory. Using Figure 3 as an example, if aWald test indicated that the researcher should remove the freely estimated
parameter from perceived ease of use (PEU) to perceived usefulness (PU), the
researcher should not apply that modification, because the suggested relationship between PEU and PU has been empirically tested and well documented. Ideally,
model modifications suggested by the Wald or Lagrange Multiplier tests should be
tested on a separate sample (i.e. cross-validation). However, given the large

8/18/2019 (Contemporary Approaches to Research
http://slidepdf.com/reader/full/contemporary-approaches-to-research 23/284
TEO ET AL.
18
samples required and the cost of collecting data for cross-validation, it is common
to split an original sample into two halves, one for the original model and the other
for validation purposes. If the use of another sample is not possible, extreme
caution should be exercised when modifying and interpreting modified models.
Covariances: (Group number 1 – Default model)
M.I. Par Changeer7 <--> er10 17.060 .064
er9 <--> er10 4.198 -.033er6 <--> er9 4.784 -.038
er5 <--> er11 5.932 -.032
er5 <--> er7 5.081 .032er4 <--> er11 8.212 .039
er4 <--> er8 4.532 -.032er3 <--> er7 4.154 -.042
er2 <--> er10 4.056 -.032er2 <--> er9 8.821 .049
er1 <--> er10 5.361 .038
Figure 5. An example of modification indices from AMOS 7.0
CONCLUSION
This chapter attempts to describe what SEM is and illustrate the various steps of
SEM by analysing an educational data set. It clearly shows that educational
research can take advantage of SEM by considering more complex researchquestions and to test multivariate models in a single study. Despite the
advancement of many new, easy-to-use software programs (e.g., AMOS, Lisrel,
Mplus) that have increased the accessibility of this quantitative method, SEM is acomplex family of statistical procedures that requires the researcher to make some
decisions in order to avoid misuse and misinterpretation. Some of these decisions
include answering how many participants to use, how to normalize data, what
estimation methods and fit indices to use, and how to evaluate the meaning ofthose fit indices. The approach to answering these questions is presented
sequentially in this chapter. However, using SEM is more than an attempt to apply
any set of decision rules. To use SEM well involves the interplay of statistical procedures and theoretical understanding in the chosen discipline. Rather, those
interested in using the techniques competently should constantly seek out
information on the appropriate application of this technique. Over time, asconsensus emerges, best practices are likely to change, thus affecting the wayresearchers make decisions.
This chapter contributes to the literature by presenting a non-technical, non-
mathematical, and step-by-step introduction to SEM with a focus for educational
researchers who possess little or no advanced Mathematical skills and knowledge.Because of the use of the variance-covariance matrix algebra in solving the
simultaneous equations in SEM, many textbooks and ‘introductory’ SEM articles

8/18/2019 (Contemporary Approaches to Research
http://slidepdf.com/reader/full/contemporary-approaches-to-research 24/284
APPLYING SEM IN EDUCATIONAL RESEARCH
19
contained formulas and equations that appear daunting to many educational
researchers, many of whom consume SEM-based research reports and review
journal articles as part of their professional lives. In addition, this chapterembedded an empirical study using a real educational data set to illustrate aspects
of SEM at various junctures aimed to enhance the readers’ understanding through
practical applications of the technique. In view of the need for continuous learning,
several suggestions and resources are listed in this chapter to aid readers in further
reading and reference. In summary, while this author acknowledge that similar
information may be obtained from textbooks and other sources, the strength of thischapter lies in its brevity and conciseness in introducing readers on the
background, features, applications, and potentials of SEM in educational research.
APPENDIX
As with many statistical techniques, present and intending SEM users must engage
in continuous learning. For this purpose, many printed and online materials areavailable. Tapping on the affordances of the internet, researchers have posted
useful resources and materials for ready and free access to anyone interested in
learning to use SEM. It is impossible to list all the resources that are available onthe internet. The following are some websites that this author has found to be
useful for reference and educational purposes.
Software (http://core.ecu.edu/psyc/wuenschk/StructuralSoftware.htm)
The site Information on various widely-used computer programs by SEM users.
Demo and trails of some of these programs are available at the links to this site.
Books (http://www2.gsu.edu/~mkteer/bookfaq.html) This is a list of introductory and advanced books on SEM and SEM-related topics.
General information on SEM (http://www.hawaii.edu/sem/sem.html)
This is one example of a person-specific website that contains useful informationon SEM. There are hyperlinks in this page to other similar sites.
Journal articles (http://www.upa.pdx.edu/IOA/newsom/semrefs.htm)
A massive list of journal articles, book chapters, and whitepapers for anyone
wishing to learn about SEM.
SEMNET (http://www2.gsu.edu/~mkteer/semnet.html) This is an electronic mail network for researchers who study or apply structuralequation modeling methods. SEMNET was founded in February 1993. As of
November 1998, SEMNET had more than 1,500 subscribers around the world. The
archives and FAQs sections of the SEMNET contain useful information forteaching and learning SEM.

8/18/2019 (Contemporary Approaches to Research
http://slidepdf.com/reader/full/contemporary-approaches-to-research 25/284
TEO ET AL.
20
REFERENCES
Allison, P. D. (2003). Missing data techniques for structural equation models. Journal of Abnormal
Psychology, 112, 545-557.
Arbuckle, J. L. (2006). Amos (Version 7.0) [Computer Program]. Chicago: SPSS.
Bentler, P. M. (2003). EQS (Version 6) [Computer software]. Encino, CA: Multivariate Software.
Bentler, P. M., & Bonnet, D. G. (1980). Significance tests and goodness of fit in the analysis of
covariance structures. Psychological Bulletin, 88, 588-606.
Bollen, K. A. (1989). Structural equations with latent variables. New York: Wiley.
Byrne, B. M. (2001). Structural equation modeling with AMOS: Basic concepts, applications, and
programming . Mahwah, NJ: Lawrence Erlbaum.
Davis, F. D. (1989). Perceived usefulness, perceived ease of use, and user acceptance of information
technology. MIS Quarterly, 13(3), 319-340.Ding, L., Velicer, W. F., & Harlow, L. L. (1995). Effects of estimation methods, number indicators per
factor, and improper solutions on structural equation modeling fit indices. Structural Equation
Modeling, 2, 119-144.
Goldberger, A. S., & Duncan, O. D. (1973). Structural equation models in the social sciences. New
York: Seminar Press.
Green, S. B., Thompson, M. S., & Babyak, M. A. (1998). A Monte Carlo investigation of methods for
controlling Type I errors with specification searches in structural equation modeling. Multivariate
Behavioral Research, 33, 365-384.
Hair, J. F. Jr., Black, W. C., Babin, B. J., Anderson R. E., & Tatham, R. L. (2006). Multivariate Data
Analysis (6th ed.), Upper Saddle River, NJ: Prentice Education, Inc.
Hershberger, S. L. (2003). The growth of structural equation modeling: 1994-2001. Structural Equation
Modeling, 10(1), 35-46.
Hoelter, J. W. (1983). The analysis of covariance structures: Goodness-of-fit indices. Sociological
Methods & Research, 11, 325-344.
Hoyle, R. H. (1995). The structural equation modeling approach: basic concepts and fundamental
issues. In R.H. Hoyle (ed.), Structural equation modeling: concepts, issues, and applications (pp. 1-
15). Thousand Oaks, CA: Sage Publications.
Hu, L. T., & Bentler, P. (1995). Evaluating model fit. In R. H. Hoyle (Ed.), Structural equation
modeling. Concepts, issues, and applications. London: Sage.
James, L., Mulaik, S., & Brett, J. (1982). Causal analysis: Assumptions, models and data. Beverly
Hills, CA: Sage Publications.
Jöreskog, K. G., & Sörbom, D. (2003). LISREL (Version 8.54) [Computer software]. Chicago:
Scientific Software.
Kelloway, E. K. (1998). Using LISREL for structural equation modeling: A researcher’s guide.
Thousand Oaks, CA: Sage Publications, Inc.
Kenny, D. A. (1979). Correlation and causality. New York: Wiley.
Kline, R. B. (2005). Principles and practice of structural equation modeling (2nd ed.). New York:
Guilford Press.
MacCallum, R. C., & Austin, J. T. (2000). Applications of structural equation modeling in
psychological research. Annual Review of Psychology, 51, 201-222.
Marsh, H. W. Balla, J. W., & McDonald, R. P. (1988). Goodness-of-fit indices in confirmatory factoranalysis: Effects of sample size. Psychological Bulletin, 103, 391-411.
Martens, M. P. (2005). The use of structural equation modeling in counseling psychology research. The
Counseling Psychologist, 33, 269-298.
Mueller, R. O., & Hancock, G. R. (2004). Evaluating structural equation modeling studies: Some
practical suggestions to manuscript reviewers. Paper presented at the meeting of the American
Educational Research Association, San Diego, CA.
Muthén, L. K., & Muthén, B. O. (1998-2010). Mplus user’s guide. Sixth Edition [Computer Program].
Los Angeles, CA: Muthén & Muthén.
8/18/2019 (Contemporary Approaches to Research
http://slidepdf.com/reader/full/contemporary-approaches-to-research 26/284
APPLYING SEM IN EDUCATIONAL RESEARCH
21
Raykov, T., & Marcoulides, G. A. (2006). A first course in structural equation modeling. Mahwah, NJ:
Erlbaum.
Raykov, T., & Marcoulides, G. A. (2008). An introduction to applied multivariate analysis. New York:
Routledge.
Raykov, T., & Widaman, K. F. (1995). Issues in applied structural equation modeling research.
Structural Equation Modeling , 2(4), 289–31.
Raykov, T., & Marcoulides, G. A. (2000). A method for comparing completely standardized solutions
in multiple groups. Structural Equation Modeling, 7 (2), 292-308
Schumacker, R. E., & Lomax, R. G. (2004). A beginner’s guide to structural equation modeling . New
Jersey: Lawrence Erlbaum Associates.
Teo, T. (2009). Is there an attitude problem? Re-considering the role of attitude in the TAM. British
Journal of Educational Technology, 40(6), 1139-1141.
Teo, T. (2010). A path analysis of pre-service teachers' attitudes to computer use: Applying andextending the Technology Acceptance Model in an educational context. Interactive Learning
Environments, 18(1), 65-79.
Teo, T., & Khine, M. S. (2009). Modeling educational research: The way forward. In T. Teo & M. S.
Khine (Eds.), Structural equation modeling in educational research: Concepts and applications (pp.
3-10). Rotterdam, the Netherlands: Sense Publishers.
Tsai, L. T. & Yang, C. C. (2012).Improving measurement invariance assessments in survey research
with missing data by novel artificial neural networks. Expert Systems with Applications. (In press)
Vriens, M., & Melton, E. (2002). Managing missing data. Marketing Research, 14, 12-17.
Wright, S. (1918). On the nature of size factors. Genetics, 3, 367-374.
Yuan, K. H., & Bentler, P. M. (1998). Normal theory based test statistics in structural equation
modeling. British Journal of Mathematical and Statistical Psychology, 51, 289-309.
Timothy TeoUniversity of Auckland
New Zealand
Liang Ting Tsai
National Taichung University
Taiwan
Chih-Chien Yang
National Taichung UniversityTaiwan

8/18/2019 (Contemporary Approaches to Research
http://slidepdf.com/reader/full/contemporary-approaches-to-research 27/284
M.S. Khine (ed.), Application of Structural Equation Modeling in Educational Research and
Practice, 23–51.
© 2013 Sense Publishers. All rights reserved.
YO IN’NAMI AND RIE KOIZUMI
2. STRUCTURAL EQUATION MODELING IN
EDUCATIONAL RESEARCH: A PRIMER
INTRODUCTION
Structural equation modeling (SEM) is a collection of statistical methods for
modeling the multivariate relationship between variables. It is also calledcovariance structure analysis or simultaneous equation modeling and is often
considered an integration of regression and factor analysis. As SEM is a flexible
and powerful technique for examining various hypothesized relationships, it has been used in numerous fields, including marketing (e.g., Jarvis, MacKenzie, &
Podsakoff, 2003; Williams, Edwards, & Vandenberg, 2003), psychology (e.g.,Cudeck & du Toit, 2009; Martens, 2005), and education (e.g., Kieffer, 2011; Teo
& Khine, 2009; Wang & Holcombe, 2010). For example, educational research has
benefited from the use of SEM to examine (a) the factor structure of the learnertraits assessed by tests or questionnaires (e.g., Silverman, 2010; Schoonen et al.,
2003), (b) the equivalency of models across populations (e.g., Byrne, Baron, &
Balev, 1998; In’nami & Koizumi, 2012; Shin, 2005), and (c) the effects of learnervariables on proficiency or academic achievement at a single point in time (e.g.,
Ockey, 2011; Wang & Holcombe, 2010) or across time (e.g., Kieffer, 2011; Marsh& Yeung, 1998; Tong, Lara-Alecio, Irby, Mathes, & Kwok, 2008; Yeo,
Fearrington, & Christ, 2011). This chapter provides the basics and the key concepts
of SEM, with illustrative examples in educational research. We begin with the
advantages of SEM, and follow this with a description of Bollen and Long’s(1993) five steps for SEM application. Then, we discuss some of the key issues
with regard to SEM. This is followed by a demonstration of various SEM analyses
and a description of software programs for conducting SEM. We conclude with adiscussion on learning more about SEM. Readers who are unfamiliar with
regression and factor analysis are referred to Cohen, Cohen, West, and Aiken
(2003), Gorsuch (1983), and Tabachnick and Fidell (2007). SEM is an extension ofthese techniques, and having a solid understanding of them will aid comprehension
of this chapter.
ADVANTAGES OF SEM
SEM is a complex, multivariate technique that is well suited for testing various
hypothesized or proposed relationships between variables. Compared with anumber of statistical methods used in educational research, SEM excels in four
aspects (e.g., Bollen, 1989; Byrne, 2012b). First, SEM adopts a confirmatory,

8/18/2019 (Contemporary Approaches to Research
http://slidepdf.com/reader/full/contemporary-approaches-to-research 28/284
IN’NAMI AND KOIZUMI
24
hypothesis-testing approach to the data. This requires researchers to build a
hypothesis based on previous studies. Although SEM can be used in a model-
exploring, data-driven manner, which could often be the case with regression orfactor analysis, it is largely a confirmatory method. Second, SEM enables an
explicit modeling of measurement error in order to obtain unbiased estimates of the
relationships between variables. This allows researchers to remove the
measurement error from the correlation/regression estimates. This is conceptually
the same as correcting for measurement error (or correcting for attenuation), where
measurement error is taken into account for two variables by dividing thecorrelation by the square root of the product of the reliability estimates of the two
instruments (r xy
/√[r xx
× r yy
]). Third, SEM can include both unobserved (i.e., latent)and observed variables. This is in contrast with regression analysis, which can only
model observed variables, and with factor analysis, which can only model
unobserved variables. Fourth, SEM enables the modeling of complex multivariaterelations or indirect effects that are not easily implemented elsewhere. Complex
multivariate relations include a model where relationships among only a certain set
of variables can be estimated. For example, in a model with variables 1 to 10, it
could be that only variables 1 and 2 can be modeled for correlation. Indirect effectsrefer to the situation in which one variable affects another through a mediating
variable.
FIVE STEPS IN AN SEM APPLICATION
The SEM application comprises five steps (Bollen & Long, 1993), although they
vary slightly from researcher to researcher. They are (a) model specification, (b)model identification, (c) parameter estimation, (d) model fit, and (e) model
respecification. We discuss these steps in order to provide an outline of SEManalysis; further discussion on key issues will be included in the next section.
Model Specification
First, model specification is concerned with formulating a model based on a theoryand/or previous studies in the field. Relationships between variables – both latent
and observed – need to be made explicit, so that it becomes clear which variables
are related to each other, and whether they are independent or dependent variables.Such relationships can often be conceptualized and communicated well through
diagrams.
For example, Figure 1 shows a hypothesized model of the relationship betweena learner’s self-assessment, teacher assessment, and academic achievement in a
second language. The figure was drawn using the SEM program Amos (Arbuckle,
1994-2012), and all the results reported in this chapter are analyzed using Amos,unless otherwise stated. Although the data analyzed below are hypothetical, let us
suppose that the model was developed on the basis of previous studies. Rectangles
represent observed variables (e.g., item/test scores, responses to questionnaireitems), and ovals indicate unobserved variables. Unobserved variables are also

8/18/2019 (Contemporary Approaches to Research
http://slidepdf.com/reader/full/contemporary-approaches-to-research 29/284
SEM IN EDUCATIONAL RESEARCH: A PRIMER
25
called factors, latent variables, constructs, or traits. The terms factor and latent
variable are used when the focus is on the underlying mathematics (Royce, 1963),
while the terms construct and trait are used when the concept is of substantiveinterest. Nevertheless, these four terms are often used interchangeably, and, as
such, are used synonymously throughout this chapter. Circles indicate
measurement errors or residuals. Measurement errors are hypothesized when a
latent variable affects observed variables, or one latent variable affects another
latent variable. Observed and latent variables that receive one-way arrows are
usually modeled with a measurement error. A one-headed arrow indicates ahypothesized one-way direction, whereas a two-headed arrow indicates a
correlation between two variables. The variables that release one-way arrows areindependent variables (also called exogenous variables), and those that receive
arrows are dependent variables (also called endogenous variables). In Figure 1,
self-assessment is hypothesized to comprise three observed variables ofquestionnaire items measuring self-assessment in English, mathematics, and
science. These observed variables are said to load on the latent variable of self-
assessment. Teacher assessment is measured in a similar manner using the threequestionnaire items, but this time presented to a teacher. The measurement of
academic achievement includes written assignments in English, mathematics, and
science. All observed variables are measured using a 9-point scale, and the datawere collected from 450 participants. The nine observed variables and one latent
variable contained measurement errors. Self-assessment and teacher assessment
were modeled to affect academic achievement, as indicated by a one-way arrow.They were also modeled to be correlated with each other, as indicated by a two-
way arrow.Additionally, SEM models often comprise two subsets of models: a
measurement model and a structured model. A measurement model relatesobserved variables to latent variables, or, defined more broadly, it specifies how
the theory in question is operationalized as latent variables along with observed
variables. A structured model relates constructs to one another and represents the
theory specifying how these constructs are related to one another. In Figure 1, thethree latent factors – self-assessment, teacher assessment, and academic
achievement – are measurement models; the hypothesized relationship between
them is a structural model. In other words, structural models can be considered to
comprise several measurement models. Since we can appropriately interpretrelationships among latent variables only when each latent variable is well
measured by observed variables, an examination of the model fit (see below for
details) is often conducted on a measurement model before one constructs astructural model.

8/18/2019 (Contemporary Approaches to Research
http://slidepdf.com/reader/full/contemporary-approaches-to-research 30/284
IN’NA
26
odel
The s
withwhose
errors
deviat
whenavaila
theorethere
varianthe id
(metri
can be be a
varian
numb
unkno
21 est
covari1 and
refers
Figure points
which
differ estima
I AND KOIZU
Identificatio
cond step in
hether onevalue is un
using the va
ons) of the
there are mle in the v
tically sound,re a large n
ces and covar ntification o
c) because th
achieved byspecific val
ce/covariance
r of parame
wn informati
imated para
ance, and 2 f do not have t
to the numbe
1, there are. This is larg
is 21. Thus,
nce betweented. In the c
I
Figure 1. E
an SEM appli
an derive anown (e.g.,
iance/covaria
easured vari
re parameteriance/covari
are likely tomber of para
iances in theSEM model
ey are unobse
fixing eithere, usually 1
matrix – kn
ters to be es
n. For examp
eters: 8 fact
ctor variance be estimated
of observed
nine observer than the nu
this model is
the number ourrent examp
xample SEM m
cation, namel
nique valueactor loading
nce matrix (o
ables that ar
s than cannce matrix.
have identif meters to be
atrix. Two is. First, latent
rved and do
factor varia. Second, t
wn informat
timated in t
le, for the aca
or loadings,
. Three of th. The number
variables. For
d variables, ber of para
identifiable.
f data pointsle, the df are
odel diagram.
y model iden
for each par s, factor corr
the correlati
known. Mo
e estimatedModels that
cation probleestimated rel
portant prin variables m
ot have pred
ce, or one ofe number o
ion – must b
e model (i.
demic achiev
10 measurem
factor loadinof data point
the academic
nd thereforeeters to be e
he degrees o
and the numb 24. When d
ification, is c
ameter (in thelations, mea
n matrix and
dels are not i
from the inare complex,
ms, particulative to the n
iples are appst be assigne
etermined sc
the factor lof data point
e at least eq
., free para
ement model,
ent error var
gs are each fi is p( p + 1)/2,
achievement
9(9 + 1)/2stimated in t
f freedom (d
er of parame are positiv
oncerned
e model)surement
standard
dentified
ormationeven if
rly whenmber of
icable tod a scale
les. This
dings, tos in the
al to the
eters) –
there are
ances, 1
xed to bewhere p
factor in
45 datae model,
) are the
ers to be(one or

8/18/2019 (Contemporary Approaches to Research
http://slidepdf.com/reader/full/contemporary-approaches-to-research 31/284
SEM IN EDUCATIONAL RESEARCH: A PRIMER
27
above), models can be identified. When df are negative, models cannot be
identified, and are called unidentified. When df are zero, models can be identified
but cannot be evaluated using fit indices (for fit indices, see below).
Parameter Estimation
Third, once the model has been identified, the next step is to estimate parameters in
the model. The goal of parameter estimation is to estimate population parameters by minimizing the difference between the observed (sample) variance/covariance
matrix and the model-implied (model-predicted) variance/covariance matrix.
Several estimation methods are available, including maximum likelihood,robust maximum likelihood, generalized least squares, unweighted least squares,
elliptical distribution theory, and asymptotically distribution-free methods.Although the choice of method depends on many factors, such as data normality,
sample size, and the number of categories in an observed variable, the most
widely used method is maximum likelihood. This is the default in many SEM programs because it is robust under a variety of conditions and is likely to produce
parameter estimates that are unbiased, consistent, and efficient (e.g., Bollen, 1989).
Maximum likelihood estimation is an iterative technique, which meansthat an initially posited value is subsequently updated through calculation. The
iteration continues until the best values are attained. When this occurs, the model is
said to have converged. For the current example in Figure 1, the data wereanalyzed using maximum likelihood. The subsequent section entitled Data
Normality provides more discussion on some recommendations for choice of
estimation method.
Model Fit
Fourth, when parameters in a model are estimated, the degree to which the model
fits the data must be examined. As noted in the preceding paragraph, the primary
goal of SEM analysis is to estimate population parameters by minimizing thedifference between the observed and the model-implied variance/covariance
matrices. The smaller the difference is, the better the model. This is evaluated
using various types of fit indices. A statistically nonsignificant chi-square (χ 2)value is used to indicate a good fit. Statistical nonsignificance is desirable becauseit indicates that the difference between the observed and the model-implied
variance/covariance matrices is statistically nonsignificant, which implies that the
two matrices cannot be said to be statistically different. Stated otherwise, anonsignificant difference suggests that the proposed model cannot be rejected andcan be considered correct. Note that this logic is opposite to testing statistical
significance for analysis of variance, for example, where statistical significance is
usually favorable.
Nevertheless, chi-square tests are limited in that, with large samples, they are
likely to detect practically meaningless, trivial differences as statisticallysignificant (e.g., Kline, 2011; Ullman, 2007). In order to overcome this

8/18/2019 (Contemporary Approaches to Research
http://slidepdf.com/reader/full/contemporary-approaches-to-research 32/284
IN’NAMI AND KOIZUMI
28
problem, many other fit indices have been created, and researchers seldom depend
entirely on chi-square tests to determine whether to accept or reject the
model. Fit indices are divided into four types based on Byrne (2006) and Kline
(2011), although this classification varies slightly between researchers. First,
incremental or comparative fit indices compare the improvement of themodel to the null model. The null model assumes no covariances among the
observed variables. Fit indices in this category include the comparative fit index
(CFI), the normal fit index (NFI), and the Tucker-Lewis index (TLI), also known
as the non-normed fit index (NNFI). Second, unlike incremental fit indices,absolute fit indices evaluate the fit of the proposed model without comparing it
against the null model. Instead, they evaluate model fit by calculating the proportion of variance explained by the model in the sample variance/covariance
matrix. Absolute fit indices include the goodness-of-fit index (GFI) and the
adjusted GFI (AGFI). Third, residual fit indices concern the average difference
between the observed and the model-implied variance/covariance matrices.
Examples are the standardized root mean square residual (SRMR) and the rootmean square error of approximation (RMSEA). Fourth, predictive fit indices
examine the likelihood of the model to fit in similarly sized samples from the same
population. Examples include the Akaike information criterion (AIC), the
consistent Akaike information criterion (CAIC), and the expected cross-validationindex (ECVI).
The question of which fit indices should be reported has been discussed
extensively in SEM literature. We recommend Kline (2011, pp. 209-210)and studies such as Hu and Bentler (1998, 1999) and Bandalos and Finney (2010),
as they all summarize the literature remarkably well and clearly presenthow to evaluate model fit. Kline recommends reporting (a) the chi-square statistic
with its degrees of freedom and p value, (b) the matrix of correlation residuals,and (c) approximate fit indices (i.e., RMSEA, GFI, CFI) with the p value
for the close-fit hypothesis for RMSEA. The close-fit hypothesis for RMSEA tests
the hypothesis that the obtained RMSEA value is equal to or less than .05.
This hypothesis is similar to the use of the chi-square statistic as an indicatorof model fit and failure to reject it is favorable and supports the proposed
model. Additionally, Hu and Bentler (1998, 1999), Bandalos and Finney (2010),
and numerous others recommend reporting SRMR, since it shows the averagedifference between the observed and the model-implied variance/covariance
matrices. There are at least three reasons for this. First, this average difference
is easy to understand by readers who are familiar with correlations but less
familiar with fit indices. Hu and Bentler (1995) emphasize this, stating that theminimum difference between the observed and the model-implied variance/
covariance matrices clearly signals that the proposed model accounts for the
variances/covariances very well. Second, a reason for valuing the SRMR
that is probably more fundamental is that it is a precise representation ofthe objective of SEM, which is to reproduce, as closely as possible, the model-
implied variance/covariance matrix using the observed variance/covariance

8/18/2019 (Contemporary Approaches to Research
http://slidepdf.com/reader/full/contemporary-approaches-to-research 33/284
SEM IN EDUCATIONAL RESEARCH: A PRIMER
29
matrix. Third, calculation of the SRMR does not require chi-squares. Since chi-
squares are dependent on sample size, this indicates that the SRMR, which
is not based on chi-squares, is not affected by sample size. This is in contrast withother fit indices (e.g., CFI, GFI, RMSEA), which use chi-squares as part of the
calculation. For the assessment and academic achievement data, the chi-square
is 323.957 with 24 degrees of freedom at the probability level of .464 ( p > .05).
The matrix of correlation residuals is presented in Table 1. If the model is
correct, the differences between sample covariances and implied covariances
should be small. Specifically, Kline argues that differences exceeding |0.10|indicate that the model fails to explain the correlation between variables.
However, no such cases are found in the current data. Each residual correlationcan be divided by its standard error, as presented in Table 2. This is the same
as a statistical significance test for each correlation. The well-fitting model
should have values of less than |2|. All cases are statistically nonsignificant. TheRMSEA, GFI, and CFI are 0.000 (90% confidence interval: 0.000, 0.038), .989,
and 1.000, respectively. The p value for the close-fit hypothesis for RMSEA is
.995, and the close-fit hypothesis is not rejected. The SRMR is .025. Takentogether, it may be reasonable to state that the proposed model of the relationship
between self-assessment, teacher assessment, and academic achievement is
supported.The estimated model is presented in Figure 2. The parameter estimates
presented here are all standardized as this facilitates the interpretation of
parameters. Unstandardized parameter estimates also appear in an SEM output andthese should be reported as in Table 3 because they are used to judge statistical
significance of parameters along with standard errors. Factor loadings from thefactors to the observed variables are high overall (β = .505 to .815), thereby
suggesting that the three measurement models of self-assessment, teacherassessment, and academic achievement were each measured well in the current
data. A squared factor loading shows the proportion of variance in the observed
variable that is explained by the factor. For example, the squared factor loading of
English for self-assessment indicates that self-assessment explains 53% of thevariance in English for self-assessment (.731 × .731). The remaining 47% of the
variance is explained by the measurement error (.682 × .682). In other words, the
variance in the observed variable is explained by the underlying factor and the
measurement error. Finally, the paths from the self-assessment and teacherassessment factors to the academic achievement factor indicate that they
moderately affect academic achievement (β = .454 and .358). The correlation
between self-assessment and teacher assessment is rather small (–.101), therebyindicating almost no relationship between them.

8/18/2019 (Contemporary Approaches to Research
http://slidepdf.com/reader/full/contemporary-approaches-to-research 34/284
IN’NAMI AND KOIZUMI
30
S e l f - a s s e s s m e n t
T e a c h e r a s s e s s m e n t
A c a d e
m i c a c h i e v e m e n t
E n g l i s h
M a t h e m a t i c s
S c i e n c e
E n g l i s h
M a t h e m a t i c s
S c i e n c e
E n g l i s
h
M a t h e m a t i c s
S c i e n c e
S e l f - a s s e s s m e n t E n
g l i s h
–
M a t h
0 . 0
0 8
–
S c
i e n c e
– 0 . 0
2 6
0 . 0
0 5
–
T e a c h e r
a s s e s s m e n t
E n
g l i s h
0 . 0
3 2
– 0 . 0
0 3
– 0 . 0
2 3
–
M a t h
0 . 0
0 2
0 . 0
1 5
0 . 0
3 6
0 . 0
0 3
–
S c
i e n c e
– 0 . 0
1 3
– 0 . 0
6 5
– 0 . 0
1 4
– 0 . 0
0 6
– 0 . 0
0 1
–
A c a d e m i c
a c h i e v e m e n t
E n
g l i s h
0 . 0
0 2
– 0 . 0
6 4
0 . 0
4 6
0 . 0
4 8
0 . 0
0 8
– 0 . 0
2 3
–
M a t h
0 . 0
1 2
– 0 . 0
1 6
0 . 0
4 7
– 0 . 0
1 1
0 . 0
0 3
– 0 . 0
3 2
0 . 0
0 7
–
S c
i e n c e
0 . 0
8 1
0 . 0
1 0
0 . 0
2 9
– 0 . 0
8 3
– 0 . 0
0 9
0 . 0
5 8
0 . 0
0 0
– 0 . 0
1 2
–
T a b l e 1 .
C o r r e l a t i o n r e s i d u a l s

8/18/2019 (Contemporary Approaches to Research
http://slidepdf.com/reader/full/contemporary-approaches-to-research 35/284
SEM IN EDUCATIONAL RESEARCH: A PRIMER
31
S e l f - a s s e s s m e n t
T e a c h e r a s s e s s m e n t
A c
a d e m i c a c h i e v e m e n t
E n g l i s h
M a t h e m a t i c s
S c i e n
c e
E n g l i s h
M a t h e m a t i c s
S c i e n c e
E n g l i s h
M a t h e m a t i c s
S c i e n c e
S e l f - a s s e s s m e n t E n
g l i s h
–
M a t h e m a t i c s
0 . 1
0 2
–
S c
i e n c e
– 0 . 3
8 0
0 . 0
9 2
–
T e a c h e r
a s s e s s m e n t
E n
g l i s h
0 . 3
8 9
– 0 . 0
4 5
– 0 . 3 5
8
–
M a t h e m a t i c s
0 . 0
3 0
0 . 3
1 4
0 . 7 5
7
0 . 0
4 3
–
S c
i e n c e
– 0 . 2
1 9
– 1 . 2
9 7
– 0 . 2 8
4
– 0 . 0
8 5
– 0 . 0
1 4
–
A c a d e m i c
a c h i e v e m e n t
E n
g l i s h
0 . 0
2 9
– 0 . 9
5 9
0 . 7 1
0
0 . 5
6 7
0 . 1
3 5
– 0 . 3
7 1
–
M a t h e m a t i c s
0 . 2
1 1
– 0 . 3
4 9
1 . 0 3
7
– 0 . 1
8 6
0 . 0
6 2
– 0 . 7
1 8
0 . 1
0 6
–
S c
i e n c e
1 . 3
4 0
0 . 1
9 5
0 . 6 0
8
– 1 . 3
0 4
– 0 . 1
8 4
1 . 2
2 4
– 0 . 0
0 5
– 0 . 2
6 1
–
T a b l e 2 .
S t a n d a r d i z e d c o r r e l a t i o n r e s i d u a l s

8/18/2019 (Contemporary Approaches to Research
http://slidepdf.com/reader/full/contemporary-approaches-to-research 36/284
IN’NA
32
odel
Fifth,
examp
Anydriven
expla
examp
it is vdone
chang
N
I AND KOIZU
Figure
Respecificati
model re-spe
le, by deletin
ecision mus. The result
atory. For th
le, delete the
ery small innly if it wer
is made in t
T
ote.a Fixed to 1
I
. Example of a
on
cification is c
g statistically
be theoretis are no lo
e assessment
correlation b
ize (r = –.10e supported b
e model.
ble 3. Unstand
.000 for scale iestimates. β r
SEM model
oncerned wit
nonsignifican
ally defensinger confir
and academi
tween self-a
1) and statisty previous st
ardized and st
dentification. *efers to standa
ith standardize
h improving
t paths or add
le and shoulatory and s
c achieveme
sessment and
cally nonsigdies. Since t
ndardized esti
< .05. B refer dized estimate
d estimates
he model-da
ng paths to t
d not be sthould be vi
t data, we c
teacher asses
ificant. Thishis is not the
ates
s to unstandar .
a fit, for
e model.
tisticallyewed as
ould, for
sment as
could becase, no
ized
Param
Self-as
Teache
Acade
Self-as
Teache
Self-as
eter
sessment –>
r assessment –
ic achieveme
sessment –>
r assessment –
sessment <–>
EnglisMathe
Scien
Englis
MatheScien
t –> EnglisMatheScien
Acade
Acade
Teach
hmatics
e
h
maticse
hmaticse
mic achieveme
mic achieveme
er assessment
B
1.000a .910*
.703*
1.000a
.736*
.528*
1.000a
.483*
.534*
nt .498*
nt .380*
–0.092
Standard err
–.073
.060
–
.086
.066
–.060.065
.072
.073
.058
or β
.731
.815
.646
.712
.716
.505
.784
.532
.560
.454
.358
-.101
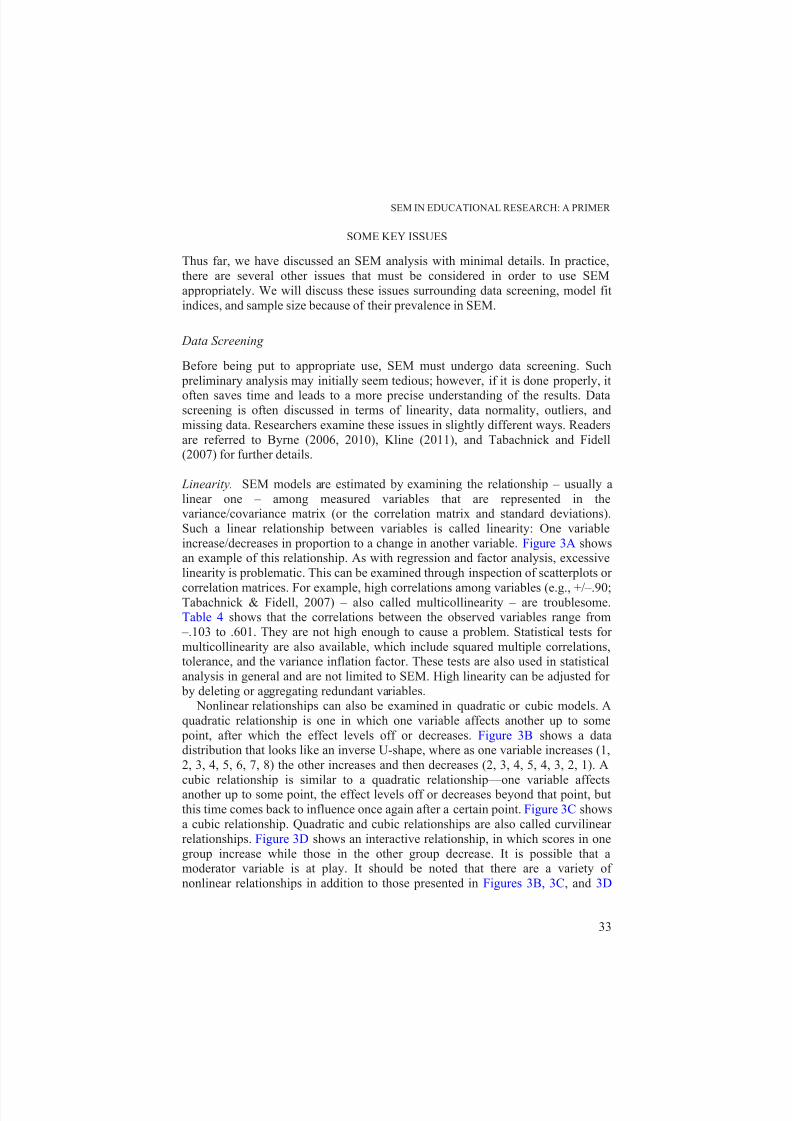
8/18/2019 (Contemporary Approaches to Research
http://slidepdf.com/reader/full/contemporary-approaches-to-research 37/284
SEM IN EDUCATIONAL RESEARCH: A PRIMER
33
SOME KEY ISSUES
Thus far, we have discussed an SEM analysis with minimal details. In practice,
there are several other issues that must be considered in order to use SEM
appropriately. We will discuss these issues surrounding data screening, model fit
indices, and sample size because of their prevalence in SEM.
Data Screening
Before being put to appropriate use, SEM must undergo data screening. Such
preliminary analysis may initially seem tedious; however, if it is done properly, it
often saves time and leads to a more precise understanding of the results. Datascreening is often discussed in terms of linearity, data normality, outliers, and
missing data. Researchers examine these issues in slightly different ways. Readers
are referred to Byrne (2006, 2010), Kline (2011), and Tabachnick and Fidell(2007) for further details.
Linearity. SEM models are estimated by examining the relationship – usually a
linear one – among measured variables that are represented in thevariance/covariance matrix (or the correlation matrix and standard deviations).
Such a linear relationship between variables is called linearity: One variable
increase/decreases in proportion to a change in another variable. Figure 3A showsan example of this relationship. As with regression and factor analysis, excessive
linearity is problematic. This can be examined through inspection of scatterplots or
correlation matrices. For example, high correlations among variables (e.g., +/–.90;Tabachnick & Fidell, 2007) – also called multicollinearity – are troublesome.Table 4 shows that the correlations between the observed variables range from
–.103 to .601. They are not high enough to cause a problem. Statistical tests for
multicollinearity are also available, which include squared multiple correlations,tolerance, and the variance inflation factor. These tests are also used in statistical
analysis in general and are not limited to SEM. High linearity can be adjusted for
by deleting or aggregating redundant variables. Nonlinear relationships can also be examined in quadratic or cubic models. A
quadratic relationship is one in which one variable affects another up to some
point, after which the effect levels off or decreases. Figure 3B shows a datadistribution that looks like an inverse U-shape, where as one variable increases (1,
2, 3, 4, 5, 6, 7, 8) the other increases and then decreases (2, 3, 4, 5, 4, 3, 2, 1). A
cubic relationship is similar to a quadratic relationship—one variable affectsanother up to some point, the effect levels off or decreases beyond that point, but
this time comes back to influence once again after a certain point. Figure 3C shows
a cubic relationship. Quadratic and cubic relationships are also called curvilinear
relationships. Figure 3D shows an interactive relationship, in which scores in one
group increase while those in the other group decrease. It is possible that amoderator variable is at play. It should be noted that there are a variety of
nonlinear relationships in addition to those presented in Figures 3B, 3C, and 3D

8/18/2019 (Contemporary Approaches to Research
http://slidepdf.com/reader/full/contemporary-approaches-to-research 38/284
IN’NAMI AND KOIZUMI
34
(e.g., U-shaped relationship for a quadratic one). As a standard SEM assumes
linear relations, modeling a nonlinear effect requires advanced techniques (see
Kline, 2005, 2011; Marsh, Wen, Nagengast, & Hau, 2012).
A B C D
Figure 3. Linear, quadratic, cubic, and interactive relationships
Data normality. Data normality is divided into univariate normality andmultivariate normality. Univariate normality refers to the situation in which one
variable is normally distributed. Multivariate normality refers to the situation in
which, in addition to the normality of each variable, each variable is also normallydistributed for each other variable (Tabachnick & Fidell, 2007). Numerous SEM
application studies use the maximum likelihood estimation method. This method
assumes multivariate normal distribution of the data for the dependent (i.e.,endogenous) variable. Although maximum likelihood methods are robust against
non-normality, it is still important to assess whether the data satisfy the assumptionof normality. Since multivariate normality is related to univariate normality, both
types of normality need to be examined.
Univariate normality can be examined by inspecting absolute skewness and
kurtosis values or the statistical significance of those values. First, with regard tothe inspection of skewness and kurtosis, data normality is ensured when both
values are zero. Unfortunately, there are no clear-cut guidelines on the degree of
non-normality. Kline (2011) reviewed relevant studies (e.g., Curran, West, &Finch, 1996) and suggested viewing skewness and kurtosis exceeding 3 and 20
respectively as extremely non-normal. Note that this is a rule-of-thumb and is not
an agreed-upon definition. For example, Curran et al. (1996) consider a skewnessof 2 and a kurtosis of 7 as moderately non-normal, and a skewness of 3 and a
kurtosis of 21 as severely non-normal. Chou and Bentler (1995) and Muthén andKaplan (1985) argue that skewness and kurtosis values approaching 2 and 7,
respectively, indicate problems. Table 4 shows that skewness and kurtosis values
for all the observed variables are well below these cut-offs and are in fact very nearto zero, thereby indicating that the data are univariately normal.

8/18/2019 (Contemporary Approaches to Research
http://slidepdf.com/reader/full/contemporary-approaches-to-research 39/284
T a b l e 4 .
C o r r e l a t i o n s b e t w e e n v a r i a b l e s a n d t h e i r d e s c r i p t i v e
s t a t i s t i c s
S e l f - a s s e s s m e n t
T e a c h e r a s s e s s m e n t
A c a d e m i c a c h i e v e m e n t
E n g l i s h
M a t h e m a t i c s
S
c i e n c e
E n g l i s h
M a t h e m a t i c s
S c i e n c e
E n g l i s h
M a t h e m a t i c s
S c i e n c e
S e l f - a s s e s s m e n t
E n g l i s h
–
M a t h e m a t i c s
. 6 0 1
–
S c i e n c e
. 4 5 2
. 5 3 1
–
T e a c h e r a s s e s s m e n t
E n g l i s h
– . 0
3 4
– . 0
6 1
– . 0
6 3
–
M a t h e m a t i c s
– . 0
5 2
– . 0
4 4
– . 0
1 1
. 5 1 3
–
S c i e n c e
– . 0
4 8
– . 1
0 3
– . 0
4 6
. 3 5 6
. 3 6 1
–
A c a d e m i c a c h i e v e m e n t
E n g l i s h
. 2 4 1
. 2 2 0
. 2
4 6
. 2 0 2
. 1 8 2
. 1 0 6
–
M a t h e m a t i c s
. 1 7 2
. 1 6 4
. 1
9 3
. 1 0 9
. 1 2 2
. 0 5 0
. 4 2 3
–
S c i e n c e
. 2 3 5
. 2 0 0
. 1
8 0
. 0 6 3
. 1 1 7
. 1 4 6
. 4 3 9
. 2 8 5
–
M e a n
4 . 0
8 9
4 . 1
0 2
4 . 0
8 8
4 . 0
7 7
4 . 1
5 8
4 . 0
7 8
4 . 1
7 7
4 . 0
7 2
4 . 0
6 3
S D
1 . 2
8 4
1 . 0
4 8
1 . 0
2 1
1 . 3
6 1
0 . 9
9 6
1 . 0
1 3
1 . 3
1 3
0 . 9
3 5
0 . 9
8 1
M i n i m u m
0 . 4
1 2
1 . 0
9 9
1 . 2
8 1
0 . 0
4 0
1 . 7
2 4
1 . 0
6 1
0 . 4
6 8
1 . 6
0 1
1 . 1
7 1
M a x i m u m
8 . 4
2 3
6 . 9
8 4
6 . 7
7 6
8 . 6
2 5
7 . 5
4 9
7 . 3
8 3
7 . 7
1 2
7 . 2
3 0
6 . 7
3 6
S k e w n e s s
0 . 0
9 5
0 . 0
3 5
0 . 0
1 6
– 0 . 0
6 5
0 . 1
4 8
– 0 . 0
3 5
– 0 . 1
1 9
0 . 1
2 8
– 0 . 0
7 2
z
0 . 8
1 9
0 . 2
9 9
0 . 1
3 7
– 0 . 5
6 5
1 . 2
7 3
– 0 . 2
9 8
– 1 . 0
3 1
1 . 1
0 6
– 0 . 6
2 3
K u r t o s i s
0 . 1
3 5
0 . 0
0 6
– 0 . 3
2 6
– 0 . 3
6 0
0 . 2
0 8
0 . 1
6 4
– 0 . 1
6 6
– 0 . 2
1 8
– 0 . 0
1 3
z
0 . 5
2 0
– 0 . 0
3 1
– 1 . 4
5 3
– 1 . 5
9 9
0 . 8
3 1
0 . 6
4 4
– 0 . 7
6 8
– 0 . 9
9 2
– 0 . 1
1 2
35
SEM IN EDUCATIONAL RESEARCH: A PRIMER

8/18/2019 (Contemporary Approaches to Research
http://slidepdf.com/reader/full/contemporary-approaches-to-research 40/284
36
Second, the statistical significance of skewness and kurtosis also serves as an
indicator of data normality. In particular, the critical ratio or z value is computed
by dividing either skewness or kurtosis by its standard error. Data normality isensured when the absolute value is within +/– 2.58 ( p < .01) or 3.29 ( p < .001).
However, as emphasized by Kline (2011) and Tabachnick and Fidell (2007), the
standard errors of skewness and kurtosis shrink in large sample sizes, which can
produce statistically significant skewness and kurtosis values even when the data
distribution appears normal. Thus, with large samples, making substantive
decisions on the basis of the visual inspection of the data – for example, usinghistograms or box plots – is preferred. However, it is difficult to define what is
meant by a large sample. For example, Byrne (2006, 2010) only uses absoluteskewness and kurtosis values for her dataset with a sample size of 372. Ullman
(2007) uses both absolute values and statistical significance of skewness and
kurtosis for her two datasets with sample sizes 175 and 459. In actuality, it appearsthat researchers are more likely to use estimation methods that are robust against
non-normality, such as Satorra-Bentler correction or weighted least square
parameter estimate methods. In any case, Table 4 shows that z values for skewnessand kurtosis are all within +/–2.58 ( p < .01) or 3.29 ( p < .001), thereby suggesting
data normality.
Additionally, multivariate normality can be measured using Mardia’scoefficient of multivariate kurtosis. The statistical significance of Mardia’s
coefficient is examined using a z value, but this time using the z values of 5 or 6,
not +/–2.58 ( p < .01) or 3.29 ( p < .001), since Bentler (2005) argues thatmultivariate non-normality would not affect the model in practice unless its values
were 5, 6, or above. Univariate normality can be estimated using general-purposesoftware programs (e.g., SAS or SPSS) or SEM programs, whereas multivariate
normality can only be estimated using SEM programs (for SEM programs, see theSoftware section). Mardia’s coefficient for the current data is –.157 with a z value
of –.119. This indicates the multivariate normality of the data.
As seen above, numerous issues surrounding the treatment of non-normal data
complicate decision making during data analysis. We reviewed previous studiesand found Finney and DiStefano (2006) the most accessible, synthetic, and up to
date. They summarize relevant studies and recommend that, for continuous data, if
the variables are approximately normally distributed, the maximum likelihood
estimation is recommended; if the variables are moderately non-normal (skewness< 2 and kurtosis < 7) the maximum likelihood estimation or Satorra-Bentler
correction method are recommended; if the variables are severely non-normal
(skewness > 2 and kurtosis > 7), the Satorra-Bentler correction or bootstrappingmethods is recommended. For categorical data, regardless of the number of
categories, they recommend using weighted least square parameter estimates
(WLSMV), available in the SEM program Mplus. If Mplus is not available, they
recommend that if the variables are approximately normally distributed, themaximum likelihood estimation should be used for scales with five or more
categories and the Satorra-Bentler correction method for scales with four or more
categories. This also applies to moderately non-normal data (skewness < 2 and
IN’NAMI AND KOIZUMI

8/18/2019 (Contemporary Approaches to Research
http://slidepdf.com/reader/full/contemporary-approaches-to-research 41/284
SEM IN EDUCATIONAL RESEARCH: A PRIMER
37
kurtosis < 7). If the variables are severely non-normal (skewness > 2 and kurtosis >
7), the Satorra-Bentler correction method is recommended.
Outliers. An outlier is an extremely large or small value of one variable (a
univariate outlier) or a combination of such values of two or more variables (amultivariate outlier). Univariate outliers can be detected by drawing a histogram or
inspecting the z values of variables using, for example, the SPSS EXPLORE or
DESCRIPTIVES functions. Multivariate outliers can be detected using the
Mahalanobis distance (i.e., Mahalanobis d-squared) statistic. It shows how oneobservation in the data is distantly located from the others. It is distributed as a chi-
square statistic with degrees of freedom equal to the number of observed variables.Observations are arranged according to the size of the statistics, and those
exceeding the critical value of the chi-square given degrees of freedom (e.g., p <
.001) can be judged as outliers. For the current data, the histograms appear normal.
There are five responses out of 4050 (450 × 9 items) exceeding the z value 3.29 ( p
< .001). As this is just 0.001% of the total responses, it is considered negligible.With regard to multivariate outliers, the critical value of chi-square for 24 degrees
of freedom is 51.179. The most deviated case was participant 4, whose responses
produced a Mahalanobis distance of 27.192—still below 51.179. Taken together, it
is reasonable to say that the current dataset does not include univariate ormultivariate outliers.
Missing data. The ideal situation is to be able to analyze a complete dataset thatcontains all examinees’ responses to all items. In reality, this rarely occurs and one
often has to analyze a dataset with missing values. Therefore, how to treat missingdata is a widely discussed issue in the application of statistics, including SEM.
Missing data treatment is classified into three types: (a) the deletion of those data,(b) the estimation of those data, and (c) the use of parameter estimation methods
that take missingness into consideration. Deletion of missing data is a traditional
approach, and includes listwise deletion (elimination of all cases with missing
values from subsequent analysis) or pairwise deletion (removal of paired cases inwhich at least one case has a missing value). Although both methods are easy to
implement, they may result in substantial loss of data observations. More
importantly, Muthén, Kaplan, and Hollis (1987) argue that the two methods workonly when data are missing completely at random, a case that is often violated in
practice. Thus, both listwise and pairwise deletion methods may bias results if data
missingness is not randomly distributed through the data (Tabachnick & Fidell,
2007).A preferred approach is to estimate and impute missing data. Methods abound,
such as mean substitution, regression, and expectation maximization methods;
however, according to Tabachnick and Fidell (2007), the most recommended
method is multiple imputation (Rubin, 1987). It replaces missing values with plausible values that take into account random variation.
Another way to address missing data is to use parameter estimation methods
that take missingness into consideration. This is implemented in (full information)
8/18/2019 (Contemporary Approaches to Research
http://slidepdf.com/reader/full/contemporary-approaches-to-research 42/284
IN’NAMI AND KOIZUMI
38
maximum likelihood estimation, which uses all available data regardless of
completeness (e.g., Enders, 2001). Both expectation maximization and maximum
likelihood estimation methods are available in SEM programs. As the current data
do not include missing responses, it is not necessary to eliminate, estimate, or
impute such responses.
Model Fit Indices
Although no agreed-upon guidelines exist regarding which fit indices should be
reported, some recommendations can be found in the literature. In an often-cited
article, Hu and Bentler (1998, 1999) recommend reporting (a) the SRMR, and (b)the CFI, TLI, RMSEA, or other indices (e.g., Gamma Hat, Incremental Fit Index
[IFI], McDonald’s Centrality Index [MCI], Relative Noncentrality Index [RNI]).Similarly, Kashy, Donnellan, Ackerman, and Russell (2009) recommend reporting
the CFI or TLI along with the chi-square and RMSEA. Bandalos and Finney
(2010) recommend the chi-square, CFI, TLI, RMSEA, and SRMR, whereasMueller and Hancock (2010) recommend RMSEA and its confidence interval, the
SRMR, and at least one of CFI, NFI, and TLI. Widaman (2010) encourages
reporting the chi-square, CFI, TLI, and RMSEA. For testing measurement
invariance across groups (e.g., whether the factor loadings are the same across
groups), Cheung and Rensvold (2002) recommend reporting the CFI, Gamma Hat,
and McDonald’s Noncentrality Index and interpreting a reduction in each index asevidence of measurement invariance. Summarizing studies that provide guidelines
for reporting fit indices, In’nami and Koizumi (2011) report that the indices
recommended most often are the chi-square (with degrees of freedom and p values), CFI, TLI, RMSEA (and its confidence interval), and the SRMR.
Sample Size
One rule-of-thumb is that a sample size below 100, between 100 and 200, and over200 is often considered small, medium, and large, respectively (Kline, 2005).
Similarly, Ding, Velicer, and Harlow (1995) argue that the minimum sample size
adequate for analysis is generally 100 to 150 participants. Another approach is toconsider model complexity in terms of the ratio of the sample size to the number of
free parameters to be estimated in a model. A minimum sample size is at least 10times the number of free model parameters (Raykov & Marcoulides, 2006). For
example, a model with 30 free parameters would require at least 300 observations
(30 × 10). Nevertheless, as the authors of the aforementioned articles emphasize,these are only rough guidelines. This is particularly because the requisite sample
size depends on numerous factors, including the number and patterns of missing
data, strength of the relationships among the indicators, types of indicators (e.g.,categorical or continuous), estimation methods (e.g., [robust] maximum likelihood,
robust weighted least squares), and reliability of the indicators. Complex issues
surrounding sample size determination seem to hamper creating definitive rules –

8/18/2019 (Contemporary Approaches to Research
http://slidepdf.com/reader/full/contemporary-approaches-to-research 43/284
SEM IN EDUCATIONAL RESEARCH: A PRIMER
39
or even rules of thumb – concerning necessary sample size (e.g., Mundfrom, Shaw,
& Ke, 2005).
Instead of elaborating on general guidelines for sample size, more empiricallygrounded, individual-model-focused approaches to determining sample size in
relation to parameter precision and power have been proposed. These approaches
include Satorra and Saris (1985), MacCallum, Browne, and Sugawara (1996), and
Muthén and Muthén (2002). The methods of both Satorra and Saris (1985) and
MacCallum et al. (1996) estimate sample size in terms of the precision and power
of an entire model using the chi-square statistic and RMSEA, respectively. Incontrast, Muthén and Muthén (2002) evaluate sample size in terms of the precision
and power of individual parameters in a model, while allowing the modeling ofvarious conditions that researchers frequently encounter in their research, such as
non-normality or type of indicator. Such modeling flexibility is certainly useful for
estimating sample size, given that sample size and many variables affect each otherin intricate ways.
In order to evaluate sample size, Muthén and Muthén (2002) use four criteria.
First, parameter bias and standard error bias should not exceed |10%| for any parameter in the model. Second, the standard error bias for the parameter for which
power is of particular interest should not exceed |5%|. Third, 95% coverage – the
proportion of replications for which the 95% confidence interval covers the population parameter value – should fall between 0.91 and 0.98. One minus the
coverage value equals the alpha level of 0.05. Coverage values should be close to
the correct value of 0.95. Finally, power is evaluated in terms of whether it exceeds0.80 – a commonly accepted value for sufficient power.
An analysis of the sample size of the current data based on Muthén and Muthén(2002) is presented in Table 5. Columns 2 and 3 show population and sample
parameters. Population parameters are unstandardized parameters in Table 3. Theyare viewed as correct, true parameters from which numerous samples (replications)
are generated in each run, and results over the replications are summarized. For
example, using these values, the parameter bias for self-assessment measured by
mathematics is calculated in the following manner: |0.9130 – 0.910|/|0.910| =0.00330, or in other words, 0.330%. This is far below the criterion of 10%, thereby
suggesting a good estimation of the parameter. The result is presented in
Column 4. Column 5 shows the standard deviation of the parameters across
replications. Column 6 shows the average of the standard errors acrossreplications. The standard error bias for self-assessment measured by mathematics
is |0.0743 – 0.0754|/|0.0754| = 0.01459, or in other words, 1.459%. This is again
far below the criterion of 10%, thereby suggesting a good estimation of the parameter. The result is presented in Column 7. In particular, we are interested in
the effect of self-assessment and teacher assessment on academic achievement.
The standard error biases for these parameters of interest are 0.413% and 0.545%,
respectively. Neither exceeds 5%, thereby suggesting a good estimation of the parameter. Column 8 provides the mean square error of parameter estimates, which
equals the variance of the estimates across replications plus the squared bias
(Muthén & Muthén, 2007). Column 9 shows coverage, or the proportion of

8/18/2019 (Contemporary Approaches to Research
http://slidepdf.com/reader/full/contemporary-approaches-to-research 44/284
IN’NA
40
replic
The v
0.95,
shows
differ
the po0.80
provid
measumeasu
remaiself-as
sugge
correl
adequ
exerci
curren
Not clari
E
I AND KOIZU
tions where
alue of 0.947
thereby sugg
the percent
nt from zero
wer for self-nd suggests
e good evid
red by mathred by math
ing parametesessment an
ts that the c
tion from z
te overall, t
sed when inte
t analysis.
Table 5. Mplus
. The column l ty. Self-assess glish variable.
I
the 95% con
for self-asses
esting a goo
ge of replic
(i.e., the pow
ssessment msufficient po
nce for par
matics and sematics is s
rs. It should b teacher ass
urrent sampl
ro. Thus, alt
e underpow
rpreting it. T
output for the
an
bels were slig ent by EnglishSelf-assessmen
bet
idence interv
sment measu
estimation
tions for w
r estimate of
easured by mwer for the
meter precisi
uggest that tfficient. The
e noted that tssment is lo
e size of 45
ough the sa
red correlati
e Appendix s
onte Carlo a
power of para
tly changed fr refers to a pat t with Teachereen these two
al covers the
ed by mathe
of the param
ich the para
a parameter).
athematics is parameter. T
on and pow
he sample sisame proces
e power for tw (0.339; se
is not eno
ple size for
n indicates t
hows the Mp
alysis to deter
meters
m original Mp from the self-assessment ref actors.
true paramet
atics is ver
eter. The las
meter is sig
Column 10 s
1.000, whichogether, thes
r for self-as
e for self-ass is repeate
he correlatione the last ro
gh to distin
the current
hat caution s
us syntax us
ine the precis
lus outputs to e ssessment fact rs to the correl
er value.
close to
column
ificantly
ows that
exceedse results
sessment
sessmentfor the
betweenw). This
uish the
model is
hould be
d for the
on
nhancer to theation
8/18/2019 (Contemporary Approaches to Research
http://slidepdf.com/reader/full/contemporary-approaches-to-research 45/284
SEM IN EDUCATIONAL RESEARCH: A PRIMER
41
VARIOUS SEM ANALYSES
Various types of models can be analyzed within the SEM framework. In addition
to the models presented in Figures 1 and 2, we describe models often used in
educational studies: confirmatory factor analysis, multiple-group analysis, and
latent growth modeling. First, confirmatory factor analysis is used to examinewhether the factor structure of a set of observed variables is consistent with
previous theory or empirical findings (e.g., Brown, 2006). The researcher
constructs a model using knowledge of the theory and/or empirical research,
postulates the relationship pattern, and tests the hypothesis statistically. Thisreinforces the importance of theory in the process of model building. The models
of self-assessment, teacher assessment, and academic achievement in Figures 1 and2 represent different measurement models and must be verified throughconfirmatory factor analysis in terms of whether each of the three constructs are
well represented by the three measurements of English, mathematics, and science.
Unfortunately, each measurement model has only three observed variables, and
this results in zero degrees of freedom (6 parameters to estimate – two factorloadings, three measurement errors, and one factor variance – and 3(3 + 1)/2 = 6
data points). The measurement models cannot be evaluated in the current model
specification (see model identification in the Five Steps in an SEM Applicationabove).
Various models can be analyzed using confirmatory factor analysis. For
example, the often-cited study Holzinger and Swineford (1939) administered a
battery of tests to measure seventh- and eighth-grade students in two Chicago
schools. The tests were designed to measure mental ability, hypothesized tocomprise spatial, verbal, speed, memory, and mathematics abilities. Although
Holzinger and Swineford (1939) did not use SEM, the model closest to the onethey hypothesized is shown in Figure 4A, and competing models that we
postulated are shown in Figures 4B, 5A, and 5B. Figure 4A shows that mental
ability comprises a general ability and five sub-abilities. Figure 4B is similar toFigure 4A but assumes a hierarchical relationship between a general ability and
sub-abilities. Figure 5A assumes only a single general ability. Figure 5B
hypothesizes no general ability and instead assumes correlated sub-abilities. Aseries of models can be tested on a single dataset using SEM by comparing model
fit indices or using a chi-square difference test (see, for example, Brown, 2006;
Shin, 2005).
Second, multiple-group or multiple-sample analysis aims to fit a model to two
or more sets of data simultaneously. It allows us to test whether and to what extent
measurement instruments (tests and questionnaires) function equally across groups,or, put another way, whether and to what extent the factor structure of a
measurement instrument or theoretical construct of interest holds true across
groups (e.g., Bollen, 1989). Multiple-group analysis involves testing across thesamples whether factor loadings, measurement error variances, factor variances,
and factor covariances are the same. Equivalence across groups suggests the cross-

8/18/2019 (Contemporary Approaches to Research
http://slidepdf.com/reader/full/contemporary-approaches-to-research 46/284
IN’NA
42
Figur and hi
cube
classi
codite
recobatt
I AND KOIZU
e 4. Confirmat gher-order mo , (3) paper for
information, ( ication, and (
g, (12) counti st battery comp
nition, (17) objry comprises (
series c
I
ry factor anal el (right). The
m board, and (
) paragraph co ) word meanin
g groups of dorises (14) wor
ect-number, (120) deduction,mpletion, and
sis of a model spatial test bat ) flags. The ve
mprehension,. The speed te
s, and (13) str recognition, (
) number- igu(21) numerical(24) Woody- c
f mental abilit ery comprisesbal test batter
7) sentence cot battery comp
ight and curve5) number rec
e, and (19) fig uzzles, (22) pr
Call Mixed Fu
: Bi- actor mo(1) visual perce comprises (5)
pletion, (8) wises (10) addit
capitals. The gnition, (16) fi
re-word. Theoblem reasonidamentals.
del (left) ption, (2) general
rdion, (11)
memory gure
ath test g, (23)

8/18/2019 (Contemporary Approaches to Research
http://slidepdf.com/reader/full/contemporary-approaches-to-research 47/284
A
Figu
re 5. Confirma
ory factor anal (left) and c
SEM IN
sis of a modelrrelated- acto
EDUCATIONA
B
of mental abili model (right)
L RESEARCH:
ty: Single-facto
PRIMER
43
r model

8/18/2019 (Contemporary Approaches to Research
http://slidepdf.com/reader/full/contemporary-approaches-to-research 48/284
IN’NA
44
valida
simila
Holzi
of bot
wheth
gradesanalys
Shin (
Thiaspect
changquadr
socioe
et al.
when
years.
A
Fig
indicacalled
point.
for th
I AND KOIZU
ion or gener
in size acro
ger and Swi
h genders fr
er the bi-fac
, gender, anis, see Byrne
2005).
rd, latent gros of individu
at the inditic), and vari
conomic stat
2008) hypot
measured by
Their model
re 6. Latent gr
es the levelslope, indica
The loadings
growth rate
I
alizability of
ss groups, wh
eford’s (1939
m two diffe
tor model o
/or schools., Baron and
wth modelinls over time.
idual and tables related
s (i.e., incom
esized that s
vocabulary
is presented
wth model ofext
f proficiencyes the speed
for the initial
are fixed to b
findings. It
ile factor cov
) data includ
ent schools.
mental abil
For examplealev (1998),
is useful foIt provides a
e group levto change, s
e, education,
cond langua
nd listening
n Figure 6A.
B
ral proficiencyrnal variables
at the begint which chan
status factor
e 0, 1, and 2
s possible th
ariances are
seventh- an
It would be
ity in Figure
of applicati In’nami and
evaluating lgreat deal of
ls, pattern och as age, g
and occupatio
e oral profici
tests at three
Initial status
(left) and of re(right)
ing of the stge is observe
are all fixed
to model a li
at factor loa
ifferent. For
eighth-grade
f interest to
4A is stabl
ons of multi Koizumi (2
ngitudinal cinformation, i
change (e.gnder, motiva
n). For exam
ency develop
time points
, also called
ading proficie
dy. Growthat each mea
o be 1, wher
ear growth r
ings are
example,
students
examine
e across
le-group12), and
anges inncluding
., linear,tion, and
le, Tong
linearly
over two
ntercept,
cy with
ate, alsosurement
eas those
ate. Note

8/18/2019 (Contemporary Approaches to Research
http://slidepdf.com/reader/full/contemporary-approaches-to-research 49/284
SEM IN EDUCATIONAL RESEARCH: A PRIMER
45
that all factor loadings are fixed, unlike confirmatory factor analysis and multiple-
group analysis.
More complex models can also be analyzed using latent growth modeling. Yeo,Fearrington, and Christ (2011) investigated how demographic variables – gender,
income, and special education status – affect reading growth at school. Their
model, shown in Figure 6B, differs primarily from the model in Figure 6A in two
ways. First, the loadings for the growth rate factor are fixed to be 0, 5, and 9 –
three time points of data collection (August = 0, January = 5, and May = 9) –
because we assume that the authors were interested in nine-month growth andrescaled the slope factor loadings accordingly. It should be noted that growth rate
factors, whether fixed to be 1, 2, and 3, or 0, 5, and 9, do not change the data-model fit (e.g., Hancock & Lawrence, 2006). Second, the three demographic
variables are incorporated into the model as predictors of initial status and growth
rate. The results indicate the relative impact of the external variables on the initiallevel of reading proficiency and on the growth rate of reading proficiency over
nine months. For further examples of latent growth modeling, see Kieffer (2011)
and Marsh and Yeung (1998).
SOFTWARE
Since Byrne (2012a) provides a detailed, comparative review of SEM software, we
will present only a brief treatment of SEM software programs (also see Narayanan,2012). There are several major commercial programs for performing SEM,
including Amos (Analysis of Moment Structures; Arbuckle, 1994-2012), CALIS
(SAS Institute, 1990-2012), EQS (Equations; Bentler, 1994-2011), LISREL(Linear Structural Relationships; Jöreskog & Sörbom, 1974-2012), and Mplus
(Muthén & Muthén, 1998-2012). Free programs are also available, including Mx
(Neale, Boker, Xie, & Maes, 2003) and three R-language packages: the OpenMx
package (Boker, Neale, Maes, Wilde, Spiegel, Brick, et al., 2007-2012), the “sem”
package (Fox, Nie, Byrnes, Culbertson, Friendly, Kramer, & Monette, 2012), andthe “lavaan” package (Rosseel, 2012). The choice of software depends on the
purpose of the SEM analysis and the proficiency of the user’s computing skills.
Byrne (2012a) indicates three aspects related to deciding on the best software: (a)familiarity with SEM concepts and application, (b) the types of SEM model to be
tested, and (c) preference concerning manual or graphic interface. She argues that
beginners may find Amos or EQS the easiest to use, and that more advancedlearners may prefer to use EQS, LISREL, or Mplus. Unlike Amos, EQS, and
LISREL, Mplus requires command-based inputs, and learners who are used tographic interfaces may need some time to become comfortable with the program.In order to familiarize themselves with software, novice learners are referred to
Byrne (1998, 2006, 2010, 2012b), whereas advanced learners wishing to use R-
based packages are referred to Fox, Byrnes, Boker, and Neale (2012).
8/18/2019 (Contemporary Approaches to Research
http://slidepdf.com/reader/full/contemporary-approaches-to-research 50/284
IN’NAMI AND KOIZUMI
46
SOME DIRECTIONS FOR LEARNING MORE ABOUT SEM
Since SEM is a versatile technique, a single book chapter would not be able to
cover a wide range of analyses that can be modeled using SEM. In order to deepen
learning regarding SEM, we recommend reading through Byrne (1998, 2006,
2010, 2012b) for LISREL, EQS, Amos, and Mplus, trying to analyze the
accompanying datasets, and ensuring that one can replicate findings. Based on ourown experience with Byrne (2010) for Amos, and Byrne (2006) for EQS datasets,
as well as on discussion with skilled SEM users, we believe that this is probably
the best approach to familiarize oneself with SEM and apply the techniques toone’s own data.
For providing answers to questions that may arise with regard to particularissues related to SEM, the following recent references may be useful: Bandalos andFinney (2010), Brown (2006), Cudeck and du Toit (2009), Hancock and Mueller
(2006), Hoyle (2012), Kaplan (2009), Kline (2011), Lomax (2010), Mueller and
Hancock (2008, 2010), Mulaik (2009), Raykov and Marcoulides (2006),
Schumacker and Lomax (2010), Teo and Khine (2009), and Ullman (2007). For
more on how researchers should report SEM results, see Boomsma, Hoyle, and
Panter (2012); Gefen, Rigdon, and Straub (2011); Jackson, Gillaspy Jr., and Purc-Stephenson (2009); Kahn (2006); Kashy, Donnellan, Ackerman, and Russell
(2009); Martens (2005); McDonald and Ho (2002); Schreiber, Nora, Stage,
Barlow, and King (2006); and Worthington and Whittaker (2006). Reporting acorrelation matrix with means and standard deviations is strongly recommended as
this allows one to replicate a model, although replication of non-normal and/or
missing data requires raw data (for example, see In’nami & Koizumi, 2010). Of particular interest is the journal Structural Equation Modeling: An
Interdisciplinary Journal published by Taylor & Francis, which is aimed at those
interested in theoretical and innovative applied aspects of SEM. Although
comprising highly technical articles, it also includes the Teacher’s Corner, which
features instructional modules on certain aspects of SEM, and book and softwarereviews providing objective evaluation of current texts and products in the field.
For questions pertaining to particular features of SEM programs, user guides are
probably the best resource. In particular, we find the EQS user guide (Bentler &Wu, 2005) and manual (Bentler, 2005) outstanding, as they describe underlying
statistical theory in a readable manner as well as stepwise guidance on how to use
the program. A close look at manuals and user guides may provide answers to mostquestions. LISREL and Mplus users should take full advantage of technical
appendices, notes, example datasets, and commands, which are all available online
free of charge (Mplus, 2012; Scientific Software International, 2012). The Mplus
website also provides recorded seminars and workshops on SEM and a schedule
listing of upcoming courses.
For problems not addressed by the abovementioned resources, we suggestconsulting the Structural Equation Modeling Discussion Network (SEMNET). It
was founded in February 1993 (Rigdon, 1998) and archives messages by month.Because of the large number of archived messages collected over the past two

8/18/2019 (Contemporary Approaches to Research
http://slidepdf.com/reader/full/contemporary-approaches-to-research 51/284
SEM IN EDUCATIONAL RESEARCH: A PRIMER
47
decades (thanks to the mushrooming popularity of SEM across many disciplines),
SEMNET is a treasure trove of questions and answers on virtually every aspect of
SEM. Questions should only be posted if answers to them cannot be found in the
archive. As with any other academic online discussion forum, contributors to
SEMNET take questions seriously and spend precious time responding to them.We recommend that anyone wishing to receive a good reply should mention that
answers were not found in the archive and articulate problems in enough detail for
others to respond. Posting a command/script/syntax file is a good idea.
SEM is constantly evolving and expanding. The development and application ofnew techniques are causing numerous academic disciplines to move increasingly
toward a better understanding of various issues that require tools that are more precise. SEM analysis offers powerful options for analyzing data from educational
settings, and techniques discussed in this chapter will enable educational
researchers to be in a better position to address a wide range of research questions.
By employing SEM analysis appropriately, we will be able to contribute much in
years to come.
APPENDIX
Mplus Input for the Monte Carlo Analysis for Determining the Precision and Power ofParametersTITLE: THREE-FACTOR, NORMAL DATA, NO MISSING
MONTECARLO: NAMES ARE X1-X9;
NOBSERVATIONS = 450; ! SAMPLE SIZE OF INTEREST NREPS = 10000;
SEED = 53567;MODEL POPULATION:
f1 BY X1@1 X2*.91 X3*.70;f2 BY X4@1 X5*.74 X6*.53;
f3 BY X7@1 X8*.48 X9*.53;X1*.77; X2*.37; X3*.61; X4*.91; X5*.48; X6*.76; X7*.66; X8*.63;X9*.66;f1*.88; f2*.94; f3*.74;
f3 ON f1*.50; f3 ON f2*.38;f1 WITH f2*-.09;
MODEL:f1 BY X1@1 X2*.91 X3*.70;
f2 BY X4@1 X5*.74 X6*.53;
f3 BY X7@1 X8*.48 X9*.53;X1*.77; X2*.37; X3*.61; X4*.91; X5*.48; X6*.76; X7*.66; X8*.63;X9*.66;
f1*.88; f2*.94; f3*.74;f3 ON f1*.50; f3 ON f2*.38;f1 WITH f2*-.09;
ANALYSIS: ESTIMATOR = ML;OUTPUT: TECH9;

8/18/2019 (Contemporary Approaches to Research
http://slidepdf.com/reader/full/contemporary-approaches-to-research 52/284
IN’NAMI AND KOIZUMI
48
REFERENCES
Arbuckle, J. L. (1994–2012). Amos [Computer software]. Chicago, IL: SPSS.
Bandalos, D. L., & Finney, S. J. (2010). Factor analysis: Exploratory and confirmatory. In G. R.
Hancock & R. O. Mueller (Eds.), The reviewer’s guide to quantitative methods in the social
sciences (pp. 93-114). New York: Routledge.
Bentler, P. M. (1994-2011). EQS for Windows [Computer software]. Encino, CA: Multivariate
Software.
Bentler, P. M. (2005). EQS 6 structural equations program manual . Encino, CA: Multivariate
Software.
Bentler, P. M., & Wu, E. J. C. (2005). EQS 6.1 for Windows user’s guide. Encino, CA: Multivariate
Software.
Boker, S. M., Neale, M., Maes, H., Wilde, M., Spiegel, M., Brick, T., et al. (2007–2012). OpenMx[Computer software]. Retrieved from http://openmx.psyc.virginia.edu/installing-openmx.
Bollen, K. A. (1989). Structural equations with latent variables. New York: Wiley.
Bollen, K. A., & Long, J. S. (1993). Introduction. In K. A. Bollen & J. S. Long (Eds.), Testing
structural equation models (pp. 1-9). Newbury Park, CA: Sage.
Boomsma, A., Hoyle, R. H., & Panter, A. T. (2012). The structural equation modeling research report.
In R. H. Hoyle (Ed.), Handbook of structural equation modeling (pp. 341-358). New York: Guilford
Press.
Brown, T. A. (2006). Confirmatory factor analysis for applied research. New York: Guilford Press.
Byrne, B. M. (1998). Structural equation modeling with LISREL, PRELIS, and SIMPLIS: Basic
concepts, applications, and programming . Mahwah, NJ: Erlbaum.
Byrne, B. M. (2006). Structural equation modeling with EQS: Basic concepts, applications, and
programming (2nd ed.). Mahwah, NJ: Erlbaum.
Byrne, B. M. (2010). Structural equation modeling with AMOS: Basic concepts, applications, and
programming (2nd ed.). Mahwah, NJ: Erlbaum.
Byrne, B. M. (2012a). Choosing structural equation modeling computer software: Snapshots of
LISREL, EQS, Amos, and Mplus. In R. H. Hoyle (Ed.), Handbook of structural equation modeling
(pp. 307-324). New York: Guilford Press.
Byrne, B. M. (2012b). Structural equation modeling with Mplus: Basic concepts, applications, and
programming . Mahwah, NJ: Erlbaum.
Byrne, B. M., Baron, P., & Balev, J. (1998). The Beck Depression Inventory: A cross-validated test of
second-order factorial structure for Bulgarian adolescents. Educational and Psychological
Measurement , 58, 241-251.
Cheung, G. W., & Rensvold, R. B. (2002). Evaluating goodness-of-fit indexes for testing measurement
invariance. Structural Equation Modeling , 9, 233-255.
Chou, C., & Bentler, P. M. (1995). Estimates and tests in structural equation modeling. In R. H. Hoyle
(Ed.), Structural equation modeling: Concepts, issues, and applications (pp. 37-55). Thousand
Oaks, CA: Sage.
Cohen, J., Cohen, P., West, S. G., & Aiken, L. S. (2003). Applied multiple regression/correlation
analysis for the behavioral sciences (3rd ed.). Mahwah, NJ: Erlbaum.
Cudeck, R., & du Toit, S. H. C. (2009). General structural equation models. In R. E. Millsap & A.
Maydeu-Olivares (Eds.), The Sage handbook of quantitative methods in psychology (pp. 515-539).London, UK: SAGE.
Curran, P. J., West, S. G., & Finch, J. F. (1996). The robustness of test statistics to nonnormality and
specification error in confirmatory factor analysis. Psychological Methods, 1, 16-29.
Ding, L., Velicer, W. F., & Harlow, L. L. (1995). Effects of estimation methods, number of indicators
per factor and improper solutions on structural equation modeling fit indices. Structural Equation
Modeling , 2, 119-143.
Enders, C. K. (2001). A primer on maximum likelihood algorithms available for use with missing data.
Structural Equation Modeling , 8, 128-141.

8/18/2019 (Contemporary Approaches to Research
http://slidepdf.com/reader/full/contemporary-approaches-to-research 53/284
SEM IN EDUCATIONAL RESEARCH: A PRIMER
49
Finney, S. J., & DiStefano, C. (2006). Non-normal and categorical data in structural equation modeling.
In G. R. Hancock & R. O. Mueller (Eds.), Structural equation modeling: A second course (pp. 269-
314). Greenwich, CT: Information Age.
Fox, J., Byrnes, J. E., Boker, S., & Neale, M. C. (2012). Structural equation modeling in R with the sem
and OpenMx packages. In R. H. Hoyle (Ed.), Handbook of structural equation modeling (pp. 325-
340). New York: Guilford Press.
Fox, J., Nie, X., Byrnes, J., Culbertson, M., Friendly, M., Kramer, A., & Monette, G. (2012). sem:
Structural equation modeling. Available from http://cran.r-project.org/web/packages/sem/index.html
Gefen, D., Rigdon, E. E., & Straub, D. (2011). An update and extension to SEM guidelines for
administrative and social science research. Management Information Systems Quarterly, 35, A1-A7.
Gorsuch, R. L. (1983). Factor analysis. Hillsdale, NJ: Erlbaum.
Hancock, G. R., & Lawrence, F. R. (2006). Using latent growth models to evaluate longitudinal change.
In G. R. Hancock & R. O. Mueller (Eds.), Structural equation modeling: A second course.Greenwich, CT: Information Age.
Hancock, G. R., & Mueller, R. O. (Eds.). (2006). Structural equation modeling: A second course.
Greenwich, CT: Information Age.
Holzinger, K. J., & Swineford, F. (1939). A study in factor analysis: The stability of a bi-factor solution
[Monograph]. Chicago: University of Chicago Press.
Hoyle, R. H. (Ed.). (2012). Handbook of structural equation modeling . New York: Guilford Press.
Hu, L.-T., & Bentler, P. M. (1995). Evaluating model fit. In R. H. Hoyle (Ed.), Structural equation
modeling: Concepts, issues, and applications (pp. 76-99). Thousand Oaks, CA: Sage.
Hu, L.-T., & Bentler, P.M. (1998). Fit indices in covariance structure modeling: Sensitivity to
underparameterized model misspecification. Psychological Methods, 3, 424-453.
Hu, L.-T., & Bentler, P. M. (1999). Cutoff criteria for fit indexes in covariance structure analysis:
Conventional criteria versus new alternatives. Structural Equation Modeling , 6 , 1-55.
In’nami, Y., & Koizumi, R. (2010). Can structural equation models in second language testing and
learning research be successfully replicated? International Journal of Testing , 10, 262-273.
In’nami, Y., & Koizumi, R. (2011). Structural equation modeling in language testing and learning
research: A review. Language Assessment Quarterly, 8, 250-276.
In’nami, Y., & Koizumi, R. (2012). Factor structure of the revised TOEIC® test: A multiple-sample
analysis. Language Testing , 29, 131-152.
Jackson, D. L., Gillaspy Jr., J. A., & Purc-Stephenson, R. (2009). Reporting practices in confirmatory
factor analysis: An overview and some recommendations. Psychological Methods, 14, 6-23.
Jarvis, C. B., MacKenzie, S. B., & Podsakoff, P. M. (2003). A critical review of construct indicators
and measurement model misspecification in marketing and consumer research. Journal of Consumer
Research, 30, 199-218.
Jöreskog, K. G., & Sörbom, D. (1974–2012). LISREL for Windows [Computer software]. Lincolnwood,
IL: Scientific Software International.
Kahn, J. H. (2006). Factor analysis in counseling psychology research, training, and practice:
Principles, advances, and applications. The Counseling Psychology, 34, 684-718.
Kaplan, D. (2009). Structural equation modeling: Foundations and extensions. Thousand Oaks, CA:
Sage.
Kashy, D. A., Donnellan, M. B., Ackerman, R. A., & Russell, D. W. (2009). Reporting and interpreting
research in PSPB: Practices, principles, and pragmatics. Personality and Social Psychology Bulletin,
35, 1131-1142.
Kieffer, M. J. (2011). Converging trajectories: Reading growth in language minority learners and their
classmates, kindergarten to grade 8. American Educational Research Journal , 48, 1187-1225.
Kline, R. B. (2005). Principles and practice of structural equation modeling (2nd ed.). New York:
Guilford Press.
Kline, R. B. (2011). Principles and practice of structural equation modeling (3rd ed.). New York:
Guilford Press.

8/18/2019 (Contemporary Approaches to Research
http://slidepdf.com/reader/full/contemporary-approaches-to-research 54/284
IN’NAMI AND KOIZUMI
50
Lomax, R. G. (2010). Structural equation modeling: Multisample covariance and mean structures. In G.
R. Hancock & R. O. Mueller (Eds.), The reviewer’s guide to quantitative methods in the social
sciences (pp. 385-395). New York: Routledge.
MacCallum, R. C., Browne, M. W., & Sugawara, H. M. (1996). Power analysis and determination of
sample size for covariance structure modeling. Psychological Methods, 1, 130-149.
Marsh, H. W., Wen, Z., Nagengast, B., & Hau, K.-T. (2012). Structural equation models of latent
interaction. In R. H. Hoyle (Ed.), Handbook of structural equation modeling (pp. 436-458). New
York: Guilford Press.
Marsh, H. W., & Yeung, A. S. (1998). Longitudinal structural equation models of academic self-
concept and achievement: Gender differences in the development of math and English constructs.
American Educational Research Journal , 35, 705-738.
Martens, M. P. (2005). The use of structural equation modeling in counseling psychology research. The
Counseling Psychologist , 33, 269-298.McDonald, R., & Ho, M. (2002). Principles and practice in reporting structural equation analyses.
Psychological Methods, 7 , 64–82.
Mplus. (2012). Retrieved from http://www.statmodel.com/.
Mueller, R. O., & Hancock, G. R. (2008). Best practices in structural equation modeling. In J. W.
Osborne (Ed.), Best practices in quantitative methods (pp. 488–508). Thousand Oaks, CA: Sage.
Mueller, R. O., & Hancock, G. R. (2010). Structural equation modeling. In G. R. Hancock & R. O.
Mueller (Eds.), The reviewer’s guide to quantitative methods in the social sciences (pp. 371-383).
New York: Routledge.
Mulaik, S. A. (2009). Linear causal modeling with structural equations. Boca Raton, FL: Chapman &
Hall/CRC.
Mundfrom, D. J., Shaw, D. G., & Ke, T. L. (2005). Minimum sample size recommendations for
conducting factor analyses. International Journal of Testing , 5, 159-168.
Muthén, B. O., & Kaplan, D. (1985). A comparison of some methodologies for the factor analysis of
non-normal Likert variables. British Journal of Mathematical and Statistical Psychology, 38, 171-
189.
Muthén, B., Kaplan, D., & Hollis, M. (1987). On structural equation modeling with data that are not
missing completely at random. Psychometrika, 52, 431-462.
Muthén, L. K., & Muthén, B. O. (1998–2012). Mplus [Computer software]. Los Angeles, CA: Muthén
& Muthén.
Muthén, L. K., & Muthén, B. O. (2002). How to use a Monte Carlo study to decide on sample size and
determine power. Structural Equation Modeling , 9, 599-620.
Narayanan, A. (2012). A review of eight software packages for structural equation modeling. The
American Statistician, 66 , 129-138.
Neale, M. C., Boker, S. M., Xie, G., & Maes, H. H. (2003). Mx: Statistical modeling (6th ed.).
Richmond, VA: Virginia Institute of Psychiatric and Behavioral Genetics, Virginia Commonwealth
University.
Ockey, G. (2011). Self-consciousness and assertiveness as explanatory variables of L2 oral ability: A
latent variable approach. Language Learning , 61, 968-989.
Raykov, T., & Marcoulides, G. A. (2006). A first course in structural equation modeling (2nd
ed.).Mahwah, NJ: Erlbaum.
Rigdon, E. (1998). SEMNET. Retrieved from http://www2.gsu.edu/~mkteer/semnet.html.
Rosseel, Y. (2012). lavaan: Latent variable analysis. Available from http://cran.r-project.org/
web/packages/lavaan/.
Royce, J. R. (1963). Factors as theoretical constructs. In D. N. Jackson & S. Messick (Eds.), Problems
in human assessment . New York: McGraw Hill.
Rubin, D. B. (1987). Multiple imputation for nonresponse in surveys. New York: John Wiley & Sons.
SAS Institute. (1990–2012). SAS PROC CALIS [Computer software]. Cary, NC: Author.
Satorra, A., & Saris, W. E. (1985). Power of the likelihood ratio test in covariance structure analysis.
Psychometrika, 50, 83-90.

8/18/2019 (Contemporary Approaches to Research
http://slidepdf.com/reader/full/contemporary-approaches-to-research 55/284
SEM IN EDUCATIONAL RESEARCH: A PRIMER
51
Schoonen, R., van Gelderen, A., de Glopper, K., Hulstijn, J., Simis, A., Snellings, P., & Stevenson, M.
(2003). First language and second language writing: The role of linguistic knowledge, speed of
processing, and metacognitive knowledge. Language Learning, 53, 165-202.
Schreiber, J. B., Nora, A., Stage, F. K., Barlow, E. A., & King, J. (2006). Reporting structural equation
modeling and confirmatory factor analysis: A review. Journal of Educational Research, 99, 323-
337.
Schumacker, R. E., & Lomax, R. G. (2010). A beginner’s guide to structural equation modeling (3rd
ed.). New York: Routledge.
Scientific Software International. (2012). LISREL. Retrieved from http://www.ssicentral.com/lisrel/.
Shin, S.-K. (2005). Did they take the same test? Examinee language proficiency and the structure of
language tests. Language Testing , 22, 31-57.
Silverman. S. K. (2010). What is diversity?: An inquiry into preservice teacher beliefs. American
Educational Research Journal , 47 , 292-329.Tabachnick, B. G., & Fidell, L. S. (2007). Using multivariate statistics (5th ed.). Needham Heights,
MA: Allyn & Bacon.
Teo, T., & Khine, M. S. (Eds.). (2009). Structural equation modeling in educational research: Concepts
and applications. Rotterdam, the Netherlands: Sense Publishers.
Tong, F., Lara-Alecio, R., Irby, B., Mathes, P., & Kwok, O.-m. (2008). Accelerating early academic
oral English development in transitional bilingual and structured English immersion programs.
American Educational Research Journal , 45, 1011-1044.
Ullman, J. B. (2007). Structural equation modeling. In B. G. Tabachnick & L. S. Fidell, Using
multivariate statistics (5th ed., pp. 676-780). Needham Heights, MA: Allyn & Bacon.
Wang, M.-T., & Holcombe, R. (2010). Adolescents’ perceptions of school environment, engagement,
and academic achievement in middle school. American Educational Research Journal , 47 , 633-662.
Widaman, K. F. (2010). Multitrait-multimethod analysis. In G. R. Hancock & R. O. Mueller (Eds.), The
reviewer’s guide to quantitative methods in the social sciences (pp. 299-314). New York:
Routledge.
Williams, L., Edwards, J., & Vandenberg, R. (2003). Recent advances in causal modeling methods for
organizational and management research. Journal of Management , 29, 903-936.
Worthington, R. L., & Whittaker, T. A. (2006). Scale development research: A content analysis and
recommendations for best practices. The Counseling Psychologist , 34, 806-838.
Yeo, S., Fearrington, J., & Christ, T. J. (2011). An investigation of gender, income, and special
education status bias on curriculum-based measurement slope in reading. School Psychology
Quarterly, 26 , 119-130.
Yo In’namiShibaura Institute of Technology
Japan
Rie Koizumi
Juntendo University
Japan

8/18/2019 (Contemporary Approaches to Research
http://slidepdf.com/reader/full/contemporary-approaches-to-research 56/284
PART II
STRUCTURAL EQUATION
MODELING IN LEARNING
ENVIRONMENT RESEARCH
8/18/2019 (Contemporary Approaches to Research
http://slidepdf.com/reader/full/contemporary-approaches-to-research 57/284
M.S. Khine (ed.), Application of Structural Equation Modeling in Educational Research and
Practice, 55–74.
© 2013 Sense Publishers. All rights reserved.
MARJAN VRIJNSEN-DE CORTE, PERRY DEN BROK,
THEO BERGEN AND MARCEL KAMP
3. TEACHERS’ PERCEPTIONS OF THE SCHOOL AS A
LEARNING ENVIRONMENT FOR PRACTICE-BASED
RESEARCH: TESTING A MODEL THAT DESCRIBES
RELATIONS BETWEEN INPUT, PROCESS AND
OUTCOME VARIABLES
INTRODUCTION
Learning environments research has a long tradition in investigating perceptions of
students and teachers of all kinds of in-school and out-of-school learningenvironments (Fraser, 1998, 2002, 2007). Interestingly, the vast majority of these
studies has investigated student perceptions of teacher behavior or the learning
environment, and related such perceptions to student outcomes, either viatraditional analyses of variance, multilevel analyses, and, in exceptional cases,
structural models. Much less is known about teacher perceptions, let alone teacher
perceptions of their own behavior and learning in relation to teacher learningoutcomes. The present study thus attempts to fill this blank spot, by focusing on
teachers’ perceptions of their own behavior and outcomes with respect toconducting practice-based research, and of the school as a learning environment
for conducting such research. In addition, rather than variance analyses, the study
employs structural equation modeling as a method to link the various variables of
interest. In doing so, it enables to investigate the relative importance of thesevariables in relation to outcomes, but also the processes involved, whether they are
about direct connections or not.
In-school practice-based research is commonly seen by researchers, teachereducators and policy makers as an important activity for the professional
development of both experienced and prospective teachers (Cochran-Smith &
Lytle, 2009; Zeichner & Noffke, 2001). It is expected that teachers who investigate practical problems and examine questions resulting from their own daily practice
actively construct knowledge about or gain insight into their own or shared
educational practice (Cochran-Smith & Lytle, 1999a; Fenstermacher, 1994). It isassumed that via practice-based research teachers can more effectively improve
their educational practice, which ultimately will lead to improvement of pupillearning as well as school development (Teitel, 2003). Both student teachers and
experienced teachers have to acquire the teacher-researcher role, which differs
from their regular teaching role. Recently, secondary education schools, in particular professional development schools (PDSs), have established research
8/18/2019 (Contemporary Approaches to Research
http://slidepdf.com/reader/full/contemporary-approaches-to-research 58/284
VRIJNSEN-DE CORTE ET AL.
56
environments supportive and stimulative for practice-based research through
teachers and student teachers in their schools (NCATE, 2001; Teitel, 2003). PDSs
or research oriented schools have been established in several countries, such as
Canada, Australia, England, and the USA (Harris & van Tassel, 2005), but also in
the Netherlands (Meijer, Meirink, Lockhorst, & Oolbekking-Marchand, 2010;Snoek & Moens, 2011).
In many studies, investigating teacher research in PDSs (for example Snow-
Gerono, 2005) as well as studies on teacher action research (for example Ponte,
2002b) or practice-based research (for example Cochran-Smith & Lytle, 2009), theinfluence of performing practice-based research leading to certain research
outcomes within a context containing stimulating or hindering factors is assumed , but the actual relationship between such variables is most times not empirically
explored. In several studies, research outcomes are reported, but the manner in
which they can be explained by other influencing variables such as the research
context in schools or the practice-based research process itself is not investigated.
In the present study, relations between teachers’ perceptions regarding practice- based research were investigated. These perceptions were measured by means of a
questionnaire, developed via two earlier studies conducted by the authors
(Vrijnsen-de Corte, 2012).
This study will focus on (student) teachers’ perceptions with respect to: (a) thelearning environment for research at the school (‘contextual input’), (b) the
motives for performing practice-based research (‘personal input’), (c) the
satisfaction of teachers with performed research activities (‘process’), and (d ) the(learning) outcomes that result from these research activities (‘outcomes’). By
means of analyzing questionnaire data and testing a hypothetical (structuralequation) model, we will gather (1) empirical support for assumed relations
between concepts associated with practice-based research, and (2) insight into therelative importance of these different concepts in explaining research outcomes.
Deeper insight into the relations between (teachers’ perceptions of) the input,
process and outcomes of practice-based research and the relative strength of these
relations, can suggest directions for the successful realization of practice-basedresearch as a professional learning activity in schools.
THEORETICAL FRAMEWORK
Aspects of Practice-Based Research in PDSs
Prior studies on practitioner research in schools suggest different variables that play an important role in the realization of (student) teachers’ practice-based
research in secondary education schools. In the next section, we will describe these
input (contextual and personal), process and outcome related variables and theirinterconnectedness, more deeply.
Contextual input (research environment in schools). A first important element
with respect to the environment for practice-based research is the establishment ofa supportive research structure in schools. Conditions such as a research budget,

8/18/2019 (Contemporary Approaches to Research
http://slidepdf.com/reader/full/contemporary-approaches-to-research 59/284
SCHOOL AS LEARNING ENVIRONMENT FOR PRACTICE-BASED RESEARCH
57
scheduled hours for the benefit of carrying out the practice-based research project,
available physical resources and time for discussing, sharing, and performing
practice-based research and its results, and accessible resources such as books and
journals, seem important preconditions for successful, practice-based research
through teachers in schools (Darling-Hammond, 2005). Another important aspectis the position of practice-based research in school policy (Cochran-Smith & Lytle,
2009) for example the integration with existing educational innovations in the
school organization or with the training of student teachers. Furthermore, teachers’
practice-based research activities are regarded most successful when they areembedded in ‘professional learning communities’ (Cochran-Smith & Lytle, 1999b;
Groundwater-Smith & Dadds, 2006), in which teacher-researchers as well asstudent teachers can expand their knowledge and skills in a critical dialogue with
their colleagues as ‘critical friends’.
Second, a research culture conducive to the development of professional
learning communities and collaboration is an important element with respect to the
performance of practice-based research (Ebbutt, 2002; Schussler, 2006; Snow-Gerono, 2005). Besides a shift from traditional isolation to community and
collaboration in schools, teachers’ professionalism or their willingness to conduct
and be actively involved in research, and teachers’ recognition of the value of
practice-based research, are, according to Ebbutt (2002), important for realizingsupportive research cultures in schools. Not only teacher-researchers’ engagement
in practice-based research is important in this respect, but also the appreciation of
colleagues for emerging research initiatives, and the actual use and disseminationof research and research results in the school organization and partnership.
Third, in the establishment of a productive research environment in schools, the supportive leadership of the school leader plays an important role (Krüger, 2010).
Principals need to motivate teachers and stimulate them to investigate questionsand search for solutions to problems resulting from their own or shared educational
practices. Therefore, not only a school policy supportive for carrying out practice-
based research through teachers needs to be in place, but also a policy that links
teacher research to school practice in a way that research and research results canactually enable improvement and innovation (Ebbutt, 2002). This also entails
establishing clear requirements for and high expectations of teacher-researchers,
directed at monitoring research progress and the control of research quality. Priorresearch by the authors has shown that teachers hardly seem to distinguish between
on the one hand ‘research culture’ or supportive leadership with respect to the
realization of a research supportive culture and on the other hand ‘research
infrastructure’ or supportive leadership with respect to the realization of conditionssupportive and/or stimulative for practice-based research (Vrijnsen-de Corte,
2012).
Fourth, to create professional space for experienced teachers’ embedded
professional development and prospective teacher learning through (collaborative) practice-based research, professional development schools work together in
partnerships with other schools and/or teacher education institutes (Conaway &
Mitchell, 2004; Cornelissen, van Swet, Beijaard, & Bergen, 2011; Cooner &

8/18/2019 (Contemporary Approaches to Research
http://slidepdf.com/reader/full/contemporary-approaches-to-research 60/284
VRIJNSEN-DE CORTE ET AL.
58
Tochterman, 2004; Darling-Hammond, 2005; Snow-Gerono, 2005). Within these
partnerships collaborations among and across teacher-researchers, their critical
colleagues, the participants in the practice-based research projects, academic
researchers, teacher educators and so on, can take many forms.
In different studies investigating (student) teachers’ practice-based research inschools, teachers and student teachers have mentioned the presence of a research
culture (Worrall, 2004) and research infrastructure (Worrall, 2004; Watkins, 2006)
and the way in which these are realized in schools, as important preconditions for
performing practice-based research. Most times, different contextual aspectstogether (research culture, research infrastructure and supportive leadership) were
mentioned as prerequisite; partnership emerged as a concept unique for the PDS inthese studies. However, while several studies have investigated (student) teachers’
perceptions of practice-based research within the PDSs context (Mule, 2006; Levin
& Rock, 2003), the influence of factors such as the partnership on the actual
research process and outcomes following (student) teachers’ practice-based
research activities, has less frequently been investigated. In this study, the threecontextual input variables included are: ‘research culture’, ‘research infrastructure’
(both including some aspects of supportive leadership), and ‘partnership’.
Personal Input (Teachers’ Research Motivation)
In the literature, several goals or expected outcomes are proposed for teachers’ practice-based research. By means of carrying out practice-based research, teachers
are assumed to deepen their understanding of own (or shared) educational practice,
including pupil learning and learning results (Cochran-Smith & Lytle, 2009; Ponte,2005). It is expected that teachers, through conducting practice-based research
activities, can acquire deep practical knowledge about the causes and consequences
of their actions, find answers to their specific practical problems, and provideevidence about what works in practice and why (Cochran-Smith & Lytle, 2009;
Cordingley, 2003; Ponte, 2005). Based upon their developed practical knowledge
and the results of their practice-based research projects, teachers can improve,
evidence-based, their own or shared educational practice and solve practical
problems in their classrooms and/or school organization (Elliott, 2008). Theseintended results of practice-based research activities, form important motives for
teachers to conduct practice-based research in their schools (see for example
Worrall, 2004 and Watkins, 2006). Worrall (2004) states the concept of personaldevelopment features in most teachers’ accounts of the reasons behind their
involvement in research. However, the relations between certain motives for performing practice-based research and the actual performance of the research process or the gathered research outcomes have not been investigated. Therefore,
teachers’ ‘research motives’ are included in this study as an important personal
input variable.

8/18/2019 (Contemporary Approaches to Research
http://slidepdf.com/reader/full/contemporary-approaches-to-research 61/284
SCHOOL AS LEARNING ENVIRONMENT FOR PRACTICE-BASED RESEARCH
59
Practice-based Research Process (Research Activities)
In different phases of their practice-based research projects teachers perform
various research activities. In the literature, several models for teachers’ research
processes have been described, with approximately the same concepts andelements (Burton & Bartlett, 2005; Hubbard & Power, 1993; 1999; Lankshear &
Knobel, 2004; Mills, 2000; Ponte, 2002a). First, activities can relate to the
exploration and definition of the research problem(s) and question(s), resulting in a proposed research plan or, in other words, the ‘planning’ of the practice-based
research. Second, activities can refer to the realization of the proposed research
plan, such as collecting and analyzing research data or, in other words,
‘performing’ the practice-based research. Third, activities can concern theevaluation of the carried out practice-based research or, in other words,‘evaluating’ the practice-based research. Fourth and last, activities can be
undertaken making the research and research results public or, in other words,
‘reporting’ the practice-based research. Within a research cycle, the differentresearch activities are supposed to follow up each other (Ponte 2002a). Prior
research conducted by the authors showed that teachers mainly make a distinction
between planning and performing practice-based research and the ‘more finalizing’activities such as evaluating and reporting (see Vrijnsen-de Corte, 2012). In most
studies on (student) teachers’ practice-based research, perceived (learning)
outcomes have been investigated, both with respect to performing research as wellas with respect to teaching (Levin & Rock, 2003; Henson, 2001; Zeichner &
Noffke, 2001), but most times not in relation to the actual research process itself
(and the performed research activities). Therefore, in this study two processvariables are included: ‘planning and performing research’ and ‘evaluating and
reporting research’.
(Learning) Outcomes (Teachers’ Professional Growth)
Practice-based research is assumed to stimulate teachers’ knowledge, beliefs and
practices, both with respect to teaching and student learning as well as with respect
to conducting research (Ponte, Ax, Beijaard, & Wubbels, 2004). Conditional fordoing and using practice-based research through teacher-researchers are their
positive attitudes towards research (cf. Kirkpatrick & Kirkpatrick, 2006) and theirappreciation of its benefits (cf. Kincheloe, 2003). Both influence the extent to
which teachers perceive their role as researchers as meaningful as well as the
extent to which they will learn. This research attitude refers to teachers’ evaluativequality – like or dislike of practice-based research – (Shrigley, Koballa, &Simpson, 1988), including terms such as interest, enjoyment, and satisfaction
(Gardner & Gauld, 1990) and even curiosity, confidence, and perseverance
(Shulman & Tamir, 1972). It is assumed that these attitudes in turn determine
teachers’ efficacy beliefs with respect to performing practice-based research
activities.

8/18/2019 (Contemporary Approaches to Research
http://slidepdf.com/reader/full/contemporary-approaches-to-research 62/284
VRIJNSEN-DE CORTE ET AL.
60
Research has shown that in order for teachers to change or improve their
behavior related to their teaching practice, it is important that teachers believe they
can achieve these changes (Bandura, 1997). Research efficacy beliefs are thusconditional for performing research as well as for achieving the actual outcomes of
teachers’ practice-based research projects. Research has also shown relevant
distinctions between various types of efficacy beliefs, such as general teaching
efficacy belief and personal efficacy belief (Gibson & Dembo, 1984). In our prior
research it was found that in teachers’ perceptions only a meaningful distinction
could be made between research-related outcomes or, in other words, ‘researchattitude and efficacy beliefs’ and teaching-related outcomes or, in other words,
‘teacher efficacy’ (see Vrijnsen-de Corte, 2012). In this study we thereforeincluded these two outcome variables.
Relations between Input, Process and Outcomes
In conclusion, it can be stated that many assumptions regarding relations orinfluences between aspects associated with (student) teachers’ practice-based
research in schools, have not (yet) been supported with empirical evidence. If
aspects and their interrelations were investigated, this most times happened between specific pairs or parts of the variables discussed; a complete test of
relations between the context, process and outcome variables has – at least to our
knowledge – not yet been conducted. This study is directed at this moreencompassing test of associations between variables as perceived by teachers and
student teachers. The assumed relations as described in the theoretical framework
and the starting points of our research are presented in the hypothetical startingmodel visualized in Figure 1.
Research Questions
The main question investigated in this study is: What model explains the empirical
relations that exist in (student) teachers’ perceptions of factors associated with theinput (contextual and personal), process and outcomes of in-school practice-based
research? This resulted in the following more specific sub questions:
1. What relations exist between (student) teachers’ perceptions of input(context and personal), process and outcome variables?
2. What empirical model explains these relations (e.g. fits the data)?
a.
What direct and indirect relations exist in this empirical model between(student) teachers’ perceptions of the input, process and outcomes of
practice-based research?
b. What relative importance do different input and process variables have onoutcomes of practice-based research?

8/18/2019 (Contemporary Approaches to Research
http://slidepdf.com/reader/full/contemporary-approaches-to-research 63/284
Note:
than a
Respo
For th based
was g
for all
only panalys
experi
partici
as a pschool
the te
gradu
of theiworki
studen
SCHO
‘ ’ signifies
causal relation
dents
e benefit ofresearch in s
athered from
variables in t
resent in PDis. Data of a
enced teache
pating in this
ofessional le subjects and
chers in the
tion. The stu
r teacher traig in one of t
t teachers we
L AS LEARNI
irect relations,
Figure 1.
nalyzing relachools by me
102 (student)
he questionna
s or teacherotal of 56 res
rs and 17 w
study had fin
arning activitworked 27.6
ample had be
dent-teachers
ing were in the participati
e also teachi
G ENVIRONM
‘---’ means a
Hypothetical s
ETHOD
ions betweeans of struct
teachers. On
ire – so, incl
ducation pra pondents cou
ere student t
ished (or alm
in their schhours per we
tween 20 an
who carried
heir graduatiog schools as
g different su
NT FOR PRAC
n association
arting model
variables asral equation
ly respondent
ding the part
ctice schoolsld be include
eachers. The
st finished) p
ols. These teek on averag
30 years tea
ut practice-b
n year of thei part of their t
bjects.
TICE-BASED R
etween variab
ociated withodeling (S
s who answe
ership variab
were includ in the study:
experienced
ractice-based
achers taught(SD = 10.3).
hing experie
sed research
r curriculumeacher traini
ESEARCH
61
les rather
practice-M), data
ed items
le that is
ed in the39 were
teachers
research
differentMost of
ce since
as a part
and wereg. These

8/18/2019 (Contemporary Approaches to Research
http://slidepdf.com/reader/full/contemporary-approaches-to-research 64/284
VRIJNSEN-DE CORTE ET AL.
62
Table 1. Domains, scales, number of items, Cronbach’s alpha (CA), and sample items for the QTR scales
Domain Scale Items CA Sample item
Input
Environment
Research culture1
7 0.81 ‘At our school, teachers’ practice-
based research is taken for granted’
Research
infrastructure
1
5 0.71 ‘At our school, the school leader
showed interest in my practice- based research’
Partnership1 8 0.90 ‘Our school makes a contribution
to the research partnership’
Personal
Research motives1 5 0.74 ‘I conduct practice-based research
because I want to gather more
insight into pupils’ (learning)
needs’
Process
Planning and
performing research2
10 0.84 ‘During the planning phase of my
practice-based research, I have
made a research plan’
Evaluating andreporting research
2 15 0.92 ‘During the evaluation phase of my practice-based research, I have
discussed the conclusions of my
research with colleagues’
Outcomes
Research attitude
and efficacy beliefs314 0.93 ‘Resulting from my practice-based
research, I now enjoy conducting
practice-based research’
Teacher efficacy3
15 0.95 ‘Resulting from my practice-based
research, I am now directed at
improving pupils’ education’
Notes: 15-point Likert-scale (1 = not or in a very small extent, 5 = in a very high extent)2
4-point scale (1 = not performed at all, 2 = weak performed,3 = medium performed, 4 = very well performed)
35-point Likert-scale (1 = much smaller/more badly, 5 = much more/ much better)

8/18/2019 (Contemporary Approaches to Research
http://slidepdf.com/reader/full/contemporary-approaches-to-research 65/284
SCHOOL AS LEARNING ENVIRONMENT FOR PRACTICE-BASED RESEARCH
63
Instrumentation
Based upon the findings of an interview study (see Vrijnsen-de Corte, 2012), the
Questionnaire on Teacher Research (QTR) was developed in order to map
(student) teachers’ perceptions. The instrument is a self-report questionnaire usedto assess teachers’ perceptions concerning practice-based research in schools. The
questionnaire consisted of eight scales with a total of 79 statements to be rated. In
Table 1, the eight scales, their corresponding number of items, the Cronbach’salpha’s (CA) as well as some example items, are displayed.
Regarding the contextual input (environment), the ‘research culture’ scale
measured teachers’ perceptions of the school support by colleagues and school
leaders for practice-based research in their schools. The ‘research infrastructure’scale asked for teachers’ perceptions of the existing organizational structure,
including conditions such as research budget, available resources, and supportive
school policy for performing practice-based research in their schools. The‘partnership’ scale measured teachers’ perceptions of the collaboration of their
schools with other partners with respect to practice-based research. The research
motives scale (personal input) measured teachers’ motives for performing practice- based research. The first process scale, ‘planning and performing research’, asked
for teachers’ perceptions of the activities with regard to planning and performing
practice-based research. The second process scale, ‘evaluating and reporting
research’, measured teachers’ perceptions of the activities with respect to theevaluation and report of the practice-based research. The first outcome scale,
‘research attitude and efficacy beliefs’, mapped teachers’ perceptions of the
outcomes of their practice-based research with respect to performing research:changed research attitude, and improved/reduced research knowledge and skills.Last, the second outcome scale, ‘teacher efficacy’, measured teachers’ perceptions
of the outcomes of their practice-based research with respect to teaching (their self-
efficacy beliefs). The Cronbach’s alpha’s (CA) of the eight scales varied from 0.71to 0.95. The results showed all scales to be reliable (above 0.70).
Data Analysis
In order to gain insight into the presence of the eight variables in the present
sample, a descriptive analysis was conducted. Average scale scores and standarddeviations were calculated using SPSS. In addition, Pearson correlations between
the QTR-scales were calculated. In order to further investigate the relations
between the perceived aspects of teachers’ practice-based research in secondaryeducation schools (e.g. the QTR scales), a structural model using MPlus (Muthén
& Muthén, 1999) was tested. The data of the aforementioned 56 respondents were
used for the modeling process. In the hypothetical starting model (see Figure 1),relations were assumed between the contextual variables research culture, research
infrastructure and partnership. These contextual variables, teachers’ research
motives and the two process variables (planning and performing research, andevaluating and reporting research), were hypothesized to affect teachers’ research

8/18/2019 (Contemporary Approaches to Research
http://slidepdf.com/reader/full/contemporary-approaches-to-research 66/284
VRIJNSEN-DE CORTE ET AL.
64
attitude and efficacy beliefs, as well as teacher efficacy. The two process variables
were assumed to be affected by the contextual variables and teachers’ research
motives. The first process variable ‘planning and performing research’ wasassumed to effect the second process variable ‘evaluating and reporting research’.
Last, teacher efficacy was hypothesized to be affected by teachers’ research
attitude and efficacy beliefs.
Fit indices showed the hypothetical starting model to fit the data well (χ 2 =
1.179 with df = 3 (p=.76); the Comparative Fit Index (CFI) =1.00; the Tucker
Lewis Index (TLI) =1.00; Root Mean Square Error of Approximation (RMSEA)=.00; Standardized Root Mean Square Residual (SRMR) =.03; see Table 2, model
1). While the hypothetical model fitted the data, many of the relations tested in thisstructural model were weak and statistically non-significant. Through excluding
these non-significant relations from the model (given the one-directionality
assumed in the relations, these were tested one-sided (at p =.05)), a more economic parsimonious structural model emerged. The final structural model also provided
an adequate fit to the data (χ 2 = 16.17 with df = 18 (p=.58); CFI=1.00; TLI=1.00;
RMSEA=.00; SRMR=.08; see Table 2, model 2). Thus, the difference betweenmodel and data was non-significant: CFI and TLI were above the required value of
.95. However, SRMR was above the required value of .05 indicating that there
was some unexplained variance in the model. The standardized path coefficientsand effect sizes (Cohen’s effect size for correlation) were estimated for the final
model.
Table 2. Model fit measures
Description X2 (df) P-value CFI TLI RMSEA SRMR
Model 1
Hypothetical
starting model
1.18 3 .76 1.00 1.00 .00 .03
Model 2
Final
empirical
model
16.17 18 .58 1.00 1.00 .00 .08
Χ 2 describes the distance between model and data, but depends on the sample size. CFI
and TLI describe the ‘power’ of the model compared to ‘the situation without the model’.SRMR and RMSEA describe how much error or unexplained variance remain after
fitting the model.
RESULTS
Teachers’ Perceptions of Practice-based Research (RQ1)
In Table 3, average scale scores, standard deviations, and Pearson correlations for
the eight QTR scales are presented. The results show that for all QTR scales,

8/18/2019 (Contemporary Approaches to Research
http://slidepdf.com/reader/full/contemporary-approaches-to-research 67/284

8/18/2019 (Contemporary Approaches to Research
http://slidepdf.com/reader/full/contemporary-approaches-to-research 68/284

8/18/2019 (Contemporary Approaches to Research
http://slidepdf.com/reader/full/contemporary-approaches-to-research 69/284
SCHOOL AS LEARNING ENVIRONMENT FOR PRACTICE-BASED RESEARCH
67
It should be noted, however, that because the date were collected at one moment
in time, real causality cannot be tested. Hence, the model merely suggests logical
paths between measured variables. The direction of the arrow represents thedirection of the causality. Each relation depicted in the figure concerned a
statistically significant relation between two variables. Besides all direct effects
influencing the two process and outcome variables, several indirect effects
occurred. These indirect effects emerged via different pathways in the structural
model: for example, partnership has an indirect influence on evaluating and
reporting research via research infrastructure but also via research culture (andresearch infrastructure). The total effects concern a total sum of the direct and
indirect effects between two variables. In Table 4, the direct, indirect and totaleffects (cf. Verschuren, 1991) based upon Figure 2 are displayed. These effects are
further explained below.
Table 4. Direct (D), indirect (I), and total effects (T) based on Figure 2
Note: D: means direct effect, I: means indirect effect, and T: means total effect
Domain and variables Process Outcomes
Planning and
performingresearch
Evaluating and
reporting research
Research attitude
and efficacy beliefs
Teacher efficacy
D I T D I T D I T D I T
Contextual input
Research culture - - - - .29 .29 - .09 .09 - .05 .05
Research infrastructure - - - .56 - .56 - .17 .17 - .09 .09Partnership - - - - .32 .32 - .10 .10 - .05 .05
Personal input
Research motives - - - - - - .44 - .44 .25 .23 .48
Process
Planning and
performing research
- - - .18 - .18 .22 .06 .28 - .15 .15
Evaluating and
reporting research
- - - - - - .31 - .31 - .16 .16
Outcomes
Research attitude and
efficacy beliefs
- - - - - - - - - .53 - .53
Teacher efficacy - - - - - - - - - - - -

8/18/2019 (Contemporary Approaches to Research
http://slidepdf.com/reader/full/contemporary-approaches-to-research 70/284
VRIJNSEN-DE CORTE ET AL.
68
Direct, Indirect and Total Relations (RQ2a)
Input (contextual and personal) – process. There are no direct or indirect effects
of input variables (contextual and personal) on the planning and performing
research variable in the structural model. With respect to the contextual inputvariables, only ‘research infrastructure’ had a medium direct effect (.56) on
‘evaluating and reporting research’ (total effect .56). Thus, the greater the presence
of a research infrastructure was perceived by teachers, the more satisfied they werewith research activities they performed. The other two contextual input variables
only had a small indirect effect (via research infrastructure or both other contextual
variables and research infrastructure) on ‘evaluating and reporting research’.
‘Research culture’ had an indirect and total effect of .29 and ‘partnership’ anindirect and total effect of .32 on evaluating and reporting research. The personalinput variable ‘research motives’ did not have an effect (direct or indirect) on
‘evaluating and reporting research’.
Process. In the structural model there was a very small relationship between the
two process variables. The planning and performing research variable had a direct
effect of .18 on the evaluating and reporting research variable (total effect .18).Thus, the more teachers perceived to have been engaged in planning and
performing research activities, the more they reported to have been engaged in
evaluating and reporting their research.
Process – outcomes. The planning and performing research variable had a small
direct effect of .22 as well as a very small indirect effect (via evaluating andreporting research) of .06 on ‘research attitude and efficacy beliefs’ (total effect
.28). The second process variable ‘evaluating and reporting research’ only had a
direct effect of .31 on ‘research attitude and efficacy beliefs’. This means that themore teachers perceived their evaluating and reporting research activities as very
well performed, the more they perceived improved research attitudes and efficacy
beliefs. Both process variables only had an indirect effect on ‘teacher efficacy’.The variable ‘planning and performing research’ had an indirect effect of .15 and
the variable ‘evaluating and reporting research’ had an indirect effect of .16. Thus,the more teachers perceived their planning and performing research activities and
their evaluating and reporting research activities as very well performed, the more
they perceived increased teacher efficacy.
Input (contextual and personal) – outcomes. Given the aforementioned results, allcontextual input variables only had indirect effects on both outcome variables
(mainly via research infrastructure). Research culture had an indirect effect of .09,research infrastructure an indirect effect of .17, and partnership an indirect effect of
.10 on research attitude and efficacy beliefs. Thus, the more teachers perceived the presence of the research culture, research infrastructure, and partnership at their
schools, the more they perceived improved research attitudes and efficacy beliefs.
Teacher efficacy was influenced indirectly by research culture (.05), research

8/18/2019 (Contemporary Approaches to Research
http://slidepdf.com/reader/full/contemporary-approaches-to-research 71/284
SCHOOL AS LEARNING ENVIRONMENT FOR PRACTICE-BASED RESEARCH
69
infrastructure (.09), and partnership (.05). Thus, the more teachers perceived the
presence of a research culture, research infrastructure and partnership at their
schools, the more they perceived increased teacher efficacy. The personal input
variable ‘research motives’ had a direct effect of .44 on research attitude and
efficacy beliefs. This means that the more teachers perceived they had clearresearch motives, the more they perceived improved research attitudes and efficacy
beliefs. With respect to the outcome variable ‘teacher efficacy’, ‘research motives’
had a direct effect of .25 as well as an indirect effect via research attitude and
efficacy beliefs of .23 (total effect .48). This suggests that the more teachers perceived to have clear research motives, the more they perceived increased
teacher efficacy.
Outcomes. Between both outcome variables there was a relationship as shown in
the structural model. Research attitude and efficacy beliefs had a direct effect of
.53 on teacher efficacy (total effect .53). Thus, the more teachers felt they were
capable of conducting research, the more they felt they improved their teaching.
Relative Importance of Variables and Model (RQ2b)
When the above described relations between the variables of practice-based
research are compared to each other, the following trends emerged:
1. The influence of the research infrastructure variable on the planning and performing research variable and both outcome variables was two times
stronger than that of the other two context variables (and moreover it was
the only direct influence).2. The research motive variable appeared four times more stronger in its
effect on outcomes than the other input variables (i.e. contextual input
variables); this suggests it can be regarded as more important than all theother context variables together.
3. Both process variables had double the effect on outcomes compared to the
context variables. Compared to the research motives variable their effectwas half that in size; but process variables did have a direct influence on
outcomes.The variance ( R2) in evaluating and reporting research was explained for 35% by
the three contextual input variables and planning and performing research. The
variance in research attitude and efficacy beliefs was explained for 47% by theinput variables (contextual and personal) and both process variables. The variance
in teacher efficacy was explained for 36% by direct and indirect relations with allother variables.
CONCLUSION AND DISCUSSION
Overall, we found empirical evidence for most of the assumptions (frequently)
mentioned in the literature. The developed empirical structural model fitted thedata well and explained quite a lot of variance, in particular with respect to the

8/18/2019 (Contemporary Approaches to Research
http://slidepdf.com/reader/full/contemporary-approaches-to-research 72/284
VRIJNSEN-DE CORTE ET AL.
70
process variable evaluating and reporting research (35%) and both outcome
variables (respectively 36% for research attitude and efficacy beliefs, and 47% for
teacher efficacy). Furthermore, we have gathered more insight into what (student)
teachers themselves think about which concepts are important with respect to
practice-based research outcomes in secondary education schools. Based upon thefindings of this study we can draw three important conclusions.
First, the contextual input variables had mainly indirect effects on process and
outcome variables. Only research infrastructure had a direct influence on the
process variable ‘evaluating and reporting research. This causal relation was thestrongest relation in the total structural model (.56). The other contextual variables
‘research culture’ and ‘partnership’ appeared only marginally important and weremediated by ‘research infrastructure’, process and outcome variables. Based upon
this finding we can draw the conclusion that the contextual variables are not that
important in explaining teachers’ perceptions of the practice-based research
process and research outcomes as mentioned in some literature (Holmes Group,
1990; NCATE, 2001).Second, we can conclude that both process variables do have an important
influence on the outcome variables ‘research attitude and efficacy beliefs’ and
‘teacher efficacy’. Both process variables directly influenced the outcome variable
‘research attitude and efficacy beliefs’. The planning and performing researchvariable also had an indirect influence. Both process variables indirectly influenced
teacher efficacy, via the mediating variable research attitude and efficacy beliefs.
This finding does confirm findings from our prior study (see Vrijnsen-de Corte,2012), that the practice-based research process (and its quality) is of major
importance for obtaining both research outcomes.Third, research motives have a direct influence on both outcome variables. This
influence was up to twice as strong as the influence of the process variables. Basedupon this finding we can draw the conclusion that besides the process variables
research motives are also very important for obtaining both outcomes.
On the whole, the developed structural equation model seemed promising for
investigating (student) teachers’ practice-based research in schools. The empiricalstructural equation model showed several direct and indirect relations between
perceived concepts associated with teachers’ practice-based research in schools.
From the strength of the relations, we can deduce what concepts and what relations between those concepts are relatively important for implementing practice-based
research through teachers-as-researchers in secondary education schools.
First, schools that want to implement practice-based research as a professional
learning activity, with outcomes regarding performing research as well asregarding teaching, should focus on teachers’ and student teachers’ motives for
performing practice-based research and the practice-based research process itself,
instead of investing in and focusing too much on the context for practice-based
research in schools (research culture, research infrastructure and partnership).Successfully realizing practice-based research in schools starts with selecting
teachers who are interested in research (results) and eager to perform practice-
based research activities. Especially these teachers need to get inspired for

8/18/2019 (Contemporary Approaches to Research
http://slidepdf.com/reader/full/contemporary-approaches-to-research 73/284
SCHOOL AS LEARNING ENVIRONMENT FOR PRACTICE-BASED RESEARCH
71
researching their own educational practice as a professional learning activity.
Therefore, schools should show them ‘good practices’ and convince them of the
added-value of practice-based research activities for the education of pupils and for
own professional learning as a teacher. Inspired teachers themselves should
formulate the research questions: emerging from their own educational practiceand leading to direct and observable improvements. Besides this, schools should
show teachers how these good practices are established: what makes that these
research projects are successful?
Second, while the context for practice-based research in schools is the mostimportant variable. In the perception of the (student) teachers, research culture and
partnership do have a strong coherence with the research infrastructure, but aremore indirectly important for the process and outcomes of practice-based research
in schools. Schools should thus focus first on realizing in-school structures directly
important for performing practice-based research and realizing research outcomes.
The developed empirical structural model does fit the research data well,
however, the percentages explained variance for the process and outcome variablesof the model still showed some room for improvement. In this structural model we
defined all concepts as latent variables due to the small sample size. Hence,
measurement error for the different variables could not be accounted for in the
model. Further, the question remains if these are the only important concepts orthat there are other also important concepts to be taken into account.
Besides this, in this study we investigated (student) teachers’ perceptions of the
concepts associated with practice-based research in schools via a questionnaire.Therefore, concepts were measured in a prescribed and structured manner, leaving
no room for more personal descriptions. If (student) teachers did have a perceptionof other concepts (which we did not include in our questionnaire) these perceptions
were not taken into account. It is also the question if (student) teachers do have agood image of all concepts questioned. The structural relations found in the model
were prompted by teachers and student teachers as perceived at this moment.
These relations can change in time with the development of practice-based
research in schools.
REFERENCES
Bandura, A. (1997). Self-efficacy: The exercise of control. New York: W.H. Freeman.
Burton, D., & Bartlett, S. (2005). Practitioner research for teachers. London: Sage.
Cochran-Smith, M., & Lytle, S. L. (2009). Inquiry as stance. Practitioner research in the next
generation. New York: Teachers College Press.
Cochran-Smith, M., & Lytle, S. L. (1999a). The teacher research movement: A decade later.
Educational Researcher, 28 (15), 15-25.
Cochran-Smith, M., & Lytle, S. L. (1999b). Relationships of knowledge and practice. Teacher learning
in communities. In A. Iran-Nejad & C. Pearson (Eds.), Review of research in education (Vol. 24)
(pp. 249-264). Washington, DC: American Educational Research Association.
Conaway, B.J., & Mitchell, M.W. (2004). A comparison of the experiences of yearlong interns in a
professional development school and on semester student teachers in a non-PDS location. Action in
Teacher Education, 26 (3), 21-28.

8/18/2019 (Contemporary Approaches to Research
http://slidepdf.com/reader/full/contemporary-approaches-to-research 74/284
VRIJNSEN-DE CORTE ET AL.
72
Cooner, D.D., & Tochterman, S.M. (2004). Life inside a professional development school: what
experienced teachers learn. The Teacher Educator, 39(3), 184-195.
Cordingley, P. (2003). Research and evidence-based practice: Focusing on practice and practitioners. In
L. Anderson & N. Bennet (Eds.), Developing educational leadership. Using evidence for policy and
practice (pp. 104-114). London: Sage Publications.
Cornelissen, F., van Swet, J., Beijaard, D., & Bergen, T. (2011). Aspects of school-university research
networks that play a role in developing, sharing and using knowledge based on teacher research.
Teaching and Teacher Education, 27 (1), 147-156.
Darling-Hammond, L. (Ed.). (2005). Professional development schools: Schools for developing a
profession. New York: Teachers College Press.
Ebbutt, D. (2002). The development of a research culture in secondary schools. Educational Action
Research, 10(1), 123-142.
Elliott, J. (2008). Using research to improve practice. The notion of evidence-based practice. In C. Day& J. Sachs (Eds.), International handbook on the continuing professional development of teachers
(pp. 264-290). Maidenhead: Open University Press.
Fenstermacher, G. D. (1994). The knower and the known: The nature of knowledge in research on
teaching. In L. Darling-Hammond (Ed.), Review of research in education (pp. 3-56). Washington,
DC: American Educational Research Association.
Fraser, B. J. (1998). Science learning environments: Assessment, effects and determinants. In B. J.
Fraser & K. Tobin (Eds.), International handbook of science education (pp. 527-564). Dordrecht,
the Netherlands: Kluwer.
Fraser, B. J. (2002). Learning environments research: Yesterday, today and tomorrow. In S. C. Goh &
M. S. Khine (Eds.), Studies in educational learning environments: An international perspective (pp.
1-27). Singapore: World Scientific.
Fraser, B. J. (2007). Classroom learning environments. In S. K. Abell & N. G. Lederman (Eds.),
Handbook of research on science education (pp.103-125). London: Routledge.
Gardner, P., & Gauld, C. (1990). Labwork and students’ attitudes. In E. Hegarty-Hazel (Ed.), The
student laboratory and the science curriculum (pp. 132-156). London: Routledge.Gibson, S., & Dembo, M. H. (1984). Teacher efficacy: A construct validation. Journal of Educational
Psychology, 76 (4), 569-582.
Groundwater-Smith, S., & Dadds, M. (2006). Critical practitioner inquiry: Towards responsible
professional communities of practice. In C. Day & J. Sachs (Eds.), International handbook on the
continuing professional development of teachers (pp. 238-263). Maidenhead: Open University
Press.
Harris, M. M., & van Tassel, F. (2005). The professional development school as a learning
organization. European Journal of Teacher Education, 28(2), 179-194.
Henson, R. K. (2001). The effects of participation in teacher research on teacher efficacy. Teaching and
Teacher Education, 17 , 819-836.
Holmes Group. (1990). Tomorrow’s schools: Principles for the design of professional development
schools. East Lansing: Holmes Group.
Hubbard, R. S., & Power, B. M. (1993). The art of classroom inquiry: A handbook for teacher
researchers. Portsmouth, NH: Heinemann.
Hubbard, R. S., & Power, B. M. (1999). Living the questions: A guide for teacher researchers. York:
ME: Stenhouse.
Kincheloe, J. L. (2003). Teachers as researchers: Qualitative inquiry as a path to empowerment (2nd
edition). London: Routledge Farmer.
Kirkpatrick, D. L., & Kirkpatrick, J. D. (2006). Evaluating training programs. The four levels (3rd
edition). San Francisco: Berrett-Koehler Publisher, Inc.
Krüger, M. L. (2010). Leading schools in the knowledge society: On the way to leaders of learning in
inquiry-based schools. In A. H. Normore (Ed.), Global perspectives on educational leadership
reform: The development and preparation of leaders of learning and learners of leadership (pp.
397-417). Binley, UK: Emerald Group Publishing Limited.

8/18/2019 (Contemporary Approaches to Research
http://slidepdf.com/reader/full/contemporary-approaches-to-research 75/284
SCHOOL AS LEARNING ENVIRONMENT FOR PRACTICE-BASED RESEARCH
73
Lankshear, C., & Knobel, M. (2004). A handbook for teacher research. From design to implementation.
Glasgow: Bell & Bain.
Levin, B.B., & Rock, T.C. (2003). The effects of collaborative action research on preservice and
experienced teacher partners in professional development schools. Journal of Teacher Education, 54
(2), 135-149.
Meijer, P., Meirink, J., Lockhorst, D., & Oolbekkink-Marchand, H. (2010). (Leren) onderzoeken door
docenten in het voortgezet onderwijs [Teachers (learn to) do research in Dutch secondary
education]. Pedagogische Studiën, 87 , 232-252.
Mills, G. E. (2000). Action research: A guide for the teacher researcher. Upper Saddle River, NJ:
Merrill.
Mule, L. (2006). Preservice teachers’ inquiry in a professional development school context:
Implications for the practicum. Teaching and Teacher Education, 22, 205-218.
Muthén, L. K., & Muthén, B. (1999). Mplus user’s guide (3rd ed.). Los Angeles: Muthén & Muthén. National Council for Accreditation of Teacher Education (NCATE). (2001). Standards for professional
development schools. Washington, DC: National Council for Accreditation of Teacher Education.
Ponte, P. (2002a). Actieonderzoek door docenten: Uitvoering en begeleiding in theorie en praktijk
[Action research by teachers: executing and supervising in theory and practice]. Doctoral
dissertation. Apeldoorn/Leuven: Garant.
Ponte, P. (2002b). Onderwijs van eigen makelij: Actie onderzoek in scholen en opleiding [Home grown
education: Action research in schools and teacher education courses]. Soest: Nelissen BV.
Ponte, P., Ax, J., Beijaard, D., & Wubbels, T. (2004). Teachers’ development of professional
knowledge through action research and the facilitation of this by teacher educators. Teaching and
Teacher Education, 20, 571-588.
Ponte, P. (2005). A critically constructed concept of action research as a tool for the professional
development of teachers. Journal of In-service Education, 31 (2), 273-295.
Schussler, D. L. (2006). The altered role of experienced teachers in professional development schools:
The present and its possibilities. Issues in Teacher Education, 15 (2), 61-75.
Shrigley, R. L., Koballa, T. R., & Simpson, R. D. (1988). Defining attitude for science educators. Journal of Research in Science Teaching, 25, 659-678.
Shulman, L. S., & Tamir, P. (1972). Research on teaching in the natural sciences. In R. M. W. Travers
(Ed.), Second handbook of research on teaching (pp. 1098-1148). Chicago, IL: Rand McNally.
Snoek, M., & Moens, E. (2011). The impact of teacher research on teacher learning in academic
training schools in the Netherlands. Professional Development in Education, 37 (5), 817-835.
Snow-Gerono, J.L. (2005). Professional development in a culture of inquiry: PDS teachers identify the
benefits of professional learning communities. Teaching and Teacher Education, 21, 241-256.
Teitel, L. (2003). The professional development schools handbook. Thousand Oaks, CA: Corwin Press.
Verschuren, P. (1991). Structurele modellen tussen theorie en praktijk [Structural models between
theory and practice]. Utrecht: Het Spectrum.
Vrijnsen-de Corte, M. (2012). Researching the teacher-researcher: practice-based research in Dutch
professional development schools. Doctoral dissertation. Eindhoven: ESoE/Eindhoven University of
Technology.
Watkins, A. (2006). So what exactly do teacher-researchers think about doing research? Support for
Learning, 21 (1), 12-18.
Worrall, N. (2004). Trying to build a research culture in a school: trying to find the right questions to
ask. Teacher Development, 8 (2 & 3), 137-148.
Zeichner, K. M., & Noffke, S. E. (2001). Practitioner research. In V. Richardson (Ed.), Handbook of
research on teaching (4th ed., pp. 298-330). Washington, DC: American Educational Research
Association.

8/18/2019 (Contemporary Approaches to Research
http://slidepdf.com/reader/full/contemporary-approaches-to-research 76/284
VRIJNSEN-DE CORTE ET AL.
74
Marjan Vrijnsen-de Corte
Fontys University of Applied Science
The Netherlands
Perry den Brok Eindhoven University of Technology
The Netherlands
Theo Bergen Eindhoven University of Technology
The Netherlands
Marcel Kamp
Radboud University Nijmegen
The Netherlands

8/18/2019 (Contemporary Approaches to Research
http://slidepdf.com/reader/full/contemporary-approaches-to-research 77/284
M.S. Khine (ed.), Application of Structural Equation Modeling in Educational Research and
Practice, 75–89.
© 2013 Sense Publishers. All rights reserved.
LIYAN LIU AND BARRY J. FRASER
4. DEVELOPMENT AND VALIDATION OF AN
ENGLISH CLASSROOM LEARNING ENVIRONMENT
INVENTORY AND ITS APPLICATION IN CHINA
INTRODUCTION AND THEORETICAL FRAMEWORK
Relevant teaching and learning activities need to be conducted in various learning
environments, with the classroom being the principal place for teaching most
subjects. So, the classroom learning environment has an important influence on the
teaching–learning process. Generally speaking, classroom environment refers to
various kinds of physical, social and psychological factors that influence teachingactivities (Fraser, 1998). China’s New English Curriculum Reform is in an
important period of implementation. What does the English classroom look like in
the context of the new curriculum reform? Students are in a good position to judgetheir classroom environment because they have experienced a variety of different
learning environments and have had sufficient time in the class to form accurate
perceptions of their learning environments (Fraser, 2012). Having anunderstanding of students’ perceptions of their English classroom learning
environments provides a useful basis for improving classroom teaching and
learning. Students’ perceptions of the classroom learning environment can be usedas a tool for teachers’ reflection and as a guide in teachers’ attempts at
improvement of their classroom environments (Aldridge, Fraser, Bell, & Dorman,2012).
The beginning of the study of classroom learning environments can be traced
back to the work of Herbert Walberg and Rudolf Moos (Fraser, 2012). From thenon, research on classroom learning environments has attracted great attention and
developed rapidly. The study of the classroom learning environment has focused
on the effectiveness of new curricula and teaching approaches, the development ofclassroom environment instruments, the factors that influence classroom
environment, and associations between the classroom environment and student
outcomes (academic achievements and attitudes, etc.) (Fraser, 2012). Amongthese, the development of classroom environment instruments and associations
between the classroom environment and students’ outcomes have drawn the mostattention (Macaulay, 1990). Research has supported that students’ perceptions ofthe classroom environment are significantly related to their outcomes (Fraser &
Fisher, 1982). Also researchers have used classroom environment assessments as
criteria in evaluating educational programs and innovations (Afari et al., 2013;Lightburn & Fraser, 2007; Nix, Fraser, & Ledbetter, 2005). With the development
of research methods and techniques for data collection and data analysis, Western
8/18/2019 (Contemporary Approaches to Research
http://slidepdf.com/reader/full/contemporary-approaches-to-research 78/284
LIU & FRASER
76
researchers have developed several extensively-validated and widely-used
classroom learning environment instruments, such as the Learning Environment
Inventory (LEI), My Class Inventory (MCI), Science Laboratory Environment
Inventory (SLEI), Constructivist Learning Environment Inventory (CLEI) and the
popular What Is Happening In this Class? (WIHIC) (Fraser, 2007, 2012; Liu, Ma,& Liu, 2009). Some scales from the WIHIC were used in the present study.
OBJECTIVES AND RESEARCH QUESTIONS
The main purpose of the present study was to develop a learning environmentsquestionnaire for English classrooms in China. Several Western classroom
environment instruments, including the WIHIC, CLES and SLEI, have been
translated into Mandarin by Taiwanese researchers (Huang, Aldridge & Fraser,1998). These instruments were found to be valid and useful after being translated
into Mandarin. However, the studies also showed that students and teachers had
different understandings of the same questions in different languages because ofdifferent educational systems based on differences in politics, economies and
cultures. The meaning of the original items thus could be different in a translated
version.Chinese researchers have developed classroom environment instruments to suit
the cultural mores in China, such as the Hong Kong Classroom Environment Scale
(HKCES) that measures the junior high school mathematics classroom learningenvironment, developed by Hong Kong scholars Lee Chikin John, Lee Lai Mui
Frances and Wong Hin Wah (2003), and the My Class Questionnaire developed by
the mainland scholar Jiang Guangrong (2004). At the same time, the Teacher– Student Interaction Questionnaire (TSIQ) was developed by the Taiwanese scholar
She (1998) to assess interactions between teachers and students.However, all of these instruments were used for measuring classroom learning
environments in science, mathematics or biology. In mainland China, because the
English curriculum is undergoing reform, it was timely to develop an instrumentwhich could be used to assess students’ perceptions of the English classroom
environment in the context of the new curriculum reform.
The other purpose of the present study was to explore associations between theclassroom learning environment and students’ outcomes in Mainland China.
Overall, the research questions that guided the present study were:
1. Is the newly-developed English Classroom Environment Inventory valid
and reliable when used with high school students in China?
2.
Do students’ perceptions of their English classroom learningenvironments vary with student sex, year level and school province?
3. Are there associations between the classroom learning environment and
student outcomes based on their achievement and English learning-related
attitudes?

8/18/2019 (Contemporary Approaches to Research
http://slidepdf.com/reader/full/contemporary-approaches-to-research 79/284
ENGLISH CLASSROOM ENVIRONMENT INVENTORY IN CHINA
77
METHODOLOGY
Sample
High school students in Grades 7, 8, 10 and 11 were involved during each of the
stages of the development and validation of the inventory. The first version of the
instrument was administered to 318 students for the purpose of performing an
exploratory factor analysis. The resulting final version of the ECLEI was thenadministered to 1,235 students.
Development of the ECLEI
The first draft of the ECLEI consisted of 56 items in six scales and obtained byexamining extensively-validated classroom learning environment inventories such
as the WIHIC, LEI and CLES, and by administering an open-ended questionnaire
to students to elicit their general perceptions of their English classroom learning
environment. The content of the first draft was face-validated by two Englishlanguage professors, six high school English teachers and the first author, resulting
in a reduction to 37 items in six scales in the second draft of the ECLEI.
Exploratory factor analysis was performed after administering the second draftof the ECLEI to 318 students, resulting in a further reduction to 25 items in five
scales after deleting items with factor loadings less than 0.40 on their own scale or
more than 0.40 on any other scale. One whole scale was removed using thesecriteria. A five-point frequency scale was used (1 = Almost Never; 2 = Seldom; 3 =
Sometimes; 4 = Often; 5 = Almost Always) to solicit students’ responses.The structure of the ECLEI was further confirmed using the results of
confirmatory factor analysis after administering it to a further 1,235 students. The
final version of the ECLEI consisting 25 items in five scales is provided inAppendix A. The results of the confirmatory factor analysis are summarized in
Table 1. The goodness-of-fit of models was evaluated based on the chi-square test
statistic and the Root Mean Square Error of Approximation (RMSEA), Goodness
of Fit Index (GFI) and Comparative Fit Index (CFI). The results are summarized inTable 2. According to conventional model fit standards, these results indicate good
model fit.
A sample item from each ECLEI scale is provided in Table 3. This table also
shows the classification of each ECLEI scale according to Moos’ three general
dimensions for all human environments: relationship dimensions; personaldevelopment dimensions; and system maintenance and change dimensions.
Additional statistical information (namely, the internal consistency reliability) issummarised in Table 3. The acceptable level of reliability for every ECLEI scaleattests to the validity of the questionnaire in response to the first research question
(concerning whether the newly-developed English Classroom Environment
Inventory is valid and reliable when used with high school students in China).
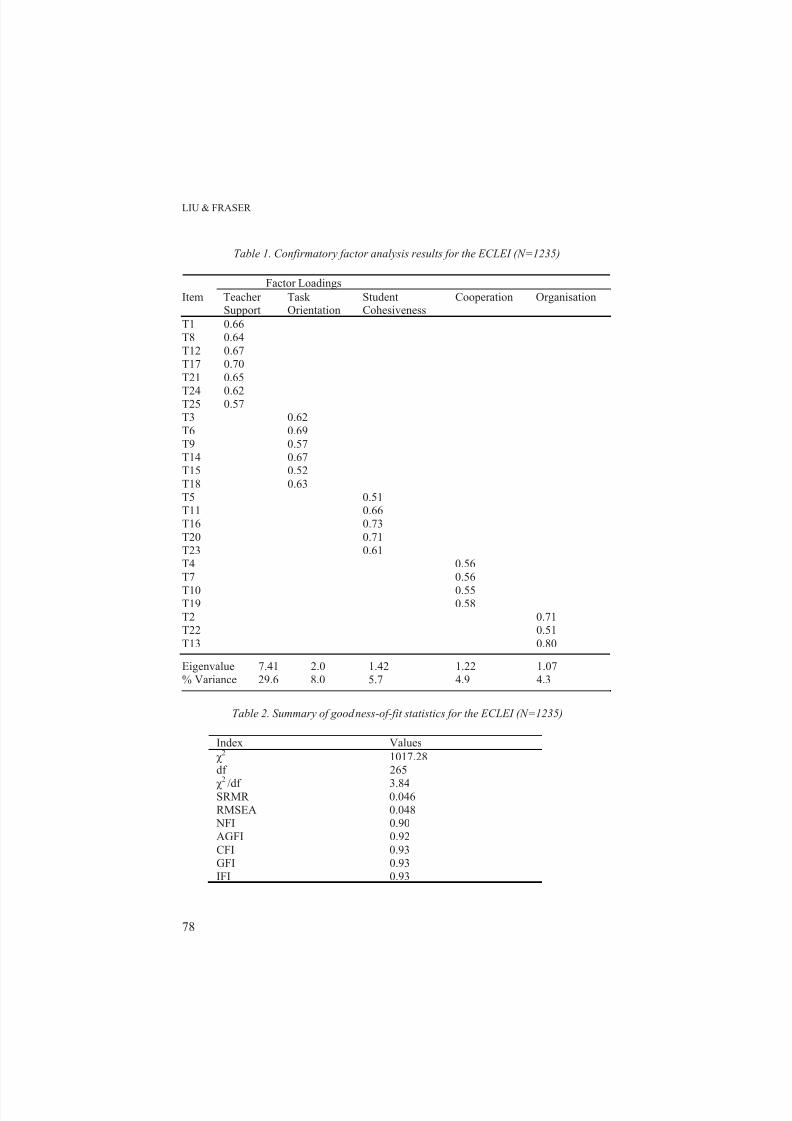
8/18/2019 (Contemporary Approaches to Research
http://slidepdf.com/reader/full/contemporary-approaches-to-research 80/284
LIU & FRASER
78
Table 1. Confirmatory factor analysis results for the ECLEI (N=1235)
Factor Loadings
Item TeacherSupport
TaskOrientation
StudentCohesiveness
Cooperation Organisation
T1 0.66T8 0.64
T12 0.67T17 0.70
T21 0.65
T24 0.62T25 0.57T3 0.62
T6 0.69T9 0.57T14 0.67T15 0.52
T18 0.63T5 0.51T11 0.66T16 0.73
T20 0.71T23 0.61T4 0.56T7 0.56
T10 0.55T19 0.58T2 0.71T22 0.51
T13 0.80
Eigenvalue 7.41 2.0 1.42 1.22 1.07% Variance 29.6 8.0 5.7 4.9 4.3
Table 2. Summary of goodness-of-fit statistics for the ECLEI (N=1235)
Index Values
χ 2 1017.28
df 265
χ 2
/df 3.84SRMR 0.046RMSEA 0.048
NFI 0.90AGFI 0.92
CFI 0.93GFI 0.93IFI 0.93

8/18/2019 (Contemporary Approaches to Research
http://slidepdf.com/reader/full/contemporary-approaches-to-research 81/284
ENGLISH CLASSROOM ENVIRONMENT INVENTORY IN CHINA
79
Table 3. Moos classification and sample item and internal consistency reliability(Cronbach’s alpha coefficient) for each ECLEI scale (N=1235)
Scale MoosScheme
No. ofItems
Sample Item AlphaReliability
Teacher Support R 7 Our English teacher likes us. 0.81Task Orientation PD 6 I know the goals for this
English language class.0.81
StudentCohesiveness
R 5 Certain students work onlywith their close friends.
0.75
Cooperation PD 4 Most students cooperateequally with other class
members.
0.66
Organisation S 3 Our English class is wellorganized.
0.74
R: Relationship, PD: Personal Development, S: System Maintenance & Change
Test of English-Related Attitudes
In our study, an eight-item scale adapted from Enjoyment scale of the Test of
Science-Related Attitudes (TOSRA) developed by Fraser (1981) to measure
students’ attitudes to English for our sample of 308 Grade 11 students. The attitudeitems are provided in Table 4. The information was subsequently used in
investigating associations between students’ perceptions of the classroom learningenvironment and their attitudes towards English.
Table 4. Test of English-related attitudes
Item Item Wording
1 I look forward to English lessons.2 Lessons in English class are fun.
3 I don’t like lessons in English class.4 English is my favorite subject.
5 Lessons in English class bore me.6 I enjoy lessons in English class.7 Lessons in English class are a waste of time.8 English lessons make me interested in English.
Academic Achievement
The mid-year examination scores for the 308 Grade 11 students were used to
assess achievement and to investigate associations between students’ perceptionsof the classroom learning environment and their academic achievement.

8/18/2019 (Contemporary Approaches to Research
http://slidepdf.com/reader/full/contemporary-approaches-to-research 82/284
LIU & FRASER
80
Interviews
Twenty students were selected for follow-up interviews to obtain further
information about their perceptions of the English classroom learning environment
and their English-related attitudes. Ten teachers were also interviewed to identifyfactors that influence the English classroom environment and to help to explain the
research findings obtained from the questionnaires.
FINDINGS
The findings of the study are presented below in two sections. First, students’
perceptions of their English classroom learning environments are reported andresearch question 2 is answered (What are students’ perceptions of their English
classroom learning environments based on gender, year level and school
province?). Second, associations between students’ perceptions of the classroomlearning environment, their English-related attitudes, and their academic
achievement are reported in response to research question 3 (What are the
associations between the classroom learning environment and student outcomes
based on their achievement and English learning-related attitudes?).
Students’ Perceptions of Their English Classroom Learning Environment
When a total of 1,235 students in Grades 7, 8, 9 and 11 English classes provided
their perceptions of their English classroom learning environment, the average item
mean for the five ECLEI scales varied from 3.68 to 4.21, suggesting that generallyhigh school students had positive perceptions of their English classroom learning
environments. The average item mean for Teacher Support, Organisation,
Cooperation, Task Orientation and Student Cohesiveness were 4.21, 4.13, 3.94,3.80 and 3.68, respectively. (As score of 4 for an ECLEI item corresponds to the
response alternative of Often and a score of 3 corresponds to Sometimes.)
Sex Differences in Perceptions of the English Classroom Learning E nvironment
A comparison of students’ perceptions of the English classroom learning
environment was undertaken for 571 male students and 664 female students.
Results from MANOVA showed that female students’ perceptions were generallymore positive than those of the males, especially for Student Cohesiveness
(F(1,233)=6.46, p<0.05) and Cooperation(F(1,233)=4.22, p<0.01).
However, sexdifferences were small for Organisation (F(1,233)=0.55, p>0.05). Figure 1
graphically depicts these sex differences in ECLEI scale scores.

8/18/2019 (Contemporary Approaches to Research
http://slidepdf.com/reader/full/contemporary-approaches-to-research 83/284
Differ
Class
Stude
levelsindica
and f
Orient
p<0.0
progre
enviro
ECLE
Table
Scale
TeacheSuppor
Task
OrientStuden
CohesiCoope
Organi
Figure 1. Se
nces betwee
oom Learnin
ts’ perceptio
were analyseed that there
or the four
ation (F(3,123
) and Orga
ssed to high
nment beca
I scale for ea
. Mean and st
Gra
(n=2
Mrt
4.44
tion4.19
t
veness3.83
ation 3.95
sation 4.39
ENGLIS
differences in(n=57
Grade Level
Environmen
ns of the cla
using MANwere differe
scales of T
1)=39.51, p
isation (F(3,12
r grades, the
e less positi
h grade level
ndard deviatio
e 7
18)
SD
0.59
0.60
0.91
0.74
0.64
CLASSROOM
students’ erce males and 66
in Students’
t
sroom learni
VA and mulces in overal
acher Supp
0.01), Stud
31)=17.51, p<
r perceptions
e. The mea
are provided
n for each ECL
Grade 8
(n=427)
M SD
4.29 0.77
3.88 0.72
3.49 0.81
3.90 0.79
4.14 0.79
ENVIRONMEN
ptions of learni females)
Perceptions
ng environm
tiple comparil responses (
rt (F(3,1231)=1
nt Cohesiv
0.001). On t
of the Engli
and standa
n Table 5.
EI scale for fo
Grade 1
(n=326)
M
4.04
3.62
3.81
3.97
4.17
INVENTORY
ng environmen
f the English
nt for differ
sons of mean
(3,1231)=14.09,
6.52, p<0.0
ness (F(3,123
e whole, as
sh classroom
rd deviation
r grade levels
0
(
SD
0.73
0.75
0.73
0.69
0.75
IN CHINA
81
t
nt grade
. Results p<0.01)
), Task
1)=12.85,
students
learningfor each
(N=1235)
rade 11
n=264)
M SD
4.10 0.76
3.56 0.78
3.69 0.80
3.94 0.79
3.86 0.99

8/18/2019 (Contemporary Approaches to Research
http://slidepdf.com/reader/full/contemporary-approaches-to-research 84/284
LIU &
82
Fig
Differ Learn
Analyheld d
were
Task
Organ
provinstuden
(Provi
positidiffer
graphi
Associ
Assocand t
using
basedstuden
RASER
re 2. Students’
nces betweeng Environm
ses indicatedifferent perce
ignificant di
rientation (
isation (F(2,123
ce (Provincets from eit
nce J), but
ely than thence between
cally depicts
ations betwe
ations betweeir English-r
structural eq
on the Test ots’ attitudes
perceptions of scho
Provinces innt
that students ptions of thei
ferences in st
(2,1232)=5.22,
2)=24.53, p<0
L) perceiveer Heilongji
students fro
students fro provinces for
hese between
n Students’
n students’ pelated attitud
ation modeli
Science-Relto English. T
the English clals from three p
Students’ Pe
from the thr English clas
udents’ perce
<0.05), Coo
.01). General
d Cooperatioang province
Jilin provi
the other tTeacher Sup
-province dif
utcomes and
erceptions ofs and acade
g. As mentio
ted Attitudeshe sample c
sroom learninrovinces
ceptions of t
ee provincessroom learnin
ptions of the
eration (F(2,1
y speaking, s
n much mor (Province
nce perceive
wo provincesort (F(2,1232)=
erences.
Classroom Le
the classrooic achieve
ned previous
(Fraser, 1981nsisted of 3
environments
e English Cl
in northeasteg environmen
three ECLEI
232)=5.81, p<
tudents from
e positivelyH) or Jilin
d Organisati
. There was.14, p=0.87).
arning Envir
learning envent were inv
y, an eight-it
), was used to8 Grade 11
in high
ssroom
rn Chinats. There
scales of
.05) and
Liaoning
than the province
on more
no clearFigure 2
nment
ironmentestigated
em scale
measurestudents.

8/18/2019 (Contemporary Approaches to Research
http://slidepdf.com/reader/full/contemporary-approaches-to-research 85/284
With
exami
It
and O
In pa
achiev
signifi0.001)
Figure
regard to the
ation scores
as found th
rgansiation sc
rticular, Tas
ement ( β =
cant associati. The results
3.
igure 3. Assoc
ENGLIS
measureme
were used.
at the Task
ales had a po
Orientatio
0.31, p < 0.
on betweenof structural
ations betweenac
CLASSROOM
t of academi
Orientation,
sitive impact
was positi
05), whereas
eacher Suppequation mod
the English cl hievement (n =
ENVIRONMEN
c achieveme
tudent Cohe
on students’
vely and si
there was a
rt and achieveling for achi
ssroom learni 308)
INVENTORY
t, students’
siveness, Co
cademic achi
nificantly r
negative, di
ement ( β = -evement are
g environment
IN CHINA
83
mid-year
peration
evement.
lated to
rect and
0.33, p <shown in
and
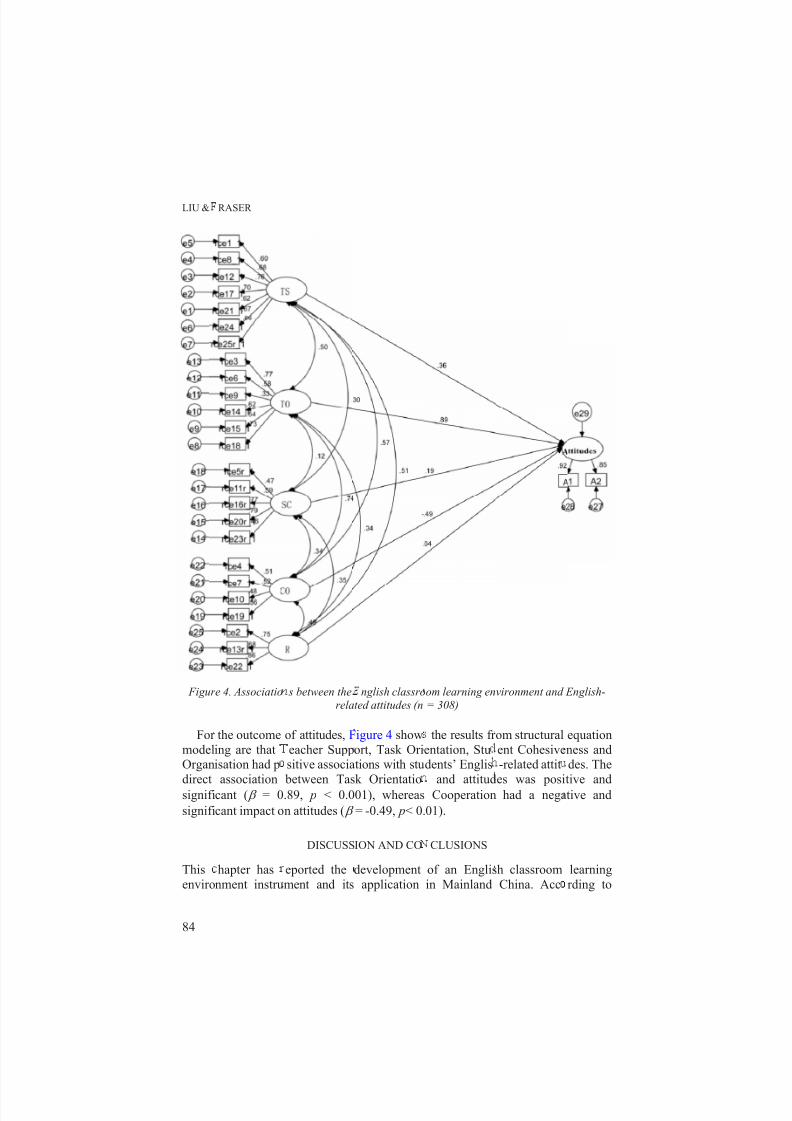
8/18/2019 (Contemporary Approaches to Research
http://slidepdf.com/reader/full/contemporary-approaches-to-research 86/284
LIU &
84
Figur
For
modelOrgan
directsignifi
signifi
This
enviro
RASER
e 4. Associatio
the outcome
ing are thatisation had p
associationcant ( β = 0
cant impact o
hapter has
nment instru
s between therela
of attitudes, F
eacher Suppsitive associa
between Tas.89, p < 0.0
n attitudes ( β
DISCUSS
eported the
ment and its
nglish classroted attitudes (n
igure 4 show
ort, Task Oritions with stu
k Orientatio01), whereas
= -0.49, p< 0.
ION AND CO
development
application
om learning en= 308)
the results fr
entation, Students’ Englis
and attitudCooperation
01).
CLUSIONS
of an Englis
in Mainland
vironment and
om structural
ent Cohesive-related attit
es was posi had a nega
h classroom
China. Acc
English-
equation
ness anddes. The
tive andtive and
learning
rding to
8/18/2019 (Contemporary Approaches to Research
http://slidepdf.com/reader/full/contemporary-approaches-to-research 87/284
ENGLISH CLASSROOM ENVIRONMENT INVENTORY IN CHINA
85
Moos’ (1979) scheme, human environment scales can be classified into three
general dimensions – relationship dimension, personal development dimension,
and system maintenance and system change dimension. The final version of the
ECLEI consists of 25 items in five scales that encompassed Moos’ three general
dimensions. Exploratory factor analysis and confirmatory factor analysis werecarried out to confirm the validity of the instrument. Cronbach’s alpha coefficient
was used as a measure of internal consistency reliability. Overall, the study results
supported the ECLEI’s factorial validity and reliability for assessing students’
perceptions of their English classroom in high schools in Mainland China.Our research revealed sex differences in students’ perceptions of their English
classroom learning environment. By and large, female students tended to havemore favourable perceptions of their classrooms environments than males,
especially in areas of Cooperation and Student Cohesiveness, which is basically in
line with past studies (Lim, 1995; Wong, Young, & Fraser, 1997). Our findings
also agree with Levine and Donitsa-Schmidt’s (1996) study of the classroom
environment which showed that female students had more positive perceptions ofthe Affiliation dimension. The present study also supported Aldridge, Fraser and
Huang’s (1999) findings that Taiwanese high school girls perceived their
classrooms more positively than boys. Our study also revealed that junior high school students tended to have
significantly more positive learning environment perceptions than senior high
school students, especially for the Teacher Support and Student Cohesiveness
dimensions. Interviews with some students in Grade 10 revealed that they receivedless help either from their teachers or their peers than they did when in junior high
school, and that students felt that classroom activities became less interesting. Thisfinding is in agreement with past studies that showed that students experienced less
cooperation and less favourable relationships with teachers when they moved fromelementary schools to junior high schools (Midgley, Eccles, & Fedlaufer, 1991).
This result suggests that there was a gap between students’ expectations and the
actual classroom environment when students progressed to high school. Further
research is needed to explore whether changes across the transition between levelsof schooling are caused by differences in students’ ages or by different teaching
strategies or teacher–student interactions.
Our findings revealed differences in students’ perceptions between provinces in the areas of Cooperation and Organisation. Students in Liaoning province
generally perceived more Cooperation than students in the other two provinces.
Students from Jilin province perceived higher levels of Organisation. The research
question that is worth further exploring is whether these provincial differences arecaused by the development of the economy or the distribution of the teaching
resources and facilities.
It was found that some factors of the English classroom learning environment
can significantly predict students’ academic achievement and attitudes towardsEnglish. In particular, Task Orientation could predict students’ achievement
and attitudes towards English and attitudes towards English was a mediator
between students’ perceptions of English classroom environment and their

8/18/2019 (Contemporary Approaches to Research
http://slidepdf.com/reader/full/contemporary-approaches-to-research 88/284
LIU & FRASER
86
academic achievement. The present study provided evidence to support the
assertion that students’ perceptions of classroom learning environment affect their
achievement and attitudes, which is consistent with considerable prior research
(Fraser, 2012).
It is interesting to note that Teacher Support was negatively related to students’academic achievement, which is inconsistent with most previous studies with the
exception of one study that revealed the teacher support had a negative impact on
academic results in Chinese, English and Mathematics (Lee, Lee, & Wong, 2003).
Cooperation had a negative association with students’ English-related attitudesin our study. Through interviews, some teachers revealed that they believed that
independent learning was very important for senior high school students; the moresupport that teachers offer, the more that students would rely on them. However, if
some students don’t know how to study independently, this would negatively
influence students’ achievement. Through classroom observation, researchers
found cooperation was often promoted through group work in the English class;
but the results of group work generally were reported by only one dominantstudent in a group, while the other members of the group normally kept silent and
depended on the active group member. Offering appropriate support to students,
enhancing teacher support based on improving teachers’ professional knowledge,
and organising classroom group work activities to promote cooperation effectivelyare some practical recommendations that flow from our research.
Our study is pioneering in that it involved developing a questionnaire to assess
students’ perceptions of their English classroom learning environment in highschools in China and exploring associations between the English classroom
learning environment and student achievement and attitudes. Few past studies haveinvestigated these questions in China. Another practical contribution made by the
present study is that English teachers can use the newly-developed classroomenvironment instrument to assess students’ perceptions of their classroom learning
environment to guide improvements in their classroom environments using
approaches described by Aldridge, Fraser, Bell and Dorman (2012).
Finally, our research is one of a relatively small number of studies that has usedstructural equation modeling in investigating associations between the nature of the
classroom environment and student learning outcomes.
APPENDIX A
English Classroom Learning Environment Inventory (ECLEI)
Directions
This questionnaire contains statements that could take place in your English class.
It describes how often each practice happens in your English class. Please give ananswer for each question. There is no right or wrong answer. Your opinions are
welcome. Your responses will be confidential.
Draw a circle around:1 if the practice Almost Never takes place

8/18/2019 (Contemporary Approaches to Research
http://slidepdf.com/reader/full/contemporary-approaches-to-research 89/284
ENGLISH CLASSROOM ENVIRONMENT INVENTORY IN CHINA
87
2 if the practice Seldom takes place
3 if the practice takes place Sometimes
4 if the practice takes place Often
5 if the practice takes place Almost Always
My English Class
Almost Never
Seldom Sometimes OftenAlmostAlways
1. Our English
teacher likes us.1 2 3 4 5
2. Our English classis very orderly.
1 2 3 4 5
3. I pay attention
during Englishclasses.
1 2 3 4 5
4. Most students co-
operate equally with
other class members.
1 2 3 4 5
5. Students in my
class like to fight.1 2 3 4 5
6. I am ready to startthis class on time.
1 2 3 4 5
7. I work with other
students in this class.1 2 3 4 5
8. Our English
teacher is good atteaching.
1 2 3 4 5
9. I know what Ishould accomplish in
this class.
1 2 3 4 5
10. Most students co-
operate rather thancompete with one
another.
1 2 3 4 5
11. Certain students
don’t like to get on
well with others.
1 2 3 4 5
12. Our Englishteacher is our friend.
1 2 3 4 5
13. Our English Class
is disorganized.
1 2 3 4 5
14. I know the goal
for this class.1 2 3 4 5
15. I can finish my
English homework on
time.
1 2 3 4 5
16. Some students
don’t like others in
my class.
1 2 3 4 5

8/18/2019 (Contemporary Approaches to Research
http://slidepdf.com/reader/full/contemporary-approaches-to-research 90/284
LIU & FRASER
88
17. Our English
teacher pays attention
to our questions.
1 2 3 4 5
18. I will try to
accomplish the
assignments in
English class.
1 2 3 4 5
19. I share my books
and resources with
other students when
doing English
assignments.
1 2 3 4 5
20. Certain studentsin my class are mean.
1 2 3 4 5
21. Our English
teacher encourages us
to raise questions in
class.
1 2 3 4 5
22. Our English class
is well organized.1 2 3 4 5
23. Certain students
work only with close
friends.
1 2 3 4 5
24. Our English
teacher will accept
our opinions.
1 2 3 4 5
25. Our English
teacher rarely talkswith us.
1 2 3 4 5
Refer to Table 1 to identify which of the 25 items belong to each of the five ESCLEI scales.
REFERENCES
Afari, E., Aldridge, J. M., Fraser, B. J., & Khine, M. S. (2013). Students’ perceptions of the learning
environment and attitudes in game-based mathematics classrooms. Learning Environments
Research, 16, 131-150.
Aldridge, J. J., Fraser, B. J., Bell, L., & Dorman, J. P. (2012). Using a new learning environment
questionnaire for reflection in teacher action research. Journal of Science Teacher Education, 23,
259-290.
Aldridge, J. M., Fraser, B. J., & Huang, I. T. C. (1999). Investigating classroom environments in Taiwan
and Australia with multiple research methods. Journal of Educational Research, 93, 48-62.
Fraser, B. J. (1981). Test of Science-Related Attitudes (TOSRA). Melbourne: Australian Council for
Educational Research.
Fraser, B .J. (1998). Science learning environments: Assessment, effects and determinants. In B. J.
Fraser & K. G. Tobin (Eds.), International handbook of science education (pp. 527-564). Dordrecht,
the Netherlands: Kluwer.
Fraser, B. J. (2007).Classroom learning environments. In S. K. Abell & N. G. Lederman (Eds.),
Handbook of research on science education (pp. 103-124). London: Taylor & Francis.

8/18/2019 (Contemporary Approaches to Research
http://slidepdf.com/reader/full/contemporary-approaches-to-research 91/284
ENGLISH CLASSROOM ENVIRONMENT INVENTORY IN CHINA
89
Fraser, B. J. (2012). Classroom learning environments: Retrospect, context and prospect. In B. J. Fraser,
K. G. Tobin & C. J. McRobbie (Eds.), Second international handbook of science education (pp.
1191-1239). New York: Springer.
Fraser, B. J., & Fisher, D. L. (1982). Predicting students’ outcomes from their perceptions of classroom
psychosocial environment. American Educational Research Journal, 19, 498-518.
Huang, I. T. C., Aldridge, J. M., & Fraser, B. J. (1998). A cross-national study of perceived classroom
environments in Taiwan and Western Australia: Combining quantitative and qualitative approaches.
Chinese Journal of Science Education, 6, 343-362.
Jiang, G. (2004). Class environment in the Chinese school system: Structure and measurement.
Psychological Science, 27 , 839-843.
Lee, C.-K. J., Lee, L.-M. F., & Wong, H.-W. (2003). Development of a classroom environment scale in
Hong Kong. Educational Research and Evaluation, 9, 317-344.
Levine, T., & Donitsa-Schmidt, S. (1996). Classroom environment in computer-integrated scienceclasses: Effects of gender and computer ownership. Research in Science and Technological
Education, 14,163-78.
Lightburn, M. E., & Fraser, B. J. (2007). Classroom environment and student outcomes among students
using anthropometry activities in high school science. Research in Science and Technological
Education, 25, 153-166.
Lim, T. K. (1995). Perceptions of classroom environment, school types, gender and learning styles of
secondary school students. Educational Psychology, 15, 161-169.
Liu, L., Ma, Y., & Liu, Y. (2009). A review on Western classroom measurement instrument research .
Studies in Foreign Education, 5, 17-23.
Macaulay, D. J. (1990). Classroom environment: A literature review. Educational Psychology, 10, 239-
253.
Midgley, C., Eccles, J. S., & Feldlaufer, H. (1991). Classroom environment and the transition to junior
high school. In B. J. Fraser & H. J. Walberg (Eds.), Educational environments: Evaluation,
antecedents and consequences (pp. 113-139). London: Pergamon.
Moos, R. H. (1979). Educational climates. In H. J. Walberg (Ed.), Educational environments andeffects: Evaluation, policy and productivity (pp. 79-100). Berkeley, CA: McCtuchan Publishing
Corporation.
Nix, R. K., Fraser, B. J., & Ledbetter, C. E. (2005). Evaluating an integrated science learning
environment using the Constructivist Learning Environment Survey. Learning Environments
Research, 8, 109-133.
She, H. C. (1998). The development and validation of the teacher-student interaction questionnaire in
the secondary science classroom learning environment. Chinese Journal of Science Education, 6 ,
403-416.
Wong, A. F. L., Young, D. J., & Fraser, B. J. (1997). A multilevel analysis of learning environment and
student attitudes. Educational Psychology, 17 , 449-468.
Wubbels, T., & Brekelmans, M. (2012). Teacher–student relationships in the classroom. In B. J. Fraser,
K. G. Tobin & C. J. McRobbie (Eds.), Second international handbook of science education (pp.
1241-1255). New York: Springer.
Liyan Liu Northeast Normal University, China
Barry J. FraserCurtin University, Australia

8/18/2019 (Contemporary Approaches to Research
http://slidepdf.com/reader/full/contemporary-approaches-to-research 92/284
M.S. Khine (ed.), Application of Structural Equation Modeling in Educational Research and
Practice, 91–114.
© 2013 Sense Publishers. All rights reserved.
ERNEST AFARI
5. THE EFFECTS OF PSYCHOSOCIAL LEARNING
ENVIRONMENT ON STUDENTS’ ATTITUDES
TOWARDS MATHEMATICS
BACKGROUND
Learning Environments
Students spend up to 20,000 hours at educational institutions by the time they
finish university (Fraser, 2001). Therefore, students’ observations of and reactions
to, their experiences in school – specifically their learning environments – are ofsignificance. The term learning environment refers to the social, physical,
psychological and pedagogical context in which learning occurs and which affects
student achievement and attitudes (Fraser, 2007, 2012).
The notion of a learning environment existed as early as 1936 when Lewin proposed that both the environment and its interaction with personal characteristics
of the individual are potent determinants of human behaviour. To this end, he
developed the formula B = f (P, E) in which behaviour (B) is a result of theinteraction between the person (P) and environmental factors (E). Murray (1938)
identified that Lewin’s formula did not take into account the personal needs of anindividual. To address this shortcoming he proposed a needs-press model in which
an individual’s behaviour is affected internally by characteristics of personality(needs) and externally by the environment itself (press). Personal needs refers to
motivational personality characteristics representing tendencies to move in the
direction of certain goals, while environmental press provides an external
situational counterpart which supports or frustrates the expression of internalised personality needs.
Results of studies conducted over the past 40 years have provided convincing
evidence that the quality of the classroom environment in schools is a significantdeterminant of student learning (Fraser, 2007, 2012). That is, students are likely to
learn better when they perceive their classroom environment positively (Dorman &
Fraser, 2009; Velayutham & Aldridge, 2012). Many of these studies have
controlled for background variables with students’ perceptions of the classroomenvironment accounting for appreciable amounts of variance in learning outcomes,
often beyond that attributable to background student characteristics (Dorman &
Fraser, 2009).
Recent studies have substantiated this position. For example, using a modifiedWhat Is Happening In this Class? (WIHIC), Opolot-Okurut (2010) established
associations between students’ perceptions of their mathematics classroom

8/18/2019 (Contemporary Approaches to Research
http://slidepdf.com/reader/full/contemporary-approaches-to-research 93/284
AFARI
92
learning environment and motivation among a sample of 81 secondary school
students in two schools in Uganda, Africa. Kerr, Fisher, Yaxley and Fraser (2006)
established positive relationships between classroom environment and attitudinal
outcomes in Australian science classes. Associations with students’ cognitive and
affective outcomes have been established, using the Science LaboratoryEnvironment Inventory (SLEI), for a sample of approximately 80 senior high-
school chemistry classes in Australia (Fraser & McRobbie, 1995), 489 senior high-
school biology students in Australia (Fisher, Henderson & Fraser, 1997) and 1,592
grade 10 chemistry students in Singapore (Wong & Fraser, 1996).In California, USA, Ogbuehi and Fraser (2007) found associations between
perceptions of classroom learning environment and students’ attitudes tomathematics and conceptual development among a sample of 661 middle-school
students in 22 classes using modified versions of the What Is Happening In this
Class? (WIHIC), Constructivist Learning Environment Survey (CLES) and Test of
Mathematics Related Attitudes (TOMRA).
In Singapore, Teh and Fraser (1995) established associations between classroomenvironment, achievement and attitudes among a sample of 671 high-school
geography students in 24 classes using an instrument suited for computer-assisted
instruction classrooms. Fisher, Henderson and Fraser (1995) used the
Questionnaire on Teacher Interaction (QTI) to establish associations betweenstudent outcomes and perceived patterns of teacher-student interaction for samples
of 489 senior high-school biology students in Australia.
Wong, Young and Fraser (1997) investigated associations between three studentattitude measures and a modified version of the SLEI involving 1,592 grade 10
students in 56 chemistry classes in Singapore. In India, Koul and Fisher (2006)found positive associations between scales of the What Is Happening In this Class?
(WIHIC) questionnaire and students’ attitude towards science. Similarly, Telli,Cakiroglu and den Brok (2006) found positive associations between scales of the
WIHIC and students’ attitude to biology in Turkish high schools. Telli, den Brok
and Cakiroglu (2010) investigated the associations between teacher-student
interpersonal behaviour and students’ attitudes to science using the QTI with anattitude questionnaire for a sample of 7,484 grade 9-11 students from 278 classes
in 55 public schools in 13 major Turkish cities. Their results revealed that the
influence dimension of the QTI was related to student enjoyment, whilst the proximity dimension was associated with attitudes to inquiry.
Kyriakides (2006) administered the QTI (Wubbels & Levy, 1993) to elementary
school students in Cyprus and established positive links between teacher
interaction and affective outcomes. Other environment-outcomes studies haveinvestigated school-level environments and student outcomes in mathematics
(Webster & Fisher, 2004), the relationship between learning environments, family
contexts, educational aspirations and attainment (Marjoribanks, 2004). Some
researchers have also investigated the relationship between learning environment,attitudes and achievement in middle schooling science classes (Wolf & Fraser,
2008); mathematics classroom environment and academic efficacy (Dorman,

8/18/2019 (Contemporary Approaches to Research
http://slidepdf.com/reader/full/contemporary-approaches-to-research 94/284
EFFECTS OF PSYCHOSOCIAL LEARNING ENVIRONMENT
93
2001); and school and classroom environment and teacher burnout (Dorman,
2003a).
Confirmatory factor analysis and structural equation modeling have been
employed in recent learning environments studies. Dorman (2003b) employed
LISREL to establish the factorial invariance of the WIHIC according to country,gender and year of student. Den Brok, Fisher, Wubbels, Brekelmans and Rickards
(2006) performed multigroup confirmatory factor analysis on Questionnaire on
Teacher Interaction (QTI) data collected in Singapore, Brunei and Australia.
Aldridge, Dorman and Fraser (2004) used multitrait-multimethod modeling tovalidate actual and preferred forms of the Technology-Rich Outcomes-Focused
Learning Environment Inventory (TROFLEI). Their results provided strongevidence of the sound psychometric properties of the TROFLEI. Structural
equation modeling and multilevel modeling have advanced the data analysis
techniques employed in the field of learning environments (see: den Brok,
Brekelmans, & Wubbels, 2006; den Brok, Fisher, Rickards, & Bull, 2006;
Dorman, Fisher, & Waldrip, 2006; Dorman & Fraser, 2009; Fisher, Waldrip, &den Brok, 2005; Velayutham & Aldridge, 2012).
Dorman and Fraser (2009) used structural equation modeling to develop a
comprehensive model representing the relationships among classroom
environment, its antecedents and outcomes. In a more recent study, Velayuthamand Aldridge (2012) used structural equation modeling to investigate the influence
of psychosocial aspects of classroom environment on students’ motivation and
self-regulation in the area of science learning. Their results suggested that studentcohesiveness, investigation and task orientation were the most influential
predictors of student motivation and self-regulation in science learning.In another recent study, Velayutham, Aldridge and Fraser (2012) used multi-
group structural equation modeling analysis to examine gender differences instudent motivation and self-regulation in science learning. Their study revealed
that the influence of task value on self-regulation was statistically significant for
boys only.
My study investigated the effects psychosocial features of the classroomenvironment (Teacher Support, Involvement and Personal Relevance) on students’
enjoyment of mathematics lessons and academic self-efficacy in mathematics
learning in the United Arab Emirates, using structural equation modeling.
Students’ Attitudes
The conceptions, attitudes and expectations of students regarding mathematics andmathematics teaching are considered to be significant factors underlying theirschool experience and achievement (Borasi, 1990; Reed, Drijvers, & Kirschner,
2010). In reviewing the issue of students’ attitudes towards mathematics,
Westwood (2000, p. 31) cites the work of Wain who painted a rather dark image ofmathematics:

8/18/2019 (Contemporary Approaches to Research
http://slidepdf.com/reader/full/contemporary-approaches-to-research 95/284
AFARI
94
Many intelligent people after 1500 hours of instruction over eleven years of
schooling still regard mathematics as a meaningless activity for which they
have no aptitude. It is difficult to imagine how a subject could have achieved
for itself such an appalling image as it now has in the popular mind to think
that all our effort has led to a situation of fear.
While this picture of mathematics is not a pleasant one, it represents a ‘wake-upcall’ for all of those involved in the teaching of mathematics (Swan, 2004). Davis
(1993, p. 1) goes further when he states that:
Some students seem naturally enthusiastic about learning, but many need-or-expect their instructors to inspire, challenge, and stimulate them. Whatever
level of motivation your students bring to the classroom, will be transformed,
for better or worse, by what happens in that classroom.
Learning clearly has an affective component and, according to Kind, Jones and
Barmby (2007), developing a positive attitude is important for students’achievement. One definition that is commonly used to describe attitudes includes
the three components of cognition, affect and behaviour (Kind et al., 2007;
Rajecki, 1990). These three components are defined by Reid (2006, p. 4) as “aknowledge about the object, or the beliefs and ideas component (cognitive); a
feeling about the object, or the like or dislike component (affective); and a
tendency towards action, or the objective component (behavioural)”.
As Kind et al. (2007) point out, this definition is a sensible view of attitudes
because these components are closely linked. For example, we know about
mathematics (cognitive) and therefore we have a feeling or an opinion about it(affective) that may cause us to take a particular action (behavioural). Other
researchers have suggested that the three components should be treated more
independently, and that attitudes should be viewed as basis for evaluative judgements (Ajzen, 2001; Crano & Prislin, 2006). According to Kind et al. (2007)
when we have an attitude, we judge something along emotional dimensions, such
as good or bad, harmful or beneficial, pleasant or unpleasant, important orunimportant. Crano and Prislin (2006) point out that it is important to notice that
these evaluative judgements are always towards something, often called the
attitude object. Although some researchers have defined attitudes solely in terms of
the affective component (George, 2000; Germann, 1988), Fishbein and Ajzen
(1975) viewed attitudes as being formed spontaneously and, inevitably, involvingthe attributes of an object. Attitudes or the affective component of attitudes,
therefore, are linked to the beliefs that a person holds (Kind et al., 2007). It is with
this in mind that the definition for attitude, used for my study, is the feelings that a person has about an object, based on their beliefs about that object.
When children start school, their attitude towards learning is derived primarily
from their home environment (Lumsden, 1994). However, success or failure in theclassroom impacts on these initial attitudes and is shaped by early school
experiences which, in turn, impact on subsequent classroom situations (Lumsden,
1994; Reynolds & Walberg, 1992). In addition, students’ attitudes are affected by
their interactions with their peers (Fishbein & Ajzen, 1975; Reynolds & Walberg,

8/18/2019 (Contemporary Approaches to Research
http://slidepdf.com/reader/full/contemporary-approaches-to-research 96/284
EFFECTS OF PSYCHOSOCIAL LEARNING ENVIRONMENT
95
1992; Taylor, 1992). Positive and negative experiences of school activities produce
learned responses which may then impact on students’ attitudes as they get older
(Dossey, Mullis, Lindquist, & Chambers, 1988).
Students’ attitudes towards mathematics influence the extent to which learning
outcomes are realised (Reed et al., 2010). One aspect of my study involveddetermining the effects of teacher support, involvement and personal relevance on
students’ attitudes towards mathematics, in particular, their enjoyment of
mathematics lessons and academic self-efficacy.
Academic Self-efficacy
More than three decades ago, Bandura (1977) theorised that a potent influence on
student behaviour is the beliefs that they hold about their capabilities. According tosocial cognitive theory, students are more likely to have an incentive to learn if
they believe that they can produce the desired outcomes (Bandura, 1986). Hence,
self-efficacy beliefs are powerful predictors of the choices that students make, theeffort that they expend and their persistence in facing difficulties. Furthermore,
aside from task value, a major motivational component of expectancy-value theory
is ones self-efficacy beliefs. In their expectancy-value theory, Eccles and Wigfield
(2002) envisage the direct influence of students’ expectation beliefs on both
achievement-related choices and performance. Furthermore, according to Pajares
(2002), self-efficacy is intimately related to students’ self-regulated learning.Students with high efficacy are more likely to put in more effort, consistently
evaluate their progress and apply self-regulatory strategies (Schunk & Pajares,
2005).Velayutham, Aldridge and Fraser (2011) examined the influence of motivational
constructs (learning goal orientation, task value and self-efficacy) in science
learning on students’ self-regulation in science classrooms involving 1360 sciencestudents in grades 8, 9 and 10 in Perth, Australia. Their results revealed that
motivational beliefs of learning goal orientation, task value and self-efficacy
significantly influenced students’ self-regulation in science learning.
Previous research has established that self-efficacy is a predictor of academic
achievement (Bandura, 1997; Edman & Brazil, 2007; Gore, 2006; Hsieh, Sullivan,& Guerra, 2007; Tyler & Boelter, 2008) and influences academic motivation and
learning (Adeyemo, 2007; Pajares, 1996). Researchers have demonstrated that self-
efficacy beliefs predict students’ mathematics performances (Bandura, 1986;Pajares, 1996; Schunk, 1991). Interestingly, Pajares and Kranzler (1995) found that
the influence of self-efficacy on mathematics performance was as strong as was theinfluence of general mental ability.
About 13 years ago, Lorsbach and Jinks (1999) brought to the attention of
learning environment researchers, the influence of classroom environment on
academic efficacy. According to Lorsbach and Jinks (1999), student self-efficacy beliefs regarding academic performance can have important implications for
improving learning environments and student outcomes. Additionally, focusing on
students’ academic self-efficacy could alter student perceptions of the learning

8/18/2019 (Contemporary Approaches to Research
http://slidepdf.com/reader/full/contemporary-approaches-to-research 97/284
AFARI
96
environment. Dorman (2001) and Dorman and Adams (2004) took up this
challenge and established the relationship between students’ academic efficacy and
classroom environment. Using simple and multiple correlation analyses, their
results indicate that the mathematics classroom environment is positively related to
student academic efficacy.A study of classroom environment, perceptions of assessment tasks, academic
efficacy and attitude to science revealed significant links between classroom
environment and academic efficacy (Dorman & Fraser, 2009). A more recent study
of Velayutham and Aldridge (2012) identified aspects of the psychosocial learningenvironment that influence student motivation (including self-efficacy). Their
results suggested that the student cohesiveness, task orientation and investigationwere the most influential predictors of student self-efficacy.
One premise of my study was that student self-efficacy beliefs regarding
competence could have important implications for improving learning
environments and therefore, student outcomes (Aldridge & Fraser, 2008; Lorsbach
& Jinks, 1999, Velayutham & Aldridge, 2012). Hence my study aimed toinvestigate whether associations exist between students’ enjoyment and self-
efficacy and their perceptions of the learning environment.
AIMS OF THE STUDY
The study described in this chapter was carried out to investigate whether three psychosocial features of the classroom environment (teacher support, involvement
and personal relevance) can influence students’ enjoyment of mathematics lessons
and academic self-efficacy in mathematics learning in the United Arab Emirates,using structural equation modeling.
METHOD
Participants
The participants for this study were 352 first and second year mathematics students
attending three colleges in the United Arab Emirates. Among the participants, 231
(66%) were female and 121 (34%) were male. The participants’ age ranges from18 to 35 years. About 90% of the students were United Arab Emirates nationals
and the rest were from the neighbouring Arab countries. The questionnaire was
administered at the middle of the semester. Participants completed the
questionnaires in their classrooms during normal school hours. I distributed thequestionnaire, explained the procedure, and answered students’ clarifications. The
students took approximately 20 minutes to complete the questionnaires and
participation was voluntary.

8/18/2019 (Contemporary Approaches to Research
http://slidepdf.com/reader/full/contemporary-approaches-to-research 98/284
EFFECTS OF PSYCHOSOCIAL LEARNING ENVIRONMENT
97
Variables in the Model
I adapted the Teacher Support scale, consisting of eight items, from a widely used
learning environment instrument: The What is Happening in This Classroom
(WIHIC; Aldridge, Fraser, & Huang, 1999). The Teacher Support scale assessesthe extent to which the teacher helps, relates to, trusts and is interested in students.
The teacher’s relationship with his or her students is an important aspect of any
learning environment, and it can lead the student to love or hate a subject, and to be inspired or turned away from learning. The supportiveness of a teacher helps to
give students the courage and confidence needed to tackle new problems, take risks
in their learning, and work on and complete challenging tasks. If students consider
a teacher to be approachable and interested in them, then they are more likely toseek the teacher’s help if there is a problem with their work. The teacher’srelationship with his or her students, in many ways, is integral to a student’s
success and to creating a cooperative learning environment (Hijzen, Boekaerts, &
Vedder, 2007). The response format involves a five-point frequency scaleconsisting Almost Always, Often, Sometimes, Seldom and Almost Never. A
typical item is “The teacher helps me when I have trouble with the work”. In my
study, the internal consistency (Cronbach’s alpha) of the Teacher Support scalewas 0.89 and considered an internally reliable scale.
The Involvement scale assesses the extent to which students feel that they have
opportunities to participate in discussions and have attentive interest in what ishappening in the classroom. The Involvement scale assumes that language plays an
important part in helping students to understand what they are learning (Taylor &
Campbell-Williams, 1993) and that giving students the opportunity to participatein classroom discussions and to negotiate ideas and understandings with peers,
rather than listening passively, is an important aspect of the learning process. The
response format involves a five-point frequency scale consisting Almost Always,Often, Sometimes, Seldom and Almost Never. Typical item is “I explain my ideas
to other students”. In my study, the internal consistency (Cronbach’s alpha) of the
Involvement scale was 0.87 and considered an internally reliable scale. The Personal Relevance scale, consisting of eight items, was adapted from the
Constructivist Learning Environment Survey (CLES; Taylor, Fraser and Fisher1997). To ensure that students engage in their learning, it is necessary for teachers
to make mathematical content relevant to students’ lives outside school (Nicol,
2002; Taylor et al., 1997). The Personal Relevance scale assesses the
connectedness of a subject with students’ out-of-school experiences. The response
format involves a five-point frequency scale consisting Almost Always, Often,Sometimes, Seldom and Almost Never. Typical item is “This class is relevant tomy life outside college”. In my study, the internal consistency (Cronbach’s alpha)
of the Personal Relevance scale was 0.89 and considered an internally reliable
scale.The eight-item Academic self-efficacy scale was based on Jinks and Morgan
(1999) Student Efficacy Scale (MJSES). The Academic self-efficacy scale assesses
the extent to which students have confidence in their academic competence. A

8/18/2019 (Contemporary Approaches to Research
http://slidepdf.com/reader/full/contemporary-approaches-to-research 99/284
AFARI
98
student’s self-efficacy positively affects engagement and effort and is important to
learning (Aldridge & Fraser, 2008; Bandura, 1989; Velayutham, Aldridge, &
Fraser, 2011; Zimmerman, Bandura, & Martinez-Pons, 1992). The responsealternatives for each item are Almost Always, Often, Sometimes, Seldom and
Almost Never. Examples of items are “I find it easy to get good grades in
mathematics” and “I feel that I am an intelligent student”. In my study, the
Cronbach alpha reliability for the academic self-efficacy scale was 0.93 and
considered an internally reliable scale.
The Enjoyment of Mathematics Lessons scale, consisting of eight items, wasadapted from one scale in the Test of Science-Related Attitudes (TOSRA; Fraser,
1981) by Spinner and Fraser (2005). The Enjoyment of Mathematics Lessons scaleassesses the extent to which students enjoy their mathematics lessons. The
response alternatives for each item are Almost Always, Often, Sometimes, Seldom
and Almost Never. Examples of items are “Lessons in mathematics are fun” and “Ienjoy the activities that we do in mathematics”. In my study, the Cronbach alpha
reliability for the enjoyment of mathematics lessons scale was 0.95 and considered
an internally reliable scale. My results for the sound internal consistency reliabilityof the three learning environment scales (teacher support, involvement and person-
al relevance) and the two attitude scales (enjoyment of lessons and academic self-
efficacy), when used with college students in the United Arab Emirates, replicates past research (Afari, Aldridge, Fraser, & Khine, 2013; Aldridge & Fraser, 2008;
Fraser, Aldridge, & Adolphe, 2010; MacLeod & Fraser, 2010). Table 1 provides a
scale description and sample item for each of the scales used in my study.
Table 1. Scale description and sample item for each of the questionnaireused in the study
Scale Description Sample Item
Learning
Environment
The extent to which …
Teacher Support the teacher helps, befriends and is
interested in students.
The teacher helps me when I
have trouble with the work.Involvement students have attentive interest,
participate in discussions and
enjoy the class.
I explain my ideas to otherstudents.
PersonalRelevance
there is a link between what istaught and students’ out of schoolexperiences.
This class is relevant to mylife outside college.
Attitudes
Enjoyment ofMathematicsLessons
students enjoy their mathematicslessons. Lessons in mathematics arefun.
Academic Self-
Efficacy
students have confidence in their
academic competence.
I find it easy to get good
grades in mathematics.
Note: All items used the response alternatives of Almost Always, Often, Sometimes,Seldom and Almost Never.

8/18/2019 (Contemporary Approaches to Research
http://slidepdf.com/reader/full/contemporary-approaches-to-research 100/284
EFFECTS OF PSYCHOSOCIAL LEARNING ENVIRONMENT
99
Model and Analysis
Researchers now have many sophisticated methodological tools to analyse
nonexperimental data. Structural equation modeling or path analysis is an
especially appropriate method for analysis of causal relations in nonexperimentaldata (Cohen & Cohen, 1983; Keith, 1993). In path analysis, the researcher
develops a model of hypothesized causes and effects based on previous research
and theory. Latent variable structural equation modeling is different from ordinary path analysis in that it uses measured variables (generally multiple indicators) to
infer latent variables (Singh, 1998). Latent variables equate to “factors” in factor
analytic techniques (Arbuckle & Wothke, 1999; Byrne, 2010; Joreskog, 1977;
Kline, 2010; Ullman, 2001). Latent variable structural equation modeling carriesout confirmatory factor analysis and path analysis of the latent factors
simultaneously.
Structural equation models are either recursive or nonrecursive. Recursivemodels have unidirectional “causal” relationships (Arbuckle & Wothke, 1999;
Byrne, 2010; Kline, 2010; Ullman, 2001) and an independent error terms (Kline,
2010; Ullman, 2001). Nonrecursive models have bidirectional “causal”relationships, that is, feedback loops (Arbuckle & Wothke, 1999; Byrne, 2010;
Kline, 2010; Ullman, 2001) correlated error terms, or both (Kline, 2010; Ullman,
2001).
One advantage of latent variable models is that unobserved latent variables arerelatively free of measurement error and closely approximate the constructs of
interest. Another advantage of the method is that fit indices provided in the output
assess the adequacy of the model in explaining the data. These features makestructural equation modeling a rigorous method for estimating cause-effectrelationships in nonexperimental data.
I developed the initial model for my study on the basis of previous research and
theory, which is presented in Figure 1. The research model hypothesizes that eachof the three psychosocial aspects of the learning environment (teacher support,
involvement and personal relevance) would influence each of the two attitude
constructs (enjoyment of mathematics lessons and academic self-efficacy).
Additionally, academic self-efficacy is predicted to influence enjoyment ofmathematics lessons.
First, the measurement part of the model (construct and their indicators) was
specified and estimated, and then structural relationships in the model werespecified and estimated. I fully specified the factor pattern and specified the
relations among latent variables to arrive at a latent-variable structural equationmodeling. Latent variable structural equation modeling (SEM) makes it possible toestimate and test the measurement and structural parts of the model
simultaneously. Although cause-effect relationships can be ascertained with any
certainty only in experimental research, in nonexperimental research the estimationof cause-effect relationships is best done with structural equation modeling (SEM).
SEM is an especially appropriate method for analyzing nonexperimental data and
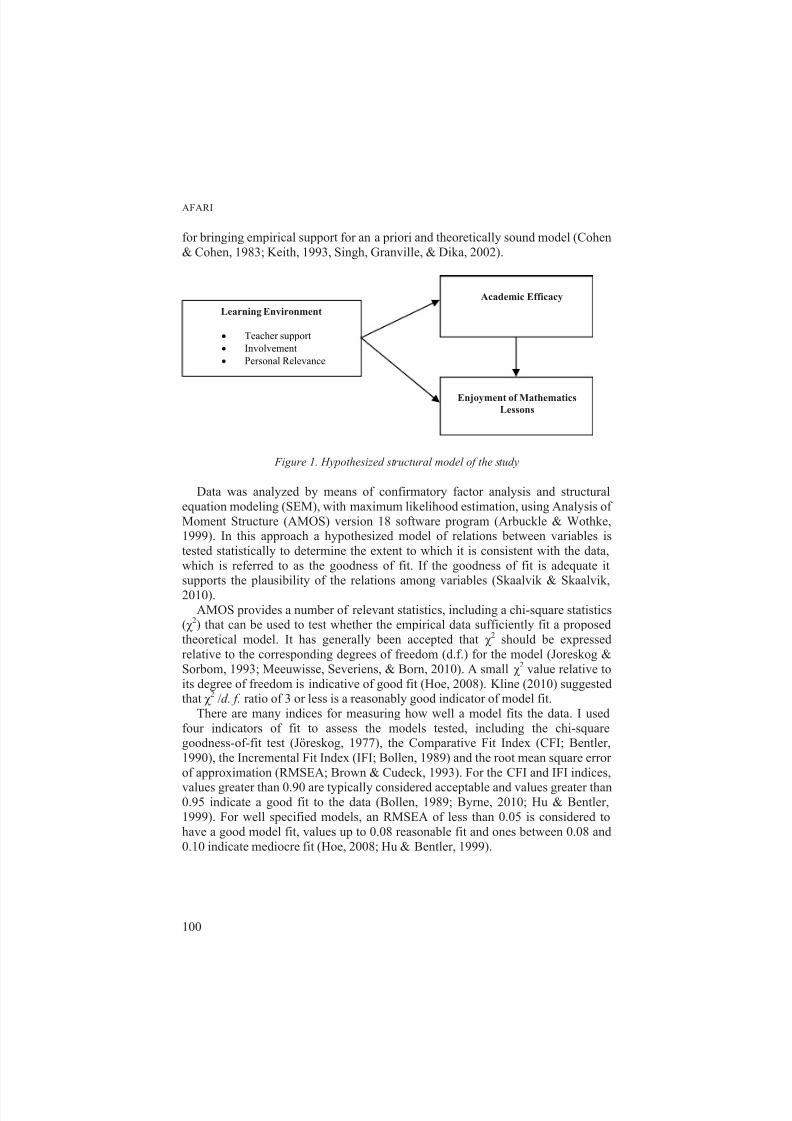
8/18/2019 (Contemporary Approaches to Research
http://slidepdf.com/reader/full/contemporary-approaches-to-research 101/284
AFARI
100
for bringing empirical support for an a priori and theoretically sound model (Cohen
& Cohen, 1983; Keith, 1993, Singh, Granville, & Dika, 2002).
Figure 1. Hypothesized structural model of the study
Data was analyzed by means of confirmatory factor analysis and structural
equation modeling (SEM), with maximum likelihood estimation, using Analysis of
Moment Structure (AMOS) version 18 software program (Arbuckle & Wothke,1999). In this approach a hypothesized model of relations between variables is
tested statistically to determine the extent to which it is consistent with the data,
which is referred to as the goodness of fit. If the goodness of fit is adequate itsupports the plausibility of the relations among variables (Skaalvik & Skaalvik,
2010).
AMOS provides a number of relevant statistics, including a chi-square statistics(χ
2) that can be used to test whether the empirical data sufficiently fit a proposed
theoretical model. It has generally been accepted that χ 2 should be expressed
relative to the corresponding degrees of freedom (d.f.) for the model (Joreskog &
Sorbom, 1993; Meeuwisse, Severiens, & Born, 2010). A small χ 2 value relative to
its degree of freedom is indicative of good fit (Hoe, 2008). Kline (2010) suggestedthat χ 2 /d. f. ratio of 3 or less is a reasonably good indicator of model fit.
There are many indices for measuring how well a model fits the data. I used
four indicators of fit to assess the models tested, including the chi-squaregoodness-of-fit test (Jöreskog, 1977), the Comparative Fit Index (CFI; Bentler,
1990), the Incremental Fit Index (IFI; Bollen, 1989) and the root mean square error
of approximation (RMSEA; Brown & Cudeck, 1993). For the CFI and IFI indices,
values greater than 0.90 are typically considered acceptable and values greater than0.95 indicate a good fit to the data (Bollen, 1989; Byrne, 2010; Hu & Bentler,
1999). For well specified models, an RMSEA of less than 0.05 is considered to
have a good model fit, values up to 0.08 reasonable fit and ones between 0.08 and
0.10 indicate mediocre fit (Hoe, 2008; Hu & Bentler, 1999).
Academic Efficacy
Learning Environment
• Teacher support
• Involvement
• Personal Relevance
Enjoyment of Mathematics
Lessons

8/18/2019 (Contemporary Approaches to Research
http://slidepdf.com/reader/full/contemporary-approaches-to-research 102/284
EFFECTS OF PSYCHOSOCIAL LEARNING ENVIRONMENT
101
RESULTS
First, I examined the descriptive statistics of the measurement items and assessed
the reliability and validity of the measures used in the study. This was followed by
testing for model fit and assessing the contributions and statistical significance of
the manifest variables’ path coefficients.
Descriptive Statistics
The descriptive statistics of the 5 constructs (teacher support, involvement, personal relevance, enjoyment of mathematics lessons and academic self-efficacy)
are shown in Table 2. All means were greater than 3.0, ranging from 3.58 to 4.02.This indicates an overall positive response to the constructs that are measured
in this study. The standard deviations for all the variables were less than one,ranging from 0.73 to 0.99, indicating that the item scores were relatively close to
the mean scores. The skewness ranged from -0.34 to -0.77 and kurtosis ranged
from -0.27 to 0.12. Following Kline’s (2010) recommendations that the skew and
kurtosis indices should be below an absolute value of 3.0 and 8.0, respectively, thedata in this study was regarded as normal for the purpose of structural equation
modeling.
Table 2. Descriptive statistics of teacher support, personal relevance, enjoyment
of mathematics lessons and academic self-efficacy
Construct Mean Standard
deviation
Skewness Kurtosis
Teacher Support 4.02 0.79 -0.77 0.12Involvement 3.66 0.73 -0.34 -0.47Personal Relevance 3.58 0.83 -0.44 -0.43
Enjoyment ofMathematics Lessons
3.61 0.99 -0.56 -0.61
Academic Efficacy 3.76 0.91 -0.65 -0.27
Convergent Validity
Fornell and Larcker (1981) proposed three procedures to assess for convergentvalidity of the measurement items in relation to their corresponding constructs.
These are (1) item reliability of each measure, (2) composite reliability of each
construct, and (3) the average variance extracted. The item reliability of an itemwas assessed by its factor loading onto the underlying construct. Hair, Black,
Babin, Anderson (2010) suggested that an item is significant if its factor loading isgreater than 0.50. Table 3 shows that the factor loadings of all the items in the
measure ranged from 0.536 (item PR2) to 0.918 (item EOM6). In this study, thecomposite reliability was used instead of the cronbach’s alpha because the latter
tends to understate reliability (Hair, et al., 2010). For the composite reliability to be
adequate, a value of 0.70 or higher was recommended (Nunnally & Bernstein,1994). The results (Table 3) show that all five constructs met the suggested
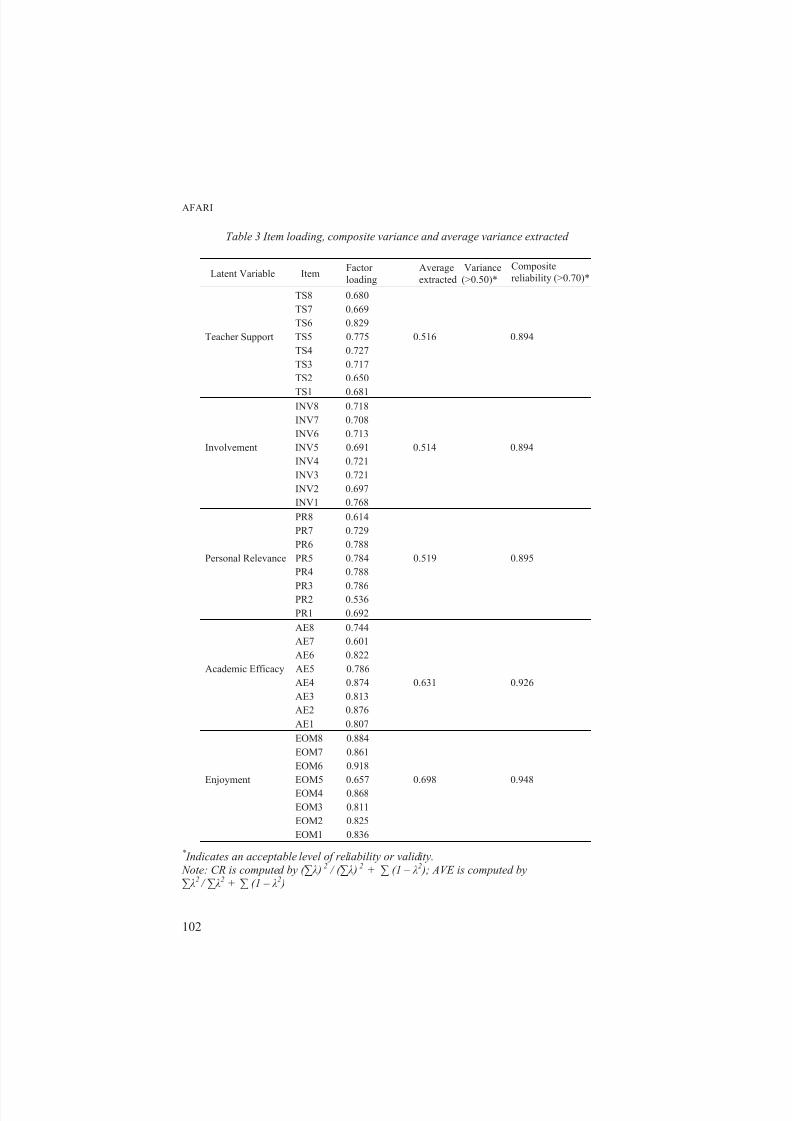
8/18/2019 (Contemporary Approaches to Research
http://slidepdf.com/reader/full/contemporary-approaches-to-research 103/284
AFARI
102
Table 3 Item loading, composite variance and average variance extracted
Latent Variable ItemFactor
loading
Average Variance
extracted (>0.50)*
Composite
reliability (>0.70)*
TS8 0.680
TS7 0.669
TS6 0.829
Teacher Support TS5 0.775 0.516 0.894
TS4 0.727
TS3 0.717
TS2 0.650
TS1 0.681INV8 0.718
INV7 0.708
INV6 0.713
Involvement INV5 0.691 0.514 0.894
INV4 0.721
INV3 0.721
INV2 0.697
INV1 0.768
PR8 0.614
PR7 0.729
PR6 0.788
Personal Relevance PR5 0.784 0.519 0.895
PR4 0.788
PR3 0.786PR2 0.536
PR1 0.692
AE8 0.744
AE7 0.601
AE6 0.822
Academic Efficacy AE5 0.786
AE4 0.874 0.631 0.926
AE3 0.813
AE2 0.876
AE1 0.807
EOM8 0.884
EOM7 0.861
EOM6 0.918
Enjoyment EOM5 0.657 0.698 0.948
EOM4 0.868
EOM3 0.811
EOM2 0.825
EOM1 0.836
* Indicates an acceptable level of reliability or validity.
Note: CR is computed by ( ∑λ ) 2 / ( ∑λ ) 2
+ ∑ (1 – λ
2 ); AVE is computed by
∑λ2 / ∑λ2 + ∑ (1 – λ2 )

8/18/2019 (Contemporary Approaches to Research
http://slidepdf.com/reader/full/contemporary-approaches-to-research 104/284
EFFECTS OF PSYCHOSOCIAL LEARNING ENVIRONMENT
103
minimum value of 0.70. The final criterion to satisfy convergent validity was the
measure of the average variance extracted (AVE). AVE is a measure that indicates
the amount of variance in the item that is explained by the construct. The results ofthe statistical analysis (Table 3) show that all of the AVE values were above the
suggested value of 0.5.
Therefore, the measurement model satisfied all three necessary criteria and
achieved convergent validity. Hence the results indicated that the items in each
construct were highly correlated and reliable.
Discriminant Validity
Discriminant validity assesses the degree to which the constructs differ from each
other. As suggested by Barclay, Higgins and Thompson (1995), I assessed thediscriminant validity by applying two analytical procedures. The first criterion of
discriminant validity was that the square root of average variance extracted (AVE)
for each construct is larger than the inter-construct correlation. The data analysisresults (Table 4) support the discriminant validity because for each construct, the
square root of the AVE is larger than inter-construct correlation. As stipulated by
Gefen, Straub and Boudreau (2000), the second discriminant validity criterion isachieved when the loading of an item within a construct is greater than its loading
in any other construct in the model. My results of cross-loading correlations show
that all items loaded higher in the construct that they are measuring than on anyother construct in the model. Therefore, the second criterion of the discriminant
validity was met. The two analyses confirmed that the individual constructs are
discriminated from each other by the instrument.
Table 4. Inter-construct correlations and square roots of average variance extracted
Construct TS PR INV EOM AE
Teacher Support (TS) 0.718
Personal Relevance (PR) 0.185** 0.720
Involvement (INV) 0.304** 0.242** 0.717
Enjoyment of Mathematics
Lesson (EOM)
0.237** 0.303** 0.305** 0.835
Academic Efficacy (AE) 0.117* 0.208** 0.136** 0.479** 0.794
*p< 0.05; **p< 0.01
Note: The bold elements in the main diagonal are the square roots of average variance
extracted
Model Fit
The examination of the fit indices is the first step in model evaluation because the
fit statistics help determine the adequacy of the model in explaining the data. The
fit indices compare the residual differences between the covariance matrix implied

8/18/2019 (Contemporary Approaches to Research
http://slidepdf.com/reader/full/contemporary-approaches-to-research 105/284
AFARI
104
by the model and the actual covariance matrix used to analyze the data (Singh &
Billingsley, 1998).
Using structural equation modeling (SEM) procedure with AMOS 18, I testedthe model in Figure 1 specifying three correlated latent variable; a second order
teacher support, involvement and personal relevance and also an academic efficacy
and enjoyment of mathematics lessons. AMOS generates a chi-square (χ 2)
statistics, associated degree of freedom (df) and a probability value whenever
maximum-likelihood estimates are computed. In addition, AMOS uses Hoelter’s
formula for critical N (CN) to estimate a sample size that would be sufficient toyield an adequate model fit for χ 2 test (Hu & Bentler, 1995). Both the .05 and
.01CN values for my hypothesized model were 202 and 209, respectively. Thesample size for this SEM analysis is 352.
The primary fit index is the chi-square value; for this model, χ 2 (249, N = 352)
=766.04, p<0.001. The significant value of the chi-square indicates a significantdifference between the input covariance matrix and covariance matrix implied by
the model and, thus suggesting that the fit of the data to the hypothesized model is
not entirely adequate. Although a significant chi-square value for the model
suggest a poor fit, it is important to examine the other fit indices. The fit indices for
the initial model are given in Table 5, from which it can be seen that this model did
not fit the data well (χ 2 = 1856.49, CFI = 0.90, IFI = 0.90, RMSEA = 0.07).
Table 5. Summary of fit indices
Index χ 2 df CFI IFI RMSEAInitial model 1856.49 730 0.90 0.90 0.07
Final Model 1372.34 724 0.93 0.93 0.05
Note: CFI = comparative index; IFI = incremental fit index; RMSEA = root-mean-squareof error of approximation.
In addition to the fit statistics, AMOS also provides the standardized and
unstandardized loadings with standard errors, critical ratio, and modification
indices to assess which aspects of the model are misspecified and, thus, can bemodified.
Examination of the modification indices suggests that estimation of some
correlated errors would improve the fit of the model. The correlated errorsindicated that some of these items shared specific variance that was not part of the
latent variable. Although modification indices pointed to the source of themisspecification, I attended to only those modifications which were theoretically
defensible; namely, the inclusion of six error covariance (namely, items PR5 and
PR6 of the personal relevance scale, items EOM1 and EOM2 and items EOM3 and
EOM4, both are items of the enjoyment of mathematics lessons scale, items AE3and AE8 of the academic self-efficacy scale, and both items INV7 and INV8 and
items INV1 and INV2 of the involvement scales). Items EOM1 and EOM2, and

8/18/2019 (Contemporary Approaches to Research
http://slidepdf.com/reader/full/contemporary-approaches-to-research 106/284
EFFECTS OF PSYCHOSOCIAL LEARNING ENVIRONMENT
105
Items EOM3 and EOM4 suggest redundancy due to content overlap. Item EOM1
asks if respondent looks forward to lessons in mathematics, whereas item EOM2
asks if respondent feels lessons in mathematics are fun. Clearly, there appears to bean overlap of content between these items. Similarly Item EOM3 asks respondent
if mathematics is one of their favourite school subjects, whereas item EOM4 asks
respondent if lessons in mathematics interest them. Again, there appears to be an
overlap of content between these items.
Also, Item INV1 asks if respondent discusses ideas in class, whereas Item INV2
asks if respondent gives his or her opinions during class discussions. There appearsto be a clear overlap of content. Finally, both Items AE3 and AE8 also suggest
redundancy due to content overlap. Item AE3 asks respondent if their friends askthem for help in mathematics, whereas item AE8 asks if respondent helps their
friends with their homework in mathematics. Clearly, there appears to be an
overlap of content between these items. These error covariances are explicable inrelation to content.
Table 6 reports the path coefficient and t -value for each hypothesized
relationship. The table indicates that 4 out the 7 possible relationships werestatistically significant ( p < 0.001) and that all the statistically significant
relationships were positive in direction. The results indicate that of the three
learning environment scales, the two scales of teacher support and personalrelevance were most likely to influence students’ enjoyment of their mathematics
lessons and their academic self-efficacy.
Table 6. Standardized path coefficients and t-value for the hypothesized relationships
in the research model
Hypothesized relationship Standardized pathcoefficient
t
Teacher Support → Academic Efficacy 0.15 1.76
Involvement → Academic Efficacy 0.02 0.21Personal relevance→ Academic Efficacy 0.30 3.47***
Teacher Support → Enjoyment 0.35 3.82***Involvement → Enjoyment -0.14 -1.54Academic Efficacy → Enjoyment 0.77 10.22***Personal Relevance → Enjoyment 0.34 3.72***
*** p<0.001
I also examined regression weights and deleted nonsignificant paths. The paths
deleted were from the involvement scale to academic efficacy scale, suggesting
that the perceptions of academic self-efficacy is not affected by studentinvolvement. Another path deleted was from involvement to enjoyment of
mathematics lesons, again suggesting no causal link between involvement and
enjoyment of mathematics lesons. Finally, the path from teacher support to
academic self-efficacy was also deleted, suggesting that academic efficacy is not
affected by the perceptions of teacher support.

8/18/2019 (Contemporary Approaches to Research
http://slidepdf.com/reader/full/contemporary-approaches-to-research 107/284
AFARI
106
After deleting the nonsignificant paths and correlating the errors in certain pairs
of variables, I reestimated the model and accepted it as a final model because it
provided a good fit with all significant paths (χ 2 = 1372.34, CFI = 0.93, IFI = 0.93,
RMSEA = 0.05) (Table 5). The final model is presented in Figure 2. All factor
loadings were significant and generally high, suggesting that measured variableswere reliable and valid measures of the latent variables.
The explanatory power of the research model (refer to Figure 1) was assessed
by calculating the coefficient of determination (R 2) of the endogenous constructs
(Santosa, Wei, & Chan, 2005). Table 7 indicates that 10% of the variation instudents’ academic efficacy scores in mathematics learning can be accounted for
by their perception of their classroom learning environment (teacher support,involvement and personal relevance). Also, 48% of the variance on students’
enjoyment of their mathematics lessons can be accounted for by their perception of
teacher support, involvement and personal relevance.
Table 7. Coefficient of determination (R2 ) of the endogenous
Effects on Enjoyment of Mathematics Lessons and Academic Self-efficacy
My main purpose in this study was to examine the effects learning environmentvariables on college students’ enjoyment of mathematics lessons and theiracademic self-efficacy. I interpreted the structural relationships in the model as the
effect of one latent variable on the other. I examined direct and indirect effects for
significance and magnitudes (see Table 8). In the initial run, I found that the directeffects of teacher support on academic efficacy, involvement on academic efficacy
and involvement on enjoyment of mathematics lessons were very small and not
significant, so these paths were deleted one by one in subsequent runs for reasonsof parsimony. All paths were significant in the final model (see Figure 2). The
largest effect in the model was that of academic efficacy on enjoyment of
mathematics lessons (β = 0.77). This result indicated a strong effect of academicefficacy on students’ enjoyment of mathematics lessons. Students’ enjoyment of
mathematics lessons were strongly affected by their perceptions of their academic
self-efficacy.
The two learning environment variables (teacher support and personal
relevance) both influenced students’ enjoyment of mathematics lessons. Teacher
support had a moderate direct effect (β = 0.30) on enjoyment of mathematicslessons. This suggests that as students perceive more positive teacher support, they
are more likely to enjoy their mathematics lessons. Personal relevance had amoderate direct effect (β = 0.29) and also a moderate indirect effect (β = 0.28), so
the total effect of personal relevance on enjoyment of mathematics lessons was
Endogenous Construct R 2
Academic Self-EfficacyEnjoyment of Mathematics Lessons
0.100.48

8/18/2019 (Contemporary Approaches to Research
http://slidepdf.com/reader/full/contemporary-approaches-to-research 108/284
EFFECTS OF PSYCHOSOCIAL LEARNING ENVIRONMENT
107
large (β = 0.57). This effect indicated that as students perceive their personal
relevance as positive, they enjoy their mathematics lessons more.
Table 8. Direct, indirect, and total effects on enjoyment of mathematicslessons and academic efficacy
***p<0.001
Finally, personal relevance had a moderate direct effect (β = 0.36) on academic
efficacy but no indirect effect. Hence the total effect was moderate (β = 0.36). Thissuggests that students who have positive perceptions on personal relevance are
likely to have moderately more positive academic self-efficacy. See Table 8 for acomplete pattern of direct, indirect and total effects on enjoyment of mathematics
lessons and academic self-efficacy.
DISCUSSION AND CONCLUSION
The purpose of this study was to examine the effects of teacher support,
involvement and personal relevance on students’ academic self-efficacy and their
enjoyment of mathematics lessons. There was strong support for the hypothesized
relationships and mediated effects of teacher support and personal relevance on
academic self-efficacy and their enjoyment of mathematics lessons. Allcoefficients were significant and in the theoretically expected direction. The
findings of this study suggest that the two aspects of learning environment (teacher
support and personal relevance) significantly influence students’ enjoyment ofmathematics lessons and academic self-efficacy.
Results suggested that students’ enjoyment of their mathematics lessons was
more positive in classrooms with greater teacher support and personal relevance,and that academic self-efficacy was higher in classes with more personal
relevance. This would suggest that, as students get more teacher support and
mathematics lessons are made relevant to them, the more likely it is that they willenjoy mathematics lessons. The results also indicated that increased academic self-
Scale Enjoyment of Mathematics Academic Efficacy
Direct Indirect Total Direct Indirect Total
TeacherSupport
0.30*** – 0.30*** – – –
Involvement – – – – – –
PersonalRelevance
0.29*** 0.28*** 0.57*** 0.36*** – 0.36***
AcademicEfficacy
0.77*** – 0.77*** – – –

8/18/2019 (Contemporary Approaches to Research
http://slidepdf.com/reader/full/contemporary-approaches-to-research 109/284
AFARI
108
Figur re
effica
lessoneffica
perso
MinnaSakiz,
Th
suppoacade
lessonThis i
Barch
enjoyeffica
Res
suppo
e 2. Represent levance and ac
y is likely
s. These resuy and their
al relevance
ert, van derPape, & Hoy
study of th
t and personic self-effic
s were strongs consistent
feld and Per
ent was siy.
ults of my
t on enjoym
tion of the revidemic self-effi
ith more pe
lts reflect paserceptions o
have been
erf, & Kuy, 2012).
e total effec
l relevance ocy. Results i
ly affected byith results in
ry (2011) a
gnificantly p
study indicat
nt of mathe
sed and finalcacy and enjoy
sonal releva
t studies inthe learnin
found to ha
er, 2010; Fr
s revealed t
students’ endicated that
their percept recent studi
d Sakiz et
ositively as
d significan
atics lessons.
odel linking teent of mathe
ce and enjo
hich student environmen
ve positive
ser, 2012; L
e important
oyment of mtudents’ enjo
ions of theirs in which P
al. (2012) re
ociated wit
total effect
Suggesting t
cher support,atics lessons s
ment of mat
’ enjoyment(teacher sup
elationships
rsbach & Jin
influences o
athematics lesyment of mat
cademic self-ekrun, Goetz,
ported that
students’
of perceive
hat experienc
ersonalales.
hematics
and self- port and
(Ahmed,
ks 1999;
f teacher
sons andhematics
efficacy.Frenzel,
cademic
cademic
teacher
ing more

8/18/2019 (Contemporary Approaches to Research
http://slidepdf.com/reader/full/contemporary-approaches-to-research 110/284
EFFECTS OF PSYCHOSOCIAL LEARNING ENVIRONMENT
109
teacher support in the mathematics classroom is likely to increase students’
enjoyment of their mathematics lessons. This support previous research conducted
in Brunei, Singapore, Australia and USA (den Brok, Fisher, & Scott, 2005; Fisher,
Waldrip, & den Brok, 2005: Lang, Wong, & Fraser, 2005, Sakiz et al., 2012).
The generalisation of the results to other populations should be made withcaution since this study involved a relatively small number of students (352
students, 33 classes from three colleges in Abu Dhabi). The United Arab Emirates
is a country with seven emirates (states) with at least five colleges in each emirate
and no sample was drawn from any of the other six emirates. It is therefore unclearwhether my findings would apply to other college-level institutions in the United
Arab Emirates. A further limitation of my study is the limited scope in terms ofstudent outcomes, which included only students’ academic self-efficacy and their
enjoyment of mathematics lessons. In particular, the absence of any achievement
outcomes might be considered as a limitation and the inclusion of which may have
enhanced my study.
The research reported in this article is significant because it is one of the fewstudies to be conducted in the United Arab Emirates that structural equation
modeling has been used to develop a comprehensive model representing the
relationships among classroom environment and outcomes. The results of this
study will hopefully encourage teachers, especially in the United Arab Emirates toimprove their classroom environment which will most likely improve their
students’ outcomes. Also mathematics teachers will be encouraged to provide a
learning environment with a cooperative atmosphere in which students feel thatthey are supported by their teachers and mathematics lessons are made relevant to
them. The results of my study have the potential to influence educators and policymakers to focus on stimulating a number of learning environment elements, such
as teaching methods that involve cooperative work, active participation in thelearning process and an atmosphere in which all students will perceive their
teachers as supportive and approachable which will hopefully increase students
enjoyment of their lessons and improve their confidence in academic competence.
REFERENCES
Adeyemo, D. A. (2007). Moderating influence of emotional intelligence on the link between academic
self-efficacy and achievement of university students. Psychology and Developing Societies, 19, 199-
213.
Afari, E., Aldridge, J. M., Fraser, B. J., & Khine, M. S. (2013). Students’ perceptions of the learning
environment and attitudes in game-based mathematics classrooms. Learning Environments
Research, 16, 131-150.
Ahmed, W., Minnaert, A., Werf, G. V., & Kuyper, H. (2010). Perceived social support and early
adolescents’ achievement: The mediational roles of motivational beliefs and emotions. Journal of
Youth Adolescence, 39, 36-46.
Ajzen, I. (2001). Nature and operation of attitude. Annual Review of Psychology, 52, 27-58.
Aldridge, J. M., Dorman, J. P., & Fraser, B. J. (2004).Use of multitrait-multimethod modelling to
validate actual and preferred forms of the technology-rich outcomes-focused learning environment
inventory (Troflei). Australian Journal of Educational Education & Developmental Psychology,
4,110-125.

8/18/2019 (Contemporary Approaches to Research
http://slidepdf.com/reader/full/contemporary-approaches-to-research 111/284
AFARI
110
Aldridge, J. M., & Fraser, B. J. (2008).Outcomes-focused learning environments: Determinants and
effects. Rotterdam, the Netherlands: Sense Publishers.
Aldridge, J. M., Fraser, B. J., & Huang, I. T.-C. (1999). Investigating classroom environments in
Taiwan and Australia with multiple research methods. Journal of Educational Research, 93, 48-57.
Arbuckle, J. L., & Wothke, W. (1999). AMOS 4.0 user’s guide. Chicago: Smallwaters.
Bandura, A. (1977). Self-efficacy: Toward a unifying theory of behavioral change. Psychological
Review, 84(2) , 191-215.
Bandura, A. (1986). Social foundations of thought and action: A social cognitive theory . Englewood
Cliffs, NJ: Prentice Hall
Bandura, A. (1989). Human agency in social cognitive theory. American Psychologist, 44, 1175-1184.
Bandura, A. (1997). Self-efficacy: The exercise of control . New York: Freeman.
Barclay, D., Higgins, C., & Thompson, R. (1995). The partial least squares (PLS) approach to causal
modeling: Person computer adoption and uses as an illustration. Technology studies, 2, 285-309.Bentler, P. M. (1990). Comparative fit indexes in structural models. Psychological Bulletin, 107 (2) ,
238-246.
Bollen, K. A. (1989). Structural equations with latent variables. New York: Wiley.
Borasi, R. (1990). The invisible hand operating on mathematics instruction: Students’ conceptions and
expectations. In T. J. Cooney (Ed.), Teaching and learning mathematics in the 1990s (NCTM
Yearbook) (pp. 174-182). Reston, VA: NCTM.
Brown, M. W., & Cudeck, R. (1993). Alternative ways of assessing model fit. In K. A. Bollen & J. S.
Long (Eds.), Testing structural equation models (pp. 136-162). Newbury Park, CA: Sage.
Byrne, B. M. (2010). Structural equation modeling with AMOS: Basic concepts, applications, and
programming. New York: Routledge.
Cohen, J., & Cohen, P. (1983). Applied multiple regressions analysis for the behavioural sciences
(2nded.). Hillsdale, NJ: Erlbaum.
Crano, W. D., & Prislin, R. (2006).Attitudes and persuasion. Annual Review of Psychology, 57, 345-
374.
Davis, B. G. (1993). Tool for teaching. San Francisco: Jossey-Bass.denBrok, P., Brekelmans, M., & Wubbels, T. (2006). Multilevel issues in research using students’
perceptions of learning environments: The case of the Questionnaire on Teacher Interaction.
Learning Environments research, 9, 199-213.
denBrok, P., Fisher, D., & Scott, R. (2005). The importance of teacher interpersonal behaviour for
student attitudes in Brunei primary science classes. International Journal of Science Education, 27,
765-779.
den Brok, P., Fisher, D., Rickards, T., & Bull, E. (2006). Californian science students’ perceptions of
their classroom learning environments. Educational Research and Evaluation, 12, 3-25.
den Brok, P., Fisher, D. L., Wubbels, T., Brekelmans, M., & Rickards, T. (2006). Secondary teachers’
interpersonal behaviour in Singapore, Brunei and Australia: A cross national comparison. Asia
Pacific Journal of Education, 26, 79-95.
Dorman, J. P. (2001). Associations between classroom environment and academic efficacy. Learning
Environments Research, 4(3), 243-257.
Dorman, J. P. (2003a). Relationship between school and classroom environment and teacher burnout: A
lisrel analysis. Social Psychology of Education, 6 (2) , 107-127.
Dorman, J. P. (2003b). Cross-national validation of the What Is Happening In this Class? (WIHIC)
questionnaire using confirmatory factor analysis. Learning Environments Research, 6, 231-245.
Dorman, J. P. & Adams, J. (2004). Associations between students’ perceptions of classroom
environment and academic efficacy in Australia and British secondary schools. International
Journal of Research and Method in Education, 27, 69-85.
Dorman, J. P., & Fraser, B. J. (2009). Psychological environment and affective outcomes in technology-
rich classrooms: Testing a causal model. Social Psychology of Education, 12, 77-99.
8/18/2019 (Contemporary Approaches to Research
http://slidepdf.com/reader/full/contemporary-approaches-to-research 112/284
EFFECTS OF PSYCHOSOCIAL LEARNING ENVIRONMENT
111
Dorman, J. P., Fisher, D. L., & Waldrip, B. G. (2006).Learning environments, attitudes, efficacy and
perceptions of assessment: A LISREL analysis. In D. L. Fisher & M. S. Khine (Eds.), Contemporary
approaches to research on learning environments (pp. 1-28). Singapore: World Scientific.
Dossey, J. A., Mullis, I. V. S., Lindquist, M. M., & Chambers, D. L. (1988).The mathematics report
card: Trends and achievement based on the 1986 National Assessment. Princeton, NJ: Educational
Testing Service.
Eccles, J. S., & Wigfield, A. (2002). Motivational beliefs, values, and goals. Annual Review of
Psychology, 53, 109-132.
Edman, J. L., & Brazil, B. (2007). Perceptions of campus climate, academic efficacy and academic
success among community college students: An ethnic comparison. Social Psychology of Education,
12, 371-383.
Fishbein, M., & Ajzen, I. (1975). Belief, attitude, intention and behaviour: An introduction to theory
and research. Reading, MA: Addison-Wesley.Fisher, D. L., Henderson, D., & Fraser, B. J. (1995). Interpersonal behaviour in senior high school
biology classes. Research in Science Education, 25, 125-133.
Fisher, D. L., Henderson, D., & Fraser, B. J. (1997). Laboratory environments and student outcomes in
senior high school biology. American Biology Teacher, 59, 214-219.
Fisher, D., Waldrip, B., & den Brok, P. (2005). Students’ perceptions of primary teachers’ interpersonal
behavior and of cultural dimensions in the classroom environment. International Journal of
Educational Research, 43, 25-38.
Fornell, C., & Larcker, D. F. (1981). Evaluating structural equation models with unobservable variables
and measurement error. Journal of Marketing Research, 18, 39-50.
Fraser, B. J. (2001). Twenty thousand hours: Editor’s introduction. Learning Environments Research, 4,
1-5.
Fraser, B. J. (2007). Classroom learning environments. In S. K. Abell and N. G. Lederman (Eds.),
Handbook of research on science education (pp. 103-124). Mahwah, NJ: Lawrence Erlbaum.
Fraser, B. J. (2012). Classroom learning environments: Retrospect, context and prospect. In B. J. Fraser,
K. G. Tobin & C. J. McRobbie (Eds.), Second international handbook of science education (pp. 1191-1239). New York: Springer.
Fraser, B. J., Aldridge, J. M., & Adolphe, G. (2010). A cross-national study of secondary science
classroom environments in Australia and Indonesia. Research in Science Education, 40, 551-571.
Fraser, B. J., & McRobbie, C. J. (1995). Science laboratory classrooms at schools and universities: A
cross-national study. Educational Research and Evaluation: An International Journal on Theory
and Practice, 1(4), 1-25.
Gefen, D., Straub, D., & Boudreau. M. (2000). Structural equation modelling techniques and
regression: Guidelines for research practice, Communications of the Association for Information
systems, 7 (7), 1-78.
George, R. (2000). Measuring change in students’ attitudes toward science over time: An application of
latent variable growth modelling. Journal of Science Education and Technology, 9, 213-225.
Germann, P. J. (1988). Development of the attitude toward science in school assessment and its use to
investigate the relationship between science achievement and attitude toward science in schools.
Journal of Research in Science Teaching, 25(8), 689-703.
Gore, P. A. (2006). Academic self-efficacy as a predictor of college outcomes: Two incremental
validity studies. Journal of Career Studies, 14, 92-115.
Hair, Jr., J. E., Black, W. C., Babin, B. J., & Anderson, R. E. (2010). Multivariate data analysis (7th
ed.). New Jersey: Prentice-Hall.
Hijzen, D., Boekaerts, M., & Vedder, P. (2007).Exploring the links between students’ engagement in
cooperative learning, their goal preferences and appraisals of instructional conditions in the
classroom. Learning and Instruction, 17, 673-687.
Hoe, S. L. (2008). Issues and procedures in adopting structural equation modelling technique. Journal
of Applied Quantitative Methods, 3(1), 76-83.

8/18/2019 (Contemporary Approaches to Research
http://slidepdf.com/reader/full/contemporary-approaches-to-research 113/284
AFARI
112
Hsieh, P., Sullivan, J. R., & Guerra, N. S. (2007). A close look at college students: Self-efficacy and
goal orientation. Journal of Advanced Academics, 18, 454-479.
Hu, L-T., & Bentler, P. M. (1999). Cutoff criteria for fit indexes in covariance structure analysis:
Conventional criteria versus new alternatives. Structural Equation Modeling, 6, 1-55.
Hsieh, P., Sullivan, J. R., & Guerra, N. S. (2007). A close look at college students: Self-efficacy and
goal orientation. Journal of Advanced Academics, 18, 454-479.
Jinks, J., & Morgan, V. (1999).Children’s perceived academic self-efficacy: An inventory scale. The
Clearing House, 72(4), 224-230.
Jöreskog, K.G. (1977). Structural equation models in the social sciences: Specification, estimation, and
testing. In P. R. Krishnaiah (Ed.), Applications of statistics (pp. 265-287). Amsterdam: North-
Holland.
Jöreskog, K. G., & Sörbom, D. (1993). LISREL 8: Structural equation modeling with the SIMPLIS
command language. Hillsdale, NJ: Erlbaum.Keith, T. Z. (1993). Causal influences on school learning. In H. J. Walberg (Ed.), Advances in
educational productivity: Vol. 3 Analytic methods for educational productivity (pp. 21-47).
Greenwich, CT: JAI Press.
Kerr, C. R., Fisher, D. L., Yaxley, B. G., & Fraser, B. J. (2006). Studies of students’ perceptions in
science classrooms at the post-compulsory level. In D. Fisher & M. S. Khine (Eds.), Contemporary
approaches to research on learning environments (pp. 161-194). Singapore: World Views.
Kind, P., Jones, K., & Barmby. P. (2007). Development attitudes towards science measures.
International Journal of Science Education, 29(7), 871-893.
Kline, R. B. (2010). Principles and practices of structural equation modeling (3rd ed.). New York:
Guilford Press.
Koufteros, X. A. (1999). Testing a model of pull production: A paradigm for manufacturing research
using structural equation modelling. Journal of Operations Management, 17, 467-488.
Koul, R. B., & Fisher, D. L. (2006). A contemporary study of learning environments in Jammu, India.
In D. L. Fisher & M. S. Khine (Eds.), Contemporary approaches to research on learning
environments (pp. 273-296). Singapore: World Views.Kyriakides, L. (2006). Measuring the learning environment of the classroom and its effect on cognitive
and affective outcomes of schooling. In D. L. Fisher & M. S. Khine (Eds.), Contemporary
approaches to research on learning environments (pp. 369-408). Singapore: World Views.
Lang, Q. C., Wong, A. F. L., & Fraser, B. J. (2005). Teacher–student interaction and gifted students'
attitudes toward chemistry in laboratory classrooms in Singapore. Journal of Classroom Interaction,
40, 18-28.
Lewin, K. (1936). Principles of topological psychology. New York: McGraw-Hill.
Lorsbach, A., & Jinks, J. (1999). Self-efficacy theory and learning environment research. Learning
Environments Research, 2(2), 157-167.
Lumsden, L. (1994). Students’ motivation to learn. Emergency Librarian, 22(2), 31-32.
MacLeod, C., & Fraser, B. J. (2010). Development, validation and application of a modified Arabic
translation of the What Is Happening In this Class? (WIHIC) questionnaire. Learning Environments
Research, 13, 105-125.
Marjoribanks, K. (2004). Learning environments, family contexts, educational aspirations and
attainment: A moderation-mediation model extended. Learning Environments Research, 6 , 247-265.
Meeuwisse, M., Severiens, S. E., & Born, M. Ph. (2010). Learning environment, interaction, sense of
belonging and study success in ethnically diverse student groups. Research in Higher Education,
51(6), 528-545.
Murray, H. A. (1938). Explorations in personality. New York: Oxford University Press.
Nunnally, J. C., & Bernstein, I. H. (1994). Psychometric theory (3rd ed.). New York: McGraw-Hill.
Nicol, C. (2002). Where’s the math? Prospective teachers visit the workplace. Educational Studies in
Mathematics, 50, 289-309.
8/18/2019 (Contemporary Approaches to Research
http://slidepdf.com/reader/full/contemporary-approaches-to-research 114/284
EFFECTS OF PSYCHOSOCIAL LEARNING ENVIRONMENT
113
Ogbuehi, P. I., & Fraser, B. J. (2007). Learning environment, attitudes and conceptual development
associated with innovative strategies in middle-school mathematics. Learning Environments
Research, 10, 101-114.
Opolot-Okurut, C. (2010). Classroom learning environment and motivation towards mathematics
among secondary school students in Uganda. Learning Environments Research, 13, 267-277.
Pajares, E. (1996). Self-efficacy beliefs in academic settings. Review of Educational Research, 66 (4),
543-578.
Pajares, F. (2002).Gender and perceived self-efficacy in self-regulated learning. Theory into Practice,
41, 116-125.
Pajares, F., & Kranzler, J. (1995). Self-efficacy beliefs and general mental ability in mathematical
problem-solving. Contemporary Educational Psychology, 20, 426-443.
Pekrun, R., Goetz, T., Frenzel, A. C., Barchfeld, P., & Perry, R. P. (2011). Measuring emotions in
students' learning and performance: The achievement emotions questionnaire (AEQ). Contemporary Educational Psychology, 36 (1), 36-48.
Rajecki, D. W. (1990). Attitudes. Sunderland, MA: Sinauer.
Reed, H. C., Drijvers, P., & Kirschner, P. A. (2010).Effects of attitudes and behaviours on learning
mathematics with computer tools. Computers and Education, 55, 1-15.
Reid, N. (2006). Thoughts on attitude measurement. Research in Science and Technology Education,
24(1), 3-27.
Reynolds, A. J., & Walberg, H. J. (1992). A process model of mathematics achievement and attitude.
Journal for Research in Mathematics Education, 23(4), 306-328.
Sakiz, G., Pape, S. J., & Hoy, A. W. (2012). Does perceived teacher affective support matter for middle
school students in mathematics classrooms? Journal of school Psychology, 50, 235-255.
Santosa, P. I., Wei, K. K., & Chan, H. C. (2005). User involvement and user satisfaction with
information-seeking activity. European Journal of information Systems, 14, 361-370.
Schunk, D. H. (1991). Self-efficacy and academic motivation. Educational Psychologist, 26, 207-231.
Schunk, D. H., & Pajares, F. (2005). Competence beliefs in academic functioning. In A. J. Elliot & C.
Dweck (Eds.), Handbook of competence and motivation (pp. 85-104). New York: Guilford Press.
Singh, K. (1998). Part-time employment in high school and its effect on academic achievement. The
Journal of Educational Research, 91(3), 131-139.
Singh, K., Granville, M., & Dika, S. (2002). Mathematics and science achievement: Effects of
motivation, interest, and academic engagement. The Journal of Educational research, 95, 323-332.
Singh, K., & Billingsley, B. S. (1998).Professional support and its effects on teachers’ commitment.
The Journal of Educational Research, 91(4), 229-239.
Skaalvik, E. M., & Skaalvik, S. (2010). Teacher self-efficacy and teacher burnout: A study of relations.
Teaching and Teacher Education, 26 (4), 1059-1069.
Spinner, H., & Fraser, B. J. (2005).Evaluation of an innovative mathematics program in terms of
classroom environment, student attitude, and conceptual development. International Journal of
Science and Mathematics Education, 3, 267-293.
Swan, P. (2004). I hate mathematics. Retrieved November 10, 2008, from
http://www.mav.vic.edu.au/pd/confs/2004/papers/Swan.pdf.
Taylor, L. (1992). Mathematical attitude development from a Vygotskian perspective. Mathematics
Education Research Journal , 4(3), 8-23.
Taylor, P. C., & Campbell-Williams, M. (1993). Discourse toward balanced rationality in the high
school mathematics classroom: Ideas from Habermas’s critical theory. In J. A. Malone and P. C. S.
Taylor (Eds.), Constructivist interpretations of teaching and learning mathematics (Proceeding of
Topic Group 10 at the Seventh International Congress on Mathematical Education; pp. 135-148).
Perth, Western Australia: Curtin University of Technology.
Taylor, P. C, Fraser, B. J., & Fisher, D. L. (1997). Monitoring constructivist classroom learning
environments. International Journal of Educational Research, 27 , 293-302.
Teh, G., & Fraser, B. J. (1995). Associations between student outcomes and geography classroom
environment. International Research in Geographical and Environmental Education, 4(1), 3-18.

8/18/2019 (Contemporary Approaches to Research
http://slidepdf.com/reader/full/contemporary-approaches-to-research 115/284
AFARI
114
Telli, S., Cakiroglu, J., & den Brok, P. (2006).Turkish secondary education students’ perceptions of
their classroom learning environment and their attitude towards biology. In D. L. Fisher & M. S.
Khine (Eds.), Contemporary approaches to research on learning environments (pp. 517-542).
Singapore: World Views.
Telli, S., den Brok, P., & Cakiroglu, J. (2010). The importance of teacher-student interpersonal
relationships for Turkish students’ attitudes towards science. Research in Science and Technological
Education, 28, 261-276.
Ullman, J. B. (2001). Structural equation modeling. In B. G. Tabachnick & L. S. Fidell (Eds.), Using
multivariate statistics (4th ed.). Needham Heights, MA: Allyn & Bacon.
Velayutham, S., Aldridge, J. M. (2012). Influence of psychosocial classroom environment on students’
motivation and self-regulation in science learning: A structural equation modelling approach.
Research in Science Education (online), 1-21. DOI 10.1007/s11165-011-9273-y.
Velayutham, S., Aldridge, J. M., & Fraser, B. J. (2011). Development and validation of an instrument tomeasure students’ motivation and self-regulation in science learning. International Journal of
Science Education, 33, 2159-2179.
Velayutham, S., Aldridge, J. M., & Fraser, B. J. (2012). Gender differences in student motivation and
self-regulation in science learning: A multi-group structural equation modeling analysis.
International Journal of Science and Mathematics Education, 10(6), 1347-1368.
Webster, B. J., & Fisher, D. L. (2004).School-level environment and student outcomes in mathematics.
Learning Environments Research, 6 , 309-326.
Westwood, P. (2000). Numeracy and learning difficulties: Approaches to learning and assessment.
Melbourne: ACER.
Wolf, S. J., & Fraser, B. J. (2008).Learning environment, attitudes and achievement among middle
school science students using inquiry-based laboratory activities. Research in Science Education,
38, 321-341.
Wong, A. F. L., Young, D. J., & Fraser, B. J. (1997).A multilevel analysis of learning environments and
student attitudes. Educational Psychology, 17 , 449-468.
Wubbels, T., & Levy, J. (Eds). (1993). Do you know what you look like: Interpersonal relationships ineducation. London: Falmer Press.
Zimmerman, B. J., Bandura, A., & Martinez-Pons, M. (1992). Self-motivation for academic attainment:
The role of self-efficacy beliefs and personal goal setting. American Educational Research Journal,
29, 663-676.
Ernest Afari
Petroleum Institute
Abu Dhabi, UAE
8/18/2019 (Contemporary Approaches to Research
http://slidepdf.com/reader/full/contemporary-approaches-to-research 116/284
M.S. Khine (ed.), Application of Structural Equation Modeling in Educational Research and
Practice, 115–133.
© 2013 Sense Publishers. All rights reserved.
SUNITA VELAYUTHAM, JILL ALDRIDGE AND ERNEST AFARI
6. STUDENTS’ LEARNING ENVIRONMENT,
MOTIVATION AND SELF-REGULATION:
A COMPARATIVE STRUCTURAL EQUATION
MODELING ANALYSIS
INTRODUCTION
Over the past 40 years, research has consistently shown that the quality of the
classroom environment is an important determinant of student learning (Fraser,
2007, 2012). That is, students are likely to learn better when they perceive their
classroom environment positively. According to Hanrahan (2002), research on
science pedagogy suggests that the dynamics of science classrooms can beinfluential in alienating students before they even to begin to engage with science
concepts. While classroom environment research focuses on perceptions of
classroom life, usually from the students’ perspective (Fraser, 2007), contemporary
research in psychology draws attention to the importance of developing self-belief
and self-regulatory capabilities in students (Zimmerman, 2008). Indeed, one of theendeavors of science education is to motivate and empower students by nurturing
the belief that they can succeed in science learning and to cultivate the self-regulatory strategies required to help to bring about that success. Urdan and
Schoenfelder (2006) propose that enhancing student motivation requires attention
to the key features of the classroom learning environment that are likely to
influence student motivation. Zimmerman (2008) contends that the effect ofclassroom stimulators and constraints on changes in students’ self-regulated
learning is important and should be studied further. Our study took up these
suggestions by investigating psychosocial aspects of learning environments and
their influence on students’ development of motivation and self-regulation inscience learning.
According to Schunk and Zimmerman (2007), students’ social environments
can influence their affective domains and behaviours. Additionally, teachers, whoare an integral component of the classroom environment, can inspire students by
creating a favourable classroom environment in which they feel personally
efficacious and motivated, and, therefore, work harder to succeed. Hence, our
study aimed to inform practitioners and policy makers about which factors withinthe learning environment are likely to enhance student motivation and self-
regulation in science learning. This information could guide teachers in directing

8/18/2019 (Contemporary Approaches to Research
http://slidepdf.com/reader/full/contemporary-approaches-to-research 117/284
VELAYUTHAM ET AL.
116
and focusing the science classroom environment in an attempt to cultivate the
motivation and self-regulatory strategies required to succeed in science learning.
LEARNING ENVIRONMENT
It has been estimated that students spend up to 15,000 hours in classrooms by the
time that they complete high school (Fraser, 2001; Rutter, Maughan, Mortimore,Outson, & Smith, 1979). Therefore, what happens within these classrooms, such as
the nature of the teaching and learning and the interactions experienced by
students, are likely to have a profound impact on a range of outcomes. Despite theimportance of what goes on in the classroom, science educators tend to rely
heavily on achievement and other outcomes which do not provide a complete
picture of the educational process (Fraser, 2001, 2012). Although the learningenvironment is a subtle concept, there has been much progress in the
conceptualisation, assessment and examination of its determinants and effects.
The notion that there exists a learning environment which mediates aspects ofeducational development began as early as the 1930s; when Lewin (1936)
recognised that the environment and the interaction of the individual were
powerful determinants of behaviour. Lewin initiated this shift in the study of psychology from a focus on the individual to a focus on processes between
individuals (Crosbie-Brunett & Lewis, 1993). Murray (1938) extended Lewin’s
work with his Needs-Press Model which asserts that an individual’s need is provoked directly by the occurrence of one or more effective presses from the
individual’s environment.
Moos (1974), as part of his work in a range of environments, delineated threegeneral dimensions that characterize any human environment: personal
relationships, personal growth and system management. Whilst the personalrelationships dimension focuses on the different types and strengths of relationship
in the environment, the personal growth dimension is concerned on the availability
of opportunities for personal development and self-enhancement. The finaldimension, system management, examines the degree to which the environment is
orderly, maintains control and is responsive to change. Research specifically on
classroom learning environments took off over 40 years ago with the developmentof well-validated and robust classroom environment instruments to measure
students perceptions, largely based on Moos’ three pertinent dimensions (Fraser,
1998). The What Is Happening In this Class? (WIHIC), selected for use in the
present study, combines scales from past learning environment with scales of
contemporary relevance to ensure good coverage of the three dimensionsdeveloped by Moos (Aldridge, Fraser & Huang, 1999). The WIHIC is comprised
of three scales measuring personal relationships (student cohesiveness, teacher
support and involvement), three scales measuring personal development
(investigation, task orientation and cooperation) and one scale measuring systemmaintenance and change (equity). Further information with respect to these
psychosocial learning environment scales is provided in the instruments section.

8/18/2019 (Contemporary Approaches to Research
http://slidepdf.com/reader/full/contemporary-approaches-to-research 118/284
LEARNING ENVIRONMENT, STUDENT MOTIVATION AND SELF-REGULATION
117
Research in the domain of classroom learning environment has made significant
contributions to the field of education, including program evaluation (Martin-
Dunlop & Fraser, 2008; Nix, Fraser, & Ledbetter, 2005; Wolf & Fraser, 2008),
teacher action research (Aldridge & Fraser, 2008; Aldridge, Fraser, Bell, &
Dorman, 2012) and cross-national studies (Aldridge et al., 1999; Fraser, Aldridge,& Adolphe, 2010). In particular, associations between outcome measures and
classroom environment perceptions have been replicated for a variety of cognitive
and affective outcomes, with a range of instruments, across numerous countries
and at all grade levels (Fraser, 2007, 2012). The consensus is that student perceptions of the classroom environment account for appreciable amounts of
variance in learning outcomes, often beyond that attributable to student background characteristics (Dorman, 2001; Fraser, 2007). Therefore, to stimulate
and optimize student learning, knowledge of students’ perceptions of learning
environment and how these factors influence their learning is crucial for both
teachers and educational researchers.
Student motivation and self-regulation are important affective outcomes that arenecessary for the improvement of science classrooms. Past research has reported
that the classroom environment has a strong association with academic efficacy
(Dorman, 2001; Dorman & Adams, 2004). We felt that the influence of
psychosocial learning environment on students’ learning goal orientation, taskvalue and self-regulation warranted further investigated. Furthermore, the
interactions elucidated in the social cognitive theory suggest that relevant aspects
of the learning environment could influence both student motivation and self-regulation. This theoretical basis, coupled with the limited number of studies
related to the influence of learning environment on student motivation and self-regulation, provided the impetus for our research. Hence, we investigated salient
psychosocial features of classroom environment that could influence studentmotivation and self-regulation in science learning.
MOTIVATION AND SELF-REGULATION
Research has indicated that motivated students are the key to successful learning
engagement in classrooms (Pajares, 2001, 2002; Pajares & Schunk, 2001).Specifically, in science learning, research indicates that students’ motivation plays
a pivotal role in their conceptual change processes, critical thinking, learning
strategies, and science achievement (Glynn, Taasoobshirazi, & Brickman, 2007;
Kuyper, van der Werf & Lubbers, 2000; Lee & Brophy, 1996; Napier & Riley,
1985; Pintrich, Marx, & Boyle, 1993; Wolters, 1999). Three components ofmotivation, learning goal orientation, task value and self-efficacy, have been found
to be related to student engagement in self-regulated learning (Zimmerman, 2002).
Learning goal orientation involves the student’s purpose in developing
competence in the subject and focuses on learning, understanding and masteringtasks (Midgley, 2002). Prevailing evidence from past research has indicated that
students’ learning goal orientation is likely to influence a range of positive learningoutcomes including student achievement (Brookhart, Walsh, & Zientarski, 2006;

8/18/2019 (Contemporary Approaches to Research
http://slidepdf.com/reader/full/contemporary-approaches-to-research 119/284
VELAYUTHAM ET AL.
118
Kaplan & Maehr, 1999, 2007). Academic task value beliefs are an integral element
that structures students’ motivation to learn (Eccles 1983; Pintrich, 1989; Pintrich
& De Groot, 1990). Students who are convinced that the learning activity is
important, appealing and useful tend to be more cognitively engaged to learn, put
in greater effort and persevere longer to complete a learning task (Schunk &Zimmerman, 2007; Wolters & Rosenthal, 2000). Self-efficacy has received much
attention in educational research and it has been shown to influence students’
academic achievement across various academic areas and levels (Pajares & Urdan,
2006). Previous research has established that science self-efficacy is related toscience achievement and engagement with science-related activities (Britner &
Pajares, 2006; Kupermintz, 2002; Lau & Roeser, 2002; Pajares, Britner, &Valiante, 2000). Shaughnessy (2004) asserts that teachers who seek to help
students to increase their self-efficacy should first attend to the sources underlying
these beliefs.
The dearth of research on the influence of classroom environment on academic
efficacy was brought to the attention of learning environment researchers byLorsbach and Jinks (1999) who called for the convergence of these two fields.
When Dorman (2001) and Dorman and Adams (2004) took up this challenge,
multiple regression analyses of data from mathematics classes indicated that most
of the classroom environment scales related positively with academic efficacy. Ourresearch focused on the three motivational beliefs discussed previously, namely:
learning goal orientation, task value and self-efficacy (all of which contribute
significantly towards student engagement in science learning). We felt that it wasimportant to investigate the classroom learning environment as the genesis of these
motivational beliefs and to draw out factors that positively nurture student’slearning goal orientation, task value and self-efficacy in science learning.
According to Zimmerman (2002), students’ differing level of self-regulation is akey contributor towards individual differences in learning. Motivation theorists
argue that research related to self-regulated learning has focused on students’ use
of cognitive and meta-cognitive strategies while leaving out one of the most
important components of self-regulation, namely, sustaining effort untilcompletion of the task (Boekaerts, 1993; Boekaerts & Cascallar, 2006; Corno,
1994; Pintrich, 2000). Effort regulation is the “tendency to maintain focus and
effort towards goals despite potential distraction” (Corno, 1994, p. 229). Pastresearch has indicated that effort regulation is a strong determinant of student
achievement (Doljanac, 1994; Lee, 1997). Based on this theoretical and research
evidence, we have assumed that students’ self-regulation of effort is a key
component of students’ learning engagement in science lessons. Zimmerman(2008) asserts that the effects of learning environment on students’ self-regulated
learning should be studied further. Our study took up this challenge and filled the
research gap in terms of studies of psychosocial aspects of learning environment
and its influence on students’ development of effort regulation in science learning.Zimmerman (2000) emphasizes that self-regulatory skills are of little value to
students if they cannot motivate themselves to use them. The cyclical phases of
Zimmerman’s (2002) self-regulated learning theory highlight the major role of

8/18/2019 (Contemporary Approaches to Research
http://slidepdf.com/reader/full/contemporary-approaches-to-research 120/284
self-m
additi
evide
self-re
learni
self-re
Resea
As a f using
model
model
aspectinvolv
influe
value
motiv predic
Figure
Partic
The s
grades
a repr
LEARNIN
otivation beli
n, Pintrich (
ce indicates t
gulation in l
g goal orien
gulation in sc
ch Model
irst step the tconfirmatory
, based on bo
, presented i
s of the leement, invest
ces each of
and self-effi
tion construted to influen
1. Representa scienc
ipants and pr
ample for thi
8, 9 and 10 f
sentative sa
G ENVIRONM
efs in initiati
2003), in a r
hat students
earning. Hen
tation, task v
ience learnin
RE
e study aimefactor analysi
th theory and
Figure 1, h
rning enviroigation, task
he three moti
cacy) and s
ts (learningce self-regulat
ion of the rese learning and s
cedures
s study inclu
rom five publ
ple of lower
NT, STUDENT
g and maint
eview of pas
ho are more
e, our study
alue and self
.
SEARCH ME
d to validates. The secon
research (dis
pothesizes t
nment (studorientation, c
vation constr
elf-regulation.
oal orientatiion in scienc
rch model link elf-regulation i
ded 1360 st
c schools in
secondary st
MOTIVATION
ining self-reg
t research, co
cademically
decided to i
-efficacy as
HOD
he questionn step involve
cussed in the
at each of t
nt cohesiveooperation a
ucts (learning
. Additionall
on, task valu learning.
ing learning enn science learn
dents (719 b
erth, Wester
dents in publ
ND SELF-REG
ulation of lea
ncluded that
otivated sho
nvestigate th
redictors of
ires used in td assessing a
previous sect
e seven psy
ess, teacherd equity) ind
goal orienta
, each of t
and self-ef
vironment, mot ing scales
oys and 641
Australia. T
ic schools, th
ULATION
119
rning. In
research
w higher
role of
students’
his studyresearch
on). The
hosocial
support,ividually
ion, task
he three
icacy) is
ivation in
girls) in
provide
schools
8/18/2019 (Contemporary Approaches to Research
http://slidepdf.com/reader/full/contemporary-approaches-to-research 121/284
VELAYUTHAM ET AL.
120
were selected to encompass students with differing abilities, gender and socio-
economic status. Both instruments (described below) were administered, with
guidance from the researchers, during one class period in the last quarter of theacademic year, by the science teachers.
Instruments
Students’ perceptions of the classroom environment were assessed using theWhat Is Happening In this Class? (WIHIC) questionnaire, which was specifically
designed for high school science classes (Aldridge et al., 1999). The WIHIC
incorporates the best features of existing instruments through the integrationof psychosocial classroom learning environment scales that have been
confirmed through past studies as statistically significant predictors ofstudent outcomes (Fraser, 1998). The salient scales were adapted and combined
with particular aspects of constructivism and other relevant factors operating
in contemporary classrooms to bring parsimony to the field of learningenvironments research (Aldridge et al., 1999; Dorman, 2008). The reliability
and validity of the WIHIC have been supported for samples in Australia
and Taiwan (Aldridge et al., 1999), the US (Ogbuehi & Fraser, 2007; Wolf &Fraser, 2008), Indonesia (Fraser et al., 2010), Singapore (Chionh & Fraser, 2009;
Khoo & Fraser, 2008), Korea (Kim, Fisher, & Fraser, 2000), United Arab Emirates
(Afari, Aldridge, Fraser, & Khine, 2013) and India (den Brok, Fisher, & Koul,2005).
Of all of the questionnaires developed in the field of learning environments, the
WIHIC is the most widely used. Its impressive validity in a range of contexts andcountries has contributed to what has been termed ‘band-wagon status’ (Dorman,
2008). The final version of the WIHIC consists of seven eight-item scales, namely,
student cohesiveness, teacher support, involvement, investigation, task orientation,
cooperation and equity. The WIHIC is worded to elicit the student’s perception ofhis/her individual role within the classroom. Table 1 provides, for each WIHIC
scale, a description, a sample item and its classification according to Moos’s
schema.
To assess students’ motivation and self-regulation in science learning, we usedthe Students’ Adaptive Learning Engagement in Science (SALES), developed by
Veyalutham, Aldridge and Fraser (2011). The SALES has 32 items with eight
items in each of the four scales of learning goal, task value, self-efficacy and self-regulation. Table 2 provides a scale description and a sample item for each scale of
the SALES instrument.

8/18/2019 (Contemporary Approaches to Research
http://slidepdf.com/reader/full/contemporary-approaches-to-research 122/284
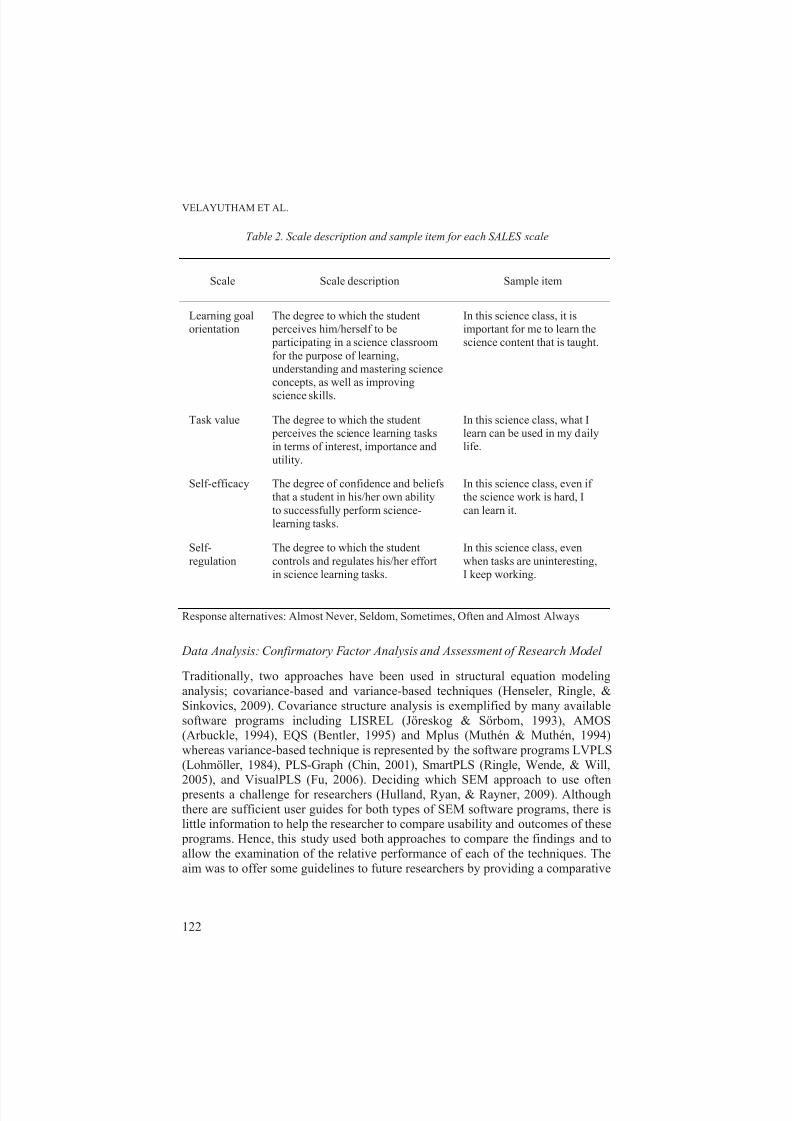
8/18/2019 (Contemporary Approaches to Research
http://slidepdf.com/reader/full/contemporary-approaches-to-research 123/284

8/18/2019 (Contemporary Approaches to Research
http://slidepdf.com/reader/full/contemporary-approaches-to-research 124/284
LEARNING ENVIRONMENT, STUDENT MOTIVATION AND SELF-REGULATION
123
analysis of the results obtained using the covariance-based AMOS and variance-
based PLS-Graph SEM techniques.
PLS-Graph (Version 3.0), used in this study, has been recommended as a
powerful statistical tool for prediction-oriented research (Hensler, Ringle, &
Sinkovics 2009). PLS is highly applicable in theory development, in particular,examining exploratory research models, because it has higher levels of statistical
power as compared to covariance-based SEM such as AMOS (Hair et al., 2011).
Due to the emphasis on theory building and predictive accuracy in PLS, the
goodness-to-fit indices, used in AMOS, is not conducted as a part of PLS analysis(Chin, 1998; Gefen et al., 2000; Henseler et al., 2009). Another advantage of PLS
is that it makes minimal distribution assumptions (Chin, 1998). However, despitethe growing number of studies utilising PLS, some researchers view the method as
less rigorous and, therefore, less suitable for examining relationships between
latent variables (Hair et al., 2010).
Amongst covariance-based SEM, AMOS (Version 17), used in this study, has
two major advantages. First, AMOS combines SPSS software is familiar to manyresearchers. Second, AMOS is user-friendly involving icons as the operation
interface. The covariance-based approach of AMOS shifts the emphasis from
predictive modeling to theory testing, since the objective of AMOS is to explain
the covariance of all of the indicators used in a model (Fornell, 1989; Falk &Miller, 1992). The technique focuses on estimating a set of model parameters in
such a way that the difference between the theoretical covariance matrix and the
estimated covariance matrix is minimized (Rigdon, 1998). AMOS develops atheoretical covariance matrix, based on a specified set of structural equations
making it highly suitable for theory confirmation. However, AMOS estimationrequires a set of assumptions to be fulfilled, including the multivariate normality of
data and minimum sample size (Diamantopoulos & Siguaw, 2000).The SEM analysis, for the present study, included both confirmatory factor
analysis and the assessment of the research model. First, for the confirmatory
factor analysis, SEM assessed the properties of the measurements utilized in the
research model to achieve convergent and discriminant validity. All items from thetwo questionnaires were regarded as part of the regression model and analyzed
simultaneously (Chin, 1995; Gefen et al., 2000). Then, the assessment of the
explanatory power of the research model was conducted by estimating the varianceassociated with the endogenous constructs (dependent variables or consequents).
Finally, path coefficients and t -values for the hypothesized relationships were
calculated to evaluate the magnitude and statistical significance of the
relationships.
RESULTS
Confirmatory Factor Analysis
An important requirement of covariance-based SEM analyses is that the data are
multivariate normal (Byrne 2010). The value of the Mardia’s coefficient (a

8/18/2019 (Contemporary Approaches to Research
http://slidepdf.com/reader/full/contemporary-approaches-to-research 125/284
VELAYUTHAM ET AL.
124
standard measure of multivariate normality) obtained in this study, using AMOS,
was 238.36. This value, as required, was less than [p (p + 2)] where p = total
number of observed indicators; 88(90) = 7,920 (Raykov & Marcoulides, 2008).
Therefore the requirement of multivariate normality was satisfied and the data
considered fit to be analysed by AMOS.Convergent validity assesses whether scores on items, assessing a single
construct are strongly intercorrelated and measure the same underlying dimension.
For both PLS and AMOS, items are examined for their loadings, internal
consistency reliability and the average variance extracted to indicate convergentvalidity (Fornell & Larcker, 1981). The loading for each individual item indicates
its correlation with its respective construct. Low loading items will decrease thecorrelation between the items in the construct and increase the level of random
error (Nunnally, 1978). As such, this procedure enables the researcher to identify
and eliminate items that could lead to an increase in the construct’s level of
random error (Fornell & Lacker, 1981). In confirmatory factor analysis, the item
loadings typically are higher than for exploratory factor analysis because the pattern of item loadings is pre-specified (Gefen & Straub, 2005). In SEM, the
minimum requirement suggested for item loadings is 0.7 (Barclay, Higgins, &
Thompson 1995; Chin, 1998; Hulland, 1999).
All item loadings for the PLS analysis were found to be above therecommended cut-off point except for items SC2, SC7, SC8 and SR5. Hence,
after the first PLS run, these four items were discarded. When the refined set of
items were again analyzed using PLS, all loadings were found to be above the cut-off point of 0.70. In the AMOS analysis, twelve items, the earlier four indicated
in the PLS analysis, as well as items SC2, SC3, SC7, SC8, IVT3, IVT5, IVT7,IVT8 LG4, LG7, TV7 and SR5, had loadings lower than the minimum
requirement. The items were similarly refined to ensure that all of the items hadloadings above 0.70.
Results of internal consistency analysis for each factor for both the PLS and
AMOS analysis indicated that all of the factors exceeded the minimum reliability
value of 0.7, as suggested by Fornell and Larcker (1981). The final criterion forconvergent validity was a measure of average variance extracted (AVE) for each
factor. Fornell and Larcker (1981) and Nunnally (1978) specify that, as a rule of
thumb, a minimum value of AVE as 0.5. The results of the statistical analysisshowed that the AVE values for all scales in both PLS and AMOS analysis were
above 0.5. Therefore, the measurement properties satisfied all three necessary
criteria of convergent validity.
The criterion of discriminant validity was that the square root of averagevariance extracted (AVE) for each construct is larger than the inter-construct
correlation. The PLS data analysis results supports the discriminant validity
because, for each construct, the square root of the AVE for each construct
was larger than its correlation with other constructs. In the AMOS analysis,this criterion was also met except for the correlation between the student
cohesiveness and cooperation scales (0.67) which were slightly higher than the
AVE for SC (0.65). Overall, however, the discriminant validity analyses ensured

8/18/2019 (Contemporary Approaches to Research
http://slidepdf.com/reader/full/contemporary-approaches-to-research 126/284
LEARNING ENVIRONMENT, STUDENT MOTIVATION AND SELF-REGULATION
125
that the individual constructs in the questionnaires were discriminated from each
other.
Assessment of the Research Model
The results for the analysis of the structural model for AMOS, together with the
recommended level of acceptable fit and the fit indices for the research model in
this study are summarized below in Table 3. All of the values satisfied therecommended level of acceptable fit, with the exception of the χ 2. Hair et al. (2010)
noted that, as the sample size increases, there is a tendency for the χ 2 to indicate
significant differences. For these reason, the ratio of χ
2
to its degrees of freedom(χ 2/df) was used, with a ratio of 5 or less being indicative of an acceptable fit
between the hypothetical model and the sample data. The results of the model fit,as shown by the various fit indices in Table 3, indicate that the research model fits
the data well.
Table 3. Results of the model fit of the measurement model
Model fit indices Values Recommendedguidelines
References
χ 2 10290.53
p< 0.001 Nonsignificant Joreskog & Sorbom
(1993); Klem (2000);Kline (2010);McDonald & Ho
(2002); Meeuwisse,Severiens & Born(2010);
χ 2/df 2.80 < 3 Hu &Bentler (1999);
Kline (2010);TLI 0.92 ≥ 0.90 Hu & Bentler (1999);
Klem (2000);McDonald & Ho
(2002);CFI 0.92 ≥ 0.90 Bollen (1989); Byrne
(2010); Hu & Bentler(1999); Klem (2000);McDonald & Ho(2002);
RMSEA 0.036 < 0.05 Browne & Cudeck
(1993); McDonald &Ho (2002);
SRMR 0.053 < 0.05 Hu & Bentler (1999);
Klem (2000);McDonald & Ho (2002)

8/18/2019 (Contemporary Approaches to Research
http://slidepdf.com/reader/full/contemporary-approaches-to-research 127/284
VELAYUTHAM ET AL.
126
The explanatory power of the research model (outlined in Figure 1) was
assessed by calculating the coefficient of determination ( R2) of the endogenous
constructs (Santosa, Wei & Chan, 2005). Falk and Miller (1992) proposed
that the minimum R2 should be 0.10. Table 4 indicates that, for both the PLS and
AMOS analysis, all of the R2 values were higher than this requirement. Thefindings imply that 52% (PLS) and 64% (AMOS) of the variation in students’ self-
efficacy scores in science learning can be accounted for by their perceptions of
their classroom learning environment. The percentage of variation in students’
scores attributed to psycho-social elements in their classroom learning environmentfor the task value and learning goal orientation scales were 44% and 50%,
respectively, for the analysis with PLS, and 55% and 61%, respectively, for theanalysis with AMOS. In addition, for both the PLS and AMOS analysis, the
overall model explained a substantial 69% of the variance on students’ self-
regulation in science learning.
Table 4. Coefficient of determination (R2 ) of the endogenous constructs
Endogenous Construct R2 (PLS) R2 (AMOS)
Task Value (TV) 0.44 0.64Learning Goal (LG) 0.50 0.61Self-efficacy (SE) 0.52 0.55Self-regulation (SR) 0.69 0.69
The standardized beta coefficient of ordinary least squares regressions for each
path in the structural model was used to determine the significance of the path.According to Hair et al. (2011, p. 147), “significant paths showing the
hypothesized direction empirically support the proposed causal relationship”.Table 5 reports the t -value for each hypothesized relationship. The table indicates
that, for the PLS analysis, 18 of the 31 possible relationships were statistically
significant ( p<0.05) and that all statistically significant relationships were positivein direction. In the AMOS analysis, however, only seven of the 31 possible
relationships were significant. All seven of the significant relationships for the
AMOS analysis were significant in the PLS analysis.The first 28 hypotheses were related to whether psychosocial features of the
classroom environment influenced students’ motivation and self-regulation inscience learning. The PLS results indicate that, of the seven learning environment
scales, the three scales of student cohesiveness, investigation and task orientation
were the most likely to influence students’ learning goal orientation, science taskvalue, self-efficacy and self-regulation in science learning. For the AMOS analysisthe results indicate that students’ perception of task orientation was the most likely
learning environment factor to influence their motivation and self-regulation in
science learning.

8/18/2019 (Contemporary Approaches to Research
http://slidepdf.com/reader/full/contemporary-approaches-to-research 128/284

8/18/2019 (Contemporary Approaches to Research
http://slidepdf.com/reader/full/contemporary-approaches-to-research 129/284
VELAYUTHAM ET AL.
128
Equity (EQ) → Learning Goal (LG) 1.07 -0.249
Equity (EQ) → Task Value (TV) 1.22 -0.050
Equity (EQ) → Self -efficacy (SE) 1.39 0.726
Equity (EQ) → Self-regulation (SR) 0.82 -2.112
Learning Goal (LG) → Self -regulation (SR) 2.11* 1.189
Task Value (TV) → Self-regulation (SR) 2.29* 0.750
Self-efficacy (SE) → Self-regulation (SR) 3.98*** 7.042***
Notes: * p < 0.05; ** p < 0.01; *** p < 0.001
The research also examined the effect of the motivational constructs on
students’ self-regulation in science classrooms. For the PLS analysis, all three
motivational constructs strongly influenced students’ self-regulation in science
learning. The AMOS results, however, indicated that students’ self-efficacy wasthe most likely motivational factor to influence students’ self-regulation in science
learning.
Finally, the research compared the results of the two SEM approaches. Thefindings indicated that the PLS analysis could be less stringent than the AMOS
analysis. Although seven of the hypothesised relationships were statistically
significant, 11 additional statistically significant relationships were identified in thePLS analysis. The comparison analysis indicates that the relationships with a t -
value less than 3.99 are indicated as significant in PLS but are not significant for
the AMOS analysis. All of the statistically significant relationships are discussedfurther in the following sections for their possible implications for science
teaching.
DISCUSSION AND IMPLICATIONS OF THE RESULTS
Our findings for both the PLS and AMOS analysis suggest that task orientation
significantly influences students’ learning goal orientation, task value, self-efficacy
and self-regulation in science learning. As shown in Table 1, task orientation isfrom Moos’s (1974) personal growth dimension which emphasizes students’
accessibility to opportunities for personal development and self-enhancement. The
influence of task orientation on students’ motivation and self-regulation in sciencelearning suggests that students need to be aware of the importance of completing
planned activities and staying on the subject matter. The results imply that it is
time well spent when teachers encourage students to get a certain amount of work
done in class. In addition, the results indicate that teachers wishing to improve
motivation should highlight to students the goals of each activity and ensure thatstudents understand what they are required to accomplish in each task. The
findings support Middleton and Midgley’s (2002) suggestion that, for students to

8/18/2019 (Contemporary Approaches to Research
http://slidepdf.com/reader/full/contemporary-approaches-to-research 130/284
LEARNING ENVIRONMENT, STUDENT MOTIVATION AND SELF-REGULATION
129
succeed in academic tasks, teachers need to apply academic press by constantly
challenging students to understand what is being taught in class and to complete
their assigned work.
Both the PLS and AMOS results indicate that teacher support (the extent to
which the teacher helps, befriends, trusts and is interested in the student) has astatistically significant influence on students’ task value. The influence of teacher
support on task value suggests that teachers play a major role in helping students to
recognize the value of the tasks that they are undertaking in class. The implications
are that, if teachers are helpful, friendly and trustworthy to students, students’science task values are likely to increase.
The findings for both the PLS and AMOS analysis indicates that involvementhas a statistically significant influence on students’ self-efficacy in science
learning. This finding makes intuitive sense because students who are involved in
classroom activities that encourage them to ask questions, give opinions and
explain ideas, are more likely to have confidence in their science abilities. The
strong influence of involvement on self-efficacy suggests that teachers who provide opportunities for students to take part in peer and class discussions are
likely to elevate their students’ confidence level. However, it is important to keep
in mind Britner and Pajares’s (2006) recommendation that student involvement
should be tailored to the abilities of individuals to ensure confidence building andsuccess and to minimize efficacy-diminishing failures.
Finally, the finding that self-efficacy is a strong predictor of students’ self-
regulation in science learning is consistent with Zimmerman’s (2002) self-regulated learning theory which contends that self-efficacy beliefs are the
precursor to self-regulated learning. The results suggest that promoting students’self-regulation in science learning could be more successful with prior emphasis on
increasing self-efficacy in science learning. Urdan and Schoenfelder (2006) arguethat student motivation is influenced not only by students’ individual differences
but also by the social and academic features of the classroom learning
environment. They suggest that altering controllable factors such as the
curriculum, teaching style and school or classroom policies could enhance studentmotivation towards learning. The results of our study imply that, to encourage self-
regulated learners in lower secondary science classes, educators must first
implement strategies that could increase students’ self-efficacy in science learning.Our comparative analysis using PLS and AMOS based SEM, indicates that the
results are similar for both the confirmatory factor analysis and the assessment of
the research model. However for the hypotheses testing, AMOS provided a more
rigorous SEM approach, whereby only seven of the 18 statistically significantfindings for the PLS analysis were also significant for the AMOS analysis. The
results support Henseler et al.’s (2011) suggestion that, rather than being
competitive, variance-based PLS and covariance-based AMOS are complementary
SEM approaches. Joreskog (1982) contends that PLS is primarily intended forcausal-predictive analysis in situations of high complexity but low theoretical
information. PLS was used in the present study because it is a prediction-oriented,
theory building exploratory research, with a complex research model emerging

8/18/2019 (Contemporary Approaches to Research
http://slidepdf.com/reader/full/contemporary-approaches-to-research 131/284
VELAYUTHAM ET AL.
130
from a review of literature. However, when prior theory is strong and further
testing and development is the goal, covariance-based AMOS is the most
appropriate approach (Hair et al., 2011; Henseler et al., 2011). In this study, the
concurrent AMOS analysis supported the PLS findings and provided more
stringent results to validate the research model and to confirm the statisticallysignificant relationships. The two approaches complemented each other and
provided rigor to the analysis.
REFERENCES
Afari, E., Aldridge, J. M., Fraser, B. J., & Khine, M. S. (2013). Students’ perceptions of the learning
environment and attitudes in game-based mathematics classrooms. Learning Environments
Research, 16 , 131-150.
Aldridge, J. M., & Fraser, B. J. (2008). Outcomes-focused learning environments: Determinants and
effects. Rotterdam, the Netherlands: Sense Publishers.
Aldridge, J. M., Fraser, B. J., & Huang, I. T. C. (1999). Investigating classroom environments in
Taiwan and Australia with multiple research method. The Journal of Educational Research, 93, 48-
62.
Aldridge, J. M., Fraser, B. J., Bell, L. M., & Dorman, J. (2012). Using a new learning environment
questionnaire for reflection in teacher action research. Journal of Science Teacher Education.
Barclay, D., Higgins, C., & Thompson, R. (1995). The partial least squares (PLS) approach to causal
modeling: Personal computer adoption and uses as an illustration. Technology Studies, 2, 285-309.
Boekaerts, M. (1993). Being concerned with well-being and with learning. Educational Psychologist,
28, 149-167.
Boekaerts, M., & Cascallar, E. (2006). How far have we moved toward the integration of theory and
practice in self-regulation? Educational Psychology Review, 18, 199-210.
Britner, S. L., & Pajares, F. (2006). Sources of science self-efficacy beliefs of middle school students. Journal of Research in Science Teaching, 43, 485-499.
Brookhart, S. M., Walsh, J. M., & Zientarski, W. A. (2006). The dynamics of motivation and effort for
classroom assessments in middle school science and social studies. Applied Measurement in
Education, 19, 151-184.
Chin, W. W. (1998). Issues and opinion on structural equation modeling. MIS Quarterly, 22(1), vii-xvi.
Chionh, Y. H., & Fraser, B. J. (2009). Classroom environment, achievement, attitudes and self-esteem
in geography and mathematics in Singapore. International Research in Geographical and
Environmental Education, 18(1), 29-44.
Corno, L. (1994). Student volition and education: Outcomes, influences, and practices. In B. J.
Zimmerman & D. H. Schunk (Eds.), Self-regulation of learning and performance (pp. 229-254).
Hillsdale, NJ: Lawrence Erlbaum Associates.
Crosbie-Brunett, M., & Lewis, E. A. (1993). Theoretical contributions from social and cognitive
behavioral psychology. In P. G. Boss, W. J. Doherty, R. LaRossa, W. R Schumm, & S. K.
Streinmetz (Eds.), Sourcebook of family theories and methods: A contextual approach (pp. 531-
557). New York: Plenum Press.den Brok, P., Fisher, D., & Koul, R. (2005). The importance of teacher interpersonal behaviour for
secondary science students' attitudes in Kashmir . Journal of Classroom Interaction, 40(2), 5-19.
Doljanac, R. F. (1994). Using motivational factors and learning strategies to predict academic success.
Dissertation Abstracts International, 56 (01A), 0142.
Dorman, J. P. (2001). Associations between classroom environment and academic ef ficacy. Learning
Environments Research, 4, 243-257.

8/18/2019 (Contemporary Approaches to Research
http://slidepdf.com/reader/full/contemporary-approaches-to-research 132/284
LEARNING ENVIRONMENT, STUDENT MOTIVATION AND SELF-REGULATION
131
Dorman, J. P. (2008). Use of multitrait-multimethod modelling to validate actual and preferred forms of
the What Is Happening In this Class? (WIHIC) questionnaire. Learning Environments Research, 11,
179-193.
Dorman, J. & Adams, J. (2004). Associations between students’ perceptions of classroom environment
and academic efficacy in Australian and British secondary schools. International Journal of
Research and Method in Education, 27 (1), 69-85.
Eccles, J. (1983). Expectancies, values, and academic behaviors. In J. T. Spence (Ed.), Achievement and
achievement motives (pp. 75-146). San Francisco: Freeman.
Falk, R. F., & Miller, N. B. (1992). A primer for soft modelling . Akron, OH: University of Akron Press.
Fornell, C., & Larcker, D. F. (1981). Evaluating structural equation models with unobservable variables
and measurement error. Journal of Marketing Research, 18(1), 39-50.
Fraser, B. J. (1998). Classroom environment instruments: Development, validity and applications.
Learning Environments Research, 1, 7-34.Fraser, B. J. (2001). Twenty thousand hours: Editors Introduction. Learning Environments Research, 4,
1-5.
Fraser, B. J. (2007). Classroom learning environments. In S. K. Abell & N. G. Lederman (Eds.),
Handbook of research on science education (pp. 103-124). Mahwah, NJ: Lawrence Erlbaum
Associates.
Fraser, B. J. (2012). Classroom learning environments: Retrospect, context and prospect. In B. J. Fraser,
K. G. Tobin, & C. J. McRobbie (Eds.), The second international handbook of science education (pp.
1191-1239). New York: Springer.
Fraser, B. J., Aldridge, J. M., & Adolphe, F. S. G. (2010). A cross-national study of secondary science
classroom environments in Australia and Indonesia. Research in Science Education, 40, 551-571.
Gefen, D., & Straub, D. (2005). A practical guide to factorial validity using PLS-Graph: Tutorial and
annotated example. Communications of the Association for Information Systems, 16 , 91-109.
Gefen, D., Straub, D., & Boudreau, M. (2000). Structural equation modeling techniques and regression:
Guidelines for research practice. Communications of the Association for Information Systems, 7 (7),
1-78.Glynn, S. M., Taasoobshirazi, G. & Brickman, P. (2007). Nonscience majors learning science: A
theoretical model of motivation. Journal of Research in Science Teaching, 44, 1088-1107.
Hair, J. F., Ringle, C. M., & Sarstedt, M. (2011). PLS-SEM: Indeed a silver bullet. Journal of
Marketing Theory and Practice, 19, 139-151.
Hanrahan, M. (2002, July). Learning science: Revisiting humanist dimensions of intellectual
engagement. Paper presented at the annual meeting of the Australasian Science Education Research
Association, Townsville, Australia.
Hensler, J., Ringle, C. M., & Sinkovics, R. R. (2009). The use of Partial Least Square path modeling in
international marketing. Advances in International Marketing, 20, 277-319.
Hulland, J. (1999). Use of partial least squares (PLS) in strategic management research: A review of
four recent studies. Strategic Management Journal, 20, 195-204.
Kaplan, A., & Maehr, M. (1999). Achievement goals and student well-being. Contemporary
Educational Psychology, 24, 330-358.
Kaplan, A., & Maehr, M. L. (2007). The contribution and prospects of goal orientation theory.
Educational Psychology Review, 19, 141-187.
Kim, H., Fisher, D. L., & Fraser, B. J. (2000). Environment and teacher interpersonal behaviour in
secondary science classes in Korea. Evaluation Research in Education, 14(1), 3-22.
Khoo, H. S., & Fraser, B. J. (2008). Using classroom psychosocial environment in the evaluation of
adult computer application courses in Singapore. Technology, Pedagogy and Education, 17 (1), 67-
81.
Kupermintz, H. (2002). Affective and cognitive factors as aptitude resources in high school science
achievement. Educational Assessment, 8, 123-137.

8/18/2019 (Contemporary Approaches to Research
http://slidepdf.com/reader/full/contemporary-approaches-to-research 133/284
VELAYUTHAM ET AL.
132
Kuyper, H., van der Werf, M. P. C., & Lubbers, M. J. (2000). Motivation, meta-cognition and self-
regulation as predictors of long term educational attainment. Educational Research and Evaluation,
6 , 181-201.
Lau, S., & Roeser, R. W. (2002). Cognitive abilities and motivational processes in high school students’
situational engagement and achievement in science. Educational Assessment, 8, 139-162.
Lee, L. H. (1997). Goal orientation, goal setting, and achievement performance in college students: An
integrated model of achievement motivation in school settings. Dissertation Abstracts International,
59(06A), 1905.
Lee, O., & Brophy, J. (1996). Motivational patterns observed in sixth-grade science classrooms.
Journal of Research in Science Teaching, 33, 585-610.
Lewin, K. (1936 ). Principals of topological psychology. New York: McGraw.
Lorsbach, A. W., & Jinks, J. L. (1999). Self-efficacy and learning environment research. Learning
Environments Research, 2, 157-167.Martin-Dunlop, C., & Fraser, B. J. (2008). Learning environment and attitudes associated with an
innovative course designed for prospective elementary teachers. International Journal of Science
and Mathematics Education, 6 , 163-190.
Middleton, M. J., & Midgley, C. (2002). Beyond motivation: Middle school students’ perceptions of
press for understanding in math. Contemporary Educational Psychology, 27 , 373-391.
Midgley, C. (2002). Goals, goal structures, and patterns of adaptive learning . Mahwah, NJ: Lawrence
Erlbaum.
Moos, R. H. (1974). The social climate scales: An overview. Palo Alto, CA: Consulting Psychologists
Press.
Murray, H. A. (1938). Explorations in personality. New York: Oxford University Press.
Napier, J. D., & Riley, J. (1985). Relationship between affective determinants and achievement in
science for seventeen-year olds. Journal of Research in Science Teaching, 22, 365-383.
Nix, R. K., Fraser, B. J., & Ledbetter, C. E. (2005). Evaluating an integrated science learning
environment using the Constructivist Learning Environment Survey. Learning Environments
Research, 8, 109-133. Nunnally, J. C. (1978). Psychometric theory. New York: McGraw-Hill.
Ogbuehi, P. I., & Fraser, B. J. (2007). Learning environment, attitudes and conceptual development
associated with innovative strategies in middle-school mathematics. Learning Environments
Research, 10, 101-114.
Pajares, F. (2001). Toward a positive psychology of academic motivation. Journal of Educational
Research, 95, 27-35.
Pajares, F. (2002). Gender and perceived self-efficacy in self-regulated learning. Theory into Practice,
41, 116-125.
Pajares, F., & Urdan, T. (Eds.). (2006). Adolescence and education: Self-efficacy beliefs of adolescents.
Greenwich, CT: Information Age.
Pajares, F., Britner, S.L., & Valiante, G. (2000). Relation between achievement goals and self beliefs of
middle school students in writing and science. Contemporary Educational Psychology, 25, 406-422.
Pajares, F., & Schunk, D. H. (2001). Self-beliefs and school success: Self-efficiency, self-concept, and
school achievement. In R. Riding & S. Rayner (Eds.), Perception (pp. 239-266). London: Ablex.
Pintrich, P. R. (1989). The dynamic interplay of student motivation and cognition in the college
classroom. In C. Ames & M. Maehr (Eds.), Advances in motivation and achievement: Motivation
enhancing environments (pp. 117-160). Greenwich, CT: JAI Press.
Pintrich, P. R. (2000). The role of goal orientation in self-regulated learning. In M. Boekaerts, P. R.
Pintrich, & M. Zeidner (Eds.), Handbook of self-regulation (pp. 451-502). San Diego, CA:
Academic Press.
Pintrich, P. R. (2003). A motivational science perspective on the role of student motivation in learning
and teaching contexts. Journal of Educational Psychology, 95, 667-686.
Pintrich, P. R., & De Groot E. V. (1990). Motivational and self-regulated learning components of
classroom academic performance. Journal of Educational Psychology, 82, 33-40.

8/18/2019 (Contemporary Approaches to Research
http://slidepdf.com/reader/full/contemporary-approaches-to-research 134/284
LEARNING ENVIRONMENT, STUDENT MOTIVATION AND SELF-REGULATION
133
Pintrich, P. R., Marx, R. W., & Boyle, R. A. (1993). Beyond cold conceptual change: The role of
motivational beliefs and classroom contextual factors in the process of conceptual change. Review of
Educational Research, 63, 167-199.
Rutter, M., Maughan, B., Mortimore, P., Outsome, J., & Smith, A. (1979). Fifteen thousand hours:
Secondary schools and their effects on children. Cambridge, MA: Harvard University Press.
Santosa, P. I., Wei, K. K., & Chan, H. C. (2005). User involvement and user satisfaction with
information-seeking activity. European Journal of Information Systems, 14, 361-370.
Shaughnessy, M. F. (2004). An interview with Anita Woolfolk: The educational psychology of teacher
efficacy. Educational Psychology Review, 16 , 153-176.
Schunk, D. H., & Zimmerman, B. J. (2007). Influencing children’s self-efficacy and self-regulation of
reading and writing through modeling. Reading & Writing Quarterly, 23, 7-25.
Urdan, T., & Schoenfelder, E. (2006). Classroom effects on student motivation: Goal structures, social
relationships, and competence beliefs. Journal of School Psychology, 44, 331-349.Veyalutham, S., Aldridge, J.M., & Fraser, B.J. (2011). Development and validation of an instrument to
measure students’ motivation and self-regulation in science learning. International Journal of
Science Education, 5, 2159-2179.
Wolf, S. J., & Fraser, B. J. (2008). Learning environment, attitudes and achievement among middle
school science students using inquiry-based laboratory activities. Research in Science Education,
38, 321−341.
Wolters, C. A. (1999). The relation between high school students’ motivational regulation and their use
of learning strategies, effort, and classroom performance. Learning and Individual Differences, 11,
281-300.
Wolters, C., & Rosenthal, H. (2000). The relation between students’ motivational beliefs and their use
of motivational regulation strategies. International Journal of Educational Research, 33, 801-820.
Zimmerman, B. J. (2000). Self-efficacy: An essential motive to learn. Contemporary Educational
Psychology, 25, 82-91.
Zimmerman, B. J. (2002). Becoming a self-regulated learner: An overview. Theory into Practice, 41(2),
64-70.Zimmerman, B. J. (2008). Investigating self-regulation and motivation: Historical background,
methodological developments, and future prospects. American Educational Research Journal, 45,
166-183.
Sunitadevi VelayuthamCurtin University, Australia
Jill AldridgeCurtin University, Australia
Ernest Afari Petroleum Institute, Abu Dhabi, UAE

8/18/2019 (Contemporary Approaches to Research
http://slidepdf.com/reader/full/contemporary-approaches-to-research 135/284
M.S. Khine (ed.), Application of Structural Equation Modeling in Educational Research and
Practice, 135–167.
© 2013 Sense Publishers. All rights reserved.
HASAN ŞEKER
7. IN/OUT-OF-SCHOOL LEARNING
ENVIRONMENT AND SEM ANALYSES USAGE
ATTITUDE TOWARDS SCHOOL
IN- AND OUT-OF-SCHOOL FACTORS AFFECTING
ATTITUDES TOWARDS SCHOOL
What Are School Attitudes Related to?
There are many factors such as teacher behaviors, school rules, classroomenvironment, student family, the student himself/herself, teaching process, examstaken and evaluation processes thought to be influential on attitudes towardsschool. To what extent are these factors influential on forming attitudes towardsschool? Or, to what extent can these factors account for attitudes towards school?Such questions can be answered to some extent within factor analyses. When youasked a student what his/her attitudes towards school are and to explain whathe/she feels about school, he/she can make explanations based on above-mentionedfactors. In different environments or cultural structures, factors determiningattitudes towards school and between-factor relationships can differentiate. For
instance, factors such as physical conditions of a school or the distance betweenthe school and the house and availability of cutting-edge technologies are alsorelated to school attitudes and reactions towards these factors can also varydepending on different socio-cultural environments. Moreover, at different levelsof schooling, reactions towards factors can differentiate. At that point, thefollowing questions or similar ones should be answered:
Will the test items to be developed related to attitudes towards school be prepared based on local considerations or universal considerations? If they are to be developed based on local considerations, it will be natural to write a largenumber or different factors suitable for the given socio-cultural environment. If thechild’s relationships with the teacher are to be considered one of the factors orvariables, then the responses to be given to an item written in relation to this factormay change from one culture to another. For instance, the responses to be given to
this statement “I can have an eye contact with my teacher within the classenvironment” may vary depending on the culture. Zalaquett, McHatton andCranston-Gingras (2007) reported that some migrant students experiencedifficulties speaking with unfamiliar people and avoid making eye contact with anauthority figure or older person as a sign of respect. In some societies, there aresimilar attitudes adopted as a sign of respect. For instance, in some societies, afather’s being affectionate to his children in the presence of his own father is

8/18/2019 (Contemporary Approaches to Research
http://slidepdf.com/reader/full/contemporary-approaches-to-research 136/284
ŞEKER
136
regarded as a sign of disrespect to the grandfather. In societies where avoiding aneye contact with older people or authority figures is considered to be a sign ofrespect, the responses to be given to the above-mentioned statement may not bedirectly related to attitudes towards school. Moreover, for which level of schoolingwill the test to be developed be prepared? Without doubt, components of theattitudes of pre-school children and young children will naturally be different fromthose of the attitudes of university students or adults.
Attitudes
What will our measurement tool be designed to measure? Achievement?, Ability?,Intelligence? or Attitude? If the purpose is to design a measurement tool toevaluate attitudes towards school, then the content of the attitude should becarefully examined. Eagly and Chaikens’s widely cited definition of the term ofattitude, “a psychological tendency that is expressed by evaluating a particularentity with some degree of favor or disfavor” (as cited in Wittenbrink, 2007). Theterm attitude refers to global and enduring favorable or unfavorable predispositionstoward a stimulus or class of stimuli (Wittenbrink, 2007). The term attitude may bedefined as a learned predisposition (‘set’) to evaluate or react consistently in a
particular manner, either positively and negatively, to certain persons, places,concepts, or things (Roeckelein, 1998).
In attitude studies, the widely accepted belief is that there are three componentsof attitude (Kruglansky, 2007; Roeckelein, 1998). These three components areaffective/evaluative, cognitive/belief, and behavioral/action. According to three
component-model, attitude expresses people’s feeling, belief and past behaviorsregarding the attitude subject. Through the process of self-perceptions andcognitive dissonance, people tend to decide that they like something when they canrecall doing it often.
It is also difficult to identify each component of attitude with certain limits initself. For these reasons, attitudes are thought with some concepts and sometimesthey are confused. Cognitive responses of a nonverbal kind are more difficult toassess, and the information they provide about attitudes is usually more indirect(Aizen, 2005). In his study, Aizen investigated responses used to infer attitudes,cognition, affect and response mode in conation dimension and categories ofresponse. The fact that there are three components of attitudes and the responses toattitude objects are both verbal and nonverbal makes it difficult to distinguishattitudes from other concepts. In Aizen’s (2005) study, there are concepts such as
belief, perceptual reaction, behavioral intention, and overt behaviors within three-dimensioned attitudes. This situation shows the boundaries of attitude concept andits relation with other concepts. Eagly and Chaikens’ widely cited definition statesthat attitude is ‘a psychological tendency that is expressed by evaluating a
particular entity with some degree of favor or disfavor’ (as cited in Wittenbrink,2007).
While forming the school attitude items, these three components of attitudeshould be considered. For example, I feel myself lucky as I am a student in this

8/18/2019 (Contemporary Approaches to Research
http://slidepdf.com/reader/full/contemporary-approaches-to-research 137/284
IN/OUT OF SCHOOL LEARNING ENVIRONMENTS
137
school (effective component), Negative attitudes of the people in my close circletowards school affect my eagerness negatively (cognitive component), Teachersare only interested in hard working students (behavioral component). Attitudeitems should be constructed in such a way as to cover these three components.
School Attitude
The term attitude may be defined as a learned predisposition (‘set’) to evaluate orreact consistently in a particular manner, either positively and negatively, to certain
persons, places, concepts, or things (Roeckelein, 1998). What is meant by school
attitude? It is a complex term. It can be claimed that the studies in school attitudescan only partly explain. This may be due to the fact that it is a higher level conceptin school system approach rather than concept misunderstandings andmisconceptions. The variables concerning attitudes towards school cannot bethought separately from the classroom learning environment, school environment,social environment and classroom climate. Attitudes towards school are related tonot only the classroom learning environment but also the school environment.Studies of student perspectives and behaviors show that many factors affectattitudes towards school. Factors such as parental attitude, school belongingness,school bonding, peer relationship, liking teachers, friendship, teaching atmosphereand their impacts are explored below as they relate to student attitudes towardsschool. In general, school attitudes are related to in- and out-of school factors and
personal/individual factors (Şeker, 2011).When the related studies are scrutinized, it is difficult to isolate the concept of
school attitudes from among many related concepts. When affective, cognitive and behavioral dimensions of attitude are taken into account, it may be more difficultto discern it from other concepts. It has been observed that the concepts that can bedeemed to hold the same meaning for school attitudes are expressed using differentconcepts. For example ‘social environment’ can be used equally with ‘classroomclimate’ (Anderson, Hamilton, & Hattie, 2004). In Dorman’s (2009) study, schoolenvironment and school climate have been used similarly. “Classroom learningenvironment is defined as students’ perception of or reaction to their learning tasksand classroom instruction” (as cited in Waxman & Huang, 1998). School attitudecan involve student reactions to learning tasks and classroom instructions. It seemsthat the concept of attitude towards school is more comprehensive than conceptssuch as student’s perceptions of teaching and learning environment, and‘classroom learning environment’. The factors such as peer groups and parental
approach to school are considered within school attitude. School attitude iscombined with both in-school and out-school variables, such as family and peergroups, and it cannot be confined to the classroom learning environment alone. Inaddition to school attitude, emphasis is given to in-school and out-school learningand the effect of social environment on student’s predisposition is depicted. Somefactors that can be related to school attitudes are discussed below.
For many of us, the first day at school is special. This is the day which usuallymakes students and families exited. For some, it is boring and even a nightmare,
8/18/2019 (Contemporary Approaches to Research
http://slidepdf.com/reader/full/contemporary-approaches-to-research 138/284
ŞEKER
138
yet, for some others, it is a day longed for a long time. What are the factors leadingto the formation of such different attitudes?
What Are the Factors That May Affect Our School Attitudes?
Our school attitudes might be affected by the school’s learning environment or in-school education and instruction, administration and school program. Yet, only in-school factors cannot explain school attitudes sufficiently. The concept of schoolattitude can be related to in-school factors as well as out of-school factors and
personal/individual factors. School attitude was viewed as a combination of both
in-school and out-of-school variables, such as family and peer groups, and was notconfined to the classroom learning environment alone. Emphasis also was given toin-school and out of-school learning and the effect of the social environment on astudent’s predisposition.
The Factors Affecting School Attitudes
Thus far, many studies have proved the reasonable assumption that if the attitudeof a student towards school is positive, his success at school will be high and if hisattitudes are negative, his success at school will be low. The studies conducted inthe field have showed that variables such as student’s seeing himself as someone
belonging to school, interest of the family in school, quality of the classroomteaching and learning processes have varying effects on school success andstudent’s attitudes towards school. As far as we know, in none of these studies, wecan see to what extent the factors affecting the attitudes towards school altogetheraffect the school attitude.
Many factors affecting school attitude affect the attitudes in compliance witheach other are examined? For instance, study X can explain the effects of factor Aon attitudes towards school, yet it cannot explain the effects of factors B, C, and Dthat can simultaneously affect the attitudes towards school. Moreover, it cannotexplain the effects of factors ABCD in combination. Former studies developed anattitude questionnaire that is very comprehensive and that can examine the effectsof many factors affecting the attitudes towards school.
Studies in this field show that many factors affect the attitudes towards school.As it is cited below, it is generally seen that the factors such as parental attitude,school belongingness, school bonding, peer relationship, liking teachers,friendship, and teaching atmosphere affect attitudes towards school. In the study
conducted by Holfve-Sabel and Gustafsson (2005), the content of the questionnairedeveloped to investigate the attitudes of students towards school emphasizes threemain areas: (a) Students’ interests in school in relation to classroom factors(boredom experienced by students in the classroom, monotonous activities, funactivities, desire to leave the school activities early, unwillingness to come toschool, and necessity of knowledge obtained at school); (b) Views of the teachers,teachers’ commitment to their promises, teachers with peaceful and nice behavior,teachers helping their students, and their concern for the problems of students; and

8/18/2019 (Contemporary Approaches to Research
http://slidepdf.com/reader/full/contemporary-approaches-to-research 139/284
IN/OUT OF SCHOOL LEARNING ENVIRONMENTS
139
(c) relations with the classmates (hostility among students, feeling of loneliness,etc.).
Teacher Competence
Teacher competence can be seen as another factor effective in the formation ofattitudes. Developing positive attitudes to learning and strengthening one’s self-confidence is of importance, as well as developing other life skills. It is reasonableto assume that teacher competence is related to students’ attitudes to school workand learning as well as students’ self-confidence and self-conceptions. There are
high correlations between teacher competence, school attitudes and self-confidence(Malm & Löfgren, 2006).
Academic Success
Students’ sense of achievement and positive attitudes toward the quality ofschool life are likely indicators of improved school performance (Silins & Murray-Harvey, 2000). Negative attitudes towards school may stem from the failureexperienced at school and may affect the school performance (McCoach, 2002).McCoach (2002) states that the best predictor of success in school is aptitude, andit can explain 50% of the variance observed in student scores. This proves that theonly factor affecting academic success is not aptitude alone; there are also otherfactors that influence the success of the student.
There are studies showing the relation between students’ attitudes and theiracademic success (McCoy, 2005; Legum & Hoare, 2004; Bryant et al., 2003;McCoach, 2002; Hung & Marjoribanks, 2005; Hoower-Dempsey, Besler, &Brissie, 1992). However, some studies show that the academic success for onecourse can be the indication of the student’s general attitude towards school. InReynolds’ (2001) study, a relation was found between students’ attitudes towardsschool and their academic success in mathematics. In Maher’s (2000) study, highlysignificant correlations were observed between students’ general attitudes towardsschool and their attitudes towards courses (Science, Mathematics, Social Sciences,Language). On the other hand, in Morrell and Lederman’s (1998) study, althoughstudents showed positive attitudes towards school, they do not show positiveattitudes towards science course. Moreover, a weak correlation is observed
between their attitudes towards school and science course. Hence, students’negative attitudes towards a course may not reflect their general attitudes towards
school. Attitudes towards school just indirectly affect students’ success (Maher2000).
Correlation studies revealed that if students’ attitudes towards an object are positive, it is possible to see weak correlation between this object and the ones to be compared with it. In such studies, great care should be taken while selecting thesample.

8/18/2019 (Contemporary Approaches to Research
http://slidepdf.com/reader/full/contemporary-approaches-to-research 140/284
ŞEKER
140
Attitudes of Peer Groups
In the study conducted by McCoach (2002, p. 72), high correlations are observed between the attitudes towards school and attitudes of peer groups, motivation andself-regulation. The study shows that the students whose success levels are belowaverage exhibit more negative attitudes towards school than the students whosesuccess levels are above average. Students’ having a negative image of the schoolmay be the reason for many other factors to be negatively perceived. Hence,having a positive image of the school may affect the attitudes towards school
positively. In Şeker and Kömür’s (2004) study, it was found that the students who perceive themselves as unsuccessful tend to perceive classroom atmosphere,
teaching environment and the teacher as unsuccessful. Research in the peerrelationship literature has indicated that peers might influence learners’ attitudeand beliefs about school as well as their academic achievement (cited in Nelson &DeBocker, 2008).
Belongingness and School Membership
In Libbey’s (2004) study, nine factors (academic tendency of the students, belonging, fairness, out of program activities, liking the school, student voice, peerrelations, security and teacher support) are found to be related to the schoolattitude.
Belongingness mediates student-teacher cooperation and leads to positiveschool attitude. Positive student-teacher relationship increases students’ positive
school-related attitude because this promotes a greater sense of school belongingness (Pintrich & Meaher, 2004). Belongingness beliefs were not onlyrelated to student achievement. In addition, belongingness was significantly andnegatively related to absenteeism when the effect of achievement was controlled.Researchers have been increasingly interested in the relationship between thestudents’ perceptions of belongingness and their resultant motivation andachievement in the school setting (Nichols, 2008). In Goodenow’s study, it isobserved that school membership has a primary role in student’s engagement inacademic activities and contributes to student motivation. Goodenow focused
primarily on the role of perceived school membership in maintaining studentmotivation and their engagement in academic activities. Students’ sense of
belongingness affects their motivation, learning and development (as cited inAnderman & Freeman, 2004)). There are significant points of overlap between
school bonding and attitude towards school. Attitudes towards school containsimilar elements as attachment to school, school commitment, and attachment to personnel, but it lacks a behavioral component such as a school involvement(Maddox & Prinz, 2003).
Although many student performances depend on the quality of teaching andability of student, participation in school activities is essential for success. Thequality of teaching also affects the participation. Success obtained from the
performance influences the level of importance attached to school-related goals.

8/18/2019 (Contemporary Approaches to Research
http://slidepdf.com/reader/full/contemporary-approaches-to-research 141/284
IN/OUT OF SCHOOL LEARNING ENVIRONMENTS
141
Gaining identity affects participation as a positive cycle (Leithwood, Aitken, &Jantzi, 2006).
Students Family
Families regard the quality of education as an important criterion in the selecting ofschool. However, some studies show that selection decision is related to factorssuch as the situation of general school environment and student activities, whichare not academic factors (Kemerer, 1994, cited in Pritchett, Schwartz, & Slate,2000, p. 3). Grandmond points out that the participation of the family affects
student success more than the other factors (cited in Pritchett, Schwartz, & Slate,2000, p. 3). Both father involvement and mother involvement significantly andindependently contributed to positive school attitudes (Flouri, Buchanan, & Bream,2002). In Kaplan, Turner and Badger’s (2007) study, girls who felt that theirmothers understood them, showed interest in them and respected their points ofview, which are components measured by the Mutuality scale, were likely to havemore positive feelings towards school. Girls who have a higher degree of mutualitywith their mothers are more likely to enjoy school. Heaven, Mok, Barry andCiarrochi (2002) express a significant relationship between parental care andschool attitude. In Papanastasiou and Elena’s (2004) study, it is argued thateducational backgrounds of the family and school have influence on students’attitudes. Parents’ views will play an important role because parents are animportant linking pin between the school environment and the world outside theschool (Roelofs, Visser, & Terwel, 2003). The study conducted by Allen and
Fraser (2007) shows that the relationship between parents’ perceptions of thelearning environment and their children’s outcomes (attitudes and achievement)was explored and possible associations were identified. The study by Flouri,Buchanan and Bream (2002, p. 579) shows that the perceived involvement of boththe parents in-school activities helps the student to develop positive attitudestowards school. A weak relationship is observed between learning and the attitudesof the socially disadvantaged students towards school.
Rousseau, Hassan, Measham, Moreau, Lashley, Castro, Blake and McKenzie(2009) conducted a study called “Family relations, school attitude …” and theyemployed Resnicowetal’s 26-item School Attitude-Bonding (SAB) scale. Thisscale includes factors related to teachers, academic requirements, and their feelingsof safety at school. The findings of the study revealed that a significant negativecorrelation was noted between family conflict and school attitude. Conversely, the
higher the family cohesion, the better the attitude towards school. Significantrelationships were observed between the means of intra-family communication andthe school attitudes of compliant students.
Extracurricular Activities
Adolescents who participated in extracurricular activities reported higher grades,more positive attitudes toward schools (Darling, Caldwell, & Smith, 2005).

8/18/2019 (Contemporary Approaches to Research
http://slidepdf.com/reader/full/contemporary-approaches-to-research 142/284
ŞEKER
142
Adolescents who participated in school-based extracurricular activities were morelikely to perform better in school, have a more positive attitude toward it, and
believe that they will remain in school longer (Darling, 2005). Student must feelsafe if they are to become more involved. A safe climate not only leads toincreased academic achievement and decreased propensity to drop out, it alsosignificantly increases student involvement (McNeal, 1999).
Measuring a trait requires to go through some phases. Efforts similar toreviewing literature as given above (especially when the trait to be measured isschool attitude) are necessary to write criteria and items for the measurement of thegiven trait. Developing an original test is more difficult than adapting an alreadydeveloped scale into other languages. The most outstanding difficulty is writingitems complying with the theoretical structure of the given trait because theoreticalstructure of the trait should be well analyzed and its dimensions should beunderstood well. That is, the theoretical structure proposed for the given traitshould be well understood. Otherwise, the findings obtained as a result of a studymay not be supported by the theoretical structure of the trait.
The review presented above shows that school attitudes are affected by many in-school and out-of-school factors. Factors actually related to school attitude andthose having potential to be related should be determined. Then, care should betaken to include items that are reliable and valid representatives of these factors inthe measuring tool.
In the SEM analysis, we examine the factors influencing the school attitude,which in turn affect the attitudes that are in compliance with each other. By usingthe structural equation modeling (SEM), a model that shows the compliance
among these factors and accordingly helps to make more deductions wasdeveloped.
What, to What Extent and How Do We Measure?
What is the extent to which the reality is represented through measurement tools?It is possible to put forth some criticisms about whether a measurement toolrepresents the reality. Even though a “perfect” tool was developed, this tool could
be criticized as it is not flexible enough or cannot represent all shades of thereality. Such criticisms have always been done in many fields of social sciences.For example, such questions as “How humane is to educate students according to
predetermined goals?”, “Is it possible to predetermine the knowledge and skills to be gained by students for all subject areas?” “Can they be same?”, can be
frequently seen in program development studies where processes come to the fore.On the basis of such questions or criticisms lies the belief that training studentsaccording to predetermined target behaviors is not very humane. Moreover,
predetermined target behaviors or criteria can make up only limited sample of therelated field and in some field they may not represent the reality. Similar criticismscan be directed to studies dealing with academic achievement and affectiveassessments. Therefore, assessment of school attitude is a hard task.

8/18/2019 (Contemporary Approaches to Research
http://slidepdf.com/reader/full/contemporary-approaches-to-research 143/284
IN/OUT OF SCHOOL LEARNING ENVIRONMENTS
143
When we want to determine the scope of a measurement tool, we may encountersome difficulties. For example, when we want to evaluate a drama activity (onwhich I am not very experienced), it is not enough to consider only performance-related elements such as gestures, mimics, use of voice etc. but technical anddesign factors such as lighting, design and shape of the stage and costumes shouldalso be taken into consideration. If the study is planned considering these facts,then there are three main factors to be considered to assess the drama activity: (a)
performance, (b) technical equipment, (c) design-related factors. Hence, itemscovering all these factors should be developed and included in the measurementtool. However, is a drama performance only limited to these factors? Despite ourlimited experience in this field, we can provide answer “no”. Hence, inclusion ofother factors may reduce the limitations of the measurement tool to be developed.Factor analysis as a tool that brings order to the way we see things by determiningwhich variables are related and which are not (Bryman & Cramer, 2006, p. 325). Inaddition, including some other variables such as the age group of the participantsmay result in giving new forms to our measurement tools.
In his book of pragmatism, William James stated that rationalism scornsexperimentalism “as it reflects the color richness of the world in a dull manner”. Inthis regard, as in the case of painting the reality as it is in our canvas without losingthe brightness of colors, our measurement tool should also reflect the reality andthis is only possible when the validity of the instrument is established.
Some Data Collection Approaches to Collect Data Related to the Scope of the Test
Formation of test structure and test items can be made easier by using somemethods as the following. For example, the data to be collected, – Open and closed-ended questions – Interviews – Observations – Action research – Case study – Narrative strategies – Memoirs etc.
These methods can have important contributions to the establishment of criteriafor the measurement instrument and construction of test items. Yet, there may besome limitations resulting from the method employed. However, the data collectedthrough these instruments and methods can bring a broad perspective to the scale.
Open-Ended Questions
Closed-ended questions can be answered by using predetermined options such as“I strongly agree”, “I strongly disagree” or “yes” or “no” to the pre-constructeditems. Open-ended questions can be responded more freely when compared toclosed-ended questions. Open-ended questions have an important advantage overthe closed-ended ones which is that they reduce the artificiality and lack of variety.Though the analysis of closed-ended questions is relatively easier, they are

8/18/2019 (Contemporary Approaches to Research
http://slidepdf.com/reader/full/contemporary-approaches-to-research 144/284
ŞEKER
144
inadequate for reflecting the colors of the reality. Open-ended questions may alsoserve the function of selecting items having greater potential to represent theuniverse. Through open-ended questions, highly different and high number ofalternatives can be elicited. Duvarger (2006) calls these questions “cafeteriaquestions” due to this property. These questions may yield self-service responses-reactions for every participant. Despite this unlimited freedom brought about byopen-ended questions, they should be developed based on a reference point. In thisway, responses serving the purpose of the test can be elicited.
Narrative, Autobiographies
Methods such as narrative stories, memoirs, autobiographies, case studies can beused to establish item pool. Narratives including information concerning personalexperiences are special tools to explain applications and practices(Gudmundsdottir, 1995 cited in Fottland, 2004). Studies based on narratives canhelp us to understand people’s educational reflections on their previouslyconstructed beliefs and they can also serve the function of helping people to reflecton their previously-constructed feelings, opinions and beliefs. Narrative stories
provide a rich backdrop for understanding the contextualized situations in whichteachers come to know what they know and make the decisions that they do(Rushton, 2004).
In literature reviews, it is seen that case studies are also used as narrativedescriptions (Riggs & Ve Sefarin, 1998). Besides narratives and autobiographies,memoirs can also be effectively used during the testing process. Autobiographic
narrations of learning and teaching are stories related to how learning and teachingshould be (Fottland, 2004). By understanding these narratives, what is happeningin learning and teaching environment where students and teachers are present can
be comprehended to a great extent.Autobiographies, narratives, case studies and memoirs, as in open-ended
questions, can help to establish trial structures by conducting content analysis andconstruct items for these trial structures. How is this done? All of the memoirsand/or autobiographies written by the sampling or study group in a studyemploying these methodologies can generally be read, then, they are classifiedunder certain themes by rereading them. The things classified under some certainthemes are in fact trial factor constructs for the tests thought to be developed. Afterthat, expert opinions should be sought whether the memoirs/narratives or open-ended questions are related to a given theme. They can be asked which themessome selected memoirs, narratives, open-ended questions or autobiographicnarrations should be included in. In this connection, opinions of different expertsare sought relating which factors memoirs are associated with and looking at inter-rater consistencies can help establish the consistency of the whole test.
There are four excerpts below written by students about their memoirs of goodeducation. Let’s look at these memoirs.

8/18/2019 (Contemporary Approaches to Research
http://slidepdf.com/reader/full/contemporary-approaches-to-research 145/284
IN/OUT OF SCHOOL LEARNING ENVIRONMENTS
145
(Student 1) In science and technology class, the teacher divided us into groups and
gave each group a thermometer. Then he took the groups outside the class. The
groups measured the temperature. Then the groups made short presentations
about their measurements …. At the end of the lesson, I perfectly learned how and
under which conditions to use a thermometer …
(Student 2) … Our teacher selected two novels and then determined a voluntary
group to work on these novels. We determined the characteristics, superficial
aspects etc. and then discussed with the other group … For the first time, we as students were in the fore front. We realized that we have broad viewpoint on novel
…
(Student 3) … We carried out an experiment about air-pressure when I was a
second-year student at university. We connected the pipes and hung them on thewall. We filled sour-cheery juice into the pipe. Then, we blew into the pipe and in
this way we demonstrated air-pressure
(Student 4) … While we were learning some trends in educational philosophy in
the course of introduction to educational sciences, we watched the film “Dead
poets society” in order to see the applications of these trends … this was a lessonwhere I learned without memorizing …
From the memoirs of the students given below, following criteria can be drawnrelated to good teaching (without doubt, with larger sample, more criteria can be
obtained for the test to be developed):The first student emphasizes the importance of group interaction and
experience. The second student sees group work and active participation asimportant for good teaching, the third one points out learning by doing andconcrete experiences and the fourth student attaches more importance to the use oftechnology and media. In this respect, the items to be included in the test of goodteaching should be designed in such a way as to elicit students’ opinions about thetrial criteria to be drawn from the above-given memoirs of the students.
Original Test Development
The stages of operation and flow chart to be followed in original test developmentcan be as follows. Test development stages for attitude and ability test are given in
Figure 1.
Data Collection for the Structure of the Test to Be Developed
On which topics are data collected? First thing to be considered should be the typeof the scale. For instance, if the aim is to develop a scale to evaluate schoolattitudes, first questions such as “What are school attitudes?”, “What is attitude?”,
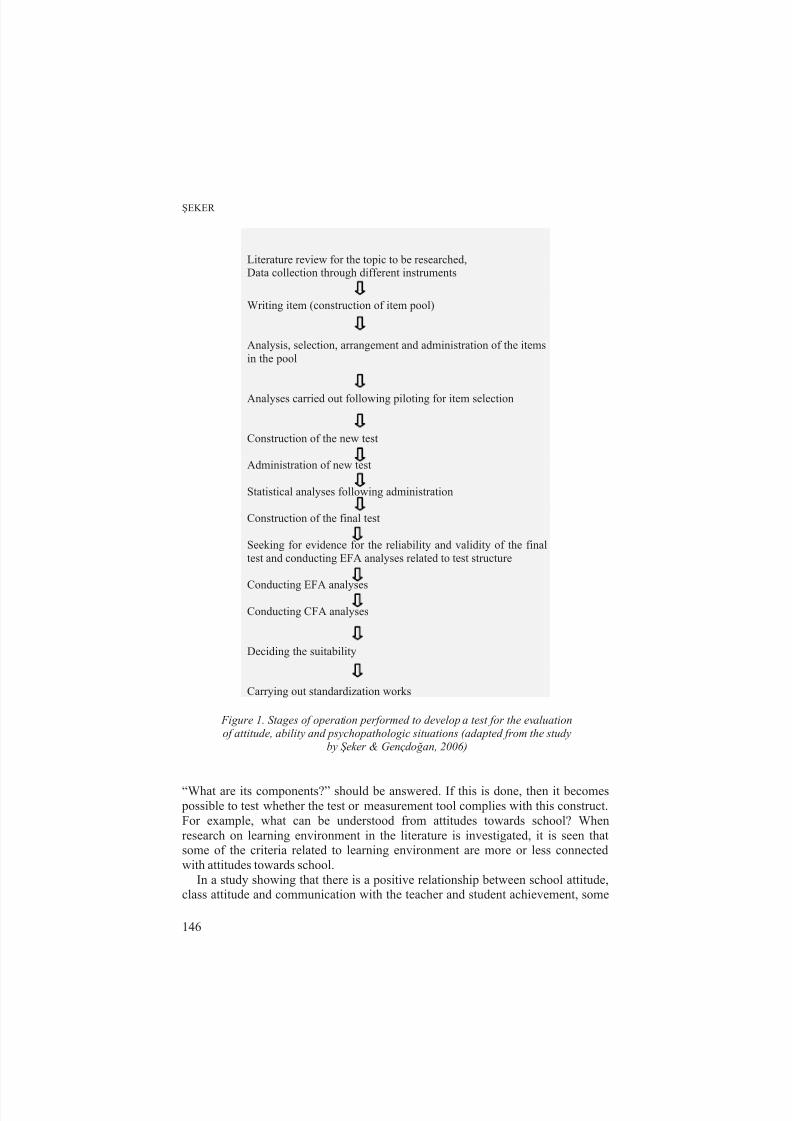
8/18/2019 (Contemporary Approaches to Research
http://slidepdf.com/reader/full/contemporary-approaches-to-research 146/284
ŞEKER
146
Literature review for the topic to be researched,Data collection through different instruments
Writing item (construction of item pool)
Analysis, selection, arrangement and administration of the itemsin the pool
Analyses carried out following piloting for item selection
Construction of the new test
Administration of new test
Statistical analyses following administration
Construction of the final test
Seeking for evidence for the reliability and validity of the finaltest and conducting EFA analyses related to test structure
Conducting EFA analyses
Conducting CFA analyses
Deciding the suitability
Carrying out standardization works
Figure 1. Stages of operation performed to develop a test for the evaluationof attitude, ability and psychopathologic situations (adapted from the study
by Ş eker & Gençdo ğ an, 2006)
“What are its components?” should be answered. If this is done, then it becomes possible to test whether the test or measurement tool complies with this construct.For example, what can be understood from attitudes towards school? Whenresearch on learning environment in the literature is investigated, it is seen thatsome of the criteria related to learning environment are more or less connectedwith attitudes towards school.
In a study showing that there is a positive relationship between school attitude,class attitude and communication with the teacher and student achievement, some

8/18/2019 (Contemporary Approaches to Research
http://slidepdf.com/reader/full/contemporary-approaches-to-research 147/284
IN/OUT OF SCHOOL LEARNING ENVIRONMENTS
147
positive relations were also observed between school attitude and the perception ofthe teacher (Stricland, 1970). It is seen that the concept of school attitude isintertwined with many other concepts. At least some of the variables related toattitudes towards school are embedded within the concepts such as “learningenvironment” and “classroom environment”, hence, it seems to be necessary todetermine the actual borders of the concept intended to be evaluated. Schoolsystem affect and is affected by many systems such as technology, administration,learning environment and family. Therefore, school attitudes should be related tothe learning environment and some other factors. Accordingly, variablesconcerning attitudes towards school cannot be considered independent of thelearning environment of the class, school environment and classroom atmosphere.School attitude can be related to learning environment in the class as well as schoolenvironment having the power to influence attitudes towards school. Therefore, thescope of a test aiming to evaluate attitudes towards school should be extended tocover the environment outside the school and the concept of school attitude cannot
be restricted to the classroom environment; as a result, such test should beconstructed in such a way as to contain both in-class and out of-class factors suchas family and peer groups.
In social sciences, many of items in different measurement scales developedindependently from each other seem to be very identical to each other. This may be
because, the topic for which any test is developed is closely connected with manyother topics in social sciences. For example, when the instruments developed toassess learning environment are examined, it is seen that some of the items arerelated to attitudes towards school. Out of such instruments, Classroom
Environment Scale (CES) and the Instructional Learning EnvironmentQuestionnaire (ILEQ) are instruments modified to produce a ‘personal form’ of theinstrument to elicit an individual student’s responses to his/her role in the classrather than a student’s perception of the class as a whole. The instruments werealso modified to focus specifically on students’ perceptions of their content areaclasses (i.e., mathematics or reading) rather than on their general impressions ofschool as a whole. The brief description of the CES scale components areinvolvement, affiliation, teacher sport, task orientation, order and organization andrule and clarity. The CES is a questionnaire that has been widely used in a varietyof different educational settings to measure students’ perceptions of theirrelationships with students and teachers, as well as the organizational structure ofthe classroom. (as cited in Waxman & Huang, 1998). Cresswell and Fisher (1998)used the ‘School-Level Environment’ (SLEQ) in a study comparing principals’ and
teachers’ perceptions of school environment. Fisher and Fraser (1990) helpedclassroom teachers to identify and work to change elements of their school’sclimate (as cited in Johnson & Stevens, 2001). In addition, the SLEQ could serveas a tool for reflection that reinforces or modifies cooperating teacher and studentteacher’s learning environment perceptions, both preferred and actual (Kiley &Jansen, 1998). Though including some variables related to school attitude, School-Level Environment Questionnaire (SLEQ) mainly consists of dimensions such as

8/18/2019 (Contemporary Approaches to Research
http://slidepdf.com/reader/full/contemporary-approaches-to-research 148/284
ŞEKER
148
professional interest, staff freedom, and resource adequacy. SLEQ is primarilyrelated to teacher perspective and perception of learning environment.
There are many difficulties involved in the isolation of the concept of schoolattitude from many other related concepts. Given the fact that attitude hasaffective, cognitive and behavioral components, it becomes clear how difficult itmay be to isolate the concept of attitude from other concepts. Moreover, there aremany different school attitude-related terms representing the same concept. Forexample, ‘social environment’ can be used interchangeably with ‘classroomclimate’ (Anderson, Hamilton, & Hattie, 2004). In Dorman’ study (2009), conceptof school environment and the concept of school climate mean the same thing.‘Classroom learning environment’ is defined as students’ perceiving and reactingto their learning tasks and classroom instruction (as cited in Waxman & Huang,1998). The term ‘classroom climate’ is defined as the sum total of all the group
processes that take place during teacher–student and student–student interactions.These include interpersonal relationships, emotional intonations and structuralaspects of teaching style and classroom organization, teacher expectations ofstudents and attitudes towards them, level of teacher control, disciplinary
problems, the gender and age of the students, etc. (Zedan, 2010). Fraser and Tobin(1991) agree that classroom climate affects students’ behaviours, levels ofknowledge, scholastic achievements, motivation, self-image and attitudes towardsa certain discipline, the class and school, and schooling and education as a whole.Therefore, researching the factors that affect classroom environment enables us toidentify and understand social processes within the classroom, to explain the
behaviour of the students at both the emotional and cognitive level (cited in Zedan,
2010).School attitude can contain students’ reactions to learning task and classroom
instructions. We can argue that as a term, school attitude is more comprehensivethan some other terms such as ‘students’ perceptions of teaching and learningenvironment’, ‘classroom learning environment’ and ‘classroom climate’. Withinthe concept of school attitude, some factors such as peer groups and attitudes of thestudent family towards school can also be included. What is meant by schoolattitude is not only in-school factors but also out of-school factors. Sum of thesefactors can explain school attitude. Thus, during a test development process,factors related to the components of the test should be clearly delineated.
Construction of the Theoretical Basis of Test Structure
Another step to be taken during test development process is to construct thetheoretical basis of the thing or trait to be evaluated through the test. Tests should
be developed based on some specific theories. For this, review of the relevantliterature and investigation of the previously developed measurement tools is agood starting point. This is a good way of establishing an item pool of a study.
Developing tests in the fields of psychology and psychopathology seems to berelatively easier because there is a commonly accepted set of syndromes to be usedin psychopathologic studies (Şeker & Gençdoğan, 2006). For example, when
8/18/2019 (Contemporary Approaches to Research
http://slidepdf.com/reader/full/contemporary-approaches-to-research 149/284
IN/OUT OF SCHOOL LEARNING ENVIRONMENTS
149
studies on depression are examined, it is seen that there is a clarity of the variablestaught to be the syndromes of depression. In addition, there are international
publications which set some standards for the symptoms accepted as the indicatorsof psychopathologic problems (e.g. DSM-IV-R; ICD-10). Hence, in a new study,the symptoms can be determined very easily and with great certainty.
However, if there is a field or trait on which relatively little research has beencarried out, or there is an elusive concept presenting difficulties in terms ofdetermining its components, it may be difficult to develop a test to evaluate them.For instance, developing a test to measure students’ attitudes towards learningenvironment or students’ attitudes towards school or adapting such test into adifferent language or culture can prove difficult. By examining the previouslyconducted studies, basic components or factors of these attitudes can bedetermined. Then they are tested on a piloting group to see the extent to which theyare valid for new situation and whether there may be other factors involved. Forthis purpose, a test-questionnaire study can be carried out as a descriptive study toreveal the existing state. As stated before, having open-ended questions in a test orquestionnaire can bring about great flexibility in determining criteria. In case ofclosed-ended questions, actual state or states may not be determined. Yet, ofcourse, elicited criteria will not be sufficient for the test. The size of two samplegroups (study or sampling groups), selection and design of the questions promotingsincere responses may be other factors affecting the number of criteria to beselected and trial questions.
Writing Items – Construction of Item PoolFollowing literature review and other data collection efforts about the topic whichis the target of the test to be developed, basic criteria, symptoms or indicatorsshould be turned into more explanatory statements to construct the items. Forexample, we assume that the factors which can be predictors of school attitudeshave been determined as a result of literature review, other data collection methodsand systematic or unsystematic observations as follows:
TeachingClassroom environment
Teacher
School rules Family
Student Exam…
After determining the factors, many trial items should be written related to eachfactor. More items than required should be written for each factor. Let’s writesome trial items for the factors given above:

8/18/2019 (Contemporary Approaches to Research
http://slidepdf.com/reader/full/contemporary-approaches-to-research 150/284
ŞEKER
150
Trial items for the factor of teaching:I believe that I acquire more information than necessary in classStudents giving correct answers are rewarded in class,Teacher threatens the students with gradeWhen students make some errors, they are corrected gentlyThe course content prepares me for the real lifeI think that the course content is considerably intense and unnecessary…
Trial items related to classroom environment:Teacher is only interested in successful students.I have a good communication with my classmatesI can comfortably share my problems with my classmatesI feel lonely in classI cannot communicate with my teacherPhysical conditions in class are goodI do not feel bored in classI wish I were in another class…
Trial questions written in relation to teaching and classroom environment should be reviewed according to item writing criteria partly explained below before piloting. In this connection, when the items written in relation to teaching factorare examined, it is seen that some modifications can be made. For example, though
the items written seem to be within the framework of teaching factor, they can becriticized and restated as follows:
‘I believe that I acquire more information than necessary in class’, in thisitem, what does the word more mean? I think the item is not clear enough tounderstand. Moreover, the uncertainty whether this item should be evaluatedas negative of positive may yield some problems in its scoring. The items‘Students giving correct answers are rewarded in class’ and ‘When studentsmake some errors, they are corrected gently’ can be related to another sub-factor such as giving feedback. The item ‘Teacher threatens the students withgrade’ can be an item related to classroom management. In addition, theitems ‘The course content prepares me for the real life’ and ‘I think that thecourse content is considerably intense and unnecessary’ are items which can
be under the heading of content.
The following criticisms can be directed to the items written for the classroomenvironment factor.
The item ‘Teacher is only interested in successful students’ seems to be notvery clear and understandable. On the other hand, the items ‘I wish I were inanother class’, ‘I cannot communicate with my teacher’ and ‘I feel lonely inclass’ are not clear and difficult to comprehend. The item ‘physicalconditions of class are good’ is related to the physical aspect of the classroom

8/18/2019 (Contemporary Approaches to Research
http://slidepdf.com/reader/full/contemporary-approaches-to-research 151/284
IN/OUT OF SCHOOL LEARNING ENVIRONMENTS
151
but it would have been better if more items can be included to assess thisaspect.
Some Rules to Be Followed While Writing Items
Although there are no certain rules to be followed while constructing items, forhigher quality items to be written, the number of the trial items should be threetimes more than the number of the actual items to be included in the target test.Some of the rules to be followed while writing items can be as follows (Berg,2007; May, 1997; Sarantakos, 1998; Şeker & Gençdoğan, 2006):
– The words in the items should be focused on what is to be measured – Only one thing should be measured with one item – Language must be simple, clear. – Items should be written according to grammar rules of the given language and
punctuation and writing mistakes should not be committed. – Questions are not too general or insufficiently specific. – Avoid using prejudicial language. – Avoid ambiguity; that is, using words with several different meanings, double
negatives. – Avoid double-barreled and complex question. – Avoid affectively worded questions. – Words such as all, always, no more, never only, exactly, almost should be
avoided.
Scaling
Determining the number of options and words to be used in the statements is ofgreat importance. For example, no difference can be seen between the options‘Strongly agree’ and ‘Agree’ because both of them indicate an agreement withsomething. When a large number of items are written, some options without muchdifference in their meaning may have to be used. For example, it is very difficult todifferentiate among the options ‘sometimes’, ‘occasionally’, ‘sparsely’, ‘rarely’,‘very little’. This is of greater importance for the test administered to younger agegroups. Through sample instructions, this problem can be reduced. Moreover,some issues should be taken into considerations in pilot applications. These are:recording of test beginning time, investigation of the reason for any item which isnot clearly understandable throughout the testing process, if feedback about the
non-comprehensibility of a test item is taken from more than one participant, thenthe reason behind this should be investigated. In addition, evidence can becollected for the suitability of the scale for the developmental level of the target
population in piloting applications. The terms used in the scale aiming to testyounger age groups can be supported with visuals. It is seen that this wasconsidered in McKenna and Kear’s (1990) ‘elementary reading attitude’ scale.

8/18/2019 (Contemporary Approaches to Research
http://slidepdf.com/reader/full/contemporary-approaches-to-research 152/284
ŞEKER
152
Asthis a
discar
need t
Likert
follo
‘Agredisagr
marke
it is sreliabi
calcul
ExplaUsage
The fa
Some
attitudfeelin
attitud
scale t
EFArelate
and e
theseunity.
towar
with e By
help t
causalused i
decad
whethreveal
stages
a first stage odministration,
ded from the
o score each t
type scale,
ing options
’ is scoredee’ with 1. N
d is ‘Strongly
cored with 5lity and valid
ted.
atory Factorin School Att
ct that school
factors whic
es towards sc belonging
es towards sc
o evaluate att
nalysis to d to attitudes
plain the attit
studies analyThe EFA a
s school and
ach other.determining
determine t
ity relationsn test develo
. CFA is just
er the constr causality rel
of making up
f item selecti which item
est is decide
est item acco
hen the opt
hould be sc
ith 4, ‘Partialegative items
agree’, it is s
. In order toity works of
Analysis (EF itude Survey
attitudes are
may not b
hool. For exato school an
hool and acad
itudes toward
etermine whaowards schoo
udes towards
e the variabld CFA stu
establish a
among which
e factors to
mong the det pment proces
one type of
ct structuredtionships. It t
a CFA analy
n, the test iss should be
. Then statist
ding to their
ion ‘Strongly
red by subtr
ly agree’ witare scored i
cored with 1
be able to bhe scale, tot
) and Confir
affected by
taught initi
ple, attituded teaching
emic achieve
s school, the
t factors arel were carrie
school throu
es that affecties explain
odel that sh
factors are t
e included in
ermined factos followed in
actor analyse
by the reseaests the mode
sis are as foll
administeredkept and w
ical analyses
ptions. For e
agree’ is sc
acting 1 fro
3, ‘Disagreeversely. For
nd if ‘Strong
e used in tesl score taken
matory Facto
any factors h
ally may hav
of family, atctivities hav
ent. In studi
retical struct
influential. I out in such
h a single or
all the attituhat variable
ws the facto
ere strong r
a scale. CF
rs. CFA anal social scien
s. This analys
cher is consil constructed
ws:
o a small groich items s
are decided.
ample, in a
ored with 5,
the previou
’ with 2 and ‘example, if t
y disagree’ is
t item correl by each part
r Analysis (C
as already be
e some influ
itudes of close influences
es aiming to
res can be te
general, tha way so as t
few variables.
des towardss affect the
s that are in
lations, EFA
analyses loo
ses have beee research i
is is used to
stent and sui by the resear
up. Afterould be
here is a
ive-point
then the
s one as
Stronglye option
marked,
ations orcipant is
A)
n stated.
ences on
e circles,on both
evelop a
sted with
e studiesanalyze
None of
chool inattitudes
harmony
analyses
k for the
n widelythe last
etermine
able andher. The
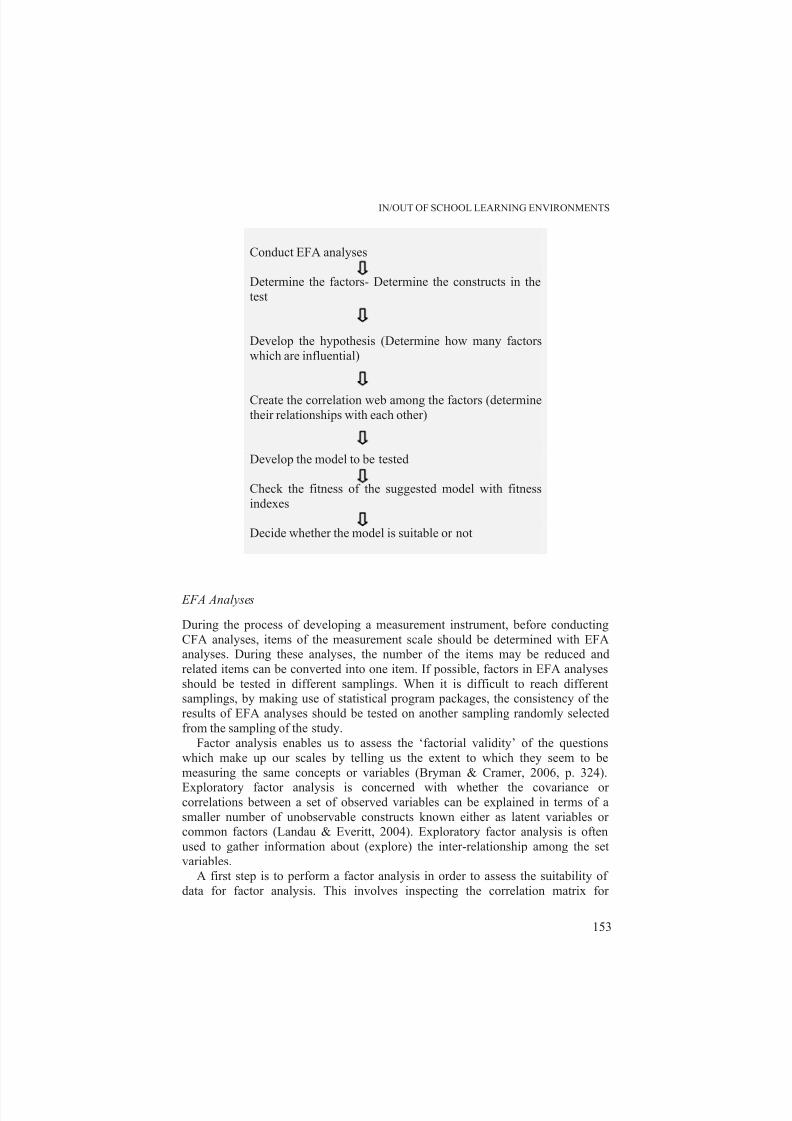
8/18/2019 (Contemporary Approaches to Research
http://slidepdf.com/reader/full/contemporary-approaches-to-research 153/284
IN/OUT OF SCHOOL LEARNING ENVIRONMENTS
153
Conduct EFA analyses
Determine the factors- Determine the constructs in thetest
Develop the hypothesis (Determine how many factorswhich are influential)
Create the correlation web among the factors (determinetheir relationships with each other)
Develop the model to be tested
Check the fitness of the suggested model with fitnessindexes
Decide whether the model is suitable or not
EFA Analyses
During the process of developing a measurement instrument, before conductingCFA analyses, items of the measurement scale should be determined with EFAanalyses. During these analyses, the number of the items may be reduced andrelated items can be converted into one item. If possible, factors in EFA analysesshould be tested in different samplings. When it is difficult to reach differentsamplings, by making use of statistical program packages, the consistency of theresults of EFA analyses should be tested on another sampling randomly selectedfrom the sampling of the study.
Factor analysis enables us to assess the ‘factorial validity’ of the questionswhich make up our scales by telling us the extent to which they seem to bemeasuring the same concepts or variables (Bryman & Cramer, 2006, p. 324).
Exploratory factor analysis is concerned with whether the covariance orcorrelations between a set of observed variables can be explained in terms of asmaller number of unobservable constructs known either as latent variables orcommon factors (Landau & Everitt, 2004). Exploratory factor analysis is oftenused to gather information about (explore) the inter-relationship among the setvariables.
A first step is to perform a factor analysis in order to assess the suitability ofdata for factor analysis. This involves inspecting the correlation matrix for

8/18/2019 (Contemporary Approaches to Research
http://slidepdf.com/reader/full/contemporary-approaches-to-research 154/284
ŞEKER
154
coefficient of .30 and above and then calculating the measure of samplingadequacy (KMO) and Barletts’ test of sphericity.
The second step involves the determination of the underlying factors in the setof variables. Principle components analysis PCA attempts to produce a smallernumber of linear combinations of the original variables in such a manner that mostof the variations in the pattern of correlations are captured (Palland, 2002). PCA isa multivariate technique for transforming a set of related (correlated) variables intoa set of unrelated (uncorrelated) variables that account for decreasing proportionsof the variation in the original observations. PCA is essentially a method of datareduction that aims to produce a small number of derived variables that can beused in place of the larger number of original variables to simplify subsequentanalysis of the data (Landau & Everitt, 2004). Factor analysis can determine thedegree to which they can be reduced to a smaller set (Bryman & Cramer, 2006).
Stating that factors analyses are carried out to convert different items related tothe same concept into one item, Bryman and Cramer (2005) argue that throughthem, factorial validity of the items is determined. In addition to this, EFA factoranalysis aims to reduce high number of items to more manageable number. That is,it can be used to reduce the constructs. Through EFA factor analysis, a largenumber of variables or concepts can be brought together and so they can beassigned common meanings. For instance, let’s assume that the followingquestions are taught to represent the factors related to close circles and family
believed to influence attitudes towards school. – Negative attitudes of my close circles and family towards school discourage me, – I want my family to be informed about may school works,
– My family thinks that my going to school is unnecessary, – My family supports my preference for the school, – My family supports my school works …
When all the above-given items are thought to be included in the same factor as aresult of EFA factor, these five items can be explained within only one supra-concept. In determining what this supra-concept can be, factor analysis may makea great contribution. For the above-mentioned items, the common factor or supra-concept can be ‘involvement of the family in the process’. As a result of EFAfactor analysis, many items seem to be related to one factor should be combinedinto a common concept or under an umbrella concept.
For example, when the following items included in a test developed to evaluateschool attitudes (Şeker, 2011) are examined, it is seen that if these items were
required to be combined into a common factor, the concept of ‘reluctance’ can begood alternative be included within the name of this factor.
– Communication within the family makes me feel less positive towards school. – My family considers my going to school unnecessary. – Negative attitudes of the people in my close circle towards school negatively
affect my eagerness. – My efforts are being overlooked and this decreases my interest to study. – I feel as if I am out of the activities in most of the courses.
8/18/2019 (Contemporary Approaches to Research
http://slidepdf.com/reader/full/contemporary-approaches-to-research 155/284
IN/OUT OF SCHOOL LEARNING ENVIRONMENTS
155
– I cannot participate in many courses.Sometimes, it may be difficult to come up with a common concept just by
looking at the test items developed to evaluate attitudes towards school. In suchcases, opinions of experts and linguists can be sought.
Factor analyses are conducted to test the theoretical structures. A factor analysisshows how many different structures a test is made of. What is done with a factoranalysis is to elicit the relationships within the items of a test. That is, factoranalysis shows the correlations among the test items. Moreover, factor analysis isevidence used to verify the construct validity of a test (Dooley, 1995, p. 93). Factoranalysis is a kind of factorial validity work.
The most widely used factor analysis is Principal component factor analysis(principle-axis factoring). There are some other different methods in SPSS such asalpha, image and maximum likelihood. Yet, as they produce less information, theyare used less. The main difference of them with Principle component is thatPrincipal component analyzes all the variances in variables; that is, it is assumedthat the items in the test are faultless with perfect reliability.
There are two main criteria used to determine how many factors will beinvolved Bryman (2001, p. 267). One is looking at whether Kaiser’ eigenvalue ishigher than 1, and the second one is graphically looking at Scree. There are twomethods of transforming factors; orthogonal (varimax) and oblique. Orthogonalconversion is used to distinguish among items which are not related to each otheror independent of each other Bryman (2001, p. 268). Oblique conversion, on theother hand, shows among which factors are there correlations.
Through EFA analyses, factors in a test should be determined. For example,
let’s assume that the items suggested as a result of EFA analysis for a testdeveloped to evaluate attitudes towards school are as given in Table 1. It can beseen in this table that the 22-item questionnaire aiming to elicit attitudes towardsschool consists of six factors. While reducing the items in the questionnaire, thosecomponent matrix items with load of 0.40 and over have been selected, and thus,they are made inter-correlations quite strong (Palland, 2002). In factor analysis, ifsome items just do not load on the components obtained, they are omitted and theanalyses are repeated.
The following steps were taken in order to reduce the number of the questions inthe questionnaire:
An inspection of the correlation matrix for evidence of coefficients greater than0.3. If few correlations above this level are found, then factor analysis may not beappropriate. Items were eliminated if they did not have a loading of at least 0.30, a
commonly used cutoff, with any one factor. In Walker and Fraser’s (2005) andJohnson and Steven’s (2001)’studies, the same method was used to eliminate theitems.

8/18/2019 (Contemporary Approaches to Research
http://slidepdf.com/reader/full/contemporary-approaches-to-research 156/284
ŞEKER
156
Table 1. Suggested scale items
Scale items F a c t o r
N o .
F a c t o r v a l u e f o r t h e
1 s t f a c t o r
R o t a t e d v a l u e
I t e m s
c a l e
c o r r e l a t i o n
E x t r a c t i o n
1. I share my learning problems easily. 1 0.357 0.621 0.389 0.4832. Students are provided help in learning
activities.
1 0.510 0.616 0.500 0.464
3. I do not feel bored with the lessons. 1 0.418 0.566 0.482 0.4604. I feel lucky that I am a student of this school. 2 0.478 0.560 0.482 0.5905. It is a privilege to study in this school 2 0.707 0.477 0.658 0.5386. I adequately make use of the services given atschool.
2 0.357 0.708 0.347 0.550
7. I wish I were a student of another school. 2 0.416 0.668 0.407 0.4908. I feel lonely in the classroom. 3 0.464 0.626 0.443 0.4489. I am not able to have a healthycommunication with my teachers.
3 0.592 0.609 0.542 0.576
10. Teachers are only interested in hardworkingstudents.
3 0.350 0.458 0.465 0.624
11. Opportunities for questioning and criticisingare provided.
4 0.486 0.680 0.444 0.580
12. Students’ mistakes are corrected without
offending them.
4 0.535 0.661 0.511 0.578
13. Exams measure my real success. 4 0.488 0.589 0.484 0.46514. Exam questions are clear andunderstandable.
4 0.714 0.454 0.680 0.592
15. Communication within the family makes mefeel less positive towards school.
5 0.499 0.439 0.490 0.400
16. My family considers my going to schoolunnecessary.
5 0.482 0.643 0.471 0.525
17. Negative attitudes of the people in my closecircle towards school negatively affect myeagerness.
5 0.565 0.595 0.544 0.505
18. My efforts are being overlooked and thisdecreases my interest to study.
5 0.538 0.577 0.502 0.516
19. I feel as if I am out of the activities in mostof the courses.
5 0.426 0.441 0.429 0.414
20. I cannot participate in many courses. 5 0.265 0.775 0.311 0.63321. I do not want to go to school 6 0.441 0.561 0.444 0.51122. I do not feel that I belong to this school. 6 0.415 0.544 0.432 0.443
Note: These items were taken from Ş eker (2011).
Another way of reducing the number of the items in the study is that if you findthat some items just do not load on the components obtained, you may also need to

8/18/2019 (Contemporary Approaches to Research
http://slidepdf.com/reader/full/contemporary-approaches-to-research 157/284
IN/OUT OF SCHOOL LEARNING ENVIRONMENTS
157
consider removing them and repeating the analysis (Ntoumanis, 2001). The itemswere reduced in the questionnaire by extracting the questions thought to havedifferent components.
Suitability of KMO sampling is connected with the suitability of the correlationamong the questionnaire items. The value over 0.60 is an acceptable value(Ntoumanis, 2001, p. 140). If KMO value is high, Bartlett test becomes statisticallysignificant. Both of them having these values demonstrates that factor analysis isapplicable and the correlation among the items is really high (Ntoumanis, 2001, p.142).
According to the findings presented in Table 1, it is seen that the 22-itemquestionnaire is made up of six factors. When the values in the first factor areexamined, it can be decided whether the questionnaire can be used as a one-factorquestionnaire or not. Moreover, it is seen that item-scale correlation values arehigh. This finding proves that each item of the test is related to what the test aimsto evaluate.
According to Table 1, Student’s attitudes towards school factors:
Factor 1: TeachingQ1.Q2.Q3.
Factor 2: School image
Q4.
Q5.Q6.Q7.
Factor 3: Loneliness at schoolQ8.Q9.Q10.
Factor 4: Testing and feedback
Q11.Q12.Q13.Q14.
Factor 5: ReluctanceQ15.Q16.Q17.Q18.Q19.Q20.

8/18/2019 (Contemporary Approaches to Research
http://slidepdf.com/reader/full/contemporary-approaches-to-research 158/284
ŞEKER
158
Factor 6: Belongingness
Q21.Q22.
In the factor analysis, attitudes towards school were found to be related with thesefactors.
CFA Analysis. It is aimed to determine the level of the change taking place in unityof the components (above-mentioned factors) of students’ attitudes towards schooland to develop a model by determining the structure of the relations among thesefactors. In other words, the aim is to investigate whether the above-mentioned sixfactors together affect the attitudes towards school. At the end of the application,
by examining the relations among the dimensions of the questionnaire, the factorsthat are in compliance with each other were determined through structural equationmodeling (SEM).
Structural equation modeling (SEM) is used in order to test the multiplerelations in the school attitude questionnaire. This technique is used to estimate,analyze, and test models that specify relationships among variables (Bruce, 2003).This technique is called confirmatory factor analysis and is a part of SEM (Daniel,2004). SEM can be explained as a technique that helps the researcher to establish amodel in order to find the relationships among variables that are observed in thestudied sample (Ader, 2004). In SEM, a model is established at the beginning andthis model is tested to see whether it is supported by the data obtained. If the modelsuggested is not in compliance with the data, the researcher redesigns the model
and retests it by using the same data. For this reason, SEM studies are correctiveand explanatory (Klaine, 1998).
SEM Analysis
Structural equation modeling can perhaps best be defined as a class ofmethodologies that seek to represent hypotheses about summary statistics derivedfrom empirical measurements in terms of a smaller number of ‘structural’
parameters defined by a hypothesized underlying model (Kaplan, 2009, p. 1). Astandard statistical technique for evaluating a measurement model is exploratoryfactor analysis (EFA). EFA is not generally considered a member of the SEMfamily. EFA does not require a priori hypothesis about how indicators are relatedto underlying factors or even the number of factors. Hence the term “exploratory,”
which in this context means that the researcher has little direct influence on thecorrespondence between indicators and factors (Kline, 2005, p. 71).
EFA factor analysis is used to elicit information about the nature of thefactors determined by the researcher rather than to test a specific hypothesis.CFA (corrective factor analysis) is generally used to test a hypothesis developed inline with a theory. Usually, it is used after EFA analysis has been carried out.The main purpose of CFA analysis is to test whether a clearly delineated model isconfirmed by data. Yet, confirmation of a model by the data does not mean that

8/18/2019 (Contemporary Approaches to Research
http://slidepdf.com/reader/full/contemporary-approaches-to-research 159/284
IN/OUT OF SCHOOL LEARNING ENVIRONMENTS
159
the model has been thoroughly justified. The researcher may assume that thegiven model is justifiable for other models (Şimşek, 2007, p. 4). Path analysisentails the use of multiple regressions in relation to explicitly formulated causalmodel.
Path analysis cannot establish causality; it cannot be used as a substitute for theresearcher’s views about the likely causal linkages among groups of variables. Allit can do is to examine the pattern of relationship between variables, but it canneither confirm nor reject the hypothetical causal imagery (Bryman & Cramer,2006, pp. 313-314). The relationships between observable variables and latent onesare shown with a path diagram. The relationships are described by parameters thatindicate the magnitude of the effect (direct or indirect) that independent variables(either observed or latent) have on dependent variables (either observed or latent).Latent variables are hypothetical variables that cannot be observed directly(Hershberger, Marcoulides, & Parramore, 2003, p. 4).
Let’s assume that attitudes towards school are latent variable. We have nochance to directly measure school attitudes. Then, assume that teaching, classroomenvironment, teacher, student, school rules, family and exams are observablevariables and they are related to attitudes towards school. When the relationship
between the observable and latent variables is assumed to be linear, a diagramsimilar to the following can be constructed:
et e sa
es
el
ef
er
eb
Chart 1. Hypothetical observable and latent variables related to school attitudes
Latent variablesObservable
variables
teaching
school
Schoolattitude
loneliness
feedback
relutance
belonngingnes

8/18/2019 (Contemporary Approaches to Research
http://slidepdf.com/reader/full/contemporary-approaches-to-research 160/284
ŞEKER
160
Meaning of the symbols in Chart 1
Latent variable
Observed variable
Recursive relation
Measurement errorin observed variable
Disturbance error in
Latent variable
SAMPLE SIZE
There is no consensus on the size of sample to be included in any study. Thegeneral consensus is that the bigger the size of the sample, the better it is. Garsuchargued that it should not be fewer than 100 (cited in Bryman, 2001, p. 263). Asimilar criterion is suggested by Ntoumianis (2001, p. 138). In general, samplingsused in factor analysis research consist of 200 or more participants. SEM is still alarge-sample technique. Because several factors affect sample size requirements inSEM, however, it is difficult to give a simple answer to the question of how large a
sample needs to be. Some guidelines about absolute sample size in estimationmethods were offered earlier (small, N < 100; medium, N between 100 and 200;large, N > 200). Another consideration is model complexity. A sample size of 200or even much larger may be necessary for a very complicated path model.Although there are no absolute standards in the literature about the relation
between sample size and path model complexity, the following recommendationsare offered: a desirable goal is to have the ratio of the number of cases to thenumber of free parameters be 20:1; a 10:1 ratio, however, may be a more realistictarget. Thus, a path model with 20 parameters should have a minimum sample sizeof 200 cases (Kline, 2005, p. 111).
GOODNESS FIT-INDEXES RELATED TO CFA STRUCTURE OF THE SCALE
There are different views with regard to the acceptability of Chi-square goodnesstest. For instance, according to different authors, the rate of Chi-square/freedomshould be less than 3 (Alcı, 2007, p. 68), between 1 and 3 (Carmines & McIver,1985, cited in Arbuckle, 2005, p. 493), and between 2 and 5 (Marsh & Hocevar,1985, cited in Arbuckle, 2005, p. 493). The following are interpreted as good or
perfect: CFI value close to 0.95, TLI value close to 0.95 and NFI value about 0.95(Schumacker & Lomox, 2004, p. 82).

8/18/2019 (Contemporary Approaches to Research
http://slidepdf.com/reader/full/contemporary-approaches-to-research 161/284
IN/OUT OF SCHOOL LEARNING ENVIRONMENTS
161
Applications suggest that the RMSEA value should be 0.05 or less, or 0.08 orless. It is very good if it is less than 0.05, and good and acceptable if it is less than0.10 (Loehlin, 2004; cited in Arbuckle, 2005, p. 69). Browne and Cudeck (1993)suggested that 0.05of RMSEA indicates a close fit and that values up to 0.08represent reasonable errors of approximation in the population (cited in Jöreskog &Sörbon, 1993). Steiger suggests that values below 0.10 indicate a good fit to thedata and values below 0.05 a very good fit to the data (cited in Kelloway, 1998).
AGFI and GFI values close to 1 can be interpreted as good. Unfortunately, thereis not a strict norm for these indices. As a rough guide, it is currently viewed that amodel with a GFI or AGFI of 0.95 or above may well represent a reasonably goodapproximation of the data (Hu & Bentler, 1999, cited in Hershberger, Marcoulides,& Parramore, 2003, p. 19). The GFI ranges from 0 to 1, with values exceeding 0.9indicating a good fit to the data (Kelloway, 1998).
Coefficients related to item-factor correlations calculated by confirmatory factoranalysis are presented in Figure 3.
(X2/sd) value calculated through the confirmatory factor analysis is 1.86 and thisvalue shows that the suggested factor model fits well with the data collected. As aresult of the analysis, GFI value was calculated to be .93, AGFI .95 and CFI .95,
NFI .93, NNFI .94; RMR .06 and RMSEA .049; hence, it can be argued that six-factor structure of the scale is acceptable and can yield valid results. In addition, ascan be seen in Figure 3, the observable data show good fit to six-dimensionalmodel. Path coefficients vary between .37 and .67. All of these values are higherthan .30 and according to Klein’s (2005) values higher than .30 are good values. Inthe model shown in Figure 3, it is believed that the attitudes towards school depend
on student’s effort, loneliness of the student at school, his/her sense of belonging,feedback, image of school and teaching activities.
There is a need to conduct second order factor analysis to confirm whetherschool attitudes are made up of the combination of six factors; teaching, schoolimage, loneliness, testing, reluctance, belongingness.
SECOND ORDER CONFIRMATORY FACTOR ANALYSIS
In addition to explanatory and confirmatory factor analyses conducted to test theconstruct validity of the scale, second order confirmatory factor analysis can becarried out through LISREL program to determine the extent to which six factors(teaching, school image, loneliness, testing, reluctance, and belongingness)indicate a good fit to the supra-structure, school attitude.
In the second order confirmatory factor analysis application, correlation matrixobtained from 6 factors is used as data.As a result, the argument that school attitude consists of 6 factors; loneliness,
image, reluctance, testing, teaching, belongingness, was supported. In addition tothis finding, the coefficients revealed by second order confirmatory factor analysisrelating to factor-scale relationships are presented in Figure 4.

8/18/2019 (Contemporary Approaches to Research
http://slidepdf.com/reader/full/contemporary-approaches-to-research 162/284
ŞEKER
162
Figure . Item- actor correlations
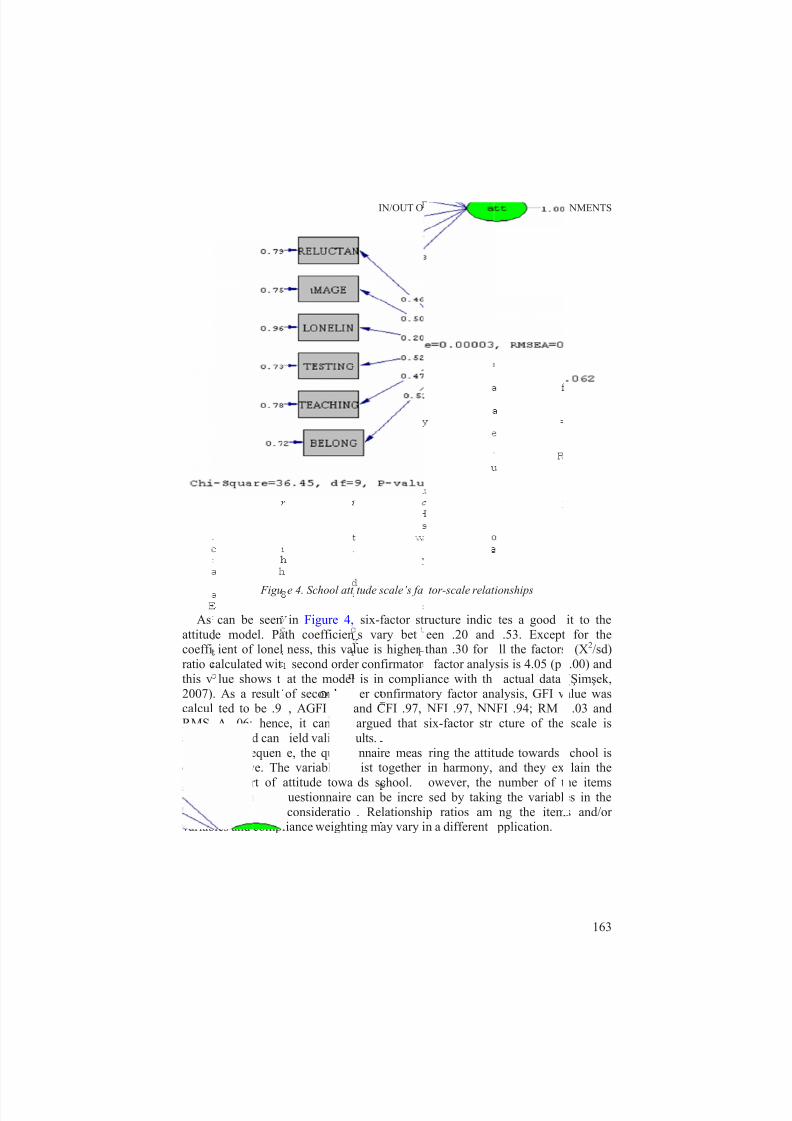
8/18/2019 (Contemporary Approaches to Research
http://slidepdf.com/reader/full/contemporary-approaches-to-research 163/284
As
attitudcoeffi
ratio c
this v
2007).calcul
RMS
accept
Ascompr
impor (quest
questivariab
Figu
can be seen
e model. Paient of lonel
alculated wit
lue shows t
As a resultted to be .9
A .06; henc
able and can
a consequenehensive. Th
ant part ofons) in the
nnaire intoles and compl
e 4. School att
in Figure 4,
th coefficienness, this val
second orde
at the model
of second or , AGFI .96
e, it can be
ield valid res
e, the questie variables e
attitude towauestionnaire
consideratioiance weighti
IN/OUT O
tude scale’s fa
six-factor st
s vary betue is higher
r confirmator
is in compli
er confirmatand CFI .97,
argued that
ults.
nnaire measist together
ds school.can be incre
. Relationshing may vary i
SCHOOL LEA
tor-scale relat
ructure indic
een .20 andthan .30 for
factor analy
ance with th
ory factor an NFI .97, NN
six-factor str
ring the attitin harmony,
owever, thesed by takin
p ratios amn a different
RNING ENVIR
ionships
tes a good
.53. Exceptll the factors
sis is 4.05 (p
actual data
alysis, GFI vFI .94; RM
cture of the
ude towardsand they ex
number of tg the variabl
ng the item pplication.
NMENTS
163
it to the
for the. (X2/sd)
.00) and
(Şimşek,
alue was.03 and
scale is
school islain the
he itemses in the
s and/or

8/18/2019 (Contemporary Approaches to Research
http://slidepdf.com/reader/full/contemporary-approaches-to-research 164/284
ŞEKER
164
SOME CLOSING THOUGHT
School attitudes are believed to be related to in-school, out of-school and someother factor. School attitude, as a supra-concept, cannot be limited to learningenvironment of the school. School attitudes are affected by many variables such aslearning environment, peer relations, academic achievement, belongingness, andextra-curricular activities. Therefore, some of the items included in the testsdeveloped to evaluate any of these variables may have some similarities with theitems included in any school attitude test. Hence, great care should be taken whiledetermining the scope of the tests developed in social sciences. To what extentdoes the scale match with the “reality”? Even if, a perfect tool were developed,
there would be many criticisms to be directed to it such as being distant fromreality or not being able to reflect all the colors of reality. In order to reduce suchcriticisms or limitations, there are some steps to be taken. One of them is theeffective use of data collection means to form the scope of the test. Methods usedto reduce such limitations depend on effective use of many data collection toolsranging from literature review, interviews, and case studies to narrative strategies.Following data collection procedure, factors should be hypothetically determinedin relation to test content and then trial items should be written for these factors.Here, while writing items, there are some rules to be followed and special attentionshould be paid to scoring. Then, EFA vs DFA analyses should be conducted. EFAanalysis serves the function of determining among which factors there are strongrelationships and in this way which factors should be included in the test andreducing items. With CFA analysis, causality relationships among the factors are
sought. CFA analysis is one type of factor analyses. These analyses test whetherthe construct developed by the researcher is consistent or not and reveal causalityrelationships. By checking through the values obtained as a result of CFA analysisand suggested hypothetical model fitness indexes, it is decided whether the modelis suitable or not.
REFERENCES
Ader, N. E. (2004). A self-regulation model to explain quantitative achievement in a high-stake testing
situation. Unpublished Master’s Thesis, Boğaziçi Üniversity, İstanbul, Turkey.Aizen, I. (2005). Personality and behaviour (2nd ed.). Berkshire, UK: McGraw-Hill Education.Alcı, B. (2007). The explanatory and predictive relations patterns of university students regarding their
points of achievement in university entrance exam, perceived problem solving abilities, sel f efficacy
perception and metacognitive self regulation strategies. Unpublished PhD Thesis, Yildız Technical
University, Istanbul, Turkey.Allen, D., & Fraser, B. J. (2007). Parent and student perceptions of classroom learning environment andits association with student outcomes. Learning Environment Research, 10, 67-82.
Anderman, L. H., & Freeman, T. M. (2004). Students’ sense of belonging in school. In P. R. Pintrich &M. L. Maeher (Eds.), Motivating students, improving school, 13: The legacy of Carol Midgley
(Advances in motivation and achievement) (pp. 27-64). JAI Press.Anderson, A., Hamilton, J., & Hattie, J. (2004). Classroom climate and motivated behaviour in
secondary schools. Learning Environments Research, 7, 211-225.Arbuckle, J.L. ( 2005). Amos 6.0. User’s guide. Amos Development Corporation.
8/18/2019 (Contemporary Approaches to Research
http://slidepdf.com/reader/full/contemporary-approaches-to-research 165/284
IN/OUT OF SCHOOL LEARNING ENVIRONMENTS
165
Berg, B.L. (2007). Qualitative research methods for the social sciences (6th ed.). USA: PearsonEducation, Inc.
Bruce, P. (2003). Structural equation modeling: Applications in ecological and evolutionary biology.
West Nyack, NY: Cambridge University Press,Bryant, A. L., Schulenberg, J. E., O’Malley, P. M., Bachman, J. G., & Johnston, L. D. (2003). How
academic achievement, attitudes, and behaviors relate to the course of substance use duringadolescence: A 6-year, multiwave national longitudinal study. Journal of Research on Adolescence,
13(3), 361-398.Bryman, A., & Cramer, D. (2006). Qualitative data analysis with SPSS 12 and 13. A guide for social
scientists. Routledge: London & New York.Daniel, M. (2004). Doing quantitative research in education with SPSS. London, UK: Sage
Publications.
Darling, N. (2005). Participation in extracurricular activities and adolescent adjustment: cross-sectionaland longitudinal findings. Journal of Youth and Adolescence, 34(5), 493-505.
Darling, N., Caldwell, L. L., & Smith, R. (2005). Participation in school-based extracurricular activitiesand adolescent adjustment. Journal of Leisure Research, 37 (19), 51-76.
Davies, M., Hirschberg, J., Lye, J., & Johnston, C. (2010). A systematic analysis of quality of teachingsurveys. Assessment & Evaluation in Higher Education, 35(1), 87-100.
Dooley, D. (1995). Social research methods (3rd ed.). Englewood Cliffs, NJ: Prentice Hall.Dorman, J.P. (2009). Statistical tests conducted with school environment data: The effect of teachers
being clustered in schools. Learning Environments Research, 12, 85-99.Duvarger, M. (2006). Metodoloji açı sından sosyal bilimlere giri ş [Introduction to the social sciences].
Istanbul: K ırmızı Yayınevi.Flouri, F., Buchanan, A. & Bream, V. (2002). Adolescents’ perceptions of their fathers’ involvement:
Significance to school attitude. Psychology in the Schools, 39(5), 575-583.Fottland, H. (2004). Memories of a fledgling teacher: A beginning teacher’s autobiography. Teachers
and Teaching: Theory and Practice, 10(6), 639-662.Fraser, B. J., & Tobin, K. (1991). Combining qualitative methods in classroom environment research.
In J. Fraser & H. J. Walberg (Eds.), Educational environment: Evaluation, antecedents and
consequences (pp. 271-292). Oxford, UK: Pergamon.Heaven, C.L.P., Mok, A., Barry, J., & Ciarrochi, J. (2002). Personality and family influences on
adolescent attitudes to school and self-rated academic performance. Personality and Individual
Differences, 33, 453-462.Hershberger,S .L., Marcoulides, G A., & Parramore, M. M. (2003). Structural equation modeling: An
introduction. In B. Pugesek, A. Tomer, & A. Von Eye (Eds.), Structural equation modeling:
Applications in ecological and evolutionary biology (pp. 3-42). West Nyack, NY: CambridgeUniversity Press.
Holfve_Sabel, M. A., & Gustafsson, J. E. (2005). Attitudes towards school, teacher, and classmates atclassroom and individual levels: An application of two-level confirmatory factor analysis.Scandinavian Journal of Educational Research, 49(2), 187-202.
Hoower-Dempsey, K., Besler, O., & Brissie, J. (1992). Explorations in parent-school relation. Journal
of Educational Research, 85(5), 287-294.Hung, C. L., & Marjoribanks, K. (2005). Parents, teachers and children’s school outcomes: A
Taiwanese study. Educational Studies, 31(1), 3-14.Johnson, B., & Stevens, J. J. (2001). Exploratory and confirmatory factor analysis of the school level
environment questıonnaire (SLEQ). Learning Environments Research, 4, 325-344.Joreskog, K., & Sörbom, D. (1993). LISREL 8: Structural equation modeling with the SIMPLIS
Command Language. USA.Kaplan, C. P., Turner, S. G., & Badger, L. W. (2007). Hispanic adolescents girls’ attitudes towards
school. Child and Adolescents Social work Journal , 24(2), 173-193.Kaplan, D. (2009). Structural equation modeling . Foundation and extensions. Los Angeles/London/
New Delhi/Singapore: Sage.

8/18/2019 (Contemporary Approaches to Research
http://slidepdf.com/reader/full/contemporary-approaches-to-research 166/284
ŞEKER
166
Kelloway, E. K. (1998). Using LISREL for structural equation modeling. A researcher’s guide. SagePublications, Inc.
Kiley, T. J., & Jansen, R. A. (1998). Cooperating and student teachers’ actual and preferred learningenvironments: a matched-pair analysis. Learning Environments Research, 1, 181-197.
Kline, R. B. (2005). Principles and practice of structural equation modeling (2nd ed.). NewYork/London: The Guilford Press.
Kruglansky, A. (2007). Social psychology: Handbook of basic principles (2nd ed.). New York, USA.Legum, H., & Haore, C. H. (2004). Impact of a career intervention on at-risk middle school students’
career maturity levels, academic achievement, and self-esteem. Professional School Counseling, 8(2), 148-156.
Leithwood, K. A., Aitken, R., & Jantzi, D. (2006). Making schools smarter: Leading with evidence.Corwin Press, Sage Publications Ltd.
Libbey, H. P. (2004). Measuring student relationships to school: Attachment, bonding, connectedness,and engagement. Journal of School Health, 74(7), 274-284.
Maddox, S. J., & Prinz, R. J. (2003). School bonding in children and adolescents: Conceptualization,assessments and associated variables. Clinical Child and Family Psychology Review, 6 (1), 31-49.
Maher, M. A. H. (2000). A Structural model of attitudes towards school subjects, academic aspirationand achievement. Educational Psychology, 20(1), 75-85.
Malm, B., & Lofgren, H. (2006). Teacher competence and students’ conflict handling strategies. Research in Education, 76 , 62-73.
May, T. (1997). Social research. Issues, methods and process (2nd ed.). Buckingham/Philadelphia:Open University Press.
McCoach, D. B. (2002). A validation study of the attitude assessment survey. Measurement and
Evaluation in Counseling and Development, 35(2), 66-79.McCoy, L. P. (2005). Effect of demographic and personal variables on achievement in eighth-grade
algebra. Journal of Educational Research, 98(3), 131-136.McKenna, M. C., & Kear, D. J. (1990). Measuring attitude toward reading: A new tool for teachers. The
reading teacher, 43
(9), 626-639.McNeal, R. B. (1999). Participating in high school extracurricular activities: Investigating school
effects. Social Science Quarterly, 80(2), 291-309.Morrell, P. D., & Lederman, N. G. (1998). Students’ attitudes toward school and classroom science:
Are they independent phenomena? School Science & Mathematics, 98(2), 76-84. Nelson, R. M. & DeBocker, T. K. (2008). Achievement motivation in adolescents: The role of peer
climate and best friends. The Journal of Experimental Education, 76 (2), 170-189. Nichols, S. L. (2008). An exploration of students’ belongingness beliefs in one middle school. The
Journal of Experimental education, 76 (2), 145-169. Ntoumanis, N. (2001). Step-by-step guide to SPSS for sport . Florence, KY: Routledge.Papanastasiou, C., & Elena, C. (2004). Major influences on attitudes toward science. Educational
Research & Evaluation, 10(3), 239-258.Pintrich, P. R., & Maeher, M. L. (2004). Motivating students, Improving school , Volume 13: The legacy
of Carol Midgley (Advances in motivation and achievement). JAI Press.Pallant, Julie. (2002). SPSS survival manual. A step by step guide to data analysis using SPSS .
Buckingham: Open University Press.
Pritchett, J. J., Schwartz, M. L., & Slate, J. R. (2004). What makes a good elementary school? A criticalexamination. The Journal of Educational Research, 93(6), 339-348.
Riggs, E., & Ve Sefarin, A. G. (1998). Classroom-based narratives: teachers reflecting on their own
teaching stories. A new page in the story of success … A new chapter in the life of hope . Paper presented at the Annual Meeting of the Midwestern Educational Research Association, Chicago, IL,October 14-17, 1998. Retrieved from ERIC ED424214.
Roeckelein, J. E. (1998). Dictionary of theories, laws & concepts in psychology. Westport, CT.Roelofs, E., Visser, J., & Terwel, J. (2003). Preferences for various learning environments: Teachers’
and parents’ perceptions. Learning Environments Research, 6 , 77-110.

8/18/2019 (Contemporary Approaches to Research
http://slidepdf.com/reader/full/contemporary-approaches-to-research 167/284
IN/OUT OF SCHOOL LEARNING ENVIRONMENTS
167
Rousseau, C., Hassan, G., Measham, T., Moreau, N., Lashley, M., Castro, T., Blake, C., & McKenzie,G. (2009). From the family universe to the outside world: Family relations, school attitude, and
perception of racism in Caribbean and Filipino adolescents. Health & Place, 15, 751-760.Rushton, S. P. (2004). Using narrative inquiry to understand a student–teacher’s practical knowledge
while teaching in an inner-city school. The Urban Review, 36 (1), 61-79.Sarantakos, S. (1998). Social research (2nd ed.). London: Macmillan Press.Şeker, H. (2011). Developing a questionnaire on attitude towards school. Learning Environments
Research. 14 (3), 241-261.Şeker, H., & Kömür, S. (2004). Image of quality lesson, teacher and classroom atmosphere according to
the student perception. In Symposium International d’Imagologie, 26-28 April 2004 (Vol. II, pp.261-274).
Şeker, H., & Geçdoğan, B. (2006). Psikolojide ve e ğ itimde ölçme aracı geli ştirme. Ankara: Nobel
Yayın Dağıtım.Silins, H. C., & Murray-Harvey, R. (2000). Students as a central concern school, students and outcome
measures. Journal of Educational Administration, 38(3), 230-246.Şimşek, Ö. F. (2007). Yapı sal E şitlik modellemesine giri ş. Temel ilkeler ve lirsel uygulamalar ı. Ankara:
Ekinoks.Strickland, G., & California Univ., Los Angeles. Center for the Study of Evaluation. (1970).
Development of a school attitude questionnaire for young children. Appendices. Washington, D.C.:Distributed by ERIC Clearinghouse, Retrieved from:http://www.eric.ed.gov/contentdelivery/servlet/ERICServlet?accno=ED051260.
Walker, S. L., & Fraser, B. J. (2005). Development and validation of an instrument for assessingdistance education learning environments ın higher education: The distance education learningenvironments survey (deles). Learning Environment Research, 8, 289-308.
Waxman, H. C., & Huang, S-Y. L. ( 1998). Classroom learning environments in urban elementary,middle, and high school. Learning Environments Research, 1, 95-113.
William, J. (2003). Faydacıl ık [Pragmatism]. Ankara: Yeryüzü yayınevi.Wittenbrink, B. (2007). Implicit measures of attitudes. New York: Guilford Publications.Zalaquett, C. P., McHatton, P. A., & Cranston-Gingras, A. (2007). Characteristics of Latina/o migrant
farmworker students attending a large metropolitan university. Journal of Hispanic Higher
Education, 6 (2), 135-156.Zedan, R. (2010). New dimensions in the classroom climate. Learning Environment Research, 13, 75-
88.Zerihun, Z., Beishuizen, J., & Os, W. V. (2012). Conceptions and practices in teaching and learning:
Implications for the evaluation of teaching quality, Quality in Higher Education, 17 (2), 151-161.
Hasan Ş eker
Faculty of Education
Mu ğ la S ıtk ı Koçman UniversityTurkey
8/18/2019 (Contemporary Approaches to Research
http://slidepdf.com/reader/full/contemporary-approaches-to-research 168/284
M.S. Khine (ed.), Application of Structural Equation Modeling in Educational Research and
Practice, 169–184.
© 2013 Sense Publishers. All rights reserved.
WINCY W. S. LEE, DORIS Y. P. LEUNG AND KENNETH C. H. LO
8. DEVELOPMENT OF GENERIC CAPABILITIES IN
TEACHING AND LEARNING ENVIRONMENTS AT
ASSOCIATE DEGREE LEVEL
INTRODUCTION
History of Associate Degrees in Hong Kong
In response to the demands imposed by the knowledge-based economy, Hong
Kong underwent a relatively revolutionary change in its tertiary education scene in
2000, with the mission to increase the percentage of the population able to receivetertiary education from 30% to 60% within a decade (Hong Kong SAR, Education
Commission, 2000). In this light, the American model of community colleges
(awarding associate degrees) was imported to and pioneered in Hong Kong in 2000
by a reputable university (Lee & Young, 2003). Within two years, almost all of theother tertiary institutes had established their own subsidiaries, running in self-
financed modes, to offer associate degree programs. The number of associate
degree programs increased from 16 in the academic year 2001/2002 to 157 in2011/2012, with a corresponding increase in the number of enrolled students from
3,732 to 27,822 (Hong Kong SAR, Information Portal for Accredited PostSecondary Programs, 2012).
The introduction of the associate degree award in Hong Kong follows theAmerican model for mass education (Postiglione, 2009). In particular, the
American tertiary education model can generally be seen as two-tiered, with
government-funded or privately-funded universities remaining in the upper-tier
and associate degrees in the second tier. Successful completion of an associatedegree in the States provides seamless mobility to the upper-tier – direct entrance
to the third year of a four-year degree award – where the choices of articulation
pathway are also abundant. However, the situation is quite the contrary in HongKong, where almost all university places are government-funded, resulting in a
restricted number of senior places being reserved for associate degree graduates
(Heorn, 2006). As a result, there remains a huge gap between the demand and
supply of government-funded university places. Critics worry that the associatedegree will become an award that leads nowhere, neither sufficing for vocational
purposes nor for further academic pursuits (Kember, 2010).
The fact that the institutions offering associate degrees espouse visions and
missions similar to those of the universities offering degrees – to prepare studentswith 21st century skills for pursuing life-long learning and leading the lives of
responsible citizens in order to cope with the ever-evolving demands of the

8/18/2019 (Contemporary Approaches to Research
http://slidepdf.com/reader/full/contemporary-approaches-to-research 169/284
LEE ET AL.
170
workplace and society in general. Their efforts in such endeavors have often been
overshadowed by the issue of articulation, which is taken as the only goal of the
associate degree. Therefore, much of the public discussion and research has been
conducted to examine the introduction of the associate degree in Hong Kong, from
both administrative and policy perspectives, so as to address the ‘shortage’ issuesin articulation places. On the other hand, the question of whether this new tier of
education has helped students to develop generic capabilities has largely been
overlooked.
Twenty-first century skills, such as problem-solving, reasoning, systemicthinking, and interpersonal skills, are often generic and tacit in nature and such
require distributed learning (Bransford, Brown, & Cocking, 2000; Sawyer, 2006).Their development may require an orchestrated and coherent learning environment
at program level instead of teaching of the ‘right’ subject content in a single
course. However, only scant effort has been made so far to understand students’
psychological facets and the educational facets of the learning environment on the
mechanisms for developing generic capabilities in associate degree students. Withthe development of the associate degree in Hong Kong now having completed its
first decade, it is high time to undertake an empirical study to unravel the issues.
Characteristics of Associate Degree Students, Teachers and the Learning
Environment
As argued by Resnick (2010), educational changes and classroom innovations are
complex and hence it is useful to understand the learning environment as a multi-
layer interactive ecological system. The multi-layer system involves macro-, meso-and micro-level factors that pertain to change in the educational change or
contexts. The learning environment in the associate degree programmes in Hong
Kong can also be described and understood using this three-layer interactiveecological system. The history of the associate degree in Hong Kong, as portrayed
in the introductory paragraph, provides the macro-level backdrop regarding the
scene we have been facing in the tertiary sector during 2000 and onwards. Meso-
level issues in the system involve institutional climate, ethos and practices in
teaching and learning; while micro-level issues involve the psychology of humanfactors, both teachers’ and students’, that affect the teaching and learning processes
in the classroom. This section describes both meso-level and micro-issues, with all
of these factors nested within the macro-level context of change. It is believed thatthe mechanism of the learning and teaching environment nurturing students’
generic capabilities at associate degree level results from the interplay of all thesefactors at different levels in this ecological system of change.

8/18/2019 (Contemporary Approaches to Research
http://slidepdf.com/reader/full/contemporary-approaches-to-research 170/284
GENERIC CAPABILITIES IN TEACHING AND LEARNING ENVIRONMENTS
171
Meso-level: Strong ethos in teaching and learning. Most of the associate degree
programs are offered by institutions run by local universities, and therefore they
employ quality assurance processes, administrative procedures, curriculum design
and modes of study that are like those of their parent institutions. Despite these
marked similarities in the procedural and administrative matters, there are somekey differences in terms of their overall institutional climates and ethos of teaching
and learning, and funding modes of the institutions that make these two tiers
different from each other.
Almost all of the institutions offering associate degrees are self-financed, andhence most of the institutional income relies on the student in-take in each
academic year. It is very crucial for the institutions to make competitive‘marketing’ plans to ensure good enrolment rates. Moreover, from market
responses and graduates’ comments, it seems that a high articulation rate is one of
the most critical determinants of the applicant’s choice of institution. As a result,
achieving a good articulation rate becomes the key agenda for institutions offering
associate degrees. Benchmarking the success of a program based on thearticulation rate may shape both teachers and learners’ beliefs about what
constitute good learning, good teaching and a good learning environment. This
may lead to a high emphasis on the teacher’s role in the teaching and learning
process, in particular the design of assessment tasks and the need to teach forsufficient understanding to enable the students to meet the assessment
requirements in order to get good grades for articulation. On the contrary, the
capabilities that are not directly relevant to academic performance may be lessvalued, or overlooked, by both teachers and students.
Micro level: Students’ and teachers’ emphasis on academic performance.Undergraduates and associate degree students may differ from each other in some
important presage characteristics that are relevant to understanding their learning
experience and outcomes (Biggs, 1996). First, as discussed by Lee (1996), Hong
Kong students are characterized by their strong examination orientation and, giventhe aforementioned competitiveness of articulation, associate degree students may
manifest this to a new height. Fierce competition among peers and strategic use oftactics (for example, rote learning from lesson summaries, drilling on past exam
papers) to excel in examinations are common among associate degree students. On
the contrary, engagement in social relationships, participation in co-curricular
activities, and breeding a sense of belonging to college life in general are of lesser
concern to them (Lee, 2004). It is therefore expected that facets of peer
relationships may exert less influence on the development of students’ genericcapabilities when compared to other facets that have direct bearing on teaching and
learning.
Second, from veteran teachers’ observations, associate degree students ingeneral have lower self-esteem than their undergraduate counterparts, as a result of
their head-on failure in the public examination (Lee, 2004). Even when associate
degree graduates have re-entered university, many still manifest low self-esteemand consider themselves as less capable than their classmates who have followed a

8/18/2019 (Contemporary Approaches to Research
http://slidepdf.com/reader/full/contemporary-approaches-to-research 171/284
LEE ET AL.
172
‘neat and normal’ path to university (through the Joint University Program
Admission System).
Unlike conventional local government-financed tertiary institutions, those
offering associate degrees are mainly teaching institutions, focusing mainly on the
provision of quality teaching. Most of the assigned duties of academic staffmembers in these institutions are teaching-related, and research activities are often
made optional. As a result, teaching performance may factor in as one of the very
important criteria for personnel matters (including recruitment, promotion and
performance appraisal), and this leads to a very strong ethos among academic staffmembers to strive for excellence in teaching. Furthermore, this ethos is reinforced
by elaborate quality assurance processes including minimum numbers and types ofassessment tasks used, types of examination questions designed, annual peer class
review exercises, pledge of return dates for assignments with feedback, and
opportunities for students to review examination scripts for feedback purposes. All
of these college-wide practices prepare academic staff members to become fluent
in dialogue relating to learning and teaching matters. It is therefore expected thatsuch fluency will translate into the design of learning and teaching environments
that are conducive to students’ articulation to other universities.
Learning Environment and the Development of Generic Capabilities among
University Students
There has been a prevalence of research examining and tracking the development
of college students’ generic competences in the light of their college experiences
(see for example Tinto, 1987; Pascarella & Terenzini, 2006). This strand ofresearch has suggested that the overall college climate pertaining to both the
academic and social aspects of students’ lives are pivotal determinants of
persistence and success (Tinto, 1975, 1987). Nevertheless, it has been argued thatthis research may not help to identify specific aspects of the learning environment
that effect changes in students’ generic capabilities. When universities are unaware
of the underlying mechanisms, the development of specific capabilities to their full
potential is less likely (Kember & Leung, 2005a, 2005b).
In this light, Kember and colleagues (Kember & Leung, 2005a, 2005b, 2009,2011; Kember, Leung, & Ma, 2007) pioneered research work in characterizing
important facets of the learning environment and students’ perceptions of their
generic capabilities with the use of a diagnostic instrument, the StudentEngagement Questionnaire (SEQ; Kember & Leung, 2005b, 2009). Furthermore,
they theorized and tested causal models of the impact of identified facets of thelearning environment upon the development of generic capabilities (Kember &Leung, 2009, 2011). The Student Engagement Questionnaire consists of a total of
15 dimensions, six of which measure elements of the learning and teaching
environment while the remaining nine measure generic capabilities that areimportant for lifelong learning. Kember and colleagues theorized that the six
learning and teaching dimensions can be subsumed under three latent variables,
namely 1) Teaching, 2) Teacher-Student Relationship and 3) Student-Student

8/18/2019 (Contemporary Approaches to Research
http://slidepdf.com/reader/full/contemporary-approaches-to-research 172/284
GENERIC CAPABILITIES IN TEACHING AND LEARNING ENVIRONMENTS
173
Relationship; while the nine generic capabilities dimensions are grouped under two
latent constructs of 1) Intellectual Capabilities and 2) Working Together.
The model developed by Kember and Leung in 2009 (the 2009 Model), using a
sample of undergraduates in Hong Kong, hypothesized that (1) Teaching has a
direct effect on the development of Intellectual capabilities while (2) Student-Student Relationship has a direct impact on Working Together, which in turn has a
direct impact on Intellectual Capabilities. All three constructs in the learning and
teaching environment domain (Teaching, Teacher-Student Relationship and
Student-Student Relationship) inter-correlated with each other. Later in 2011,Kember and Leung revised their model by adding a direct path from Teaching to
Working Together, and allowed the two capability latent variables, WorkingTogether and Intellectual, to impact on each other (a covariance between the two
latent variables) instead of Working Together impacting on Intellectual (Kember &
Leung, 2011; the 2011 Model). Empirical data supported the hypothesized models
and they have been replicated with different samples of Hong Kong graduates and
undergraduate students. This converging line of findings suggests the adequacyand stability of the models in capturing the mechanism of developing generic
capabilities in relation to learning and teaching environments in the Hong Kong
tertiary context.
The Present Study
The objective of the present study was to examine the development of associate
degree students’ generic capabilities in relation to the learning and teaching
environment. Specifically, we tested whether the mechanism of the impact of theteaching and learning environment on capability development identified for
undergraduate students can be generalized to a sample of associate degree students.
We believed the mechanism would be similar for the associate degree students butexpected that there may be nuanced differences in the interplay of the learning and
teaching environment and the development of their generic capabilities when
compared to their undergraduate counterparts, due to the differences found in a
complex multilayer ecological system. It was hoped that the results generated from
the present study would shed light on the understanding of learning environmentsat the associate degree level and inform the design of learning environments that
promote deep learning.
METHOD
Sample and Procedure
The target population in the study was all of the 1166 associate degree students
enrolled in the Marketing, Engineering and Sociology programs of a community
college in 2008 to 2010 in Hong Kong. The students were invited to complete aquestionnaire in class at the commencement of the academic years of 2008, 2009
and 2010. The project research assistant explained the purpose of the study, the

8/18/2019 (Contemporary Approaches to Research
http://slidepdf.com/reader/full/contemporary-approaches-to-research 173/284
LEE ET AL.
174
voluntary nature of the participation, the guarantee of confidentiality, and that all
the results would be disseminated in aggregated formats. A total of 1110 students
participated in the study voluntarily and completed the questionnaires, resulting inan overall response rate of 95.2%. Their ages ranged from 19 to 22.
Instrument
The questionnaire in this study was adapted from the Student EngagementQuestionnaire developed to seek feedback from university students (Kember &
Leung, 2009). This instrument consists of 33 items measuring students’
perceptions of their generic capability development and elements in the teachingand learning environment. The original SEQ was developed through a series of
studies (Kember & Leung, 2005a, 2005b, 2009, 2011) and, in its final version, thesix generic capabilities include (1) critical thinking , (2) self-managed learning , (3)
adaptability, (4) problem solving , (5) communication skills, and (6) interpersonal
skills and groupwork . Previous studies had surveyed both graduates (Kember &Leung, 2005) and undergraduates (Kember & Leung, 2005b, 2009, 2011; Leung &
Kember, 2005a). It was believed that the six capabilities in the instrument should
also be applicable to associate degree students, and hence no change was made tothe capability domain of the instrument.
The scales in the teaching and learning environment domain were modified in
order to better characterize the relevant nature of the teaching and learningenvironment in the associate degree context. The original SEQ includes the
following nine elements in the teaching and learning environment domain: (1)
active learning , (2) teaching for understanding , (3) feedback to assist learning , (4)assessment , (5) teacher-student interaction, (6) assistance from teaching staff , (7)
relationship with other students, (8) cooperative learning , and (9) coherence of
curriculum. Three elements in this domain, cooperative learning, coherence of
curriculum, and assistance from teaching staff, were dropped from the currentstudy due to its relevance to the present context of associate degree programs as
well as the length of the questionnaire. Since much of the curriculum space of the
associate degree program is concerned with the provision of general education, the
structure and coherence of the specific domain knowledge may not be salient tostudents. The remaining six elements were retained in the teaching and learning
environment domain, which was believed to reflect the forms of teaching and
learning at the associate degree level, which appears to make it suitable for the present study.
Appendix 1 displays the modified version of the questionnaire, with 25 itemsmeasuring the development of the six capabilities and the six elements in theteaching and learning environment. All the 12 scales have two items except
assessment which has three. The items were rated on a 5-point Likert scale ranging
from 1 (very little) to 5 (very much).
Thus, the 2009 and 2011 Models developed by Kember and Leung (2009,
2011) were modified according to the changes in SEQ, and the two models beingtested in the present study are shown in Figure 1. The modifications to the original

8/18/2019 (Contemporary Approaches to Research
http://slidepdf.com/reader/full/contemporary-approaches-to-research 174/284
model
by th
curric
Teach
In
compof the
Teach
they r
– actiassess
Teach
items
relatio
teachi
Figur and d
wit Teachi
GEN
s were that: (
e observed
lum of the T
er-Student Re
he following
ting Cronbacfive latent va
ing. Seven i
ceived inside
ve learningment (α = 0.5
r-student rel
comprising
nship with t
g staff (α =
1. The modifivelopment of g hout the dasheng to Working
ERIC CAPABIL
) the Student
variable stu
eaching latent
lationship lat
section, we
h’s alpha valiables which
ems were us
the classroo
(α = 0.529),58).
ationship. T
two constru
eir teachers,
0.604), and t
d hypothesised eneric attribute direct paths aTogether and t
by the das
ITIES IN TEAC
-Student Rela
dent-student
variable and
nt variable w
present the
e using SPSwere include
d to measure
. These item
teaching fo
eacher-studen
cts to refle
that is, fee
acher/student
model relatin s for associate
d the 2011 M e path from W ed covariance
ING AND LEA
ionship laten
interaction,
assistance fro
ere dropped.
easure of i
S19.0 for thein the model
student’s per
s were group
understandi
t relationship
t students’
back to assi
interaction (
the teaching adegree student del with the daorking Togethe
ath
RNING ENVIR
variable was
while cohe
m teaching st
ternal consis
constructs utesting.
eption of the
d into three c
ng (α = 0.6
was measure
perceptions
t learning fr
= 0.598).
d learning env. Note: The 20
shed direct pat r to Intellectual
NMENTS
175
replaced
ence of
aff of the
tency by
der each
teaching
onstructs
06), and
d by four
of their
om their
ironment09 Model fromreplaced

8/18/2019 (Contemporary Approaches to Research
http://slidepdf.com/reader/full/contemporary-approaches-to-research 175/284
LEE ET AL.
176
Student-student relationship. There was only one construct with two items used
to assess students’ perceptions of their relationship with fellow students, which
was student/student interaction (α = 0.462).
Intellectual. Eight items were used to assess the development of students’
intellectual attributes. These items were grouped into four constructs: critical
thinking (α = 0.586), self-managed learning (α = 0.676), adaptability (α = 0.50),
and problem solving skills (α = 0.717).
Working together. Students’ perception of the development in capabilities in
communication and team work skills were measured by four items which weregrouped into two constructs of communication skills (α = 0.680), and
interpersonal skills & group-work (α = 0.498).
Mean scores for the scales were then computed by averaging their
corresponding items and are shown in Table 1.
Table 1. Mean and standard deviation of the 12 subscales in the modified Student
Engagement Questionnaire for associate degree students (n = 1110)
Dimension Mean (SD)
Critical thinking 3.60 (0.57)
Adaptability 3.61 (0.58)
Self-managed learning 3.70 (0.69)
Problem-solving 3.37 (0.61)
Communication skills 3.51 (0.69)
Interpersonal skills and group work 3.74 (0.64)
Active learning 3.63 (0.57)
Teaching for understanding 3.75 (0.54)
Feedback to assist learning 3.66 (0.58)
Assessment 3.70 (0.48)
Relationship between teachers and students 3.90 (0.56)
Relationship with other students 3.59 (0.64)
Data Analysis
Structural equation modelling (SEM) was used to test the two hypothesised
models. The aim was to replicate and then compare the two possible models
developed for undergraduate students, as reported by Kember and Leung (2009)
8/18/2019 (Contemporary Approaches to Research
http://slidepdf.com/reader/full/contemporary-approaches-to-research 176/284
GENERIC CAPABILITIES IN TEACHING AND LEARNING ENVIRONMENTS
177
and Kember and Leung (2011), in the associate degree context with the adaption in
the instrument. The two unstandardized factor loadings of critical thinking from
Intellectual and communication skills from Working Together, and the variances ofthe two latent variables in the teaching and learning environment domain,
Teaching and Teacher-Student Relationship, were fixed to 1 for identification
purposes (Byrne, 2006).
The assessment of the model fit was based on several fit indexes including the
root mean square error of approximation (RMSEA; Browne & Cudeck, 1993), the
standardized root mean squared residual (SRMR; Bentler, 2006) and thecomparative fit index (CFI; Bentler, 1990). As a rule of thumb, a model with
RMSEA < 0.08, SRMR < 0.08 and CFI > 0.90 would be considered as anacceptable fit to the data (Hoyle, 1995) and not rejected. Comparison of the two
hypothesized structural models was made using the corrected Satorra–Bentler
robust chi-square difference (∆R-χ 2) test between the more stringent model (2009
Model) and the less stringent one (2011 Model) (Satorra & Benlter, 2001). We saidthe 2011 Model provided a statistically better fit than the 2009 Model if the ∆R-χ 2 test was statistically significant, that is, the path from Teaching to Working
Together was statistically different from zero, and the relationship between
Intellectual and Working Together is bi-directional, instead of uni-directional from
Working Together to Intellectual.We first checked the normality of univariate and multivariate distributions of
the 12 measured constructs. The univariate distributions of the variables were only
slightly non-normal (skewness: -0.66 to 1.13; kutosis: 0.48 to 0.69) but thenormalized value (26.10) is large, which is indicative of the non-normality of the
data (Benter, 2006; Byrne, 2006). Thus, the maximum likelihood procedure withthe Satorra-Bentler robust correction (Satorra & Benlter, 1988, 1994) was used inthe parameter estimations in SEM to adjust for non-normality. All the models were
tested using the EQS package (Benlter, 2006). Converged solutions with no-of-
range parameter estimates were obtained in all the analyses.
RESULTS
The 2009 Model
The covariance matrix of the 12 constructs was submitted for analysis (Table 3).All the factor loadings, variances of the latent variables and covariances between
the latent variables, and the structural paths from the teaching and learning domain
to the capability development domain in the 2009 Model, were statisticallysignificant. The goodness-of-fit indices obtained for the model were R-χ 2 (df) =
304.05 (49), SRMR = 0.087, R-CFI = 0.925, R-RMSEA (90% CI) = 0.069 (0.061,
0.076), which yielded a reasonable approximation to the data. Figure 2 shows thestandardized parameter estimates of the 2009 Model. All the standardized factor
loadings were > 0.4. The three variables in the teaching and learning environment
domain were positively correlated to a moderate to strong extent, as anticipated.The impacts of Teaching on Intellectual and of student-student interaction on

8/18/2019 (Contemporary Approaches to Research
http://slidepdf.com/reader/full/contemporary-approaches-to-research 177/284
LEE E
178
Worki
Intelle
The 2
The fi(df) =
(0.049
covari
AL.
ng Together
ctual was stro
Table 2. Cov
11 Model
indexes of t220.94 (48),
, 0.065). All
ances betwee
were small,
ng.
ariance matrix
e 2011 ModSRMR = 0.0
the factor l
the latent va
while the
of the 12 subsc
l indicated a8, R-CFI =
oadings, var
riables, and t
impact of
ales in the ana
acceptable fi.949, R-RMS
ances of the
e structural p
orking Tog
ysis (n = 1110
t to the dataEA (90% CI
latent varia
aths from the
ether on
ith R-χ 2 = 0.057
bles and
teaching
Figuand l
e 2. Standardiearning enviro
ed parameternment to the de
students:
stimates of thevelopment of g
The 2009 Mod
structural mod neric capabili
l (n = 1110)
el relating theies in associate
eachingdegree

8/18/2019 (Contemporary Approaches to Research
http://slidepdf.com/reader/full/contemporary-approaches-to-research 178/284
and le
statisti
provid
129.6
model
amonthe te
Toget
similaimpac
studenthe 20
which
Figu
and l
The r degre
under
obser hypot
charac
GEN
arning domai
cally signific
ed a statistic
, df = 1, p-va
are shown in
Teaching, Taching and
er to Intelle
to those ob of Teaching
t-student inte09 Model, a
the impact w
e 3. Standardi
earning enviro
sults suggest learning e
raduate lear
ed in the sesized mode
terizing the
ERIC CAPABIL
to the capabi
ant. The ∆R-
ally better fit
lue < 0.001).
Figure 3. All
eacher-Studelearning envi
ctual in the
tained in theto Intellectua
raction to Wfter adding t
as estimated t
ed parameter
nment to the de students:
that the devvironment f
ing environ
pecific pathsls suggests t
echanism of
ITIES IN TEAC
lity develop2 test reveale
than the m
The standardi
the standardi
t Relationshironment do
apability do
2009 Model. was estimat
orking Togete path from
be moderate
stimates of the
velopment of g The 2011 Mod
DISCUSSIO
elopment ofollows a si
ent; but th
among varie 2011 Mod
various learni
ING AND LEA
ent domain i
d that the less
re stringent
zed paramete
zed factor loa
p and student ain and the
ain in the
In the 2011d to be stron
er was weaTeaching to
.
structural mod
neric capabilil (n = 1110)
generic capailar mechan
re are some
ables. Compel is deemed
ng environme
RNING ENVIR
the 2011 M
stringent 201
2009 Model
estimates of
dings, the co
-student inter path from
011 Model
Model, hower while the i
er when coWorking To
el relating the
ies in associat
ilities in anism as foun
nuanced di
arison of fitmore appro
nt facets imp
NMENTS
179
del were
1 Model
(∆R-χ 2 =
the 2011
relations
action inWorking
emained
ever, thempact of
pared toether , of
eaching
degree
associated in an
fferences
of tworiate for
acting on

8/18/2019 (Contemporary Approaches to Research
http://slidepdf.com/reader/full/contemporary-approaches-to-research 179/284
LEE ET AL.
180
various facets of generic capabilities. Specifically, the 2011 Model demonstrates
that the latent variable Teaching yields significant direct paths on both the latent
variable of Intellectual and Working Together. Moreover, Teaching also yields an
indirect impact on the nurturance of Intellectual through Working Together
indirectly.Taking a closer look at the fitted model, it can be seen that the magnitude of the
coefficient of Teaching on Intellectual is relatively high (beta = 0.53), suggesting
that indicators of assessment, teaching that focuses on understanding as well as the
use of active pedagogies are salient for the development of intellectual capabilities(critical thinking, problem-solving, self-managed learning, and adaptability). At
the same time, Teaching exerts influence on the nurturance of Working together (acluster of generic social skills that includes communication skills, interpersonal
and groupwork skills) but with a smaller magnitude (beta = 0.39) when compared
to its path on Intellectual capabilities. In contrast, the role of the latent variable
Student-Student interaction has a much weaker influence on the nurturance on
Working Together (beta = 0.11) when compared to Teaching. In sum, in anassociate degree level learning environment, much of the changes affected upon
students are sourced from the formal learning processes (lectures and tutorials) and
academic related activities.
Furthermore, the observed correlation between Teaching and Teacher-StudentRelationship in the teaching and learning environment domain was quite different
from previous studies in undergraduate samples. In the present study, the
correlation was as high as 0.98, which was similar to the results of Kember andLeung’s studies in 2005a and 2009, but was substantially higher than those
reported in their later study (2011) (0.26-0.37). These findings may characterizeteaching-oriented sub-degree tertiary institutions, where priorities and resources
are placed on teaching and the provision of a caring culture. This may be becausethe academic staff members can be more accessible and more able to provide
timely assistance to students outside regular weekly contact hours because their
major responsibility is teaching and their duties are not mixed with research and
community service. The high correlations between Teaching and Teacher-StudentRelationship found in the current study and the two previous studies by Kember
and Leung (2005a, 2009) might also have occurred because there were only two
indicators used to characterize the Teacher-Student Relationship latent variable,which might not be good enough to separate the two distinct concepts of Teaching
and Teacher-Student Relationships among associate degree and undergraduate
students. Another reason might be the use of a mixture of students from the
Marketing, Engineering and Sociology programs who might have respondeddifferently to the modified SEQ. Indeed, Kember and Leung (2011) had reported
disciplinary differences in the mechanism for how the teaching and learning
environment affects the development of generic capabilities. Further studies should
be conducted on the characterization of the elements in the teaching and learningenvironment in the associate degree context.
The pervasive role of the teacher in the associate degree learning environment
on the development of students’ capabilities is clear: teachers’ practices in the

8/18/2019 (Contemporary Approaches to Research
http://slidepdf.com/reader/full/contemporary-approaches-to-research 180/284
GENERIC CAPABILITIES IN TEACHING AND LEARNING ENVIRONMENTS
181
classroom yield a direct influence on the development of both types of generic
capabilities in students; and teachers’ out-of-class interactions and feedback
provided for students feed substantially into the process of learning and teaching in
classroom. In this light, it is important for institutions offering associate degrees to
foster good teaching and learning ethos and practices among teaching staffmembers (as the construct of Teaching is indicated by aspect of assessment, use of
pedagogy, teaching for understanding as well as design of curriculum).
Specifically, at the meso-level, the institute can maintain its existing quality
assurance practices so as to benchmark quality teaching. Furthermore, it may beuseful to introduce quality enhancement efforts to support academic staff members
to develop their assessment and pedagogy literacy. By providing academic staffmembers with the theory of constructive alignment (Biggs, 1996), practices of
cutting-edge assessment techniques and pedagogies, they can have both the
principles and strategies to design curriculum, assessment and classroom activities
to create a positive backwash effect in order to harness the students’ examination-
oriented mindset (Biggs & Tang, 2011). This would also be useful to provide theskills and tangible support for academic staff members to conduct action research,
so that their practices can be both reflective and evidence-based. However, it is
noted that this work was conducted in one of the associate degree institutions in
Hong Kong, hence some of the meso-contextual factors described in the presentstudy might be idiosyncratic to this institute and may not be representative to all
other providers in Hong Kong. Further efforts should be made to replicate the
current findings and examine in more depth the actual mechanisms of change inother similar institutions.
CONCLUSION
The present study examined the mechanism for developing generic capabilities in
an associate degree learning environment. Despite the differences at the meso and
micro levels when comparing associate degree and degree offering institutes, itwas found that the mechanism for developing generic capabilities in associate
degree students is similar to that found in undergraduate students. At associate
degree level, the role of the formal curriculum, pedagogies and assessment thatconstitute the construct of Teaching in the model play a pivotal role in influencing
the development of both the intellectual and social aspects of generic capabilities.
In this light, it is suggested that there is a need to promote quality enhancement in
learning and teaching among teaching staff members, so as to provide them with
sufficient understanding, relevant theories and up-to-date, cutting-edge techniquesin assessment and pedagogy.
Finally, after a decade, the development of associate degree in Hong Kong has
already moved beyond its gestation period. Systematic empirical effort may also be
needed to advance our understanding beyond the societal and policy levels to theclassroom level. It is hoped that, through such systemic effort among practitioners,
the existence of the associate degree in Hong Kong will become more than only a

8/18/2019 (Contemporary Approaches to Research
http://slidepdf.com/reader/full/contemporary-approaches-to-research 181/284
LEE ET AL.
182
second chance for students to get into University, but will also add value to
youngsters’ generic competencies and prepare them for future pursuits of any kind.
APPENDIX 1
The Modified Version of the Student Engagement Questionnaire for Associate
Degree Students
Critical Thinking:1. I have the ability to make judgments about alternative perspectives.
2.
I am willing to consider different points of view.Self-managed Learning:
3. I feel that I can take responsibility for my own learning.
4. I am confident of my ability to pursue further learning.
Adaptability:
5. During my time at the College, I have learnt how to be more adaptable.6. I am willing to change my views and accept new ideas.
Problem-solving:
7. I have improved my ability to use knowledge to solve problems in my
field of study.8. I am able to bring information and different ideas together to solve
problem.
Communication Skills:
9.
I have the ability to communicate effectively with others.10.
In my time at the College, I have improved my ability to convey ideas.
Interpersonal Skills:
11. I am an effective team or group member.12. I feel confident in dealing with a wide range of people.
Active Learning:
13. Our teaching staff use a variety of teaching methods.14. Students are given the chance to participate in classes.
Teaching for Understanding:
15. The teaching staff try hard to help us understand the course material.
16. The course design helps students understand the course content.
Feedback to Assist Learning: 17. When I have difficulty with learning materials, I find the explanations
provided by the teaching staff very useful.
18.
There is sufficient feedback on activities and assignments to ensure thatwe learn from the work we do.
Assessment:
19. The programme use a variety of assessment methods.
20. To do well in assessment in this programme you need to have goodanalytical skills.
21. The assessment tested our understanding of key concepts in this
programme.

8/18/2019 (Contemporary Approaches to Research
http://slidepdf.com/reader/full/contemporary-approaches-to-research 182/284
GENERIC CAPABILITIES IN TEACHING AND LEARNING ENVIRONMENTS
183
Teacher-student Relationship:
22. The communication between teaching staff and students is good.
23. I find teaching staff helpful when asked questions.
Student-student Relationship:
24. I feel a strong sense of belonging to students in my programme.
25. I frequently work together with others in my programme.
ACKNOWLEDGEMENTS
This work was supported by Hong Kong SAR, Education Bureau, QualityEnhancement Grant Scheme. We thank Mr. Victor Chan for the data analysis and
Ms Amber Ho for her effort in data collection.
REFERENCES
Bentler, P. M. (1990). Comparative fit indexes in structural models. Psychological Bulletin, 107 (2),
238-246.
Bentler, P. M. (2006). EQS structural equations program manual . Encino, CA: Multivariate Software.
Biggs, J. (1996). Western misperceptions of the Confucian-heritage learning culture. In D. Watkins & J.
B. Biggs (Eds.), The Chinese learner: Cultural, psychological and contextual influences. Melbourne
and Hong Kong, Australian Council for Educational Research and the Comparative Education
Research Center, University of Hong Kong.
Biggs, J., & Tang, C. (2011). Teaching for quality learning at university (4th ed.). Philadelphia, PA:
Open University Press.
Bransford, J. D., Brown, A. L., & Cocking, R. R. (Eds.). (2000). How people learn: Brain, mind,
experience, and school . Washington, DC: National Academy Press.Browne, M. W., & Cudeck, R. (1993). Alternative ways of assessing model fit. In K. A. Bollen & J. S.
Long (Eds.), Testing structural equation models (pp.136-161). Newbury Park, CA: Sage.
Byrne, B. M. (2006). Structural equation modelling with EQS: Basic concepts, applications, and
programming (2nd ed.). Mahwah, NJ: Lawrence Erlbaum Associates, Inc.
Heorn, L. (2006, March). More degree places to be available in shake-up. South China Morning Post ,
Hong Kong, SAR, China, p. C2.
HKSAR Education Commission. (2000). Review of education systems: Reform proposals. Hong Kong
Special Administrative Region: Printing Department.
HKSAR, Information Portal for Accredited Post-secondary Programmes (2012).
http://sc.edb.gov.hk/TuniS/www.ipass.gov.hk/edb/index.php/en/home/statheader/stat/stat_pg_index,
last retrieved October 2012.
Hoyle, R. (1995). The structural equation modeling approach: Basic concepts and fundamental issues.
In R. H. Hoyle (Ed.), Structural equation modeling, concepts, issues, and applications (pp. 1-15).
Thousand Oaks, CA: Sage Publications.
Kember, D. (2010). Opening up the road to nowhere: problems with the path to mass higher education
in Hong Kong. Higher Education, 59, 167-179.
Kember, D., & Leung, D. Y. P. (2005a). The influence of active learning experiences on the
development of graduate capabilities. Studies in Higher Education, 30(2), 155-170.
Kember, D., & Leung, D. Y. P. (2005b). The influence of the teaching and learning environment on the
development of generic capabilities needed for a knowledge-based society. Learning Environments
Research, 8(3), 245-266.
Kember, D., & Leung, D. Y. P. (2006). Characterising a teaching and learning environment conducive
to making demands on students while not making their workload excessive. Studies in Higher
Education, 31(2), 185-198.

8/18/2019 (Contemporary Approaches to Research
http://slidepdf.com/reader/full/contemporary-approaches-to-research 183/284
LEE ET AL.
184
Kember, D., & Leung, D. Y. P. (2009). Development of a questionnaire for assessing students’
perceptions of the teaching and learning environment and its use in quality assurance. Learning
Environments Research, 12(1), 15-29.
Kember, D., & Leung, D. Y. P. (2011). Disciplinary differences in student ratings of teaching quality.
Research in Higher Education, 52(3), 278-299.
Kember, D., Leung, D. Y. P., & Ma, R. S. F. (2007). Characterising learning environments capable of
nurturing generic capabilities in higher education. Research in Higher Education, 48(5), 609-632.
Lee, W. O. (1996). The cultural context for Chinese learners: Conceptions of learning in the Confucian
tradition. In D. A. Watkins & J. B. Biggs (Eds.), The Chinese Learners: Cultural, psychological
and contextual influences (pp. 25-41). Hong Kong/Melbourne: Comparative Education Research
Centre, The University of Hong Kong/Australian Council for Educational Research.
Lee, E., & Young, E. (2003). Pioneering the community college movement in Hong Kong. International
Journal of Lifelong Education, 22, 147-158.Lee, W. W. S. (2004). A survey of students’ total learning experience in a community college in Hong
Kong. Paper presented at the Conference on Internationalization of Lifelong Education: Policy and
Issues, Hong Kong. December, 2004.
Leung, D. Y. P., & Kember, D. (2005a). Comparability of data gathered from evaluation questionnaires
on paper and through the internet. Research in Higher Education, 46 (5), 571-591.
Leung, D. Y. P., & Kember, D. (2005b). The influence of the part-time study experience on the
development of generic capabilities. Journal of Further and Higher Education, 29(2), 91-101.
Leung, D. Y. P., & Kember, D. (2006). The influence of teaching approach and teacher-student
interaction on the development of graduate capabilities. Structural Equation Modeling , 13(2), 264-
286.
Pascallera, E. T., & Terenzini, P. T. (2006). How college affects students. San Fransico: Jossey-Bass.
Postiglione, G. (2009). Community colleges in China’s two systems. In R. R. Latiner & E. J. Valeau
(Eds), Community college models: Globalization and higher education reform (pp. 157-172).
Amsterdam: Springer Press.
Resnick, L. B. (2010). Nested learning system for the thinking curriculum. Educational Researcher , 39,183-197.
Satorra, A., & Bentler, P. M. (1988). Scaling corrections for chi-square statistics in covariance structure
analysis, In ASA 1988 Proceedings of the Business and Economic Statistics Section (pp. 308-313).
Alexandria, VA: American Statistical Association.
Satorra, A., & Bentler, P. M. (1994). Corrections to test statistics and standard errors in covariance
structure analysis. In A. van Eye & C. C. Clogg (Eds.), Latent variable analysis in developmental
research (pp. 285-305). Newbury Park, CA: Sage Publication.
Satorra, A., & Bentler, P. M. (2001). A scaled difference chi-square test statistic for moment structure
analysis. Psychometrika, 66 , 507-514.
Sawyer, R. K. (Ed.). (2006). The Cambridge handbook of the learning sciences. Cambridge University
Press.
Tinto, V. (1975). Dropout from higher education: A theoretical synthesis of recent research. Review of
Educational Research, 45(1), 89-125.
Tinto, V. (1987). Leaving college. Chicago, IL: University of Chicago Press.
Wincy W. S. LeeThe University of Hong Kong, China
Doris Y. P. Leung
The Chinese University of Hong Kong, China
Kenneth C. H. Lo
Hong Kong Community College, China

8/18/2019 (Contemporary Approaches to Research
http://slidepdf.com/reader/full/contemporary-approaches-to-research 184/284
PART III
STRUCTURAL EQUATION
MODELING IN
EDUCATIONAL PRACTICE
8/18/2019 (Contemporary Approaches to Research
http://slidepdf.com/reader/full/contemporary-approaches-to-research 185/284
M.S. Khine (ed.), Application of Structural Equation Modeling in Educational Research and
Practice, 187–216.
© 2013 Sense Publishers. All rights reserved.
GREGORY ARIEF D. LIEM AND ANDREW J. MARTIN
9. LATENT VARIABLE MODELING IN
EDUCATIONAL PSYCHOLOGY: INSIGHTS
FROM A MOTIVATION AND ENGAGEMENT
RESEARCH PROGRAM
INTRODUCTION
The application of latent variable modeling in various areas of psychological
research has dramatically grown in popularity over the past three decades (see e.g.,
Breckler, 1990; Hershberger, 2003; MacCallum & Austin, 2000; Tomarken &
Waller, 2005; Tremblay & Gardner, 1996 for systematic reviews). This growth is
also apparent in educational psychology research that primarily seeks to address arange of applied and policy related questions to promote educational outcomes.
Contemporary Educational Psychology, for example, recently dedicated a special
issue on applications of latent variable modeling in educational psychologyresearch (Kulikowich & Hancock, 2007). In their commentary in this special issue,
Marsh and Hau (2007) called for educational psychology researchers to emphasize
and adopt methodological-substantive synergies; that is, to conduct research that
harnesses and makes the best use of methodological advancements in addressingimportant substantive issues which otherwise could not be appropriately pursued
without such advances. In this context, applications of latent variable modeling
techniques have the capacity to answer this call. This is the case because latent
variable modeling is considered a unique and powerful approach to representing
and assessing hypothetical (unobservable) psycho-educational constructs (e.g.,academic motivation, engagement, self-concept) commonly delved within
educational psychology research. That is, in latent variable modeling, latent
constructs are measured by multiple manifest (observable) indicators and arelinked to multiple antecedents, multiple mediators and moderators, and multiple
outcomes – the majority of which are hypothetical and latent constructs
themselves. Thus, latent variable modeling is a cutting-edge statistical tool withtremendous potential to shed light on the complexity of inter-relationships of
factors relevant to educational outcomes.
In the present chapter, we provide an overview of contemporary applications of
latent variable modeling techniques (e.g., confirmatory factor analysis [CFA],
structural equation modeling [SEM], multiple-indicator-multiple-cause modeling[MIMIC]), exploratory structural equation modeling [ESEM], multilevel CFA and
SEM) in addressing applied and substantive issues pertinent to student motivation
and engagement. The empirical evidence presented here is drawn from various

8/18/2019 (Contemporary Approaches to Research
http://slidepdf.com/reader/full/contemporary-approaches-to-research 186/284
LIEM AND MARTIN
188
research studies underpinned by the Motivation and Engagement Wheel – a
comprehensive and integrative framework to study a diverse range of key
motivation and engagement factors – and its accompanying assessment tool, the
Motivation and Engagement Scale or MES (Martin, 2007, 2009). In the first
section, we briefly review CFA and SEM, their unique advantages over statisticaltechniques under the umbrella of general linear modeling (GLM), and also their
key role in a construct validation approach to research. In the second section, we
then introduce the Wheel, summarise its theoretical bases, and describe the MES.
In the third section, we review research studies that employ CFA in assessing therelative multidimensionality and specificity of motivation and engagement factors
across various academic domains, over diverse samples, and between distinct unitsor levels of analysis. In the fourth section, we present examples of large-scale
longitudinal SEM studies that seek to test theoretically hypothesized models
linking academic motivation and engagement to their antecedents and outcomes. In
this section, we also report on the use of ESEM on responses to the MES. Finally,
in the fifth section, we point out some key areas of recent development in latentvariable techniques (i.e., composite-score latent modeling, cross-lagged latent
modeling, latent variable interaction, and latent growth modeling) that offer future
methodological opportunities for educational psychology researchers seeking to
establish more reliable empirical evidence that supports educational policy and practice.
THE ROLE OF CFA AND SEM IN CONSTRUCT VALIDATION
Construct Validation Approach to Research
Given the latent and unobserved nature of the majority of psycho-educational
constructs (e.g., academic motivation), researchers have proposed a construct
validation approach to educational psychology research (Marsh & Hau, 2007;
Marsh, Martin, & Hau, 2006; Martin, 2007; Martin, Green, Colmar, Liem, &Marsh, 2011). This approach essentially focuses on the interplay between the
theoretical conceptualisation of the target construct under examination and its
measurement validation. Thus, the main issue at the heart of this approach
concerns the extent to which a latent construct is well represented or well defined
by its manifest indicators and the extent to which the latent factor is positivelyrelated to other latent constructs that are theoretically and conceptually compatible
or congruent (e.g., mathematics self-efficacy and mathematics self-concept);
negatively related to other latent constructs that are theoretically and conceptuallyopposing or antithetical (e.g., mathematics self-efficacy and mathematics test
anxiety); and trivially or non-significantly related to other latent constructs that are
not theoretically and conceptually associated (e.g., mathematics self-efficacy and physical self-concept). Accordingly, studies that adopt a construct validation
approach can be classified as within-network or between-network studies with the
former concerned with the internal structure of an instrument comprising sets ofitems serving as indicators of distinct latent constructs that the instrument purports

8/18/2019 (Contemporary Approaches to Research
http://slidepdf.com/reader/full/contemporary-approaches-to-research 187/284
LATENT VARIABLE MODELING IN EDUCATIONAL PSYCHOLOGY
189
to measure, and the latter seeking to establish a logical and theoretically consistent
pattern of relationships between a given latent construct and its conceptually
related latent constructs (in the case of convergent validity) or conceptuallydissimilar latent constructs (in the case of discriminant validity).
CFA and SEM
In the context of the construct validation approach, CFA and SEM are two majorgroups of latent variable modeling techniques that predominantly underpin within-
network and between-network analytic frameworks, respectively. It is important to
note that these modeling techniques, when appropriately employed, have variousadvantages over traditional, non-latent variable analytic tools such as exploratory
factor analysis or regression analysis. First, these statistical procedures allowresearchers to investigate correlational data by specifying a priori the expected
factor structure for the measures under investigation as well as the associations
and/or predictive paths between latent constructs, thereby encouraging theresearcher to base predictions on extant theorising and prior research rather than
relying on exploratory approaches. Second, unlike many other techniques, latent
variable modeling can be effectively used to test the entire hypothesized model andits complex predictive relationships amongst factors in one analysis, a procedure
that is particularly important for testing theoretical models in educational
psychology. Third, latent variable modeling also takes into account the presence ofmeasurement errors associated with observed indicators, thereby providing more
accurate estimated parameters for inter-factor relationships. Fourth, latent variable
modeling allows us to assess the invariance of key measurement parameters inCFA (i.e., factor loadings, factor correlations, error terms) and predictive paths in
SEM (i.e., regression weights) across groups involved in the investigation (e.g.,
female and male students, early and later adolescents) to determine whether these
groups come from the same population and, therefore, justify pooling responsesacross groups and draw a broad conclusion of findings (or otherwise, in cases
where invariance is not established).
Whilst a technical discussion of CFA and SEM is beyond the scope of this
chapter, it is considered sufficient to provide a brief description of each of thesetechniques (for more detailed accounts of CFA and SEM, see e.g., Byrne, 2012;
Kline, 2011). In CFA, it is hypothesized that (a) each measured indicator will have
a non-zero loading onto the factor it is designed to measure and a zero loading ontoall other factors, (b) all latent factors are correlated (i.e., when a measurement
model comprises more than one latent factor), and (c) the error terms (oftenreferred to as item uniquenesses) for each measured variable are uncorrelated(unless specified otherwise, see below). Furthermore, within a CFA framework, a
higher-order latent factor can be generated by setting specific lower-order latent
factors as “defining indicators” of the hypothesized higher-order latent factor.
Figure 1 shows a pictorial representation of measurement and structural
components of a two-latent factor model. The CFA component is represented inthis figure by two measurement models embodying two latent factors (LF1 and

8/18/2019 (Contemporary Approaches to Research
http://slidepdf.com/reader/full/contemporary-approaches-to-research 188/284
LIEM AND MARTIN
190
LF2), each of which is defined by three indicators (Item 1, Item 2, and Item 3 for
LF1 and Item 4, Item 5, and Item 6 for LF2) while taking into account their
associated error terms (e1, e2 e3, e4, e5, and e6). Figure 1 also shows a predictiverelationship between LF1 and LF2, representing the structural component of the
model. It is important to note that whilst there are only two latent factors in this
example, which is built for illustrative purposes, latent variable models
hypothesized and tested in educational psychology research are typically more
comprehensive and reflective of the complexity of the relationships of numerous
latent factors (see our examples below). In summary, in latent variable modeling, psycho-educational constructs are represented by latent factors corrected for
measurement errors or unreliability and the complexity of structural relationshipsof such constructs can be simultaneously estimated in a one-step analysis of the
proposed model. Further, the fit between the data and the model can be assessed
through evaluating various fit indices. In the following section, we describe aconceptual framework that underpins a motivation and engagement research
program that has chiefly capitalized on the flexibility and versatility of CFA and
SEM.
Figure 1. Measurement and structural components of a two-latent factor structural
equation model (adapted with permission from Martin, Green, Colmar, Liem, &
Marsh, 2011). Note: e = error term of manifest indicator (i.e., item uniqueness)
MOTIVATION AND ENGAGEMENT: A CONCEPTUAL MODEL AND ITSASSESSING INSTRUMENT
Across various areas of human endeavour, motivation and engagement play a key
role in adaptive developmental pathways and the pursuit of desirable outcomes. In
the educational setting, students’ motivation and engagement are key to theirachievement, interest in school, and enjoyment of study, among others (Schunk,

8/18/2019 (Contemporary Approaches to Research
http://slidepdf.com/reader/full/contemporary-approaches-to-research 189/284
Pintri
theori
practi
this a
2000).
“use-iappro
2000;
EngagMotiv
enco2009;
The
Withi
inclin potent
drive
conce
h, & Meece
ts and pra
al/applied uti
ea is guide
It is thus no
spired basicches to theo
Wigfield &
ement Wheeation and E
passing and isee also Liem
igure 2. Motivartin, A. J. (2
otivation and
this conc
tion, energyial, whereas
Martin, 2007
tual definitio
LATENT VA
, 2008). Ho
ctitioners th
lity (Urdan &
by diffuse
t surprising t
research” (Pising and re
ambria, 201
l (Figure 2)gagement S
ntegrative stu & Martin, 20
ation and Eng 10). Building c
failur
Engagement
ptual frame
and drive tengagement
, 2009) (how
ns exist). Bas
RIABLE MODE
ever, there
t research
Turner, 2005
theoretical p
here have be
intrich, 2003,earch in this
). In respons
and its accale (MES),
dy of motiva12).
gement Wheellassroom succee. London: Co
Wheel
ork, motiv
learn, wor s the behavi
ver, we reco
ed on this de
LING IN EDUC
has been so
and theories
) and that a g
rspectives (
en calls to gi
p. 668) an field (e.g.,
e to these cal
companyingwere devel
ion and enga
(reproduced wi ss: Eliminatintinuum)
ation is de
effectively,ours aligned
nise that oth
inition, the W
TIONAL PSY
me concern
in the fi
ood deal of re
urphy & A
e greater att
for more iurphy & A
ls, the Motiv
assessment ped to ena
gement (Mart
th permission f academic fear
ined as in
and achievewith this en
r feasible an
heel was dev
HOLOGY
191
amongst
ld lack
search in
exander,
ention to
tegrativeexander,
tion and
ool, thele more
in, 2007,
omand
ividuals’
to theirergy and
cognate
loped as
8/18/2019 (Contemporary Approaches to Research
http://slidepdf.com/reader/full/contemporary-approaches-to-research 190/284
LIEM AND MARTIN
192
a multidimensional framework representing salient cognition and behaviour
pertinent to motivation and engagement. Specifically, it was built upon two basic
congruencies across various models. The first reflects the distinction betweencognitive and behavioural dimensions of achievement pursuit, including theorizing
and research focusing on cognitive and behavioural dimensions to academic
engagement (Fredricks, Blumenfeld, & Paris, 2004), cognitive and behavioural
orientations of learning strategies (Pintrich & Garcia, 1991; Zimmerman, 2008),
cognitive antecedents of behavioural strategies used to negotiate environmental
tasks (Buss & Cantor, 1989), and also cognitive-behavioural approaches toengagement and behaviour change (Beck, 1995). The second relates to hierarchies
within the self-system that reflect the representation of specific factors under moreglobal dimensions (e.g., self-concept, see Marsh & Shavelson, 1985; personality
traits, see Digman, 1997). Taken together, these considerations led to
conceptualising the Wheel in terms of higher- and first-order cognitive and behavioural dimensions.
At its most basic level, as Figure 2 shows, the Wheel comprises four higher-
order dimensions, including adaptive cognition, representing an adaptivemotivational orientation to learning/task; adaptive behaviour, reflecting beneficial
strategies that individuals adopt to engage in their learning/task; impeding
cognition, representing an orientation that inhibits motivated engagement inlearning/task; and maladaptive behaviour, reflecting detrimental strategies that
individuals engage in approaching their learning/task. At the more specific level,
the 11 first-order dimensions of factors were chosen to integrate seminal theoriessuch as self-efficacy, attribution and control, valuing, achievement goal
orientation, need achievement, self-worth, self-determination, and self-regulation(Martin, 2007, 2009). In terms of adaptive cognition , the self-efficacy dimension
is guided by self-efficacy and self-agency perspectives (Bandura, 1997); thevaluing dimension is informed by expectancy-value theory (Wigfield & Eccles,
2000); and the mastery orientation dimension represents the concept of mastery in
achievement goal perspectives (Kaplan & Maehr, 2007) and the notion of intrinsic
motivation in self-determination theory (Ryan & Deci, 2000). The three adaptive behaviour dimensions – planning, task management, and persistence – represent
central learning strategies in the self-regulatory perspective (Pintrich & Garcia,
1991; Zimmerman, 2008). For impeding cognition, the uncertain control
dimension constitutes the controllability element of attribution theory (Connell,1985; Weiner, 1994); and the failure avoidance and anxiety dimensions represent
impeding cognitive factors in achievement need/motive and self-worth
perspectives (Atkinson, 1957; Covington, 1992). Lastly, in terms of maladaptive behaviour, the self-handicapping dimension represents behavioural strategies
aimed at avoiding failures and protecting one’s self-worth (Covington, 1992); and
the disengagement dimension constitutes a negative behavioural consequence of
self-appraisals about ability and/or tasks in the achievement context (Skinner,Kindermann, Connell, & Wellborn, 2009). Taken together, these factors seek to
represent an encompassing set of motivation and engagement factors derived from
contemporary psycho-educational theorizing and research.

8/18/2019 (Contemporary Approaches to Research
http://slidepdf.com/reader/full/contemporary-approaches-to-research 191/284
LATENT VARIABLE MODELING IN EDUCATIONAL PSYCHOLOGY
193
Table 1. Definitions and sample items from the Motivation and Engagement Scale – High School (MES-HS)
No. Scale/Subscale Operational Definition Sample Item
Adaptive Cognition Attitudes and orientations facilitating
learning1. Self-efficacy Students’ belief and confidence in
their own ability to do well in their
learning.
“If I try hard, I believe I can do
my schoolwork well”
2. Valuing Students’ belief about the usefulness,importance, and relevance of the
academic work they engage in.
“Learning at school is important tome”
3. Mastery orientation Students’ orientation to developing
competence and knowledge in theirlearning.
“I feel very pleased with myself
when I really understand what Iam taught at school”
Adaptive Behaviour Behaviours and engagement
facilitating learning 4. Planning The extent to which students plan
their academic work and tasks.
“Before I start an assignment I
plan out how I am going to do it”5. Task management The ways students use their time,
organise their timetable, and choose
and arrange where they work.
“When I study, I usually study in
places where I can concentrate”
6. Persistence The extent to which students sustaintheir engagement.
“If I can’t understand myschoolwork at first, I keep going
over t until I understand it”
Impeding Cognition Attitudes and orientations impeding
learning
7. Anxiety The extent to which students feelanxious when they think about or do
their academic work.
“When exams and assignments arecoming up, I worry a lot”
8. Failure avoidance The extent to which students’motivation to do their work is toavoid failure, doing poorly, or
disappointing others.
“Often the main reason I work atschool is because I don’t want todisappoint my parents”
9. Uncertain control The extent to which students are
uncertain about how to do well or
how to avoid doing poorly.
“I’m often unsure how I can avoid
doing poorly at school”
Maladaptive Behaviour Behaviours and engagementmaladaptive for learning
10. Self-handicapping The extent to which students
compromise their chances of
academic success so they haveexcuses if they do not do well.
“I sometimes don’t study very
hard before exams so I have an
excuse if I don’t do as well as Ihoped”
11. Disengagement Students’ inclination to give up in
their academic work or inachievement setting more generally.
“I often feel like giving up at
school”
Note: adapted with permission from Liem and Martin (2012)
The Motivation and Engagement Scale
Alongside the Wheel is the Motivation and Engagement Scale or MES (Martin,
2007, 2009; see also Liem & Martin, 2012 for a systematic review of the
instrument). The MES consists of 11 motivation and engagement subscales
congruent with the 11 first-order factors in the Wheel (viz. self-efficacy, valuing,
8/18/2019 (Contemporary Approaches to Research
http://slidepdf.com/reader/full/contemporary-approaches-to-research 192/284
LIEM AND MARTIN
194
mastery orientation, planning, task management, persistence, anxiety, failure
avoidance, uncertain control, self-handicapping, and disengagement). The 11
subscales can be grouped into four major scales representing the four higher-ordermotivation and engagement dimensions (i.e., adaptive cognition, adaptive
behaviour, impeding cognition, and maladaptive behaviour). Each of the 11 MES
subscales comprises four items – hence the MES is a 44-item instrument. To
respond to the MES, a 7-point Likert-type scale, ranging from 1 (strongly disagree)
to 7 (strongly agree), is provided – with a 1 (strongly disagree) to 5 (strongly
agree) scale for use with elementary/primary school students (see Martin, 2009).Definitions of the MES subscales and sample items of the MES-HS (i.e., High
School version of the MES) are presented in Table 1. The MES comprises a suiteof corresponding instruments that aim to assess motivation and engagement in
diverse applied settings including elementary school, high school, university/
college, sport, music, and work. Its applications across these domains are on the basis that core motivation and engagement factors relevant to human performance
in these various settings are congruent (Martin, 2007, 2009).
CFA AND SEM IN PRACTICE: THEIR ROLE IN ADDRESSING APPLIED ANDSUBSTANTIVE ISSUES IN MOTIVATION AND ENGAGEMENT
As elucidated above, to illustrate the use of CFA and SEM in educational psychology, we draw on a program of research underpinned by the Motivation and
Engagement Wheel and, more specifically, based on various analyses of responses
to the MES. Aligned with the construct validation approach to research, the
illustrative cases reviewed in the present chapter are divided into two sections. Wefirst report on studies pertinent to the within-network framework of construct
validation, that is, those that employed various applications of CFA. We thenreport on studies relevant to the between-network framework of construct
validation, that is, those that harnessed distinct applications of SEM.i
CFA in Practice
First- and higher-order confirmatory factor analysis. One of the more basic
applications of CFA is to assess the factor structure of a multidimensional
instrument. Researchers can assess first-order factor structures or higher-order
factor structures. An example of a first-order factor is where factors are developed
from items in a survey. Thus, in the case of the MES, four self-efficacy items
‘load’ onto a factor that is declared a self-efficacy (latent) factor. The same
operation is formed for each of the four items for each of the other ten scales in the
MES to form a total of 11 latent factors (see Figure 4a).
Researchers may also examine higher-order structures where the first-order
factors are collected together as indicators to form a ‘higher’ factor. Thus, a higher-
order factor structure would comprise survey items that load onto a number of
first-order factors and these first-order factors in turn load onto a higher-order

8/18/2019 (Contemporary Approaches to Research
http://slidepdf.com/reader/full/contemporary-approaches-to-research 193/284
LATENT VARIABLE MODELING IN EDUCATIONAL PSYCHOLOGY
195
factor. In the case of the MES, for example, 12 items form three first-order factors
– self-efficacy, valuing school, and mastery orientation – and these three factors in
turn load onto a higher-order factor referred to as ‘adaptive cognition’ (see Figure4b).
For example, using LISREL 8.54 (Jöreskog & Sörbom, 2003), Martin (2007)
performed first-order and higher-order CFAs of 12,237 students’ responses to the
MES-HS. The results showed an excellent fit of the data to the first-order model (see
Figure 4a; χ 2 = 15,737.26, df = 847, NNFI = .98, CFI = .98, RMSEA = .038) as
well as to the higher-order model (see Figure 4b; χ 2 = 20,280.91, df = 886, NNFI =.97, CFI = .98, RMSEA = .042). In these analyses, all first- and higher-order factor
loadings were significant and substantial (means of factor loadings > .66). Inter-factor correlations were consistent with the directions predicted by the theories
underlying the constructs. That is, all the adaptive factors were significantly
positively correlated with one another and these factors were markedly negativelycorrelated with the maladaptive factors and non-significantly correlated with the
impeding factors. Moreover, as reflected in a change of CFI<.01 (Cheung &
Rensvold, 2002), a series of multigroup CFAs of the first-order model confirmed
the invariance of key measurement parameters (factor loadings, factor correlations,
and item uniquenesses) over gender and also across junior, middle, and senior highschools. Taken together, these first- and higher-order CFAs showed that the MES-
HS is a psychometrically sound instrument and that the Wheel is a conceptually
and theoretically sound framework to measure and understand an integrative set of
first- and higher-order motivation and engagement dimensions important to studentacademic development.
Specificity of motivation and engagement across academic subjects. Anotherexample of CFA application is derived from a study that sought to evaluate the
relative domain specificity of student motivation and engagement in different
academic subjects (Green, Martin, & Marsh, 2007). The study was initiated by theobservation that the majority of extant research has either examined student
motivation and engagement in a general academic domain or focused on only asingle academic subject. In this context, the study aimed to examine the extent to
which student motivation and engagement are multidimensional – as posited in the
Wheel – and further distinguished across English, mathematics, and science. To
address this, Green and colleagues administered the MES-HS to 1,801 high schoolstudents (33% female; mean age = 14.40 years, SD = 1.40) who rated their
motivation and engagement in mathematics and another academic area (English or
science). Green and her colleagues focused on testing three CFA modelshypothesized to reflect construct and domain specificity, domain generality, and
construct generality, respectively, of the motivation and engagement dimensions in
the Wheel (see Figure 3). The first model, a domain and construct specific model
(Figure 3a), is a 33-factor model in which the 11 motivation and engagement first-
order facets in each of the three subjects were estimated (e.g., English self-efficacy, mathematics self-efficacy, science self-efficacy, etc.). The second model,
a domain general model (Figure 3b), is an 11-factor model, whereby English,

8/18/2019 (Contemporary Approaches to Research
http://slidepdf.com/reader/full/contemporary-approaches-to-research 194/284

8/18/2019 (Contemporary Approaches to Research
http://slidepdf.com/reader/full/contemporary-approaches-to-research 195/284
LATENT VARIABLE MODELING IN EDUCATIONAL PSYCHOLOGY
197
English
S. Efficacy
English
Mastery Orient.
English
Valuing
English
Persistence
English
Planning
English
Task Manage.
English
Anxiety
English
Failure Avoid.
English
Uncertain Control
English
Disengagement
English
S. Handicapping
Mathematics
Disengagement
Mathematics
S. Handicapping
Science
Disengagement
Science
S. Handicapping
Fig. 3a 33-Factor Model
(Domain and Construct Specific)
English, Math, & Science
Self-Efficacy
English, Math, & Science
Mastery Orientation
English, Math, & Science
Valuing
English, Math, & Science
Persistence
English, Math, & Science
Planning
English, Math, & Science
Task Management
English, Math, & Science
Anxiety
English, Math, & Science
Failure Avoid.
English, Math, & Science
Uncertain Control
English, Math, & Science
Disengagement
English, Math, & Science
Self-Handicapping
English
Motivation &
Engagement
Math
Motivation &
Engagement
Science
Motivation &
Engagement
Fig. 3b 11-Factor Model
(Domain General)
Fig. 3c Three-Factor Model
(Construct General)
Mathematics
S. Efficacy
MathematicsMastery Orient.
Science
S. Efficacy
Science
Mastery Orient.
Figure 3. Hypothesized confirmatory factor analysis (CFA) models reflecting domain andconstruct specificity, domain generality, and construct generality of English, mathematics,
and science motivation and engagement (adapted with permission from Green, Martin, & Marsh, 2007). Note: For clarity purposes, manifest indicators (items) and their
corresponding error terms are not shown.

8/18/2019 (Contemporary Approaches to Research
http://slidepdf.com/reader/full/contemporary-approaches-to-research 196/284
LIEM AND MARTIN
198
A developmental construct validity approach to motivation and engagement. The
second example of CFA application focuses on the assessment of the construct
validity of student motivation and engagement across elementary, high school, anduniversity/college samples. The rationale underpinning this research is that
students of different educational levels share a great deal of commonalities
in their efforts to sustain their academic motivation and engage in their academic
learning over the course of their education. To this end, Martin (2009)
administered the MES-Junior School (MES-JS) to 624 upper-age elementary
students (56% female, mean age = 11.13, SD = 0.69) and the MES-University/College (MES-UC) to 420 undergraduate students (80% female, mean
age = 21.47, SD = 6.62). For the high school sample, an archived databasecomprising responses to the MES-HS of 21,579 high school students (around 45%
female; mean age = 14.52, SD = 1.57) was used. Consistent with the more widely
used MES-HS, the MES-JS and MES-UC each comprises 44 items and measuresthe same number of first-order (11) and higher-order (4) factors (see Liem &
Martin, 2012). Item adaptation was done to make simple and transparent word and
terminology changes in order to remain very parallel to the high school form.Conducting CFA using LISREL 8.80 (Jöreskog & Sörbom, 2006), Martin
examined both first-order and higher-order factor structures of the MES separately
for each sample (Figure 4). For the 11-first-order-factor model (Figure 4a), theCFA yielded a very good fit to the data for elementary school ( χ 2 = 1,881.10, df =
847, CFI =.98, NNFI = .97, RMSEA = .04), high school ( χ 2 = 28,217.75, df = 847,
CFI =.98, NNFI = .98, RMSEA = .04), and university ( χ 2 = 1,697.75, df = 847, CFI=.96, NNFI = .95, RMSEA = .05) samples and all the items were significant
indicators of their respective a priori latent factors with the majority of item factorloadings above .60. In addition, the higher-order factor structure (Figure 4b), inwhich correlations between first-order factors were constrained to be zero and their
relationships were explained in terms of higher-order factors, also yielded a very
good fit for elementary school ( χ 2 = 2,155.87, df = 886, CFI =.97, NNFI = .97,
RMSEA = .05), high school ( χ 2 = 36,732.07, df = 886, CFI =.98, NNFI = .98,
RMSEA = .04), and university ( χ 2 = 1,968.82, df = 886, CFI =.95, NNFI = .94,RMSEA = .05) samples.
To assess the invariance of key measurement parameters, Martin (2009)
conducted a series of multigroup CFAs assessing the MES factor structures acrossthe distinct groups within each sample (male and female students; younger and
older students) and between samples (elementary, high school, and university
students). Multigroup CFA essentially involves comparison of a number of models
in which measurement parameters (i.e., first-order and higher-order factorloadings, first-order or higher-order factor correlations, uniquenesses) are
systematically held invariant across groups and assessment of changes in fit indicesrelative to a baseline model that allows all the measurement parameters to differ
across groups.

8/18/2019 (Contemporary Approaches to Research
http://slidepdf.com/reader/full/contemporary-approaches-to-research 197/284
LATENT VARIABLE MODELING IN EDUCATIONAL PSYCHOLOGY
199
Self-Efficacy
Mastery
Orientation
Valuing
Persistence
Planning
Task
Management
Anxiety
Failure
Avoidance
Uncertain
Control
Disengagement
Self-Handicapping
Adaptive
Cognition
Self-
Efficacy
Mastery
Orientation
Valuing
Maladaptive
Behavior
Disengagement
Self-
Handicapping
Adaptive
Behavior
Persistence
Planning
Task
Management
Impeding
Cognition
Anxiety
Failure
Avoidance
Uncertain
Control
Fig. 4a First-Order Factor Structure of
Motivation and EngagementFig. 4b Higher-Order Factors Structure of
Motivation and Engagement
Figure 4. First-order and higher-order hypothesized CFA models of motivation and
engagement (adapted with permission from Martin, 2009). Note: For clarity purposes,manifest indicators (items) and their corresponding error terms are not shown.
Based on the application of recommended criteria for evidence of lack ofinvariance (i.e., a change of <.01 in CFI, see Cheung & Rensvold, 2002; a changeof <.015 in RMSEA, see Chen, 2007), findings indicated the presence of the
invariance of measurement parameters across groups within each sample and
across samples. It is also important to note that evidence for between-groupinvariance in measurement parameters (factor correlations, uniquenesses, and
especially factor loadings) is a basic prerequisite in conducting valid comparison of
means between groups (Marsh, 1993) in that observed mean differences, if any,

8/18/2019 (Contemporary Approaches to Research
http://slidepdf.com/reader/full/contemporary-approaches-to-research 198/284
LIEM AND MARTIN
200
can be regarded ‘trustworthy’ as measurement properties between groups are
equivalent.
To assess mean difference within the context of CFA, Kaplan (2000) suggested
a multiple-indicators multiple-causes (MIMIC) approach, which is similar to a
regression model in which, in the present study, latent factors of motivation andengagement were “caused” by discrete grouping variables (e.g., gender) each
represented by a single indicator. Given the presence of multinominal predictors,
high school students were used as the reference group and two dummy variables
were created: high school (0) versus elementary school (1) and high school (0)versus university (1); hence, positive beta weights for dummy variables would
indicate higher scores for elementary school and university students relative tohigh school students, and vice versa. MIMIC modeling of the first-order model
showed a good fit to the data ( χ 2 = 39,347.85, df = 914, CFI =.95, NNFI = .94,
RMSEA = .04), as did the higher-order model ( χ 2 =45,508.66, df = 966, CFI =.95,
NNFI = .94, RMSEA = .05). Specifically, findings showed that, relative to high
school students, elementary and university students were significantly higher onadaptive cognition ( β = .45 and β = .36, respectively) and adaptive behaviour ( β =
.35 and β = .36, respectively) but were significantly lower on impeding cognition
( β = -.47 and β = -.24, respectively) and maladaptive behaviour ( β = -.49 and β =
-.24, respectively). A general similar pattern was also observed with the first-ordermotivation and engagement factors. Taken all together, Martin (2009) provided
evidence that academic motivation and engagement of elementary, high school,
and university students can be analogously represented by both first-order andhigher-order models in the Wheel. It was further concluded that measurement of
these motivation and engagement factors can be conducted equivalently across thethree educational levels. This evidence, in turn, warrants the comparison of the
degree of motivation and engagement factors amongst students from differentdevelopmental stages or educational levels.
Multilevel confirmatory factor analysis. An emerging line of research,
representing a contextualist perspective, focuses on understanding the role ofcontext, and how this context interplays with student motivation and engagement,
in predicting key educational outcomes (see e.g., Lüdtke, Robitzsch, Trautwein, &
Kunter, 2009; Marsh, Lüdtke, Robitzsch, Trautwein, Asparouhov, Muthen, & Nagengast, 2009; Miller & Murdock, 2007). It is now widely recognized, however,
that the same construct (e.g., self-efficacy) and its associations with other
constructs, but measured at different units or levels of analysis (e.g., student level
vs. school level), may lead to fundamentally different interpretations. Furthermore,a student-level factor structure might not be replicated at the upper (e.g., class,
school) levels (Klein & Kozlowski, 2000; Marsh, Martin, & Cheng, 2008; Van de
gaer, Grisay, Schulz, & Gebhardt, 2012). That is, measures with good
psychometric properties at the individual level may not be satisfactory at the classor school level. It is therefore important to establish the psychometric evidence of
context-level measures at the upper levels before assessing their role as contextual
predictors of student-level outcomes.

8/18/2019 (Contemporary Approaches to Research
http://slidepdf.com/reader/full/contemporary-approaches-to-research 199/284
LATENT VARIABLE MODELING IN EDUCATIONAL PSYCHOLOGY
201
Given this, Martin, Malmberg, and Liem (2010) conducted a series of
multilevel CFAs using Mplus (Muthén & Muthén, 1998-2010) and provided
evidence for various multilevel factor structures of the MES-HS based onresponses of over 21,000 students in 58 schools. As shown in Figure 5, Martin and
colleagues tested various multilevel CFA models including a one-factor model in
which a first-order motivation/engagement factor (e.g., self-efficacy) was
represented by a latent factor defined by its four a priori items (Figure 5a); a three-
factor model in which three first-order motivation/engagement factors (e.g., self-
efficacy, mastery orientation, valuing) that belong to the same higher-orderdimension (or two-factor model for maladaptive behaviour) were each represented
by a latent factor defined by two parcels of two randomly selected items (Figure5b); one-factor higher-order model in which three first-order (or two first-order
factors for maladaptive behaviour) motivation/engagement factors that belong to
the same higher-order dimension (e.g., self-efficacy, mastery orientation, valuing)constitute the first-order latent factors defining their a priori higher-order latent
factor (i.e., adaptive cognition; Figure 5c); and a four-factor cluster model in which
the four higher-order motivation/engagement dimensions were simultaneouslyestimated and that each dimension was defined by the scale scores of their a priori
first-order motivation/engagement factors (Figure 5d). Their findings demonstrated
that, at student and school levels, the various CFA models tested evinced soundfactor structure and good model fit. Further, the results showed that factor
correlations were in the hypothesized directions and broadly parallel at the student
and school levels. Taking these findings together, the study suggests that thedifferent ways of conceptualizing the multidimensionality of motivation and
engagement are viable at both student and school levels and that the MES-HStarget factors and the framework from which they emanate (the Motivation and
Engagement Wheel) demonstrates sound multilevel psychometric properties. Thisevidence is a basis for future research to use school-level MES motivation and
engagement factors as contextual predictors of student-level motivation and
engagement as well as other educational outcome factors (e.g., academic
performance).
SEM in Practice
Longitudinal mediated model of academic buoyancy. The first example of SEM
application draws from a study on academic buoyancy (Martin & Marsh, 2006,2008) conceptualized as students’ capacity to successfully deal with setbacks and
challenges that are typical of everyday academic life (e.g., receiving poor grades,negative feedback). Prior research has indicated the predictive role of academic
buoyancy in enjoyment of school, class participation, general self-esteem (Martin
& Marsh, 2006) and also in absenteeism (negatively), task completion, and
educational aspiration (Martin & Marsh, 2008). This prior work has also identified
the ‘5Cs’ of academic buoyancy, including confidence (high self-efficacy),
coordination (high planning), commitment (high persistence), composure (low

8/18/2019 (Contemporary Approaches to Research
http://slidepdf.com/reader/full/contemporary-approaches-to-research 200/284
LIEM AND MARTIN
202
Figure 5. Various multilevel confirmatory factor analysis (CFA) models of motivation andengagement (adapted with permission from Martin, Malmberg, & Liem, 2010). Note: For
clarity purposes, error terms of manifest indicators are not shown

8/18/2019 (Contemporary Approaches to Research
http://slidepdf.com/reader/full/contemporary-approaches-to-research 201/284
LATENT VARIABLE MODELING IN EDUCATIONAL PSYCHOLOGY
203
Figure 6. Hypothesized fully-forward structural equation model predicting Time2academic buoyancy (adapted with permission from Martin, Colmar, Davey, & Marsh,
2010). Note: Dotted arrow represents auto-regressive path. For clarity purposes,manifest indicators (items) and their corresponding error terms are not shown
anxiety), and control (low uncertain control), as key motivational factors closelyassociated with academic buoyancy (Martin & Marsh, 2006). Building upon this
research, Martin, Colmar, Davey, and Marsh (2010) examined the salience of the
5Cs in mediating prior and subsequent academic buoyancy (see Figure 6) by
implementing a longitudinal research design in which academic buoyancy wasassessed at two points in time (MacCallum & Austin, 2000; Martin, 2011; Menard,
1991; Rosel & Plewis, 2008). A key procedure for modeling longitudinal data is
through autoregressive paths (MacCallum & Austin, 2000; Martin, 2011; Rosel &Plewis, 2008) which link variables measured at Time 1 with corresponding
variables measured at Time 2. Hence, the effect of any remaining constructs on the
Time 2 construct is viewed as beyond or ‘over and above’ that of the Time 1
construct. As seen in Figure 6, the key autoregressive path in this model was onethat linked students’ academic buoyancy with their academic buoyancy one year
later. There were two major advantages for testing the hypothesized fully-forward
model shown in Figure 6. First, the model allowed examining the effects of the

8/18/2019 (Contemporary Approaches to Research
http://slidepdf.com/reader/full/contemporary-approaches-to-research 202/284
LIEM AND MARTIN
204
5Cs on Time 2 academic buoyancy after taking into account its variance shared
with Time 1 buoyancy. Second, the ordering of factors in the model also enabled
assessing the direct and indirect effects (mediated via the 5Cs) of prior academic buoyancy on subsequent academic buoyancy.
Martin and his colleagues (2010) tested the theoretically grounded model in
Figure 6 with a sample of 1,866 high school students (39% female) from six
Australian high schools completing the instrumentation at T1 (3rd term of the
school year) and T2 (one year later). Approximately 29% of the respondents were
in grade 7 (the beginning of high school) at T1 and grade 8 at T2; 24% were ingrade 8 at T1 and grade 9 at T2; 23% were in grade 9 at T1 and grade 10 at T2;
18% were in grade 10 at T1 and grade 11 at T2, and 6% were in grade 11 at T1 andgrade 12 (the final year of high school) at T2. The mean age of respondents was
13.86 years (SD = 1.28) at T1 and 14.79 years (SD = 1.28) at T2. Academic
buoyancy was measured with the 4-item Academic Buoyancy Scale (ABS; Martin& Marsh, 2006, 2008; e.g., I think I am good at dealing with schoolwork pressures;
I don't let a bad mark affect my confidence). Each of the 5Cs was measured by the
self-efficacy, planning, persistence, anxiety, and uncertain control subscales of theMES-HS. Preliminary CFA conducted to assess the fit of the data to measurement
models of the psycho-educational and socio-demographic factors in the
hypothesized model (T1 and T2 buoyancy, the 5C components, gender, age)yielded an excellent fit to the data ( χ 2 = 1,831.88, df = 367, CFI =.97, NNFI = .98,
RMSEA = .05). A series of multigroup CFAs further showed that key
measurement parameters (i.e., factor loadings, factor correlations, and itemuniquenesses) were invariant across gender and age groups (as reflected by
∆CFIs<.01 between a baseline model that allowed all parameters to be different between groups and models that systematically constrained one, or more, set of parameters to be equivalent across groups; Cheung & Rensvold, 2002). This result
justified pooling these sub-groups and analysing the whole sample as a single
group. Having shown these preliminary results, the main SEM demonstrated thatthe hypothesized model fitted the data well ( χ 2 = 1,831.87, df = 367, CFI =.97,
NNFI = .98, RMSEA = .05). Of central relevance to the hypotheses, findingsshowed that after controlling for the effect of Time 1 academic buoyancy ( β = .21,
p<.001) and also those of gender and age, the 5Cs significantly predicted Time 2
academic buoyancy: self-efficacy ( β = .22, p<.001), planning ( β = .16, p<.001), persistence ( β = .08, p<.05), anxiety ( β = -.59, p<.001), and uncertain control ( β =
-.27, p<.001). Findings also showed that, alongside the direct effect of Time 1
academic buoyancy on Time 2 academic buoyancy, the effect of Time 1 academic
buoyancy was partially mediated by the 5Cs – this was reflected in the decrease ofits direct effect, which was initially β = .57 ( p<.001), to be β = .21 ( p<.001) after
the inclusion of the 5Cs as mediators. Finally, the analysis also sought to assess ifthe central regression weights in the model (e.g., the predictive path between self-
efficacy and Time 2 academic buoyancy) were equivalent across gender and age
groups. Multigroup SEM indicated that the model that constrained regression paths( β s) to be equivalent across groups did not yield a significantly poorer fit
(∆CFI<.01) than the model that allowed these paths to differ across groups,

8/18/2019 (Contemporary Approaches to Research
http://slidepdf.com/reader/full/contemporary-approaches-to-research 203/284
LATENT VARIABLE MODELING IN EDUCATIONAL PSYCHOLOGY
205
suggesting that the predictive relationships between the central constructs in the
model were not substantially different across gender and age groups. Collectively,
these findings suggest that a psycho-educational intervention aimed at fosteringstudents’ academic buoyancy would do well when it addresses each of the 5C
components and, further, such an intervention may well be effective when
simultaneously implemented across the different socio-demographic sub-groups
(boys and girls; younger and older adolescents).
Self-system model of engagement and disaffection. The second SEM example isderived from a recent large-scale longitudinal study (Green, Liem, Martin, Colmar,
Marsh, & McInerney, 2012) that sought to test the self-system model of schoolengagement and disaffection (Skinner, Furrer, Marchand, & Kindermann, 2008;
Skinner, Kindermann, Connell, & Wellborn, 2009; see Figure 7). The model posits
dynamic relations between individuals’ experience of context, self,engagement/disaffection, and outcomes. The notion of self is viewed as
individuals’ self-appraisals about their ability and task/activity (e.g., self-beliefs,
subjective task values) developed through continuous socialization in anachievement context. Thus, the self in the model closely relates to the various
motivational dimensions in the Wheel (Martin, 2007, 2009). The self-system
model also posits that these self-appraisals lead to emotional or affectiveengagement (or disaffection) which in turn leads to behavioural engagement (or
disaffection). It follows that these patterns of activity (or inactivity) potentially
impact contextually-relevant outcomes including achievement and skillacquisitions. Skinner and her colleagues (2008, 2009) regard engagement (or
disaffection) as the central component that reflects the manifestation of motivationand self-related beliefs on the one hand and affects outcomes on the other. As
reflected in the model, they assert that engagement (a) directly predicts learningoutcomes, (b) mediates the effects of ‘self’ on immediate outcomes, and (c) leads
to subsequent changes in ‘self’, engagement, and outcomes. Effects of each
component in the self-system model on its corresponding component over time
(feed-forward effects) form a cycle that represents a continuous process ofstudents’ motivated engagement with their academic tasks/activities. This cycle
explains why students who begin school academically engaged become more so,
whereas students who start out academically disaffected become gradually more so
as they progress through school (Skinner et al., 2009).Of particular importance, the self-system model recognizes that each component
of the model is multidimensional and, thus, this is the basis for Green and
colleagues (2012) to establish and test a model comprising a comprehensive rangeof psycho-educational factors depicted in Figure 7. Specifically, the study
conceptualized ‘self’ through academic motivation and self-concept; ‘engagement’
through its affective (positive attitudes toward school) and behavioural (class
participation, homework completion, absenteeism) dimensions; and ‘outcome’through test performance. In line with the self-system model (Skinner et al., 2008,

8/18/2019 (Contemporary Approaches to Research
http://slidepdf.com/reader/full/contemporary-approaches-to-research 204/284
LIEM AND MARTIN
206
Figure 7. Hypothesized longitudinal structural equation model assessing the predictiverelationships of academic motivation and self-concept, engagement, and achievement
(adapted with permission from Green, Liem, Martin, Colmar, Marsh, & McInerney, 2012).
Note: Motivation and attitudes toward school are higher-order factors. For clarity
purposes, manifest indicators and their corresponding error terms are not shown
2009), comprehensive reviews of the literature provided support for therelationships of self, engagement, and outcome factors examined in the study. The
hypothesized model was tested with the longitudinal sample in the academic
buoyancy study described earlier (Martin et al., 2010). The motivationaldimensions were measured by the MES-HS and academic self-concept by the Self-
Description Questionnaire-Short (SDQ-S, Marsh, 1992; e.g., “I am good at most
school subjects”). Two four-item scales , positive school appraisals (“I likeschool”) and positive academic intentions (“I am happy to stay and complete
school”), were used to measure students’ positive attitudes toward school.
Homework completion (“How often do you do and complete your homework andassignments?”) was assessed on a 1 (never) to 5 (always) scale. Class participation
was assessed by four items (e.g., “I get involved in things we do in class”) and
absenteeism (“How many days were you absent from school last term?”) askedstudents to specify approximate days absent from school in the previous term.
Responses to the absenteeism item were later coded on a scale of 1 (0 days absent)
to 6 (5 or more weeks absent). The three psychometric scales of positive school
appraisal, positive academic intentions, and class participation were adapted from
Martin (2007, 2009) and were rated on a 1 (strongly disagree’) to 7 (stronglyagree) scale. Homework completion and absenteeism are single-item measures.
Preliminary analysis was focused on assessing the within-construct validity of
the key psycho-educational factors in the model. This involved a CFA, performed

8/18/2019 (Contemporary Approaches to Research
http://slidepdf.com/reader/full/contemporary-approaches-to-research 205/284
LATENT VARIABLE MODELING IN EDUCATIONAL PSYCHOLOGY
207
with LISREL 8.80 (Jöreskog & Sörbom, 2006), of a longitudinal measurement
model comprising 18 factors (9 factors for each time wave): four higher-order
factors (adaptive, impeding, and maladaptive motivation and attitudes towardschool) and five first-order factors (self-concept, class participation, homework
completion, absenteeism, and test performance). This measurement model fitted
the data well ( χ ² = 36,974.70, df = 7,922, CFI = .96, NNFI = .96, RMSEA = .06).
All factor loadings were significant at p<.001 and substantial (>.69). Further,
multi-group CFAs demonstrated gender and year-level (junior, middle, senior high
school) measurement invariance of the longitudinal CFA (∆CFIs< .01), providing justification for conducting whole-sample analyses. SEM performed with the
model in Figure 7 yielded an excellent fit to the data ( χ ² = 23,991.29, df = 7,876,CFI=.98, NNFI=.98, RMSEA=.04). All the hypothesized paths were significant in
the predicted directions (positive or negative). The results also indicated
congruence of predictive paths across the two time waves, demonstrating thestability of the hypothesized model over time. That is, all Time 2 paths remained
significant even after controlling for shared variance with the parallel Time 1
factors. For example, whilst adaptive motivation and academic self-concept were positive predictors of attitudes toward school both at Time 1 ( β = .30 and β = .28,
respectively, p<.001), maladaptive motivation negatively predicted this affective
engagement at both Time 1 ( β = -.47, p<.001) and Time 2 ( β = -.41, p<.001).Attitudes toward school positively predicted class participation and homework
completion at both Time 1 ( β = .60 and β = .53, respectively, p<.001) and Time 2
( β = .48 and β = .29, respectively, p<.001), and negatively predicted absenteeism at both Time 1 ( β = -.18, p<.001) and Time 2 ( β = -.21, p<.001). Findings also
showed that whilst class participation and homework completion positively predicted test performance at both Time 1 ( β = .07, p<.05 and β = .24, p<.001,
respectively) and Time 2 ( β = .05, p<.05 and β = .07, p<.001, respectively),absenteeism negatively predicted test performance at both Time 1 ( β = -.14,
p<.001) and Time 2 ( β = -.09, p<.001). Furthermore, Time 1 factors positively
predicted their parallel Time 2 factors (test-retest or autoregressive paths),
supporting the posited long-term effects of the key factors in the model that lead toeither a virtuous or vicious cycle (Skinner et al., 2009). As asserted by Martin
(2011), longitudinal SEM analyses may effectively provide a basis for proposing
prescriptive statements on educational practices, especially given the temporal
ordering of factors in the longitudinal models tested. This being the case, thelongitudinal self-system model demonstrated here holds important implications in
that an educational intervention that seeks to promote students’ academic
motivation and self-concept is potentially effective in promoting students’engagement and achievement and these effects are likely to be sustained over time.
Exploratory structural equation modeling. It is now recognized that measures
of multidimensional constructs often fall short in meeting the standards of good
measurement when responses to their items are subjected to CFA. This is reflected,
for example, in poor fit indices, lack of between-group measurement invariance,

8/18/2019 (Contemporary Approaches to Research
http://slidepdf.com/reader/full/contemporary-approaches-to-research 206/284
LIEM AND MARTIN
208
Figure 8. Confirmatory factor analysis (CFA) model and its corresponding exploratory
structural equation model (ESEM): A three-factor example (adapted with permission from Marsh, Liem, Martin, Nagengast, & Morin, 2010). Note: For clarity purposes, error terms
of manifest variables (items) are not shown

8/18/2019 (Contemporary Approaches to Research
http://slidepdf.com/reader/full/contemporary-approaches-to-research 207/284
LATENT VARIABLE MODELING IN EDUCATIONAL PSYCHOLOGY
209
and highly correlated latent factors that could potentially lead to seriousmulticollinearity and suppression effects such that the effects of the individual
factors in predicting outcome measures are distorted in regression or SEM
analyses. Although the MES-HS evinced robust psychometric properties (i.e.,sound CFA factor structure, substantial factor loadings, excellent model fit) and
sufficient evidence for the multidimensionality and distinctiveness of the
motivation and engagement factors in the Wheel, the correlations amongst MESfactors based on CFA solutions were relatively high (see e.g., Martin, 2007, 2009).
Marsh and his colleagues (2010) asserted that part of the problem lies in the overly
restrictive independent cluster models of CFA (ICM-CFA) in which items are
required to load on one, and only one, latent factor, with non-target loadingsconstrained to be zero (see e.g., measurement components in Figure 1). Theapplication of exploratory structural equation modeling or ESEM – an integration
of CFA and SEM – is proposed to resolve this methodological issue in that in
ESEM items are allowed to load on different latent factors specified in the
measurement model. Further, the ESEM framework has a range of advantagesinherent in the typical CFA/SEM including, for example, access to standard errors,
goodness of fit, comparisons of competing models, assessment of between-group
measurement invariance, and inclusion of correlated uniquenesses (Marsh et al.,2010).
Given the methodological benefits of ESEM, Marsh, Liem, Martin, Nagengast,and Morin (2011) adopted this technique to analyse responses to the MES-HS of
7,420 high school students and juxtaposed the results with those of CFA (see
Figure 8 for comparison between CFA and ESEM models). The analyses,
conducted using Mplus (Muthén & Muthén, 1998-2010), showed that although allthe factor loadings were significant and substantial in both ESEM and CFA
solutions, the 11-first-order factor in ESEM (CFI = .977, NNFI = .958, RMSEA =
.025) suggested an overall better fit than its CFA counterpart (CFI = .935, NNFI =
.928, RMSEA = .033). Further, the CFA factor correlations, ranging between r =
-.70 and r = .70 (|M| = .40, SD = .22) tended to be systematically larger than the
ESEM factor correlations, ranging between r = -.33 and r = .38 (|M| = .17, SD =
.11). Thus, for example, the negative correlation between valuing anddisengagement was r = -.70 in the CFA solution but r = -.33 in the ESEM solution.
Importantly, ESEM also showed that the means of item loadings on their
respective a priori factors (i.e., target loadings) were more substantial than theirloadings on other factors (i.e., non-target loadings). Taken together, relative to
CFA, ESEM provided stronger evidence for the multidimensionality of motivation
and engagement constructs and the discriminant validity of the multiple factors inthe MES-HS that are particularly useful to obtain more accurate beta parameterswhen these factors are jointly used to predict outcomes (e.g., achievement).
Further, ESEM has also been evidently useful in showing acceptable fit indices of
a big-five personality instrument which would typically fit poorly to the data
within the CFA framework (Marsh et al., 2010). Beyond the use of ESEM toassess internal structure of a measure (Marsh et al., 2010, 2011), this technique can

8/18/2019 (Contemporary Approaches to Research
http://slidepdf.com/reader/full/contemporary-approaches-to-research 208/284
LIEM AND MARTIN
210
also be applied to examine structural relationships amongst latent factors to address
substantive issues in educational psychology (see e.g., Marsh, Nagengast, Morin,
Parada, Craven, & Hamilton, 2011, for the use of ESEM in bullying and
victimization issues). ESEM appears to be a promising technique that educational
psychology researcher can effectively harness to address the complex relationshipsof psycho-educational factors in their research.
METHODOLOGICAL ADVANCEMENTS AND FUTUREMODELLING POSSIBILITIES
The studies described above have illustrated some of the fundamental applications
of CFA and SEM in addressing applied and substantive issues in motivation and
engagement. There are, however, some recent notable methodologicaldevelopments in latent variable modeling that offer important avenues for
educational and psychological researchers in advancing interpretations of their
data, proposing sounder and more compelling implications of their findings, and
solidifying contributions of their research to the educational and psychology
literature. In this section we highlight four of these major advanced techniques(i.e., composite-score latent modeling, cross-lagged latent modeling, latent variable
interaction, and latent growth modeling) that are potentially important in advancing
our understanding of student motivation and engagement.
Composite-score latent modeling . Latent variable modeling is known as a
quantitative technique that requires a large sample size, with the recommendedratio of the number of parameters estimated and the number of cases that is at least
1:5 to obtain stability of estimated parameters (Iocobucci, 2010). In manyinstances, however, researchers are potentially limited by their relatively small
sample size. For example, based on a sample of 249 high school students, Liem,
Ginns, Martin, Stone, and Herrett (2012) tested a relatively complex model that
assessed the effects of academic personal best (PB) goals – target performancestandards that match or exceed a student’s previous best – on various academic
(deep learning, academic buoyancy, and academic flow) and social (positive
teacher relationships and attitudes toward peer cooperation) outcomes at two time points. Given the 66 manifest variables involved the hypothesized model, the
number of parameters to be estimated in their study can be up to 2,211. To redressthis methodological problem, Liem and his colleagues (2012) employed
composite-score latent modeling (Holmes-Smith & Rowe, 1994; Rowe & Hill,
1998). This technique markedly reduced the number of parameters because, ratherthan being predicted by its a priori manifest indicators, each latent factor in their
model was defined by a weighted composite score derived from a confirmatory,
one-factor, congeneric model (performed with a syntax provided by Raykov,2009). Proportional factor score regression weights (κ ) generated from a
congeneric model solution were then used to modify the weight of each item
before a composite score was calculated. Moreover, the number of parameters incomposite-score latent modeling was further reduced as the factor loading (λ ) and

8/18/2019 (Contemporary Approaches to Research
http://slidepdf.com/reader/full/contemporary-approaches-to-research 209/284
LATENT VARIABLE MODELING IN EDUCATIONAL PSYCHOLOGY
211
measurement error variance (θ) of each latent variable in the model were fixed
with the values calculated using the weighted composite score reliability (ρ or rm -
maximized reliability) of the corresponding factor. Whilst researchers dealing with
such a situation would typically rely on a path analytic technique that does not
purge constructs of measurement errors and disregards individual item or manifestvariable contributions to their factor’s composite score, Liem and colleagues
(2012, p. 229) concluded that composite-score latent modeling (Holmes-Smith &
Rowe, 1994) is “methodologically more robust and consistent with the essence of
latent modeling as it takes into account item unreliability and unique (unequal)contributions to the composite score of the target factor, and hence, generates more
accurate parameter estimates that are vital in understanding the effects of the key predictors of interest (e.g., PB goals) on a diverse range of outcomes.” Composite
score latent modeling is thus another application that can be useful under certain
circumstances.
Latent factor interactions. We also note various research designs in which latent
variable modeling as a quantitative technique offers methodological benefits inmaking sense of substantive data and advancing understanding of student
motivation and engagement. One of these is pertinent to tests of interaction effects
which have rarely been carried out in the context of latent variable modeling(Tomarken & Waller, 2005). This is surprising given that many theoretical models
in educational psychology (e.g., aptitude-treatment interaction, Cronbach & Snow,
1977; expectancy-value model, Wigfield & Eccles, 2000) explicitly posit the role
of interaction effects in educational outcomes. Recent methodologicaladvancement allows researchers to assess the effects of interaction of latent factors
on outcomes (see e.g., Nagengast, Marsh, Scales, Xu, Hau, & Trautwein, 2011).
With measurement errors controlled, interactions of latent factors are expected to
show more reliable and larger effects which are otherwise small and not easilydetectable (Marsh, Hau, Wen, Nagengast, & Morin, in press).
Causal ordering. The classic cross-lagged panel analysis (Crano, Kenny, &Campbell, 1972) is viewed to be a crucial framework that sheds light on the
relative salience of motivation and engagement in predicting subsequent
achievement, and vice versa. In the context of latent variable modeling, motivation
and achievement can be represented by latent factors that purge unreliability of
measurement such that more accurate predictive paths between motivation,
engagement, and achievement can be obtained. Liem, Martin, and Marsh (2011),for example, conducted a series of cross-lagged analyses and found that Time 1
adaptive cognition, Time 1 adaptive behaviour, and Time 1 maladaptive behaviour
(negatively) showed a stronger pattern of predictive paths in predicting Time 2achievement than Time 1 achievement predicting each of these motivation and
engagement dimensions, pointing to the salience of motivation and engagement
dimensions over achievement. In relation to the sustained benefits of motivation

8/18/2019 (Contemporary Approaches to Research
http://slidepdf.com/reader/full/contemporary-approaches-to-research 210/284
LIEM AND MARTIN
212
and engagement over time, there is a need to assess the development of students’
motivation and engagement across their academic trajectory (see below).
Latent growth modeling. A powerful means to assess changes in motivation and
engagement over time is latent growth modeling (Curran & Hussong, 2003;
Tomarken & Waller, 2005) which is useful in, for example, developmental or time- based changes of students’ motivation and engagement through high school years
and how these changes relate to their achievement. Gottfried and colleagues
(2009), for instance, performed a conditional latent growth modeling to assess how parents’ motivational practices – measured when their children were at the age of 9
– were related to the children’s intrinsic motivation in maths and science at theages of 9, 10, 13, 16, and 17. The results showed that parents’ task-intrinsic
practices (i.e., parental encouragement of children’s pleasure and engagement inthe learning process) were beneficial for their children’s intrinsic motivation at age
9 and its decline through age 17, highlighting the importance for parents to employ
appropriate ways of motivating their children early.
CONCLUSION
The present chapter has presented a diverse range of research studies that illustrate
the flexibility and versatility of confirmatory factor analysis (CFA) and structural
equation modeling (SEM) as two major groups of latent variable modeling
techniques that can effectively be used to address substantive and applied issues in
motivation and engagement research. Alongside these more widely usedapplications, recent methodological developments (e.g., exploratory structural
equation modeling [ESEM], multilevel CFA and SEM) provide researchers
powerful tools to model the complexity of the relationships amongst the multitudeof factors relevant to educational outcomes. Further, assessing effects of latent
variable interactions, employing a cross-lagged panel design in the context of
latent variable modeling, and harnessing latent growth modeling to complementrepeated-measure design are promising areas in which latent variable modeling can
further contribute to the theorizing and research in educational psychology.
Aligned with the principle of methodological-substantive synergies (Marsh & Hau,
2007), educational psychology researchers are now in a stronger methodological
position in seeking to address important applied and policy issues that aim to
promote educational outcomes.
NOTE
i In evaluating the fit of the data to alternative models tested, a range of goodness-of-fit indices were
assessed. Following recommendations by Marsh, Hau, and Wen (2004), the Comparative Fit Index
(CFI), the Non-Normed Fit Index (NNFI), the Root Mean Square Error of Approximation
(RMSEA), the χ² test statistic, and an evaluation of parameter estimates were used in the present
chapter to assess model fit. The RMSEA index is less affected by sample size than the χ² test
statistic and values at or less than .08 and .05 are typically taken to reflect acceptable and excellent
fit, respectively (Marsh, Balla, & Hau, 1996; Yuan, 2005). The NNFI and CFI vary along a 0-to-1
8/18/2019 (Contemporary Approaches to Research
http://slidepdf.com/reader/full/contemporary-approaches-to-research 211/284
LATENT VARIABLE MODELING IN EDUCATIONAL PSYCHOLOGY
213
continuum in which values at or greater than .90 and .95 are typically taken to reflect acceptable and
excellent fit to the data, respectively (McDonald & Marsh, 1990). The CFI contains no penalty for alack of parsimony so that improved fit due to the introduction of additional parameters may reflect
capitalization on chance, whereas the NNFI and RMSEA contain penalties for a lack of parsimony
(Yuan, 2005).
REFERENCES
Atkinson, J. W. (1957). Motivational determinants of risk-taking. Psychological Review, 64, 359-372.
Bandura, A. (1997). Self-efficacy: The exercise of control. New York: Freeman & Co.
Beck, A. T. (1995). Cognitive therapy: Basics and beyond . New York: Guilford.
Breckler, S. J. (1990). Applications of covariance structure modeling in psychology: Cause for concern?
Psychological Bulletin, 107 , 260-273.Buss, D.W., & Cantor, N. (1989). Personality psychology: Recent trends and emerging directions. New
York: Springer-Verlag.
Byrne, B. M. (2012). Structural equation modeling with Mplus: Basic concepts, applications, and
programming . New York: Routledge.
Chen, F. F. (2007). Sensitivity of goodness of fit indices to lack of measurement invariance. Structural
Equation Modeling , 14, 464-504.
Cheung, G. W., & Rensvold, R. B. (2002). Evaluating goodness-of-fit indexes for testing measurement
invariance. Structural Equation Modeling , 9, 233-255.
Connell, J. P. (1985). A new multidimensional measure of children’s perceptions of control. Child
Development , 56 , 1018-1041.
Covington, M. V. (1992). Making the grade: A self-worth perspective on motivation and school reform.
Cambridge: Cambridge University Press.
Crano, W. D., Kenny, D. A., & Campbell, D. T. (1972). Does intelligence cause achievement?: A cross-
lagged panel analysis. Journal of Educational Psychology, 63, 258-275.
Cronbach, L. J., & Snow, R. E. (1977). Aptitudes and instructional methods. New York: Irvington.Curran, P. J., & Hussong, A. M. (2003). The use of latent trajectory models in psychopathology
research. Journal of Abnormal Psychology, 112, 526-544.
Digman, J. M. (1997). Higher-order factors of the big five. Journal of Personality and Social
Psychology, 73, 1246-1256.
Fredricks, J. A., Blumenfeld, P. C., & Paris, A. H. (2004). School engagement: Potential of the concept,
state of the evidence. Review of Educational Research, 74, 59-109.
Gottfried, A. E., Marcoulides, G. A., Gottfried, A. W., & Oliver, P. H. (2009). A latent curve model of
parental motivational practices and developmental decline in math and science academic intrinsic
motivation. Journal of Educational Psychology, 101, 729-739.
Green, J., Liem, G. A. D., Martin, A. J., Colmar, S., Marsh, H. W., & McInerney, D. M. (2012).
Academic motivation, self-concept, engagement, and performance in high school: Key processes
from a longitudinal perspective. Journal of Adolescence, 35, 1111-1122.
Green, J., Martin, A. J., & Marsh, H. W. (2007). Motivation and engagement in English, mathematics
and science high school subjects: Towards an understanding of multidimensional domain
specificity. Learning and Individual Differences, 17 , 269-279.
Hershberger, S. L. (2003). The growth of structural equation modeling: 1994-2001. Structural Equation
Modeling, 10, 35-46
Holmes-Smith, P., & Rowe, K. J. (1994, January). The development and use of congeneric
measurement models in school effectiveness research: Improving the reliability and validity of
composite and latent variables for fitting multilevel and structural equation models. Paper presented
at the International Congress for School Effectiveness and Improvement, Melbourne, Australia.
Iacobucci, D. (2010). Structural equations modeling: Fit indices, sample size, and advanced issues.
Journal of Consumer Psychology, 20, 90-98.
Jöreskog, K. G., & Sörbom, D. (2003). LISREL 8.54. Chicago: Scientific Software International.

8/18/2019 (Contemporary Approaches to Research
http://slidepdf.com/reader/full/contemporary-approaches-to-research 212/284
LIEM AND MARTIN
214
Jöreskog, K. G., & Sörbom, D. (2005). LISREL 8.72. Chicago: Scientific Software International.
Jöreskog, K. G., & Sörbom, D. (2006). LISREL 8.80. Chicago: Scientific Software International.
Kaplan, A., & Maehr, M. L. (2007). The contribution and prospects of goal orientation theory.
Educational Psychology Review, 2007 , 141-184.
Kaplan, D. (2000). Structural equation modeling: Foundations and extensions. Newbury Park, CA:
Sage.
Klein, K. J., & Kozlowski, S. W. J. (Eds.). (2000). Multilevel theory, research, and methods in
organizations: Foundations, extensions, and new directions. San Francisco, CA: Jossey-Bass.
Kline, R. B. (2011). Principles and practice of structural equation modeling (3rd ed.). New York: The
Guilford Press.
Kulikowich, J. M., & Hancock, G. R. (Eds.). (2007). Applications of latent variable modeling in
educational psychology research [Special Issue]. Contemporary Educational Psychology, 32(1).
Liem, G. A. D., Ginns, P., Martin, A. J., Stone, B., & Herrett, M. (2012). Personal best goals andacademic and social functioning: A longitudinal perspective. Learning and Instruction, 22, 222-230.
Liem, G. A. D., & Martin, A. J. (2012). The Motivation and Engagement Scale: Theoretical framework,
psychometric properties, and applied yields. Australian Psychologist , 47 , 3-13.
Liem, G. A. D., Martin, A. J., & Marsh, H. W. (2011, June). Extending the reciprocal effects model of
self-concept and achievement using motivation and engagement factors. Paper presented at the 6th
SELF Biennial International Conference, Quebec, Canada.
Lüdtke, O., Robitzsch, A., Trautwein, U. & Kunter, M. (2009). Assessing features of the learning
environment: How to use student ratings of classroom or school characteristics in multilevel
modeling. Contemporary Educational Psychology, 34, 120-131.
MacCallum, R. C., & Austin, J. T. (2000). Applications of structural equation modeling in
psychological research. Annual Review of Psychology, 51, 201-226.
McDonald, R. P., & Marsh, H. W. (1990). Choosing a multivariate model: Noncentrality and goodness-
of-fit. Psychological Bulletin, 107, 247-255.
Menard, S. (1991). Longitudinal research. Newbury Park: Sage Publications.
Marsh, H. W. (1993). The multidimensional structure of academic self-concept: Invariance over genderand age. American Educational Research Journal, 30, 841-860.
Marsh, H. W., Balla, J. R., & Hau, K.-T. (1996). An evaluation of incremental fit indices: A
clarification of mathematical and empirical processes. In G. A. Marcoulides & R. E. Schumacker
(Eds.), Advanced structural equation modeling techniques (pp. 315-353). Hillsdale, NJ: Erlbaum.
Marsh, H. W., & Hau, K.-T. (1996). Assessing goodness of fit: Is parsimony always desirable? The
Journal of Experimental Education, 64, 364-390. Marsh, H. W., & Hau, K-T. (2007) Applications of latent-variable models in educational psychology:
The need for methodological-substantive synergies, Contemporary Educational Psychology, 32,
151-171.
Marsh, H. W., Hau, K.-T., & Wen, Z. (2004). In search of golden rules: Comment on hypothesis
testing approaches to setting cut-off values for fit indexes and dangers in overgeneralising Hu &
Bentler’s (1999) findings. Structural Equation Modeling, 11, 320-341.
Marsh, H. W., Hau, K.-T., Wen, Z., Nagengast, B., & Morin, A. J. S. (in press). Moderation. In T.D.
Little (Ed.), The Oxford handbook of quantitative methods. New York, NY: Oxford University
Press.
Marsh, H. W., Liem, G. A. D., Martin, A. J., Nagengast, B., & Morin, A. (2011). Methodological-
measurement fruitfulness of exploratory structural equation modeling (ESEM): New approaches to
key substantive issues in motivation and engagement. Journal of Psychoeducational Assessment , 29,
322-346.
Marsh, H. W., Lüdtke, O., Muthén, B., Asparouhov, T., Morin, A. J. S., Trautwein, U., & Nagengast, B.
(2010). A new look at the big-five factor structure through exploratory structural equation modeling.
Psychological Assessment , 22, 471-491.
Marsh, H. W., Lüdtke, O., Robitzsch, A., Trautwein, U., Asparouhov. T., Muthén, B., & Nagengast, B.
(2009). Doubly-latent models of school contextual effects: Integrating multilevel and structural
8/18/2019 (Contemporary Approaches to Research
http://slidepdf.com/reader/full/contemporary-approaches-to-research 213/284
LATENT VARIABLE MODELING IN EDUCATIONAL PSYCHOLOGY
215
equation approaches to control measurement and sampling error. Multivariate Behavioral Research,
44, 764-802.
Marsh, H. W., Martin, A. J., & Cheng, J. (2008). A multilevel perspective on gender in classroom
motivation and climate: Potential benefits of male teachers for boys? Journal of Educational
Psychology, 100, 78-95.
Marsh, H. W., Martin, A. J., & Hau, K. (2006). A multiple method perspective on self-concept research
in educational psychology: A construct validity approach. In M. Eid & E. Diener (Eds.), Handbook
of multimethod measurement in psychology. Washington D.C.: American Psychological
Association.
Marsh, H. W., Nagengast, B., Morin, A. J. S., Parada, R. H., Craven, R. G., & Hamilton, L. R. (2011).
Construct validity of the multidimensional structure of bullying and victimization: An application of
exploratory structural equation modeling. Journal of Educational Psychology, 103, 701-732.
Marsh, H. W., Roche, L. A., Pajares, F., & Miller, D. (1997). Item-specific efficacy judgments inmathematical problem solving: The downside of standing too close to trees in a forest.
Contemporary Educational Psychology, 22, 363-377.
Marsh, H. W., & Shavelson, R. J. (1985). Self-concept: Its multifaceted, hierarchical structure.
Educational Psychologist, 20,107-125.
Martin, A. J. (2007). Examining a multidimensional model of student motivation and engagement using
a construct validation approach. British Journal of Educational Psychology, 77 , 413-440.
Martin, A. J. (2009). Motivation and engagement across the academic lifespan: A developmental
construct validity study of elementary school, high school, and university/college students.
Educational and Psychological Measurement, 69, 794-824.
Martin, A. J. (2011). Prescriptive statements and educational practice: What can structural equation
modeling (SEM) offer? Educational Psychology Review, 23, 235-244.
Martin, A. J. Colmar, S., Davey, L., & Marsh, H. W. (2010). Longitudinal modeling of academic
buoyancy and motivation: Do the ‘5Cs’ hold up over time? British Journal of Educational
Psychology, 80, 473-496.
Martin, A. J., Green, J., Colmar, S., Liem, G. A. D., & Marsh, H. W. (2011). Quantitative modelling ofcorrelational and multilevel data in educational research: A construct validity approach to exploring
and testing theory. In L. Markauskaite, P. Freebody, & J. Irwin (Eds.), Methodological choices and
research designs for educational and social change: Linking scholarship, policy and practice.
Dordrecht: Springer.
Martin, A. J., Malmberg, L.-E., & Liem, G. A. D. (2010). Multilevel motivation and engagement:
Assessing construct validity across students and schools. Educational and Psychological
Measurement, 70, 973-989.
Martin, A. J., & Marsh, H. W. (2006). Academic resilience and its psychological and educational
correlates: A construct validity approach. Psychology in the Schools, 43, 267-281.
Martin, A. J., & Marsh, H. W. (2008). Academic buoyancy: Towards an understanding of students’
everyday academic resilience. Journal of School Psychology, 46 , 53-83.
Miller, A. D., & Murdock, T. B. (2007). Modeling latent true scores to determine the utility of
aggregate student perceptions as classroom indicators in HLM: The case of classroom goal
structures. Contemporary Educational Psychology, 32, 83-104.
Murphy, P. K., & Alexander, P. A. (2000). A motivated exploration of motivation terminology.
Contemporary Educational Psychology, 25, 3-53.
Muthén, L. K., & Muthén, B. O. (1998-2010). Mplus user’s guide. Los Angeles, CA: Muthén &
Muthén.
Nagengast, B., Marsh, H. W., Scalas, L. F., Xu, M. K., Hau, K.-T., & Trautwein, U. (2011). Who took
the “x” out of expectancy-value theory? A psychological mystery, a substantive-methodological
synergy, and a cross-national generalization. Psychological Science, 22, 1058-1066.
Pintrich, P. R. (2003). A motivational science perspective on the role of student motivation in learning
and teaching contexts. Journal of Educational Psychology, 95, 667-686.

8/18/2019 (Contemporary Approaches to Research
http://slidepdf.com/reader/full/contemporary-approaches-to-research 214/284
LIEM AND MARTIN
216
Pintrich, P. R., & Garcia, T. (1991). Student goal orientation and self-regulation in the college
classroom. In M. Maehr & P. R. Pintrich (Eds.), Advances in motivation and achievement: Goals
and self-regulatory processes (Vol. 7, pp. 371-402). Greenwich, CT: JAI Press.
Raykov, T. (2009). Evaluation of scale reliability for unidimensional measures using latent variable
modeling. Measurement and Evaluation in Counseling and Development, 42, 223-232.
Rosel, J., & Plewis, I. (2008). Longitudinal data analysis with structural equations. Methodology, 4, 37-
50.
Rowe, K. J., & Hill, P. (1998). Modeling educational effectiveness in classrooms: The use of multi-
level structural equations to model students’ progress. Educational Research and Evaluation, 4,
307-347.
Ryan, R. M., & Deci, E. L. (2000). Self-determination theory and the facilitation of intrinsic motivation,
social development, and well-being. American Psychologist, 55, 68-78.
Schunk, D. H., Pintrich, P. R., & Meece, J. L. (2008). Motivation in education. Upper Saddle River, NJ:Pearson Education.
Skinner, E. A., Furrer, C., Marchand, G., Kinderman, T. (2008). Engagement and disaffection in the
classroom: Part of a larger motivational dynamic? Journal of Educational Psychology, 100, 765-
781.
Skinner, E. A., Kindermann, T. A., Connell, J. P., & Wellborn, J. G. (2009). Engagement as an
organizational construct in the dynamics of motivational development. In K. Wentzel & A. Wigfield
(Eds.), Handbook of motivation in school (pp. 223-245). Malwah, NJ: Erlbaum.
Tomarken, A. J., & Waller, N. G. (2005). Structural equation modelling: Strengths, limitations, and
misconceptions. Annual Review of Clinical Psychology, 1, 31-65.
Tremblay, P. F., & Gardner, R. C. (1996). On the growth of structural equation modeling in
psychological journals. Structural Equation Modeling, 3, 93-104.
Urdan, T., & Turner, J. C. (2005). Competence motivation in the classroom. In A. J. Elliot & C. S.
Dweck (Eds.), Handbook of competence and motivation (pp. 297-317). New York: The Guilford
Press.
Van de gaer, E., Grisay, A., Schulz, W., & Gebhardt, E. (2012). The reference group effect: Anexplanation of the paradoxical relationship between academic achievement and self-confidence
across countries. Journal of Cross-Cultural Psychology, 43, 1205-1228.
Weiner, B. (1994). Integrating social and personal theories of achievement striving. Review of
Educational Research, 64, 557-573.
Wigfield, A., & Cambria, J. (2010). Students’ achievement values, goal orientations, and interest:
Definitions, development, and relations to achievement outcomes. Developmental Review, 30, 1-35.
Wigfield, A., & Eccles, J. S. (2000). Expectancy-value theory of motivation. Contemporary
Educational Psychology, 25, 68-81.
Yuan, K. H. (2005). Fit indices versus test statistics. Multivariate Behavioral Research, 40, 115-148.
Zimmerman, B. J. (2008). Investigating self-regulation and motivation: Historical background,
methodological developments, and future prospects. American Educational Research Journal, 45,
166-183.
Gregory Arief D. Liem
Nanyang Technological University, Singapore
Andrew J. Martin
University of Sydney, Australia

8/18/2019 (Contemporary Approaches to Research
http://slidepdf.com/reader/full/contemporary-approaches-to-research 215/284
M.S. Khine (ed.), Application of Structural Equation Modeling in Educational Research and
Practice, 217–239.
© 2013 Sense Publishers. All rights reserved.
JOHN K. RUGUTT
10. LINKING TEACHING AND LEARNING
ENVIRONMENT VARIABLES TO HIGHER ORDER
THINKING SKILLS: A STRUCTURAL EQUATION
MODELING APPROACH
INTRODUCTION
Studies of learning environments, particularly during the past 30 years, have
rapidly drawn the interests of educational researchers and theorists. In recent
decades, studies of learning environments have been concerned with
conceptualization and theory development (Bryk & Raudenbush, 1992). Student
ratings have also been traditionally included in faculty and course evaluation inhigher education settings. Research on learning environments (Astin, 1993; Fraser,
Walberg, Welch, & Hattie, 1987; Fullerton, 2002) show that psychosocial
characteristics of classroom learning environments demonstrate incrementalvalidity in predicting student achievement. These psychosocial characteristics are
useful in curriculum evaluation studies, and can provide teachers with useful
information to arrange more optimally functioning classrooms.
Constructivist-based, personal forms of learning environment measuresdesigned to tap students’ individual, rather than collective perspectives of
classroom life have also been developed (Cavanagh, Dellar, Ellett, & Rugutt, 2000;
Fraser, Fisher, & McRobbie, 1996; Rugutt, Ellett, Culross, 2003). Learning
environment has often been studied for the purposes of ensuring maximum student
achievement in his/her education endeavors. Further, learning is a highlyindividual process which occurs within a larger environment. Learning is thus
mediated by an individual’s interactions with and perceptions of the external
environment (Loup, 1994; Olivier, 2001).It has been shown that the surrounding teaching and learning environments or
institutional culture influences educational behaviors of their students, faculty or
staff (Astin, 1993; Holland, 1997; Tinto, 1993). Research has shown that academicenvironments contribute to gain in student abilities, interests, and attitudes
(Feldman, 1988; Feldman, Ethington, & Smart, 2001). Holland (1997) noted that
the environments foster the development of competencies, motivate people to
engage in different activities, and reward people for their display of values and
attitudes. Environment therefore influences personal and professional self- perceptions, competencies, attitudes, interests, and values. Holland (1997) further
indicated that college students experience includes but not limited to; (a) a
student’s search for academic environments that match their patterns of abilities,

8/18/2019 (Contemporary Approaches to Research
http://slidepdf.com/reader/full/contemporary-approaches-to-research 216/284
RUGUTT
218
interests, and personality profiles; (b) effects of academic environments on
student’s social behavior in an effort to acquire the desired abilities, interests and
values; and (c) a student achievement to include a function of personality type and
the academic environment.
FRAMEWORK
Most research has focused on student and faculty interactions in the classroom
context. However, few studies have examined the linkages among student learning
environment teaching and learning variables such as higher order thinking skills,self-efficacy, motivation, student-faculty interaction outside of classroom, and
student involvement in learning (collaborative and self-directed learning).
Investigating factors that influence student learning processes as well asdetermining whether faculty or the student have an impact on student overall
academic performance are important professional issues.
Additionally, it is important to consider student’s involvement in learning (e.g.,cooperating with other students when doing assigned work and on class activities,
knowing other students, learning from other students in class, and working with
other students in class), as it plays a key role in student’s higher order thinkingskills as well academic achievement. Since faculty provides the student with
learning materials, the student has a responsibility of completing the required
activities so as to realize an improved understanding of the subject matter.
PURPOSE OF THE STUDY
The primary purpose of this study was to develop an empirically derived, structuralequations model to broaden our understanding of a complex, theory-based set of
personal and organizational factors that contribute to higher order thinking skills.
The study explored the degree of influence student-faculty interaction, motivationand self-efficacy has on student’s development of higher order thinking skills.
Specifically, the study focus was three-fold: 1) to investigate interrelationships
existing between teacher student relations (TSR), self-efficacy (SE) and motivation
(MO). 2) To investigate the direct relationship between; a) teacher student relations
and higher order thinking skills (HOTS); b) self-efficacy and higher order thinking
skills; and c) motivation and higher order thinking skills. 3) To use confirmatoryfactor analysis to validate all the study variables (MO, SE, TSR, HOTS).
SIGNIFICANCE OF THE STUDY
This research is important since it integrates student teaching and learning
variables that can impact academic achievement. While numerous studies have
focused on student-faculty interaction, and the impact it has on student academic
performance, fewer studies have investigated linkages existing among the teaching
and learning variables such as higher order thinking skills, self-efficacy, student-
faculty interaction, student involvement in learning and motivation. Further, this
8/18/2019 (Contemporary Approaches to Research
http://slidepdf.com/reader/full/contemporary-approaches-to-research 217/284
LINKING TEACHING AND LEARNING ENVIRONMENT VARIABLES
219
study is important since factors outside the classroom environment are studied to
determine if they also play a role in student’s development of higher order thinking
skills.
RATIONALE FOR STRUCTURAL EQUATION MODELING (SEM)
Like many multivariate statistical techniques, the use of SEM may be wellgrounded, but many aspects of SEM are yet to be understood and embraced by
most researchers and consumers of research reports. As such, it is important that
researchers continue to share their findings on the design, modeling, and recentSEM developments in a bid to expand and advance knowledge in this important
research area. The multi-step approach that is completed in SEM, particularly the
measurement and structural model, make SEM a versatile tool for a variety ofstatistical analyses including instrument development and validation as well. Use
of confirmatory factor analysis (CFA), a structural equation modeling (SEM)
technique in education has gained prominence in recent years, particularly in scaledevelopment and data analysis. Noar (2003) posit that “CFA has taken on a pivotal
role in the development of quantitative scales, although there is little literature that
discusses the unique contribution that CFA brings to measurement development,and the process by which it is employed ” (p. 623). In quantitative data analysis,
multiple linkages among study variables are investigated using SEM technique.
The CFA approach “offers a strong analytical framework for evaluating theequivalence of measurement models across distinct groups” (Brown, 2006, p. 49).
PRIOR RESEARCH
Motivation and Higher Order Thinking Skills
The literature regarding the relationship between motivation and higher order
thinking skills is drawn from diverse settings such as K-12 education, highereducation, and even training to become military air traffic controllers. In few cases,
motivation is viewed as the dependent variable with higher order thinking skills as
an independent variable. More often, motivation is viewed as a predictor of higher
order thinking skills. Teacher as a motivation factor influence students’ learninggreatly. How teachers behave in classroom can directly promote student learning
and motivation. It is important that teachers care about how they motivate students
because if the students are not actively motivated to learn, learning will not occur.
Patrick, Hisley, Kempler, and College (2000) noted that teacher behaviors promote student intrinsic motivation to learn. Their research of how teachers’
enthusiasm and interaction relate to each other found a significant relationship
between teacher-student relations and intrinsic motivation. Students who areintrinsically motivated view learning as a goal in itself, while students who are
extrinsically motivated view learning as a reward (Cokley, 2000; Covino, &
Iwanicki, 1996; Dweck, 1986). Donohue and Wong, (1997) studied motivation
while Nastasi and Clements (1994) studied motivation and higher order thinking in

8/18/2019 (Contemporary Approaches to Research
http://slidepdf.com/reader/full/contemporary-approaches-to-research 218/284
RUGUTT
220
third grade students in two cooperative computer environments, one using Logo
for programming and the other using computer based instruction for writing. They
found that the treatment (environment) accounted for significant portions of the
variance in both motivation and in higher order thinking skills and that motivation
accounted for a significant portion of the variance in higher order thinking skills.While this study treated higher order thinking skills as the dependent variable, the
authors maintained that the learning environment that placed greater emphasis on
higher order thinking skills saw higher levels of student motivation. DiCintio and
Stevens (1997) investigated whether the level of higher order thinking required byinstruction is related to motivational goals. Higher order thinking skills were found
to be a significant predictor of motivational variables with fifth grade providingmore emphasis on higher order thinking skills than sixth and seventh grade
mathematics classes and much more emphasis on higher order thinking skills in a
high ability fifth grade class than in an average ability fifth grade class. The
motivational variable of mastery orientation (intrinsic motivation) was also
significantly higher for fifth graders than for the older students in the study. Theauthors, however, cited a lack of variance in higher order thinking skills within
grade level as a confounding issue limiting generalization of the study’s
conclusions.
Kanfer and Ackerman (1989), studied of skills acquisition among U.S. air forcerecruits learning to become air traffic controllers found that goal assignments
provided during the declarative stage of complex skill acquisition actually
decreased performance among both low-ability and high-ability groups with moreimpairment among low-ability subjects. They define the declarative phase as the
earliest phase of skill acquisition when the focus is on facts. This stage is followed by stages of integration and automatization of the skill. Higher order thinking skills
are most closely related to the integration phase of skill acquisition. The studyconcludes that low-ability subjects benefit more from imposition of a goal
assignment (motivation) during the integration portion of complex skill acquisition
than do high-ability subjects. Their conclusion can be stated another way, that
emphasis on higher order thinking skills provides an environment in whichmotivational interventions are more effective. While learning to become an air
traffic controller certainly differs from academic learning in a university setting,
Kanfer and Ackerman’s (1989) study is one of few to consider the effect ofemphasis on higher order thinking skills on motivation rather than vice versa.
Other studies that have investigated the relationship between motivation and
higher order thinking skills with mixed results include research by Singh and Singh
(1994) on the role of motivation in integrational capacity in young children. Theyfound that motivation was a significantly better predictor of integrational capacity
than an ability construct was for some but not all age levels. Prediction models
presented in these studies varied by ethnicity and by gender. However, Plecha
(2002) found no significant difference in negative impact on students’ motivationand achievement based on negative teacher-student relationship.

8/18/2019 (Contemporary Approaches to Research
http://slidepdf.com/reader/full/contemporary-approaches-to-research 219/284
LINKING TEACHING AND LEARNING ENVIRONMENT VARIABLES
221
Self-efficacy
Self-efficacy, defined as “beliefs in one’s capacity to organize and execute the
courses of action required to produce given attainments” (Bandura, 1997, p. 3) has
guided researchers for over a quarter of a century. The beliefs of self-efficacy have been identified as a factor that may contribute to the success or failure of an
individual with respect to specific tasks. Self-efficacy reflects a person’s level of
confidence in their ability to perform a behavior to produce specific outcomes. It is believed to affect the choice by an individual to take on certain tasks and
influences the amount of effort and persistence needed to succeed (Bandura, 1977;
Schunk 1985).
Bandura’s work has shown that there is considerable evidence that self-efficacy(SE) beliefs play a strong role in human behavior. Self-efficacy plays an importantmediating link between cognition and behavior and has been viewed as highly
situational and consists of competency and motivational factors that subsequently
affect an individual’s ability to organize and execute courses of action required toattain various types of goals and performances (Bandura, 1997). Further, personal
perceptions of efficacy and resulting actions are influenced by factors in the
environment (Ellett, Loup, Culross, McMullen & Rugutt, 1997). Ellett, 1995 andEllett, 2000 study has shown predictable relationships between child welfare
staffs= self-efficacy beliefs, strength of motivation and persistence, and intentions
to remain or leave employment in child welfare.
High self-efficacy beliefs have been shown to enhance motivation, promote
higher goal-setting behaviors, and influence persistence and commitment to goal
accomplishment (Bandura & Schunk, 1981). Loup (1999), Loup and Ellett (1993),Loup, Clarke, Ellett and Rugutt (1997) present self- and organizational efficacy
assessment measures for use in schools to assess personal motivational elements of
the efficacy construct in terms of effort and persistence put forth to achievespecific goals. The measure contextualized self-efficacy behavior by requiring
respondents to consider the particular context (such as school, classroom) in which
specific goals might be achieve. There have been few studies (Ellett, Loup,
Culross, McMullen, & Rugutt, 1997) that have been conducted using the self-efficacy construct as it relates to student learning in higher education settings.
Student-faculty Interactions
Other studies have found that students who frequently interacted with faculty had
greater satisfaction with their college experiences as compared to students whointeract at a lesser level (Wilson, Gaff, Dienst, Wood, & Bavry, 1975). Students
who interacted more frequently with faculty, performed better academically than
students who seldom met with the faculty (Pascarella & Terenzini, 1976;Pascarella, Terenzini, & Hibel, 1978). These findings strongly indicate that
student-faculty interactions are important to a student’s college academic
performance. Tinto (1987, 1993) as well as Woodside (1999) concluded that both

8/18/2019 (Contemporary Approaches to Research
http://slidepdf.com/reader/full/contemporary-approaches-to-research 220/284
RUGUTT
222
informal and formal interaction with teachers is important in predicating freshmen
academic outcomes, satisfaction, and attrition.
Some factors that are associated with student-faculty interaction include;
student’s academic achievements, educational attainment and aspirations, career
and major choice, college satisfaction and persistence, and cognitive development.First-year students have occasional contact (once or twice a month) with their
instructors, while seniors at doctoral-extensive universities interacted less with
faculty members than first-year students at liberal arts colleges, (Kuh, 2001).
Pascarella and Terenzini (1976, 1991) pointed out that the frequency of student-faculty interactions significantly predicts freshman academic outcomes such as
college satisfaction and attrition. Students learn how experts (mentors) think andsolve problems by interacting with faculty members inside and outside the
classroom (Institutional Benchmark Report, 2002). Numerous projects have
focused on the relationship that exists between student-faculty interactions and
outcome variables such as academic achievement and overall satisfaction of
college students (Astin, 1993; Kuh, 2001; Terenzini & Pascarella, 1994).
METHODOLOGY
Research Design
This study is both cross-sectional and survey in nature. It is cross-sectional in that
it focuses on major variables of higher education teaching and learning
environment at a specific period. It is also a survey research design because the
students were surveyed on key variables of teaching and learning environment.Further, a post hoc correlation design was used as a framework for data analysis inthe study. Thus relationships among the variables was explored (rather than
manipulated) in an attempt to develop a structural equation model for examining
linkages among key variables of the study.
Measures
A variety of self-report measures have been developed to examine student
perception of learning environment and their own characteristics as learners. This
study used measures contained in Student Assessment of Teaching and Learning(SATL) (Short-Form), first developed by Ellett, Culross, McMullen, and Rugutt,
(1996), and later revised by Ellett, Loup, Culross, McMullen and Rugutt (1997).
The measures assessed a wide variety of factors among college students.
Motivation (MO). Mayer (1998) found that motivational skills were necessary inacademic problem solving but cognitive and strategic (metacognitive) skills were
even more necessary while House (1995) found that motivational variables were
significant predictors of grade performance but that academic background was astronger predictor. For this study, student motivation (MO) is comprised of five
statements. Students respond to the degree to which various activities enhanced

8/18/2019 (Contemporary Approaches to Research
http://slidepdf.com/reader/full/contemporary-approaches-to-research 221/284
LINKING TEACHING AND LEARNING ENVIRONMENT VARIABLES
223
their learning using a three point scale as follows: 1 = learning not enhanced, 2 =
learning sometimes enhanced, 3 = learning almost always enhanced. A complete
list of the five statements making up the MO construct is found in Appendix A.
Higher Order Thinking Skills (HOTS). Resnick (1987) indicates that HOTS is a
complex construct to be given a precise definition but instead lists nine featuresthat collectively sum up what HOTS entail. Rugutt and Chemosit (2009) define
HOTS as cognitive characteristics that enable a student to analyze and reason
toward an informed response in a variety of scenarios. HOTS, nearly synonymouswith critical thinking (Bean, 2001), develop with a student’s active participation
and involvement in the educational process (Kaplan & Kies, 1994). Ennis (1985)argues that critical thinking is the practical side of developing one’s HOTS, while
Pascarella (1989) specifies that one’s critical thinking ability develops in terms ofhis or her ability to reason and evaluate information. HOTS differ from knowledge
because they are cognitive abilities rather than the retention of specific
information. HOTS, then, develop independent of a given curricula while
knowledge may or may not transfer across situation. Cognitive growth occurs asone develops HOTS or critical thinking skills. For this study, the variable for
classroom emphasis on higher order thinking skills (HOTS) is comprised of 4
statements (see Appendix A). Students rate the amount of emphasis given to eachtype of learning as follows: 1 = no emphasis, 2 = some emphasis, 3 = much
emphasis, 4 = very much emphasis.
Self-efficacy (SE). The vast majority of studies of learning environments haveoccurred in the K-12 context in schools and at the classroom level. There have
been some past efforts to focus research on the study of college/university
environments (Astin, 1993; Kuh, 2001; Kuh, & Hu, 2001; Pace & Stern 1958;
Stern, 1970; Pascarella, 1980, 2001). Astin (1993) posit that “student-faculty
interaction had a significant positive correlation with every academic attainmentoutcome: college GPA, degree attainment, graduating in honors and enrollment in
graduate or professional school” (p. 383). Student-faculty interaction also had positive effect on student intellectuals and personal growth, behavioral outcome
and career outcome. Pascarella and Terenzini in (Woodside, 1999) point out that
the frequency of student-faculty interactions significantly predicts freshman
academic outcomes such as college satisfaction and attrition. Student-faculty
interaction produces a sense of identification with faculty and has important
implications for student development (Astin 1993; Lamport, 1993). For this study,self-efficacy construct comprised of responses to 4 statements. The four items
comprising the self-efficacy measure are shown in Appendix A. Students respond
to the amount of effort or effort and persistence they put forth to enhance their ownlearning on a scale of 1 = little or none to 5 = a large amount.
Teacher Student Relations (TSR). Tinto (1987, 1993) stated that student-facultyinteractions, which include both formal classroom experiences and informal
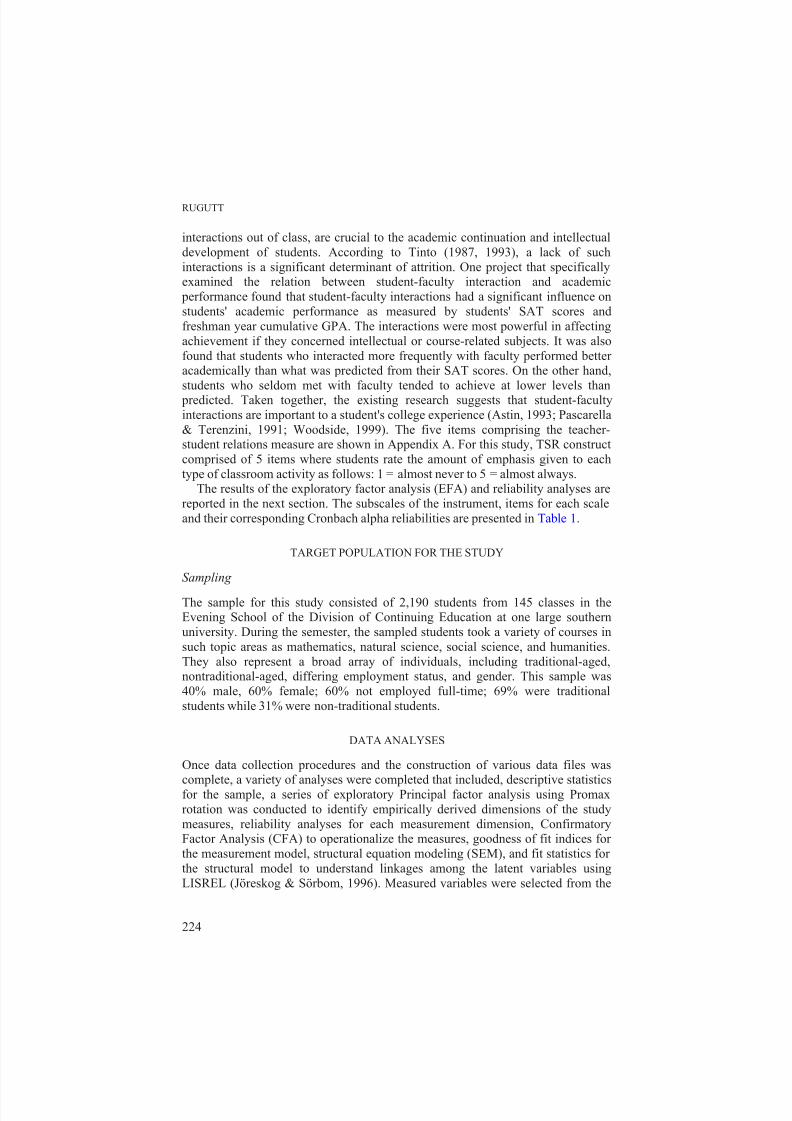
8/18/2019 (Contemporary Approaches to Research
http://slidepdf.com/reader/full/contemporary-approaches-to-research 222/284
RUGUTT
224
interactions out of class, are crucial to the academic continuation and intellectual
development of students. According to Tinto (1987, 1993), a lack of such
interactions is a significant determinant of attrition. One project that specificallyexamined the relation between student-faculty interaction and academic
performance found that student-faculty interactions had a significant influence on
students' academic performance as measured by students' SAT scores and
freshman year cumulative GPA. The interactions were most powerful in affecting
achievement if they concerned intellectual or course-related subjects. It was also
found that students who interacted more frequently with faculty performed betteracademically than what was predicted from their SAT scores. On the other hand,
students who seldom met with faculty tended to achieve at lower levels than predicted. Taken together, the existing research suggests that student-faculty
interactions are important to a student's college experience (Astin, 1993; Pascarella
& Terenzini, 1991; Woodside, 1999). The five items comprising the teacher-student relations measure are shown in Appendix A. For this study, TSR construct
comprised of 5 items where students rate the amount of emphasis given to each
type of classroom activity as follows: 1 = almost never to 5 = almost always.The results of the exploratory factor analysis (EFA) and reliability analyses are
reported in the next section. The subscales of the instrument, items for each scale
and their corresponding Cronbach alpha reliabilities are presented in Table 1.
TARGET POPULATION FOR THE STUDY
Sampling
The sample for this study consisted of 2,190 students from 145 classes in theEvening School of the Division of Continuing Education at one large southern
university. During the semester, the sampled students took a variety of courses in
such topic areas as mathematics, natural science, social science, and humanities.
They also represent a broad array of individuals, including traditional-aged,nontraditional-aged, differing employment status, and gender. This sample was
40% male, 60% female; 60% not employed full-time; 69% were traditional
students while 31% were non-traditional students.
DATA ANALYSES
Once data collection procedures and the construction of various data files was
complete, a variety of analyses were completed that included, descriptive statisticsfor the sample, a series of exploratory Principal factor analysis using Promax
rotation was conducted to identify empirically derived dimensions of the study
measures, reliability analyses for each measurement dimension, ConfirmatoryFactor Analysis (CFA) to operationalize the measures, goodness of fit indices for
the measurement model, structural equation modeling (SEM), and fit statistics for
the structural model to understand linkages among the latent variables using
LISREL (Jöreskog & Sörbom, 1996). Measured variables were selected from the

8/18/2019 (Contemporary Approaches to Research
http://slidepdf.com/reader/full/contemporary-approaches-to-research 223/284
LINKING TEACHING AND LEARNING ENVIRONMENT VARIABLES
225
larger measures contained in Student Assessment of Teaching and Learning (SATL)
(Short-Form), first developed by Ellett, Culross, McMullen, and Rugutt, (1996),
and later revised by Ellett, Loup, Culross, McMullen and Rugutt (1997) (with
permission). The correlations and covariance matrices calculated using SPSS
(SPSS, Inc., 1990) were used as input into LISREL (Jöreskog, & Sörbom, 2003) todevelop the Structural Equation Model (SEM). Individuals comprising the
undergraduate college students were used as the units of analysis.
Table 1 Student Assessment of Teaching and Learning (SATL) (Short-Form)
Item Construct and Item Description Cronbach AlphaCoefficient
Motivation (MO) 0.88mo1 The instructor’s enthusiasm for teaching, learning and the
subject taughtmo2 The interpersonal climate in the classroom (e.g., patience,
courtesy, respect)mo3 Encouragement for students to express their own ideas
mo4 Encouragement for students to participate in discussionsmo5 Encouragement for students to ask questions
Teacher Students Relations (TSR) 0.93tsr1 The teacher takes a personal interest in me
tsr2 The teacher considers my feelingstsr3 The teacher helps me when I have trouble with the work
tsr4 The teacher talks with me
tsr5 The teacher moves about the class to talk with metsr6 It is alright for me to tell the teacher that I do understandtsr7 The teacher’s questions help me to understand
Self-efficacy (SE) 0.80se1 How much effort did you put forth in this course to enhance
your own learning?se2 When there were difficult or uncertain obstacles to overcome
in learning/achieving in this course, how much effort and persistence did you put forth to enhance your own learning?
se3 How much knowledge and/or ability do you think you have toaccomplish your learning objectives in college?
se4 How much personal responsibility do you think you have toaccomplish your learning objectives in college?
se5 How much success do you think you have had inaccomplishing your learning goals in college?
Higher Order Thinking Skills (HOTS) 0.93hots1 Learning factual informationhots2 Developing conceptshots3 Understanding and applying principles and rules
hots4 Understanding and applying theorieshots5 Critical analysis and/or problem solving

8/18/2019 (Contemporary Approaches to Research
http://slidepdf.com/reader/full/contemporary-approaches-to-research 224/284
RUGUTT
226
Exploratory factor analysis (EFA). EFA focuses on finding structures or patterns
of correlations in data and this technique is most often used in the early stages of
instrument development (Vogt, 2007). For the current study, a series of Principal
factor analysis using Promax rotation was conducted on the exploratory sample for
the four study measures (HOTS, SE, MO, TSR) to identify measurement sub
constructs as defined by the magnitude and patterning of item loadings on
extracted components (correlations). This study randomly divided the full sample
(n = 2190) into two samples for analysis. A smaller sample (n = 800) was analyzed
using exploratory factor analysis (EFA) and for generating the Crobach alpha
reliability coefficients for the four instrument subscales (see Table 1). The other
portion (n = 1390) was used for the confirmatory factor analysis (CFA) methods.The splitting of data and running two separate analyses were important in the
validation of the study latent constructs since the second sample acted as a
validation sample. CFA requires larger sample sizes than exploratory analyses
because of the large number of parameters it evaluates given the model described
in this study. Principal factor analysis using Promax rotation was conducted on the
exploratory sample.
Structural equation modeling (SEM) analyses. Latent variable structural equations
modeling (SEM) is an appropriate procedure for use with non-experimental data
(Keith, 1998; Quirk, Keith, & Quirk, 2002). This procedure performs a
confirmatory factor analysis (CFA) and path analysis simultaneously (Keith, 1997;
Marsh, 1994). In this study, developing a SEM to best represent the data required
two key steps, the measurement model and the structural model. There are several basic steps that are involved in setting up a SEM model. Some of these steps have
been discussed in detailed in Kline (2005), in scaling procedures research and in
SEM books (e.g., Brown, 2006; DeVellis, 1991; Jackson, 1970; Maruyama, 1998;
Netemeyer, Bearden, & Sharma, 2003). These steps include: a) use of literature
and theory in the development of latent constructs as well as linkages among study
variables; b) determining whether the model is identified, that is the difference
between the number of freely estimated model parameters and the number of
pieces of information in the input variance-covariance matrix; c) selection of
measures and data preparation; d) data analysis; e) model re-specification; and f)
description of the analysis and writing of reports. Researchers interested in details
of the above steps should consult the above resources as well as other works in
SEM techniques.
First, the measurement model was specified by completing a CFA of the study
variables and computing goodness of fit statistics for each of the four latent
variables (study measures). Subsequently, a two-step LISREL approach was usedto further simplify and operationalize the measured variables used in developing
the SEM and to generate goodness of fit statistics to determine the adequacy of the
measurement and structural models.
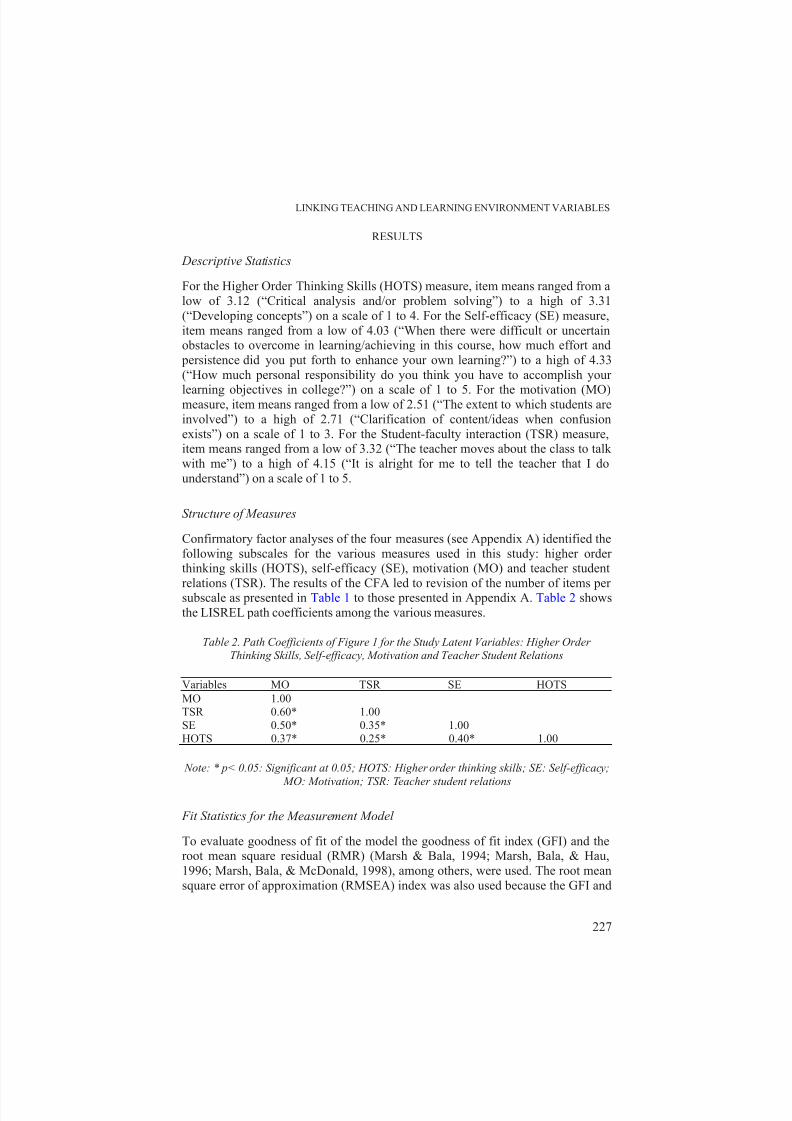
8/18/2019 (Contemporary Approaches to Research
http://slidepdf.com/reader/full/contemporary-approaches-to-research 225/284
LINKING TEACHING AND LEARNING ENVIRONMENT VARIABLES
227
RESULTS
Descriptive Statistics
For the Higher Order Thinking Skills (HOTS) measure, item means ranged from a
low of 3.12 (“Critical analysis and/or problem solving”) to a high of 3.31
(“Developing concepts”) on a scale of 1 to 4. For the Self-efficacy (SE) measure,
item means ranged from a low of 4.03 (“When there were difficult or uncertainobstacles to overcome in learning/achieving in this course, how much effort and
persistence did you put forth to enhance your own learning?”) to a high of 4.33
(“How much personal responsibility do you think you have to accomplish your
learning objectives in college?”) on a scale of 1 to 5. For the motivation (MO)measure, item means ranged from a low of 2.51 (“The extent to which students are
involved”) to a high of 2.71 (“Clarification of content/ideas when confusion
exists”) on a scale of 1 to 3. For the Student-faculty interaction (TSR) measure,item means ranged from a low of 3.32 (“The teacher moves about the class to talk
with me”) to a high of 4.15 (“It is alright for me to tell the teacher that I do
understand”) on a scale of 1 to 5.
Structure of Measures
Confirmatory factor analyses of the four measures (see Appendix A) identified the
following subscales for the various measures used in this study: higher orderthinking skills (HOTS), self-efficacy (SE), motivation (MO) and teacher student
relations (TSR). The results of the CFA led to revision of the number of items persubscale as presented in Table 1 to those presented in Appendix A. Table 2 shows
the LISREL path coefficients among the various measures.
Table 2. Path Coefficients of Figure 1 for the Study Latent Variables: Higher OrderThinking Skills, Self-efficacy, Motivation and Teacher Student Relations
Variables MO TSR SE HOTS
MO 1.00TSR 0.60* 1.00
SE 0.50* 0.35* 1.00HOTS 0.37* 0.25* 0.40* 1.00
Note: * p< 0.05: Significant at 0.05; HOTS: Higher order thinking skills; SE: Self-efficacy;
MO: Motivation; TSR: Teacher student relations
Fit Statistics for the Measurement Model
To evaluate goodness of fit of the model the goodness of fit index (GFI) and theroot mean square residual (RMR) (Marsh & Bala, 1994; Marsh, Bala, & Hau,
1996; Marsh, Bala, & McDonald, 1998), among others, were used. The root mean
square error of approximation (RMSEA) index was also used because the GFI and

8/18/2019 (Contemporary Approaches to Research
http://slidepdf.com/reader/full/contemporary-approaches-to-research 226/284
RUGUTT
228
RMR indices do not take into account the number of parameters estimated in the
model, and the model goodness of fit improves as the number of estimated
parameters increases.Table 3 includes the chi-square values ( x2) with associated degrees of freedom
(df ), root mean square error of approximation (RMSEA), normed fit index (NFI),comparative fit index (CFI), root mean square residual (RMR), and goodness of fit
(GFI) index values for each variable in the measurement model and in the
structural models. The results for the model’s goodness of fit indices were within
acceptable limits (Bentler, 1993; Brown & Cudek, 1993; Byrne, 1989, 1993, 1998;Diamantopoulus & Siguaw, 2000; Schumaker & Lomax, 1996). The allowable fit
values for the NFI, CFI and GFI indices are those close to 1.00. For RMSEAvalues less than 0.08 are considered acceptable, and RMR values as close to zero
as possible are preferred. The results shown in Table 3 support a good fit of the
variables to the measurement and structural models.
Table 3. Summary of hypothesized measurement model fit statistics for each study variable
χ 2 df GFI NFI RMR RMSEA
Measurement
Higher OrderThinking skills
4.16 2 1.00 1.00 0.009 0.020
Self-efficacy 2.68 2 1.00 1.00 0.098 0.016Motivation 13.87 2 0.97 0.98 0.024 0.065
Teacher StudentRelations
15.23 2 0.99 0.99 0.012 0.069
Structural ModelHOTS (Dependent
Variable)
431.40 113 0.93 0.98 0.044 0.036
IndependentVariables (MO, TSR
& SE)
Note: df: Degrees of freedom; GFI: Goodness of Fit; NFI: Normed Fit Index; RMR: Root Mean Square Residual; RMSEA: Root Mean Square Error of Approximation
Structural Equation Modeling Analyses
Figure 1 shows the CFA loadings for the measurement and the structural models.
The conceptual focus guiding the development of the SEM was to develop a causalmodel to examine the influence of the motivation (MO) and teacher studentrelations (TSR) variables on the higher order thinking skills (HOTS) variable
through self-efficacy (SE). The latent variables (ovals) are constructs inferred from
the measured variables (indicators shown in rectangles) previously developedusing CFA procedures. The paths from the latent variables (ovals) to the measured
variables (rectangles) show the weighting (not included in the schematic but were
all larger than 0.50 and significant) of the measured variables as they

8/18/2019 (Contemporary Approaches to Research
http://slidepdf.com/reader/full/contemporary-approaches-to-research 227/284
LINKING TEACHING AND LEARNING ENVIRONMENT VARIABLES
229
operationalize the latent variables (factor loadings). All the measurement factor
loadings were significant indicating that the indicators were reliable measures of
their respective latent constructs. Paths from the latent variable (SE, TSR, MO) tothe HOTS (the structural model) are standardized regression coefficients that
suggest the extent to which each independent variable relate to the dependent
variable (HOTS). The curved lines and the double-headed arrow lines indicate
bivariate correlations between the various latent variables (SE, MO and TSR). A
disturbance (d1) term is included in the model to represent influence on the latent
variable HOTS other than those already contained in the model (MO, SE, TSR).The measured variables also take into account any error or other influences not
shown (e.g., e1, e
2, e
3…) that may be influencing the variables beyond the latent
variables. Separating error from the model enhances the interpretation of the
constructs of interest and their effects on each other (Keith, 1998; Quirk, Keith, &
Quirk, 2002). The various fit statistics that were used to judge the adequacy of themeasurement and structural models are shown in Table 3 and they suggest that the
models provided a good fit to the data.
Given an adequate fit of the model to the data, the next step was to interpret the
paths. The path from self-efficacy (SE) to higher order thinking skills (HOTS) was0.16 while the path coefficient from teacher student relations (TSR) to higher order
thinking skills (HOTS) was 0.25. The path from MO to HOTS was 0.37. This path
suggests that for each standard deviation increase in motivation, HOTS increased
by 0.37 of a standard deviation. This means that motivation appears to have had a
moderate, positive effect on HOTS. The path from TSR to HOTS was also positiveand significant. The path suggests that for each standard deviation increase in
teacher student relations, HOTS increased by 0.25 of a standard deviation. Thismeans that teacher student relations variable appears to have had a moderate,
positive effect on HOTS. Motivation, self-efficacy and teacher student relations
demonstrated moderately strong, positive relationships to each other (MO on SE =
0.50; MO on TSR = 0.62; SE on TSR = 0.53). The three coefficients werestatistically significant (p<.05). Standardized regression coefficients (path
coefficients) are presented in Table 2. Where the path coefficient was significant atan alpha level of 0.05 (95% level of significance), a single asterisk was used. It
should be noted that the path coefficients between any two latent variables
presented in the figure are adjusted for the other latent variables in the model.
DISCUSSION AND IMPLICATIONS
The purpose of this study was to explore the degree of influence student-facultyinteraction, self-efficacy and motivation has on student’s development of higher
order thinking. The results show that all the study variables (motivation, self-
efficacy and teacher student relations) significantly predict higher order thinking
skills. The path coefficients between motivation and self-efficacy, betweenmotivation and teacher student relations and between self-efficacy and teacher
student relations were positive and significant. All the path coefficients between

8/18/2019 (Contemporary Approaches to Research
http://slidepdf.com/reader/full/contemporary-approaches-to-research 228/284
RUGU
230
the in
were
Fig
ord thi
Implic
The st
a rath
studen1993),
1997;
Banduthinki
Clemeto stuThe r
and m
There be se
varioueleme
T
dependent va
ositive and si
re 1: Structura
r thinking skil nking skills; E
ations for Hi
udy variables
er rich histo
t-faculty inte discussion o
Plecha, 2002
ra & Schung skills (Di
nts, 1994). Fent higher or sults of this
otivation are
ore, it seemssitive to the
s units of cots of higher
riables (MO,
gnificant.
l equation mod
s as the depen F: Self-efficac
her Educatio
(higher order
ry in the e
action (Astinf motivation
; Tavani &
, 1981) andintio & Stev
rther, underser thinking study clearly
important va
important fo student-leve
lleges and uorder thinkin
SE, TSR) a
el (SEM) for st
ent variable.; MO: Motiva
and Practic
thinking skill
pirical and
, 1993; Pasca(Ames, 1992;
osh, 2003),
investigations, 1997; Ka
anding indiviills in learni
show that tea
iables in pre
institutionsl and organi
iversities be skills, activ
d the depen
dy variables u
ote: * p< 0.05;ion; TSR: Teac
s and teacher
heoretical lit
rella & Tere DiCintio &
elf-efficacy
of developnfer & Acker
dual and instig are importacher student
dicting highe
f learning anational char
oove them t learning stra
dent variable
ing the studen
HOTS: Higheher student rel
student relati
eratures pert
zini, 1991; aStevens, 199
Bandura, 19
ent of higman, 1989;
tutional factont professionelations, self
order thinki
d universitycteristics. L
o be cognizategies, teache
(HOTS)
t higher
ordertions
ns) have
ining to
d Tinto,; House,
7, 1997;
er orderastasi &
s relatedl issues.efficacy,
g skills.
aculty to
aders in
t of ther student
MO
SE
TSR
HOTS
mo1
mo2
mo3
mo4
mo5
se1
se2
se3
se4
trs1
tsr2
tsr3
tsr4
tsr5
hots1
hots2
hots3
e1
e2
e3
e5
e6
e7
e8
e9
e10
e11
e12
e13
e14
e15
e16
e17
e18
0.50*
0.53* hots4 e4
0.37*
0.25*
0.62*
0.16*
d1

8/18/2019 (Contemporary Approaches to Research
http://slidepdf.com/reader/full/contemporary-approaches-to-research 229/284
LINKING TEACHING AND LEARNING ENVIRONMENT VARIABLES
231
relations, student motivation and self-efficacy so that they are fully involved in
providing the kinds of educational experiences that can enhance the development
of these important and affective higher order thinking characteristics in their
learners. This strategy may lead to increase student motivation, student-faculty
interaction, elevated active learning strategies and development of higher orderthinking skills and thus student academic success. Strengthening these individual
and institutional characteristics seems particularly important for learners and
institutions of higher learning.
Implications for Theory Development
The network of relationships in the structural model in this study shows how
higher order thinking skills is statistically, and importantly related to both the levelof motivation as well as to the level of teacher student relations and self-efficacy
beliefs about learning tasks of students. Further, the results of this study have
implications for the continued development of a nomological network (Cronbach& Meehl, 1955) for a general theory of motivation and learning, and higher order
thinking skills in institutions of learning and other organizations. This research
approach and concern has been on studying linkages of factors related to higher
order thinking skills. The researcher believes this approach to theory development
will provide a conceptual framework for future research that has stronger
implications for improving strategies used to motivate learners and thus improvestudent higher order thinking skills. Thus, a developing theory of motivation and
learning and higher order thinking skills can be understood through the
investigation of factors related to higher order thinking skills at institutions ofhigher learning. Obviously, there are a host of other organizational and personal
variables that can be researched and added to the nomological network in
explicating a theory of motivation and learning and higher order thinking skills.With this goal in view, this study and other recent studies in the fields of self-
efficacy (e.g., Bandura, 1977, 1997; Astin, 1993; Tavani, & Losh, 2003; Tinto,
1993) will shed more light to the current research on predictors and correlates of
higher order thinking skills.
Implications for Future Research
This study was completed at only one point in time with one large, institution
sample of traditional and non-traditional students. Replications of the study, with
the refined study measures resulting from the confirmatory factor analyses, and theaddition of other important measures as well, are needed. This study synthesized
pertinent studies in the areas covered by the study variables and thus produced
greater benefits that augmented the statistical results. Majority of past researchhave made use of final grades and student success as indicators of good teaching,
learning and student motivation. This study advocates for the need for learner-
centered research that focuses on the cognitive aspect of all learners; how they

8/18/2019 (Contemporary Approaches to Research
http://slidepdf.com/reader/full/contemporary-approaches-to-research 230/284
RUGUTT
232
learn, how learning might be increased, and what environmental factors can assist
in achieving such improved results and motivation.
For the most part, the measures used in this study yielded reliable data, though
some of the measurement dimensions may need to be refined with revisions of
items. The researcher believes these measures are adequate to do replicationstudies in other large research/extensive institutions of higher learning, and with
other research designs. The findings of this study suggest that these variables may
be quite potent and yield rich information for theory development. As well, the
continued use of mixed methodologies in future studies can strengthen thenomological network (Cronbach & Meehl, 1955) of a theory of higher order
thinking skills and learning and add to the utility and explanatory power of thequantitative results presented in this study.
Since motivation consists not only of making student receptive to and excited
about the subject taught, but also making them discern the value of learning itself
(Covino, & Iwanicki, 1996), there are a number of strategies that are of value to
the teacher in order to effectively motivate individual student or groups of studentsand lead them to the development of higher order thinking skills. First, through
teacher student relations, the teacher gets to know students’ preconceptions and
misconceptions or subject matter, student’s collaborative and active learning
strategies such as student-to-student relations and how such relationships couldfurther the learning process, students’ areas of interests, student weak points,
students’ ability to learn factual information and to develop concepts,
understanding and applying principles, rules, applying theories, and problemsolving strategies among others. With this knowledge, the teacher can devise
strategies to foster motivation and tickle the minds of students for the developmentof higher order thinking skills. Good and Brophy (1987) presented four areas such
as supportive environment, as espoused in the elements of teacher student relationssuch as teacher taking a personal interest in student and student learning,
considering student feelings, helping student when they are faced with trouble with
work and maintaining frequent communication. A second strategy is to provide an
appropriate level of challenge or difficulty as listed in the elements of motivationsuch as encouragement of students to participate in discussions, providing the kind
and number of thought-provoking questions, encouragement of students to
compare and contrast and compare ideas, encouragement of students to getinvolved in discussion among themselves, and encouragement of students to apply
course content to solve problems or to understand real life situations. A third
strategy requires that the teacher provides meaningful learning objectives so that
the student remains encouraged in expressing their own ideas, participate in smalland large discussion groups, compare and contrast ideas, and appreciate to learn
from each other. The fourth strategy involves moderation and variation in strategy
such as dividing a class time into a variety of activities such as lecture, small
groups, large group projects and presentation, and discussion groups. Further,subjects such as mathematics and science courses are quite often best taught using
a teacher-centered style where the students are taught a particular skill and then
asked to duplicate that skill on their own until mastery. Social sciences and

8/18/2019 (Contemporary Approaches to Research
http://slidepdf.com/reader/full/contemporary-approaches-to-research 231/284
LINKING TEACHING AND LEARNING ENVIRONMENT VARIABLES
233
humanities often are exactly the opposite, opening up much greater opportunities
for in-class discussions, group projects, and extended peer interaction and
differential influence on motivation and development of higher order thinking
skills.
The findings of this study call for continued research on correlates and predictors of higher order thinking skills. It must be acknowledged that there may
be more variables affecting motivation, learning and development of higher order
thinking skills that cannot be altered than those that can. Demographic, personality
variables and family patterns, for example, may be the strongest predictors ofmotivation and thus higher order thinking skills but lend very little to
manipulation. This is not to say that researching these alterable variables is useless because of their relatively small influence. Rather, as educators, our noble task is
to seek to influence what we can. Based on the findings of this study, it is evident
that a systematic evaluation of correlates and predictors of student motivation and
thus higher order thinking skills at institutions of learning requires multi-method
and multi-measure approaches to the analysis of higher order thinking skills.Although the results of this study may not generalize to other universities, they are
expected to inform us about desired data and methods for a more systematic
approach to correlates and predictors of higher order thinking skills in institutions
of higher learning.Based on the results of this study, faculty who wish to increase the level of
student motivation and higher order thinking skills in their classes should focus on
improving the overall quality of their teaching, be sure to include elements ofcollaborative learning and teacher student relations, and to create a classroom
environment that encourages relationships with other students. Such changes inteaching methods are likely to increase motivation and thus increased emphasis on
higher order thinking skills.Information about how students perceive the quality of teaching and learning,
the effectiveness/enhancement of their own learning, and important elements of the
learning environment can provide a rich base for enhancing the quality of teaching
and learning in higher education settings.
Implications for Research Methodology
This study utilized a structural equation modeling technique which has tremendous
advantages over traditional regression analyses such as: (a) SEM being amultivariate approach and structural/causal relationships are estimated at the level
of latent variables or theoretical constructs rather than on the basis of the observedvariables; (b) SEM procedures differentiate between a measurement model(describing relationships among observed variables and latent factors) and a
structural model (describing interrelationships among theoretical constructs) thus
allowing for a separate estimation of measurement errors in the observablespecification of errors in the structural part of the model; and (c) SEM also
provides an assessment of the degree of fit between the causal model and the data
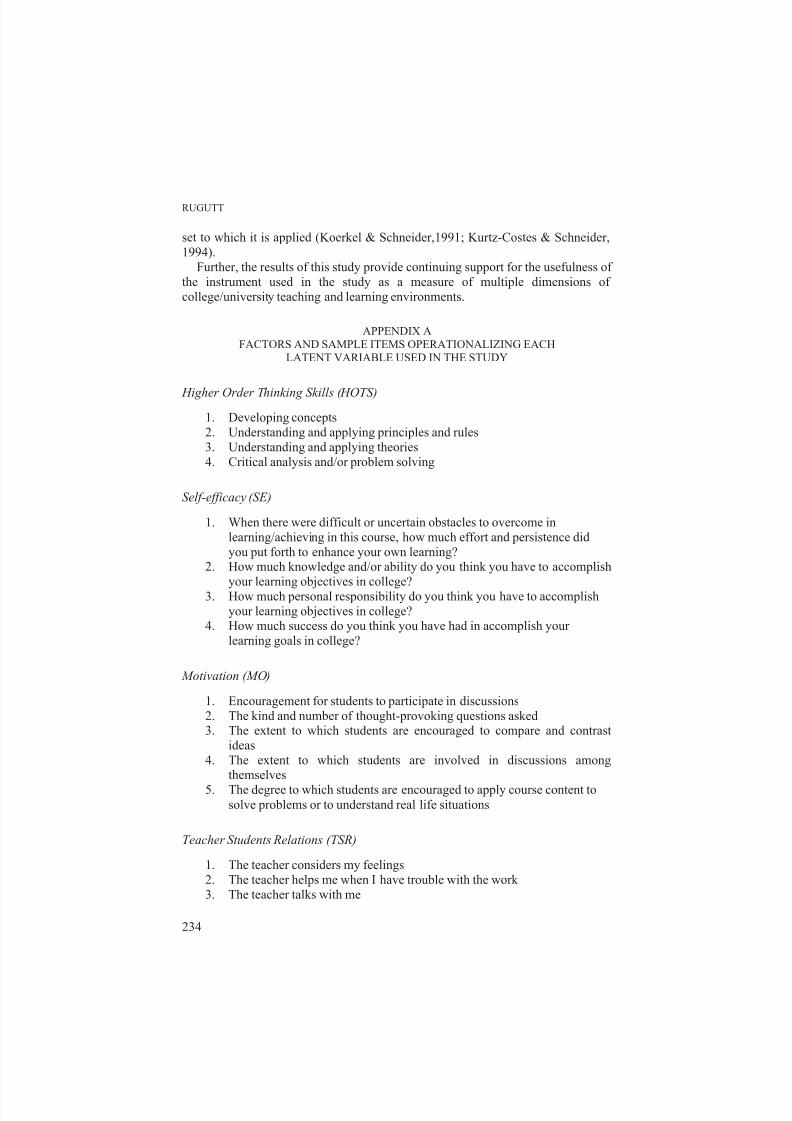
8/18/2019 (Contemporary Approaches to Research
http://slidepdf.com/reader/full/contemporary-approaches-to-research 232/284

8/18/2019 (Contemporary Approaches to Research
http://slidepdf.com/reader/full/contemporary-approaches-to-research 233/284

8/18/2019 (Contemporary Approaches to Research
http://slidepdf.com/reader/full/contemporary-approaches-to-research 234/284
RUGUTT
236
Ellett, A. J. (2000). Human Caring, Self-efficacy Beliefs, and Professional Organizational Culture
Correlates of Employee Retention in Child welfare. Unpublished doctoral dissertation, Louisiana
State University, Baton Rouge.
Ellett, C. D., Culross, R. R., McMullen, J. H., & Rugutt, J. K. (1996). Student Assessment of Teaching
and Learning (SATL) (Short-Form). Baton Rouge, LA: College of Education, Louisiana State
University.
Ellett, C. D., Loup, K. S., Culross, R. R., McMullen, J. H., & Rugutt, J. K. (1997). Assessing
enhancement of learning, personal learning environment, and student efficacy: Alternatives to
traditional faculty evaluation in higher education. Journal of Personnel Evaluation in Education,
11, 167-192.
Ennis, R. (1985, October). A logical basis for measuring critical thinking skills. Educational
Leadership, 43(24), 44-48.
Feldman, K.A. (1988). Effective college teaching from the students’ and faculty view: Matched ormismatched priorities? Research in Higher Education, 28, 291-344.
Feldman, K. A., Ethington, C. A., & Smart, J. C. (2001, Nov./Dec.). A further investigation of major
field and person-environment fit: sociological versus psychological interpretations of Holland's
theory. The Journal of Higher Education (Columbus, Ohio), 72(6), 670-98.
Flowers, C. P., Hancock, D. R., Joyner, R. E. (2000). Effects of instructional strategies and conceptual
levels on students’ motivation and achievement in a technology course. Journal of Research and
Development in Education, 33, 187-194.
Fraser, B., Fisher, D. L., & McRobbie, C.J. (1996). Development, validation and use of personal and
class forms of a new classroom learning environment instrument . Paper presented at the Annual
Meeting of the American Educational Research Association, New York, NY.
Fraser, B. J., Walberg, H. J., Welch, W. W., & Hattie, I. A. (1987). Syntheses of educational
productivity research. International Journal of Educational Research, 11, 145-252.
Fullerton, S. (2002). Student engagement with school: Individual and school-level influences
longitudinal surveys of Australian youth. Research Report No. LSAY-27 (ERIC Document
Reproduction Service No. ED 470 798).Good, T. L., & Brophy, J. E. (1987). Looking in classrooms. New York: Harper & Row.
Hancock, D. R. (2000). Impact on verbal praise on college students’ time spent on homework. The
Journal of Educational Research, 93, 384-389.
Holland, J. L. (1997). Making vocational choices: A theory of vocational personalities and work
environments (3rd ed.). Odessa, FL: Psychological Assessment Resources.
House, J. D. (1995). Cognitive-motivational variables and prior achievement as predictors of grade
performance of academically underprepared students. International Journal of Instructional Media,
22, 293-304.
Institutional Benchmark Report. (2002). National survey of student engagement . Illinois State
University.
Jöreskog, K. G., & Sörbom, D. (1996 ). LISREL 8 User’s Reference Guide. Chicago, IL: Scientific
Software International.
Jöreskog, K. G., & Sörbom, D. (2003). LISREL 8.54. Chicago, IL: Scientific Software International,
Inc.
Kanfer, R., & Ackerman, P. L., (1989). Motivation and cognitive abilities: An integrative/aptitude-
treatment interaction approach to skill acquisition. Journal of Applied Psychology, 74(4), 657-687.
Kaplan, E. J., & Kies, D. A. (1994, March). Strategies to increase critical thinking in the undergraduate
college classroom. College Student Journal, 28(1), 24-31.
Keith, T. Z. (1997). Using confirmatory factor analysis to aid in understanding the constructs measured
by intelligence tests. In D. P. Flanagan, J. L. Genshaft, & P. L. Harrison (Eds.). Contemporary
intellectual assessment: Issues in clinical child psychology (pp. 317-329). New York: Plenum.
Keith, T. Z. (1998). Structural equation modeling in school psychology. In C. R. Reynolds & T. B.
Gutkin (Eds.), The handbook of school psychology (3rd ed., pp. 78-107). New York. Wiley.

8/18/2019 (Contemporary Approaches to Research
http://slidepdf.com/reader/full/contemporary-approaches-to-research 235/284
LINKING TEACHING AND LEARNING ENVIRONMENT VARIABLES
237
Kline, R. B. (2005). Principles and practice of structural equation modeling (2nd ed.). New York: The
Guildford Press.
Koerkel, J., & Schneider, W. (1991). Domain-specific versus metacognitive knowledge effects on text
recall and comprehension. In M. Carretero, M. Rope, R.-J. Simmons, & J. I. Pozo (Eds.), Learning
and Induction (pp. 311-323). Oxford: Pergamon Press.
Kuh, G. D. (2001). Assessing what really matters to student learning: Inside the National Survey of
Student Engagement. Change, 33(3), 10-17, 66.
Kuh, G. D., & Hu, S. (2001). The effects of student-faculty interaction in the 1990s. The Review of
Higher Education, 24, 309-332.
Kurtz-Costes, B. E., & Schneider, W. (1994). Self-concept, attributional beliefs, and school
achievement: A longitudinal analysis. Contemporary Educational Psychology, 19, 199-216.
Lamport, M. A. (1993). Student-faculty informal interactions and the effect on college student
outcomes: A review of the literature. Adolescence, 28(112), 971-990.Loup, K. S. (1994). Measuring and linking school professional learning environment characteristics,
teacher self and organizational efficacy, receptivity to change, and multiple indices of school
effectiveness. Unpublished Doctoral Dissertation, Louisiana State University, Baton Rouge,
Louisiana.
Loup, K. S. (1999). Exploring the role of teachers’ perceptions of self- and organizational efficacies in
enhancement of learning environments for teachers and students in elementary and middle schools.
Paper presented at the annual meeting of the American Educational Research Association, Montreal,
Canada.
Loup, K. S., Clarke, J., Ellett, C. D., & Rugutt, J. (1997, March). Exploring dimensions of personal and
organizational efficacy motivation: A study of teachers, social workers, and university faculty. Paper
presented at the annual meeting of the American Educational Research Association, Chicago,
Illinois.
Loup, K. S., & Ellett, C. D. (1993). The teacher self and organizational efficacy assessment (TSOEA).
Baton Rouge, LA: Louisiana State University.
Marsh, H. W. (1994). Confirmatory factor analysis models of factorial invariance: A multifacetedapproach. Structural Equation Modeling, 1(1), 5-34.
Marsh, H. W., & Balla, J. R. (1994). Goodness of fit in confirmatory factor analysis: The effects of
sample size and model parsimony. Quality and Quantity: International Journal of Methodology, 28,
185-217.
Marsh, H. W., Balla, J. R., & McDonald, R. P. (1988). Goodness-of-fit indices in confirmatory factor
analysis: The effect of sample size. Psychological Bulletin, 103, 391-410.
Marsh, H. W., Balla, J. R., & Hau, K. T. (1996). An evaluation of incremental fit indices: A
clarification of mathematical and empirical processes. In G.A. Marcoulides & R.E. Schumacker
(Eds.), Advanced structural equation modeling techniques (pp. 315-353). Hillsdale, NJ: Erlbaum
Associates.
Mayer, T. (1998). Teaching, technology and talk. The Psychologist , 11, 375-377.
Maruyama, G. M. (1998). Basics of structural equation modeling. Thousand Oaks, CA: Sage.
Nastasi, B. K., & Clements, D. H. (1994). Effectance motivation, perceived scholastic competence, and
higher order thinking in two cooperative computer environments. Journal of Educational
Computing Research, 10(3), 249-275.
Netemeyer, R. G., Bearden, W. O., & Sharma, S. (2003). Scaling procedures: Issues and applications.
Thousand Oaks, CA: Sage.
Noar, S. M. (2003). The role of structural equation modeling in scale development. Structural Equation
Modeling, 10(4), 622-647.
Olivier, D. F. (2001). Teacher personal and school culture characteristics in effective schools: Toward
a model of a professional learning community . Unpublished Doctoral Dissertation, Louisiana State
University, Baton Rouge, Louisiana.
Pace, C. R., & Stern, O. O. (1958). An approach to the measurement of psychological characteristics of
college environments. Journal of Educational Psychology, 49, 269-277.
8/18/2019 (Contemporary Approaches to Research
http://slidepdf.com/reader/full/contemporary-approaches-to-research 236/284
RUGUTT
238
Pascarella, E. T. (1980). Student-faculty informal contact and college outcomes. Review of Educational
Research, 50(4), 545-575.
Pascarella, E. T. (1989). The development of critical thinking: Does college make a difference? Journal
of College Student Development, 30(1), 19-26.
Pascarella, E. T. (2001). Identifying excellence in undergraduate education: Are we even closer?
Change, 33(1), 18-23.
Pascarella, E. T., & Terenzini, P. T. (1976). Informal interaction with faculty and freshman ratings of
academic and non-academic experience of college. Journal of Educational Research, 70, 35-41.
Pascarella, E., & Terenzini, P. (1991). How college affects students. San Francisco, CA: Jossey-Bass.
Pascarella, E. T., Terenzini, P. T., & Hibel, J. (1978). Student-faculty interactional settings and their
relationship to predicted academic performance. Journal of Higher Education, 49(5), 450-463.
Patrick, B. C., Hisley, J., Kempler, T., & College, G. (2000). What’s everybody so excited about?: The
effects of teacher enthusiasm on student intrinsic motivation and vitality. Journal of Experimental Education, 68, 217–237.
Plecha, M. (April, 2002). The impact of motivation, student-peer, and student-faculty interaction on
academic self-confidence. Paper presented at the annual meeting of the American Educational
Research Association (New Orleans, LA, ERIC Document Service No. ED 464149).
Quirk, K. J., Keith, T. Z., & Quirk, J. T. (2002). Employment during high school and student
achievement: Longitudinal analysis of national data. The Journal of Educational Research, 95, 4-9.
Resnick, L. (1987). Education and learning to think . Washington, DC: National Academic Press.
Rugutt, J. K., Ellett, C. D., & Culross, R. (2003). Discriminating student learning and efficacy levels in
higher education: Contributions of classroom environment and teaching and learning effectiveness.
Planning and Changing , 34(3 & 4), 229-249.
Rugutt, J. K., & Chemosit, C. C. (2005). A study of factors that influence college academic
achievement: A structural equation modeling approach. Journal of Educational Research & Policy
Studies, 5(1), 66-90.
Rugutt, J. K., & Chemosit, C. C. (2009). What motivate students to learn? Contribution of student-to-
student relations, student-faculty interaction and critical thinking skills. Educational ResearchQuarterly, 32(3), 16-28.
Schumacker, R. E., & Lomax, R. G. (1996). A beginner’s guide to structural equation modeling .
Mahwah, NJ: L. Erlbaum Associates.
Schunk, D. H. (1985, April). Self-efficacy and classroom learning. Psychology in the Schools, 22(2),
208-223.
Singh, R., & Singh, P. (1994). Prediction of performance using motivation and ability information: New
light on integrational capacity and weighting strategies. Cognitive Development, 9, 455-496.
SPSS Inc. (1990). SPSS users guide. Chicago: SPSS Inc.
Stern, O. O. (1970). People in context: Measuring person-environment congruence in education and
industry. New York: Wiley.
Tavani, C. M., & Losh, S. C. (2003). Motivation, self-confidence, and expectations as predictors of the
academic performances among our high school students. Child Study Journal , 27, 95-109.
Terenzini, T. P., & Pascarella, T. E. (1994). Living with myths: Undergraduate education in America.
Change, 26 (1), 28-32.
Tinto, V. (1987). Leaving college: Rethinking the causes and cures of student attrition. Chicago: The
University of Chicago Press.
Tinto, V. (1993). Leaving college: Rethinking the causes and cures of student attrition (2nd ed.).
Chicago: University of Chicago Press.
Vogt, W. P. (2007). Quantitative research methods for professionals. New York: Allyn & Bacon.
Ward, M. & Newlands, D. (1998). Use of the Web in undergraduate teaching. Computers and
Education 31, 171-184.
Wilson, R. C., Gaff, J. G., Dienst, E. R., Wood, L., & Bavry, J. L. (1975). College professors and their
impact on students. New York: John Wiley and Sons.

8/18/2019 (Contemporary Approaches to Research
http://slidepdf.com/reader/full/contemporary-approaches-to-research 237/284
LINKING TEACHING AND LEARNING ENVIRONMENT VARIABLES
239
Woodside, B. M. (1999). The effects of student academic achievements and self concept. Education
(Chula Vista, California), 119(4), 730-733.
John K. Rugutt
Illinois State University, USA

8/18/2019 (Contemporary Approaches to Research
http://slidepdf.com/reader/full/contemporary-approaches-to-research 238/284
M.S. Khine (ed.), Application of Structural Equation Modeling in Educational Research and
Practice, 241–255.
© 2013 Sense Publishers. All rights reserved.
BINOD SUNDARARAJAN, LORN SHEEHAN,
MALAVIKA SUNDARARAJAN AND JILL MANDERSON
11. INFLUENCING GROUP DECISIONS BY GAINING
RESPECT OF GROUP MEMBERS IN E-LEARNING
AND BLENDED LEARNING ENVIRONMENTS:
A PATH MODEL ANALYSIS
INTRODUCTION
Computer-mediated communication (CMC), consisting of highly interactive
communication tools, including electronic mail, electronic bulletin boards,asynchronous multimedia notebooks, remote screen-sharing, and desktop video
teleconferencing, is becoming increasingly common in modern classrooms, in
addition to face-to-face time between the instructor and the students. However itmust be added here that the increase in the use of these CMC tools has been more
to facilitate online learning for distance students, and in-class instruction still
follows the traditional methods with a combination of face-to-face instruction andthe use of CMC tools in student group projects. Synchronous interaction between
remote participants in distributed learning environments has long been supported
by audio and video teleconferencing via satellite and chat tools as well as thetraditional telephone call. Developments in recent years have brought about the
convergence of these channels of communication into a singular applicationinterface allowing multipoint conferencing over the Internet – a virtual classroom.
More recently texting has emerged as a medium of choice among students and the
use of texting to facilitate knowledge transfer is currently being undertaken byseveral researchers.
Many university classes use Learning Management Systems (LMS) like
Blackboard, BBLearn, and Moodle, etc., to post topics on the discussion boards, post grades and manage student projects. The use of these discussion boards allows
students to discuss topics related to the material they are learning in class, allows
them to interact with one another and the instructor asynchronously and also post,
view and if required rate group projects. This allows for a certain level of peer
involvement and assessment. Students’ participation in discussion board threads
allows for greater interaction in their instant messenger and email interactions, asthey have had a chance to read and assess their classmates’ contributions as they
progress through the course. As predicted by Fishman (1995), such technologies
have become more integrated into education, and, therefore, it is important tounderstand student learning, behaviors and attitudes towards the use of these
communication technologies. The last couple of years have seen an increase in the
8/18/2019 (Contemporary Approaches to Research
http://slidepdf.com/reader/full/contemporary-approaches-to-research 239/284
SUNDARARAJAN ET AL.
242
use of social media sites like Facebook and Twitter for classroom activities,
discussions and knowledge transfer. All in an effort to have the student/learner
engaged and involved in the learning process as they interact with peers and
instructors to achieve knowledge gains and other learning outcomes.
While Picciano (2002) raises questions regarding the nature and extent of theseinteractions and their effects on student performance, he reiterates that much of the
research is based on student perceptions of the quality and quantity of their
interactions and how much they have learned in an online course. In his study,
Picciano (2002) examines performance in an online course in relationship tostudent interaction and sense of presence in the course and makes an attempt to go
beyond typical institutional performance measures such as grades and withdrawalrates and to examine measures specifically related to course objectives. He found
that though there was support for a strong relationship between students’
perceptions and perceived learning, the relationship of actual measures of
interaction and performance is mixed and inconsistent depending upon the
measures and requires further study.In our paper we present a hypotheses model about the communication medium
in group discussions and that plays role in group members gaining respect from
group members and influence in group decision making. The model further tracks
the impact of how students motivated by the respect and influence, increase their participation in group interactions and the potential impact on their ability to make
friends, collaborate and their perceptions of whether group members gained
knowledge. We have analyzed the model using data collected over three time periods 2005-06 in a completely e-learning environment, in 2009-11 in a
traditional classroom environment and in 2011-12 in a blended learningenvironment.
REVIEW OF LITERATURE
Many believe that online learning is the ‘magic’ answer to the pressure of growingenrolments, decreasing income, demands by students for more flexibility, along
with the explosion in knowledge created in part by the communications revolution
(Land, 2002; Race, 1998). The Internet brought with it opportunities for newcommunication media and tools and increasingly this has affected the way in
which online and traditional courses have been developed, structured and
delivered. Designers of online environments and CSCL systems have striven to
make online learning more interactive through the use of tools for instructor-
student and student-student interaction using both synchronous (instant messenger)and asynchronous (electronic discussion boards) communication. So the modern
versions of the Learning Management Systems like BBLearn, Desire2Learn and
others have tried to incorporate many features that facilitate these interactions.
CSCL was founded based on the idea that classrooms could be structured on themodel of professional communities of practice that interactively and
collaboratively built knowledge, such as scientific theories (Scardamalia &Bereiter, 1996). Following the principles of Vygotsky (1930/1978), knowledge

8/18/2019 (Contemporary Approaches to Research
http://slidepdf.com/reader/full/contemporary-approaches-to-research 240/284
INFLUENCING GROUP DECISIONS
243
was seen to be generally constructed socially in interactions among people before
it was internalized as individual knowing. This social aspect was further developed
into activity theory by Vygotsky’s followers, emphasizing that individual cognition
is mediated by physical and symbolic artifacts and that it centrally involves socio-
cultural aspects. We extend that to include social dynamics factors of respect andinfluence in groups or communities. The socio-cultural aspects that arise as a result
of social interactions among members of a group of students in a CSCL or blended
learning environment form the basis of these social dynamics factors explained
later on in the paper. An understanding of these factors will provide insight into thedesign of courses and systems to support collaborative learning and the
development of respect, influence and teamwork in student teams.Some researchers report that university students in online courses or in
traditional face-to-face courses that include an online component appear to have
found the online environment valuable for their learning (Ciba & Rakestraw, 1998;
Morss & Fleming, 1998). Other researchers report that interactive online only
courses allow for democratic participation (Schallert et al., 1999), and also that allclass members have equal access to the floor (Bump, 1990; Hiltz, 1986). However,
Hübscher-Younger & Narayanan (2003) have argued that power and authority
have to be granted, and in the classroom the students hold the ability to grant
authority, while the institutional status of an instructor gives some initial authority,students must consent and comply with the teacher’s plans for her to have
authority.
So democratization in the classroom and the shared power relationship need notalways result in all participants getting equal access to the floor. Also,
asynchronous discussions are not limited by ‘real time’, and allow each participantto contribute as much as she/he wishes to the group discussions. Again, Hübscher-
Younger and Narayanan (2003), observe that despite the progressive teachingmethodologies and CMC tools, the students still place authority with the teacher
through valuing the teacher’s opinions and approval and these student perceptions
play a part in how the students view themselves and other members of their work
groups for class projects, as well as how these groups perform and learn.Yildiz and Chang (2003) found that the quality of feedback from peers and
instructor in web-based courses was superior to that of face-to-face courses and
onsite instructors should consider incorporating web-based asynchronousdiscussion to their face-to-face classroom. They recommend that researchers
should examine how the quantity, quality or immediacy of feedback or response
from peers or the instructor in web-based courses might differ in relation to these
components (participation, grades, technology and course content) and to whatextent they differ. Powers and Mitchell (1997) showed that a true community of
learners can be developed in a web-based course despite the differences in their
patterns of communication and interaction. They found that as regards to students’
perceptions and performance, peer support, student-to-student interaction, faculty-student interaction and time demands were important themes and the unique nature
of the technology and relative anonymity was perceived as one possible reason for
community building.

8/18/2019 (Contemporary Approaches to Research
http://slidepdf.com/reader/full/contemporary-approaches-to-research 241/284
SUNDARARAJAN ET AL.
244
While contemplating the physical separation of the learner and the instructor,
Moore (1993), believed that this separation contributes to “psychological and
communication gap” and he proposed and the developed “the theory of
transactional distance”, emphasizing the effect of distance on teaching as well as
learning behaviors, forms of interaction, communication, instruction, andcurriculum. He identified three components of distance education: dialogue,
structure, and autonomy, where dialogue refers to the interaction via actions,
words, or ideas between the instructor and learner or among learners. The nature
and extent of dialogue depends on the course design, subject matter, medium ofcommunication, personalities of instructor, learning styles of learners, and size of
the class. Moore speculated that when everything else is controlled, chances areinteraction between instructor and learners in a small class will be more frequent
than in a large class (Moore & Kearsley, 1996). Moore (1993) further proposed
that when similar media are used, graduate courses in social sciences and education
tend to be more interactive with project work than those in sciences and
mathematics that demand teacher direction.Moore suggested that structure is determined by the educational philosophy of
instructor, academic level of the learners, course content, as well as
communication media (Moore & Kearsley, 1996). While autonomy on the other
hand, is the extent to which learners have control over learning objectives,implementation procedures, resource, and evaluation (Moore, 1990, p. 13), with
the belief that learners are capable of making decisions for their learning. Moore
hypothesized the tendency that “the greater the structure and the lower the dialoguein a program the more autonomy the learner has to exercise” (Moore, 1993, p. 27).
In the case of blended learning environments, where students are co-located andgroups are formed either by self-selection or by instructor assignment, the
autonomy rests within the group in the decisions they make towards any group project objectives. The structures within groups, regardless of whether they are in
distance or co-located, mediated or non-mediated environments, are formed based
on task allocation, group member experience or expertise and emergent network
positions (Sundararajan, 2010) and any autonomy is often gained based purely on performance. In groups where members are new to one another, each has to earn
their credibility and respect by dint of their performance on allocated tasks, their
contribution towards the group project and their ownership of each other’slearning.
We thus see that a CSCL or a blended learning environment would have to take
into account interactions among many people, mediated by various artifacts, and
cater to the learning objectives of individuals and groups that will interact in thisenvironment. The CMC/CSCL environment will provide some of the early
mediating artifacts. The technology will likely introduce physical constraints by
being impersonal, slow, confusing and at times not working at all, yet requiring
that students use them. So students must first learn how to use the tools providedin the learning environment, get comfortable with them and the accompanying
artifacts and then begin the learning process. These constraints are equally
applicable to the instructor.

8/18/2019 (Contemporary Approaches to Research
http://slidepdf.com/reader/full/contemporary-approaches-to-research 242/284
INFLUENCING GROUP DECISIONS
245
The goals of the group (or students in the class) activity (performance, rewards),
its constraints (materials, time), its medium (computer support, meetings), its
division of labor (group selection, mix of skills) and its social practices
(homework, native language) are given by the larger community beyond the group
or class itself (Stahl, 2004). The individual, group and community all develop newskills and structures through the influence of one unit upon the other; none is fixed
or independent of the others; learning takes place at each unit and between them
(Stahl, 2004). So CSCL and blended learning environment communication can be
thought of as a mediated discourse, involving the knowledge of the language,symbols, metaphors, and shared meaning. The language, usually the medium of
instruction, will take the shape of the course the instructor has developed, while thesymbols, in face-to-face and mediated interactions will revolve around socially
constructed and accepted norms of cooperation, ‘espirit de corps’, standards of
behavior (online and offline) and a common goal of learning the subject matter.
And collaborative discourse is situated in the shared understanding of the group
members, which in turn is historically, socially, culturally situated (Stahl, 2004).Johnson, Johnson and Holubec (1998) have suggested that students in work
groups or a class environment tend to assign themselves according to four types of
skills: forming skills, functioning skills, formulating skills, and fermenting skills.
The student with forming skills will be the one to monitor turn-taking in thegroup. The roles for the group member with functioning skills will be to record the
discussion, encourage all to participate, clarify/paraphrase the group discussion,
and work to seek a group consensus. Formulating skills require a student togenerate discussion and to summarize the group’s work. Finally, the student with
the fermenting role works to ask for justification of the group’s outcome and alsohelps to give a rationale for the group’s activities. In network terms, these roles can
be assigned to each actor (student) or they earn these roles based on their pastrecord and performance in other group or class activities.
Cho, Stefanone and Gay (2002) in their paper, ‘Social Network Analysis of
Information Sharing Networks in a CSCL Community’, clarify important features
of social network analysis for analyzing community-based activities in a CSCLsetting. They employed the theoretical and methodological background of
social/communication network analysis to identify and understand students’
communication and interaction patterns when collaborating through wirelesscomputer networking tools. Their findings show that social influences, in the form
of network prestige effects, strongly affected the likelihood and the extent to which
information posted in the CSCL environment was shared by peers in this learning
community. Thus participation in the group/class effort was validated by their peers and increased the network prestige efforts of the participants, motivating
them to continue participating and collaborating.
It is difficult to assess the quality of learning in Computer-Supported
Collaborative Learning (CSCL) or other blended learning environments, becausestandard pretest and posttest measures do not capture the differences in the
learner’s ability to engage in the material, pose interesting new questions, engage
others in learning and work collaboratively. The above discussion makes the case

8/18/2019 (Contemporary Approaches to Research
http://slidepdf.com/reader/full/contemporary-approaches-to-research 243/284
SUNDARARAJAN ET AL.
246
for looking closely at social dynamics factors like respect and influence and other
prestige effects as a useful set of factors to study students’ interaction and
participation in CSCL and blended learning environments and how they help thestudents in their learning processes and their possible impact on group learning
outcomes. The aim of this research paper is to come up with stable measurements
that can be replicated and serve as a guide to improved and more student-centered
designs of mediated learning systems. We can now proceed to discuss the
hypotheses model and explain in some detail the data collection procedures and the
analyses that have been performed in this study.
RESEARCH HYPOTHESES
Respect and influence play a role in the formation of ‘well-'oiled’ group dynamicswith communication and network factors leading to cohesion within the group and
aiding in the formation of the above social factors leading to ‘learning’. Lobel,
Neubauer and Swedburg, (2005) explore how collaboration and interactivity areaffected in the context of online learning by differences in what media allow in
terms of turn taking. Haythornewaite (2005) states that research on computer-
mediated collaborative practices show the interactions among the evolution of practice, the exchange of knowledge, and the use of computer media. As the guest
editor of the Journal of Computer Mediated Communication’s special theme issue
on ‘Computer-Mediated Collaborative Practices, Haythornewaite (2005) explainsthat each article in the issue, highlights the various facets of computer-mediated
collaboration, i.e., the work of learning how to collaborate via computer media and
evolve shared work and communication practices around and through informationand communication technologies. She suggests that future work should extend and
continue the evolution of computer-mediated collaborative practices, providingmore cases on the interaction of people, practice and technology, extending the
principles that underpin this kind of interaction, and demonstrating the impact of
these practices through new approaches to measuring, collecting and
communicating data on distributed practices. With this in mind, we propose thefollowing sets of hypotheses. Figure 1 depicts the hypotheses in a schematic, while
the adjacent column provides an explanation of the variables used in the model.
It is true that anyone can flood inboxes with emails, or the bulletin board with
posts, or even make irrelevant remarks during an instant messenger conversation orsend hundreds of text messages. However, only if the content of these emails,
posts, text or chat responses are relevant to the topics under discussion, will they
be received well. It is expected that everyone in the collaborative is reading theemails, message posts, chat or text exchanges, and being asynchronous in nature,these media allow participants to think about the content of the messages and
respond in leisure. If the messages are more pertinent and helpful to the topics
under discussion, the senders of these messages are viewed in a better light by thereaders and will rise in the esteem of others in the collaborative environment. This
then will motivate them to interact, participate, contribute and collaborate in
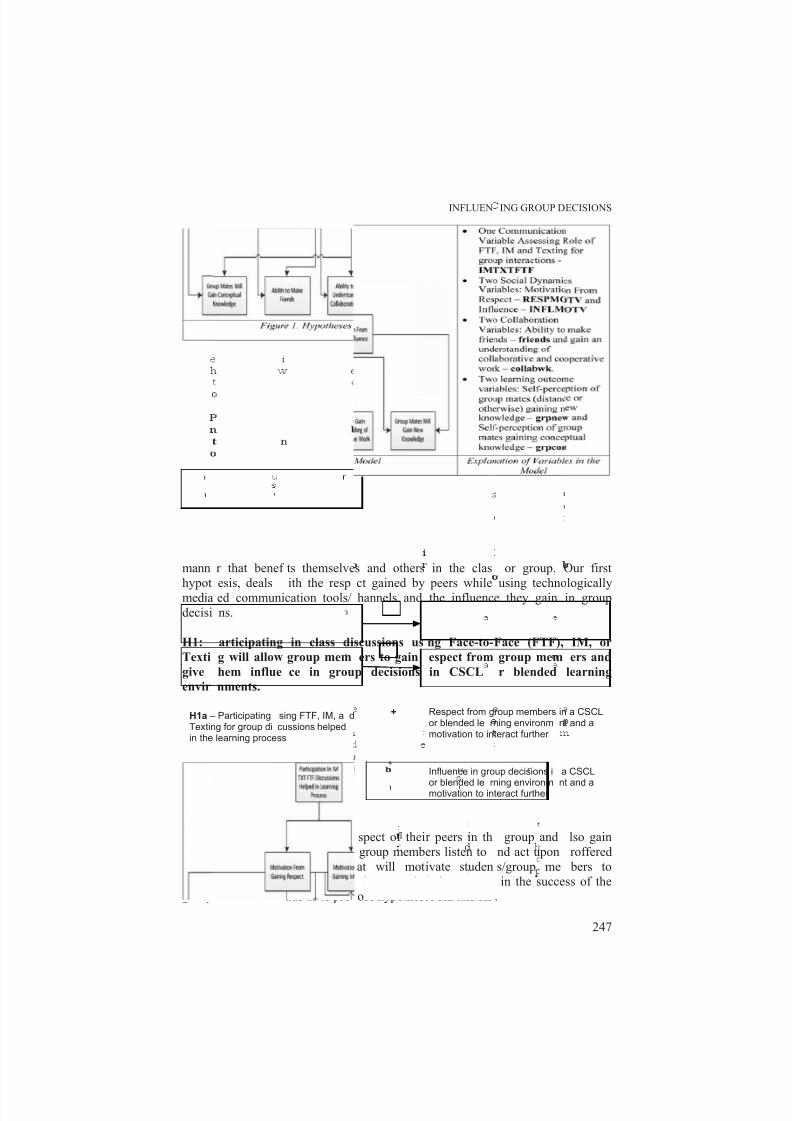
8/18/2019 (Contemporary Approaches to Research
http://slidepdf.com/reader/full/contemporary-approaches-to-research 244/284
mann
hypotmedia
decisi
H1:
Texti
give
envir
Wh
influe
task/p
partici
group
H1a
Texin th
H1
Texin th
r that benef
esis, dealsed communi
ns.
articipating
g will allow
hem influe
nments.
en group me
ce in group
oject relate
pate and inte
effort. This le
– Participatingting for group die learning proce
– Participating
ting for group die learning proce
ts themselve
ith the respcation tools/
in class di
group mem
ce in grou
mbers gain r
decisions, i.e.
options, t
ract more an
ads us to pro
sing FTF, IM, acussions helpedss
sing FTF, IM, a
cussions helpedss
s and others
ct gained byhannels and
scussions us
ers to gain
p decisions
spect of thei
group memb
at will mot
increase th
ose hypothes
d +
d+
INFLUEN
in the clas
peers whilethe influenc
ng Face-to-
espect from
in CSCL
r peers in th
ers listen to
ivate studen
ir investment
es H2 and H3
Respect fromor blended lemotivation to
Influence in g
or blended lemotivation to
ING GROUP D
or group.
using technoe they gain
Face (FTF),
group mem
r blended
group and
nd act upon
s/group me
in the succe
.
group membersrning environm
interact further
roup decisions i
rning environminteract further
ECISIONS
247
Our first
logicallyin group
IM, or
ers and
learning
lso gain
roffered
bers to
ss of the
in a CSCLnt and a
a CSCL
nt and a

8/18/2019 (Contemporary Approaches to Research
http://slidepdf.com/reader/full/contemporary-approaches-to-research 245/284
SUNDARARAJAN ET AL.
248
H2: Motivation to interact and participate in mediated group discussions,
gained from perceived respect from peers in a computer-supported
collaborative learning (CSCL) or blended learning environment will positively
impact the students’ abilities to make friends, gain an understanding of
collaborative and cooperative work, and perceive that group members gained
new and conceptual knowledge.
H3: Motivation to interact and participate in mediated group discussions,
gained perceiving influence in group decisions among students in a computer-supported collaborative learning (CSCL) or blended learning environment
will positively impact the students’ abilities to make friends, gain an
understanding of collaborative and cooperative work, and perceive that group
members gained new and conceptual knowledge.
H3 – Motivation to interact andparticipate in online discussions,gained from perceiving influence ingroup decisions
Ability to make friends, gain anunderstanding of collaborative andcooperative work, perceive groupmembers gained new andconceptual knowledge
+
H3a - INFLMOTV
H3b - INFLMOTV
H3c - INFLMOTV
H3d - INFLMOTV
Ability to make friends,Gain an understanding of collaborative and
cooperative workPerceive group members gained conceptualknowledgePerceive group members gained new knowledge+
H2 – Motivation to interact andparticipate in online discussions,gained from perceiving respect frompeers
Ability to make friends, gain anunderstanding of collaborative andcooperative work, perceive groupmembers gained new and
conceptual knowledge
+
H2a - RESPMOTV
H2b - RESPMOTV
H2c - RESPMOTV
H2d - RESPMOTV
Ability to make friends,Gain an understanding of collaborative andcooperative workPerceive group members gained conceptualknowledgePerceive group members gained new knowledge
+

8/18/2019 (Contemporary Approaches to Research
http://slidepdf.com/reader/full/contemporary-approaches-to-research 246/284
INFLUENCING GROUP DECISIONS
249
METHODOLOGY – DATA COLLECTION AND SAMPLE
We present the results of analysis of data collected over three time periods. The
first set of data was collected from eight courses over the period of three semesters,
summer 2005, fall 2005 and spring 2006 at a university in the Northeastern USA.
These courses were Global Marketing & Product Management (GMPM) in the
summer of 2005, Foundations of HCI Usability (FHCI), Communication Designfor the WWW (CDW) and Proposing and Persuading in the fall semester of 2005.
Data from the following courses, IT and Decision Systems Capstone (ETC), Studio
Design in HCI (SD), International Business (IB) and Theory and Research inTechnical Communication (TCTR) was collected in the spring of 2006. However,
despite repeated attempts to remind students to participate, very few actually didand we ended up with only 60 completed responses out of a possible 250 over allthe courses. Out of the 60, we rejected 8 because they were duplicates and 3 more
as the surveys were less than 60% complete. The final N was 49. Student groups
consisted of 3-5 members. There was a mix of both distance students and in-class
students all of whom used the Elluminate CSCL system.
The second data set was collected in two universities, one in Canada and one in
the Southeastern US. The courses ranged from Business Communication toStrategy, Entrepreneurship and International Business. The initial N was expected
to be over 250, however, we rejected several because they were either incomplete
or had 5’s or 3’s or 1’s as responses to the questions. The final N was 122. Thisdata was part of an assessment study that involved group work and much of the
group work involved face-to-face meetings and discussions, with email or texting
only being used to set up meetings or exchange information or documents. Studentgroups consisted of 4-6 members. Students also had access to the Blackboard
Learning Management System.
The third data set was part of a study in which we investigated the efficacy of
texting and IM as a discussion medium in higher education classrooms. We
conducted six rounds of testing in a special lab/classroom equipped withaudio/video capabilities and also captured IM and text conversations. The courses
taught were Tourism and Leisure Management and Corporate Communication and
were conducted as compressed five-day courses. The final N was 77. Studentswere given a traditional lecture for an hour and twenty minutes and the lecture was
followed by students discussing lecture related questions for about 30 minutes.
They were then administered a survey on technology efficacy and learningoutcomes. Students were divided into groups of 3-6. The study was conducted at a
university in Canada. Student had access to material and collaborative tools in the
campus LMS BBLearn.
All participants (across all three studies) answered several questions on a final
end-of-study survey. While each of the studies had a different motivation, there
were sixteen items that were common to all three studies. These sixteen items pertained to use of a communication medium (face-to-face, instant messenger,
texting, email and electronic bulletin boards) for class discussions, social dynamicsfactors like respect from group members and influence in group decisions,
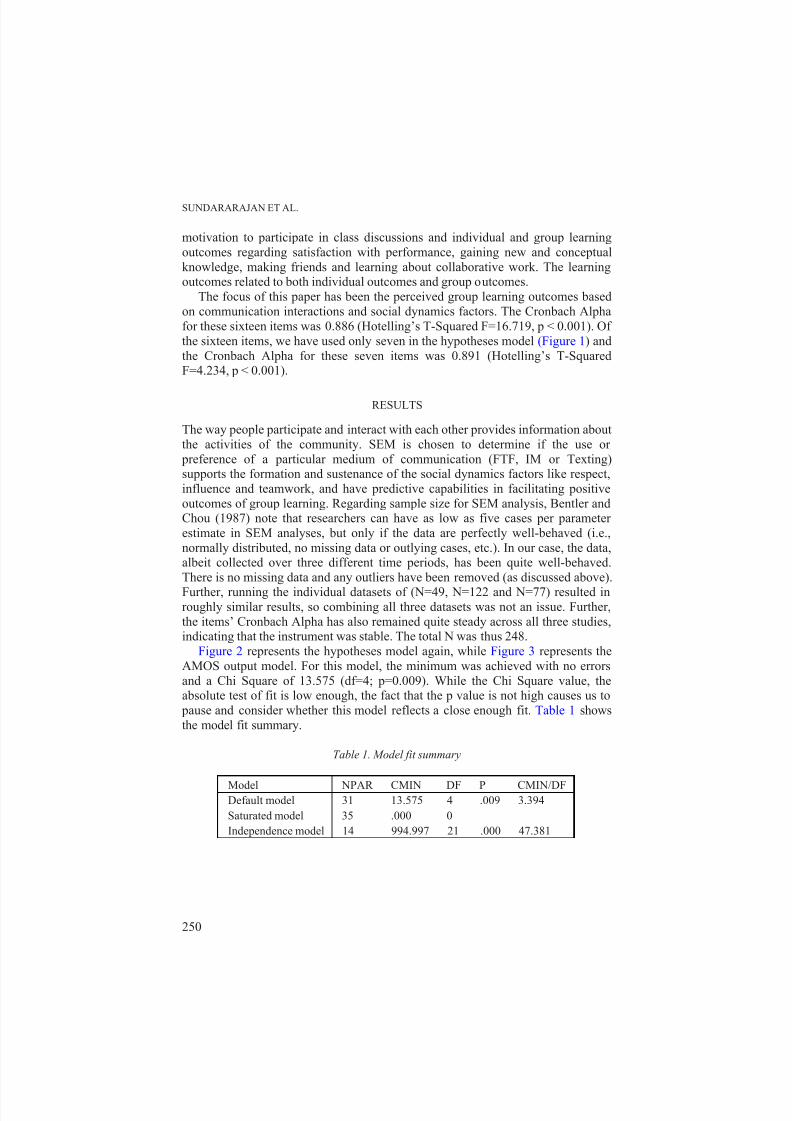
8/18/2019 (Contemporary Approaches to Research
http://slidepdf.com/reader/full/contemporary-approaches-to-research 247/284
SUNDARARAJAN ET AL.
250
motivation to participate in class discussions and individual and group learning
outcomes regarding satisfaction with performance, gaining new and conceptual
knowledge, making friends and learning about collaborative work. The learningoutcomes related to both individual outcomes and group outcomes.
The focus of this paper has been the perceived group learning outcomes based
on communication interactions and social dynamics factors. The Cronbach Alpha
for these sixteen items was 0.886 (Hotelling’s T-Squared F=16.719, p < 0.001). Of
the sixteen items, we have used only seven in the hypotheses model (Figure 1) and
the Cronbach Alpha for these seven items was 0.891 (Hotelling’s T-SquaredF=4.234, p < 0.001).
RESULTS
The way people participate and interact with each other provides information about
the activities of the community. SEM is chosen to determine if the use or
preference of a particular medium of communication (FTF, IM or Texting)supports the formation and sustenance of the social dynamics factors like respect,
influence and teamwork, and have predictive capabilities in facilitating positive
outcomes of group learning. Regarding sample size for SEM analysis, Bentler andChou (1987) note that researchers can have as low as five cases per parameter
estimate in SEM analyses, but only if the data are perfectly well-behaved (i.e.,
normally distributed, no missing data or outlying cases, etc.). In our case, the data,albeit collected over three different time periods, has been quite well-behaved.
There is no missing data and any outliers have been removed (as discussed above).
Further, running the individual datasets of (N=49, N=122 and N=77) resulted inroughly similar results, so combining all three datasets was not an issue. Further,
the items’ Cronbach Alpha has also remained quite steady across all three studies,indicating that the instrument was stable. The total N was thus 248.
Figure 2 represents the hypotheses model again, while Figure 3 represents the
AMOS output model. For this model, the minimum was achieved with no errors
and a Chi Square of 13.575 (df=4; p=0.009). While the Chi Square value, theabsolute test of fit is low enough, the fact that the p value is not high causes us to
pause and consider whether this model reflects a close enough fit. Table 1 shows
the model fit summary.
Table 1. Model fit summary
Model NPAR CMIN DF P CMIN/DFDefault model 31 13.575 4 .009 3.394
Saturated model 35 .000 0
Independence model 14 994.997 21 .000 47.381

8/18/2019 (Contemporary Approaches to Research
http://slidepdf.com/reader/full/contemporary-approaches-to-research 248/284
Figu
Figure
e 2. Hypothese
3. AMOS Out
INFLUEN
s Model
ut Model
ING GROUP D
ECISIONS
251
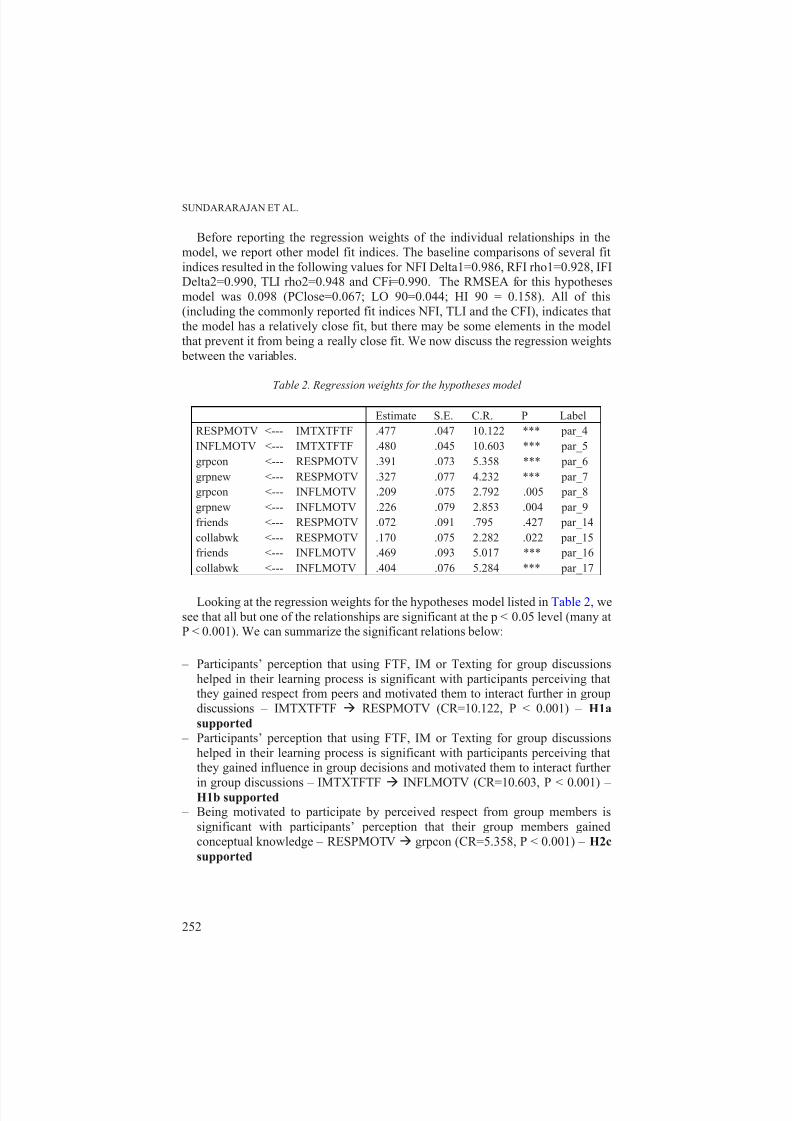
8/18/2019 (Contemporary Approaches to Research
http://slidepdf.com/reader/full/contemporary-approaches-to-research 249/284
SUNDARARAJAN ET AL.
252
Before reporting the regression weights of the individual relationships in the
model, we report other model fit indices. The baseline comparisons of several fit
indices resulted in the following values for NFI Delta1=0.986, RFI rho1=0.928, IFIDelta2=0.990, TLI rho2=0.948 and CFi=0.990. The RMSEA for this hypotheses
model was 0.098 (PClose=0.067; LO 90=0.044; HI 90 = 0.158). All of this
(including the commonly reported fit indices NFI, TLI and the CFI), indicates that
the model has a relatively close fit, but there may be some elements in the model
that prevent it from being a really close fit. We now discuss the regression weights
between the variables.
Table 2. Regression weights for the hypotheses model
Estimate S.E. C.R. P Label
RESPMOTV <--- IMTXTFTF .477 .047 10.122 *** par_4
INFLMOTV <--- IMTXTFTF .480 .045 10.603 *** par_5
grpcon <--- RESPMOTV .391 .073 5.358 *** par_6
grpnew <--- RESPMOTV .327 .077 4.232 *** par_7
grpcon <--- INFLMOTV .209 .075 2.792 .005 par_8
grpnew <--- INFLMOTV .226 .079 2.853 .004 par_9
friends <--- RESPMOTV .072 .091 .795 .427 par_14
collabwk <--- RESPMOTV .170 .075 2.282 .022 par_15
friends <--- INFLMOTV .469 .093 5.017 *** par_16
collabwk <--- INFLMOTV .404 .076 5.284 *** par_17
Looking at the regression weights for the hypotheses model listed in Table 2, we
see that all but one of the relationships are significant at the p < 0.05 level (many atP < 0.001). We can summarize the significant relations below:
– Participants’ perception that using FTF, IM or Texting for group discussions
helped in their learning process is significant with participants perceiving thatthey gained respect from peers and motivated them to interact further in group
discussions – IMTXTFTF RESPMOTV (CR=10.122, P < 0.001) – H1a
supported – Participants’ perception that using FTF, IM or Texting for group discussions
helped in their learning process is significant with participants perceiving thatthey gained influence in group decisions and motivated them to interact further
in group discussions – IMTXTFTF INFLMOTV (CR=10.603, P < 0.001) –H1b supported
– Being motivated to participate by perceived respect from group members is
significant with participants’ perception that their group members gained
conceptual knowledge – RESPMOTV grpcon (CR=5.358, P < 0.001) – H2c
supported

8/18/2019 (Contemporary Approaches to Research
http://slidepdf.com/reader/full/contemporary-approaches-to-research 250/284
INFLUENCING GROUP DECISIONS
253
– Being motivated to participate by perceived respect from group members is
significant with participants’ perception that their group members gained new
knowledge – RESPMOTV grpnew (CR=4.232, P < 0.001) – H2d supported
– Being motivated to participate by perceived influence in group decisions is
significant with participants’ perception that their group members gainedconceptual knowledge – INFLMOTV grpcon (CR=2.792, P = 0.005) – H3c
supported – Being motivated to participate by perceived influence in group decisions is
significant with participants’ perception that their group members gained newknowledge – INFLMOTV grpnew (CR=2.853, P = 0.004) – H3d supported
– Being motivated to participate by perceived respect from group members issignificant with participants gaining an understanding of collaborative and
cooperative work – RESPMOTV collabwk (CR=2.282, P = 0.028) – H2b
supported – Being motivated to participate by perceived influence in group decisions is
significant with participants ability to make friends – INFLMOTV friends(CR=5.017, P = 0.005) – H3a supported
– Being motivated to participate by perceived influence in group decisions is
significant with participants gaining an understanding of collaborative and
cooperative work – INFLMOTV collabwk (CR=5.284, P = 0.004) – H3b
supported
We see that all the hypotheses, except H2a are supported. So while the results ofthe Chi-square test, CMIN value and RMSEA values indicate that the model fits
the data acceptably, the individual parameter results are significant barring one
relationship. The operationalizations of the concepts appear to be stable and they
appear to be measuring what we set out to measure.
CONCLUSIONS, SUMMARY AND FUTURE DIRECTIONS
One of the goals of this study was to look at CMC-supported collaborative learningand blended learning and attempt to identify some of the underlying factors that
improve the learning and collaboration. Respect as a social factor is important to
people in order to validate themselves and the skills they bring to the table incollaborative work situations. Influence in a group and among class members and
motivation to actively collaborate and not be a free rider, follow from the respect
that the individual gets from group/class members. This respect may be there as a
result of past achievements or may be earned by the individual during the course ofcollaboration. In either case, since respect and its companion, influence in a group,
have emerged as important dimensions in collaboration among members in
group/class project work, one can make a case for designing learning and
collaborative systems which incorporate this need for validation.Also, designing computer-mediated communication classrooms (CMCCs) in
ways that promote more communication among group members through these
methods is important, because student members that are typically shy or have

8/18/2019 (Contemporary Approaches to Research
http://slidepdf.com/reader/full/contemporary-approaches-to-research 251/284
SUNDARARAJAN ET AL.
254
language barriers avoid the communication methods most effective for building
good social dynamics, even though there is a more urgent need for it. Such
improvement in the class work environments can lead to better usage of the CMCtools, leading to better network structures among groups, better social interactions
among group members and more successful outcomes in class efforts.
CSCL systems for supporting effective communication for building respect,
influence and teamwork for collaborative learning could consider the following
recommendations. They can have tools to validate the quality of the contribution to
the work, for instance a tool that would prompt group/class members to send both avisual validation for work done, such as an emoticon, or textual feedback to their
group members. This would be helpful in preventing situations in which members,who are contributing, don’t feel valued and might feel like the payback for
contributing in the work doesn’t meet the cost.
A collaboration tool, especially if it is to be used by class/group members whodo not have a history socially or in the workplace, should promote more ‘intimate’,
spontaneous conversation. A lot of time is spent by groups in scheduling meetings
and getting to know each other’s schedule using email. Tools to support thesharing and setting of group calendars would help solve some of these problems
and lead to an optimum level of group cohesion thereby facilitating collaboration
and innovation. However, a lot of informal conversation surrounds the planning prior to collaboration that helps students get to know one another. They learn the
other students’ interests and responsibilities through just setting a meeting date and
learning the others’ day-to-day activities.Tools to support group member learning outcomes where they can check of
learning objectives and track each other’s progress will also be a welcome additionto the CSCL or blended learning environments. Additionally, tools in these
environments should also be inclusive, allowing people with all abilities andcapabilities to participate and be heard. A rating meter to vote on suggestions, done
anonymously, can also enhance group learning outcomes. Thus peer support
becomes an integral part of the decision-making and the learning processes.
REFERENCES
Benter, P. M. & Chou, C. P. (1987). Practical issues in structural modeling. Sociological Methods and
Research, 16 (1), 78-117.
Bump, J. (1990). Radical changes in class discussion using networked computers. Computers and the
Humanities, 24, 49-65.
Cho, H., Stefanone, M., & Gay, G. (2002). Social information sharing in a CSCL community. In G.
Stahl (Ed.), Proceedings of CSCL 2002, Boulder, CO (pp. 43-50). Hillsdale, NJ: Lawrence Erlbaum
Associates.
Fishman, B. (1995). High-end high school communication: Strategies and practices of students in a
networked environment . Doctoral Consortium Paper and Interactive Poster presented at the Annual
Meeting of the Computer Human Interaction Special Interest Group of the Association for
Computing Machinery, Denver, CO (pp. 51-52; 99-100).
Haythornthwaite, C. (2005). Introduction: Computer-mediated collaborative practices. Journal
of Computer-Mediated Communication, 10(4), article 11. http://jcmc.indiana.edu/vol10/issue4/
haythornthwaite.html

8/18/2019 (Contemporary Approaches to Research
http://slidepdf.com/reader/full/contemporary-approaches-to-research 252/284
INFLUENCING GROUP DECISIONS
255
Haythornthwaite, C. (1996). Social network analysis: An approach and technique for the study of
information exchange. Library and Information Science Research, 18(4), 323-342.
Hiltz, S. R. (1986). The “virtual classroom”: Using computer-mediated communication for university
teaching. Journal of Communication, 362, 95-104.
Hubscher-Younger, T., & Narayanan, H. N. (2002a, 2003). Authority and convergence in collaborative
learning. Computers & Education, 41, 313-334.
Johnson, D., Johnson, R., & Holubec, E. (1998). Cooperation in the classroom. Boston: Allyn and
Bacon.
Land, D. L. (2002). Experiencing the online environment. USDLA Journal , 16 (2).
Lobel, M., Neubauer, M., & Swedburg, R. (2005). Comparing how students collaborate to learn
about the self and relationships in a real-time non-turn-taking online and turn-taking face-to-
face environment. Journal of Computer-Mediated Communication, 10(4), article 18.
http://jcmc.indiana.edu/vol10/issue4/lobel.htmlMoore, M. (1990). Recent contributions to the theory of distance education. Open Learning , 5(3), 10-
15.
Moore, M. (1993). Theory of transactional distance. In D. Keegan (Ed.), Theoretical principles of
distance education (pp. 22-38). New York: Routledge.
Moore, M., & Kearsley, G. (1996). Distance education: A systems view. Belmont, CA:
Wadsworth.
Morss, D. A., & Fleming, P. A. (1998). WebCT in the classroom: A student view. Paper presented at
the NAWEB 98 virtual conference. Retrieved November 2, 2003, from http://naweb.unb.ca/
98/proceedings/morss/.
Picciano, A. G. (2002, July). Beyond student perceptions: Issues of interaction, presence, and
performance in an online course. Journal of Asynchronous Learning Network , 6 (1).
Race, P. (1998). An education and training toolkit for the new millennium? Innovations in Education
and Training International , 35(3), 262-271.
Scardamalia, M., & Bereiter, C. (1996). Computer support for knowledge-building communities. In T.
Koschmann (Ed.), CSCL: Theory and practice of an emerging paradigm (pp. 249-268). Hillsdale,
NJ: Lawrence Erlbaum Associates.
Stahl, G. (2003). CSCL Lecture Notes retrieved from the web on January 26th, 2004 from
http://iisweb.cis.drexel.edu/stahl/info608/4/week3.htm.
Vygotsky, L. S. (1962). Thought and language. Cambridge, MA: MIT Press. (Original work published
1934.)
Vygotsky, L. (1978). Mind in society. Cambridge, MA: Harvard University Press. (Original work
published in 1930.)
Yildiz, S., & Chang, C. (2003). Case studies of distance students’ perceptions of participation and
interaction in three asynchronous web-based conferencing classes in the U.S. Turkish Online
Journal of Distance Education-TOJDE , 4(2).
Binod Sundararajan
Dalhousie University, Halifax, Canada
Lorn Sheehan Dalhousie University, Halifax, Canada
Malavika Sundararajan
North Carolina Central University, USA
Jill Manderson Dalhousie University, Halifax, Canada

8/18/2019 (Contemporary Approaches to Research
http://slidepdf.com/reader/full/contemporary-approaches-to-research 253/284
M.S. Khine (ed.), Application of Structural Equation Modeling in Educational Research and
Practice, 257–275.
© 2013 Sense Publishers. All rights reserved.
CHRISTINE DISTEFANO, DIANA MÎNDRILĂ ANDDIANE M. MONRAD
12. INVESTIGATING FACTORIAL INVARIANCE
OF TEACHER CLIMATE FACTORS ACROSS
SCHOOL ORGANIZATIONAL LEVELS
INTRODUCTION
School climate and its importance to education and student learning have intriguedresearchers for approximately 50 years (Anderson, 1982). A favorable schoolclimate provides the structure within which students, teachers, administrators, and
parents function cooperatively and constructively. Edmunds (1982) and Lezotte(1990) were prominent in linking climate directly to school effectiveness morethan 20 years ago. School climate has been found to positively affect academicachievement (Greenberg, 2004; Lee & Burkham, 1996), and to influence astudent’s decision to remain in school (Byrk & Thum, 1989; Rumberger, 1995).
Hoy and Miskel (1982) defined school climate as a school’s personality andevery school may be thought of as having a distinct personality or climate. Schoolclimate is typically thought to involve four parts (Allen, Thompson, Hoadley,Engelking, & Drapeaux, 1997; Sackney, 1988): ecology, milieu, social system, andculture. Ecology comprises physical and material features of schools, such as ageof the building and cleanliness. The milieu involves the personnel (e.g.,administrators, teachers, parents, staff, students, etc.) involved with a school. Asocial system is described as the ‘rules’ which a school uses to interact withmembers. Finally, school culture consists of shared norms, values, and beliefs ofthe members. The two related topics of climate and culture are delineated by Allenet al. (1997) where, “culture establishes normative behavior for the members oforganizations, and climate is the perceptions of those norms” (p. 1).
In the era of accountability, school climate is receiving increased attention. Theimportance of climate is highlighted when considering its effect on achievementand accountability measures. Specifically, a positive school climate has been foundto correlate with higher rates of academic achievement including standardized testscores, as well as increased classroom engagement, student participation, and
motivation to learn (CSEE, 2010; Chen & Weikart, 2008; DiStefano, Monrad,May, McGuiness, & Dickenson, 2007; Edmunds; 1982; Greenberg, 2004; Lee &Burkham, 1996; Lezotte, 1990; NSCC et al., 2008; Roney, Coleman, & Schlictin,2007; Sebring, Allensworth, Bryk, Easton, & Luppescu, 2006; Stewart, 2008).Positive school climate has also been linked to indicators of school successreported for accountability purposes including annual yearly progress (AYP)

8/18/2019 (Contemporary Approaches to Research
http://slidepdf.com/reader/full/contemporary-approaches-to-research 254/284
DISTEFANO ET AL.
258
measures and school report card information (Greenberg, 2004; MacNeil, Prater, &Busch, 2009; DiStefano et al., 2007; Monrad, May, DiStefano, Smith, Gay,Mîndrilă, Gareau, & Rawls, 2008; Tubbs & Garner, 2008). It is important to notethat school climate is a malleable factor. In other words, compared with other
barriers which cannot be controlled by schools (e.g., high family poverty), schoolclimate is not a fixed school condition and can be changed (Greenberg, 2004).
When targeting school climate as an area for improvement, many factors comeinto play. Given the many stakeholders involved with education, perceptions ofschool climate may vary across different groups of people. While those interestedin improving school climate may approach it from many angles, it seems likely tofocus on teachers. Not only do teachers serve as the liaison between students, their
parents, and school administrators, but also, workshops and programs aimed toimprove school improvement are likely to be targeted to a schools’ teachingfaculty.
For school administrators and districts interested in working toward changingschool climate, one additional factor to consider is the organizational level of aschool. Typically, the perceptions of students and faculty in schools servingyounger children (e.g., elementary) tend to be more positive than perceptions ofstudents and teachers in schools serving older children (e.g., high school aged,DiStefano et al., 2007; Monrad et al., 2008).
While organizational-level differences relative to climate may exist, there may be elements of school climate that are similar for teachers of differentdevelopmental levels. For example, a study conducted by Johnston, Stevens andZvoch (2007) tested the invariance of a teacher school climate structural model
across organizational levels. The model tested consisted of five factors(‘Instructional Innovation’, ‘Collaboration’, ‘Decision Making’, ‘SchoolResources’, and ‘Student Relations’) each of which was subordinated to an overallsecond-order factor labeled ‘School Climate’. Results showed that the estimatedmodel worked equally well at the elementary, middle, and high school level. Thisstudy used data collected from teachers from a large urban school district locatedin the southeastern United States. Teachers completed a revised version of theSchool Level Environment Questionnaire, which included 21 items measuring
perceptions of academic press, school leadership, school quality, and jobsatisfaction (Burden & Fraser, 1994; Fraser & Rentoul, 1982; Johnson & Stevens,2001). The survey was completed by 2,558 of the teachers in one large schooldistrict, where roughly one-half of teachers (49.7%) worked in elementary schools(N=80 elementary schools) and the other half of the sample consisted of middle
school teachers (25.9% teachers, N=26 middle schools) and high school teachers(24.3% teachers, N=13 high schools). While this study found similarities betweenteachers’ perceptions of climate at different organizational levels, only one schooldistrict was used with a relatively small survey.
For over 20 years, South Carolina has been administering an annual schoolclimate survey to all public school teachers across the state. Previous investigationsusing this survey have identified factors underlying the teacher climate surveysusing exploratory factor analysis (DiStefano et al., 2007). This structure was

8/18/2019 (Contemporary Approaches to Research
http://slidepdf.com/reader/full/contemporary-approaches-to-research 255/284
INVESTIGATING FACTORIAL INVARIANCE OF TEACHER CLIMATE FACTORS
259
replicated with confirmatory factor analysis and with five years of data (DiStefanoet al., 2007; Monrad et al., 2008). While factors underlying the teacher survey have
been identified and validated for the statewide survey, it is not known howteachers’ views of climate differ based on the organizational level of the school.
The purpose of the current study was twofold. First, invariance testing wasconducted to determine which aspects of school climate are similar acrossorganizational levels. Additionally, latent means testing was used to identify
potential differences of school climate by organization level to help inform schooladministrators. Second, the invariance testing conducted here used a very largefactor model and large sample size. From a methodological perspective, thisexample provides information on statistics and indices under such situations.
METHODS
Teacher Survey of School Climate
Across the state of South Carolina, teachers at every school complete a survey eachyear to assess the learning environment, parent-school relationships, and social and
physical factors related to each school. Three items from the survey are includedon the school’s report card, where only summary information noted (e.g., “I amsatisfied with my school’s learning environment”). However, many items areincluded on the survey and relationships among these items may representunderlying dimensions of school climate.
The survey is organized into four broad areas with nine items included in the
Learning Environment area, 17 items for Social and Physical Environment scale,11 items in Home and School Relations, and 14 items in the area of WorkingConditions. Teachers respond to a set of 69 items using a 4-point Likert scale withanchors of: 1=Disagree; 2=Mostly Disagree; 3=Mostly Agree; 4=Agree.
Data
The data set used was collected state-wide at the end of the 2010-2011 academicyear. Before analyses, duplicate cases were removed, as well as cases having morethan 25% of the responses missing within each scale. For cases with 25% or lessmissing data on each section of the survey, missing item responses were imputed.Missing item data were replaced with the average of the individual’s responses forother items on the same section, thereby maximizing sample sizes for analyses.
The resulting data set provides a unique opportunity to examine the characteristicsof school climate on a state-wide basis as well as conducting invariance testingwith a large sample. Table 1 provides the number of teachers and schools includedin the study by organizational level. For this study, nested relationships were notconsidered.

8/18/2019 (Contemporary Approaches to Research
http://slidepdf.com/reader/full/contemporary-approaches-to-research 256/284
DISTEFANO ET AL.
260
Table 1. Number of teachers and schools by organizational level.
Prior Factor Analytic Work
The teacher school climate factor structure was derived from exploratory factor
analysis (EFA) using the 2006 and 2007 teacher survey data. The 2006 sample wasused to find an initial solution by reducing the pool of items through deletion ofitems that were cross-loading (above .4 on more than one factor) or had lowloading values (under .2) with the associated factors. Additionally, items with lowcommunality estimates (under .2) were deleted. This process resulted in a total of15 items deleted from the scale, resulting in 54 items used for analyses. Multiplesolutions were interpreted to identify an optimal number of factors underlying thedata.
A six-factor solution was thought to fit the data: Working conditions/ leadership(WCL), Home-school relationship (HSR), Instructional focus (IF), Resources(RES), Social-physical environment (SPE), and Safety (SAF) (DiStefano et al,2007). The survey items included in each factor are listed in the Appendix. Thefirst factor, Working Conditions/Leadership, represented teachers’ perceptions of
the schools as a place of work and reflections on the administrative leadership.This factor included items such as: “The school administration provides effectiveinstructional leadership” and “The school administration communicates clearinstructional goals for the school.” Home-school Relationship describes therelationship between parents and teachers and parent involvement with schoolactivities (e.g., “Parents attend school meetings and other school events”). Thethird factor, Instructional Focus, measures an understanding of instructionalstandards and high expectations for students to meet those standards. The
Resources factor reflects the materials needed to teach, including classroom space,textbooks, and computer capabilities. Social-Physical Environment measuresteachers’ views of the social-physical environment of the schools and were closelyassociated with building cleanliness and maintenance. The final factor, Safety,
expresses teachers’ perceived safety during the school day and while going to and
coming from school. Some factors identified were similar in operational definitionto those identified by Johnston et al. (2007) (i.e., School Resources). Remainingfactors share similar elements with the work by Johnson and colleagues. Forexample, the WCL factor shares some of the same features included in the‘Collaboration’ and ‘Decision making’ factors, and the IF factor includes some ofthe similar features to the ‘Instructional Innovation’ factor identified by Johnsonand colleagues (2007).
Organizational LevelElementary Middle High Total
Number of Schools 597 197 270 1,064
Number of Teachers 17,555 8,127 8,736 34,418

8/18/2019 (Contemporary Approaches to Research
http://slidepdf.com/reader/full/contemporary-approaches-to-research 257/284
INVESTIGATING FACTORIAL INVARIANCE OF TEACHER CLIMATE FACTORS
261
The factor structure identified with the 2006 sample was independentlyreplicated with data from the 2007 teacher survey. Again, the same six-factorsolution was found optimal, with the same items selected for deletion. Because thefactors did not change across the two-year period, this structure was used tospecify a measurement model which included the six identified latent dimensions(Monrad et al., 2008). Confirmatory factor analysis (CFA) was conducted withschool climate data for three subsequent years (academic years ending in 2008through 2010). Results suggested that the items included in the measurementmodel were good indicators of the corresponding factors (Mîndrilă et al., 2010).
Invariance Testing of the CFA Model
The current study continued previous research by using the state-wide 2011 teachersurvey data to investigate the invariance of the measurement model across schoolorganizational levels, i.e., elementary, middle, and high schools. Multigroupinvariance tests were conducted using the LISREL software program (version 8.80,Jöreskog & Sörbom, 1996). The Maximum Likelihood (ML) estimator was used asthe fit function (Jöreskog & Sörbom, 1996). Although item data were ordinal, itemlevel skewness values were under |2.5| across all three samples. Item level kurtosisvalues were under |4.0| for most of the 54 items examined, with the number ofitems exhibiting high kurtosis varying by level (4 items from the in high schoolsample, 10 from middle school, 20 in elementary school sample). While it isrecognized that ML with non-normal data can produce attenuated loading valuesand biased fit indices (Finney & DiStefano, 2013), this estimator was used due to
problems in computing a full asymptotic covariance matrix with such a largemodel.
With invariance testing, successive structural models, with more restrictions, arecompared to models with fewer restrictions to determine if the imposed constraintsimpact the fit of the models. If there is no loss in fit, the models may be consideredinvariant, or equal, between groups. If model fit indices did not show a significantchange between the less restrictive and the more restrictive model, the invariancetesting continues with a new set of parameters. Otherwise, tests of partialinvariance are conducted to identify which parameters within a group areresponsible for the significant differences in model fit. The order of the invarianceroutine was based upon recommendations by covariance modeling researchers(Cheung & Rensvold, 2002; Finney & Davis, 2003; Vandenberg & Lance 2000).
The first step of the analysis was to test the configural invariance of the model
across groups to determine whether the three groups associate the same subsets ofitems with the same climate constructs (Finney & Davis, 2003). At this stage, noequality constraints were imposed and all model parameters were left free forestimation (Model 1). Figure 1 depicts the baseline CFA model used in theanalyses. The model includes unequal numbers of items per factor, with the largestnumber of items relating to Working Conditions/Leadership (14 items) and thesmallest relating to Safety and Physical Environment (three items each).
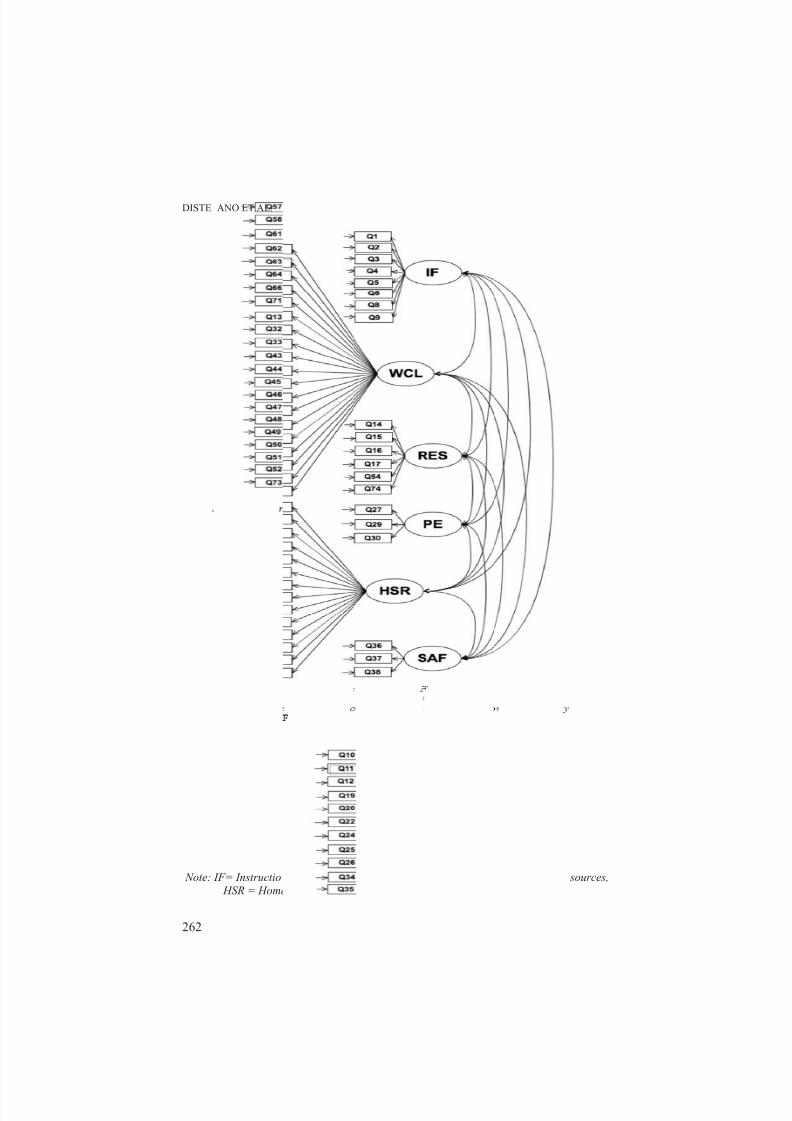
8/18/2019 (Contemporary Approaches to Research
http://slidepdf.com/reader/full/contemporary-approaches-to-research 258/284
DISTE
262
Note:
ANO ET AL.
IF= Instructio HSR = Home
Figure
al Focus, WCL /School Relati
1. Baseline C
= Working Cons, PE = Physi
A model.
nditions/Leadecal Environme
rship, RES = Rt, SAF = Safet
esources,

8/18/2019 (Contemporary Approaches to Research
http://slidepdf.com/reader/full/contemporary-approaches-to-research 259/284
INVESTIGATING FACTORIAL INVARIANCE OF TEACHER CLIMATE FACTORS
263
The second step of invariance testing was to establish the metric invariance ofthe measurement model. The test of metric invariance is conducted by constrainingall item loadings to be equal across groups (Model 2) and determining whether themodel fits the data significantly better than Model 1. This procedure helpsdetermine whether the relationships between items and the corresponding factorshave similar strength across groups (Finney & Davis, 2003). If all loading valuescould not be constrained as equal, partial invariance was tested by allowing someloading values to be freely estimated within a group.
The next step was to hold factor variances equal across the three groups (Model3). This procedure shows whether the range of factor scores on any of the schoolclimate factors varies across groups (Finney & Davis, 2003). If Model 3 does notfit the data as well as the previous model, Model 2, the invariance testing
procedures are stopped. Instead, researchers proceeded with tests of partial factorinvariance, to identify the climate construct(s) for which the range of factor scoreswas statistically different across groups. This was done by sequentially holdingsubsets of climate factors equal across groups. If factor (partial) invariance wasfound, Model 4 constrained factor covariances to be equal. Again, all covarianceswere constrained equal initially and then partial invariance tests were conducted.This test determined if relationships among latent variables are similar across thegroups.
Finally, the test of equal item error variances (i.e., uniqueness) is sometimesconducted. Many researchers consider this test to be rigorous (e.g., Byrne, 1998;Vanderberg & Lance, 2000); here, tests of equal item error terms were not ofinterest and were not conducted.
Latent Means Testing
It was of interest to test positions of the latent means on the variables to determinethe perception of a given construct across organizational levels. Additional testswere included to investigate scalar invariance by adding restrictions from Model 2
plus the additional constraint of equal item intercepts, meaning that individualswith the same value on a given latent variable would report the same value on theobserved variable, regardless of group membership (Hancock, 1997). If metricinvariance and scalar invariance hold, tests for latent mean differences may beundertaken (Cheung & Rensvold, 2002; Vanderberg & Lance, 2000). Cohen’s d effect size measure was computed to investigate the magnitude of the latent meandifferences (Cohen, 1988) as compared to the elementary sample. The effect size
was computed by dividing the latent mean difference by the pooled standarddeviation (Hong, Malik, & Lee, 2003). While comparisons were conducted acrosstwo groups, the pooled standard deviation across the three groups was used torecognize the larger structure (cf. simple effects, Hinkle, Weirsma, & Jurs, 2002).

8/18/2019 (Contemporary Approaches to Research
http://slidepdf.com/reader/full/contemporary-approaches-to-research 260/284
DISTEFANO ET AL.
264
Evaluating Results
With invariance testing, fit indices used with CFA are used to assess the model fitat successive steps. Although the chi-square fit statistic is widely used as an indexof how well the model fits a set of data, the index is sensitive to sample size andassumes the correct model is tested (Bollen, 1989; Jöreskog, 1993; Jöreskog &Sörbom, 1996). Therefore, models often will be rejected by a formal test ofsignificance with a sufficiently large sample size (Marsh, 1996; Cudeck & Browne,1983). Chi-square difference tests (∆χ 2) may be calculated by comparing thedifference in chi-square values between a more restrictive and less restrictivemodel to the referent value associated with the difference in degrees of freedom
between the two models (Bollen, 1989). A problem when using such a large modeland a large sample size is that the chi-square is sensitive to these conditions andalso used in calculating many of the indices used to evaluate invariance.
The following indices were used in comparisons: NNFI, CFI, RMSEA, ECVI,and SRMR. Both the Non-Normed Fit Index (NNFI) and Comparative Fit Index(CFI) are incremental fit indices and test the proportionate improvement in fit
between the tested model and a baseline model with no correlations amongobserved variables (Bentler, 1990; Bentler & Bonett, 1980). The values differ inthat CFI is also adjusted for sample size. NNFI and CFI values approximating 0.95were indicative of good fit (Hu & Bentler, 1999). Also, difference testing wasinvestigated across models where ∆CFI values less than .01 may suggestinvariance (Cheng & Rensvold, 1999).
The root mean square error of approximation (RMSEA) represents closeness of
fit (Browne & Cudeck, 1993). The RMSEA value should approximate or be lessthan 0.05 to demonstrate close fit of the model, values between .05 and .08represent reasonable fit, and values greater or equal to .10 suggest poor fit (Browne& Cudeck, 1993). The 90% confidence interval (CI) around the RMSEA pointestimate should contain 0.05 to indicate the possibility of close fit (Browne &Cudeck, 1993).
The Expected Cross-Validation Index (ECVI) (Browne & Cudeck, 1993) is asingle sample estimate of how well the current solution would fit in anindependently drawn sample (Browne & Cudeck, 1993), and it can be used tocompare the fit of competing models (Browne & Cudeck, 1993). SRMR is thestandardized average absolute value of the covariance residuals between thespecified and obtained variance-covariance matrices. Researchers typically use .08as a threshold for good fit (Tanaka, 1993). The Expected Cross-Validation Index
(ECVI) (Browne & Cudeck, 1993) is a single sample estimate of how well thecurrent solution would fit in an independently drawn sample (Browne & Cudeck,1993), and it can be used to compare the fit of competing models (Browne &Cudeck, 1993). ECVI also includes a 90% confidence interval which can be usedwhen comparing models.
As a second check on model fit indices, invariance testing was run with fiverandom samples ranging from of 1,000 to 20,000 cases with the “final” model.Here, sample size ratios approximating levels with the full sample (i.e., twice as
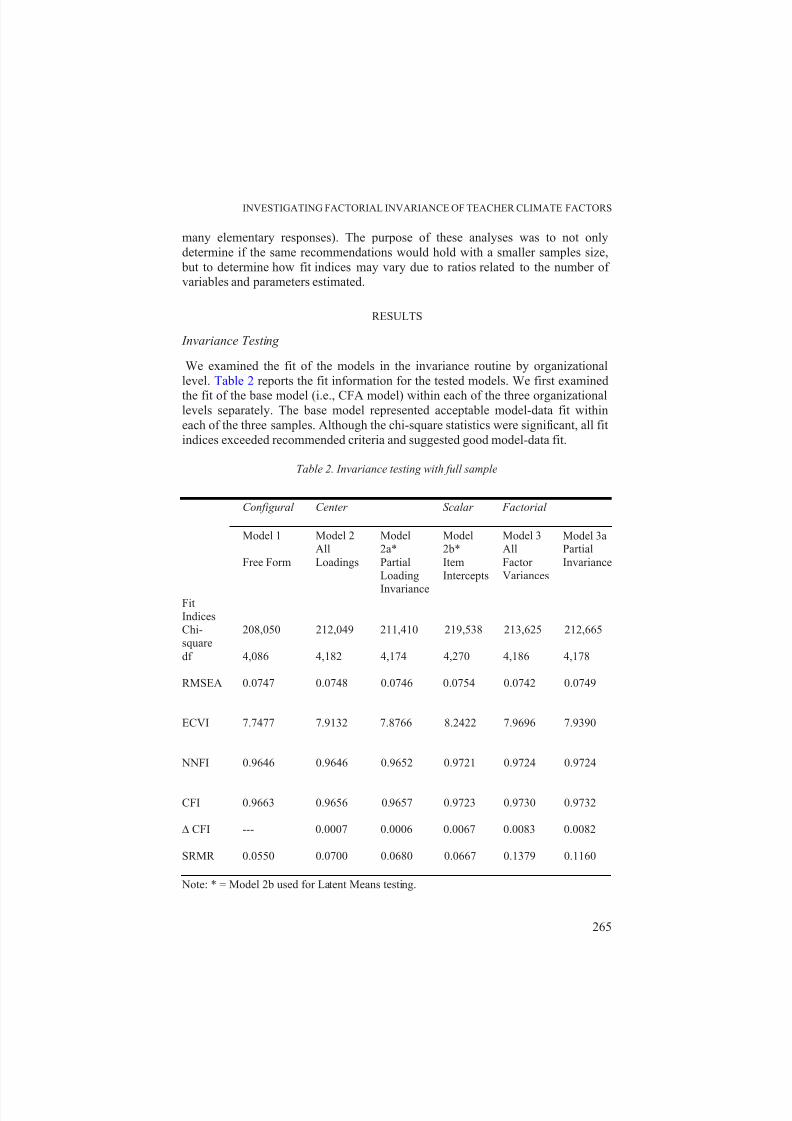
8/18/2019 (Contemporary Approaches to Research
http://slidepdf.com/reader/full/contemporary-approaches-to-research 261/284
INVESTIGATING FACTORIAL INVARIANCE OF TEACHER CLIMATE FACTORS
265
many elementary responses). The purpose of these analyses was to not onlydetermine if the same recommendations would hold with a smaller samples size,
but to determine how fit indices may vary due to ratios related to the number ofvariables and parameters estimated.
RESULTS
Invariance Testing
We examined the fit of the models in the invariance routine by organizationallevel. Table 2 reports the fit information for the tested models. We first examined
the fit of the base model (i.e., CFA model) within each of the three organizationallevels separately. The base model represented acceptable model-data fit withineach of the three samples. Although the chi-square statistics were significant, all fitindices exceeded recommended criteria and suggested good model-data fit.
Table 2. Invariance testing with full sample
Note: * = Model 2b used for Latent Means testing.
Configural Center Scalar Factorial
Model 1
Free Form
Model 2AllLoadings
Model2a*PartialLoading
Invariance
Model2b*ItemIntercepts
Model 3AllFactorVariances
Model 3aPartialInvariance
FitIndicesChi-square
208,050 212,049 211,410 219,538 213,625 212,665
df 4,086 4,182 4,174 4,270 4,186 4,178
RMSEA 0.0747 0.0748 0.0746 0.0754 0.0742 0.0749
ECVI 7.7477 7.9132 7.8766 8.2422 7.9696 7.9390
NNFI 0.9646 0.9646 0.9652 0.9721 0.9724 0.9724
CFI 0.9663 0.9656 0.9657 0.9723 0.9730 0.9732
∆ CFI --- 0.0007 0.0006 0.0067 0.0083 0.0082
SRMR 0.0550 0.0700 0.0680 0.0667 0.1379 0.1160

8/18/2019 (Contemporary Approaches to Research
http://slidepdf.com/reader/full/contemporary-approaches-to-research 262/284
DISTEFANO ET AL.
266
We then compared the fit of the models in the invariance routine. There wasevidence for the invariance of the overall structure (i.e., configural invariance – Model 1), where fit indices exceeded cutoff values. With Model 2, most indiceswere beyond stated cutoff values; however, given the increase in ECVI, weinvestigated individual items for partial invariance. Four items (Q5, Q8, Q44, andQ74) with loading values greater than .10 across factors (standardized solution)were allowed to be freely estimated in each sample. Allowing these items to befreed produced better fit, as shown by the reduction in ECVI and RMSEA.Therefore, we allowed for partial metric invariance.
Model 3 tested the factorial invariance of the latent variables. While invarianceof factor variances met the criteria for invariance and good fit by some of the fitindices (e.g., ΔCFI , NNFI), the large increase in SRMR was disconcerting. Selectvariances were allowed freed across organizational levels in Model 3b. This modelyielded better fit and a reduction in ECVI and SRMR; however, we stoppedinvariance testing at this point due to the high SRMR value.
Latent Means
Model 2b tested scalar invariance. Although there was support for scalarinvariance from other fit indices, the ECVI increased; additionally, it was thoughtthat the mean levels of individual items would be best to vary across levels toreflect differences in perceptions.
Therefore, scalar invariance was thought to be tentative and was used toinvestigate latent mean differences. To investigate latent mean differences between
organizational levels, the latent mean values of the six climate constructs werefixed to zero in the elementary level group and freely estimated for middle andhigh school levels. Table 3 provides a summary of latent mean values. As shown inthe table, estimated latent mean values for all factor means at middle school andhigh school level reported significantly lower perceptions of school climate thanelementary level teachers. All values were statistically significant.
Table 3. Estimated latent mean values differences from elementary level
Level
WorkingConditions/
Leadership
Home/School
Relations
Instructional Focus
Resources Physical Environment
Safety
Middle -0.207 -0.273 -0.085 -0.170 -0.044 -0.067
Effect
Size
-0.288 -0.406 -0.224 -0.275 -0.095 -0.157
HighSchool
-0.308 -0.437 -0.202 -0.305 -0.133 -0.143
Effectsize
-0.428 -0.651 -0.529 -0.493 -0.291 -0.332
Note: All latent mean values are statistically significant (p<.001).

8/18/2019 (Contemporary Approaches to Research
http://slidepdf.com/reader/full/contemporary-approaches-to-research 263/284
INVESTIGATING FACTORIAL INVARIANCE OF TEACHER CLIMATE FACTORS
267
Because significance may be partly due to the large sample size, Cohen’s d effect size measures (Cohen, 1988) were computed to investigate the magnitude ofthe latent mean differences between elementary school and middle or high school,respectively. The computed values of d are provided in Table 3 and, as shown,differences by organizational level were observed. Considering Cohen’s guidelinesfor interpreting effect size values, effect size values latent mean differences
between elementary and middle school may be considered small to moderate.However, differences between elementary and high school teachers were mostlymoderate. Home-school relations showed the largest differences betweenelementary and higher organizational levels; and Physical Environment showed thesmallest difference among the groups.
Performance of Fit Indices Relative to Sample Size
Table 4 provides the sample sizes used in the analyses as well as the minimumsample size to number of variables ratio and the ratio sample size to number of
parameters using Model 3a (partial invariance of factor variances) used as the finalmodel.
Table 4. Sample sizes and ratios
Elementary N
Ratio N: var
Ratio N: param
Middle/ High N
Ratio N: var
Ratio N: param
SampleSize1,000 500 9.3: 1 1.8: 1 250 4.6: 1 0.9: 12,000 1,000 18.5: 1 3.6: 1 500 9.3: 1 1.8: 15,000 2,500 46.3: 1 9.0: 1 1,250 23.1: 1 4.5: 110,000 5,000 92.6: 1 18.1: 1 2,500 46.3: 1 9.0: 120,000 10,000 185.2: 1 36.1: 1 5,000 92.6: 1 18.1: 1Full Total 17,555 325.1: 1 63.4: 1 8,127/
8,736150.5/161.8: 1
29.3/31.5: 1
Note: Number of variables included = 54, Number of parameters estimated= 277.
Table 5 reports the fit indices by sample size. In terms of decision making,results are similar across the samples. RMSEA, CFI, and NNFI largely met the
criteria for good fit across all the samples. NNFI and CFI were relatively constantacross the samples drawn, suggesting that these indices may be useful under verylarge sample sizes. As expected, indices which rely on “smaller” values asindicative of “better” fit (e.g., RMSEA, ECVI, and SRMR) were lower (i.e.,showing “better” fit) as sample size increased. SRMR reported higher levels oferror for the lowest sample size; values were roughly stable above this sample size.RMSEA values were also similar across the set of random samples; however,
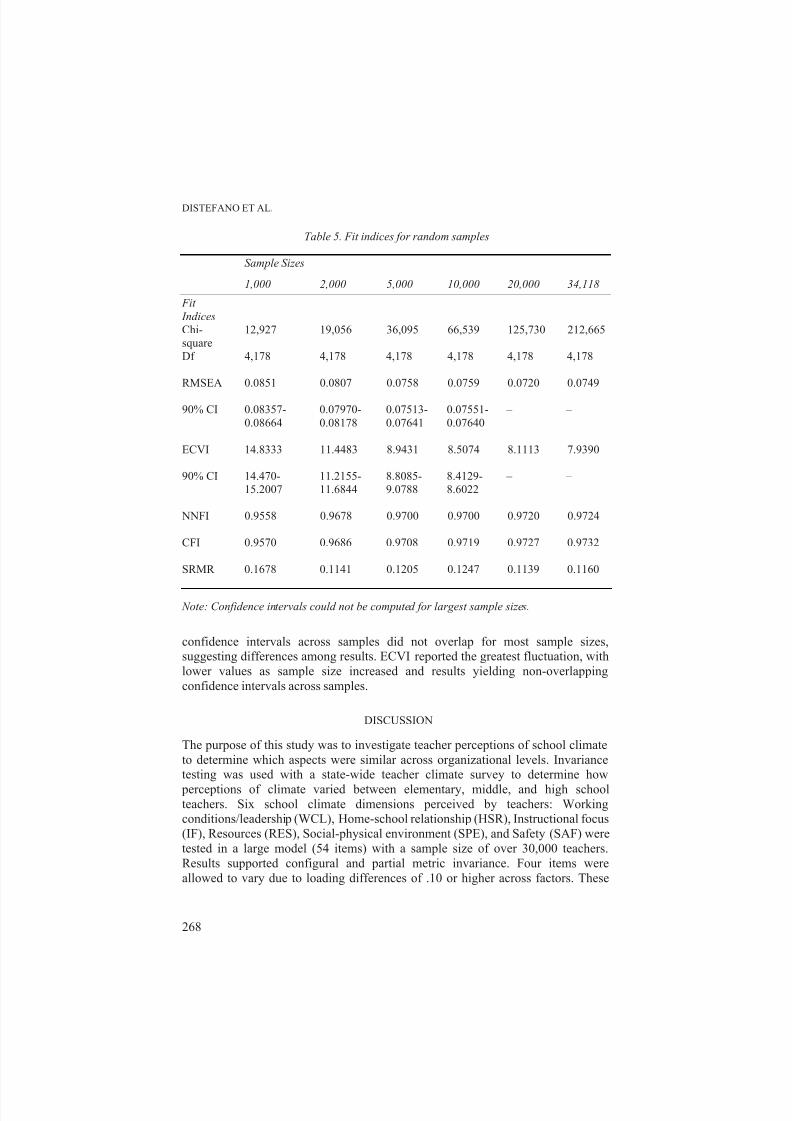
8/18/2019 (Contemporary Approaches to Research
http://slidepdf.com/reader/full/contemporary-approaches-to-research 264/284
DISTEFANO ET AL.
268
Table 5. Fit indices for random samples
Note: Confidence intervals could not be computed for largest sample sizes.
confidence intervals across samples did not overlap for most sample sizes,suggesting differences among results. ECVI reported the greatest fluctuation, withlower values as sample size increased and results yielding non-overlappingconfidence intervals across samples.
DISCUSSION
The purpose of this study was to investigate teacher perceptions of school climateto determine which aspects were similar across organizational levels. Invariancetesting was used with a state-wide teacher climate survey to determine how
perceptions of climate varied between elementary, middle, and high schoolteachers. Six school climate dimensions perceived by teachers: Workingconditions/leadership (WCL), Home-school relationship (HSR), Instructional focus(IF), Resources (RES), Social-physical environment (SPE), and Safety (SAF) weretested in a large model (54 items) with a sample size of over 30,000 teachers.Results supported configural and partial metric invariance. Four items wereallowed to vary due to loading differences of .10 or higher across factors. These
Sample Sizes
1,000 2,000 5,000 10,000 20,000 34,118
Fit
IndicesChi-square
12,927 19,056 36,095 66,539 125,730 212,665
Df 4,178 4,178 4,178 4,178 4,178 4,178
RMSEA 0.0851 0.0807 0.0758 0.0759 0.0720 0.0749
90% CI 0.08357-0.08664
0.07970-0.08178
0.07513-0.07641
0.07551-0.07640
– –
ECVI 14.8333 11.4483 8.9431 8.5074 8.1113 7.9390
90% CI 14.470-15.2007
11.2155-11.6844
8.8085-9.0788
8.4129-8.6022
– –
NNFI 0.9558 0.9678 0.9700 0.9700 0.9720 0.9724
CFI 0.9570 0.9686 0.9708 0.9719 0.9727 0.9732
SRMR 0.1678 0.1141 0.1205 0.1247 0.1139 0.1160

8/18/2019 (Contemporary Approaches to Research
http://slidepdf.com/reader/full/contemporary-approaches-to-research 265/284
INVESTIGATING FACTORIAL INVARIANCE OF TEACHER CLIMATE FACTORS
269
items largely measured school-based resources (e.g., school offers programs forstudents with disabilities, class size manageable, class time sufficient for learningessential skills) and may differ due to the characteristics of individual schools. Theremaining item assessed parent knowledge of school activities; where it is wellknown that parent involvement decreases as the age of the child increases ( Zill &
Nord, 1994). This latent variable also showed the greatest differences in latentmean values for high school and middle school teachers as compared to elementaryteachers.
The final model also suggested that the factor variances were largely differentamong organizational levels. Partial invariance was found where only two of thesix factors, Instructional Focus and Social/Physical Environment , were similaracross the groups. The IF factor measured teachers’ knowledge of instructionalstandards and teachers across organizational levels stated similar views as toawareness of the material to be taught and of student expectations to meet statestandards. Additionally, regardless of organizational level, teachers had similar
perceptions about the physical environment of the school. Clean, well-maintained buildings and school grounds were equally important to teachers of all levels.
The amount of variability reported for the remaining four latent variables(WCL, HSR, RES, and SAF) was different across organizational levels. Generally,greater variability was seen for higher-grade levels taught. In other words, highschool teachers’ perceptions yielded greater amounts of variability than for middleschool teachers. Elementary school teachers were the most homogeneous in theirviews of school climate. These variables also showed relatively low factorvariances.
In general, the benefits of invariance across levels suggest that one structure can be used across organizational levels to summarize results. This is useful in that itallows school administrators to use a common model and perspective to discussschool climate for all organizational levels. This one structure can be used toobtain further information. Factor scores aggregated at the school level can be usedto examine a school’s perceptions of climate to determine school based strengthsas well as areas for improvement. For example, cluster analyses were conductedusing factor scores to identify different types of schools relative to climate and todifferentiate groups using school report card information (DiStefano et al., 2007).Four climate clusters were uncovered where climate was described as AboveAverage, Average, Below Average or Well-Below Average. Schools with the mostfavorable school climates met more Adequate Yearly Progress (AYP) objectives,had higher standardized test scores, higher levels of parent participation, and more
encouraging report cards. Generally, students performed at higher levels in schoolswith a positive climate, and students’ performance was lowest in schools with theleast favorable climate ratings.
Additionally, scalar invariance allowed for testing of latent means differenceswhich may be used to identify differences concerning school climate. Notsurprisingly, elementary teachers were significantly more positive than eithermiddle or high school teachers relative to most school climate factors. However,this information can be used to help inform school administrators to improve

8/18/2019 (Contemporary Approaches to Research
http://slidepdf.com/reader/full/contemporary-approaches-to-research 266/284
DISTEFANO ET AL.
270
school climate with respect to other schools at the same organizational level. Thesignificant differences, as well as moderate effect sizes, found among latent meanssuggest that further analyses using mean scores should be ‘split’ by level to avoidconfounding results. For example, correlational and regression analyses may beconducted for schools at a given organizational level to determine the relationship
between school climate and selected accountability/school report card outcomes,(Monrad et al., 2008).
The information about fit indices under invariance testing with very largemodels and many items may be helpful to applied researchers. ECVI and SRMRshowed the greatest fluctuations across the set of random samples, illustratinggreater sensitivity to sample size with lower ratios of sample size to the number of
parameters estimated or to the number of variables included. NNFI, CFI, andRMSEA were largely unaffected by varying sample sizes, showing acceptable fitacross the set of tested models, even when ratios were very low. These indicesshould be examined further as prior work has found RMSEA to be overlyoptimistic when ordinal data are analyzed (DiStefano & Morgan, in press).
Limitations exist with the present study and with the dataset used in theanalyses. Although the sample sizes were large, the analyses in this study werelimited to data from a single school year, 2010-2011. Further, individual teacherscannot be identified in the dataset and all personnel within a school are required tocomplete the survey for report card purposes. Thus, not only are response rates notable to be reported, other personnel (e.g., school librarian, school counselor) mayalso take the teacher survey. While these personnel are affected by a school’sclimate, they may not relate to every indicator on the survey.
Additionally, districts vary widely in their capacity to support the schools’ physical and learning environments. This variability may have an impact on schoolclimate and, thus, survey responses. While the impact of district level indicatorswere not included in the present study, the role of district characteristics andsupport for improving school outcomes could be further explored throughadditional analyses, such as Hierarchical Linear Modeling.
Finally, this study used empirical data. While information regarding fit indiceswas examined using random samples of varying size, we cannot be sure that thetrue model was represented. Future simulation studies using large models and largesamples will be helpful to see how fit indices perform under conditions whereinvariance is known.
There are also avenues for future research to improve school climate. Thedevelopment of a school-climate report, designed expressly for school
administrators and school improvement councils may be of interest. Such a reportcould be used to identify needed professional development and programmaticinitiatives to improve school climate. Further, information could be used to reachout to parents for schools with lower climate ratings, thus showing parents thevalue of their input and hopefully encouraging higher levels of parent interaction.Future analyses may examine relationships between individual school climatefactors and report card outcomes and provide schools instruction as to how toimprove select aspects of climate.
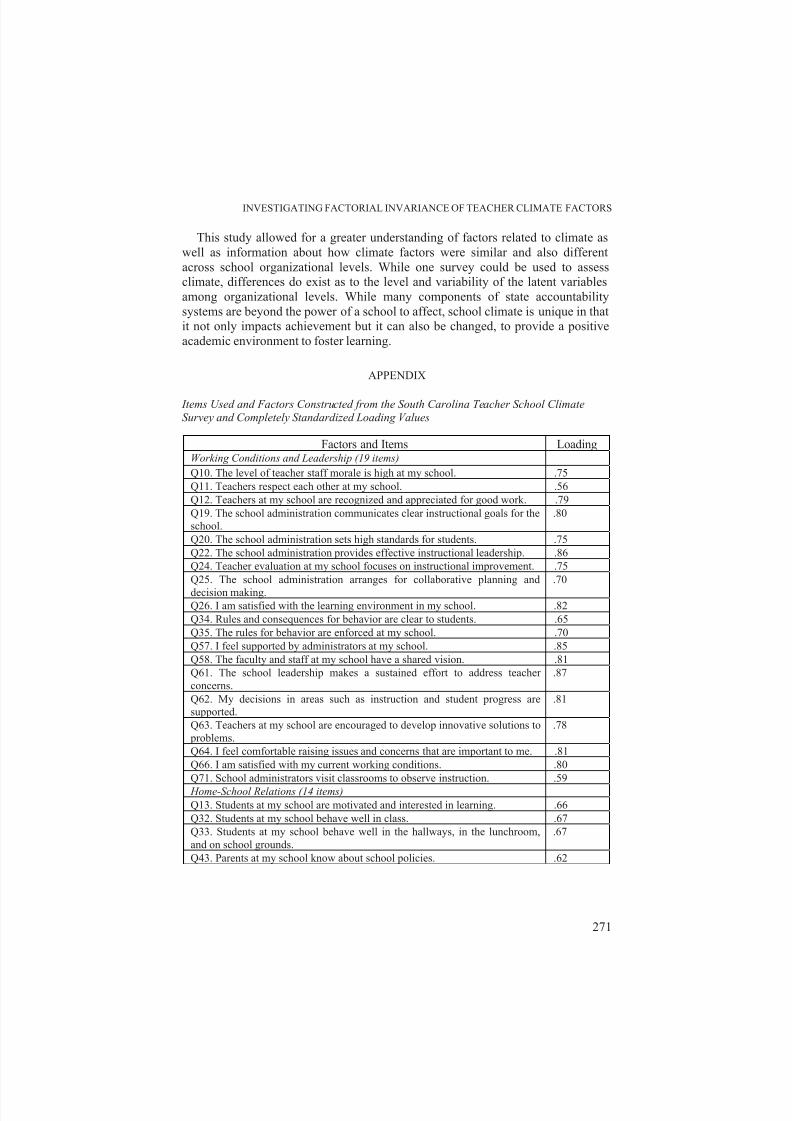
8/18/2019 (Contemporary Approaches to Research
http://slidepdf.com/reader/full/contemporary-approaches-to-research 267/284
INVESTIGATING FACTORIAL INVARIANCE OF TEACHER CLIMATE FACTORS
271
This study allowed for a greater understanding of factors related to climate aswell as information about how climate factors were similar and also differentacross school organizational levels. While one survey could be used to assessclimate, differences do exist as to the level and variability of the latent variablesamong organizational levels. While many components of state accountabilitysystems are beyond the power of a school to affect, school climate is unique in thatit not only impacts achievement but it can also be changed, to provide a positiveacademic environment to foster learning.
APPENDIX
Items Used and Factors Constructed from the South Carolina Teacher School ClimateSurvey and Completely Standardized Loading Values
Factors and Items LoadingWorking Conditions and Leadership (19 items) Q10. The level of teacher staff morale is high at my school. .75Q11. Teachers respect each other at my school. .56Q12. Teachers at my school are recognized and appreciated for good work. .79Q19. The school administration communicates clear instructional goals for theschool.
.80
Q20. The school administration sets high standards for students. .75Q22. The school administration provides effective instructional leadership. .86Q24. Teacher evaluation at my school focuses on instructional improvement. .75Q25. The school administration arranges for collaborative planning and
decision making.
.70
Q26. I am satisfied with the learning environment in my school. .82Q34. Rules and consequences for behavior are clear to students. .65Q35. The rules for behavior are enforced at my school. .70Q57. I feel supported by administrators at my school. .85Q58. The faculty and staff at my school have a shared vision. .81Q61. The school leadership makes a sustained effort to address teacherconcerns.
.87
Q62. My decisions in areas such as instruction and student progress aresupported.
.81
Q63. Teachers at my school are encouraged to develop innovative solutions to problems.
.78
Q64. I feel comfortable raising issues and concerns that are important to me. .81Q66. I am satisfied with my current working conditions. .80Q71. School administrators visit classrooms to observe instruction. .59
Home-School Relations (14 items)
Q13. Students at my school are motivated and interested in learning. .66Q32. Students at my school behave well in class. .67Q33. Students at my school behave well in the hallways, in the lunchroom,and on school grounds.
.67
Q43. Parents at my school know about school policies. .62

8/18/2019 (Contemporary Approaches to Research
http://slidepdf.com/reader/full/contemporary-approaches-to-research 268/284
DISTEFANO ET AL.
272
Q44. Parents at my school know about school activities..52(.65, .74)
Q45. Parents at my school understand the school’s instructional programs. .72Q46. Parents at my school are interested in their children’s schoolwork. .82Q47. Parents at my school support instructional decisions regarding theirchildren.
.81
Q48. Parents attend conferences requested by teachers at my school. .78Q49. Parents at my school cooperate regarding the discipline problems. .80Q50. Parents attend school meetings and other school events. .81Q51. Parents participate as volunteer helpers in the school or classroom. .76Q52. Parents are involved in school in school decisions through advisory
committees.
.72
Q73. I am satisfied with home and school relations. .84 Instructional Focus (8 items) Q1. My school provides challenging instructional programs for students. .73Q2. Teachers at my school effectively implement the State CurriculumStandards.
.76
Q3. Teachers at my school focus instruction on understanding, not justmemorizing facts.
.78
Q4. Teachers at my school have high expectations for students’ learning. .77Q5. There is a sufficient amount of classroom time allocated to instruction inessential skills.
.55(.56, .52)
Q6. Student assessment information is effectively used by teachers to planinstruction.
.71
Q8. My school offers effective programs for students with disabilities..57(.60, .51)
Q9. Instructional strategies are used to meet the needs of academically giftedstudents. .64
Resources (7 items)
Q14. There are sufficient materials and supplies available for classroom andinstructional use.
.69
Q15. Our school has a good selection of library and media material. .61Q16. Our school has sufficient computers for instructional use. .69Q17. Computers are used effectively for instruction at my school. .69Q54. I have sufficient space in my classroom to meet the educational needs ofmy students.
.56
Q74. My class sizes allow me to meet the educational needs of my students..53(.52, .50)
Physical Environment (3 items)
Q27. The grounds around my school are kept clean. .77Q29. The bathrooms at my school are kept clean. .79
Q30. The school building is maintained well and repaired when needed. .83Safety (3 items)
Q36. I feel safe at my school before and after hours. .90Q37. I feel safe at my school during the school day. .92Q38. I feel safe going to or coming from my school. .86
Note: Values in parenthesis are middle and high school values, respectively.

8/18/2019 (Contemporary Approaches to Research
http://slidepdf.com/reader/full/contemporary-approaches-to-research 269/284
INVESTIGATING FACTORIAL INVARIANCE OF TEACHER CLIMATE FACTORS
273
REFERENCES
Allen, S. M., Thompson, R. H., Hoadley, M., Engelking, J., & Drapeaux, J. (1997). Improving schoolclimate: Creating a circle of communication between educators and families. Paper presented at theannual meeting of the American Educational Research Association, Chicago, IL. Retrieved fromhttp://www.usd.edu/sdtran/qual/climate.html.
Anderson, C. S. (1982). The search for school climate: A review of the research. Review of Educational
Research, 52, 368-420.Bentler, P. M. (1990). Comparative fit indexes in structural models. Psychological Bulletin, 238-246.Bentler, P. M., & Bonett, D. G. (1980). Significance tests and goodness of fit in the analysis of
covariance structures. Psychological Bulletin, 88, 588-606.Bollen, K. A. (1989). Structural models with latent variables. New York: Wiley.
Browne, M. W., & Cudeck, R. (1993). Alternative ways of assessing model fit. In K. A. Bollen & J. S.Long (Eds.), Testing Structural equation models (pp. 136-162). Beverly Hills, CA: Sage.Burden, R. L., & Fraser, B. J. (1994). Examining teachers’ perceptions of their working environments:
Introducing the school level environment questionnaire. Educational Psychology and Practice, 10,67-73.
Byrk, A. S., & Thum, Y. M. (1989). The effects of high school organization on dropping out: Anexploratory investigation. American Educational Research Journal , 26 , 353-383.
Byrne, B. A. (1998). Structural equation modeling with LISREL, PRELIS, and SIMPLIS: Basic
concepts, applications, and programming . Mahwah, NJ: Erlbaum.Chen, G., & Wiekart, A. (2008). Student background, school climate, school disorder, and student
achievement: An empirical study of New York City’s middle schools. Journal of School Violence,7 , 3-20.
Cheung, G. W., & Rensvold, R. B. (1999). Testing factorial invariance across groups: Areconceptualization and proposed new method. Journal of Management , 25, 1-27.
Cheung, G. W., & Rensvold, R. B. (2002). Evaluating goodness of fit indices for testing measurementinvariance. Structural Equation Modeling , 9, 233-255.
Cohen, J. (2009). Transforming school climate: Educational and psychoanalytic perspectives:Introduction. Schools: Studies in Education, 6 , 99-103.
Cudeck, R., & Brown, M. (1983). Cross-validation in covariance structures. Multivariate Research, 18,147-167.
DiStefano, C., & Morgan, G. B. (in press). A comparison of robust estimation techniques for non-normal data Structural Equation Modeling.
DiStefano, C., Monrad, D. M., May, R.J., McGuiness, P., & Dickenson, T. (2007, April). Using school
climate surveys to categorize schools and examine relationships with school achievement . Paper presented at the Meeting of the American Educational Research Association, Chicago, IL.
Edmunds, R. R. (1982). Programs of school improvement: An overview. Educational Leadership, 40,4-11.
Finney, S. J., & Davis S. L. (2003, April). Examining the invariance of the Achievement Goal
Questionnaire across gender . Paper presented at the Annual meeting of the American EducationalResearch Association, Chicago, IL.
Finney, S. J. & DiStefano, C. (2013). Analyzing categorical and non-normal data in structural equation
modeling. In G. Hancock & R. O. Mueller (Eds.), A second course in structural equation modeling .Greenwich, CT: Information Age Publishing.
Fraser, B. J., & Rentoul, A. J. (1982). Relationships between school-level and classroom-levelenvironments. Alberta Journal of Educational Research, 28, 212-225.
Greenberg, E. (2004). Climates for learning . Paper presented at the Annual Meeting of the AmericanEducational Research Association, San Diego, CA.
Hancock, G. R. (1997). Structural equation modeling methods of hypothesis testing of latent variablemeans. Measurement and Evaluation in Counseling and Development , 30, 91-105.

8/18/2019 (Contemporary Approaches to Research
http://slidepdf.com/reader/full/contemporary-approaches-to-research 270/284
DISTEFANO ET AL.
274
Hinkle, D.E., Wiersma, W., & Jurs, S. G., (2002). Applied statistics for the behavioral sciences (5thed.). Belmont, CA: Wadsworth Publishing.
Hong, S., Malik, M. L., & Lee, M. K. (2003). Testing configural, metric, scalar, and latent meaninvariance across genders in sociotropy and autonomy using a non-Western sample. Educational
and Psychological Measurement , 63, 636-654.Hoy, W. K., & Miskel, C. G. (1982). Educational administration: Theory, research, and practice (2nd
ed., pp. 185-219). New York: Random House.Hu, L., & Bentler, P. M. (1999). Cutoff criteria for fit indexes in covariance structure analysis:
Conventional criteria versus new alternatives. Structural Equation Modeling , 6 , 1-55.Johnson, B., Stevens, J. J., & Zvoch, K. (2007). Teachers' perceptions of school climate: A validity
study of scores from the revised school level environment questionnaire. Educational and
Psychological Measurement , 67 , 833-844.
Jöreskog, K. G. (1993). Testing structural equation models. In K. A. Bollen & J. S. Long (Eds.), Testing structural equation models (pp. 294-316). Thousand Oaks, CA: Sage.
Jöreskog, K., & Sörbom, D. (1996). LISREL 8: Structural equation modeling with the SIMPLIS
command language. Chicago: Scientific Software International.Lee, V. E., & Burkam, D. T. (1996). Gender differences in middle grade science achievement: Subject
domain, ability level, and course emphasis. Science Education, 80, 613-650.Lezotte, L. W. (1990). A guide to the school improvement process based on effective school research.
Okemos, MI: Effective School Products.Marsh, H. W. (1996). Positive and negative global self-esteem: A substantively meaningful distinction
or artifactors? Journal of Personality and Social Psychology, 70, 810-819.MacNeil, A. J., Prater, D. L., & Busch, S. (2009). The effects of school culture and climate on student
achievement. International Journal of Leadership in Education, 12, 73-84.Mîndrilă, D., May, J., Ishikawa, T., Monrad, D., DiStefano, C., Gareau, S., & Price, K. (2010). The use
of school climate data for school improvement . Paper presented at the Annual Meeting of theAmerican Evaluation Association, San Antonio, TX.
Monrad, D. M., May, R. J., DiStefano, C. Smith, J., Gay, J., Mindrila, D., Gareau, S., & Rawls. A.(2008, April). Parent, student, and teacher perceptions of school climate: Investigations across
organizational levels. Paper presented at the Meeting of the American Educational ResearchAssociation, New York, NY.
National School Climate Center, Center for Social and Emotional Education, & National Center forLearning and Citizenship at Education Commission of the States. (2008). The school climate
challenge: Narrowing the gap between school climate research and school climate policy, practice
guidelines and teacher education policy. Retrieved from: http://www.ecs.org/html/projectsPartners/nclc/docs/school-climate-challenge-web.pdf .
Roney, K., Coleman, H., & Schlichtin, K. A. (2007). Linking the developmental health of middlegrades schools to student achievement. NASSP Bulletin, 91, 289-321.
Sackney, L. (1988). Enhancing school learning climate: Theory, research and practice. Retrieved from:http://www.ssta.sk.ca/research/school_improvement/180.htm
Stewart, E. B. (2008). School structural characteristics, student effort, peer associations, and parentalinvolvement: The influence of school- and individual-level factors on academic achievement.
Education and Urban Society, 40, 179-204.
Tanaka, J. S. (1993). Multifaceted conceptions of fit in structural equation models. In K.A. Bollen & J.S. Long (Eds.), Testing structural equation models. Newbury Park, CA: Sage.
Tubbs, J., & Garner, M. (2008). The impact of school climate on school outcomes. Journal of College
Teaching and Learning , 5, 17-26.Zill, N., & Nord, C. W. (1994). Running in place: How American families are faring in a changing
economy and an individualistic society. Washington, DC: Child Trends.
Christine DiStefanoUniversity of South Carolina, USA

8/18/2019 (Contemporary Approaches to Research
http://slidepdf.com/reader/full/contemporary-approaches-to-research 271/284
INVESTIGATING FACTORIAL INVARIANCE OF TEACHER CLIMATE FACTORS
275
Diana Mîndril ă
University of West Georgia, USA
Diane Monrad
University of South Carolina, USA

8/18/2019 (Contemporary Approaches to Research
http://slidepdf.com/reader/full/contemporary-approaches-to-research 272/284
PART IV
CONCLUSION

8/18/2019 (Contemporary Approaches to Research
http://slidepdf.com/reader/full/contemporary-approaches-to-research 273/284
M.S. Khine (ed.), Application of Structural Equation Modeling in Educational Research and
Practice, 279–283.
© 2013 Sense Publishers. All rights reserved.
MYINT SWE KHINE
13. STRUCTURAL EQUATION MODELING
APPROACHES IN
EDUCATIONAL RESEARCH AND PRACTICE
INTRODUCTION
Over the years, researchers have developed statistical methods to help them
investigate and interpret issues of interest in many discipline areas. These methods
range from descriptive to inferential to multivariate statistics. As the psychometricsmeasures in education become more complex, vigorous and robust methods were
needed in order to represent research data efficiently. One such method is
Structural Equation Modeling (SEM). With the advances in computationalmethods, statistical power to analyse complex data has been increased in recent
years. Many educational researchers started using this technique in their research
and the outcomes of the analysis help to identify the factors and interactions between students’ characteristics, personal preferences, affective traits,
motivational levels, study skills, engagement and various other factors that could
help in educational practice (Teo & Khine, 2009). The chapters in this book presents the collective works on concepts, methodologies and ideas for SEM
approach to educational research and practice. The anthology of current research
described in this book will be a valuable resource for the next generationeducational researchers.
The book is organized into three parts. Part I deals with theoretical foundationson the use of SEM in educational research. In Part II the research papers cover the
use of SEM specifically in learning environment research and in Part III, Structural
Equation Modeling in educational practice is presented followed by the conclusion.
THEORETICAL FOUNDATIONS
In Chapter 1, Teo from the University of Auckland and his colleagues from
National Taichung University provided how Structural Equation Modeling (SEM)can be used as a method for analysing multivariate data both non-experimental and
experimental in educational research. They noted that SEM procedures incorporate both unobserved (latent) and observed variables while other multivariate
techniques are based on observed measurement only. They continue to identify
types of models in SEM and explain in detail each of those models. It was alsonoted that there are five steps in testing SEM models. These five steps are model
specification, identification, estimation, evaluation and modification. The

8/18/2019 (Contemporary Approaches to Research
http://slidepdf.com/reader/full/contemporary-approaches-to-research 274/284
KHINE
280
remaining chapter focused on the test of model fit and model modification. They
concluded that the chapter presented non-technical, non-mathematical, and step-
by-step introduction to SEM with a focus for educational researchers who possess
little or no advanced Mathematical skills and knowledge.
Yo In’nami from Toyohashi University of Technology in Japan introduced thereaders to Structural Equation Modeling (SEM) in a user-friendly way and lists
some of the developments in the field of SEM applications. The chapter explained
the principles, assumptions, strengths, limitations, and applications of SEM for
experimental and non-experimental data. It describes five steps for SEMapplication: (a) model specification, (b) model identification, (c) parameter
estimation, (d) model fit, and (e) model respecification. The chapter also provided brief insights into current issues in the field. Knowledge of these issues is vital for
those who intend to use SEM. In addition, this chapter also described present and
future trends with regard to the development of SEM to better prepare researchers
for studying more advanced topics later in their careers.
STRUCTURAL EQUATION MODELING INLEARNING ENVIRONMENT RESEARCH
Learning environment research, grounded in psychosocial contexts of the
classrooms, has been firmly established as a field of study over the past fourdecades. Educators agree that, although important, academic achievement does not
provide a complete picture of the process of education. The quality of the
environment in which students learn plays an important role in achieving desired
educational outcomes (Fraser, 2001). With the use of survey instruments andinterviews with students, teachers and other stakeholders as a lens, educators are
able to gain valuable information about the social ecology of the classrooms that
could help to improve the instructional approach, classroom management and the
learning organisation. Much research has been conducted to identify the factorsand interactions between students’ characteristics, personal preferences, affective
traits, motivational levels, study skills, and various other factors that could help in
organising conductive learning environments.
In recent years learning environment researchers used SEM as a tool todetermine the effects of the classroom environments and psychological factors
such as motivation, self-regulation, and attitudes towards subjects. Part II of this book contains six chapters that focus on the study of learning environments using
SEM as an analytical tool. In Chapter 3 Marjan Vrijnsen-de Corte and her
colleagues in the Netherlands presented the study on teachers’ perceptions of theschool as a learning environment for practice-based research. In their study,
Structural Equation Modeling (SEM) was used to investigate paths (relations) between respondents’ perceptions of the school as learning environment for
practice-based research (research structure, research culture, and partnership),
motives for performing practice-based research, process variables (planning and
performing research, and evaluating and reporting research), and outcomevariables (research attitude and efficacy beliefs, and teacher efficacy beliefs).

8/18/2019 (Contemporary Approaches to Research
http://slidepdf.com/reader/full/contemporary-approaches-to-research 275/284
SEM APPROACHES IN EDUCATIONAL RESEARCH AND PRACTICE
281
Chapter 4 by Liu and Fraser presented the development and validation of an
English classroom learning environment inventory and its use in China and the
associations between students’ perceptions of the classroom learning environment
and their English-related attitudes and academic achievement were investigated
using structural equation modeling. The learning environment inventory measuredthe scales containing Teacher Support, Task Orientation, Student Cohesiveness,
Cooperation and Oragnization. The inventory has 37 items. The attitude towards
English was measured by Test if English-Related Attitudes questionnaire that has 8
items. The results from structural equation modeling are that Teacher Support,Task Orientation, Student Cohesiveness and Organisation had positive associations
with students' English-related attitudes. The direct association between TaskOrientation and attitudes was positive and statically significant, whereas
Cooperation had a negative and significant impact on attitudes. The authors
suggested that English teachers can make use the newly-developed inventory to
assess students’ perceptions for the improvements in their classroom environments.
Ennest Afari from the Petroleum Institute in Abu Dhabi presented his findingson the effects of psychosocial learning environment on students’ attitudes towards
mathematics in Chapter 5. This chapter reports a study that investigated the effects
of psychosocial features of learning environment on college students’ attitudes
towards mathematics in the United Arab Emirates. The learning environment wasassessed with two scales (Teacher Support and Involvement) from the What Is
Happening In this Class? (WIHIC) questionnaire and one scale (Personal
Relevance) from the Constructivist Learning Environment Survey (CLES).Structural equation modeling (SEM) was used to estimate and test the
hypothesized relationships of 3 learning environment factors (teacher support,involvement and personal relevance) on enjoyment of mathematics lessons and
academic self-efficacy. Results supported the positive effects of 2 learningenvironment factors (teacher support and personal relevance) on enjoyment of
mathematics lessons and academic efficacy.
In Chapter 6, Valayutham, Aldridge and Afari described a comparative
Structural Equation Modeling analysis on students’ learning environment,motivation and self-regulation. The study aimed to identify salient psychosocial
features of the classroom environment that influence students’ motivation and self-
regulation in science learning, and examine the effect of the motivationalconstructs of learning goal orientation, science task value and self-efficacy in
science learning on students’ self-regulation in science classrooms. Finally the
study aimed to compare results from variance and covariance-based structural
equation modeling (SEM) analysis. The comparative analysis of PLS and AMOSapplications indicated that the results were similar for both confirmatory factor
analysis and assessment of the research model.
The purpose of Hasan Seker’s chapter (Chapter 7) is to show how SEM analysis
can benefit learning environment research. His chapter dealt with in/out of schoollearning environment and SEM analyses of attitudes towards school. In Chapter 8,
Lee her colleagues from Hong Kong presented a study that examined the effects of
the teaching and learning environment on the development of students’ generic

8/18/2019 (Contemporary Approaches to Research
http://slidepdf.com/reader/full/contemporary-approaches-to-research 276/284
KHINE
282
capabilities. In their study the students completed a modified version of the Student
Engagement Questionnaire, which measured their perceptions of the development
of six capabilities and their ratings of the quality of six aspects of the teaching and
learning environment. Structural Equation Modeling was used to test two
alternative models on the impacts of the teaching and learning environment uponthe development of the six generic capabilities based on samples of
undergraduates.
STRUCTURAL EQUATION MODELING IN EDUCATIONAL PRACTICE
Part II of this book contains studies related to the use of SEM in educational
practice. The section begins with Liem and Martin’s work on the latent variabl
modelling in educational psychology. The chapter described the manymethodological applications of SEM that are used to answer distinct applied and
substantive questions important to understanding and enhancing students’
educational development. The chapter also synthesized findings from large-scaleSEM studies conducted across elementary school, high school, and
university/college. These studies encompass SEM involving, inter alia,
longitudinal data, mediation, interactions, multi-group analyses, and multi-levelmodeling. The authors also presented some ideas for future SEM applications in
educational research and practice.
In Chapter 10, John Rugutt from Illinois State University demonstrated the SEMapproach to link teaching and learning environment variables to higher order
thinking skills. Specifically the author of this study used the structural equation
model (SEM) approach to test a model that hypothesized the influence ofmotivation (MO), teacher student relations (TSR), and self-efficacy (SE) on higher
order thinking skills (HOTS). Also, the study used confirmatory factor analysis(CFA) to validate MO, TSR, SE and HOT measures. The study further
investigated a SEM model that hypothesized interrelationships among all the study
variables.Binod Sundararajan and his colleagues from Dalhousie University, Halifax,
Canada and North Carolina Central University, USA presented a path analysis
model to examine the influence of group decision in e-Learning and blendedlearning environments. SEM was used to determine the effects of different
variables such as motivation, respects, ability to make friends, self-perception of
group mates and gaining new knowledge. Three hypotheses were tested and the
data was analysed using AMOS. The authors concluded that both asynchronous
and synchronous communication patterns in E-learning and blended learningenvironments allow learners to gain respect from group mates which then
motivates them to have influence in group decision making processes, make
friends, collaborate and have a significant impact on group knowledge gains.
In Chapter 12, Christine DiStefano and her co-researchers from the Universityof South Carolina and the University of West Georgia presented their finding from
the factorial invariance investigation of teacher climate factors across schoolorganizational levels. Six climate dimensions involved in this study were Working

8/18/2019 (Contemporary Approaches to Research
http://slidepdf.com/reader/full/contemporary-approaches-to-research 277/284
SEM APPROACHES IN EDUCATIONAL RESEARCH AND PRACTICE
283
conditions/ leadership (WCL), Home-school relationship (HSR), Instructional
focus (IF), Resources (RES), Social-physical environment (SPE), and Safety
(SAF). Invariance testing and latent means comparisons were conducted by school
organizational level to determine how the model structure, and resulting climate
interpretations, may differ for teachers across elementary, middle, and highschools. The authors concluded that the results can be used to assist schools and
administrators interested in enhancing school climate.
CONCLUSION
In sum, this book brings a range of international examples and theories to illustrate
the applications of SEM in educational research and practice. The challenge for the
researchers and educators is how we can make use of these results in practicalways for the improvement of future education and new generation of learners
across the world.
REFERENCES
Fraser, B. J. (2001). Learning environment research: Yesterday, today and tomorrow. In S. C. Goh &
M. S. Khine (Eds.), Studies in educational learning environments (pp. 1-26). Singapore: World
Scientific.
Teo, T., & Khine, M. S. (2009). Structural equation modelling in educational research: Concepts and
applications. Rotterdam, the Netherlands: Sense Publishers.
Myint Swe KhineCurtin University
Australia

8/18/2019 (Contemporary Approaches to Research
http://slidepdf.com/reader/full/contemporary-approaches-to-research 278/284
285
AUTHOR BIOGRAPHIES
Ernest Afari holds a PhD in Mathematics Education from Curtin University,
Perth, Australia. He is a mathematics lecturer at the Petroleum Institute(Engineering University and Research Centre) in Abu Dhabi, United Arab
Emirates (UAE). His research interests are as follows: Teaching and learning with
a focus on students’ perception of their learning environment; Using Informationand Communication Technologies in teaching mathematics; Issues in teacher
education.
Jill Aldridge is an Associate Professor at the Science and Mathematics EducationCentre at Curtin University, Perth, Australia. Past and present research has focused
on school improvement and the creation of a school culture that is sensitive to the
culturally-specific needs of students from different backgrounds. Her current
research is focused on teacher action research as part of teacher-driven professionaldevelopment as an important component of school improvement.
Theo Bergen is emeritus professor at Eindhoven School of Education (ESoE), theteacher education department of Eindhoven University of Technology. His
research interests are teacher learning, teacher professional development and
school innovation. The past decade he was chair of the Dutch Association of
Teacher Educators (VELON). Theo has also published several articles on the topic
of learning environments, with special attention for the teacher.
Perry den Brok is full professor and research director of the Eindhoven School of
Education (ESoE), the teacher education department of Eindhoven University ofTechnology. His research interests are the study of (science) learning
environments, quantitative research methodology, teacher-student interpersonal
relationships, teacher learning and teacher professional development. He iscurrently chair of the Special Interest Group ‘Learning Environments’ of the
American Educational Research Association (AERA) and European editor of the
Learning Environments Research journal, and has published a host of articles,
chapters and other contributions related to the study of learning environments.
Christine DiStefano is an Associate Professor of Educational Research and
Measurement in the University of South Carolina. Dr. DiStefano teaches courses in
measurement including classroom assessment, survey design, factor analysis, andstructural equation modeling. Her research interests include investigations of child
and adolescent behavior, classification, and applications of structural equation
modeling to ordinal data.
Barry Fraser is John Curtin Distinguished Professor and Director of Science and
Mathematics Education Centre at Curtin University in Perth, Australia. He is

8/18/2019 (Contemporary Approaches to Research
http://slidepdf.com/reader/full/contemporary-approaches-to-research 279/284
AUTHOR BIOGRAPHIES
286
Editor-in-Chief of Springer’s Learning Environments Research: An International
Journal , Co-editor of Springer’s Second International Handbook of Science
Education (2012) and Co-editor of Sense Publishers’ book series “Advances in
Learning Environments Research.” He is a Fellow of six academies/associations
including the International Academy of Education, American EducationalResearch Association and American Association for the Advancement of Science.
Yo In’nami is an Associate Professor of English at Shibaura Institute of
Technology, Japan. He is also a PhD candidate’s adviser and an external Ph.D.examiner at Temple University Japan. He taught postgraduate courses on structural
equation modeling and meta-analysis. He is interested in meta-analytic inquiry intothe variability of effects and the longitudinal measurement of change in language
proficiency. He has published in International Journal of Testing, Language
Assessment Quarterly, Language Testing, System, and TESOL Quarterly. He
received TOEFL Small Grants for Doctoral Research in Second or Foreign
Language Assessment from Educational Testing Service in 2006.
Marcel Kamp is assistant professor and teacher educator at the Institute for
Teaching and School (ILS), the teacher education department of Radboud
University of Nijmegen. His research interests are teaching and learning in science,more in particular the school subject of biology.
Myint Swe Khine is the Head of Graduate Programs and Research at the BahrainTeachers College, University of Bahrain. Prior to this position he worked at the
Nanyang Technological University in Singapore. He earned postgraduatequalifications from the University of Southern California, Los Angeles, USA,
University of Surrey, Guildford, UK, University of Leicester, Leicester, UK andCurtin University of Technology, Perth, Australia. He publishes widely in
academic journals and has edited several books. He is the Editor-in-Chief of the
referred scholarly journal International Review of Contemporary Learning
Research. His latest books, Large Scale School Reform and Social Capital Building (Routledge, United Kingdom) and Critical Analysis of Science Textbooks
(Springer, the Netherlands) were published in 2013. He also holds Adjunct
Professor position in the Science and Mathematics Education Centre at CurtinUniversity of Technology, Australia.
Rie Koizumi is an Associate Professor of English at Juntendo University, Japan.
She taught postgraduate courses on research into speaking and listening. She isinterested in examining the validity of the interpretations and uses of the scores of
speaking and vocabulary tests and in modeling factor structures of language ability
and performance, especially with respect to fluency, accuracy, and syntactic
complexity of oral production. Her publication has appeared in Language Assessment Quarterly, Language Testing , International Journal of Testing , TESOL
Quarterly, JALT Journal , and other journals.

8/18/2019 (Contemporary Approaches to Research
http://slidepdf.com/reader/full/contemporary-approaches-to-research 280/284
AUTHOR BIOGRAPHIES
287
Wincy W.S. Lee is a Post-doctoral Fellow at the Faculty of Education, The
University of Hong Kong, where she also received her PhD in Educational
Psychology. Her main research interests are topics in relation to learning and
instruction, including characterizing and measuring of epistemic beliefs, use of
learning environment to foster epistemic change and implementation of Outcome- based Education. She has disseminated research findings in these areas in various
international conferences. She is currently investigating the use of Knowledge
Building to advance college teachers’ and students’ epistemic beliefs at sub-degree
sector in Hong Kong.
Doris Y. P. Leung is an Assistant Professor at the Nethersole School of Nursing,The Chinese University of Hong Kong. She received her PhD in Biostatistics from
the University of California, Los Angeles. Her main interests are in psychometrics
and the application of structural equation modeling in educational and health
psychology. She has published numerous journal articles and book chapters in
these areas. She is currently investigating the impacts of the specific characteristicsin the teaching and learning environment on capability development in various
sectors in higher education.
Gregory Arief D. Liem, PhD, is an Assistant Professor at the National Institute ofEducation, Singapore. His research interests and specializations are in the areas of
academic motivation, engagement, measurement, and structural equation
modeling. He is currently a member of the Editorial Board of the Australian Journal of Guidance and Counselling, Measurement and Evaluation in
Counselling and Development, and Asia-Pacific Education Researcher. He has published numerous journal articles and book chapters and co-edited five books,
including his latest one, Advancing cross-cultural perspectives on educational psychology: A festschrift for Dennis McInerney (2013, Information Age
Publishing).
Liyan Liu, a Visiting Research Fellow at the Science and Mathematics Education
Centre, Curtin University in Australia, is an Associate Professor in the School of
Foreign Languages, Northeast Normal University, China. Her research interests
include learning environments and teacher education. Some of her publicationshave appeared in Foreign Language Learning Theory and Practice, Journal of
Northeast Normal University and Studies in Foreign Education.
Kenneth C.H. Lo received the B.Eng and Ph.D. degrees in electrical engineeringfrom The Hong Kong Polytechnic University, Hong Kong, in 1999 and 2003
respectively. He is currently a Senior Lecturer and Programme Leader of Associate
Degree in Engineering, Hong Kong Community College at The Hong KongPolytechnic University. His research interests include fuzzy control, model-based
fault diagnosis, soft computing methods, and students’ learning and teaching in
engineering programme.

8/18/2019 (Contemporary Approaches to Research
http://slidepdf.com/reader/full/contemporary-approaches-to-research 281/284
AUTHOR BIOGRAPHIES
288
Jill Manderson is an Assistant Professor of Management and teaches Business
Communication and Corporate Communication. Her research interests are in
gender differences in communication; literature as a tool for examining business
communications; conscious and unconscious communication through words and
body, learning and assessment.
Andrew Martin, BA (Hons), MEd (Hons), PhD, is Professorial Research Fellow
at the University of Sydney specializing in motivation, engagement, achievement,
and quantitative research methods. He is also Honorary Senior Research Fellow inthe Department of Education, University of Oxford. Andrew is in the Top 25 of
International Rankings of the Most Productive Educational Psychologists (Source:Jones et al., Contemporary Educational Psychology, 2010). He is Associate Editor
of British Journal of Educational Psychology, immediate-past Associate Editor of
Journal of Educational Psychology, and on Editorial Boards of two international
journals ( Journal of Educational Psychology; American Educational Research
Journal; Contemporary Educational Psychology).
Diana Mîndrilă is an Assistant Professor of Educational Research at the
University of West Georgia. She teaches courses in quantitative research
methodology and is interested in using structural equation modeling andmultivariate classification procedures to investigate school climate and student
behavior.
Diane M. Monrad is the Director of the South Carolina Educational Policy Center
(SCEPC) in the College of Education at USC-Columbia and an Associate ResearchProfessor in the Department of Educational Leadership and Policies. Dr. Monrad
conducts program evaluations and policy research on a variety of topics in K-12education such as school climate, summer reading loss, and school reform
programs.
John Rugutt is an Associate Professor of educational research, applied statisticsand educational technology in the Department of Educational Administration and
Foundations at Illinois State University. His research and scholarship focus on
teaching and learning environments with special emphasis on using multileveltechniques to understand individual and institutional factors on learning. John has
published and co-authored several articles both in refereed journals such as the
Journal of Personnel Evaluation in Education, Planning and Changing ,
Educational Research Quarterly, Journal of Educational Research and PolicyStudies and in other professional sources such as research monographs, research
grants, book chapters and project reports.
Hasan Şeker is Associate Professor in the Faculty of Education at MuğlaUniversity. He holds the degrees of BEd, Master of Arts (MA), and PhD in
Curriculum studies. Title of the MA Thesis is ‘The Evaluation of Primary School
Programs’, the PhD thesis title is ‘Academic achievements of the students of

8/18/2019 (Contemporary Approaches to Research
http://slidepdf.com/reader/full/contemporary-approaches-to-research 282/284
AUTHOR BIOGRAPHIES
289
primary schools attending village and city primary schools in courses and family,
teaching, behavioral and social factors that affect the achievement of the students
of village primary schools’. He has diverse research interests: Curriculum studies,teacher education, assessment and evaluation of teaching and learning process.
Dr Şeker teaches a number of curriculum studies and teacher education
courses including curriculum studies and teaching and learning processes at the
Faculty of Education, Muğla University, Turkey. Dr. Şeker can be contacted at
[email protected], [email protected].
Lorn Sheehan, recently promoted to Professor, teaches Strategic Management and
his research is related to tourism destination management and stakeholdermanagement. He teaches in the areas of strategic management and tourism
management and has published in leading journals in the tourism field and
delivered numerous conference presentations related to his research. Lorn hasserved on boards of various industry and educational organizations including
Tourism Calgary (as Chair); Calgary Tourism Education Consortium (as Chair);
Calgary Chamber of Commerce on the Tourism Committee (as Chair),Environment Committee, Tax and Economic Affairs Committee; Alberta Chamber
of Commerce Policy Committee; Calgary and Area Tourism Destination Region
(as Vice-Chair); and the Travel and Tourism Research Association.
Binod Sundararajan is a recently tenured Associate Professor of Managementand teaches Business Communication, Corporate Communication and Core
Business Applications. His research interests lie in organizational, professional and
business communication; computer-mediated communication; Computer-Supported Collaborative Learning (CSCL), and social network analysis. Heconducts research in business and professional communication practices, adoption
and diffusion of mediated technologies, use of CMC in such diverse areas as
immigrant entrepreneurship, justice, teaching, collaborative work and learning.
Malavika Sundararajan is an Assistant Professor of Strategy andEntrepreneurship and teaches courses in International, Social and Technological
Entrepreneurship at both the undergraduate and graduate. She is currently
developing certificate programs in Entrepreneurship based on the needs of theDurham region to help in job creation. In addition to research work in innovation,
social and immigrant entrepreneurship, her focus has been in the cognitive-
emotional characteristics of entrepreneurs and its impact on local and global new
venture success.
Timothy Teo (Ph.D.) is Associate Professor at the Faculty of Education,University of Auckland. His research interests are multi-disciplinary in nature and
include both substantive and methodological areas. These are Educational
Psychology (Self-efficacy-teachers and students; Beliefs about teaching andlearning; Meta-cognition), ICT in Education (Technology acceptance and
adoption; e-learning), Music Education (Psychological processes of music teaching

8/18/2019 (Contemporary Approaches to Research
http://slidepdf.com/reader/full/contemporary-approaches-to-research 283/284
AUTHOR BIOGRAPHIES
290
and learning), and Quantitative Methods (Psychometrics; Instrument development
and validation; cross-cultural measurement; issues in survey development and
administration; structural equation modeling; multilevel modeling; latent growth
modeling; Item Response Theory modeling). Timothy is chief editor of two
international journals and sits in over 20 journal editorial boards. As an author, hehas edited two books and published 98 peer-reviewed journal articles in many
well-regarded journals in his fields. These include Computers and Education,
Educational and Psychological Measurement , Interactive Learning Environment ,
Journal of Computer Assisted Learning , British Journal of EducationalTechnology, Journal of Research in Music Education, Computers in Human
Behavior , The Internet and Higher Education, Asia-Pacific Journal of Teacher Education, and Journal of Psychoeducational Assessment .
Liang-Ting Tsai received the B. A. degree from I-Shou University with a major
subject in applied mathematics, Taiwan, in 1999. Subsequently, he got the M.S.
degree from National Taichung Teachers College and Sc. D. degree from the National Taichung University of Education, Taiwan, in 2001 and 2009,
respectively, all in Educational Measurement & Statistics. He is currently a
postdoc research fellow in the Cognitive NeuroMetrics Laboratory, Graduate
Institute of Educational Measurement & Statistics, National Taichung University.He has a broad research interest in the area of survey methodology and structural
equation models and has published many academic papers in topics related to these
fields.
Sunitadevi Velayutham is an experienced science educator who has worked withhigh school students for the past twenty two years. She received a PhD in Science
Education from Curtin University, Perth, Australia. Her research interests are instudent motivation and self-regulation, classroom learning environment,
questionnaire development and the use of Structural Equation Modeling
applications in research analysis. She has published articles in refereed journals
and international conferences. In 2010, she received the Postgraduate StudentResearch Award from the Australian Association for Research in Education.
Marjan Vrijnsen-de Corte defended her Ph.D. on teacher practice-based researchat the Eindhoven School of Education (ESoE), the teacher education department of
Eindhoven University of Technology. She originally obtained a Masters in social
geography and teacher education, but decided to pursue a career in research on
teaching and teacher education. The contribution to this book was based on one ofthe chapters of her dissertation, which investigated the link between the school as
learning environment for research, teacher research activities, and teacher learning
outcomes as a result of conducting practice-based research.
Chih-Chien Yang received his Ph.D. in applied statistics and psychometrics at
University of California, Los Angeles (UCLA). He also served as visiting scholar
at several institutes, including Academia Sinica (Statistical Science, Linguistics,

8/18/2019 (Contemporary Approaches to Research
http://slidepdf.com/reader/full/contemporary-approaches-to-research 284/284