Contaminants in fish from Etnefjord, Norway · mercury (Hg), lead (Pb), cadmium (Cd) and arsenic...
38
Contaminants in fish from Etnefjord, Norway TA 2821 2011 Prepared by/in collaboration with NILU – Norwegian Institute for Air Research
Transcript of Contaminants in fish from Etnefjord, Norway · mercury (Hg), lead (Pb), cadmium (Cd) and arsenic...

Contaminants in fish from Etnefjord, Norway
TA
2821
2011
Prepared by/in collaboration with NILU – Norwegian Institute for Air Research


3
TA-2821/2011
ISBN 978-82-425-2431-7 (trykt)
ISBN 978-82-425-2432-4 (elektronisk)
Client: Climate and Pollution Agency
Contractor: NILU – Norwegian Institute for Air Research
Contaminants in fish from Etnefjord, Norway
TA
2821
2011
Authors: Espen Mariussen, Martin Schlabach
NILU project number.: O-111053
NILU report number : OR 50/2011

4
5
Preface
NILU was engaged by The Norwegian Climate and Pollution Agency (Klif) to monitor the
levels of hexabromocyclododecane (HBCDD), polybrominated diphenyl ethers (PBDEs),
polychlorinated biphenyls (PCBs), hexachlorocyclohexane (HCH),
dichlorodiphenyltrichloroethane (DDT), mercury (Hg), lead (Pb), cadmium (Cd) and arsenic
(As) in cod and flounder from Etnefjorden. Etnefjorden is a branch of the Hardangerfjord at
the southwest coast of Norway. Recently, high levels of HBCDD in fish from Etnefjorden
were reported, which raised some concerns about the state of pollution in this fjord.
Cod and flounder were collected from Etnefjord in December 2010 by the local fisherman
Lars Moe. Responsible for the sampling of fish was Sigurd Øxnevad from Norwegian
Institute for Water Research (NIVA).
Responsible for the preparation and clean-up of the fish samples were Ellen Katrin Enge,
NILU. Anders Borgen, Hans Gundersen and Mebrat Ghebremeskel were responsible for the
instrumental analyses, Espen Mariussen was the main author of the report, and Martin
Schlabach was project leader. Responsible at Klif was Bård Nordbø.
Kjeller, September 2011
Martin Schlabach
Senior scientist

6

7
Summary ................................................................................................................................... 9
Norsk sammendrag ................................................................................................................ 11
1. Introduction .............................................................................................................. 13
2. Materials and Methods ............................................................................................ 14 2.1 Sampling .................................................................................................................... 14 2.2 Sample preparation..................................................................................................... 15
2.2.1 Sample preparation for HBCDD, PCB, DDT, HCH and PBDE analysis .......... 15 2.2.2 Sample preparation for Hg, Pb, Cd and As analysis .......................................... 15 2.2.3 Lipid extraction .................................................................................................. 15
2.3 Analysis ...................................................................................................................... 15
2.3.1 Analysis of HBCDD ........................................................................................... 15 2.3.2 Analyses of PCB, DDT, HCH and PBDE .......................................................... 16 2.3.3 Analyses of Hg, Pb, Cd and As .......................................................................... 16 2.3.4 Measurement uncertainty ................................................................................... 16
3. Results and Discussion ............................................................................................. 17 3.1 HBCDD concentrations in fish .................................................................................. 17
3.2 Concentrations of other halogenated pollutants in fish .............................................. 19
3.2.1 Polybrominated diphenyl ethers (PBDEs) ......................................................... 19
3.2.2 Polychlorinated biphenyls (PCBs) ..................................................................... 20 3.2.3 Dichlorodiphenyltrichloroethane (DDT) and DDT metabolites ........................ 20
3.2.4 Hexachlorocyclohexane (HCH) ......................................................................... 20 3.3 Concentrations of Hg, Pb, Cd and As ........................................................................ 20
4. Conclusions ............................................................................................................... 22
5. References ................................................................................................................. 23
Appendix……………………………………………………………………………………..27

8

9
Summary
1,2,5,6,9,10-hexabromocyclododecane (HBCDD) is one of the most frequently used
brominated flame retardants (BFR) and is considered as an emerging environmental pollutant.
Recently, high levels of HBCDD were reported in five different fish species from Etnefjord,
which is a branch of the Hardangerfjord at the southwest coast of Norway. This report raised
some serious concerns and the Norwegian Climate and Pollution Agency (Klif) therefore
initiated a survey of HBCDD in cod and flounder from Etnefjorden in order to confirm the
findings. In addition to HBCDD, the levels of other environmental pollutants were analyzed
in the fish, namely polybrominated diphenyl ethers (PBDEs), polychlorinated biphenyls
(PCBs), hexachlorocyclohexane (HCH), dichlorodiphenyltrichloroethane (DDT), mercury
(Hg), lead (Pb), cadmium (Cd) and arsenic (As). The fish muscle filet and livers were
prepared and analyzed using recognized and previously published methods. The levels of
HBCDD in the fish were low, representing expected background concentrations. HBCDD was
only detected in the cod livers with concentrations in the range 0.3-5.7 ng/g wet weight,
corresponding to 1.3-8.2 ng/g on a lipid weight basis. Previously, it was reported a level of
30 000 ng/g lipid weight in cod filet, which is, as far as we know, the highest HBCDD
concentration ever reported in cod. Our study could, therefore, not confirm the recent findings
that showed high HBCDD concentrations in fish from the Etnefjord area. Also, the levels of
the other pollutants were low. For example, the concentrations of DDT, PCB, HCH and Hg
can, according to Klifs system for classification of environmental state, be regarded as
background levels (class 1, slightly/negligible polluted). In conclusion, there are no reasons to
believe that cod and flounder in Etnefjorden are exposed to considerable amount of
environmental pollutants, neither of HBCDD nor other contaminants. Only further analysis of
sediments from the inner site of the fjord can, however, positively reveal a possible HBCDD
source.

10

11
Norsk sammendrag
1,2,5,6,9,10-hexabromocyclododecane (HBCDD) er en av de mest benyttede bromerte
flammehemmerne og regnes for å være en potensiell miljøgift. Nylig ble det, av en tysk
forskningsgruppe, rapportert svært høye HBCDD-konsentrasjoner i forskjellige typer fisk
hentet fra Etnefjorden. Etnefjorden er en fjordarm tilknyttet Hardangerfjorden på
sørvestlandet. Den tyske rapporten vakte bekymring og Klima og forurensningsdirektoratet
(Klif) tok derfor initiativ til å måle innholdet av HBCDD i torsk og flatfisk hentet fra
Etnefjord for å få bekreftet funnene. I tillegg til HBCDD ble det også analysert på andre
miljøgifter som polybromerte difenyletere (PBDE), polyklorerte bifenyler (PCB),
heksaklolorosykloheksan (HCH), diklorodifenyltrikloroetan (DDT), kvikksølv (Hg), bly (Pb),
kadmium (Cd) og arsen (As). Miljøgiftene ble bestemt i fiskefilet og/eller i lever med
anerkjente og tidligere publiserte metoder. Nivåene av HBCDD i fisken viste seg å være lave
og representerer forventede bakgrunnskonsentrasjoner. HBCDD ble kun detektert i
torskelever med konsentrasjoner fra 0,3-5,7 ng/g våtvekt som tilsvarer 1,3-8,2 ng/g på
fettvektsbasis. Tidligere ble det rapportert en konsentrasjon på 30 000 ng/g på fettvektsbasis i
torskefilet. Dette er vesentlig høyere enn det vi målte. Vi kunne derfor ikke bekrefte funn av
høye HBCDD-konsentrasjoner i fisk fra Etnefjord. Nivåene av de andre miljøgiftene var også
lave og representerer forventede bakgrunnskonsentrasjoner. Nivåene av for eksempel DDT,
PCB, HCH and Hg kan klassifiseres, i henhold til Klifs klassifiseringssystem for
miljøtilstand, som ubetydelig (Klasse 1). Konklusjonen er at det ikke er grunn til å tro at torsk
og flatfisk fra Etnefjorden er eksponert for betydelige nivåer av miljøgifter, verken for
HBCDD eller andre viktige miljøgifter. Det er vanskelig å spekulere rundt årsakene til at våre
funn avviker fra det som tidligere ble funnet. En analyse av sediment hentet fra det indre
fjordbassenget vil kunne bekrefte eller avkrefte et utslipp av HBCDD.

12

13
1. Introduction
1,2,5,6,9,10-hexabromocyclododecane (HBCDD) is one of the most frequently used
brominated flame retardants (BFR) with an estimated annual demand of 16 700 metric tons in
2001 (de Wit, 2002; Law et al., 2006). The industrial application of HBCDD has increased
during the last decade concomitantly with restrictions on the use of polybrominated diphenyl
ethers (PBDEs) (Prevedouros et al. 2004, Morf et al. 2007). HBCDD is primarily used in
extruded and expanded polystyrene for thermal insulation in buildings, but is also used in
certain textiles (Remberger et al., 2004; UNEP, 2010; Posner and Säll, 2011). The European
Union has recently implemented HBCDD into the authorization procedure under REACH as a
substance of very high concern (Commission regulation (EU) No 143/2011).
Recent investigations have revealed that HBCDD must be considered as an ubiquitous
environmental contaminant. The ubiquitous presence of HBCDD is attributed to long-range
atmospheric spread, as shown by use of air sampling and the findings of HBCDD in polar
bears from the arctic (de Wit et al., 2010; Morris et al., 2004; Remberger et al, 2004).
HBCDD is further found in guillemot eggs and marine mammals at concentration up to 6.8
mg/kg lipid weight (Morris et al., 2004; Lindberg et al., 2004). This is even higher than what
is found of polybrominated diphenly ethers (PBDEs) in trout in Lake Mjøsa and PCB in char
from Lake Ellasjøen in Bear Island (Mariussen et al., 2008; deWit 2006). In Åsefjorden, at the
west coast of Norway, which is a source area with extremely high levels of HBCDD in the
sediments, it has been reported a level of 200 ng/g lipid weight in eggs from common eider
(Haukås et al., 2009) and 114 ng/g lipid weight in cod liver (Berge et al., 2006). Elevated
levels of HBCDD are also found in the blood of workers, which have come into contact with
the substance (Thomsen et al, 2007).
In a recent work by Köppen et al., (2010) very high levels of HBCDD were reported
in fish caught from Etnefjorden, southwest in Norway (Fig 1) indicating a source of HBCDD
contamination in the area. In codfish filet it was reported a level of approximately 30 g/g on
a lipid weight basis. No lipid content was reported in their report. Cod is a lean fish, but with
a lipid content of 0.5% this is equivalent to a wet weight concentration of approximately 0.15
g/g, which is, as far as we know, the highest concentration ever reported in cod. In flounder,
Köppen et al., (2010), further reported a concentration of approximately 0.7 g/g lipid weight.
No sources of HBCDD were identified in the surrounding area in their study. Both cod and
flounder are lean fish species, and lipid based concentrations may give a false impression of
the actual levels. Nevertheless, the work of Köppen et al. (2010) in Etnefjorden has raised
some serious concerns. The Norwegian Climate and Pollution Agency (Klif) therefore
initiated a monitoring survey of HBCDD in cod and flounder from Etnefjorden in order to
confirm the recent findings by Köppen et al., (2010). Increased levels of one pollutant may be
followed by elevated levels of other environmental toxicants. To identify the general level of
pollutants in these fish species from the fjord, the fish were in addition analyzed for the level
of polybrominated diphenyl ethers (PBDEs), polychlorinated biphenyls (PCBs),
hexachlorocyclohexane (HCH), dichlorodiphenyltrichloroethane (DDT), mercury (Hg), lead
(Pb), cadmium (Cd) and arsenic (As).

14
2. Materials and Methods
2.1 Sampling
Fish, 10 individuals of Atlantic Cod (Gadus morhua), 9 individuals of the flatfish Common
dab (Limanda limanda), and 1 individual of the flatfish Torbay sole (Glyptoceophalus
cynoglossus), were collected in Etnefjorden at the southwest coast of Norway in December
2010 by fish net. The cods were sampled at a depth of approximately 40 m at the Holmaseid
area (approximate GPS position: UTM32 6616926N 321685E) and the flounders were
sampled at depth of approximately 15 m at the Osvågen area (approximate GPS position:
UTM32 6616073N 325572E) (Fig 1). Near Holmaseid, it has previously been found dumped
car wrecks, which may be suspected to contain HBCDD (Hamre and Westrheim, 2009).
Responsible for the sampling of fish was Norwegian Institute for Water Research (NIVA).
Sex, size, weight and liver weight for each individual was determined (Table 1). Samples of
filets and livers were taken, put into glass containers and kept frozen at –20°C until
preparation for analysis. The samples were analyzed either as individual fish or as pooled
samples of multiple organisms.
Figure1. The sampling sites of fish in the area of Holmaseid and Osvågen respectively, and
the sampling site of fish as reported in Köppen et al., (2010).
Table 1. Sampling data for the fish species investigated in the present work (m = male; f =
female).
15
2.2 Sample preparation
2.2.1 Sample preparation for HBCDD, PCB, DDT, HCH and PBDE analysis
Individual livers from flounder and cod were prepared for HBCDD-analysis. Pooled samples
of the ten filets from cod and flounders were prepared for HBCDD, PBDE, PCB, HCH and
DDT analysis. Pooled samples of the ten livers from cod and flounders were prepared for
PBDE, PCB, HCH and DDT analysis. The torbay sole was pooled together with the 9
individuals of the common dab. Both livers and filets were prepared similarly. Aliquots of
fish filet (5g) and liver (0.5-1g) were homogenized and mixed with sodium sulphate
(pretreated 12 h at 600 C) to remove water. The samples were spiked with internal standards:
d18-labeled α-, β-, and -HBCDD; 13
C-labelled PBDE-28, -47, -99, -153, -183 and –209; 13
C-
labeled α-, β-, and -HCH; 13
C -labeled p,p’- DDE and p,p’-DDT; 13
C -labeled PCB-28, -52, -
101, -105, -114, -118, -123, -138, -153, -156, -157, -167, -180, -189, and -209. The sodium
sulphate homogenates were then subjected to cold-column extraction with cyclohexane and
ethyl acetate (1:1). To remove lipids, 5 ml of the crude extracts were subjected to gel
permeation chromatography with cyclohexane and ethyl acetate (1:1) as mobile phase. The
extracts were evaporated to dryness and dissolved in approximately 1ml n-hexane and
subjected to further clean-up on a silica column with 4 g activated silica eluting with 60 ml of
ether/hexane (1:9, by volume). For the extracts that were subjected to HBCDD-analysis, 13
C-
labeled α- β and -HBCDD was added as recovery standard before solvent change to
methanol and attributed to analysis on LC-MS (Haukås et al., 2009). The purified extracts
subjected to PBDE, PCB, HCH and DDT analysis were added 1, 2, 3, 4-tetrachloronaphtalene
(1, 2, 3, 4-TCN) as recovery standard before solvent change to iso-octane and subjected to
GC/HRMS-EI analysis (Mariussen et al., 2008; Halse et al., 2011).
2.2.2 Sample preparation for Hg, Pb, Cd and As analysis
Aliquots of the pooled samples of cod and flounder filet were prepared for Hg analysis.
Aliquots of the pooled samples of cod and flounder liver were prepared for Pb, Cd and As
analysis. Approximately 0.5g of the samples were subjected to microwave assisted digestion
with final volume of 5 ml of concentrated nitric acid and 3 ml hydrogen peroxide. After
digestion the samples were diluted to approximately 1% final concentration of nitric acid and
subjected to metal analysis.
2.2.3 Lipid extraction
The lipid content of the samples was determined gravimetrically. Aliquots of the fish and
samples were homogenized in Na2SO4 to remove water and extracted with 100ml
dichloromethane. The solvent was evaporated into dryness, and the residue weighed. The
residue was considered as the lipid fraction of the samples.
2.3 Analysis
2.3.1 Analysis of HBCDD
The methanol extracts were analyzed for α-, β-, and γ-HBCDD using a Waters 2690 HPLC
coupled to a single quadrupole Micromass z-spray mass detector (ZMD) in electro spray
negative mode (ESI-) as described in detail in Haukås et al., (2009). The HBCDD
diastereomers were separated on a reversed phase C18-column from Atlantis (150 mm, 2.1
mm id, 3.0 m particle size) employing a trinary gradient of methanol (A), acetonitril (B) and
water (C) as eluent. The initial mobile phase (time zero) composition of 30 % A, 10 % B and
60 % C was changed to 83 % A, 15 % B and 2 % C after 12 minutes. The HBCDD

16
diastereomers were monitored at mass-to-charge ratio (m/z) of the molecular ions [M-H]¯. m/z
of the selected primary/secondary ions were 640.64/638.64, 652.64/650.64 and 657.74/655.74
for the 12
C-diastereomers, 13
C - and d18- labelled standards, respectively. Sum of the primary
and secondary ions were used in the quantification with the ratio between the two ions as
verification.
2.3.2 Analyses of PCB, DDT, HCH and PBDE
Analyses of the PCB and PBDE congeners, α-HCH, β-HCH, γ-HCH, p,p’-DDE, p,p’-DDD,
o,p’-DDT and p,p’-DDT, HCB, were performed with GC/HRMS on an Agilent 6890N gas
chromatograph coupled to a Waters AutoSpec mass spectrometer in electron impact (EI)
mode. The compounds were detected by monitoring at m/z of the molecular ions. The GC was
operating in splitless mode with helium as a carrier gas. The PCB congeners were separated
using a HT-8 (50 m×0.22 mm inner diameter (SGE)) fused silica capillary column. Separation
of α-HCH, β-HCH, γ-HCH, p,p’- DDE, p,p’-DDD, o,p’-DDT and p,p’-DDT, compounds
were done by use of a HP-1 (25 m×0.2 mm inner diameter (J&W Scientific)) fused silica
column. The PBDEs were separated with a fused silica capillary column from Zebron (ZB-1,
15m, 0.25mm id, 0.1 µm film thickness). The congeners were quantified with the labelled
compounds added as internal standards. Procedure blanks were regularly prepared to control
background contamination. Detailed descriptions of the analyses are given in Mariussen et al.,
2008 for the PBDEs and in Halse et al. (2011) for the chlorinated compounds.
2.3.3 Analyses of Hg, Pb, Cd and As
The fish extracts were analyzed for Pb, Cd and As on an ICP-MS (Element 2, Thermo
Scientific). Each sample was added internal standard and quantified with the use of an
external standard curve. Mercury in the extracts was determined as Hg-total. All mercury
species in the sample were oxidized to Hg2+
with BrCl. Determination of Hg-total was then
performed using the fully automated Tekran 2600 system (CV-ASS, cold vapor atomic
fluorescence spectrometer. To ensure correct quantification of the metals, a reference solution
of a known metal concentration was analyzed. A deviation of 10% from the given
concentration in the reference solution was accepted. Blanks were regularly analyzed to
control for background contamination.
2.3.4 Measurement uncertainty
With the exception of HBCDD and PBDE NILU is accredited according to EN/NS-17025 for
the analysis of all measured compounds in the fish samples. For all compounds NILU is
regularly participating in international laboratory intercalibrations (e.g. Liane and Becher,
2010). NILUs performance in these intercalibration studies is satisfactory. Based on this the
total expanded measurement uncertainty is estimated to be in the range of 20 to 30 %.

17
3. Results and Discussion
3.1 HBCDD concentrations in fish
The observed levels of HBCDD in cod livers ranged from 0.3-5.7 ng/g wet weight, which
corresponds to 1.3-8.2 ng/g on a lipid weight basis Table 2. Only α-HBCDD was detected in
the cod livers, whereas the concentrations of β- and γ-HBCDD were below detection limits of
approximately 50 pg/g wet weight. Neither of the HBCDD congeners was detected in the
flounder livers or in the pooled filet samples. Detection limits in flounder livers were 80 pg/g
( 40 SD), 80 pg/g ( 40 SD) and 50 pg/g ( 30 SD) for α- β- and γ-HBCDD respectively on
a wet weight basis, which corresponds to detection limits of 0.6 ng/g ( 0.4 SD), 0.6 ng/g (
40 SD) and 0.4 ng/g ( 0.2 SD) on a lipid weight basis. The mean lipid content in the flounder
livers was 22% ( 12 SD), ranging from 6.2-41%. Detection limits of the cod and flounder
filets were 5 pg/g for all three congeners, which corresponds to detection limits of 1.7 and 0.9
ng/g respectively on a lipid weight basis. The lipid content in cod and flounder was low and
the lipid contents in the pooled samples were 0.29% and 0.55% in the cod and flounder
samples respectively.
Table 2. The levels of HBCDD and the lipid content in the cod livers (nd = not detected).
Köppen et al (2010) reported high HBCDD levels in fish filets, especially in cod with a
reported lipid based concentration of approximately 30 000 ng/g. The results were, however,
only reported on a lipid weight basis and lipid content were not presented. Cod is a lean fish
with low lipid content in the muscle tissue; most lipids are stored in the liver. In our study, the
mean lipid content in the cod filet was 0.44% ( 0.25 SD) and 0.60 % ( 0.33 SD) in the
flounder filet. The conversion of contaminant level from wet weight to lipid weight, may give
the impression of a disproportionately high level of the pollutant in the animal. The
concentration level should, therefore, be reported both on a wet weight and lipid weight basis.
Taking into account an approximate lipid content of 0.5% in cod and flounder, and 7.5% in
mackerel (Grégoire et al., 1994), Köppen et al (2010) found an approximate level of
HBCDD of 150 ng/g wet weight in cod filets (30 000 ng/g lipid weight), HBCDD of 3.5
ng/g wet weight in flounder filets (680 ng/g lipid weight) and 16 ng/g wet weight in mackerel
(220 ng/g lipid weight), which are substantially higher levels than found in our investigation.
Our findings indicated that the fish from Etnefjorden, contained HBCDD at concentrations
close to environmental background levels (de Wit et al., (2006) and Law et al., (2006)). Other
recent studies have reported similar levels. Shaw et al., 2009 reported a mean HBCDD
concentrations in mackerel from the northwest Atlantic marine food web of 14 ng/g lipid
weight, corresponding to a wet weight concentration of 1.4 ng/g. Jenssen et al., (2007)
reported a HBCDD concentration of 22 ng/g lipid weight in Atlantic cod and 12 ng/g lipid
weight in polar cod. In the study by Jenssen et al (2007), HBCDD levels were analyzed in

18
whole fish and no lipid content was reported, but with an approximate lipid content of 2%, the
concentrations corresponds to approximately 0.5 ng/g wet weight. Montie et al., (2010)
reported a level of 0.8-15 ng/g lipid weight in whole winter flounder from the Northwest
Atlantic Ocean. The reported levels in cod by Köppen et al., (2010) were even higher than the
levels reported in cod sampled from the Norwegian fjord, Åsefjorden, which is highly
contaminated by HBCDD from a polystyrene factory (Berge et al., 2006; Haukås et al., 2009).
Here, HBCDD was detected in both cod filet and liver. A concentration of 17 ng/g lipid
weight (0.05 ng/g wet weight) was reported in filet, and 114 ng/g lipid weight (44 ng/g wet
weight) was reported in liver (Berge et al., 2006). Köppen et al (2010) measured HBCDD in
fish filet, but did not analyze fish livers. The levels of lipid soluble contaminants, such as
HBCDD, in different organs usually differs, but are nevertheless expected to correlate. Also,
from the limited data available, HBCDD levels in cod are reported higher in liver than in
muscle (Berge et al. 2006). Moreover, in a separate study, Sellstrøm et al., (1998) reported a
level of 8000 ng/g lipid (40 ng/g wet weight) in pike filet sampled downstream of a possible
HBCDD point source, which is a factor of four less than what was reported by Köppen et al.,
(2010) in cod..
In the work by Köppen et al (2010) it was also reported high levels of the β- and γ-HBCDD
diastereomers, indicating that the fish was sampled near a source area with considerable
release of HBCDD. Technical mixtures of HBCDD contain 70-90% γ-HBCDD, 10-20% β-
HBCDD and 1-10% α-HBCDD. In the flounder the level of γ-HBCDD was nearly similar to
the level of α-HBCDD. This is previously only reported in invertebrates living close to
sediments (e.g. Haukås et al., 2009). If detected, only trace amounts of the β- and γ-HBCDD
are usually found in vertebrates (Covaci et al., 2006; Law et al., 2006, Haukås et al., 2009).
Near a point source area, however, it has been reported up to 20% γ-HBCDD and 3% β-
HBCDD in eggs from common eider (Haukås et al., 2009). In our work only α-HBCDD was
detected, which is in accordance with previous reports in fish sampled from background areas
or from locations with no clear sources. Köppen et al (2010) reported somewhat lower
detection limits of the HBCDD diastereomers than in our study. The measured concentrations
of the two diastereomers in their study were, however, substantially higher than the detection
limits reported in our study. A similar level should, therefore, be discovered. Etnefjorden is a
small branch of the Hardangerfjord in the municipality Etne. The municipality centre, Etne,
has approximately 1000 inhabitants at the head of the fjord. With the exception of findings of
dumped car wrecks near Holmaseid (Fig 1), there are, as far as we know, no obvious sources
suspected for HBCDD emissions in this area.
It is difficult to speculate about the reasons for the discrepancy between our findings and the
findings by Köppen et al., (2010). According to Köppen et al (2010) the fish were caught in
the inner area of Etnefjorden (Fig 1). This is approximately 4 km further into the fjord than
the cod sampled in our study. Although coastal cod is relatively resident with limited
migration there is no reasons to believe that the cod analyzed by Köppen et al (2010) belongs
to a different stock, explaining the differences in HBCDD concentrations. In a study by Jorde
et al., (2007) with use of genetic markers it was showed that the population structure of
coastal cod is limited in geographic area of approximately 30 km, which is on the scale of
local fjords. Köppen et al (2010) also found elevated levels in mackerel and pollack, which
probably migrates larger areas than the coastal cod. The elevated concentrations in the codfish
and flounder, as reported in their study, should, therefore, have been discovered even at the
site of catchment in our study. Åsefjorden, at the west coast of Norway, is a HBCDD point
source area, which covers a similar area as Etnefjorden. Haukås et al., (2009) reported a
spatial distribution of the HBCDD levels in eggs from common eider and three different

19
invertebrates in this fjord. Another difference between our study and the study by Köppen et
al. (2010) is the sample preparation. They dried the fish samples beforehand and extracted
aliquots of the dried materials, whereas we extracted aliquots of fresh materials. An error in
the conversion of dry material from fresh weight may lead to an error in the results. NILU is
regularly participating in international laboratory intercalibrations (e.g. Liane and Becher,
2010). The performance in these studies is satisfactory indicating that our method for analysis
and preparation of HBCDD is adequate. Only, analysis of sediments from the inner site of the
fjord, in addition to sediment living organisms, can positively reveal possible sources of
HBCDD pollution in this area.
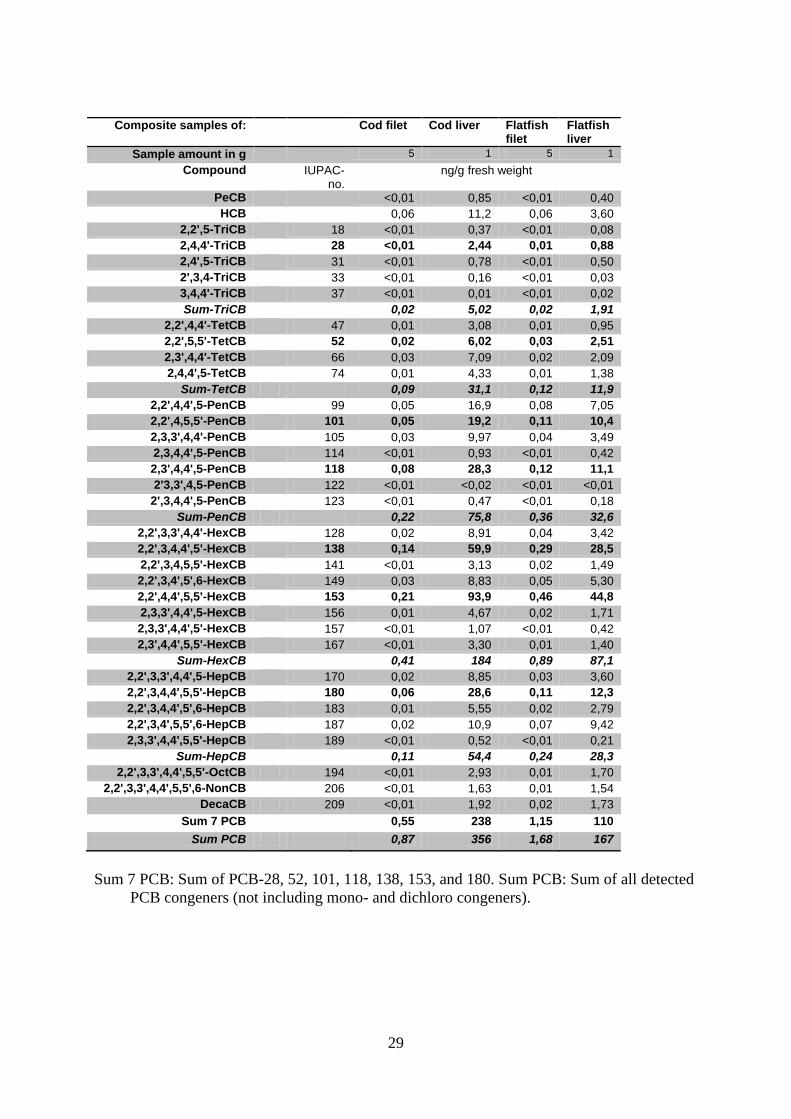
3.2 Concentrations of other halogenated pollutants in fish
Increased levels of one pollutant may be followed by elevated levels of other environmental
toxicants. The levels of PBDEs, PCBs, HCH and DDT were, therefore, analyzed in pooled
filets and livers from the cod and flounder samples from Etnefjorden. Below is a summary of
the levels found in the fish samples (Table 3). Detailed information about the levels of single
congeners is found in the Appendix.
Table 3. The levels of halogenated pollutants in the in the pooled fish samples. Detailed
information about the levels of single congeners is found in the Appendix. (dl = detection
limit, mg/kg lipid weight in brackets).
a Σ α-HCH, β-HCH,γ-HCH.
b Σ o,p'-DDE, p,p'-DDE, o,p'-DDD, p,p'-DDD, o,p'-DDT, p,p'-DDT.
c Σ PBDE-28, -47, -66, -49 + -71, -77, -85, -99, -100, -119, -138, -153, -154, -183.
d In cod filet and flounder filet only BDE-47 was detected.
e Σ PBDE-196, -206, -209.
f Σ PCB-28, -52, -101, -118, -138, -153, -180.
g Σ PCB-18, -28, -31, -33, -37, -47, -52, -66, -74, -99, -101, -105, -114, -118, -122, -123, -128, -138, -141, -149, -
153, -156, -157, -167, -170, -180, -183, -187, -189, -194, -206, -209.
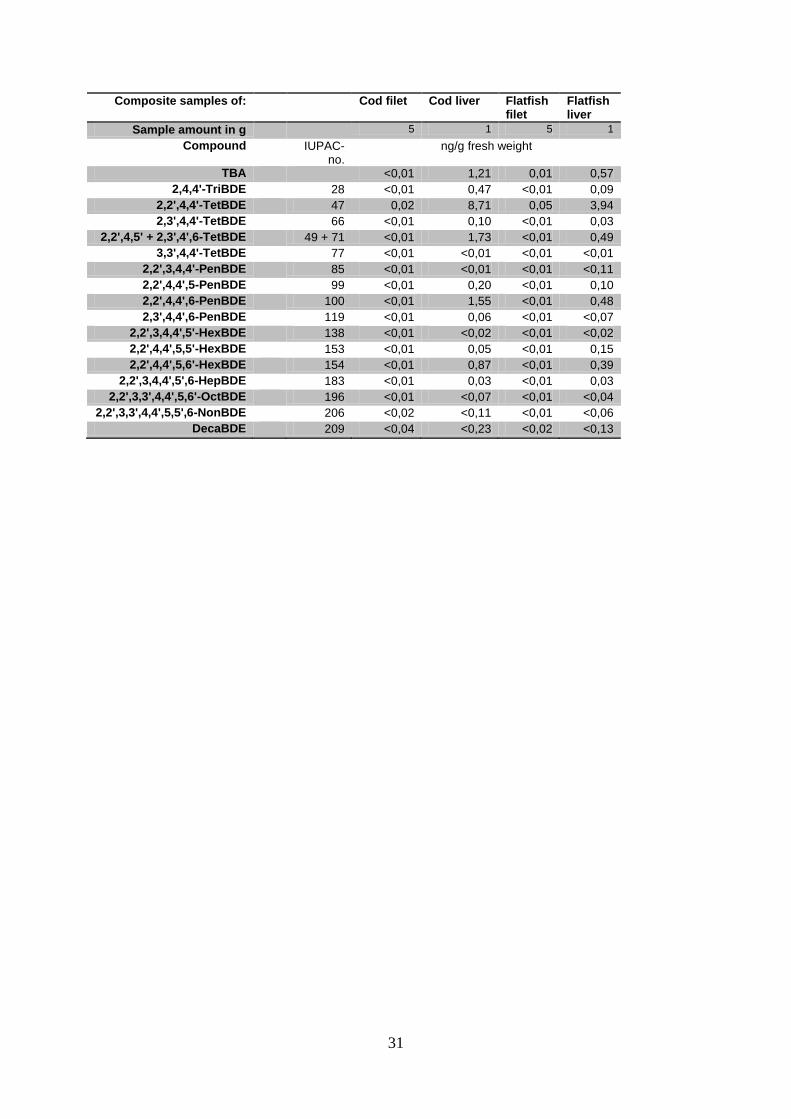
3.2.1 Polybrominated diphenyl ethers (PBDEs)
In cod filet, only trace of the single PBDE-congener 47 was found (0.02 ng/g wet weight
corresponding to 7.2 ng/g lipid weight). In the pooled cod liver there was found somewhat
higher levels and 10 out of 16 PBDE-congeners were identified (see Appendix). PBDE in
cod liver was 14 ng/g wet weight corresponding to 24 ng/g lipid weight. Also in the pooled
flounder filet only trace of BDE-47 was found (0.05 ng/g wet weight corresponding to 9.3
ng/g lipid weight). In the pooled flounder liver 9 out of 16 PBDE-congeners were identified
(see Appendix), and PBDE was 5.8 ng/g wet weight corresponding to 19 ng/g lipid weight.
Cod liver Cod filet Flounder liver Flounder filet
∑HCHa 1.4 (2.4) < dl 0.8 (2.6) < dl
∑DDTb 168 (290) 0.49 (171) 65 (208) 0.94 (171)
∑PBDEc28-183
14 (24) 0.02 (7.2)d 5.8 (19) 0.05 (9.3)
d
∑PBDEe
196-209< dl < dl < dl < dl
∑PCBf7
238 (410) 0.55 (189) 110 (353) 1.1 (208)
∑PCBg
total344 (593) 0.85 (294) 161 (515) 1.7 (302)
(mg/kg wet weight (mg/kg lipid weight))

20
No traces of the decabrominated PBDE (BDE-209) was found. These figures are low and
show that the fish have been exposed only to background concentrations of PBDEs.
3.2.2 Polychlorinated biphenyls (PCBs)
According to Klifs system for classification of environmental state (Molvær et al., 1997), the
levels of PCBs found in cod can be regarded as background levels (class 1, slightly/negligible
polluted). The concentration of PCB7 found in cod filet was 0.55 ng/g wet weight,
corresponding to 189 ng/g lipid weight. The concentration in cod liver was 238 ng/g wet
weight corresponding to 410 ng/g lipid weight. TEPCB was calculated to 0.01 pg/g in cod
filet and 1.48 in cod liver. The levels of PCB7 in flounder filet were similar as in cod with a
wet weight concentration of 1.1 ng/g corresponding to 208 ng/g lipid weight. The
concentration in flounder liver was 110 ng/g wet weight corresponding to 353 ng/g lipid
weight. TEPCB was calculated to 0.01 pg/g in flounder filet and 0.57 pg/g in liver. Detailed
information about the levels of single PCB congeners is found in the Appendix.
3.2.3 Dichlorodiphenyltrichloroethane (DDT) and DDT metabolites
The levels of (o,p’; p,p’)-DDT and its metabolites, (o,p’; p,p’)-DDE and (o,p’; p,p’)-DDD, in
the fish were also low and can be put into class 1 in Klifs classification system of
environmental state. DDT in cod filet and liver was 0.5 ng/g wet weight (171 ng/g lipid
weight) and 168 ng/g wet weight (290ng/g lipid weight) respectively. DDT in the flounder
filet and liver was 0.94 ng/g wet weight (171 ng/g lipid weight) and 65 ng/g wet weight (208
ng/g lipid weight) respectively.
3.2.4 Hexachlorocyclohexane (HCH)
The three HCH diastereomers, α-, β- and γ-HCH, were only detected in the livers of cod and
flounder. HCH in cod and founder liver was 1.4 ng/g (2.4ng/g lipid weight) and 0.8 ng/g wet
weight (2.6ng/g lipid weight), respectively. According to Klifs system for classification of
environmental state, these levels can be regarded as background levels (class 1,
slightly/negligible polluted).
3.3 Concentrations of Hg, Pb, Cd and As
In addition to the halogenated compounds, some metals of interest were analyzed in the
pooled filet and liver samples. The elements analyzed were As, Cd, and Pb in the pooled liver
samples of cods and flounder, and Hg was analyzed in the pooled filet samples. The analyzed
levels are summarized in Table 3. In general, the level of Hg in fish filet is of particular
concern to Norwegian authorities as fish from several areas in Norway are subject to
consumption advices by the Norwegian food authorities due to high Hg levels. However, the
concentrations of Hg in the cod and flounder filets from the Etnefjord as detected in this study
were relatively low and can be regarded as background levels (class 1, slightly/negligible
polluted) according to Klifs system for classification of environmental state. The National
Institute of Nutrition and Seafood Research (NIFES) has collected data on Hg-levels in
seafood and mean level of Hg in wild caught Atlantic cod is approximately 0.04 mg/kg wet
weight with a range of approximately 0.01-0.08 mg/kg wet weight
(http://www.nifes.no/sjomatdata/). In brown trout (Salmo trutta) from the Norwegian Lake
Mjøsa, the mean Hg level in filet was 0.59 mg/kg wet weight (Fjeld et al., 2009).
Arsenic, Cd and Pb in fish are still not subjected to any classification system of environmental
state. Arsenic is a priority pollutant and was, in Norway, previously used in pressure

21
impregnated wood (Bakke et al., 2007). Little is known about the levels of As in seafood, but
available literature indicates that the level varies substantially. In Bakke et al., (2007) As was
analyzed in cod liver with concentrations ranging from 2.5-19. The highest levels were found
in cod caught in the Fjord of Oslo. According to data collected by NIFES, however, even
higher concentrations of As is measured in cod liver, but mean concentrations range from
approximately 1 mg/kg to 16 mg/kg (http://www.nifes.no/sjomatdata/). The concentration of
24 mg/kg As in the flounder sample analyzed in this study is probably within expected
variation.
The levels of Cd and Pb in cod liver were also low, representing background levels.
According to data collected by NIFES, the mean level of Cd in wild caught Atlantic cod liver
is 0.2 mg/kg wet weight, with a range of approximately0.03-0.4 mg/kg wet weight
(http://www.nifes.no/sjomatdata/). In cod filet the levels are even lower. The levels of Pb in
the cod liver analyzed in this study resemble what is found in livers from farmed fish
(http://www.nifes.no/sjomatdata/). Maximum allowable levels of Cd and Pb in fish filet for
human consumption in EU is 0.05 mg/kg and 0.2 mg/kg wet weight respectively
(Commission regulation 78/2005). In a recent study on perch (Perca fluviatilis) which were
sampled from a water nearby a small arms shooting range (Mariussen et al., 2010) reported
concentrations of 0.46 mg/kg wet weight in liver and 0.19 mg/kg wet weight in filet. In
freshwater fish a Pb-concentration of 0.1-0.2 mg/kg wet weight in filet and liver respectively
is considered normal (Grande, 1987; 1997).
Table 3. The levels of the elements As, Cd, Hg and Pb in the pooled fish samples.
Cod liver Cod filet Flounder liver Flounder filet
As 5.9 24
Cd 0.03 0.4
Hg 0.07 0.09
Pb 0.01 0.3
(mg/kg wet weight)

22
4. Conclusions
In this survey the levels of selected environmental contaminants were analyzed in cod and
flounder from Etnefjord in Sunnhordland, Norway. The levels of HBCDD detected in this
study were low and comparable to environmental background levels and levels previously
reported in fish elsewhere (Covaci et al., 2006; Law et al., 2006, de Wit, 2006, 2010). The
results, however, contrasts with previous findings by Köppen et al. (2010), which showed
very high levels of HBCDD in cod, flounder, mackerel, pollack, and thorny skate from the
same area.
A reason for this discrepancy in results could be that the fish analyzed in this study were not
collected at the exact same site as in Köppen et al., (2010), but approximately 4 km further
out of the fjord. However, given the very high levels of HBCDD that were found in fish in the
Köppen study, elevated levels of HBCDD should also have been discovered at the site of
catchment in this study. In addition, based on studies on population structure of coastal cod
(Jorde et al., 2010), there are no reasons to believe that the cod analyzed by Köppen et al.
(2010) belongs to a different stock, explaining the difference in HBCDD concentration.
Another reason for the difference in the results may be the sample preparation of the fish.
Köppen et al. (2010) extracted aliquots of dried fish materials, whereas we extracted aliquots
of fresh materials. NILU regularly participates in interlaboratory studies on POP analysis in
food (e.g. Liane and Becher, 2010). The performance in these studies is satisfactory,
indicating that our method for analysis and sample preparation of HBCDD is adequate.
Only analysis of sediments and sediment living organisms from the inner site of the Etnefjord
can reveal possible sources of HBCDD pollution. Additional analysis of HBCDD in cod
collected at the same sampling site as Köppen et al., (2010) would, in addition, give
supplementary information of whether the high HBCDD levels reported in fish from the
Etnefjord by Köppen et al., (2010) were a result of a real environmental exposure to HBCDD.
The levels of the halogenated organic compounds PCB, PBDE, DDT and HCH and the
elements As, Cd, Hg and Pb were also analyzed in the fish from the Etnefjord. The levels of
these compounds were low, representing background levels. Thus, on the basis of this study
there are no reasons to believe that cod and flounder in Etnefjorden are exposed to
considerable amount of environmental pollutants.
23
5. References
Bakke, T., Fjeld, E., Skaare, B., Berge, J., Green, N., Ruus, A., Schlabach, M. (2007)
Mapping of metals and selected new organic contaminants 2006. Chromium arsenic,
perfluorated substances, dichloroethane, chlorinated benzenes, pentachlorophenol,
HCBD and DEHP. [In Norwegian] Oslo, NIVA (Statlig program for
forurensningsovervåking. Rapport 990/2007) (TA-2284/2007) (NIVA-rapport 5464-
2007).
Berge, J.A., Schlabach, M., Fagerhaug, A., Rønneberg, J.E. (2006) Kartlegging av utvalgte
miljøgifter i Åsefjorden og omkringliggende områder. Bromerte flammehemmere,
klororganiske forbindelser, kvikksølv og tribromanisol. Oslo, NIVA (NIVA-rapport
5136-2006) (Statlig program for forurensningsovervåking. Rapport 946/06) (TA-
2146/2006 ).
Covaci, A., Gerecke, A.C., Law, R.J., Voorspoels, S., Kohler, M., Heeb, N.V., Leslie, H.,
Allchin, C.R., De Boer, J. (2006) Hexabromocyclododecanes (HBCDDs) in the
environment and humans: a review. Environ. Sci. Technol., 40, 3679-3688
de Wit, C.A. (2002) An overview of brominated flame retardants in the environment.
Chemosphere, 46, 583-624.
de Wit, C.A., Alaee, M., Muir, D.C. (2006) Levels and trends of brominated flame retardants
in the Arctic. Chemosphere, 64, 209-233.
de Wit, C.A., Herzke, D., Vorkamp, K. (2010) Brominated flame retardants in the Arctic
environment-trends and new candidates. Sci. Total Environ,. 408, 2885-2918.
Fjeld, E., Enge, E.K., Rognerud, S., Rustadbakken, A., Løvik, J. (2009) Environmental
contaminants in fish and zooplankton from Lake Mjøsa – 2008. Brominated flame
retardants (PBDE, HBCDD), PCB, dioxins, chlorinated parafins, perfluorinated
alkylated substances and mercury. [In Norwegian] Oslo, NIVA (Statlig program for
forurensningsovervåking. Rapport 1045/2009) (TA-2483/2009 ) (NIVA-rapport 5771-
2009).
Grande, M. (1987) Bakgrunnsnivåer av metaller i ferskvannsfisk. Oslo, Norsk institutt for
vannforskning.
Grande, M. (1991) Biologiske effekter av gruveindustriens metallforurensninger. Oslo, Norsk
institutt for vannforskning (NIVA-rapport 2562-1991).
Grégoire, F., Dionne, H., Lévesque, C. (1994) Fat content of Atlantic mackerel (Scomber
scombrus L.) in 1991 and 1992. Québec, Department of Fisheries and Oceans (Canadian
lndustry Report of Fisheries and Aquatic Sciences 220).
Halse, A.K., Schlabach, M., Eckhardt, S., Sweetman, A., Jones, K.C., Breivik, K. (2011)
Spatial variability of POPs in European background air. Atmos. Chem. Phys., 11, 1549-
1564.
Hamre, A., Westrheim, L. (2009) Bilkirkegård funnet i Etnefjorden. Bergensavisen, 3 October
2009 [Internet]. Available from URL: http://www.ba.no/nyheter/article4167557.ece
[Accessed 7 September 2011].
Haukås, M., Hylland, K., Berge, J.A., Nygaard, T., Mariussen, E. (2009) Spatial diastereomer
patterns of hexabromocyclododecane (HBCDD) in a Norwegian fjord. Sci. Total
Environ., 407, 5907-5913.
Jenssen, B.M., Sørmo, E.G., Baek, K., Bytingsvik, J., Gaustad, H., Ruus, A., Skaare, J.U.
(2007) Brominated flame retardants in North-East Atlantic marine ecosystems. Environ.
Health Perspect., 115, Suppl. 1, 35-41.
Jorde, P.E., Knutsen, H., Espeland, S.H., Stenseth, N.C. (2007) Spatial scale of genetic
structuring in coastal cod Gadus morhua and geographic extent of local populations.
MEPS, 343, 229-237.
24
Köppen, R., Becker, R., Esslinger, S., Nehls, I. (2010) Enantiomer-specific analysis of
hexabromocyclododecane in fish from Etnefjorden (Norway). Chemosphere, 80, 1241-
1245.
Law, R.J., Allchin, C.R., de Boer, J., Covaci, A., Herzke, D., Lepom, P., Morris, S.,
Tronczynski, J., de Wit, C.A. (2006) Levels and trends of brominated flame retardants
in the European environment. Chemosphere, 64, 187-208.
Liane, V.H., Becher, G. (2010) Interlaboratory comparison on POPs in Food 2010. Eleventh
round of an international study. Oslo, Norwegian Institute of Public Health (Report
2010:5).
Lindberg, P., Sellstrom, U., Haggberg, L., de Wit, C.A. (2004) Higher brominated diphenyl
ethers and hexabromocyclododecane found in eggs of peregrine falcons (Falco
peregrinus) breeding in Sweden. Environ. Sci. Technol., 38, 93-96.
Mariussen, E., Fjeld, E., Breivik, K., Steinnes, E., Borgen, A., Kjellberg, G., Schlabach, M.
(2008) Elevated levels of polybrominated biphenyls (PBDEs) in fish from Lake Mjøsa,
Norway. Sci. Total Environ., 390, 132-141.
Mariussen, E., Steinnes, E., Breivik, K., Schlabach, M., Nygaard, T., Kålås, J.A. (2008)
Spatial patterns of polybrominated diphenyl ethers (PBDEs) in mosses, herbivores and a
carnivore from the Norwegian terrestrial biota. Sci. Total Environ., 404, 162-170.
Mariussen, E., Ljønes, M., Nazari, B., Løkke, M., Voie, O.A. (2009) Undersøkelse av bly og
kobber i abbor (Perca fluviatilis) hentet fra Steinsjøen skytefelt. [In Norwegian] Kjeller,
FFI (FFI-rapport-2009/01925).
Molvær, J., Knutzen, J., Magnusson, J., Rygg, B., Skei, J., Sørensen, J. (1997) Classification
of environmental quality in fjords and coastal waters. A guide. [In Norwegian] Oslo,
SFT (Veiledning 97:03) (TA-1467/1997).
Montiea, E.W., Letcher, R.J., Reddy, C.M., Moore, M.J., Rubinstein, B., Hahn, M.E. (2010)
Brominated flame retardants and organochlorine contaminants in winter flounder, harp
and hooded seals, and North Atlantic right whales from the Northwest Atlantic Ocean
Mar. Pollut. Bull., 60, 1160-1169.
Morf, L., Buser, A., Taverna, R. (2007) Dynamic substance flow analysis model for selected
brominated flame retardants as a base for decision making on risk reduction measures
(FABRO). NRP50 - Endocrine disruptors: relevance for humans, animals and
ecosystems. Final report. Zürich, GEO Partner.
URL: http://www.geopartner.ch/upload/FABRO_2007.pdf.
Morris, S., Allchin, C.R., Zegers, B.N., Haftka, J.J.H., Boon, J.P., Belpaire, C., Leonards,
P.E., Van Leeuwen, S.P., De Boer, J. (2004) Distributon and fate of HBCDD and
TBBPA brominated flame retardants in North Sea estuaries and aquatic food webs.
Environ. Sci Technol., 38, 5497-5504.
Posner, S., Säll, L. (2011) Exploration of management options for hexabromocyclododecane
(HBCDD). Oslo, Klif (TA-2818/2011).
Prevedouros, K., Jones, K.C., Sweetman, A.J. (2004) Estimation of the production,
consumption, and atmospheric emissions of pentabrominated diphenyl ether in Europe
between 1970 and 2000. Environ. Sci. Technol., 38, 3224-3231.
Remberger, M., Sternbeck, J., Palm, A., Kaj, L., Stromberg, K., Brorstrom-Lunden, E. (2004)
The environmental occurrence of hexabromocyclododecane in Sweden. Chemosphere,
54, 9-21.
Sellstrøm, U., Kierkegaard, A., de Wit, C., Jansson, B. (1998) Polybrominated diphenyl ethers
and hexabromocyclododecane in sediment and fish from a Swedish river. Environ.
Toxicol. Chem., 17, 1065-1072.

25
Shaw, S.D., Berger, M.L., Brenner, D., Kannan, K., Lohmann, N, Päpke, O. (2009)
Bioaccumulation of polybrominated diphenyl ethers and hexabromocyclododecane in
the northwest Atlantic marine food web. Sci. Total Environ., 407, 3323-3329.
Thomsen, C., Molander, P., Daae, H.L., Janák, K., Froshaug, M., Liane, V.H., Thorud, S.,
Becher, G., Dybing, E. (2007) Occupational exposure to hexabromocyclododecane at an
industrial plant. Environ. Sci. Technol., 41, 5210-5216.
UNEP (2010) United Nations, Stockholm Convention on Persistent Organic Pollutants. Risk
profile on hexabromocyclododecane (UNEP/POPS/POPRC.6/13/Add.2). URL:
http://chm.pops.int/Convention/POPsReviewCommittee/Chemicals/tabid/243/Default.as
px [Accessed 8 September 2011].

26

27
Appendix
Raw Data

28
29
Composite samples of: Cod filet Cod liver Flatfish
filet Flatfish liver
Sample amount in g 5 1 5 1
Compound IUPAC-no.
ng/g fresh weight
PeCB <0,01 0,85 <0,01 0,40
HCB 0,06 11,2 0,06 3,60
2,2',5-TriCB 18 <0,01 0,37 <0,01 0,08
2,4,4'-TriCB 28 <0,01 2,44 0,01 0,88
2,4',5-TriCB 31 <0,01 0,78 <0,01 0,50
2',3,4-TriCB 33 <0,01 0,16 <0,01 0,03
3,4,4'-TriCB 37 <0,01 0,01 <0,01 0,02
Sum-TriCB 0,02 5,02 0,02 1,91
2,2',4,4'-TetCB 47 0,01 3,08 0,01 0,95
2,2',5,5'-TetCB 52 0,02 6,02 0,03 2,51
2,3',4,4'-TetCB 66 0,03 7,09 0,02 2,09
2,4,4',5-TetCB 74 0,01 4,33 0,01 1,38
Sum-TetCB 0,09 31,1 0,12 11,9
2,2',4,4',5-PenCB 99 0,05 16,9 0,08 7,05
2,2',4,5,5'-PenCB 101 0,05 19,2 0,11 10,4
2,3,3',4,4'-PenCB 105 0,03 9,97 0,04 3,49
2,3,4,4',5-PenCB 114 <0,01 0,93 <0,01 0,42
2,3',4,4',5-PenCB 118 0,08 28,3 0,12 11,1
2'3,3',4,5-PenCB 122 <0,01 <0,02 <0,01 <0,01
2',3,4,4',5-PenCB 123 <0,01 0,47 <0,01 0,18
Sum-PenCB 0,22 75,8 0,36 32,6
2,2',3,3',4,4'-HexCB 128 0,02 8,91 0,04 3,42
2,2',3,4,4',5'-HexCB 138 0,14 59,9 0,29 28,5
2,2',3,4,5,5'-HexCB 141 <0,01 3,13 0,02 1,49
2,2',3,4',5',6-HexCB 149 0,03 8,83 0,05 5,30
2,2',4,4',5,5'-HexCB 153 0,21 93,9 0,46 44,8
2,3,3',4,4',5-HexCB 156 0,01 4,67 0,02 1,71
2,3,3',4,4',5'-HexCB 157 <0,01 1,07 <0,01 0,42
2,3',4,4',5,5'-HexCB 167 <0,01 3,30 0,01 1,40
Sum-HexCB 0,41 184 0,89 87,1
2,2',3,3',4,4',5-HepCB 170 0,02 8,85 0,03 3,60
2,2',3,4,4',5,5'-HepCB 180 0,06 28,6 0,11 12,3
2,2',3,4,4',5',6-HepCB 183 0,01 5,55 0,02 2,79
2,2',3,4',5,5',6-HepCB 187 0,02 10,9 0,07 9,42
2,3,3',4,4',5,5'-HepCB 189 <0,01 0,52 <0,01 0,21
Sum-HepCB 0,11 54,4 0,24 28,3
2,2',3,3',4,4',5,5'-OctCB 194 <0,01 2,93 0,01 1,70
2,2',3,3',4,4',5,5',6-NonCB 206 <0,01 1,63 0,01 1,54
DecaCB 209 <0,01 1,92 0,02 1,73
Sum 7 PCB 0,55 238 1,15 110
Sum PCB 0,87 356 1,68 167
Sum 7 PCB: Sum of PCB-28, 52, 101, 118, 138, 153, and 180. Sum PCB: Sum of all detected
PCB congeners (not including mono- and dichloro congeners).

30
Composite samples of: Cod filet Cod liver Flatfish filet
Flatfish liver
Sample amount in g 5 1 5 1
Compound ng/g fresh weight
-HCH < 0.01 0,66 < 0.01 0,34
-HCH < 0.01 0,42 < 0.01 0,27
-HCH < 0.01 0,32 < 0.01 0,19
o,p'-DDE < 0.01 0,31 < 0.01 0,30
p,p'-DDE 0,40 131 0,81 55,4
o,p'-DDD < 0.01 1,04 < 0.01 0,43
p,p'-DDD 0,05 21,1 0,07 5,23
o,p'-DDT < 0.01 1,19 0,01 0,51
p,p'-DDT 0,03 13,7 0,04 3,09
Sum DDT 0,48 168 0,93 65,0
Sum DDT: Sum of o,p'-DDE, p,p'-DDE, o,p'-DDD, p,p'-DDD, o,p'-DDT, and p,p'-DDT,
31
Composite samples of: Cod filet Cod liver Flatfish filet
Flatfish liver
Sample amount in g 5 1 5 1
Compound IUPAC-no.
ng/g fresh weight
TBA <0,01 1,21 0,01 0,57
2,4,4'-TriBDE 28 <0,01 0,47 <0,01 0,09
2,2',4,4'-TetBDE 47 0,02 8,71 0,05 3,94
2,3',4,4'-TetBDE 66 <0,01 0,10 <0,01 0,03
2,2',4,5' + 2,3',4',6-TetBDE 49 + 71 <0,01 1,73 <0,01 0,49
3,3',4,4'-TetBDE 77 <0,01 <0,01 <0,01 <0,01
2,2',3,4,4'-PenBDE 85 <0,01 <0,01 <0,01 <0,11
2,2',4,4',5-PenBDE 99 <0,01 0,20 <0,01 0,10
2,2',4,4',6-PenBDE 100 <0,01 1,55 <0,01 0,48
2,3',4,4',6-PenBDE 119 <0,01 0,06 <0,01 <0,07
2,2',3,4,4',5'-HexBDE 138 <0,01 <0,02 <0,01 <0,02
2,2',4,4',5,5'-HexBDE 153 <0,01 0,05 <0,01 0,15
2,2',4,4',5,6'-HexBDE 154 <0,01 0,87 <0,01 0,39
2,2',3,4,4',5',6-HepBDE 183 <0,01 0,03 <0,01 0,03
2,2',3,3',4,4',5,6'-OctBDE 196 <0,01 <0,07 <0,01 <0,04
2,2',3,3',4,4',5,5',6-NonBDE 206 <0,02 <0,11 <0,01 <0,06
DecaBDE 209 <0,04 <0,23 <0,02 <0,13

32
Sample type and number Sample amount
Compound
α-HBCDD β-HBCDD γ-HBCDD g ng/g fresh weight
Cod liver Sample 1 1 5,74 -0,11 -0,05
Cod liver Sample 2 1 1,12 -0,08 -0,05
Cod liver Sample 3 1 5,47 -0,10 -0,05
Cod liver Sample 4 1 2,99 -0,08 -0,05
Cod liver Sample 5 1 2,29 -0,05 -0,03
Cod liver Sample 6 1 2,42 -0,13 -0,06
Cod liver Sample 7 1 2,64 -0,03 -0,02
Cod liver Sample 8 1 0,60 -0,04 -0,02
Cod liver Sample 9 1 1,88 -0,02 -0,02
Cod liver Sample 10 1 0,27 -0,02 -0,02
Flatfish liver, Common dab
Sample 1 0,5 -0,08 -0,08 -0,05
Flatfish liver, Common dab
Sample 2 1 -0,04 -0,04 -0,03
Flatfish liver, Common dab
Sample 3 1 -0,04 -0,05 -0,03
Flatfish liver, Common dab
Sample 4 1 -0,04 -0,04 -0,03
Flatfish liver, Common dab
Sample 5 0,5 -0,09 -0,10 -0,06
Flatfish liver, Common dab
Sample 6 0,5 -0,08 -0,08 -0,05
Flatfish liver, Common dab
Sample 7 0,5 -0,07 -0,08 -0,05
Flatfish liver, Common dab
Sample 8 0,4 -0,12 -0,13 -0,08
Flatfish liver, Common dab
Sample 9 0,4 -0,18 -0,15 -0,09
Flatfish liver, Torbay sole
Sample 10 1 -0,06 -0,08 -0,05
Cod filèt Composite sample of 10 samples
5 -0,01 -0,01 -0,01
Flatfish filèt Composite sample of 10 samples
5 -0,01 -0,01 -0,01

33

34

35

36

37
Klima- og forurensningsdirektoratet
Postboks 8100 Dep, 0032 Oslo
Besøksadresse: Strømsveien 96
Telefon: 22 57 34 00
Telefaks: 22 67 67 06
E-post: [email protected]
Internett: www.klif.no
Utførende institusjon NILU – Norsk institutt for luftforskning
ISBN-nummer 978-82-425-2431-7 (T)
978-82-425-2432-4 (E)
Oppdragstakers prosjektansvarlig Martin Schlabach
Kontaktperson i Klima- og
forurensningsdirektoratet Bård Nordbø
TA-nummer 2821/2011
SPFO-nummer
År
2011
Sidetall 35
Klifs kontraktnummer 5011106
Utgiver NILU – Norsk institutt for luftforskning
Prosjektet er finansiert av Klima- og forurensningsdirektoratet
Forfatter(e) Espen Mariussen og Martin Schlabach
Tittel - norsk og engelsk Contaminants in fish from Etnefjorden, Norway
Miljøgifter i fisk fra Etnefjorden, Norge
Sammendrag – summary 1,2,5,6,9,10-hexabromocyclododecane (HBCDD) is one of the most frequently used brominated flame retardants (BFR) and is considered as
an emerging environmental pollutant. Recently, high levels of HBCDD were reported in five different fish species from Etnefjord, which is a
branch of the Hardangerfjord at the southwest coast of Norway. This report raised some serious concerns and the Norwegian Climate and
Pollution Agency (Klif) therefore initiated a survey of HBCDD in cod and flounder from Etnefjorden in order to confirm the findings. In
addition to HBCDD, the levels of other environmental pollutants were analyzed in the fish, namely polybrominated diphenyl ethers (PBDEs),
polychlorinated biphenyls (PCBs), hexachlorocyclohexane (HCH), dichlorodiphenyltrichloroethane (DDT), mercury (Mg), lead (Pb), cadmium (Cd) and arsenic (As). The fish muscle filet and livers were prepared and analyzed using recognized and previously published
methods. The levels of HBCDD in the fish were low, representing expected background concentrations. HBCDD was only detected in the cod
livers with concentrations ranging 0.3-5.7 ng/g wet weight, corresponding to 1.3-8.2 ng/g on a lipid weight basis. Previously, it was reported a level of 30 000 ng/g lipid weight in cod filet, which is, as far as we know, the highest HBCDD concentration ever reported in cod. Our study
could, therefore, not confirm the recent findings that showed high HBCDD concentrations in fish from the Etnefjord area. Also, the levels of
the other pollutants were low. For example, the concentrations of DDT, PCB, HCH and Hg can, according to Klifs system for classification of environmental state, be regarded as background levels (class 1, slightly/negligible polluted). In conclusion, there are no recons to believe that
cod and flounder in Etnefjorden is exposed to considerable amount of environmental pollutants, neither of HBCDD nor other contaminants.
Only further analysis of sediments from the inner site of the fjord can, however, positively reveal a possible HBCDD source.
4 emneord Etnefjord, Fisk, Miljøgifter
4 subject words Etnefjord, Fish, Contaminants,

Climate and Pollution Agency
P.O. Box 8100 Dep
N-0032 Oslo
Tel: +47 22 57 34 00
Fax: +47 22 67 67 06
E-mail: [email protected]
Internet: www.klif.no
Street address: Strømsveien 96, Helsfyr, Oslo
Climate and Pollution Agency
The Climate and Pollution Agency reports to the Ministry of the
Environment and has 325 employees, based mainly in Oslo.
We implement government policy on pollution. We act as
advisors, guardians and stewards for the environment. Our
most important fields of work include climate change,
chemicals, marine and freshwater environment, waste
management, air quality and noise. Our vision is a future
without pollution.
We are working to
reduce greenhouse gas emissions
reduce the spread of hazardous substances harmful to
health and the environment
achieve integrated and ecosystem-based management
of the marine and freshwater environment
increase waste recovery and reduce emissions from
waste
reduce the harmful effects of air pollution and noise
TA-2821/2011
ISBN 978-82-425-2431-7 (Trykt)
ISBN 978-82-425-2432-4 (Elektronisk)