Containing Various Waste Inventories for WIPP PA · 2014-01-09 · Containing Various Waste...
143
Information Only Determination of the Porosity Surfaces of the Disposal Room Containing Various Waste Inventories for WIPP PA Sandia National Laboratories Waste Isolation Pilot Plant Analysis Report for Revision 0 Determination of the Porosity Surfaces of the Disposal Room Containing Various Waste Inventories for WIPP PA Technical Review: Management Task number 1.4.1.2 __ __ Print Signature Date A Review: Mario J. Chavez 3 Print WIPP:1.4.1 :PA:QA-L '533 I '3 l
-
Upload
trinhquynh -
Category
Documents
-
view
214 -
download
0
Transcript of Containing Various Waste Inventories for WIPP PA · 2014-01-09 · Containing Various Waste...

Information Only
Determination of the Porosity Surfaces of the Disposal Room Containing Various Waste Inventories for WIPP PA
Sandia National Laboratories Waste Isolation Pilot Plant
Analysis Report for
Revision 0
Determination of the Porosity Surfaces of the Disposal Room Containing Various Waste Inventories for WIPP PA
Technical Review:
Management
Task number 1.4.1.2
~R~eyvgie~w~: __ _lD~a~v~id~S~.K~es~s~eil~~l_ __ _!~~~~~~~~~~~~o3 Print Signature Date
A Review: Mario J. Chavez 3 Print
WIPP:1.4.1 :PA:QA-L ~ '533 I '3 l

Information Only
Determination of the Porosity Surfaces of the Disposal Room Containing Various Waste Inventories for WIPP PA
Intentionally blank
2 of 142
Information Only
Determination of the Porosity Surfaces of the Disposal Room Containing Various Waste Inventories for WIPP PA
Acknowledgements
3 of 140
This research is funded by WIPP programs administered by the U.S. Department of Energy. The authors would like to acknowledge the valuable contributions to this work provided by others. Dr. Joshua S. Stein helped explain the hand off between these fmite element porosity surfaces and implementation in the performance calculations. Dr. Leo L. Van Sambeek ofRESPEC Inc. helped us understand the concepts of room closure under the circumstances created by a rigid waste inventory. Dr. T. William Thompson and Tom W. Pfeifle provided technical review and Mario J. Chavez provided a Quality Assurance review. The paper has been improved by these individuals.
Sandia is a multiprogram laboratory operated by Sandia Corporation, a Lockheed Martin Company, for the United States Department of Energy under Contract DE-AC04-94A/85000

Information Only
Determination of the Porosity Surfaces of the Disposal Room Containing Various Waste Inventories for WIPP PA
Intentionally Blank
4 of 140

Information Only
Determination of the Porosity Surfaces of the Disposal Room Containing Various Waste Inventories for WIPP PA
TABLE OF CONTENTS
5 of 140
1 INTRODUCTION .................................................................................................... 11
1.1 Objective ........................................................................................................... 11 1.2 Background ....................................................................................................... 14 1.3 Report Organization .......................................................................................... 16
2 ANALYSIS MODELS ............................................................................................. 17
2.1 Initial porosity ................................................................................................... 17 2.1.1 Standard waste .......................................................................................... 17 2.1.2 Pipe overpack waste .................................................................................. 18 2.1.3 AMWTP Supercompacted waste .............................................................. 21 2.1.4 Combined cases ........................................................................................ 25
2.2 Gas generation potential and production rate ................................................... 27 2.3 Geomechanical Models ..................................................................................... 30
2.3.1 Stratigraphy and constitutive models ........................................................ 30 2.3.2 Waste constitutive model .......................................................................... 32
3 MESH GENERATION ............................................................................................. 35
3.1 Disposal Room .................................................................................................. 35 3.2 Standard waste and POP waste ......................................................................... 36 3.3 AMWTP Waste ................................................................................................. 39
3.3.1 All AMWTP case ...................................................................................... 39 3.3.2 Combined Case I (2/3 AMWTP + 1/3 Standard Waste) .......................... 43 3.3.3 Combined Case II (113 AMWTP + 2/3 Standard Waste) ......................... 45
4 CALCULATION FLOW AND FILE NAMING CONVENTION .......................... 48
4.1 Computer Codes and Calculation Flow ............................................................ 48 4.2 File Naming Convention ................................................................................... 50
5 ANALYSES RESULTS ........................................................................................... 52
5.1 Disposal Room Creep Closure .......................................................................... 52 5.2 Pressure Histories .............................................................................................. 57 5.3 Porosity Histories .............................................................................................. 62 5.4 Porosity History Comparisons .......................................................................... 66 5.5 Porosity Surface ................................................................................................ 70
6 DISCUSSION AND CONCLUDING REMARKS ................................................. 73
7 REFERENCES ......................................................................................................... 76
APPENDIX A: CALCULATION SHEET TO COMPUTE THE VOLUME OF EACH COMPONENT IN THE WASTE DRUM ........................................................................ 79
A-1 12 inch-POP ......................................................................................................... 79 A-2 6-inch POP ........................................................................................................... 84

Information Only
Determination of the Porosity Surfaces of the Disposal Room Containing Various Waste Inventories for WIPP PA 6 of !40
A-3 AMWTP Debris Waste ........................................................................................ 88
APPENDIX 8: CALCULATION SHEET FOR THE INITIAL POROSITY OF THE UNDEFORMED DISPOSAL ROOM .............................................................................. 91
B-1 12-inch POP ......................................................................................................... 91 B-2 6-inch POP ........................................................................................................... 92 B-3 All AMWTP waste .............................................................................................. 93 B-4 1/3 AMWTP waste and 2/3 Standard waste ........................................................ 95 B-5 2/3 AMWTP waste and 113 Standard waste ........................................................ 97
APPENDIX C: GAS GENERATION POTENTIAL AND RATE .................................. 99
C-1 Standard Waste and POP Waste .......................................................................... 99 C-2 113 AMWTP and 2/3 Standard Waste ............................................................... 100 C-3 2/3 AMWTP and 113 Standard Waste ............................................................... 102 C-4 All AMWTP Waste ............................................................................................ I 04
APPENDIX D: HEIGHT OF THE AMWTP MODEL IN THE DISPOSAL ROOM ... 105
APPENDIX E: MODIFIED WIDTH AND LENGTH OF THEW ASTE ..................... 106
E-1 All AMWTP Waste Case ................................................................................... I 06 E-2 2/3 AMWTP + 1/3 Standard Waste Case .......................................................... 107 E-3 1/3 AMWTP and 2/3 Standard Waste Case ....................................................... 108
APPENDIX F: POROSITY CALCULATION FOR THE PUCK PART ...................... 109
APPENDIX G: SAMPLE FASTQ FILE (2/3 AMWTP+l/3STANDARD CASE) ...... 112
APPENDIX H: SAMPLE AWK SCRIPT TO CALCULATE THE POROSITY CHANGE IN THE ROOM WITH TIME (ALL AMWTP CASE) ................................ 115
APPENDIX I: SAMPLE SANTOS INPUT FILE .......................................................... 116
I-I: 12-inch POP ....................................................................................................... 116 I-2: AllAMWTP ....................................................................................................... l18
APPENDIXJ: SAMPLE USER SUBROUTINES (ALLAMWTP WITHF=O.l) ....... l21
J-1 Initial Stress State ................................................................................................ 121 J-2 Adaptive Pressure Boundary Condition .............................................................. 122
APPENDIX K: COMPARISON BETWEEN POROSITY HISTORIES FOR THE DISPOSAL ROOM CONTAINING VARIOUS WASTE INVENTORIES ................. 123
APPENDIX L: CALCULATION OF POROSITY SURFACES USED IN THE AMW PA 130
L-1 Overview ............................................................................................................ 130 L-2 Calculation Flow and File Naming Convention ................................................. 132 L-3 Results ................................................................................................................ 132
Information Only
Determination of the Porosity Surfaces of the Disposal Room Containing Various Waste Inventories for WIPP PA
LIST OF TABLES
7 of 140
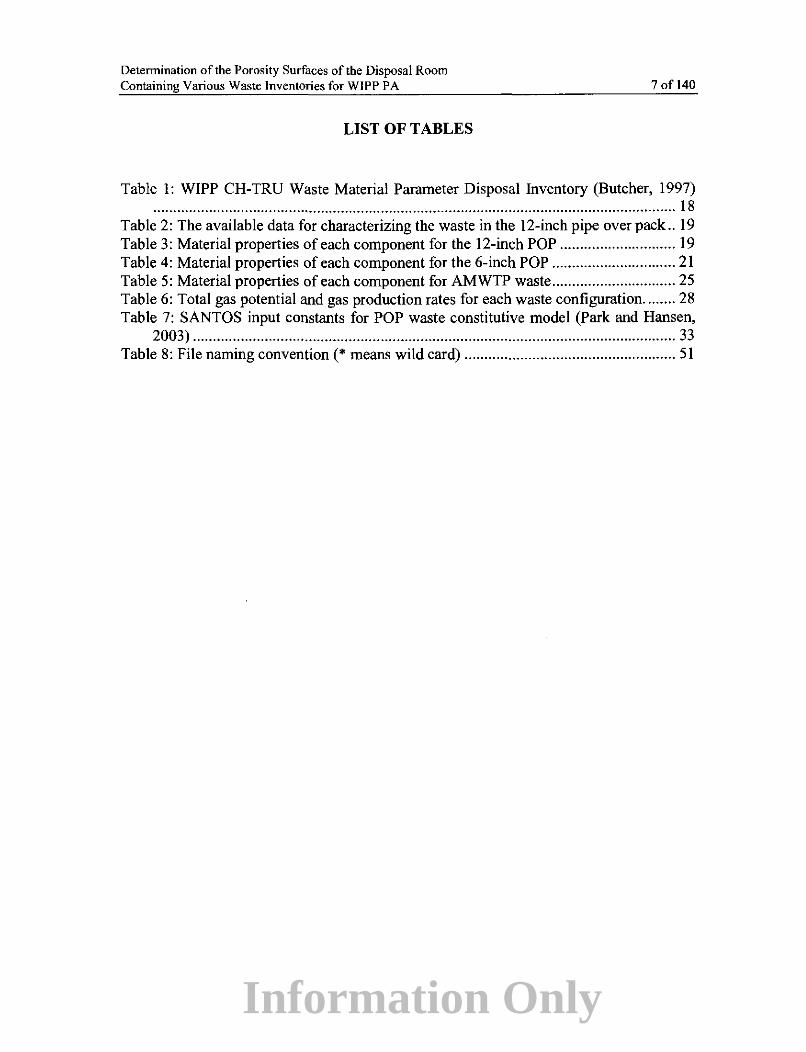
Table 1: WIPP CH-TRU Waste Material Parameter Disposal Inventory (Butcher, 1997) ................................................................................................................................... 18
Table 2: The available data for characterizing the waste in the 12-inch pipe over pack .. 19 Table 3: Material properties of each component for the 12-inch POP ............................. 19 Table 4: Material properties of each component for the 6-inch POP ............................... 21 Table 5: Material properties of each component for AMWTP waste ............................... 25 Table 6: Total gas potential and gas production rates for each waste configuration ........ 28 Table 7: SANTOS input constants for POP waste constitutive model (Park and Hansen,
2003) ......................................................................................................................... 33 Table 8: File naming convention (* means wild card) ..................................................... 51

Information Only
Determination of the Porosity Surfaces of the Disposal Room Containing Various Waste Inventories for WIPP PA
LIST OF FIGURES
8 of 140
Figure 1: Various waste packages ..................................................................................... 13 Figure 2: AMWTP pucks produced by supercompaction of 55-gallon drums of debris
waste ......................................................................................................................... 22 Figure 3: Illustration of waste containers and waste configuration .................................. 23 Figure 4: Simplified outline drawing of the 1 00-gallon container and supercompacted
waste ......................................................................................................................... 24 Figure 5: Combined cases included supercompacted waste ............................................. 26 Figure 6: Histories of gas generation potential used for the disposal room analyses, f=l.O
................................................................................................................................... 29 Figure 7: Stratigraphic model for the current level of the disposal room ......................... 31 Figure 8: Simulated volumetric strain for POP compared to the standard 55-gal drum
(Park and Hansen, 2003) ........................................................................................... 33 Figure 9: Mesh discretization and boundary conditions around the disposal room ......... 36 Figure 10: Meshes for various waste package inventories in the disposal room .............. 38 Figure 11: Ideal packing of I 00-gallon containers in rooms ............................................ 40 Figure 12: Rearrangement of containers for all AMWTP waste by the inward movement
of the walls ................................................................................................................ 41 Figure 13: Concept separating pucks and container for mesh generation ........................ 42 Figure 14: Representation of pucks and containers for a room filled with supercompacted
AMWTP .................................................................................................................... 43 Figure 15: 2/3 AMWTP and 1/3 Standard waste are placed in the room ......................... 44 Figure 16: The AMWTP containers are rearranged by the inward movement of the walls
................................................................................................................................... 44 Figure 17: Representation of pucks and containers for a room containing 2/3 AMWTP
and 1/3 standard waste packages .............................................................................. 45 Figure 18: Emplacement of 1/3 AMWTP and 2/3 Standard waste in the disposal room. 46 Figure 19: The AMWTP containers are rearranged by the inward movement of the walls
................................................................................................................................... 46 Figure 20: Idealized array separating incompressible and compressible materials for mesh
generation .................................................................................................................. 4 7 Figure 21: Computational flowchart to determine the porosity surface ........................... 50 Figure 22: Close-up views of the deformed disposal room containing the standard waste
for j=O.O .................................................................................................................... 54 Figure 23: Close-up views of the deformed disposal room containing the 6-inch POP
waste for _f---0.0 .......................................................................................................... 54 Figure 24: Close-up views of the deformed disposal room containing the 12-inch POP
waste forj=O.O .......................................................................................................... 55 Figure 25: Close-up views of the deformed disposal room containing the 1/3 AMWTP +
2/3 Standard waste for j=O.O ..................................................................................... 55 Figure 26: Close-up views of the deformed disposal room containing the 2/3 AMWTP +
1/3 Standard waste for.FO.O ..................................................................................... 56 Figure 27: Close-up views of the deformed disposal room containing the All AMWTP
waste for j=O.O .......................................................................................................... 56 Figure 28: Pressure histories for a disposal room containing the standard waste ............ 58

Information Only
Determination of the Porosity Surfaces of the Disposal Room Containing Various Waste Inventories for WIPP PA 9 of 140
Figure 29: Pressure histories for a disposal room containing the 6-inch POP waste ....... 59 Figure 30: Pressure histories for a disposal room containing the 12-inch POP waste ..... 59 Figure 31: Pressure histories for disposal room a containing the 113 AMWTP + 2/3
Standard waste .......................................................................................................... 60 Figure 32: Pressure histories for disposal room a containing the 2/3 AMWTP + 1/3
Standard waste .......................................................................................................... 60 Figure 33: Pressure histories for a disposal room containing the AMWTP waste ........... 61 Figure 34: Porosity histories for a disposal room containing the standard waste ............. 63 Figure 35: Porosity histories for a disposal room containing the 6-inch POP waste ........ 64 Figure 36: Porosity histories for a disposal room containing the 12-inch POP waste ...... 64 Figure 37: Porosity histories for a disposal room containing 113 AMWTP+2/3 standard
waste ......................................................................................................................... 65 Figure 38: Porosity histories for a disposal room containing 2/3 AMWTP+ 113 Standard
waste ......................................................................................................................... 65 Figure 39: Porosity histories for a disposal room containing all AMWTP waste ............ 66 Figure 40: Comparison between porosity histories for the disposal room containing
various waste inventories, f:::O.O ............................................................................... 68 Figure 41: Comparison between porosity histories for the disposal room containing
various waste inventories, f=0.4 ............................................................................... 68 Figure 42: Comparison between porosity histories for the disposal room containing
various waste inventories,.f=l.O ................................................................................ 69 Figure 43: Comparison between porosity histories for the disposal room containing
various waste inventories, f=2.0 ............................................................................... 69 Figure 44: Porosity surface for the room containing the standard waste (log time scale) 70 Figure 45: Porosity surface for the room containing the 12-inch POP waste (log time
scale) ......................................................................................................................... 70 Figure 46: Porosity surface for the room containing the 6-inch POP waste (log time scale)
··································································································································· 71 Figure 47: Porosity surface for the room containing the AMWTP waste (log time scale)
··································································································································· 71 Figure 48: Porosity surface for the room containing 2/3 AMWTP + 1/3 standard waste
(log time scale) .......................................................................................................... 72 Figure 49: Porosity surface for the room containing 113 AMWTP + 2/3 standard waste
(log time scale) .......................................................................................................... 72

Information Only
Determination of the Porosity Surfaces of the Disposal Room Containing Various Waste Inventories for WIPP PA
AMWTP
BRAGFLO
CCA
CFR
CPR
CRA
CH-TRU
DOE
EPA
FEM
FEPs
INEEL
PA
PAVT
POP
SNL
TDOP
TRU
TWBID
WIPP
WTS
WWIS
ACRONYMS
Advanced Mixed Waste Treatment Project
Brine And Gas FLOw (a numerical model)
Compliance Certification Application
Code ofF ederal Regulations
Cellulosics, Plastics, and Rubber
Compliance Recertification Application
Contact-Handled Transuranic
U.S. Department of Energy
U.S. Environmental Protection Agency
Finite Element Method
Feature, Events, and Processes
Idaho National Environmental Engineering Laboratory
Performance Assessment
Performance Assessment Verification Test
Pipe OverPack
Sandia National Laboratories
Ten Drum Over Pack
Transuranic Waste
TRU Waste Baseline Inventory Database
Waste Isolation Pilot Plant
Washington TRU Solutions
WIPP Waste Information System
10 of 140

Information Only
Determination of the Porosity Surfaces of the Disposal Room Containing Various Waste Inventories for WIPP PA
1 INTRODUCTION
1.1 Objective
11 ofl40
In 1996, the U.S. Department of Energy (DOE) completed a performance assessment (PA) for the Waste Isolation Pilot Plant (WIPP). The performance assessment was part of the Compliance Certification Application (CCA) (DOE, 1996) submitted to the U.S. Environmental Protection Agency (EPA) to demonstrate compliance with the long-term disposal regulations in 40 Code of Federal Regulations (CFR) 191 (Subparts B and C) and the compliance criteria in 40 CFR 194. In 1997, EPA required a verification of the calculations performed for the CCA, termed the Performance Assessment Verification Test (PA VT). On the basis of these submittals, WIPP was certified for operations. Since March 1999 the DOE has disposed of radioactive waste at WIPP in accordance with provisions of compliance certification.
One provision of the certification itself is a requirement for recertification on a five-year interval. The compliance recertification application (CRA) includes analyses of conditions that depart from the bases underlying the original certification. This requirement was imposed in recognition that operations of the repository are likely to change from the baseline conditions underpinning the original certification. In fact, this provision was prescient, as several features of operations have changed from the original certification. Performance assessment is charged with the responsibility of evaluating the consequences of these changes. One example is implementation of the Option D panel closure system in PA and evaluating the performance impact of panel closures that are less permeable than the panel closure modeled for the original compliance certification. This document examines other actual and potential changes in disposal operations that are substantially different from the compliance basis: These are the structural/mechanical impacts to room closure and porosity surfaces created by the waste packages actually placed in the underground as well as waste packaging proposed for delivery to the WIPP for disposal. The planning basis for the analysis of these changes was provided in earlier documentation (Hansen et a!., 2003b ).
The compliance certification of WIPP was predicated on many assumptions, including mechanical properties of the waste. In the original compliance calculations the standard waste form comprised a 55-gallon drum filled with waste, as illustrated in Figure lA. In practice, the actual inventory disposed in Panel 1 includes a significant proportion of 55-gallon drums containing an interior stainless steel pipe, illustrated in Figure I B. This packaging is called the pipe overpack or POP. The POP waste package has been shown to be much more rigid than the baseline waste package (Park and Hansen, 2003). From the WIPP waste information system (WWIS) dated July 29, 2003, there are 39,415 total containers in Panel I, of which 16,989 are POPs. It is also anticipated that very few, if any, additional POPs will be shipped in the future. Another notable example of a possible future waste package includes super-compacted wastes from the Advanced Mixed Waste Treatment Project (AMWTP), illustrated schematically in Figure IC. The AMWTP supercompacted waste includes highly compressed 55-gallon drums, which are subsequently placed in a I 00-gallon drum. The supercompacted drums are called
Information Only
Determination of the Porosity Surfaces of the Disposal Room Containing Various Waste Inventories for WIPP PA 12 of 140
"pucks" because they are dense disks compressed to stress levels approaching 60 MPa, a factor of four times greater than lithostatic stresses extant in the WIPP salt (15 MPa). Another waste form that has been received at WIPP is the ten drum overpack (TDOP), illustrated in Figure !D. It is anticipated that additional forms of packaging will eventuate over the disposal operational life of the repository. In this analysis, focus is given to the POP and AMWTP waste packages, as they represent the most significant structural differences to the standard package. It is estimated that the TDOP response would also be more rigid than the standard drums, but less rigid than the POP or AMWTP packages. To capture the maximal variation in possible porosity surfaces, emphasis is given here to the POP and AMWTP supercompacted waste packages.
Both waste package configurations--POPs and AMWTP--are structurally more rigid than a typical 55-gallon waste drum, and may affect repository processes. If groups of the super-compacted AMWTP waste or the wastes in POPs are stored in the rooms they would create stiff columns and influence creep closure. This effect would be reflected in the porosity surface look-up table accessed for performance assessment calculations. An evaluation of the porosity surfaces resulting from placement of these waste forms is the subject of this report.

Information Only
Determination of the Porosity Surfaces of the Disposal Room Containing Various Waste Inventories for WIPP PA 13 of 140
A. 55-Gallon Drum
-.. ""'!!!!~~+-(~ed S~gol wdrume)
C. AMWTP Compressed Pucks in 1 00-Gallon Drum
B. Pipe Overpack within a 55-Gallon Drum
D. Ten Drum Overpack (TDOP)
Figure 1: Various waste packages

Information Only
Determination of the Porosity Surfaces of the Disposal Room Containing Various Waste Inventories for WIPP PA
1.2 Background
14 of 140
The structural response of the WIPP underground setting has been modeled many times over the years. The conceptual model for room closure describes salt creep into a disposal room, in which the rock salt impinges on the waste and compresses the waste until stress equilibrium is approached. The geomechanical response of the WIPP salt and other lithologies in proximity to the rooms is well understood and validated by decades of full-scale experiments as well as continuous monitoring during the emplacement period. Thus, the essential elements of disposal room behavior and closure modeling that are different today than at the time of the original certification involve the constitutive properties of the inventory residing within the rooms.
Geomechanical response of the underground is coupled with waste deformation. Prior to submittal of the original certification application, an empirical model was developed from stress-deformation experiments on surrogate waste in 55-gallon drums (Butcher et al., 1991 ). From the laboratory data, a volumetric plasticity representation was developed and used for room closure calculations and subsequent creation of the porosity surfaces, which are accessed as a look-up table in performance assessment calculations. Because the actual waste placed in WIPP to date and proposed future shipments of waste to WIPP include packaging that differs appreciably from the standard 55-gallon drums, new analyses are required to assess the impact of possibly more robust and durable waste forms. No laboratory experiments were conducted on the new waste forms as had been conducted on 55-gallon drums. However, sufficient engineering information is available to develop credible response models for the POP and AMWTP waste packages.
Volumetric plasticity model parameters for the POP waste packages were developed in a series of fmite element simulations (Park and Hansen, 2003). Design drawings of the POP had exact dimensions and material properties of the composite elements were known precisely. The pipe overpack within the 55-gallon drum and the other packing material were accurately represented in axisymmetry using the finite strain code called SANTOS (Stone, 1997b ). Laboratory tests for uniaxial, triaxial and hydrostatic stress conditions were simulated to compute model parameters for the POP waste configurations. Parameters for the waste constitutive model, such as shear modulus, bulk modulus, deviatoric yield surface constants, and a pressure-volumetric strain function were determined (Park and Hansen, 2003). Essentially, the POP is approximately ten times stiffer than the standard waste packages.
The model for the supercompacted AMWTP waste package will be described in detail in the analysis of Section 3.3. Basically, the model of an individual AMWTP package comprises three components: pucks, outer drum, and an annulus. The annular space and the I 00-gallon drum lining offer little resistance to room closure. On the other hand, the compressed pucks resting inside the drum are very rigid and dense. The supercompaction process applies approximately 60 MPa (9,000 psi) to compress the initially 55-gallon drums into the so-called pucks. The maximal in situ stress at WIPP is 15 MPa (2,150 psi). Even accounting for tributary loading, which could load rigid waste columns above 15 MPa, it is not probable that the supercompacted waste will be further deformed by salt

Information Only
Determination of the Porosity Surfaces of the Disposal Room Containing Various Waste Inventories for WIPP PA 15 of 140
compaction. Although it is a minor consideration for the calculation of initial porosity in the room, the pucks are assumed to have zero porosity.
In performance assessment calculations, room closure initially proceeds as if the room were open. The free air space is eliminated early by creep closure without resistance from the waste packages. Eventually the salt contacts the top of the waste stacks and deforms the room inventory. Modeling room closure onward from the moment the country rock contacts the waste packages requires implementation of an appropriate response model for the waste. Simultaneously, the conceptual models for corrosion and gas generation allow internal pressure to build within the room. It should be noted that waste mechanical properties are not adjusted to account for degradation or other processes. The room closure owing to salt creep is modified by the structural response of the waste and by gas generation. These competing conditions (creep closure, waste package rigidity, gas generation) yield porosity histories for each waste package configuration, which are compiled into a porosity surface.
The uncertainty in the future placement of the waste requires structural calculations for a variety of waste configurations. Waste configurations were chosen to capture a wide range of combinations of porosity and waste rigidity. Based on analyses completed prior to the current work (Stone, 1997a; Park and Hansen, 2003) general characteristics of the waste packages can be summarized in terms of rigidity and porosity. The standard 55-gallon drums have high porosity and little rigidity, the POPs have high porosity and high rigidity and the AMWTP packages have low porosity and high rigidity. To ensure models evaluated here cover the full range of possibilities, room closure calculations are conducted for six configurations of waste:
1. All standard waste (55-gallon drums) 2. All 6-inch POPs 3. Alll2-inch POPs 4. A mix of 1/3 supercompacted waste and 2/3 standard waste 5. A mix of2/3 supercompacted waste and 1/3 standard waste 6. All supercompacted waste
Since the time of the CCA, the response of the standard waste configuration was calculated and reported as part of the assessment of the effects of raising the repository to Clay Seam G (Park and Holland, 2003). Initial calculations for the other five cases were reported by Hansen et a!. (2003a) and have been modified to improve model details for the calculations in this report.
For each waste package configuration, 13 separate calculations were conducted in which the gas generation rate is varied from the base rate by factors (j) ranging from 0.0 (no gas generation) to 2.0 (twice the base rate). For a gas generation rate of zero, porosity histories for various waste package configurations reflect the mechanical effects unambiguously. Gas generation initiates immediately, so for most analyses, creep closure is counterbalanced by various pressure levels caused by internal gas pressure. The response surfaces are developed in terms of porosity as a function oftime at various levels off

Information Only
Determination of the Porosity Surfaces of the Disposal Room Containing Various Waste Inventories for WIPP PA
1.3 Report Organization
16 of 140
The remainder of this report describes implementation details. Section 2 summarizes basic information involved with the analyses, such as calculation of initial porosity. It turns out that initial porosity for a room full of waste does not vary greatly, despite the noted significant differences in the packaging. This similarity occurs because the volume of solids (waste and containers) is relatively small compared to the room volume. The MgO engineered barrier material, for example, contributes 5% to the initial porosity calculations. Gas generation potential and gas production rates are described and related to the performance assessment utilization. Section 2 also provides an overview of the stratigraphy and mechanical models, including the POP volumetric plasticity model and the AMWTP treatment. The detailed development of the POP constitutive model is described in a separate report (Park and Hansen, 2003).
Section 3 describes the mesh generation, especially as regards treatment of the AMWTP wastes. The AMWTP supercompacted pucks are treated as rigid inclusions, and the air annulus and outer container are simulated using the standard waste model developed for the 55-gallon dmms. The proportioning of rigid elements and compliant elements is described in Section 3. Section 4 documents the computer codes, files and documentation of the multiple runs executed for this study.
Section 5 presents the results of the calculations, making ample use of figures. Pressure and porosity histories from the SANTOS calculations are provided and comparisons are made for the various waste packages modeled. Section 6 provides discussion of the phenomenon observed for the stiff wastes, which tend to prop the rooms open and reduce creep into the rooms. Section 6 provides some additional perspective on these calculations and some concluding remarks. References are provided in Section 7.

Information Only
Determination ofthe Porosity Surfaces of the Disposal Room Containing Various Waste Inventories for WIPP PA
2 ANALYSIS MODELS
17ofl40
The analysis involves the familiar underground setting of the WIPP repository. Disposal rooms are mined at 655-m depth in bedded salt formations in southeastern New Mexico and are designed to store waste drums containing transuranic waste for a regulatory period of 10,000 years. The rooms are rectangular and the model represents a plane-strain two-dimensional slice perpendicular to a typical room. Geotechnical components include the constitutive models for salt and anhydrite, which are unchanged from the CCA and identical to those described by Park and Holland (2003). Calculations of initial porosity are completed for rooms filled entirely with standard waste drums, POPs or AMWTP waste packages and for two combinations of these inventories.
2.1 Initial porosity
The solid volume ofMgO amounts to 5% of the total volume of a room (see Appendix B-3). Although the MgO does not affect structural response, its inclusion or exclusion in these analyses is inconsistent and warrants explanation. This report will compare results from earlier analyses (Stone, 1997a; Park and Holland, 2003) with the current analyses of POP and AMWTP. The early calculations that replicated the CCA did not include MgO in the original porosity surface because it was necessary to replicate calculations identical to the baseline in the CCA (Park and Holland, 2003). Calculations of the porosity surface for the CCA did not include MgO. The POP analyses, which were calculated first in this series also did not include MgO, which thereby yields a porosity surface that is slightly higher than it would be with MgO, because including MgO would reduce porosity by 5%. The last in the series of calculations run on AMWTP included MgO as part of the initial porosity. MgO was included in the AMWTP calculations by placing a standard I m3 supersack above all waste stacks regardless of the proportion of AMWTP waste filling the room. The authors recognize this inconsistency, but choose to explain its impact rather than re-run all the analyses. The important mechanical response and overall results and conclusions are not changed.
2.1.1 Standard waste
The standard waste configuration comprises 6,804 55-gallon drums uniformly distributed in the disposal room in 7 -pack units. There are 972 of these units stacked three high. The initial porosity does not include MgO to ensure consistency with earlier analyses by Stone (1997a), which constitute the compliance baseline. The corresponding volume occupied by the waste and the drums is 1, 728 m3
•
The standard transuranic waste is a combination of metallics, sorbents, cellulose, rubber and plastics, and sludges. Table 1 summarizes the available data for characterizing the waste. The initial waste density, p0 , is 559.5 kg/m3 and the solid waste density, p,, is
1,757 kg/ m3• The initial waste density is the sum of the densities ofthe constituent waste
forms. Using the following definition of porosity, 1/J = 1- p0 I p, (Park and Holland,
2003), the initial waste porosity, ¢0 , is calculated to be 0.681 resulting in an initial solid

Information Only
Determination ofthe Porosity Surfaces of the Disposal Room Containing Various Waste Inventories for WIPP PA 18 of 140
volume of 551.2 m3. Using the difference of the undeformed disposal room volume and
the initial solid volume to calculate the total void volume of the room, the initial porosity of the undeformed disposal room is determined to be 0.849, which is exactly the number underpinning the CCA calculations (Park and Holland, 2003).
Table 1: WIPP CH-TRU Waste Material Parameter Disposal Inventory (Butcher, 1997)
Waste Form Waste Density (kg/m3
) Volume Fraction
Metallic 122. 0.218
Sorbents 40. 0.071
Cellulose 170. 0.304
Rubber & Plastics 84. 0.150 Sludges 143.5 0.256
Sum 559.5 0.999
2.1.2 Pipe overpack waste
Pipe overpacks (POP) are used to ship TRU wastes contaminated with concentrations of plutonium and americium. The stainless steel hollow cylinder is surrounded by an impact limiter and placed inside a 55-gallon drum as standard waste. The impact limiter is typically fabricated from polyethylene or a dense fiberboard. A report by Park and Hansen (2003) provides extensive detail of the POP, including engineering design drawings and the finite-element grid used to model the composite waste package.
The transuranic waste form is a combination of cellulose, iron-base metal/alloys, solidified inorganic matrix, plastics, solidified organic matrix, rubber, aluminum base metal/alloys, other inorganic materials, and other metal/alloys. Characteristics of the waste within the pipe listed in Table 2 were extracted from the Transuranic Waste Baseline Inventory Database (TWBID) 2.1, which consisted of the volume fraction information (Leigh, 2003). The density data are therefore assumed the same as the CCA inventory data from SAND97-0796 (Butcher, 1997). The waste volume of the 12-inch POP is calculated as 0.05006 m3
. The porosity of waste, ¢w, is assumed 0.681 as the case of
CCA (Butcher, 1997). The volume of waste is multiplied by (1-t/Jw) to calculate the ma
trix volume of waste (0.01592 m3). The matrix volume of all combined waste is multi
plied by the volume fraction of each material to calculate the matrix volume of each individual waste material. The weights of each material are obtained by multiplying the matrix volume of each material by its density. The initial waste density is the sum of the densities of the constituent waste forms. Thus, the initial waste density, p0 , is 594.08
kg/m3 as shown Table 2.
Information Only
Detennination of the Porosity Surfaces of the Disposal Room Containing Various Waste Inventories for WIPP PA
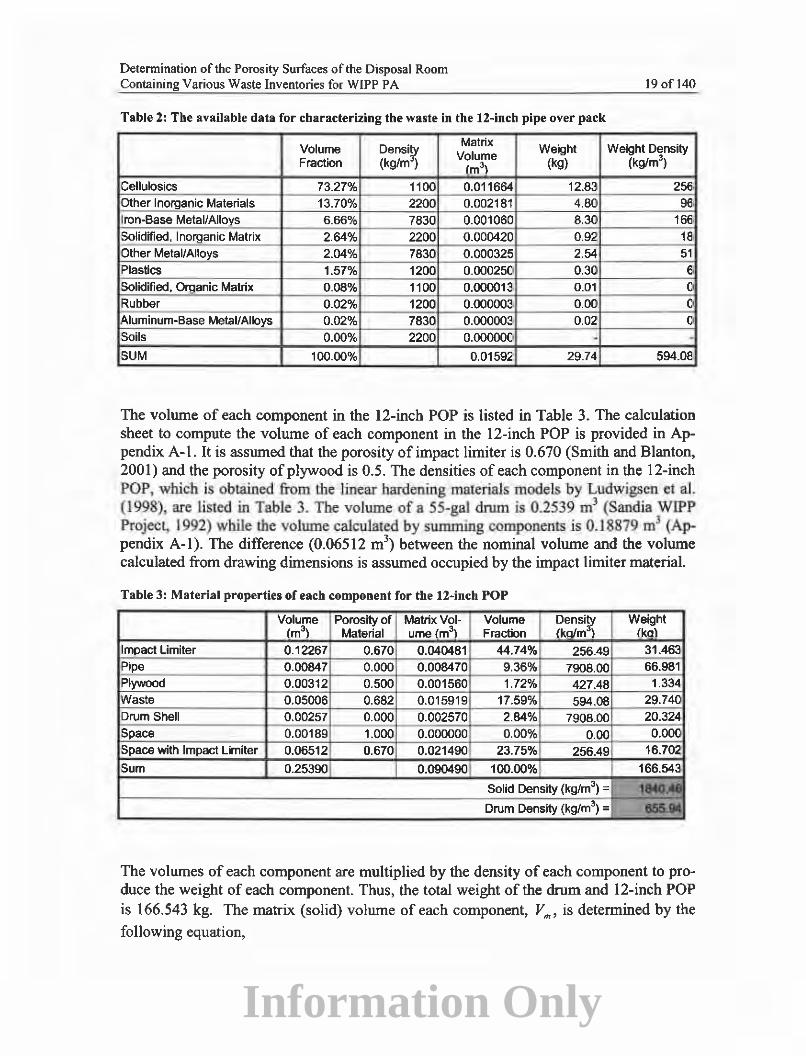
Table 2: The available data for characterizing the waste in the 12-inch pipe over pack
19 of 140
Volume Densi~ Matrix Weight Weight Density
Volume (kg/m1 Fraction (kg/m) (m3) (kg)
Cellulosics 73.27% 1100 0.011664 12.83 256i Other Inorganic Materials 13.70% 2200 0.002181 4.80 ga, Iron-Base Metal/Alloys 6.66% 7830 0.001060 8.30 1661 Solidified, Inorganic Matrix 2.64% 2200 0.000420 0.92' 18, Other Metal/Alloys 2.04% 7830 0.000325 2.54 51 Plastics 1.57% 1200 0.000250 0.301 61 Solidified, Organic Matrix 0.08% 1100 0.000013 0.01 0 Rubber 0.02% 1200 0.000003 0.00 0 Aluminum-Base Metal/Alloys 0.02% 78301 0.000003 0.02' 01 Soils 0.00% 22001 0.000000 - -SUM 100.00% 0.01592 29.74 594.08
The volume of each component in the 12-inch POP is listed in Table 3. The calculation sheet to compute the volume of each component in the 12-inch POP is provided in Appendix A-1. It is assumed that the porosity of impact limiter is 0.670 (Smith and Blanton, 2001) and the porosity of plywood is 0.5. The densities of each component in the 12-inch POP, which is obtained from the linear hardening materials models by Ludwigsen et aJ. (1998)t are listed in Table 3. The volume of a 55-gal drwn is 0.2539 m3 (Sandia WIPP Project, 1992) while the volume calculated by summang components is 0.18879 m3 (Appendix A-1). The difference (0.06512 m 3
) between the nominal volume and the volume calculated from drawing dimensions is assumed occupied by the impact limiter material.
Table 3: Material properties of each component for the 12-inch POP
Volume Porosity of Matrix Vol- Volume Densi~ Weight (m3) Material ume (m3
) Fraction (kglm (kq)
Impact Limiter 0.12267 0.670 0.040481 44.74% 256.49 31.4631 Pipe 0.00847 0.000 0.008470 9.36% 7908.00 66.981 Plywood 0.00312 0.500 0.001560 1.72% 427.48 1.334. Waste 0.05006 0.682 0.015919 17.59% 594.08 29.740 Drum Shell 0.00257 0.000 0.002570 2.84% 7908.00 20.324. Space 0.00189 1.000 0.000000 0.00% 0.00 O.OOCI Space with Impact limiter 0.06512 0.670 0.021490 23.75% 256.49 16.702
Sum 0.25390 0.090490 100.00% 166.54:3!
Solid Density {kg/m3) = 1840. ..
Drum Density {kg/m3) = --~
The volumes of each component are multiplied by the density of each component to produce the weight of each component. Thus, the total weight of the drum and 12-inch POP is 166.543 kg. The matrix (solid) volume of each component, vm, is determined by the
following equation,

Information Only
Determination of the Porosity Surfaces of the Disposal Room Containing Various Waste Inventories for WIPP PA
V =V(l-'") m c 'f'c
where, V, = The volume of each component
¢, = The porosity of each component
20ofl40
(1)
Then, the matrix volumes of each component are calculated as listed in Table 3. The sum of the matrix volumes is 0.09049 m3
. The total weight of the drum and POP is divided by the total matrix volume to produce the matrix density, which is also called the solid waste density. The solid waste density of the drum and 12-inch POP,p,, is 1840.46 kg/m3
. The
total weight is divided by the true volume of a 55-gallon drum to produce the initial waste density. The initial waste density, p 0 , is 655.94 kg/m3
•
Using the following definition of porosity, ¢ = 1- p 0 I p, , the initial waste porosity, ¢0 ,
is calculated to be 0.644 resulting in an initial solid volume of 615.69 m3. Using the dif
ference of the undeformed disposal room volume and the initial solid volume to calculate the total void volume of the room, the initial porosity of the undeformed disposal room is determined to be 0.831. The calculation sheet for the initial porosity for the case of the 12-inch POP is provided in Appendix B-1. As can be appreciated, the initial room porosity, when occupied entirely with POPs is essentially the same as when the room is filled with the standard waste confignrations comprising 55-gallon drums.
Following the same line of reasoning, the waste volume of the 6-inch POP is calculated as 0.01278 m3
. Porosity of waste, ¢w, is assumed 0.681. The volume of waste is multi-
plied by (I-¢w) to calculate the matrix volume of waste (0.00406 m3). A summary of
each component is given in Table 4. The calculation sheets for the volume of each component of the 6-inch POP are provided in Appendix A-2. The densities of each component of the 6-inch POP are the same as the 12-inch POP, while the volume of the drum as calculated in Appendix A-2 is 0.18877 m3
. The volumes of each component are multiplied by the density of each component to produce the weight of each component. Thus, the total weight of the 6-inch POP is 124.163 kg. The matrix volume of each component, Vm, is determined (Equation 1) and listed in Table 4. The amount of matrix volume is
0.08838 m3. The solid waste density of the 6-inch POP, p,, is 1404.82 kg/m3
. The total
weight is divided by the true volume of a 55-gallon drum to produce the initial waste density, Po, of 489.02 kg/m3
•

Information Only
Determination ofthe Porosity Surfaces of the Disposal Room Containing Various Waste Inventories for WIPP PA
Table 4: Material properties or each component for the 6-inch POP
Volume Porosity of Matrix Vol- Volume Densi~ (ma) Material ume (m3
) Fraction (kg/m')
Impact Limiter 0.16402 0.670 0.054127 61.24% 256.49 -
Pipe 0.00457 0.000 0.004570 5.17% 7908.00 Plywood 0.00312 0.500 0.001560 1.77% 427.48 Waste 0.01278 0.682 0.004064 4.60% 594.08 Drum Shell 0.00257 0.000 0.002570 2.91% 7908.00 Space 0.00171 1.000 0.000000 0.00% 0.00 Space with Impact Limiter 0.06513 0.670 0.021493 24.32% 256.49 Total 0.2539 0.088384 100.00%
Solid Density (kg/m3) =
Drum Density (kglm1 =
21 ofl40
Weight (kg)
42.069,
36.140 1.334 7.592
20.324 0.000
16.705.
124.163
4MiotM
488.02
The initial waste porosity, f/J0 , is calculated to be 0.652 resulting in an initial solid volume
of 601.385 m3• The initial porosity of the undeformed disposal room is determined to be
0.835, nearly identical to the porosity of the 12-inch POP. The calculation sheet to compute the initial porosity for the case of the 6-inch POP is provided in Appendix B-2.
As noted in the introduction to this section, the initial porosity of the rooms containing POPs does not include MgO. If MgO were included, the initial porosity would be reduced by 5%. The calculation result plots porosity as a function of time, which would simply be offset by an equivalent 5% if MgO material were included in the calculations.
2.1.3 AMWTP Supercompacted waste
The AMWTP is designed to retrieve, characterize, prepare and package 65,000 m3 of contact-handled transuranic (CH-TRU) waste at the INEEL for shipment to the WIPP. The CH-TRU wastes at INEEL consist of non-debris and debris wastes. The non-debris wastes constitute approximately 30% of the total stored volume at INEEL and will not be supercompacted. The debris wastes constitute about 70% of the total stored volume at INEEL and will be sorted and supercompacted. The AMWTP will compact 55-gallon drums of debris waste and place the compacted drums into 1 00-gallon drums before shipment to the WIPP. The compacted 55-gallon drums are referred to as ''pucks" (see Figure 2). Each puck has a final volume of 15 gallons to 35 gallons. and each 100-gallon container is anticipated to contain from three to five pucks, with an average of four pucks per container, as illustrated in Figure 1-C.

Information Only
Determination of the Porosity Surfaces of the Disposal Room Containing Various Waste Inventories for WIPP PA 22 of 140
Figure 2: AMWTP pucks produced by supercompaction of 55-gal1on drums or debris waste
The basis of this calculation assumes that an entire waste room is filled with waste from the AMWTP. The compressed pucks have a minimal porosity, which is assumed zero. The AMWTP waste is compressed to 60 MPa prior to being placed in the container. The supercompaction stress is far greater than the waste wil1 experience in the underground from the room closure (maximal compression of ~15 MPa). As before, a typical room can be filled with 972 seven-packs of 55-gallon drums in a hexagonal configuration. A three-pack of 1 00-gallon containers will occupy the same footprint as the standard sevenpack, as shown in Figure 3(A). Figure 3(B) also shows what might be considered random disposal room inventory. It is highly unlikely that any room would be completely filled with a single type of waste package. The three-pack and seven-pack pallets are identical in size (WTS, 2003). Thus, number of containers in a disposal room is 972 packs x 3 containers/pack= 2,916 containers.
The outer dimensions of the 100-gallon containers are 0.8897 m (35 inches) in height and 0.790 m (31 inches) in diameter as shown Figure 4. The volume of the container is calculated to be 0.436 m3
. The volume of the all containers in a room is 0.436 m3 /container x 2,916 containers = 1,272.3 m3
. Each container has an inner lid 0.0366 m (1.5 inches) below the outer lid. For purposes of these calculations, a void space between the inner lid and the top of the supercompacted waste (pucks) is assumed to be 5% ofthe outer height, or 0.044 m. Then, the height of the pucks on the inside is 0.805 m (31.75 inches). The diameter of the pucks is 0.635 m (25 inches). The pucks are guided into the 100-gallon drums with longitudinal spacers, which create a 0.076 m (3 inches) annulus between the waste and the outer wall. The incompressible volume of one container (i.e. pucks in the container) is calculated to be 0.255 m3
. Using these values, the total volume of pucks is 0.255 m3/container x 2,916 containers= 743.6 m3
.
As noted, the previous porosity calculations for rooms full of standard waste packages (i.e., the compliance baseline) and for rooms full of POPs did not include MgO. When investigations into the impact of AMWTP supercompacted waste were undertaken, MgO

Information Only
Detennination of the Porosity Surfaces of the Disposal Room Containing Various Waste Inventories for WIPP PA 23 of 140
was included in the calculation of the initial porosity. This has no structural effect, as the MgO adds nothing to the resistance to creep closure. However, its inclusion for the AMWTP case reduces the initial porosity by 5%. With the addition of 324 supersacks of MgO with a volume of 1 m3 atop each stack, the total volume of containers and MgO sacks in a room is 1,586 m3
.
(A) Footprints of three-pack of 1 DO-gallon containers and seven-pack of 55-gallon drums
(B) Arrangement of waste containers in the repository
Figure 3: mustration of waste containers and waste configuration

Information Only
Determination of the Porosity Surfaces of the Disposal Room Containing Various Waste Inventories for WJPP PA
I
E ...... •!§
Cl
0.00 14m
0.0763r!l •
OJ17Sm I
I
24 of 140
E E "t ! E 8 a 0 ~
I ! "5 ';!
~
e § 0
i e; ...
Figure 4: Simplified outline drawing of the 100-gallon container and supercompacted waste
From above, the porosity of a single AMWTP container is calculated to be 41% (= (0.436 m3
- 0.255 m3) I 0.436 m\ There is a sack of MgO atop each stack of containers, for
which the porosity is assumed to equal41 %, a nominal value for loose aggregate. Using these values the volume of solid ofMgO sacks is 324m3 x (1-0.41) = 191.2 m3
• Then. the total volume of incompressible solid in a room is calculated to be 935.9 m3 (total volume of pucks+ total volume ofMgO solid). The total volume of the container shells is calculated to be 14.9 m3 (see Appendix B-3) and the total incompressible solid is 949.5 m3
•
The initial porosity of the room can then be calculated using the following formula:
Room Porosity= 1-949
·5
= 0.739 3642.8

Information Only
Determination of the Porosity Surfaces of the Disposal Room Containing Various Waste Inventories for WIPP PA 25 of140
The calculation sheet is provided in Appendix B-3. IfMgO were not included the initial porosity would be approximately 0. 79.
The volume of pucl<s. drum shell and lhe free space (includinj upper, lower, and annular space) in a container are calculated to be 0.255 m3, 0.005 m , 0.176 m3
, respectively (Appendix A-3). The volume ofMgO per container is calculated to be 0.111 m3/container (= 324 m3 / 2916 containers). The backfill material (MgO sacks) shall have a minimum loose bulk density of87 lb/ft3 (1,394 kglm3
) (Griswold, 2002). Waste (puck) density is assumed to be 2,238 kglm3 based on an assumption that a standard drum is supercompacted to one fourth its original volume. The density of standard waste is 559.5 kg/m3 (Stone, 1997a). The steel drum shell density is assumed 7,908 kglm3
, typical values for high strength and mild carbon steels.
Table S: Material properties of each component for AMWTP waste
Volume Porosity of Matrix Vol- Volume Densi~ Weight (m3) Material ume (m3
) Fraction {kg/m) (kg}_
MgO 0.111 0.41 0.06551 20.12% 1394.01 154.73
Waste (Pucks) 0.255 0.00 0.25501 78.31% 2238.01 57o.sa.
Container Shell 0.005 0.00 0.0051 1.57% 7908.01 40.491
Space 0.176 1.00 0.0000 0.00% 0.01 0.001
Sum 0.547 0.3256 100.00% 765.801
Solid Density (kg/m3) = ~~
Drum Density (kg/m3
) = 18.21
The volumes of each component are multiplied by the density of each component to produce the weight of each component. The total weight of an AMWTP container with an MgO sack is 766 kg. The matrix volumes of each component are calculated as shown in Table 5. The amount of matrix volume is 0.3256 m3
. The solid waste density of a container with an MgO sack,ps, is 2,352 kglm3
. The total weight is divided by the actual
volume of a container with an MgO sack to determine an initial waste density, Po, equal
ing 1 ,399 kglm3•
1.1.4 Combined cases
The uncertainty in future placement of waste packages in the disposal rooms and in the waste package response models requires structural calculations for a variety of waste package configurations. Waste package configurations were chosen to cover a range of combinations of porosity and waste package structural characteristics (rigidity). To ensure that these configurations covered the range of possibilities, intermediate cases representing combinations of standard and supercompacted waste packages in various ratios were examined. Recall that the case of a room filled entirely with POP would provide high initial porosity and the rigidity of the POPs would retain the highest porosity surface in cases without gas generation. On the other extreme, rooms filled with standard waste
Information Only
Determination of the Porosity Surfaces ofthe Disposal Room Containing Various Waste Inventories for WIPP PA 26 of 140
containers continue to close with relatively small backstresses to the lowest porosity surface, again in the case without gas generation. The variations examined here involve combinations of the standard waste model with AMWTP waste. These intermediate cases are described as follows:
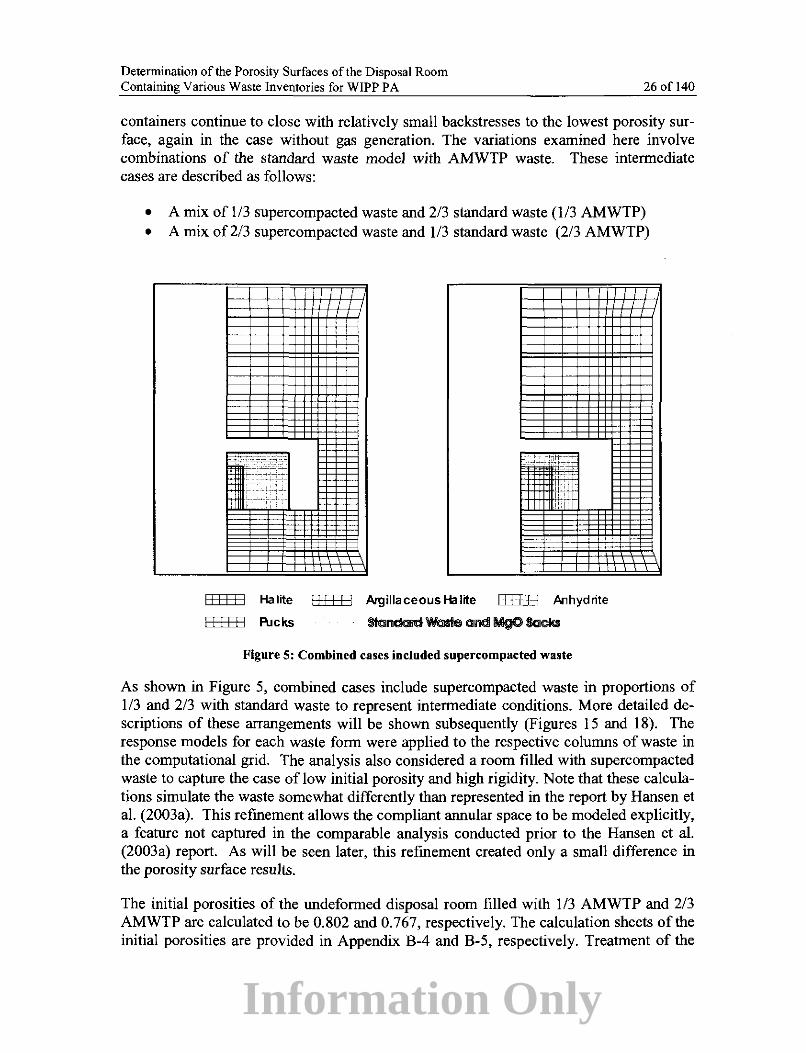
• A mix of 113 supercompacted waste and 2/3 standard waste (1/3 AMWTP) • A mix of 2/3 supercompacted waste and 113 standard waste (2/3 AMWTP)
I
EHm Halite EHm ArgillaceousHal~e 1JIIF1 Anhydrite
E:E8'E Pucks St@llc:kilrd Wast@ aildiiMigO Sacks
Figure 5: Combined cases included supercompacted waste
As shown in Figure 5, combined cases include supercompacted waste in proportions of I /3 and 2/3 with standard waste to represent intermediate conditions. More detailed descriptions of these arrangements will be shown subsequently (Figures 15 and 18). The response models for each waste form were applied to the respective columns of waste in the computational grid. The analysis also considered a room filled with supercompacted waste to capture the case of low initial porosity and high rigidity. Note that these calculations simulate the waste somewhat differently than represented in the report by Hansen et al. (2003a). This refinement allows the compliant annular space to be modeled explicitly, a feature not captured in the comparable analysis conducted prior to the Hansen et al. (2003a) report. As will be seen later, this refinement created only a small difference in the porosity surface results.
The initial porosities of the undeformed disposal room filled with 113 AMWTP and 2/3 AMWTP are calculated to be 0.802 and 0.767, respectively. The calculation sheets of the initial porosities are provided in Appendix B-4 and B-5, respectively. Treatment of the

Information Only
Determination of the Porosity Surfaces of the Disposal Room Containing Various Waste Inventories for WIPP PA 27 of 140
AMWTP package will be discussed in detail in Section 3.3, but suffice it to say at this time, that the rigid pucks are pushed together at the beginning and the annular space including the vertical spacer bars are simulated using the standard waste model.
2.2 Gas generation potential and production rate
Gas production is a significant component of the room closure model and is unique for each waste package combination examined. A gas production potential and a base gas generation rate were estimated for each waste package. The gas generation methodology was implemented exactly as it was for calculations supporting the original certification (Stone, 1997a). The base gas generation rate was varied by factors ranging from 0.0 (no gas generation) to 2.0 (twice the base rate), to capture uncertainty in actual gas generation from the waste materials.
For the standard waste, the base gas production potential from anoxic corrosion of ironcontaining metals was estimated at 1,050 moles/drum, with a base production rate of one mole/drum/year. The gas production potential from microbial activity was estimated to be 550 moles/drum, with a production rate of one mole/drum/year. Gas production ceases after 1050 years. The total amount of gas generated in a disposal room for the standard waste case was based on 6,804 waste drums per room (Stone, 1997a). For this analysis, the base gas generation potential and gas production rate for the pipe overpack configuration are assumed to equal the standard waste package configuration in terms of gas generation potential.
The amount of gas generated from a single supercompacted puck is assumed equal to the amount generated from an uncompacted 55-gallon drum (1 mole/drum/year). Since an average of four pucks are placed in each 100-gallon container, and three 1 00-gallon containers fill the same space occupied by a seven-pack arrangement of 55-gallon drums, the supercompacted waste has a gas production potential and base gas generation rate 12/7 larger than the potential and rate for the standard waste.
For the 113 supercompacted and 2/3 standard waste configuration, the total amount of gas generated in a disposal room is based on 3,888 pucks and 4,536 standard drums per room. For the 2/3 supercompacted and 113 standard waste configuration, the total amount of gas generated in a disposal room is based on 7,776 pucks and 2,268 standard drums per room. Rooms completely filled with supercompacted waste contain a total of 11,664 waste pucks. Table 6 summarizes the total potential for gas production, in moles, and the gas production rates for the six waste loading schemes. The total gas potential for each reference case is shown in Figure 6. The gas generation potential assumes that no gas bleeds off through the surrounding lithologies. The calculation sheets of the gas generation potential and rate are provided in Appendix C.
The gas pressure in the disposal room is computed from the ideal gas law based on the current free volume in the room. Specifically, the gas pressure, pg, utilizes the following relationship:

Information Only
Determination of the Porosity Surfaces of the Disposal Room Containing Various Waste Inventories for WIPP PA
P =/NRT g v
28 of 140
(2)
where N, R and Tare the mass of gas in g-moles for the baseline case, the universal gas constant, and the absolute temperature in degrees Kelvin (300 °K), respectively. The variable, V, is the current free volume of the room. For each iteration in the analysis, the current room volume is calculated based on the displaced positions of the nodes on the boundary of the room. The free room volume, V, is computed by subtracting the solid volume of the waste from the current room volume. The gas generation variable, f, is a multiplier used in the analyses to scale the pressure by varying the amount of gas generation. A value of f=l corresponds to an analysis incorporating full gas generation, while a value of f=O corresponds to an analysis incorporating no internal pressure increase due to gas generation. This portion of the analysis is identical to that implemented by Stone (1997a). It should be noted, however, that the productfxN in Equation 2 represents different gas potentials depending on the type of waste package configuration assigned to a disposal room. For example, if the entire room is filled with AMWTP waste, then fxN represents a gas potential that is 12/7 of the gas potential of a standard waste configuration. The differences in gas potential for f=l are shown graphically in Figure 6. These differences need to be considered when model results are compared in Section 5.
The porosity surface defines the relationship between disposal room porosity, amount of gas present in that porosity, and time. The porosity can be computed directly from the disposal room deformed shape. The concept of the porosity surface comes from the observation that the disposal room closure is directly influenced by gas generation. This observation allows a surface to be constructed incorporating the closure results for various values off, which is a convenient way to express the amount of gas generation.
Table 6: Total gas potential and gas production rates for each waste configuration.
Standard 6"POP 12" POP 1/3 2/3 All Parameter AMWTP AMWTP AMWTP Total gas potential from 0
7.484x10⁶ 7.484x10⁶ 7.484x10⁶ 9.266x10⁶ 1.105x10⁷ 1.283x10⁷
vr to 550 vrs (mol) Total gas potential from
3.402x10⁶ 3.402x10⁶ 3.402x10⁶ 4.212x10⁶ 5.022x10⁶ 5.832x10⁶
550 yrs to 1050 yrs (mol) Gas production rate from 0
4.312x10⁴ 4.312x10⁴ 4.312x10⁴ 5.339x10⁴ 6.366x10⁴ 7.392x10⁴
vr to 550 vrs (molls) Gas production rate from
2.156x10⁴ 2.156x10⁴ 2.156x10⁴ 2.669x10⁴ 3.183x10⁴ 3.696x10⁴
550 yrs to 1050 yrs (molls)

Information Only
Determination of the Porosity Surfaces of the Disposal Room Containing Various Waste Inventories for WIPP PA
20
18
U> 16 Q)
0 E 14 ~ (ij
"' 12
c
* 10 a. "' 8 "' C)
~ 6
1-4
2
250 500 750
Time (years)
29 of 140
AIIIWWTP
2/3 A.MWTP + 1/3 Std.
113 PJ/fWTP + 2/3 Std.
Std. and POP
1000 1250 1500
Figure 6: Histories of gas generation potential used for tbe disposal room analyses, f=l.O

Information Only
Determination of the Porosity Surfaces of the Disposal Room Containing Various Waste Inventories for WIPP PA
2.3 Geomechanical Models
2.3.1 Stratigraphy and constitutive models
30 of 140
The idealized stratigraphy for the WIPP underground, which derives from Munson et a!. (1989), has been described recently (Park and Holland, 2003). Only a brief review will be given here. Calculations were conducted using a grid representation on the original disposal level. Park and Holland (2003) showed that minor structural effects could be expected when the repository horizon is raised 2.43 m to Clay Seam G. Because room closure modeled for the raised repository differed almost imperceptibly from the compliance baseline results, the stratigraphic model used here is identical to that used for compliance calculations, as shown in Figure 7.
The traditional (e.g., see Park and Holland, 2003) multi-mechanism deformation model is implemented in SANTOS to model the creep behavior of rock salt. This is exactly the same model used by Stone (1997a) and others for calculations supporting the original compliance certification. As before, the anhydrites are modeled using the DruckerPrager criterion and a nonassociative flow rule to determine the plastic strain components.

Information Only
Determination ofthe Porosity Surfaces of the Disposal Room Containing Various Waste Inventories for WIPP PA
LEGEND
y
L. ALL DIMENSIONS lN METERS
8 .. 9.79 mlri p : 2.30 Mglm3
Figure 7: Stratigraphic model for the current level of the disposal room
3lofl40

Information Only
Determination of the Porosity Surfaces of the Disposal Room Containing Various Waste Inventories for WIPP PA
2.3.2 Waste constitutive model
2.3.2.1 Standard waste
32 of 140
The stress-strain behavior of the standard waste 55-gallon drum was represented by a volumetric plasticity model (Stone, 1997a) with a piecewise linear function defining the relationship between the mean stress and the volumetric strain. Compaction experiments on simulated waste were used to develop this relationship. The deviatoric response of the waste material has not been characterized. It is anticipated that when a drum filled with loosely compacted waste is compressed axially, the drum will not undergo significant lateral expansion until most of the void space inside the drum has been eliminated. The volumetric plasticity relationship consistent with Stone's (1997a) original work andrecent calculations supporting WIPP recertification (Park and Holland, 2003) is applied here for standard waste packages.
2.3.2.2 Pipe overpack waste
The material model for standard wastes implemented in the initial compliance certification calculations was based on laboratory testing of 55-gal drums containing surrogate wastes. Similar laboratory tests have not been conducted on the POP, but the composite material properties and geometries are known accurately, thus allowing deformational characteristics to be modeled readily using fmite elements. Park and Hansen (2003) presented the details of the several specific analyses used to develop model parameters for the POP. The finite element code called SANTOS was used for these calculations.
The SANTOS analyses allowed determination of shear modulus, bulk modulus, deviatoric yield surface constants, and a pressure-volumetric strain function. Simulations were run for 6-inch and 12-inch interior pipes and included uniaxial, triaxial, and hydrostatic stress applications.
Uniaxial Test Simulation The input to the soil and crushable foams model in the SANTOS code requires a shear modulus and the bulk modulus. These values are derived from Young's modulus and Poisson's ratio of the POP drum simulations.
Triaxial Test Simulation The POP waste package is considered isotropic and elastic until yield occurs. Yield is assumed governed by the Drucker-Prager criterion. The model within SANTOS requires input constants for the deviatoric yield surface.
Hydrostatic Test Simulation To express the volumetric hardening of the POP, the data points defining the volumetric plasticity model are determined from calculating the volume change of the POP drum with hydrostatic pressure. The pressure-volumetric strain curves show the 12-inch POP is slightly more rigid than the 6-inch POP.
SANTOS input constants obtained from test simulations are listed in Table 7. The volumetric strain calculated for the 12-in and 6-in POPs is plotted along with the experimental volumetric strain data for the standard waste 55-gal drum in Figure 8. The volumetric strain of the POP package is calculated to be much less than the standard waste drum.
Information Only
Determination of the Porosity Surfaces of the Disposal Room Containing Various Waste Inventories for WIPP PA 33 of 140
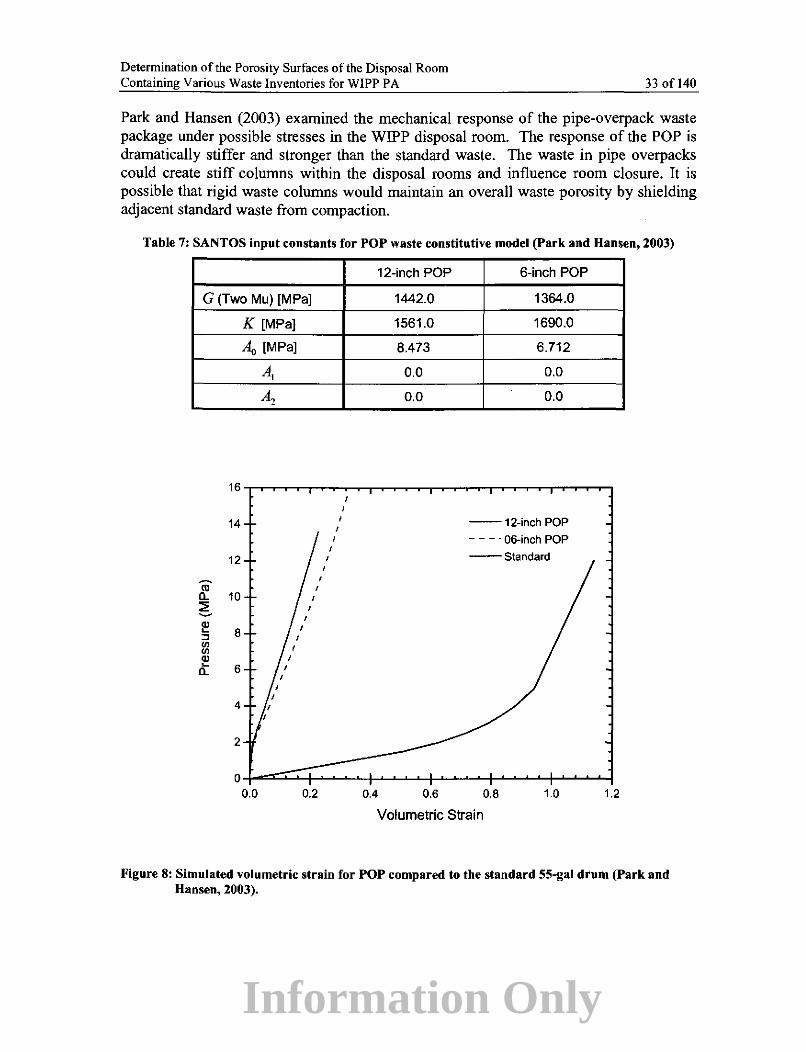
Park and Hansen (2003) examined the mechanical response of the pipe-overpack waste package under possible stresses in the WIPP disposal room. The response of the POP is dramatically stiffer and stronger than the standard waste. The waste in pipe overpacks could create stiff columns within the disposal rooms and influence room closure. It is possible that rigid waste columns would maintain an overall waste porosity by shielding adjacent standard waste from compaction.
Table 7: SANTOS input constants for POP waste constitutive model (Park and Hansen, 2003)
G (Two Mu) [MPa]
K [MPa]
A, [MPa]
A,
A2
16
14
12
-ro 0.. 10 ::!!: ~
~ 8 :::l en en <IJ ~ 6 0..
4
2
0 0.0 0.2
' '
12-inch POP 6-inch POP
1442.0 1364.0
1561.0 1690.0
8.473 6.712
0.0 0.0 .
0.0 0.0
--12-inch POP
- - - - 06-inch POP
--Standard
0.4 0.6 0.8 1.0 1.2
Volumetric Strain
Figure 8: Simulated volumetric strain for POP compared to the standard 55-gal drum (Park and Hansen, 2003).
Information Only
Determination of the Porosity Surfaces of the Disposal Room Containing Various Waste Inventories for WIPP PA
2.3.2.3 AMWTP waste
34 of 140
The model for AMWTP is developed from engineering judgment based on the supercompaction information. The pucks in the AMWTP containers are compressed to 60 MPa prior to being placed in the I 00-gallon container. Because the compaction pressure is much higher than the stresses that develop in the WIPP setting, the AMWTP pucks will retain high density and exhibit relatively high modulus when compared to the standard waste form and POPs. As an approximation, the soil and foams model applied to anhydrite in the SANTOS code is used for the pucks. The modulus thus assumed for the pucks is more than an order of magnitude greater than the POP (75 GPa versus about 2 GPa). In terms of modeling results, this assumption simply means the pucks are undeformable relative to standard waste packages.
The material properties of the container surrounding the pucks are assumed equivalent to the standard waste. The annular space surrounding the pucks is protected by the outer steel of the drum and the vertical positioning brackets. Therefore, the deformation behavior of the 1 00-gallon container is similar to the standard waste drum until room closure impinges on the pucks themselves.

Information Only
Determination of the Porosity Surfaces of the Disposal Room Containing Various Waste Inventories for WIPP PA
3 MESH GENERATION
3.1 Disposal Room
35 of 140
A two-dimensional plane-strain disposal room model is used to replicate the stratigraphy and the waste room as shown in Figure 9. The model grid represents a cross-section of a typical room in two dimensions. Invoking symmetry, only half of the room is modeled. The left and right boundaries are both planes of symmetry implying that the modeled room represents an infinite series of parallel rooms. The upper and lower boundaries are located approximately 50 m from the room. A lithostatic stress (ux=uY=u,) that varies
with depth is used as the initial stress boundary conditions and gravity forces are included. A zero-displacement boundary condition in the horizontal direction (Ux = 0.0) was applied on both the left and right boundaries of the model to represent the symmetrical nature of a disposal room in an infmite array of rooms. A prescribed normal traction of 13.57 MPa was applied on the upper boundary and a vertical zero-displacement boundary condition (Uy = 0.0) was applied on the lower boundary to react to the overburden load. An adaptive internal pressure, p • , was applied around the boundary of the dis-
posal room. The basic half-symmetry disposal room dimensions are 3.96 m high by 5.03 m wide. This mesh and boundary conditions are identical to those used in Stone's analysis (1997a).
Contact surfaces were defined between the waste and room boundaries to model possible contact and sliding that occurs as the room deforms and contacts the waste. Specifically, contact surfaces were defined between the waste and floor of the room, the waste and room rib, and the waste and ceiling. The contact surfaces allow separation if the forces between the surfaces become tensile. This feature allows the room to reopen due to gas generation within the disposal room.

Information Only
Determination of the Porosity Surfaces of the Disposal Room Containing Various Waste Inventories for WIPP PA
D
D g= 9.79 m/s'
5.03m
IHm Hal~e
IHm ArgillaceousHalile
Applied Traction 13.57 MPa
52.87 m~--mTTTTrmTITTmTm
U,= 0.0
-54.19 m---W.LW.l..WJ.LW..LW.W
U,= 0.0
tLLLJ Anhydrite
U,= 0.0
Figure 9: Mesh discretization and boundary conditions around the disposal room
3.2 Standard waste and POP waste
36 of 140
Rooms filled completely with POP waste packages and standard waste packages have the same descretized grid. The constitutive model for the waste is changed to appropriate parameters for the soil and foams algorithm in SANTOS. Drums are configured in the standard 7-packs and stacked three high along the drift with a height of 2.676 m. This storage configuration contains a large amount of void volume. To obtain the waste vol-

Information Only
Determination of the Porosity Surfaces of the Disposal Room Containing Various Waste Inventories for WIPP PA 37 of 140
ume dimensions used in the calculations, the assumption is made that each waste drum will contact its neighbor laterally. Underlying this assumption is the notion that inward movement of the walls of the disposal room is sufficient to eliminate space between the drums early in the closure process and at low stress levels. In other words, the lateral deformation of the disposal room rib compresses the 7 -packs causing the void space between the drums to be removed with little or no resistance by the waste drums themselves. This assumption allows calculation of an effective lateral dimension for the waste after lateral displacement eliminates the space between the drums. This idealization was conceived by Stone (1997a) and has been implemented in several additional calculations supporting WIPP recertification. Park and Holland (2003) provide a calculation sheet regarding the dimensions. The grid for the pipe overpack waste package follows the same logic. Of course, the constitutive models for these waste packages differ as the POPs are far more rigid than the standard waste containers. The meshes of the waste contained in the disposal room are shown in Figure 10.

Information Only
Determination of the Porosity Surfaces of the Disposal Room Containing Various Waste Inventories for WIPP PA
j i t-/--, '
'
!
!
' -- )
-
~.676 m -++--j-i-
'
------ --- ------ --
! !
-
~ -
~.750 m
~.419 m . j J_. -1 ~- -- --
--. -
. --·--
3.675 m
(a) Standard and POP
-'
r-·
' -
~ 0.750 m ,,,,
-2.419 m
···'···
,,, -
-
1.693m .._..
3.205 m
(c) 2/3 AMWTP + 1/3 Standard
2.517 m
2.972 m
(b) AIIAMWTP
0.750).
2.419 m F!f+~IIFHFi', ;F,'· ,,~ 1111 !i ''
0.868m---) ~
3.439 m
-
(d) 1/3 AMWTP + 2/3 Standard
ElHB Hal~e ElHB Argillaceousl-lalite EEEEl Anhydrite
C«!nm~OOITII, MgO $tlallldard i'©lri
EFHE 9:andard or EEEEEl Pucks R:lPWaste
38 of 140
Figure 10: Meshes for various waste package inventories in tbe disposal room

Information Only
Determination of the Porosity Surfaces of the Disposal Room Containing Various Waste Inventories for WIPP PA
3.3 AMWTP Waste
3.3.1 All AMWTP case
39 of 140
Treatment of the AMWTP waste packages has received attention recently because of the intent by INEEL to ship such containers to WIPP (Hansen et a!., 2003). The supercompacted waste package is substantially different from the standard waste considered in the original compliance calculations. Therefore, the AMWTP waste packages represent changes to the certification baseline. One of the main purposes for these calculations is to conduct an assessment of these changes.
The calculations made for the AMWTP I 00-gallon waste packages represent a case where it is assumed that an entire room is filled with this dense waste form. Figure II illustrates the room-wide configuration of the three-packs of AMWTP superimposed on the footprint of the seven-packs of standard waste. These packages (3-containers) are stacked 3 high and 6 wide across the room. In the ideal packing configuration, a total of 2,916 containers can be placed in one panel. As noted previously, a 0.5-m thick MgO super-sack exists above each stack and the height of a container is 0.889 m. Thus, the height of a stack including a MgO sack is 3.169 m (Appendix D).

Information Only
Determination of the Porosity Surfaces of the Disposal Room Containing Various Waste Inventories for WIPP PA 40 of 140
~~--------------------------~ ~ 91M --------------------~ 0~ 1 ~--~-------------1 1---- 811.10 ------~--t
Figure 11 : Ideal packing of l 00-gallon containers in rooms
The containers are assumed rearranged to remove the void between the containers by the inward movement of the walls, as was assumed for the standard waste and the POP packages. To obtain the waste volume dimensions used in the mesh, each waste container is assumed to move laterally and deform independently. The void space between containers is eliminated in order to have an accurate continuum representation of the waste response. To eliminate the void space between containers, the assumption is made that the lateral deformation of a configuration of containers caused by the inward movement of the walls is sufficient to eliminate space between the containers early in the closure process at low stress levels. This concept is illustrated in Figure 12.
The nominal uncompressed width and length of the stored waste in the disposal room are the same as standard waste, 8.6 m and 89.1 m, respectively as shown in Figure 11.

Information Only
Determination of the Porosity Surfaces of the Disposal Room Containing Various Waste Inventories for W IPP P A
-J""''-------------11 1--- 91.44 078 I I' = l 1--- l&.tD ________ ...,.
II II ~0 Nm ~00 (o)N
3 3 )(
00 + 0 :.... ~ 3
Diameter of Contalner-31 WI (0.787 m) Thus, Olalance belween Centef1ines
~-- = 31 in x sin 60" = 0.662 m
- Containers
-Pucks
41of140
Figure 12: Rearrangement of containers for all AMWTP waste by tbe inward movement of the walls
To calculate the porosity surface of the disposal room, the deformation of the waste caused by room closure must be determined first. The pucks within the containers are assumed incompressible cylinders. The material properties of the container, the vertical guide rods and annular air space surrounding the pucks are similar to the standard waste model. Therefore, the pucks and the outer container are further separated into two material types, as shown in Figure 13 (a-c). The concept sketched in Figure 13 considers a group of containers in intimate contact. When inward radial pressure is applied on each container, the container parts are compressed as shown Figure 13-(b). Assuming the container has standard waste material properties, it would compress to a minimum porosity of 0.234 (i.e., the minimum porosity obtained for standard waste containers caused by the room closure with no gas generation in 10,000 years (Park and Holland, 2003)). In addition, an interstitial void remains between the three pucks as shown Figure 13-(c).

Information Only
Determination of the Porosity Surfaces of the Disposal Room Containing Various Waste Inventories for WIPP PA
Pressure
(a) (b)
Container Part (Standard Waste Material Properties)
42 of140
{c)
Pucks ( Incompressible Material Properties)
Figure 13: Concept separating pucks and container for mesh generation
Expanding the concept to the model at a room scale, the puck constituents are separated from the compressed container as shown Figure 14. The pucks are represented by rigid material-still possessing the 11% interstitial porosity (Appendix F}-while the compliant material is modeled by an appropriate region comprising elements modeled as standard waste containers. This simplification is felt necessary to capture the possible endstate conditions of a room fiJled with supercompacted waste packages. In addition, the length and width of the waste inventory is modified as described in Appendix E-1. The width of the mesh consisting of pucks is calculated to be 5.034 m. The height of the puck elements is calculated to be 2.419 m (Appendix D). The widths of the compliant container portions surrounding the pucks are calculated to be 0.455 m (=(5.943-5.034)/2) each. Figure 1 0-(b) shows the close-up view of the mesh of the disposal room containing AMWTP, as well as the other meshes for comparison.

Information Only
Determination of the Porosity Swfaces of the Disposal Room Containing Various Waste Inventories for WIPP PA
Diameter~ Puck=25 in (0.835 m) Thus. 015111nc:e between C.nterllnes
~--= 251n ~ eln 600 = 0.56 m
43 of140
- Containen Part
-Pucks
c:::::=:J Void
Figure 14: Representation of pucks and containers for a room filled witb supercontpad"ed AMWfP.
3.3.2 Combined Case I (2/3 AMWTP + 1/3 Standard Waste)
The line of reasoning above is modified for the combined cases. Simply stated, one third of the pucks are replaced with standard waste elements. For this combined case, the supercompacted AMWTP waste packages are placed in the central portion of the room as shown in Figure 15, compressed as shown in Figure 16 and modeled as shown in Figure 17. Similar to the all-AMWTP case, the effective lateral dimension of the AMWTP containers within the disposal room is determined. The total initial waste volume (V0 ) for the
all-AMWTP case including the MgO sacks, i.e., 1,596 m3, is multiplied by 2/3 (1,064
m\ Dimensional calculations are docwnented in Appendix E-2.

Information Only
Determination of the Porosity Surfaces of the DisposaJ Room Containing Various Waste Inventories for WIPP PA
------------------------~~ r--- ~.~ -----------------~ r ~ r-- 89,10
Figure 15: 2/3 AMWTP and 1/3 Standard waste are placed in the room
! ~ 01.~ ~---------------------~~ ~ ·~10 -------------1
!~ -r-+-i-o-1-:....a.o, <D C» "-.,jl\)
3 3 )(
(11
+ 0
~ ...L..j ...... .._
3
44 of 140
Figure 16: The AMWTP eontainers are rearranged by the inward DHJvement oftbe walls
As mentioned in Section 3.3.1, the pucks within the containers are represented by incompressible elements. Figure 17 shows the conceptual drawing used to visualize the width of puck elements of the mesh as separated from the container fraction. The void between incompressible pucks will remain throughout the analysis. The width of the puck elements is calculated to be 3.385 mas shown in Figure 17. The height of the puck elements is 2.419 m, the same as the all AMWTP case. For modeling purposes, the widths of the container elements on both sides of the pucks are calculated to be 0.287 m (= (3.959-3.385)/2)) each. The widths of the standard waste elements, which are modeled on both

Information Only
Detennination of the Porosity Surfaces of the Disposal Room Containing Various Waste Inventories for WIPP PA 45 of 140
sides of the AMWTP elements are calculated to be 1.225 ( = 7.35 ·.!. ·.!.) m each. The 3 2
modified width of the standard waste for mesh generation was calculated to be 7.35 m (Stone, 1997a). The container elements above the stacks represent the compressible materials and MgO and are the same as the all-AMWTP cases (0.75 m). The height of the standard waste elements is assumed equal to the AMWTP plus the complaint material on its top, for modeling simplicity. In actuality, the heights are slightly different (2.676 m versus 3.169 mas shown in Figure 10).
Dllmlller ol Puek=25 In {0.635 m) Thus. Dlslance between c:antertl~ - --= 25 in x SO'I 80" = 0.55 m -
Containers and Standard Waste Part
-Pucks
c::::::J Void
Figure 17: Representation of pucks and containers for a room containing 2/3 AMWTP and 1/3 standard waste packages.
3.3.3 Combined Case II (1/3 AMWTP + 2/3 Standard Waste)
Modeling assumptions begin with two rows of AMWTP packages placed in the center of the room and two rows of standard waste packages rest on either side, as shown in Figure 18. The rows are then compressed together as shown in Figure 19, implementing the same line of assumptions discussed earlier. The nominal uncompressed width of the AMWTP ( w;,) is calculated to be 2.151 m (Figure 19). The nominal uncompressed
length ofthe AMWTP (£0 ) is calculated to be 85.04 m (Appendix E-3).

Information Only
Determination of the Porosity Surfaces of the Disposal Room Containing Various Waste Inventories for WIPP PA 46 ofl40
U II NO
~~ 3 3
>< N + 0
~ 3
~ 91,4.4 ------------t•lf--- 89.10 -------~-~--~ .... 6 I
Figure 18: Emplacement of 1/3 AMWTP and 2/3 Standard waste in the disposal room
l r-- !11.44 = ~------------~1 ~ ~to --------------~
Figure 19: The AMWTP containers are rearranged by the inward movement oftbe walls
Similar to the previous combined case, the width of the puck elements is calculated to be 1.735 m, as shown in Figure 20. The widths of the container material simulated on either side ofthe pucks are calculated to be 0.122 m (= (1.978-1.735) I 2) each. The widths of
the standard waste elements on both sides are calculated to be 2.45 m ( = 7.35 · ~ · .!_) 3 2
each. The container and MgO simulated above the pucks remains the same. Figure 10-(d) shows the close-up view of the mesh of the disposal room containing 1/3 AMWTP and 2/3 standard waste.

Information Only
Determination of the Porosity Surfaces of the Disposal Room Conlaining Various Waste Inventories for WIPP PA
II II -r--+--.f"--.--:-+-.--_..0
~8: 013 3 )C "-+--h-+----..,
+
~ ~ 3
·····-----. .· .·.· .. ·.·.·.·.·.·· ~ ... ..... ·..,·-·.· .. · .. •.·.,.·.· ... .. • & • • - .. • .. • • • • • • • • • ... •
• • • • • • • • • op w • • • • • • . • • • • ...... ·----·
Dlameleral Puclc=25 In (0.635 m) 1lM.B. Dlllanoe ~ CenlllriiMe
- - - - • 25111 KliniiO" •O.SSm
Containers and - Standard Waste Part -Pucks c:::::::J Void
47 of140
Figure 20: Idealized array separating lnc:empresslble and c:ompres!dble materials for mesh generation

Information Only
Determination ofthe Porosity Surfaces of the Disposal Room Containing Various Waste Inventories for WIPP PA
4 CALCULATION FLOW AND FILE NAMING CONVENTION
48 of 140
This section summarizes by name and function the codes used to implement the calculations.
4.1 Computer Codes and Calculation Flow
F ASTQ version 3.12 is used for the mesh generation. A sample input file for the F ASTQ mesh generation is provided in Appendix G. The F ASTQ code is an interactive twodimensional fmite element mesh generation program. It is designed to provide a powerful and efficient tool to both reduce the time required of an analyst to generate a mesh, and to improve the capacity to generate good meshes in arbitrary geometries. It has a number of meshing techniques available. F ASTQ has been designed to allow user flexibility and control. The user interface is built on a layered command level structure. Multiple utilities are provided for input, manipulation, and display of the geometric information, as well as for direct control, adjustment, and display of the generated mesh. Enhanced boundary flagging has been incorporated and multiple element types and output formats are supported. F ASTQ includes adaptive meshing capabilities with error estimation, deformed and undeformed remeshing according to the error, element variable remapping, and some basic post-processing plotting (Blacker, 1988).
SANTOS version 2.1. 7 is used for the solver in this analysis. The quasistatic, largedeformation finite element code SANTOS is capable of representing 2D planar or axisymmetric solids (Stone, 1997b ). The solution strategy, used to obtain the equilibrium states, is based on a self-adaptive, dynamic-relaxation solution scheme incorporating proportional damping. The explicit nature of the code means that no stiffness matrix is formed or factorized which results in a reduction in the amount of computer storage necessary for execution. The element used in SANTOS is a uniform-strain, 4-node, quadrilateral element with an hourglass control scheme to minimize the effects of spurious deformation modes. Finite strain constitutive models for many common engineering materials are available within the code. A robust master-slave contact algorithm for modeling arbitrary sliding contact is implemented. SANTOS version 2.1. 7 was installed on the Compaq Tru64 (BOC) with UNIX VS.IB. All of the verification and qualification test problems were exercised and documented in accordance with QA requirements (WIPP PA, 2003b).
BLOTII2 version 1.39 is used as the final post-processor to plot disposal room creep closure and von Mises stress contours. BLOT is a graphics program for post-processing of finite element analyses output in the EXODUS database format. It is command driven with free-format input and can drive any graphics device supported by the Sandia Virtual Device Interface. BLOT produces mesh plots with various representations of the analysis output variables. The major mesh plot capabilities are deformed mesh plots, line contours, filled (painted) contours, vector plots of two/three variables (e.g., velocity vectors), and symbol plots of scalar variables (e.g., discrete cracks). Path lines of analysis variables can also be drawn on the mesh. BLOT's features include element selection by material, element birth and death, multiple views for combining several displays on each plot,

Information Only
Determination ofthe Porosity Surfaces of the Disposal Room Containing Various Waste Inventories for WIPP PA 49of140
symmetry mirroring, and node and element numbering. BLOT can also produce X-Y curve plots of the analysis variables. BLOT generates time-versus-variable plots or variable-versus-variable plots. It also generates distance-versus-variable plots at selected time steps where the distance is the accumulated distance between pairs of nodes or element centers. (Gilkey and Glick, 1988).
To calculate the volume change of the disposal room with time, NUMBERS version 1.19 is used. NUMBERS is a shell program that reads and stores data from a finite element model described in the EXODUS database format. Within this program are several utility routines that generate information about the finite element model. The utilities currently implemented in NUMBERS allow the analyst to determine information such as: (1) the volume and coordinate limits of each of the materials in the model; (2) the mass properties of the model; (3) the minimum, maximum, and average element volumes for each material; (4) the volume and change in volume of a cavity; (5) the nodes or elements that are within a specified distance from a user-defined point, line, or plane; (6) an estimate of the explicit central-difference time step for each material; (7) the validity of contact surfaces or slide lines, that is, whether two surfaces overlap at any point; and (8) the distance between two surfaces. (Sjaardema, 1989).
These pre- and post-processing utilities are considered systems software and not subject to the requirements ofNP 19-1 (Chavez, 2003).
To calculate the porosity change in the room as a function of time, GNU A WK version 3.1.0 is used. The AWK converts the volume change of the disposal room into the porosity change with time. A sample A WK script is provided in App. H.
The code (n-dimensional Statistical Inverse Graphical Hydraulic Test Simulator) version 1.00 is used for plotting the three-dimensional porosity surface and is only used for visualization, not for any quality-affecting analyses. nSIGHTS was developed as a comprehensive well test analysis software package. It provides a user-interface, a well test analysis model and many tools to analyze both field and simulated data. The well test analysis model simulates a single-phase, one-dimensional, radial/non-radial flow regime, with a borehole at the center of the modeled flow system (Sandia National Laboratories, 2002). In this report, the function of plotting a 3D surface is the only feature used.
Figure 21 shows the computational flowchart to determine the porosity surface of the disposal room containing various waste inventories for WIPP P A.
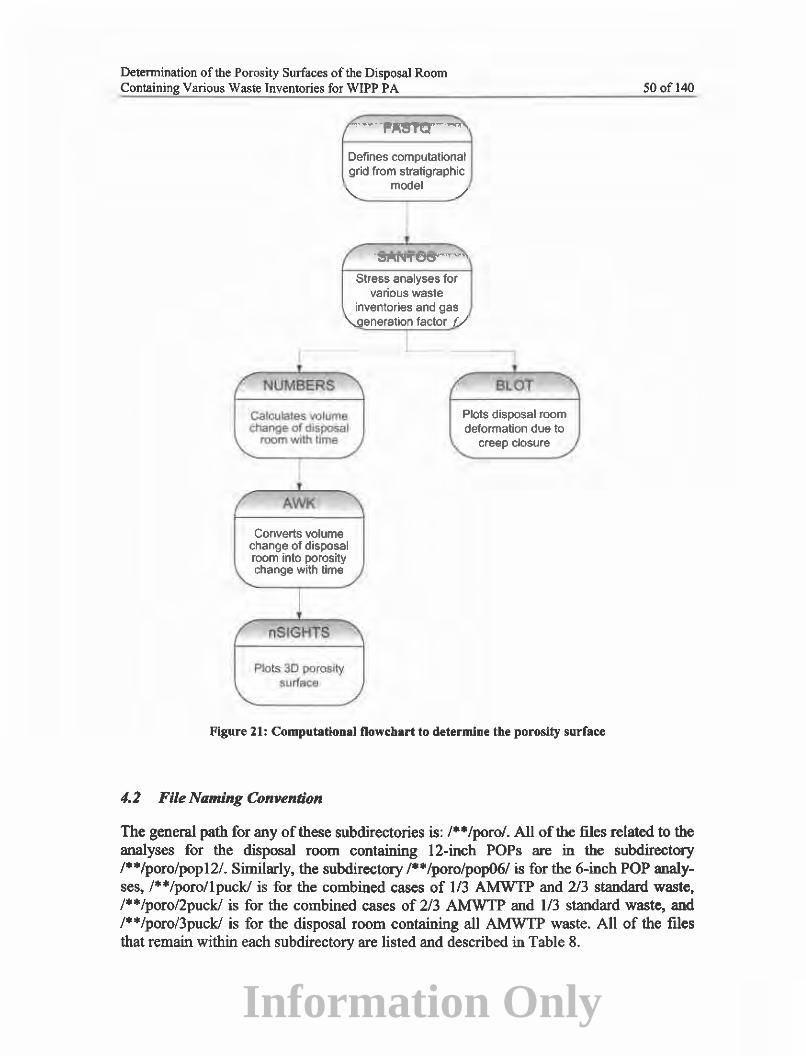
Information Only
Determination of the Porosity Surfaces of the Disposal Room Containing Various Waste Inventories for WIPP PA
Converts volume change of disposal room into porosity change with time
Defines computational grid from stratigraphic
model
Stress analyses for various waste
inventories and gas eneration factor
Plots disposal room deformation due to
creep closure
Figure 21: Computational flowchart to determine the porosity surface
4.2 FUe Naming Convention
SO of 140
The general path for any of these subdirectories is: /**/poro/. All of the files related to the analyses for the disposal room containing 12-inch POPs are in the subdirectory /**/poro/popl2/. Similarly, the subdirectory /**/poro/pop06/ is for the 6-inch POP analyses, /**/poro/lpuck/ is for the combined cases of 113 AMWTP and 2/3 standard waste, /** /poro/2puck/ is for the combined cases of 2/3 AMWTP and 1/3 standard waste, and /**/poro/3puck/ is for the disposal room containing all AMWTP waste. All of the files that remain within each subdirectory are listed and described in Table 8.

Information Only
Determination of the Porosity Surfaces of the Disposal Room Containing Various Waste Inventories for WIPP PA 5lofl40
The file suffixes, OpO, Op025, Op05, Opl, ... ,etc. express the gas generation factors. For examples, the OpO means the gas generation factor is.t=<J.O, Opl meansf=O.l, lp2 means f=i.2, and so forth.
The FASTQ file names are O.OOup.fsq, lpuck.fsq, 2puck.fsq and 3puck.fsq. The O.OOup means the current disposal room containing the standard waste or the POP waste, and the 1 puck.fsq means the disposal room containing 1/3 AMWTP and 2/3 standard waste.
Table 8: File naming convention (* means wild card)
File Prefix/Suffix File Defmition
*.fsq The F ASTQ input files for the mesh generation
*.g The F ASTQ output files that will be used for the mesh file of SANTOS
*. .I The SANTOS input files *.e The SANTOS output files in the EXODUS database format *.o The SANTOS output files in the ASCII format
The user-supplied subroutine lNITST to provide an initial initst * .f stress state and the FPRES to provide the gas generation pa-
rameter,f, to SANTOS initst *.o The object files from compiling the * .f
porosity.awk The A WK file to calculate the porosity change in the room with time The NUMBERS output file in the ASCII format to calculate
*.num the volume change of the disposal room with time from the SANTOS output files, *.e
normal*. txt The normalized volume change of the disposal room from *.num
run*.log The log file from the SANTOS run * pgas.dat The result file of the gas pressure change in the disposal room poro*.dat The result file of the porosity change in the disposal room SANTOS data for
The excel file to provide the data for BRAG FLO analyses - - -BRAGFLO *.xis *.run The batch files for running SANTOS XYZ *.dat The three dimensional data for plotting the porosity surfaces

Information Only
Determination of the Porosity Surfaces of the Disposal Room Containing Various Waste Inventories for WIPP PA
5 ANALYSES RESULTS
52 of 140
In performance assessment calculations, room closure initially proceeds as if the room were open. The free air space is eliminated early by creep closure without resistance from the waste package. Eventually the salt contacts the waste package stacks and deforms the waste package according to the relevant response model. At the same time, the conceptual models for corrosion and gas generation allow internal pressure to build within the room. Thus, the room closure owing to salt creep is modified by the structural response of the waste and by gas generation. These competing conditions (creep closure, waste package rigidity, gas generation) yield porosity histories for each waste package configuration that are compiled into a porosity surface for incorporation into performance assessment calculations as described in Section 2.2.
Closure calculations for a room containing the standard waste inventory (i.e., the baseline waste packages underpinning the CCA) were completed as part of the assessment of the effects of raising the repository to Clay Seam G (Park and Holland, 2003). An additional five hypothetical waste inventory configurations were considered to evaluate maximal possible variations in room closure. To recap, the cases being considered include:
1. All standard waste (55-gallon drums) 2. All 6-inch POPs 3. All 12-inch POPs 4. A combination of 1/3 supercompacted waste and 2/3 standard waste 5. A combination of 2/3 supercompacted waste and I /3 standard waste 6. All supercompacted waste
As explained in Section 5 .2, thirteen cases of gas generation were investigated for each inventory type. All analyses were run for a simulation time of 10,000 years. Representative examples of input files for the 12-inch POP and the all-AMWTP SANTOS runs are included in Appendix I. The other input files are identical except for the title line and the waste data. The gas generation parameter,/, is set in the user-supplied subroutine FPRES. Stone (1997a) used the user-supplied subroutine INITST to provide an initial stress state to SANTOS. In this analysis, the INITST subroutine is used unchanged from Stone (1997a). A sample INITST and FPRES subroutine for all AMWTP with f=O.l is also given in Appendix J. In the SANTOS runs, gas pressure bleed-off by flow through the surrounding lithology is not permitted.
5.1 Disposal Room Creep Closure
The computational results are best illustrated by figures. The following discussion displays all six cases to facilitate comparison of results. As noted in the analysis report (Park and Hansen, 2003) that examined the structural rigidity of the pipe overpack, the results of the 6-inch and 12-inch pipe overpacks are essentially identical. The figures of both overpacks have been retained here for completeness.
Figures 22 to 27 illustrate room closure as a function of time-without gas generation. Figure 22 replicates the room closure calculations that comprise the CCA baseline with the room full of standard waste packages. In the first few years the roof rock will contact

Information Only
Determination of the Porosity Surfaces ofthe Disposal Room Containing Various Waste Inventories for WIPP PA 53 of 140
the waste stack. Observations in Panel I confirm this rate of room closure (see Hansen, 2003). Approximately one meter of salt was trimmed to re-establish the vertical dimension of four meters after the rooms had stood open for about twelve years. After the creeping salt contacts the waste stack, the standard waste offers backstress to the salt in accord with the volumetric plasticity model incorporated in SANTOS.
Figures 23 and 24 illustrate room closure for the cases in which the rooms are filled entirely with 6-inch and 12-inch POPs, respectively. The closure of the open space in the rooms is identical in all simulations until the country rock impacts the waste stack. Thereupon, the POPs offer considerably more resistance to closure than offered by standard waste packages.
The simulations that include AMWTP supercompacted waste forms also included MgO on top of the waste. Vertical dimensions of the waste stack are slightly greater (0.5m) to account for the MgO, which is simulated structurally as standard waste. The inconsistency of inclusion or exclusion of the MgO was discussed previously. In terms of mechanical response and global features of these analyses, the inclusion or exclusion of MgO makes little difference to the major phenomena. The rigidity of the AMWTP supercompacted waste, however, has a strong influence on room closure.
Figures 25, 26 and 27 illustrate the room closure response for simulations including 1/3 AMWTP, 2/3 AMWTP, and a room filled with AMWTP supercompacted waste packages. The modeling assumptions implemented to define grid elements for the waste were recounted in Section 3.3. The assumptions were consistent with those applied to the original calculations of the porosity surface in that the free air space was removed by effectively pushing the waste together. For the AMWTP, the pucks are modeled as a rigid material and the free air space, the annular space, and the vertical open space in the containers are simulated as compliant material surrounding the pucks. All the dimensions of these elements account for the actual amounts of compliant material and rigid pucks. Room closure is eventually dominated by the cribbing effect of the pucks, even when the room is only 113 third full of the AMWTP wastes.
This phenomenon is illustrated most clearly in this sequence of figures, because no gas is produced inside the room. Gas production would counterbalance the inward creep of the rooms, as will be discussed subsequently. The cribbing effect will be discussed in more detail in Section 6.

Information Only
Determination of the Porosity Surfaces of the Disposal Room Containing Various Waste Inventories for WIPP PA
.... ,
10,000 years
~~;:-~~-, p:_-~_;_~
~~:.>=--·
.... ,.
1,000 years
54 of 140
- Argillaceous Hallie
- Clean Halite
- AnhydrHe
-Wuta
300 years
Figure 22: Close-up views of the deformed disposal room containing the standard waste for j-0.0
- Argillaceous ltoollt•
• Clean Halite
-Anhydrite
• waste
Oyear ......
10,000 years 1,000 years 300 years
Figure 23: Close-up views of the deformed disposal room containing the 6-inch POP waste for j-0.0

Information Only
Determination of the Porosity Surfaces of the Disposal Room Containing Various Waste Inventories for WIPP P A
~i!T\\:~,~'·; ·>--~.,_-y I 1:, '<, '
Oyear
10,000 years 1,000 years
55 of 140
• CINnHallle
• wute
300years
Figure 24: Close-up views of the deformed disposal room containing the 12-inch POP waste for .f-=0.0
. ., ~
.t· ..•.•.•
Oyear
10,000 years
7yea0$
1,000 years
tr\ y
----, __ ----~.MQO. illardardWooN -~
..n24years
300 years
Figure 25: Close-up views of the deformed disposal room containing the 1/3 AMWTP + 2/3 Standard waste for j-0.0

Information Only
Determination of the Porosity Surfaces of the Disposal Room Containing Various Waste Inventories for WIPP PA
Oyear 6years
10,000 years 1,000 years 300 years
56 of 140
-Arg~-lle -, __ --~
C""l<lo.,.~MgO.
~-rdWoote -~-
Figure 26: Close-up views of the deformed disposal room containing the 213 AMWTP + 113 Standard waste for .f-=0.0
----. ' ' -Cl«<n Holle
:i~ -M¥~
·lc~!'t Ccnla!ner or MgO ·---- ~-· .,
~ r:
:'If: --... ·,·
0 year .n.24years ,.
10,000 years 1,000 years 300 years
Figure 27: Close-up views of the deformed disposal room containing the All AMWTP waste for .f-=0.0

Information Only
Determination of the Porosity Surfaces ofthe Disposal Room Containing Various Waste Inventories for WIPP P A
5.2 Pressure Histories
57 ofl40
Figures 28 through 33 plot gas pressure history for the six case studies of hypothetical waste inventories. The resulting pressure histories calculated by SANTOS are meant to envelop the pressure histories calculated by BRAGFLO (WIPP PA, 2003a). Thirteen gas generation scenarios for SANTOS are determined by multiplying a base gas generation potential and rate by a factor, f, as follows: f=O.O (no gas generation), 0.025, 0.05, 0.1, 0.2, 0.4, 0.5, 0.6, 0.8, 1.0, 1.2, 1.6, and 2.0 (twice the base rate). Thus, SANTOS runs consider cases from no gas generation if= 0) to cases in which the total amount of gas and rate at which it is produced is twice the base gas generation potential and rate if= 2).
The base gas generation potential used in the CCA and CRA is set at 1050 moles of gas/drum from corrosion and 550 moles of gas/drum from microbial degradation. The base gas production rate is set at 1 mole of gas per drum per year for corrosion and 1 mole of gas per drum per year for microbial degradation. Since the rate and the potential vary by the same I- factor, gas production rates vary between 0 and 4 moles/drum/year for 550 years, when corrosion and microbial degradation occur simultaneously. From 550 to I ,050 years gas is produced only from corrosion at half the full rate (from 0 to 2 moles/drum/year). No additional gas is produced after I ,050 years.
The pressure build up in the disposal room is a result of gas generation and available room porosity. Figures 28 through 33 show the disposal room pressure histories for the various values of gas generation parameter, J, for each waste inventory in the room. The amount of gas generated from the POP waste package is identical to that of standard waste, as described in Section 2.2. However, as shown Figures 29 and 30, the pressure histories of POP for lower I reflect much lower pressure than that experienced in rooms filled with standard waste. Greater void space is retained in the rooms filled with the POP waste because of the rigidity of the POP, which cribs the room open relative to the standard waste. Therefore, for the same amount of gas production, the POP rooms would have lower gas pressure.
In the case of AMWTP wastes, the amount of gas production varies in proportion to the amount of celluloses, plastics and rubber (CPR). Gas generation from iron-based metal corrosion is similar for all waste types. The amount of gas generated by corrosion is brine-limited, so the amount of gas produced in this manner is the same whether the waste is packaged as AMWTP, standard waste, POP or any other packaging. The differences in gas generation noted in the pressure profiles are a reflection of the microbial gas generation. As noted in Section 2.2, the total gas production is a function of CPR available for microbial consumption. A room full of supercompacted AMWTP increases the ratio of CPR from the original compliance basis by a factor of 12/7, because each seven pack of standard waste is replaced on the same footprint by 12 supercompacted pucks.

Information Only
Determination of the Porosity Surfaces of the Disposal Room Containing Various Waste Inventories for WIPP PA 58 of140
The deformed shapes and volumes of the disposal rooms also differ somewhat because of the structural resistance of the various ratios of AMWTP disposed in the room. The pressure histories are influenced by a competing interaction between the room closure and the amount of gas. In a general sense, the pressure histories of these various runs are strikingly similar. The gas pressures for more thanj=l.O at 10,000 years cluster around 18.0 MPa for all cases.
The results displayed from the SANTOS calculations exhibit pressures higher than lithostatic stress (approximately 15 MPa). This is a modeling artifact that occurs because SANTOS does not have a fracture mechanism to bleed off high gas pressure. BRAGFLO, on the other hand, allows hydrofracture to proceed when internal gas pressure approaches lithostatic. However, because the transient pressures in BRAGFLO may exceed lithostatic, the pressures from SANTOS are necessary to provide a full range of porosity values.
Standard Waste 25
&.. 15
e. ~
r;: ~
20
"- 10
.// I
'
~ 5
0 0 2000 4000 6000
Time (years)
8000
1.
~ f=1. 6
2
~ 8
1.0
:;gg f=0.4
F02
£=0.1
f=0.05
f=0.025
f=O.O 10000
Figure 28: Pressure histories for a disposal room containing the standard waste

Information Only
Determination of the Porosity Surfaces of the Disposal Room Containing Various Waste Inventories for WIPP P A
6-inch Pipe Overpack
4000 6000
Time (years) 8000
Figure 29: Pressure histories for a disposal room containing the 6-inch POP waste
12-inch Pipe Overpack
Time (years)
Figure 30: Pressure histories for a disposal room containing the 12-inch POP waste
59 of 140

Information Only
Determination of the Porosity Surfaces of the Disposal Room Containing Various Waste Inventories for WIPP PA
1/3 AMWTP + 2/3 Standard Waste 25
~ ~
20
---
I I
5 /
0 ~ 0 2000 4000 6000 8000
Time (years)
~ 0 1.6 F1.2 f-'1.0 f=0.8
~-' f=0.5
~-·
~-2
1=0.1
f=0.05
f=0.025
~-0 10000
60 of 140
Figure 31: Pressure histories for disposal room a containing the 1/3 AMWTP + 2/3 Standard waste
2/3 AMWTP + 1/3 Standard Waste 25~------.--------r--------------~--------.
20
'" <l. 15
e. (/)
<1i <l. 10
-----if=0.2
5 ~--------------------j~'0.1
~----------------------j""-05 '..--------------------------------iF0-025
2000 4000 6000 8000
Time (years)
Figure 32: Pressure histories for disposal room a containing the 2/3 AMWTP + 1/3 Standard waste

Information Only
Determination of the Porosity Surfaces ofthe Disposal Room Containing Various Waste Inventories for WIPP PA
AIIAMWTP
~-----------------1"'·'
0-l'"------,-----~------,~---~-----1"".0 2000 4000 6000 6000 10000
Time (years)
Figure 33: Pressure histories for a disposal room containing the AMWTP waste
61 of!40

Information Only
Determination of the Porosity Surfaces of the Disposal Room Containing Various Waste Inventories for WIPP PA
5.3 Porosity Histories
62ofl40
The SANTOS calculations provide porosity surface input for BRAGFLO simulations (Helton et a!., 1998). The porosity surface is essentially a lookup table that gives the value of room porosity in the BRAGFLO grid for a given pressure and time. The SANTOS calculations are run only for a discrete set of representative gas generation scenarios to provide a wide range of porosity results. In contrast, gas generation simulated by BRAG FLO occurs at rates determined by sampled parameters and temporally and spatially varying brine saturation levels. These rates are completely independent of the rates used in the SANTOS calculations. Pressures calculated in BRAGFLO simulations are used to determine waste room porosity by way of interpolating porosity values from the porosity lookup table. This procedure is described below.
Each of the thirteen SANTOS calculations results in a distinct pressure and porosity history (as shown in the following Figures 28 through 39). The porosity calculated by SANTOS is the "true" porosity, meaning it is the porosity that one would expect to measure if one could access a representative piece of the waste room at some time in the future. Because SANTOS simulates room closure, the total volume of the waste rooms changes with time and pressure. In contrast, BRAGFLO employs a non-deformable mesh and thus the total volume of the waste rooms remains constant for the entire 1 0,000-year simulation. The porosity values used by BRAG FLO for the waste rooms are modified from the "true" porosity values calculated by SANTOS to preserve total pore volume. The BRAGFLO porosity is related to the SANTOS porosity by the following relationship:
"' = 1/JsVs 'i'B v
B
(3)
where 1/J is porosity, Vis room volume, and the subscripts indicate values for BRAGFLO (B) and SANTOS (S). Vs changes as rooms creep close; Vs remains constant (and greater than Vs) and thus 1/JB is always somewhat less than 1/Js.
The pressure and modified BRAGFLO "porosity" histories for the thirteen closure scenarios form the porosity lookup table used by BRAGFLO. Porosity is interpolated by identifying the two f-values for which the SANTOS pressure brackets the pressure in BRAGFLO at the particular simulation time being considered. During a BRAGFLO simulation, it is possible that the pair off-values used for the porosity interpolation may change as the simulation proceeds. IfBRAGFLO pressures ever exceed the range defined by the SANTOS scenarios, the calculation of porosity defaults to the f= 2 scenario.
Figures 34 through 39 show the disposal room porosity histories for the thirteen cases of gas generation considered for each waste inventory. For the case involving standard waste, as shown Figure 34, there are large differences in the histories for each gas generation factor. These results replicate the porosity surface calculations in the CCA, and were replicated most recently by Park and Holland (2003). The situation for a room filled with
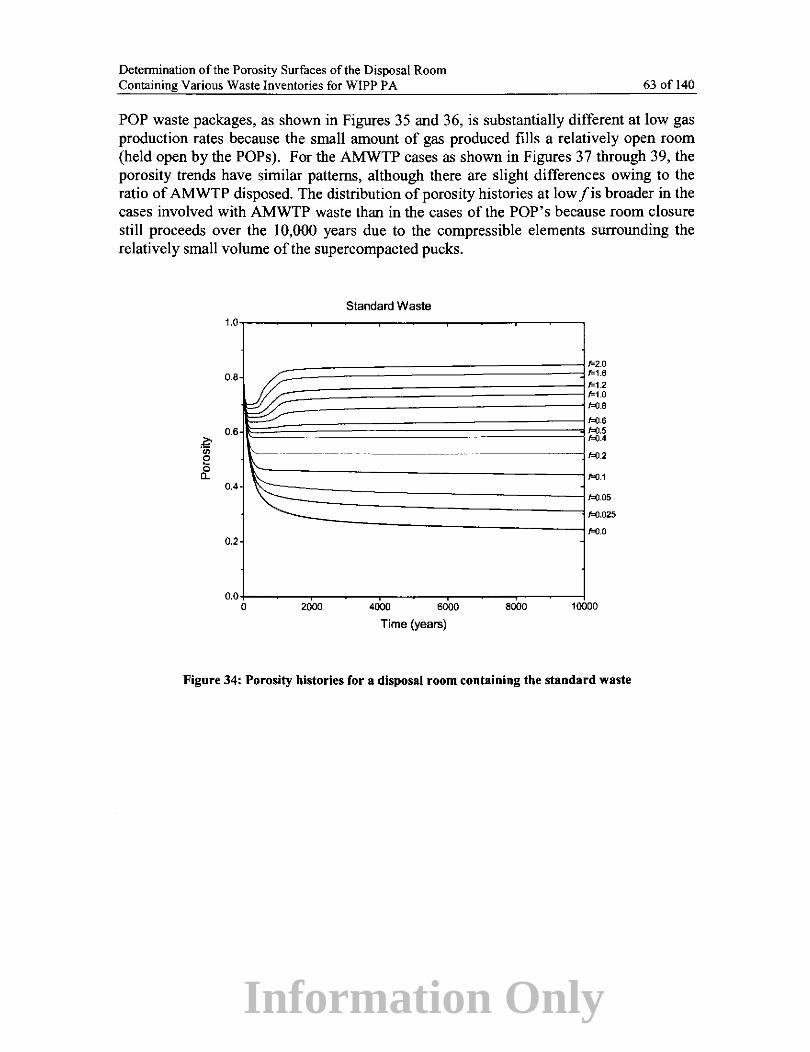
Information Only
Determination of the Porosity Surfaces of the Disposal Room Containing Various Waste Inventories for WIPP PA 63 of 140
POP waste packages, as shown in Figures 35 and 36, is substantially different at low gas production rates because the small amount of gas produced fills a relatively open room (held open by the POPs). For the AMWTP cases as shown in Figures 37 through 39, the porosity trends have similar patterns, although there are slight differences owing to the ratio of AMWTP disposed. The distribution of porosity histories at low f is broader in the cases involved with AMWTP waste than in the cases of the POP's because room closure still proceeds over the I 0,000 years due to the compressible elements surrounding the relatively small volume of the supercompacted pucks.
1.0
0.8 /
~ 0.6
·...._ __ ----------
0.4 ~ 0.2
0.0 0 2000
Standard Waste
---- ·--------
4000 6000
Time (years) 8000
f=2.0 f=1.6 f=1.2 f:1.0 FO.B
F0.6 F0.5 F0.4
F0.2
F0.1
£:0.05
f:0.025
FO.O
10000
Figure 34: Porosity histories for a disposal room containing the standard waste

Information Only
Determination of the Porosity Surfaces of the Disposal Room Containing Various Waste Inventories for WIPP PA
6-inch Pipe Overpack 1.0
0.8
~ 0.6 ~
0.4
0.2
0.0 0 2000 4000 6000
Time (years)
8000
~
F2.0 f=1.6
f=1.2
~ f=0.6 f=O.S
f-04 f-0.2 ~ .1
~02 0
05 5
10000
Figure 35: Porosity histories for a disposal room containing the 6-inch POP waste
12-inch Pipe Overpack 1.0
0.8
£ 0.6
0.4
0.2
0.0 0 2000 4000 6000 8000
Time (years)
f=2.0 f=1.6 f=1.2
f=.0.6 F0.5
0.4 .2 \I 1
5 5 ~00 0.02
0
10000
Figure 36: Porosity histories for a disposal room containing the 12-inch POP waste
64 of 140

Information Only
Determination of the Porosity Surfaces of the Disposal Room Containing Various Waste Inventories for WIPP PA
0.2
113 AMWTP + 213 Standard Waster
~~-2.0 f=1.6 f=1.2 1=1.0
"'·' ,.,, fOII:l
--------------------- 1=0.2
'~~~~~~~~~~~~~~~~~~~f:0.1 1-<J(j; M.025
"'·'
o.o+-----,.,c::-~-=-~---:c.,----=c::------,,.l 0 2000 4000 6000 8000 10000
Time (years)
65 of 140
Figure 37: Porosity histories for a disposal room containing 1/3 AMWTP+2/3 standard waste
~ e 0
a_
1.0
0.8 !/::
0.6~ \;
0.4 ~
0.2
0.0 0
2/3 AMWTP + 1/3 Standard Waste
2000 4000 6000
Time (years)
f=2.0 f=1.6 f=1.2 f=1.0 1'0.8
f=0.6
1'0.4 f=0.2
1'0.1
I=& 1=. f-:0.0
8000 10000
Figure 38: Porosity histories for a disposal room containing 2/3 AMWTP+l/3 Standard waste

Information Only
Determination of the Porosity Surfaces of the Disposal Room Containing Various Waste Inventories for WIPP PA
All AMWTP Waste 1.0
0.8
0.6 It \:
0.4 "
0.2
0.0 0 2000 4000 6000
Time (years)
6000
f= f=
2.0 1.6
f=
f=
f=
f-=1.2 1.0
0.8
0.6
·f=
f=
f=
f=O.S
1=0.4
0.2
0.1
0.05 f-=0.025
I' f=O.O
10000
Figure 39: Porosity histories for a disposal room containing all AMWTP waste
5.4 Porosity History Comparisons
66 of 140
The next sequence of figures (Figures 40 through 43) compares the porosity surfaces for the six cases over the I 0,000 year simulation period for selected gas generation factors of 0.0, 0.4, 1.0, and 2.0. The histories for all thirteen/values are provided in Appendix K. The initial porosities are actually very similar because the solid material comprises little of the available space in a room, regardless of packaging. Initial porosity used for these plots are as follows: standard wastes (0.849), 6-inch POPs (0.835), 12-inch POPs (0.831), 113 AMWTP (0.802), 2/3 AMWTP (0.766), and all AMWTP (0.739). The all AMWTP case includes MgO in the calculation of initial porosity. However, the standard waste and POP calculations do not include MgO; if MgO is included the initial porosity would be about 5% lower.
In the case of no gas generation, the standard waste as modeled in the CCA has the smallest porosity, 0.243, and 12-inch POP has the largest porosity, 0.612, at 10,000 years. It should be reiterated here that these calculations do not include any structural effects of corrosion and degradation. The structural effects of rampant corrosion and microbial degradation would be significant as would MgO hydration, salt precipitation, and volume increase associated with corrosion by-products.

Information Only
Determination of the Porosity Surfaces of the Disposal Room Containing Various Waste Inventories for WIPP PA 67 of 140
To estimate the effects of the porosity surfaces with various inventories on the WIPP PA, it is informative to examine extreme cases, such as the upper and lower bounds. Appendix K includes plots for all values off When f is less than 0.1 the standard waste rooms have the lowest porosity. Iff is larger than 0.1, the lower bound is the porosity surface associated with the ali-AMWTP case. Over the first 1000 years, or so, the highest porosity results from the case simulating rooms filled with POPs. The porosity surfaces tend to merge over time as/increases from 0.4 to 1.0. Forjvalues greater than 1.0 there is little difference between the porosities for any of the inventories after 1,000 years.
Porosity is defined as the ratio of the void volume to the room volume at specific time. The void volume is calculated by subtracting the volume of the waste solid in the room from the room volume. The solid volume remains constant for the entire analysis period. Therefore, the change in porosity comes from change in room volume. The room volume is a function of salt creep, waste form resistance and gas generation. The creep closure is impeded by the rigidity of the waste and gas production decreases the rate of the room closure. If pressures are sufficiently high, internal gas pressure can increase room volume. If the gas generation factor,/, is larger than a certain value (0.4 approximately), the room is beginning to be inflated at a certain time. Iff is larger than 1.0, the room is inflated for all six types of waste.
The key factors to determine the porosity of the room are the waste solid volume and the gas production rate because the initial room volume is constant. In other words, a larger solid volume yields a smaller porosity and a larger gas production rate creates a larger porosity. For example, the ali-AMWTP case has the greatest solid volume, 935.9 m3
, and the standard case has the smallest solid volume, 551.2 m3
• In contrast, the ali-AMWTP case has the greatest gas production rate and the standard case has the smallest rate, as discussed in Section 2.2. In the case of .f-=2.0, the inflated volumes of the room at 10,000 years are 3,576.8 m3 for the standard, 6,164.5 m3 for the all AMWTP respectively. Fi-
nally, the porosities of the room at 10,000 years are 0.846 (= 3576·8
-55
1.2
) for the 3576.8
standard, 0.848 (= 6164·5
-935
·9
)for the all AMWTP. These values are dramatically 6164.5
similar. Likewise, when/is more than 1.0, the room porosities at 10,000 years are similar to each other for all waste inventories.

Information Only
Determination of the Porosity Surfaces of the Disposal Room Containing Various Waste Inventories for WIPP PA
Gas Generation Factor,f-'0.0 1.0,-~~~~~-~~~-.,.....;~-~~~-~.---,
- Standard Waste --- 6-inch POP Waste
0.8 - 12-lnch POP waste -·-·- 1/3 AMWTP+2/3 Std --- 2/3 AMWTP+1f3 Std - AJIM1WTP
0.6 ----------------------------------------
0.4 ~------------------·-·-------·-·-·-·-· ~~-=-=---=---=--=---=-======~
0.2
o.o+-~~-=---=----::r-------~ 0 2000 4000 6000 8000 10000
Time (years)
68ofl40
Figure 40: Comparison between porosity histories for the disposal room containing various waste inventories, f=O.O
Gas Generauon Factor,f-'0.4 1.0,_ ___________ ....:,_ _______ ..---,
- Standard Waste - - - 6-lnch POP Waste - 12-inch POP Waste -·-·- 1/3AMWTP+213Std 0.8 --- 213 AMW'TP-+113 Std - AJIAMWTP
o.•t:-:~-~-~:::;::·:~-::=·----=-----=----=-----=----=-----=----=----~----0.4
0.2
4000 6000
Time (years)
Figure 41: Comparison between porosity histories for the disposal room containing various waste inventories, f=0.4

Information Only
Determination of the Porosity Surfaces of the Disposal Room Containing Various Waste Inventories for WIPP PA
Gas Generation Factor,.f-'1.0
0.6
0.4
- Standard Waste - -- S.inch POP Waste
0.2 - 12-incl'l POP Waste -·-·- 1/3 AMWTP+213 Std - - - 213 AMWTP+ 113 Sb:l - AIIAMWlP
o.o+-~~~~~~~~--------,----l 0 2000 4000 6000 8000 1 0000
Time (years)
69ofl40
Figure 42: Comparison between porosity histories for the disposal room containing various waste inventories,j-:1.0
-"' ·;;; f! ~
o•v 0.6 rj
0.4
0.2
Gas Generation Factor,.f-'2.0
- Standard Waste -- - 6-inch POP Waste - 12-inch POP Waste -·-·- 113 AMWTP-+213 S1d --- 213 AMWTP.j-1/3 Sid -AJIAMWTP
4000 6000 8000 10000
Time (years)
Figure 43: Comparison between porosity histories for the disposal room containing various waste inventories, f=2.0
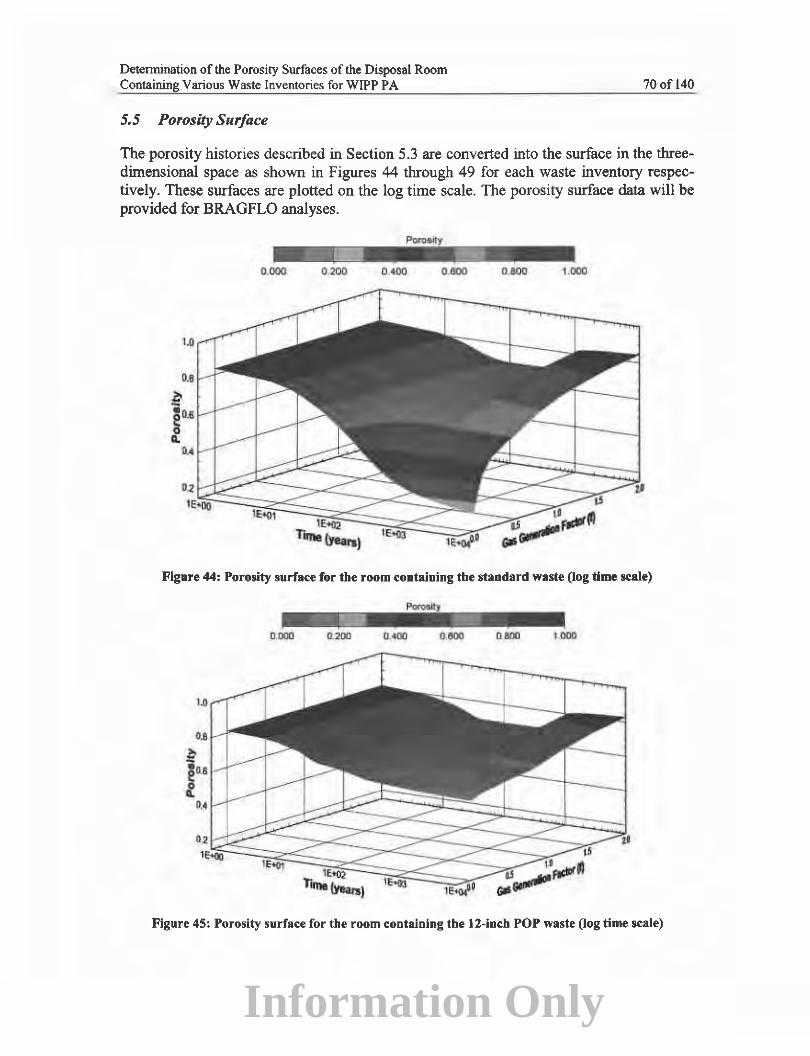
Information Only
Determination of the Porosity Surfaces of the Disposal Room Containing Various Waste Inventories for WIPP PA
5.5 Porosity Surface
70 of 140
The porosity histories described in Section 5.3 are converted into the surface in the threedimensional space as shown in Figures 44 through 49 for each waste inventory respectively. These surfaces are plotted on the log time scale. The porosity surface data will be provided for BRAGFLO analyses.
Poi'Oeily -·- -0.000 0.200 o.eoo 0 .800 1.000
Figure 44: Porosity surface for the room containing the standard waste (log time scale)
OI.DO!l 0.200 01100 (1800 1000
Figure 45: Porosity surface for the room containing the 12-inch POP waste (log time scale)

Information Only
Determination of the Porosity Surfaces of the Disposal Room Containing Various Waste Inventories for WIPP PA
o_ooo 0.200 0 . ..00 0600
71 of 140
0800 1000
Figure 46: Porosity surface for the room containing the 6-inch POP waste (log time 54:ale)
0.000 0.200 0.400 0.600 0.800 1.000
Figure 47: Porosity surface for tbe room containing tbe AMWfP waste (log time scale)

Information Only
Determination of the Porosity Surfaces of the Disposal Room Containing Various Waste Inventories for WIPP PA 72 of 140
Figure 48: Porosity surface for the room containing 2/3 AMWfP + 1/3 standard waste (log time scale)
0 .000 0.200 0.400 o.soo 0.800 1.000
Figure 49: Porosity surface for the room containing 1/3 AMWTP + 213 standard waste (log time scale)

Information Only
Determination of the Porosity Surfaces of the Disposal Room Containing Various Waste Inventories for WIPP PA
6 DISCUSSION AND CONCLUDING REMARKS
73 of 140
The primary purpose of these analyses is to assess the structural/mechanical impact to room closure and porosity development resulting from waste packages that differ from those assumed in the baseline configuration supporting the original compliance calculations. The primary waste packaging examined includes the pipe overpacks and the supercompacted waste. The POPs have already been placed in significant quantities in Pane! I, whereas plans have been made to ship AMWTP supercompacted waste. In support of the re-certification, an evaluation of possible structural effects of these waste packages is required.
Both waste package configurations--POPs and AMWTP--are structurally more rigid than a typical 55-gallon waste drum. The structural response of the underground couples creep closure, gas generation and the response of the waste. The models used for creep closure and gas generation are identical to those previously implemented for the porosity surface used in the CCA. The supercompacted wastes generate more gas than the standard waste model and the more rigid waste packages tend to hold the room open and to preserve porosity. The combination of these effects gives rise to porosity surfaces that differ from the baseline supporting the CCA.
The particular case when there is no gas generation is of no consequence to performance assessment scenarios that address a drilling intrusion. For the cases of gas generation at an/less than 0.1 rooms filled with standard waste have the lowest porosity. When/is larger than 0.1, the lower bound of the porosity surface is associated with the allAMWTP case. Over the first I 000 years, or so, the highest porosity surface results from the case simulating rooms filled with POPs. The porosity surfaces tend to merge over time as f increases from 0.4 to 1.0. For f values greater than 1.0 there is little difference between the porosities for any of the inventories from I ,000 to 10,000 years.
These analyses demonstrate possible extreme effects regarding room closure. Fundamentally, the assumptions involve filling rooms entirely with robust waste packages such as the POPs or AMWTP supercompacted waste. Resistance to room closure is increased by these waste packages in comparison to the standard waste packages assumed in the original compliance calculations. It must be noted in viewing these results that the calculations underlying them assume that the structural integrity of the waste stacks is preserved. If the waste stack corrodes at the base then they may become more deformable, while other reactions, which are not accounted for in PA occur (such as MgO hydration and salt precipitation) may provide more resistance to closure and loss of porosity due to chemical action. In any of these cases the evolution of room closure would be different than modeled here.
The phenomenon of stress uptake by rigid pillars is well known in the mining industry (Van Sambeek, 2003). In particular, in salt mines, the deformation of pillars is a function of the stress that is applied to them. If all the pillars are the same size and shape, they will each creep at the same rate. If the strata over the pillars is extremely stiff or if the mined area is not wide, then the individual pillar stresses are responsive to the deforrna-
Information Only
Determination of the Porosity Surfaces of the Disposal Room Containing Various Waste Inventories for WIPP PA 74 of 140
tion rate imposed on the pillar by movement of the stiff overlying rock or massive abutment pillars adjacent the smaller pillars. Hence, pillar stresses and behavior can be influenced and changed from what might have existed naturally when the pillar was first created, and the stresses and deformation may be much less than indicated by the size of the pillar. This influence can occur if a stiff crib is placed in a room. In this case the crib will absorb or redistribute vertical stress from the salt pillars onto itself. The rate of vertical stress increase in the crib is proportional to the elastic deformation of the crib (Hooke's law), while the deformation of the softer salt pillar is limited by the deformation of the crib. It appears as if the pillar sheds its vertical stress because any elastic rebound is completely overshadowed by the previous and contemporary creep shortening. Eventually a new stress equilibrium is reached where the salt pillar adjacent the crib no longer shortens by creep because the crib now carries the vertical stress that was in excess and causing the salt to creep. The rigid material in the present case comprises particular inventories of waste, which act to crib the rooms open. Simultaneous with load uptake in the waste stack, stress in the pillars between rooms tends to decrease, and vertical room closure is restricted due to the decrease in the stress differences that give rise to creep deformation. Thus, the lateral deformation of the rooms also decreases appreciably when rigid materials are placed within them.
The structural models evaluated in this report simulate rooms filled with robust waste forms, such as the pipe overpacks and the AMWTP supercompacted pucks. If a room were filled with structurally competent materials, the resulting porosity surface would exhibit characteristics that differ from the single porosity surface derived for the original compliance determination. The differences in porosity surfaces are greatest in the absence of gas generation.
With gas generation, the porosity surfaces undergo a transitory period lasting some thousand years. This is the period over which gas generation counterbalances the stresses driving salt creep. Over that period the porosity surfaces developed for the rooms filled with supercompacted AMWTP waste packages are lower than the surface used in the CCA. On the other hand, rooms filled with POPs produce higher porosity surfaces. With significant gas generation, i.e., when human intrusion scenarios are most important, the porosity surfaces tend to converge to a single porosity value over the regulatory period, regardless of the simulated inventory. Rooms filled with POPs and the AMWTP supercompacted waste packages are propped open by the stiffer waste stacks. The cribbing effect results from the assumption that the rooms are filled with these robust waste packages and provide the structural equivalent of rigid columns, three tiers tall.
The porosity surface calculations presented in this report have evaluated the structural response of rooms filled completely with different forms of waste packages. In the absence of gas generation by metal corrosion and microbial consumption of the waste, the standard waste packages (as represented in the CCA) consolidate more than other, more rigid packages. In the absence of gas generation there is no scenario in which regulatory release limits might be exceeded. If waste packages remain intact, or relatively intact, they would be difficult to penetrate with a conventional drill and waste would not spall or

Information Only
Determination ofthe Porosity Surfaces of the Disposal Room Containing Various Waste Inventories for WIPP PA 75 of 140
cave into the wellbore. Therefore, gas generation scenarios coupled with human intrusion pose the only possible threat to regulatory compliance.
Degradation and other changes to the waste packages, such as the structural effects of MgO hydration, salt precipitation, and corrosion by product, are not taken into account in any of the porosity surface structural calculations, either here or in the original compliance application. Obviously, massive changes to the waste would affect room closure and porosity surface development and massive changes to the waste are necessary to create gas pressure. In addition, any salt material spalling from the back would tend to agglomerate owing to the well-established mechanism of pressure solution and redeposition, and would tend to create a solid mass in the waste rooms (Hansen, 2003). Clearly these structural models provide only a superficial view of the underground evolution over the life of the repository.
Information Only
Determination of the Porosity Surfaces of the Disposal Room Containing Various Waste Inventories for WIPP PA
7 REFERENCES
76 of 140
Blacker, T.D., 1988, FASTQ Users Manual, Version 2.i, SAND88-1326, Sandia National Labora-tories, Albuquerque, NM, July 1988.
Butcher, B.M., T.W. Thompson, R.G. VanBuskirk, and N.C., Patti, 1991, Mechanical Compaction of Waste isolation Pilot Plant Simulated Waste, SAND90-1206, prepared by Sandia National Laboratories, Albuquerque, NM.
Butcher, B.M. 1997, A Summary of the Sources of input Parameter Values for the WIPP Final Porosity Surface Calculations, SAND97-0796, Albuquerque, NM: Sandia National Laboratories.
Chavez, M.J. 2003, Software Requirements, NP 19-1, Revision 10. Carlsbad, NM: Sandia National Laboratories (Copy on file in the Sandia WIPP Records Center as ERMS# 529692).
Gilkey, A.P. and Glick, J. H., 1988, BLOT- A Mesh and Curve Plot Program for the Output of a Finite Element Analysis, SAND88-1432, Sandia National Laboratories, Albuquerque, New Mexico.
Griswold, L.W., 2002, Specification for Prepackaged MgO Baclifil/, Revision 4, U.S. DOE, WIPP, Westinghouse TRU Solutions, Carlsbad, NM.
Hansen, F. D., 2003. The Disturbed Rock Zone at the Waste isolation Pilot Plant, SAND2003-3407. Sandia National Laboratories, Albuquerque, NM.
Hansen, C.W., L.H. Brush, M.B. Gross, F. D. Hansen, B. Y. Park, J. S. Stein and T. W. Thompson. 2003a, Effects of Supercompacted Waste and Heterogeneous Waste Emplacement on Repository Performance, Revision I, ERMS#532475, Sandia National Laboratories, Carlsbad NM.
Hansen, C.W., L.H. Brush, F.D. Hansen, J.S. Stein. 2003b, Analysis Plan for Evaluating Assumptions of Waste Homogeneity in WIPP Performance Assessment (AP-107), Revision I. Sandia National Laboratories. Carlsbad, NM. ERMS 531067.
Helton, J.C., et a!., 1998, Uncertainty and Sensitivity Analysis Results Obtained in the i996 Performance Assessment for the Waste Isolation Pilot Plant, SAND98-0365, Sandia National Laboratories, Albuquerque, NM.
Munson, D.E., A.F. Fossum, and P.E. Senseny, 1989, Advances in Resolution of Discrepancies between Predicted and Measured In Situ Room Closures, SAND88-2948, Albuquerque, NM: Sandia National Laboratories.
Leigh, C.D., 2003, Estimate of Waste Material Percentages in Pipe Overpacks in Support of AP-107, Revision 0, ERMS 533194, Sandia National Laboratories. Carlsbad, NM.

Information Only
Detennination of the Porosity Surfaces of the Disposal Room Containing Various Waste Inventories for WIPP PA 77 of 140
Ludwigsen, J.S., D.J. Ammerman, H.D. Radioff, 1998, Analysis in Support of Storage of Residues in the Pipe Overpack Container, SAND98-1003, Sandia National Laboratories, Albuquerque, New Mexico.
Park, B.Y. and J.F. Holland, 2003, Analysis Report for Structural Evaluation of WIPP Disposal Room Raised to Clay Seam G, SAND2003-3409, Sandia National Laboratories, Albuquerque, NM.
Park, B.Y. and F.D. Hansen, 2003, Simulations of the Pipe Overpack to Compute Constitutive Model Parameters, ERMS 533188, Sandia National Laboratories, Albuquerque, NM.
Sandia WIPP Project, 1992, Preliminary Performance Assessment for the Waste Isolation Pilot Plant, December 1992, Volume 3: Model Parameters, SAND92-0700/3, Albuquerque, NM: Sandia National Laboratories.
Sandia National Laboratories, 2002, November, nSIGHTS User Manual, Document Version 1.0, ERMS# 522061.
Sjaardema, G.D., 1989, NUMBERS: A Collection of Utilities for Pre- and Postprocessing Two-and Three-Dimensional EXODUS Finite Element Models, SAND88-0737, Sandia National Laboratories, Albuquerque, New Mexico.
Smith, A.C. and P.S. Blanton, 2001, Effect of Glue Layers on Response of Cellulose Fiberboard at Low Temperature, Westinghouse Savannah River Company, Aiken, SC 29808, WSRC-TR-2001-00083.
Stone, C.M., 1997a, Final Disposal Room Structural Response Calculations, SAND97-0795, Sandia National Laboratories, Albuquerque, NM.
Stone, C.M., 1997b, SANTOS-A Two-Dimensional Finite Element Program for the Quasistatic, Large Deformation, Inelastic Response of Solids, SAND90-0543, Sandia National Laboratories, Albuquerque, NM.
United States Department of Energy. 1996. Title 40 CFR Part 191 Compliance Certification for the Waste isolation Pilot Plant. DOE/CA0-1996-2184. Vols. I-XXI. Carlsbad, NM:Carlsbad Area Office, U. S. Department of Energy.
Van Sambeek, L. L. 2003. Personal communication.
WIPP PA 2003a. Design Document for BRAGFLO Version 5.00. Sandia National Laboratories. Carlsbad, NM. Sandia WIPP Central Files ERMS # 525700.
WIPP PA (Performance Assessment). 2003b. Verification and Validation Plan/Validation Document for SANTOS 2.1. 7. , Carlsbad, NM: Sandia National Laboratories, Sandia WIPP Central Files ERMS # 530091.

Information Only
Determination of the Porosity Surfaces ofthe Disposal Room Containing Various Waste Inventories for WIPP PA 78 of 140
WTS (Washington TRU Solutions, LLC.), 2003, TRUPACT-II Authorized Methods for Payload Control (TRAMP ACT), Revision 19c. April2003, Westinghouse TRU Solutions, Carlsbad, NM.
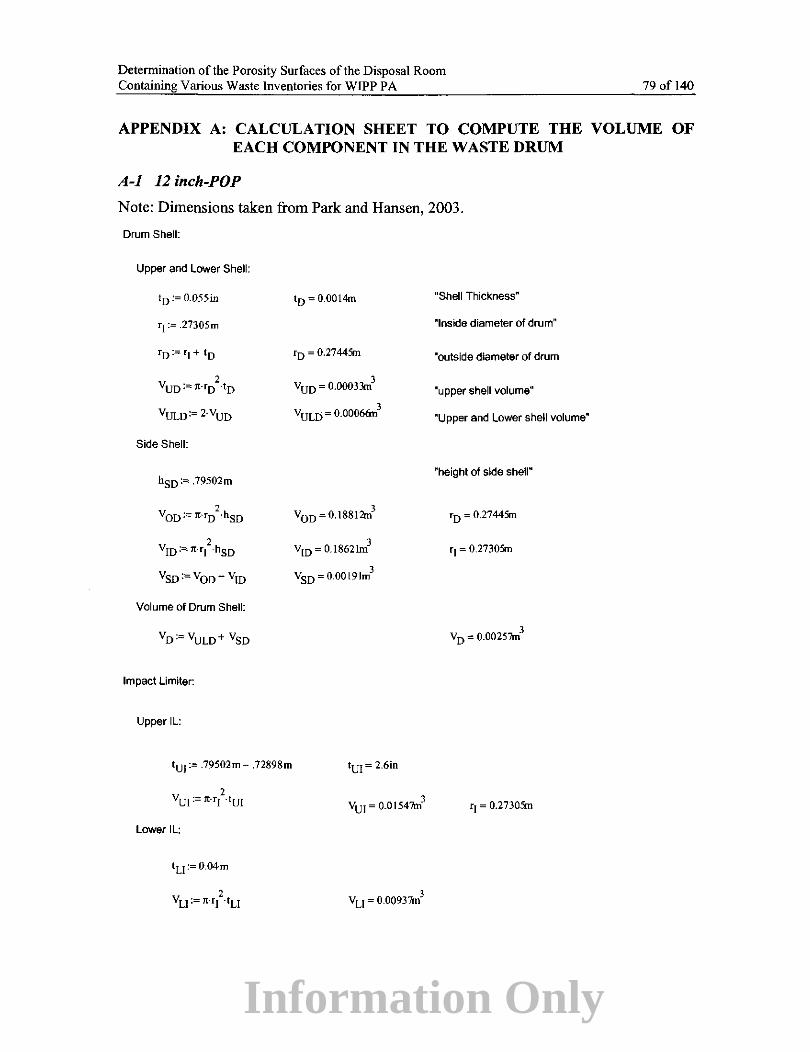
Information Only
Determination ofthe Porosity Surfaces of the Disposal Room Containing Various Waste Inventories for WIPP PA 79 of 140
APPENDIX A: CALCULATION SHEET TO COMPUTE THE VOLUME OF EACH COMPONENT IN THE WASTE DRUM
A-1 12 inch-POP
Note: Dimensions taken from Park and Hansen, 2003.
Drum Shell:
Upper and lower Shell:
t0 := o.ossm
'I:= .27305m
Side Shell:
hso := .79502m
Volume of Drum Shell:
Impact Limiter:
Upper ll:
'ur== .79502m- .72898m
lower IL:
tu:= o.04m
t0 = o.oot4m
r0 = 0.27445m
3 vuo = o.ooo33m
3 v00 = o.t88I2m
3 v10 = o.t862lni
3 Vso = 0.00191m
tu1 = 2.6in
3 vu1 = o.ots47m
3 vu = o.oo937m
"Shell Thickness"
"Inside diameter of drum"
"outside diameter of drum
"upper shell volume"
"Upper and Lower shell volumeM
"height of side shell"
'D = 0.27445m
'I= 0.27305m
3 v0 = o.oo2s7m
'I = 0.27305m

Information Only
Determination of the Porosity Surfaces ofthe Disposal Room Containing Various Waste Inventories for WIPP PA
Side IL:
Lower Side:
hLsi'= .64516m- .05334m
'ILsr'=. 16256m
Middle Side:
hMSI := .68326m- .64516m
'IMSI := .2070lm
Upper Side:
hus1 := .72898m- .68326m
'IUS!:= 'IMSl
Side IL Volume:
3 v0 Lsi= o. 13862m
3 VILSI= 0.04913m
3 VLSI = 0.0894~
hMSI = 1.5in
3 YoMSI = 0.00892m
3 VIMSI = 0.00513m
3 VMS!= 0.0037~
3 Vous1= o.Ol07lm
3 VIUSI = 0.0061tin
3 Yusi = o.00455m
'I = 0.27305m
'I= 0.27305m
'IMSI = 0.2070lm
3 v5I = o.09784m
80 of 140

Information Only
Determination of the Porosity Surfaces of the Disposal Room Containing Various Waste Inventories for WIPP PA
Impact Limiter Volume:
Pipe:
Bottom Pipe:
lp := 0.25in
'op := .16256m
Side Pipe:
Lower:
lp = 0.00635m
3 v3 p = o.ooos3ni
hLSP := .64516m- .05969m hLSP = 23.05in
Middle:
'IP := .1569974m
hMSP := .68326m- .64516m
r00p := .1665224m
'OMSP' (roop+ 'op)
2
3 VOLSP = 0.04861m
3 VILSP = 0.04534m
3 VLSP = 0.00327rri
hMSP = Uin
'OMSP = 0.16454m
3 VOMSP = 0.00324m
3 VIMSP = 0.00295m
3 VMSP = 0.0002\<D
3 v1 = 0.12267rri
81 of 140

Information Only
Determination of the Porosity Surfaces of the Disposal Room Containing Various Waste Inventories for WIPP PA
Upper:
husr :~ .70612m- .68326m
Side Pipe Volume:
Lid:
tLP:~ .72898m- .70612m
Pipe Volume:
Waste:
hw :~ .70612m- .05969m
Plywood:
tpw :~ .05334m- .04m
husr~ 0.9in
3 Yousr ~ o.oo3o8m
3 Yusp~O.OOI3Im
3 v5p ~ o.oo487m
tLP~ 0.9in
3 VLP ~ 0.00308m
'IMSI ~ 0.2070Jm
3 Yp ~ 0.00847m
hw ~ 25.45in
3 vw ~ o.osoofui
'rw ~ o.oJJ34m
3 Ypw ~ o.003I2m
82 of 140
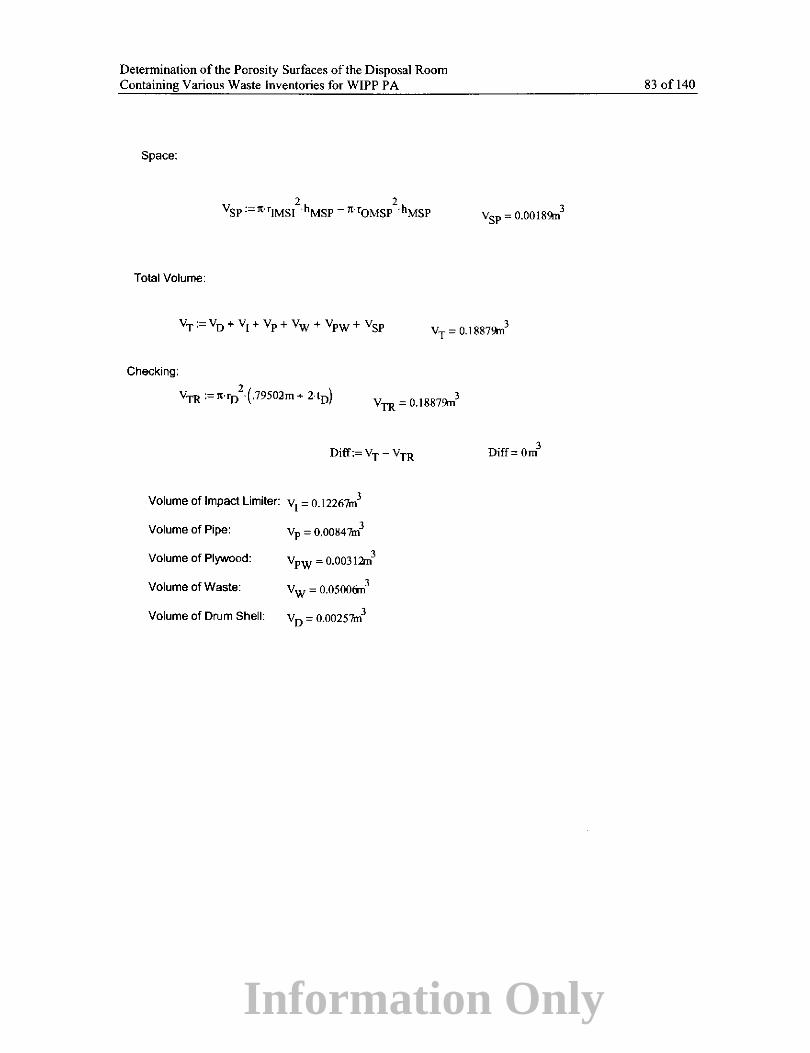
Information Only
Determination of the Porosity Surfaces of the Disposal Room Containing Various Waste Inventories for WIPP PA
Space:
Total Volume:
Checking:
vTR :=Jt-rn2
(.79502m+ 2·tn) 3 VTR = 0.1887\\n
Diff:= Vr- VTR
Volume of Impact Limiter: v1 = o.I2267m3
Volume of Pipe:
Volume of Plywood:
Volume of Waste:
Volume of Drum Shell:
3 Vp = 0.00847m
3 Ypw = o.00312m
3 Vw = o.osoocm
3 v 0 = o.00257m
3 V SP = 0.00 18\\n
Diff= Om3
83 of 140

Information Only
Determination of the Porosity Surfaces of the Disposal Room Containing Various Waste Jnventories for WTPP PA
A-2 6-inch POP
Note: Dimensions taken from Park and Hansen, 2003.
Drum Shell:
Upper and Lower Shell:
r1 := .27305m
Side Shell:
hso := .79502m
Impact Limiter:
Upper IL:
tm := .79502m- .73660m
Lower IL:
t0 = 0.0014m
'D = 0.27445m
3 VUD = 0.00033ni
3 v00 = 0.18812m
3 Ym = 0.1862lm
3 v50 = 0.0019lm
3 v0 = o.oozs1m
tu1::: 2.3in
3 Ym= o.OI368m
3 Vu = o.00937m
84 ofl40
r0 = 0.27445m
,, = 0.27305m
'I = 0.27305m

Information Only
Determination of the Porosity Surfaces of the Disposal Room Containing Various Waste Inventories for WIPP PA
Side IL:
Lower:
hLs(= .64516m- .05334m
'ILSI := .08509rn
Middle:
hMSI := .69088m- .64516m
'IMSJ := .13970m
Upper:
husr := .73660m- .69088rn
'IUS!:= 'IMSI
3 v0 Lsr= o.l3862m
hMSI = 1.8in
3 VOMSI = 0.01071m
3 VIMSI = 0.0028m
3 VMS! = 0.00791m
husr = !.Sin
3 Vousi = o.oto71m
3 Vrust = o.oo28m
3 Vust = o.00791m
3 Vsr = o.t4097rri
3 v 1 = 0.16402m
85 of 140
r1 = 0.2730n
r1 = 0.2730:m
'IMSI = 0.1397m

Information Only
Determination of the Porosity Surfaces of the Disposal Room Containing Various Waste Inventories for WIPP PA
Pipe:
Bottom Pipe:
tp := 0.25in
'OP := .08509m
Side Pipe:
Lower:
lp = 0.006J:m
3 Yap= o.oool4ni
hLSP'= .64516m- .05969m
r1p := .07887m
Middle:
hMSP := .69088m- .64516m
'OOP := .08905m
'OMSP' (roop+ 'or)
2
3 VoLsP= 0.0133211
hMSP = 1.8in
'OMSP = 0.08707m
3 VOMSP = 0.00109m
3 VtMSP = 0.00089m
3 VMSP = 0.000211
86 of 140
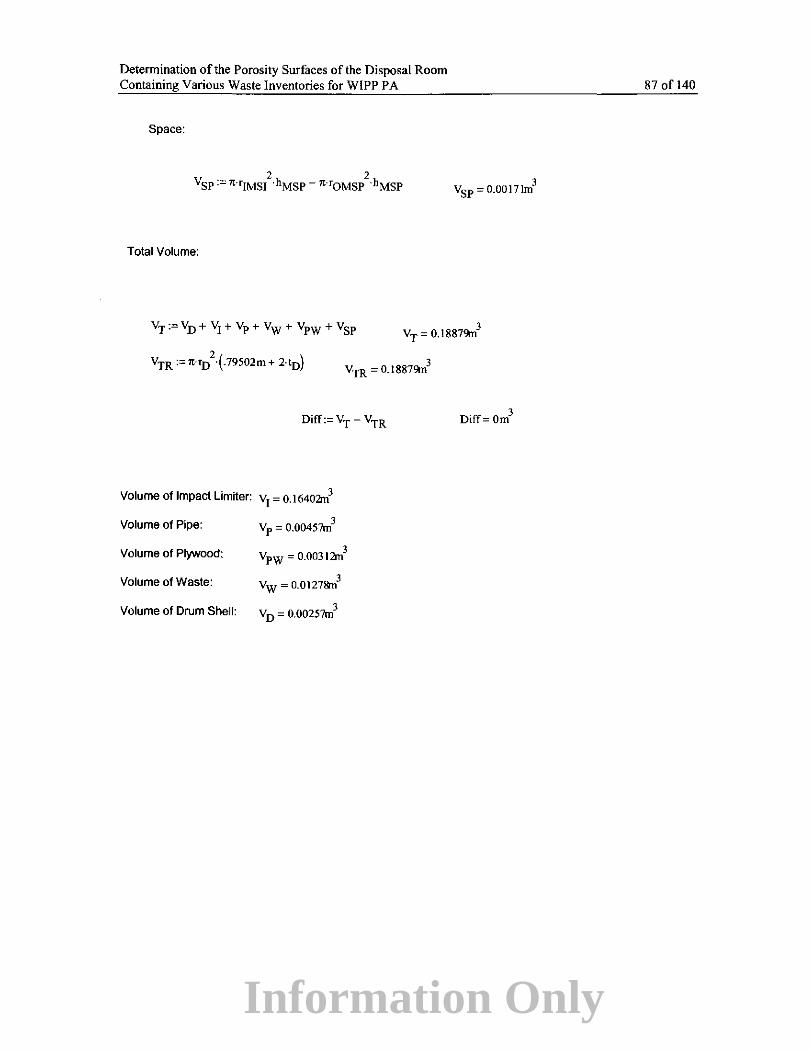
Information Only
Determination of the Porosity Surfaces of the Disposal Room Containing Various Waste Inventories for WlPP PA
Space:
Total Volume:
3 Vsp = o.00171m
3 Vr = o.1887<;1n
3 VTR = 0. 1887<;\n
Diff:= VT - VTR
Volume of Impact Limiter: v1
= o. 164o2m3
Volume of Pipe:
Volume of Plywood:
Volume of Waste:
Volume of Drum Shell:
3 Yp = 0.00457m
3 Ypw = o.oo3t2m
3 vw = o.0127&n
3 VD = 0.00257m
Diff= Om3
87 of 140

Information Only
Determination of the Porosity Surfaces of the Disposal Room Containing Various Waste Inventories for WIPP PA
A-3 AMWTP Debris Waste
Note: Dimensions taken from Figure 4.
Radius of Puck:
Space of Side:
Radius of Container (Inside):
Thick of Container Shell:
Radius of Container (Outside):
Height of Container:
Bottom of Upper lid
Height of Upper Space:
Top of lower lid:
Bottom of lower lid:
Height of lower Space:
Top of Puck:
Bottom of Puck
Height of Puck:
rp := 125in
Ss := 3.0in
rm:=rp + Ss
'DO:= 'DI + 1D
'n Hn := 35-in + -
2
'n Hls := 1.75in--
2
88 of 140
rp = 0.3175m
Ss = o.o762m
'DI = 0.3937m
'D = O.OOI4m
'DO= 0.395lm
2·rno = 0.790t9m
Hn= 0.8897m
LBu = 0.8883m
Hus = 0.0367m
~L = 0.8516m
LBL = 0.8502m
HLS = 0.0437:.U
PT = 0.8064:.U
PB = 0.0014m
Hp = 0.8050."m

Information Only
Determination of the Porosity Surfaces of the Disposal Room Containing Various Waste Inventories for WIPP P A
Volume Calculation of Each Puck Elements:
Container Shell:
Upper and Lower Shell:
Side Shell:
Height of Side:
VsD := ,. ( 'D02
- 'DI2} hsD
Middle Lid:
Volume of Container Shell:
Waste:
Space:
Upper Space:
3 VuD = 0.0006!rn
hsD = o.8876m
3 VSD = 0.00307m
3 VMD = 0.0006&ri
3 v 0 = o.oosi2ni
3 Vw = o.25495m
3 Yus = o.OI787m
89 of 140

Information Only
Determination of the Porosity Surfaces of the DisposaJ Room Containing Various Waste Inventories for WIPP PA
Lower Space:
Side Space:
Volume of Space:
Total Volume:
Checking:
" l 'H' "TC ;-.:: n·roo · D
Volume of Conta 11'1er Shetl
Volume of Pucks·
Volume of .Incompressible Material:
Volume of Space:
3 VLS = 0.0213rri
3 Vss = o.13706ri
3 VT = 0.43632ni
3 VTC = 0.436:.1:/m
3 Vw= o.1549!ni
3 Vs = o.t762-tn
90 of 140

Information Only
Determination of the Porosity Surfaces of the Disposal Room Containing Various Waste Inventories for WIPP PA 91 ofl40
APPENDIX B: CALCULATION SHEET FOR THE INITIAL POROSITY OF THE UNDEFORMED DISPOSAL ROOM
Note: POP dimensions taken from Park and Hansen, 2003; Room dimensions taken from Park and Holland, 2003.
B-1 12-inch POP
Hight of Disposal Room:
Wide of Disposal Room:
Length of Disposal Room:
Initial Room Volume:
Number of Drums in a Disposal Room:
Number of Drums in a Pack:
Number of Packs in a Disposal Room:
HR :=3.96m
WR :=10.06m
lR_ := 91.44m
V H W L "'DiaU~-~. 1 R.i:= R R R ,....._ _..,."""""
No.R :=6804
No_p:=7
No.R Np_R:=--
No.P NP.R = 972
Volume of 55-gal Steel Drums filled with Waste (SAND92..0700/3 p.3-10): v0 := 0.2539m3
Volume of the All Drums filled with Waste in a Room:
Initial Density of the All of Drums filled with Waste:
Solid Waste Density:
Initial Porosity of the All of Drums with Waste:
Initial Void Volume of the All of Drums with Waste:
Initial Solid Waste Volume:
Initial Porosity of the Undeformed Disposal Room:
Po clio:= 1--
Ps
3 vv.D.W = 1111.8ni
3 vs =615.694ni
VR·-V oL . •- .1 S TK.I"- V
R.i

Information Only
Determination of the Porosity Surfaces of the Disposal Room Containing Various Waste Inventories for WIPP PA
B-2 6-inch POP
Hight of Disposal Room:
Wide of Disposal Room:
Length of Disposal Room:
Initial Room Volume:
Number of Drums in a Disposal Room:
Number of Drums in a Pack:
Number of Packs in a Disposal Room:
HR :=3.96m
WR := 10.06m
LR :=91.44m
ND.R :=6804
No_p:=7
No.R Np_R:=N
D.P
92 ofl40
Np_R =972
Volume of 55-gal Steel Drums filled with Waste (SAND92-0700/3 p.3-10): v0
:= 0.2539m3
Volume of the All Drums filled with Waste in a Room:
Initial Density of the All of Drums filled with Waste:
Solid Waste Density:
Initial Porosity of the All of Drums with Waste:
Initial Void Volume of the All of Drums with Waste:
Initial Solid Waste Volume:
Initial Porosity of the Undeformed Disposal Room:
Po ~:=I--
Ps
3 Vv.D.W = 1126.2ni
3 vs = 601.358m

Information Only
Determination of the Porosity Surfaces of the Disposal Room Containing Various Waste Inventories for WIPP PA
B-3 All AMWTP waste
Hight of Disposal Room:
Wide of Disposal Room:
Length of Disposal Room:
Initial Room Volume:
Number of Packs in a Disposal Room:
Number of Containers in a Pack:
Number of Containers in a Disposal Room:
Thick of Container Shell: 'D :~ 0.055in
Diameter of 1 00-gal Container:
Height of 1 00-gal Container:
Volume of 1 OQ..gal Steel Containers filled with Waste:
HR :~ 3.96m
No.R :~ NP.D No.P
'o ~ o.oOI4m
Do :~ 3 J.in + 2t0
'o H0 :~35·in +-
2
2 7t·Do Vo:~--·Ho
4
Volume ofthe All Containers filled with Waste in a Room: Vo.w :~ v0 -No.R
Diameter of Supercompacted Waste(Puck): Dp:~25·in
Space between inner lid and outer lid:
Space between puck and inner lid:
3 VR.i ~ 3642.8m
ND.R ~ 2916
no~ o.79m
H0 ~o.89m
3 Vo.w ~ l272.3m
Dp ~o.635m
SL ~ 0.038m
Sp ~o.044m
Height of Puck: 3 Hp :~ Ho - SL- Sp - -to Hp ~ 0.805m
2
Height of 3 Layer Puck:
Volume of Puck:
Total Volume of Puck
2 1t·Dp
Vp:~--·Hp 4
Hp.3 ~ 2.4l5m
3 Vp~ 0.255m
3 VP.T ~ 743.4l4ni
93 of 140

Information Only
Detennination of the Porosity Surfaces of the Disposal Room Containing Various Waste Inventories for WIPP PA
Volume of Container Shell (from Drawing):
Total Volume of Container Shell
Number of Layer in a Stack:
Number of Stacks in a Disposal Room:
3 Yes :=0.00512m
VcS.T := Vcg- ND.R
Volume of supersacks of MgO on a Top of Stack:
Total Volume of MgO sacks:
Total Volume of Containers plus MgO sacks:
Porosity of MgO Sacks: ~ :=41·%
Volume of Solid of MgO Sacks:
Total Volume of Incompressible Solid:
Initial Room Porosity:
Ratio ofthe solid volume ofMgO to the total volume of a room:
Ys.M RMgO :=-
VR.i
3 vcs.r= 14.93m
Ns = 324
3 vM.r=324m
94 of140
3 VD.M = 1596.29~
3 Vs.M = 191.16ni
3 VT.l = 949.50lri

Information Only
Detennination of the Porosity Surfaces of the Disposal Room Containing Various Waste Inventories for WIPP PA
B-4 113 A.MWTP waste and 213 Sttmdard waste
Hight of Disposal Room:
Wide of Disposal Room:
Length of Disposal Room:
Initial Room Volume:
Portion of Satanclard Waste:
Portion of AMWTP Waste:
2 Pg:=-
3
WR:=10.06m
LR :=91.44m
PA := 1- Pg PA =0.33
Volume of All AMWTP(Container+MgO Sack) in a Room:
Volume of All Standard Waste Drum in a Room:
3 VD.W.A := 1S96.3m
3 vo.w.s := 1727.Sm
Volumeof1/3AMWTP TypeWaste: Vo.w:=PA·Vo.W.A + Pg·Vo.W.S
Initial Density of All AMWTP (Container+MgO Sack):
Solid Waste Density of AMWTP:
Initial Density of All Std. Drum:
Solid Waste Density of Std. Waste:
kgf Po.A := 1399.21-
3 m
kgf p s.A := 2352.26-
3 m
kgf Po.s==Ss9.s3
m
kgf Ps.S := 1751J
m
95 of140

Information Only
Determination of the Porosity Surfaces of the Disposal Room Containing Various Waste Inventories for WIPP PA
Initial Density of 113AMWTP Type: Po.TP:=PA·Po.A + Pg·Po.S
Solid Waste Density of 113 AMWTP Type: Ps.TP :=PA·Ps.A + Pg·Ps.S
kgf p o:rr = 839.-t-t
m
Initial Porosity of 1/3 AMWTP Type: $o := 1 - p O. TP ·~tu .: 0.57 Ps.TP
Initial Void Volume of 1/3 AMWTP Type: Vv,D.W := Vo.w·to Vv.O, W; 960.9Srn3
Initial Solid Waste Volume Vs := Vo.w- vv.D.W v, ~ 722.79m3
Initial Porosity of the Undeformed Disposal Room:
'a.i=0.802
96 of 140
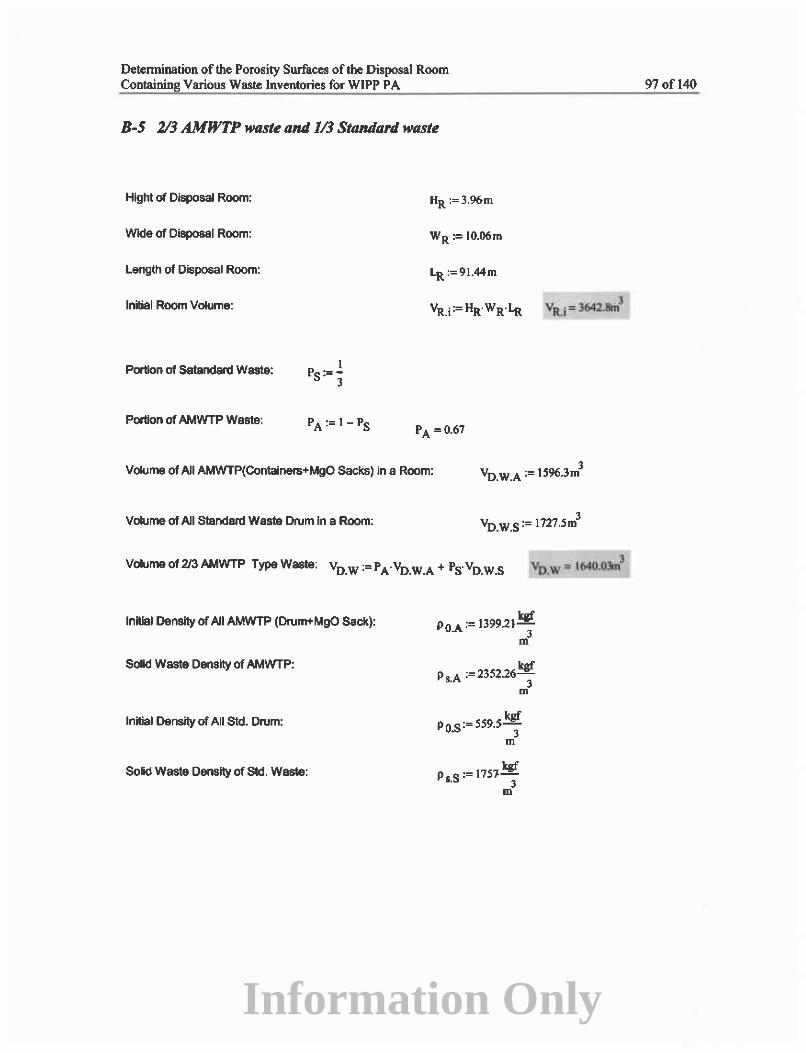
Information Only
Detennination of the Porosity Surfaces of the Disposal Room Containing Various Waste Inventories for WIPP PA
B-5 213 AMWTP waste and 113 Standard WtlSte
Hight of Disposal Room:
Wide of Disposal Room:
Length of Disposal Room:
Initial Room Volume:
Portion of Satandard Waste:
Portion of AMWTP Waste:
1 Pg:=-
3
HR:=3.96m
WR:=I0.06m
LR :=91.44m
Volume of All AMWTP(Containers+MgO Sacks) in a Room: 3 Vo.W.A := ts96.3m
Volume of All Standard Waste Drum In a Room: 3 vo.w.s:= 1121.sm
Volumeof2/3AMWTP Type Waste: Vo.W :=PA·Vo.W.A + Pg·Vo.W.S
Initial Density of All AMWTP (Drum+MgO Sack):
Solid Waste Density of AMWTP:
Initial Density of All Std. Drum:
Solid Waste Density of Std. Waste:
kgf Po.A := 1399.21-
3 m
kgf p s.A := 2352.26-
3 m
kgf Po.s==559.s3
m
p s := 1751 kgf s. 3
m
97 of140

Information Only
Determination of the Porosity Surfaces of the Disposal Room Containing Various Waste Inventories for WIPP PA
Initial Density of 2/3 AMWTP Type: p O.TP := P A· p O.A + Pg· P O.S
Solid Waste Density of 2/3 AMWTP Type: p s. TP := P A" p s.A + Pg· P s.S
Initial Porosity of 2/3 AMWTP Type:
Initial Void Volume of 213 AMWTP Type:
Initial Solid Waste Volume
Po.TP $():= 1---
Ps.TP
Initial Porosity of the Undeformed Disposal Room:
~1u=0.766
_kgf P s. TP : 2.1 53·~~
m
~ =0.48
3 vv.D.W = 787.741ri
98 of140

Information Only
Determination of the Porosity Surfaces of the Disposal Room Containing Various Waste Inventories for WIPP PA
APPENDIX C: GAS GENERATION POTENTIAL AND RATE
C-1 Sttmdtml Wee and POP Wtute
Number of Druma In a Dllpoeal Room:
Number ol DMna in a Pack:
Number ot Packaln a Dlaposal Room:
Number ol Puckaln a DNtn
Total N~.~~nber of Pucks in a Disposal Room:
Micn:Jbial Activity Period:
Total Gas Potenlal rram o yr to 550 yr.
Gal Produc:lon Rata fnm 0 yr to 550 yr
Total Gas POOrial from 550 yrto 1050 yr.
Gee Produclion Rate from 550 yr to 1050 yr
Total Gas Polential from 0 yr to 1050 yr:
No.R := 6804dnan
No.P := 7· drum
No.R. Np,R:•--
No.P NP.R •972
mol GP~:=I·--
dnmtyr drum • $Spl
mol OPI\{ := 1--
dnlmyr
tA := lO!IOyr
tM:=,$0yr
PVAWq :=(GP~ + OPI\4)-~·Nr.P
-•lid JtATFJ1 • 4J1Zx to -'--------~-~·
6 PV~=3.402x 10 mol
PVALUE:• PVAWq + PV~
99of140

Information Only
Determination of the Porosity Surfaces of the Disposal Room Containing Various Waste Inventories for WIPP PA
C-2 113 AMWTP and 2/3 Standard Waste
Number of Packs in a Disposal Room:
Portion of Satandard Waste:
Portion of AMWTP Waste:
Number of Standard Waste Packs in a Disposal Room:
Number of AMWTP Waste Packs in a Disposal Room:
Number of Standard Drums in a Pack: NsD.P := 7-drum
cont = 100 gal
drum = 55- gal
Ns_p= 648
NA_P = 324
Number of Standard Drums in a Disposal Room: Ns_R := NsD.P Ns.P Ns.R = 4536drum
Number of 1 00--gal Containers in a Pack:
Number of 100--gal Containers in a Disposal Room: No.R := NA.P' No.P No.R = 972cont
Number of Pucks( Compressed Drum) in a Container:
Total Number of Pucks in a Disposal Room:
Total Number of Pucks and Std. Drum in a Disposal Room:
Estimated Gas Production Rate from Anoxic Corrosion:
Estimated Gas Production Rate from Microbial Activity:
drum N ·=4---
P.D· cont
NT_P = 3888drum
NT.P.S = 8424drum
mol GPRA:=I--
drum-yr
mol GPI\1 := 1--
drumyr
100ofl40

Information Only
Detennination of the Porosity Surfaces of the Disposal Room Containing Various Waste Inventories for WIPP PA
Anoxic Corrosion Period: tA := 1050yr
Microbial Activity Period:
Total Gas Potential from 0 yr to 550 yr.
Gas Production Rate from 0 yr to 550 yr
Total Gas Potential from 550 yr to 1050 yr:
PVALU~ =4.212x 10⁶
moJ
Gas Production Rate from 550 yr to 1 050 yr
Total Gas Potential from 0 yr to 1050 yr: PV ALUE:= PV ALUEj_ + PV AL~
101 of 140
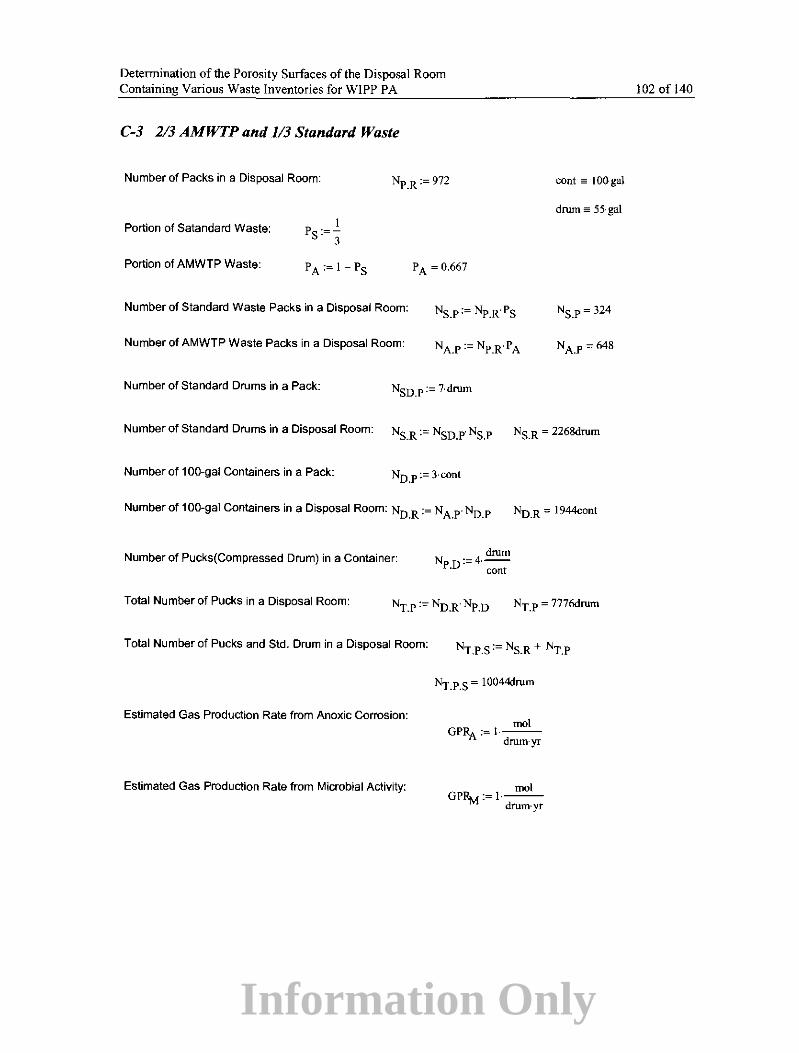
Information Only
Determination of the Porosity Surfaces of the Disposal Room Containing Various Waste Inventories for WIPP PA
C-3 2/3 AMWTP and 113 Standard Waste
Number of Packs in a Disposal Room:
Portion of Satandard Waste:
Portion of AMWTP Waste:
Number of Standard Waste Packs in a Disposal Room:
Number of AMWTP Waste Packs in a Disposal Room:
Number of Standard Drums in a Pack: Nso_p:~ 7-drum
cont = IO() gal
drum= 55-gal
NS.P ~ 324
NA.P ~ 648
Number of Standard Drums in a Disposal Room: Ns_R :~ Nso.P· Ns.P Ns.R ~ 2268drum
Number of 1 00-gal Containers in a Pack: No.P :~ 3·cont
Number of 100-gal Containers in a Disposal Room: No.R :~ NA_p·No_p No.R ~ 1944cont
Number of Pucks( Compressed Drum) in a Container: drum N ·~4---
P.D- cont
Total Number of Pucks in a Disposal Room: NT.P :~ No.R NP.D NT.P ~ 7776drum
Total Number of Pucks and Std. Drum in a Disposal Room:
Estimated Gas Production Rate from Anoxic Corrosion:
Estimated Gas Production Rate from Microbial Activity:
NT.P.S :~ Ns.R + NT.P
NT.P.S ~ 10044drum
mol GPRA :~ 1---
drum-yr
mol GPRrv! :~ 1·-
drumyr
102 of 140

Information Only
Determination of the Porosity Surfaces of the Disposal Room Containing Various Waste Inventories for WIPP PA
Anoxic Corrosion Period:
Microbial Activity Period:
Total Gas Potential from 0 yr to 550 yr:
Gas Production Rate from 0 yr to 550 yr
Total Gas Potential from 550 yr to 1 050 yr:
Gas Production Rate from 550 yr to 1050 yr
Total Gas Potential from 0 yr to 1050 yr:
tA := 1050yr
tM := 550yr
6 PV AL~ = 5.022x I 0 mol
PV ALUE:= PVALUft + PV AL~
103 ofl40

Information Only
Determination of the Porosity Surfaces of the Disposal Room Containing Various Waste Inventories for WIPP PA
C-4 All AMWTP Waste
Number of Packs in a Disposal Room: NP.R :=972
Number of 1 00-gal Container in a Pack: ND.P := 3·cont
cont = I 00 gal
drum"' 55 gal
Number of 1 00-gal Container in a Disposal Room: No.R := NP.R. No.P No.R = 2916cont
Number of Pucks( Compressed Drum) in a Container: drum Npo:=4---
. coot
Total Number of Pucks in a Disposal Room:
Estimated Gas Production Rate from Anoxic Corrosion: mol
OP~:=l·-drum·yr
Estimated Gas Production Rate from Microbial Activity: mol GPI\t := 1·-
drumyr
Anoxic Corrosion Period:
Microbial Activity Period:
Total Gas Potential from 0 yrto 550 yr.
Gas Production Rate from 0 yr to 550 yr
Total Gas Potential from 550 yr to 1050 yr.
Gas Production Rate from 550 yr to 1050 yr
Total Gas Potential from 0 yr to 1050 yr:
tA := IOSOyr
tM := SS()yr
PVALU.Iiz = 5.832x 10⁶ mo1
PVALU.Iiz RA~·-.- (tA - tM)
PVALUE:=PVALtJ9 + PVAL~
104 of 140

Information Only
Determination ofthe Porosity Surfaces of the Disposal Room Containing Various Waste inventories for WIPP P A 105 of 140
APPENDIX D: HEIGHT OF THE AMWTP MODEL IN THE DISPOSAL ROOM
Number of Packs in a Disposal Room:
Number of Drums in a Pack:
Number of Drums in a Disposal Room:
Number of Layer in a Stack:
Number of Stacks in a Disposal Room:
Volume of supersacks of MgO on a Top of Stack:
Total Volume of MgO Sacks:
Modified uncompressed width of the stored waste:
Np_o:=972
No_p:=3
N N ·- P.D s·-
NL
3 VM:=I·m
Nn.R = 2916
Ns = 324
W O := 7.3Sm (SAND97-0795, p.18)
Modified length of the disposal room available for storing waste: ~ := 87.85m (SAND97-0795, p.18)
Norminal area of the disposal room available for storing waste: Ao:=Wo·~ 2 Ao = 645.697m
Uncompressed height of MgO sacks:
Height of Pucks in a Container: Hp := 31.75in
Total Height of Pucks in Three Layers Containers: Hp.3 := lHp Hp,3 = 2.419m
Elevation of the Bottom of Waste in the Model: Ea:=-6.39m
Elevation of the Top of Pucks in the Model: Ey-p := Ea + Hp_J JSrp•-,..
Height of Container: He:= 35-in He= 0.889m
Total Height of Three Layers Containers: Hc_3 := 3· He Hc.J = 2.667m
Total Height of Containers with MgO Sacks:
Elevation of the Top of Waste in the Model: Erw := EB + HTCM
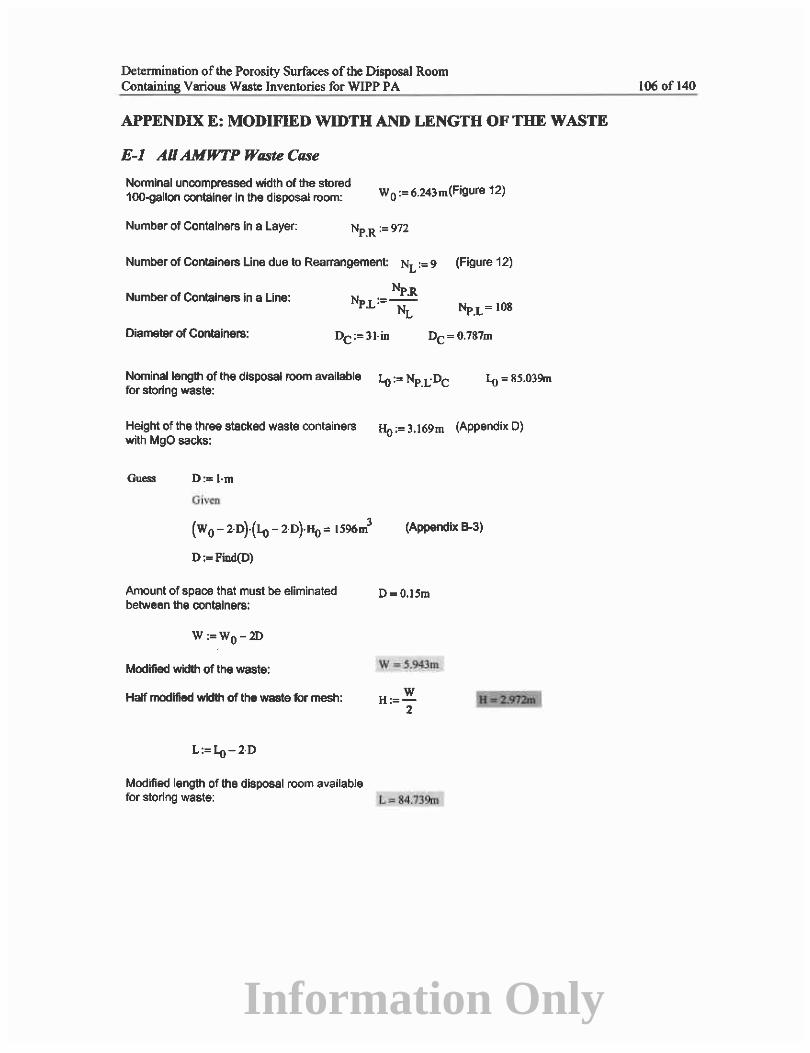
Information Only
Determination of the Porosity Surfaces of the Disposal Room Containing Various Waste Inventories for WIPP PA
APPENDIX E: MODIFIED WIDTH AND LENGTH OF THE WASTE
E-1 AIIAMWTP Waste Case
Norminal uncompressed width of the stored 100-gallon container In the disposal room: W o := 6.243m(Figure 12)
Number of Containers in a Layer: NP.R := 972
Number of Containers Line due to Rearrangement: NL := 9 (Figure 12)
Number of Containers in a Line: N- NP.R "t'.L:= NL Np.L = 108
Diameter of Containers: Dc:=lt·in Dc=0.787m
Nominal length of the disposal room available Lo := NP.L" De for storing waste:
Lo = 85.039rn
Height of the three stacked waste containers Ho := 3.169m (Appendix D) with MgO sacks:
Guess D:=l·m
yl\'t:T:J
(w0 - 2·D)·(Lo- 2·D)·Ho = I 596m3
D:=Find(D)
Amount of space that must be eliminated between the containers:
Modified width of the waste:
Half modified width of the waste for mesh:
L:=Lo-2·0
Modified length of the disposal room available
(Appendix B-3)
D = O.ISm
w ..-j.94Jm
w H:=-
2
for storing waste: L"'" &4:7iJ9m
106ofl40

Information Only
Determination of the Porosity Surfaces of the Disposal Room Containing Various Waste Inventories for WIPP PA
E-2 213 AMWTP + 113 Standard Waste CIISe
Norminal uncompressed width of the stored 1 QO-gallon container in the disposal room: W o := 4.191m(Figure 16)
Number of Containers in a Layer: Nr.R := 972( 1) Number of Containers line due to Rearrange: NL := 6 (Agure 16)
Number of Containers in a Line:
Diameter of Containers:
NP.R Nr.L:"'N
L
Dc:=lt·in
Nominal length of the disposal room available 1o := Np.r:Dc for storing waste:
Lo=85.039m
Height of the three slacked waste containers Ho := 3.169m (Appendix D) with MgO sacks:
Guess D := l·m
Given
(w0-2·D)·(Lo- 2·D)·Ho= 1064m3
D:=Find(D)
Amount of space that must be eliminated between the containers:
Modified width of the container part:
Modlfted width of the standard part
Modified width of the waste:
Half modified width of the waste:
L:=J..o-2·0
Modified length of the disposal room available
D=0.119m
I W1 :=7.3Sm-
3
w H:=-
2
for storing waste: L • 84.R.O lm
W1 =2.45m
w =6.409m
107 of 140

Information Only
Detennination of the Porosity Surfaces of the Disposal Room Containing Various Waste Inventories for WIPP PA
E-3 113 AMWTP and 113 Standard Waste Case
Nonninal uncompressed width of the stored 1 00-gallon container in the disposal room: w0 :=2.151·m (Figure 19)
Number of Containers in a Layer: NP.R := 972-( 1) Number of Containers line due to Rearrange: NL := 3 (Figure 19)
Number of Containers in a Line: NP.R
Np.t:=-N L NP.L = 108
Diameter of Containers: Dc:=31·in Dc=0.787m
Nominal length of the disposal room available 41 := Np.I:Dc for storing waste:
4J= 85.039m
Height of the three stacked waste containers Ho := 3.169m (Appendix D) with MgO sacks:
Guess D:= l·m
Given
D:=Find(D)
Amount of space that must be eliminated between the containers:
Modified width of the container part:
Modified width of the standard part:
Modified width of the waste:
Half modified width of the waste:
L:=4J-2·D
Modified length of the disposal room available
(= 3 1 32 3) 1596m ·- =5 m
D=0.086m
2 W5 :=7.35m-
3
w H:=-
2
3
W8 =4.9m
W =6.878m
for storing waste: Mf IJI 1•
108 of 140

Information Only
Determination of the Porosity Surfaces ofthe Disposal Room Containing Various Waste Inventories for WIPP PA
APPENDIX F: POROSITY CALCULATION FOR THE PUCK PART
Note: Room dimensions taken from Park and Holland, 2003.
1--- ---------i I-- Dl ... ----~-~
~~ 3 ~ ' '~~" ~
I !II L-lH--~~......J
Diameter of Puck:
Width of Pucks In the mesh:
Length of Pucks in the mesh:
Height of Pucks In the mesh:
Volume of Pucks In the mesh:
Area of Triangle:
--f ~-- 18.1D ---------1 Mm' m
Wp:=S.034m
I Lp := IO&Dp + -·Dp
2
Hp :=2.419m
- Pudcs
c::::::J Void
Lp= 68.897m
3 YpM = 838.982rri
2 AT = 0.175m
109 of140
E
~ 00

Information Only
Detennination of the Porosity Surfaces of the Disposal Room Containing Various Waste Inventories for WIPP PA
Area of Half Circle:
Area of space between 3 pucks:
Total area of space between 3 pucks: Ans := A38-J 07·8· 2
Area of Rectangle at both side:
Area of space between 2 puck at both side:
Total area of space between 2pucks:
Area of Hexagon: AH ;=6-AT
2 AHc=O.I58m
2 A3s = o.ot6rri
2 AT3S = 21-829nl
2 AR =0.202ni
2 A2g=0.043m
2 AT2S "' 9.259m
Area of space at both end: 1 AgE;=2AH- 2AHC 2
AsE = 0.207m
Total area of space at both end:
Total area of space:
2 ATsE = L864m
2 ATS = 38.952ni
110 of140

Information Only
Determination of the Porosity Surfaces of the Disposal Room Containing Various Waste Inventories for WIPP PA
Area of Pucks:
Total void volume in puck mesh:
Volume of Pucks:
Porosity of the puck mesh in FEM model:
2 Ap = 307.87lbi
3 VTS = 94.226ni
3 Vp = 744.75crn
~ = 0.112
111 ofl40
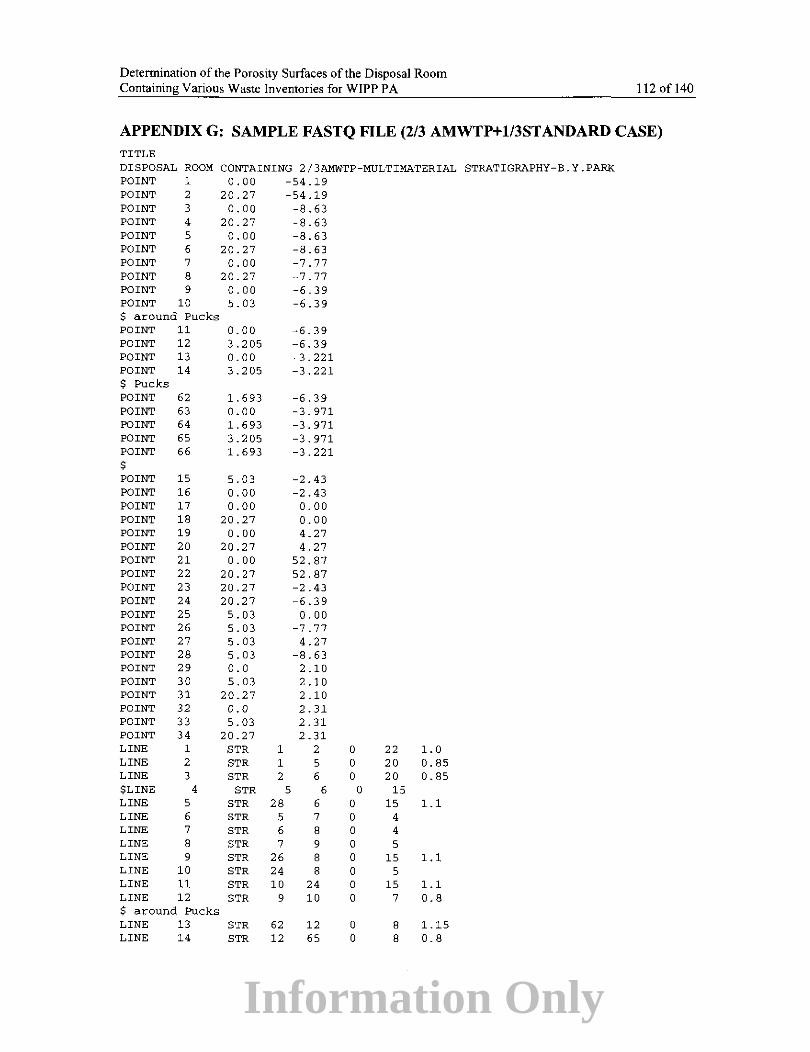
Information Only
Determination of the Porosity Surfaces of the Disposal Room Containing Various Waste Inventories for WIPP PA 112 of 140
APPENDIX G: SAMPLE FASTQ FILE (2/3 AMWTP+l/3STANDARD CASE) TITLE DISPOSAL ROOM CONTAINING 2/3AMWTP-MULTIMATERIAL STRATIGRAPHY-B.Y.PARK POINT 1 0.00 -54.19 POINT 2 20.27 -54.19 POINT 3 0.00 -8.63 POINT 4 20.27 -8.63 POINT 5 0.00 -8.63 POINT 6 20.27 -8.63 POINT 7 0.00 -7.77 POINT 8 20.27 -7.77 POINT 9 0.00 -6.39 POINT 10 5.03 -6.39 $ around Pucks POINT 11 0.00 -6.39 POINT 12 3.205 -6.39 POINT 13 0.00 -3.221 POINT 14 3.205 -3.221 $ Pucks POINT 62 1.693 -6.39 POINT 63 0.00 -3.971 POINT 64 1. 693 -3.971 POINT 65 3.205 -3.971 POINT 66 1. 693 -3.221 $ POINT 15 5.03 -2.43 POINT 16 0.00 -2.43 POINT 17 0.00 0.00 POINT 18 20.27 0.00 POINT 19 0.00 4.27 POINT 20 20.27 4.27 POINT 21 0.00 52.87 POINT 22 20.27 52.87 POINT 23 20.27 -2.43 POINT 24 20.27 -6.39 POINT 25 5.03 0.00 POINT 26 5.03 -7.77 POINT 27 5.03 4.27 POINT 28 5.03 -8.63 POINT 29 0.0 2.10 POINT 30 5.03 2.10 POINT 31 20.27 2.10 POINT 32 0.0 2.31 POINT 33 5.03 2.31 POINT 34 20.27 2.31 LINE 1 STR 1 2 0 22 1.0 LINE 2 STR 1 5 0 20 0.85 LINE 3 STR 2 6 0 20 0.85 $LINE 4 STR 5 6 0 15 LINE 5 STR 28 6 0 15 1.1 LINE 6 STR 5 7 0 4 LINE 7 STR 6 8 0 4 LINE 8 STR 7 9 0 5 LINE 9 STR 26 8 0 15 1.1 LINE 10 STR 24 8 0 5 LINE 11 STR 10 24 0 15 1.1 LINE 12 STR 9 10 0 7 0.8 $ around Pucks LINE 13 STR 62 12 0 8 1.15 LINE 14 STR 12 65 0 8 0.8

Information Only
Determination of the Porosity Surfaces of the Disposal Room Containing Various Waste Inventories for WIPP PA
LINE 15 LINE 16 LINE 67 LINE 68 LINE 69 LINE 70 $ Pucks LINE 63 LINE 64 LINE 65 LINE 66 $ LINE 17 LINE 18 LINE 19 LINE 20 LINE 21 LINE 22 LINE LINE LINE LINE LINE $LINE LINE LINE LINE LINE LINE LINE LINE LINE LINE LINE LINE LINE LINE LINE LINE LINE LINE SIDE SIDE SIDE SIDE SIDE SIDE SIDE
23 24 25 26 27
28 29 30 31 32 33 34 35 36 37 38 39 40 41 42 43 44 45
100 101 102 103 104 105 106
STR STR STR STR STR STR
STR STR STR STR
STR STR STR STR STR STR
13 63 64 65 66 64
11 62 63 11
10 24
8 16 16 15
66 13 65 14 14 66
62 64 64 63
15 23 18 17 15 23
STR 18 23 STR 25 18 STR 17 19 STR 18 20 STR 27 20
STR 25 20 STR 19 21 STR 20 22 STR 21 22 STR 17 25 STR 19 27 STR 7 26 STR 5 STR 17 STR 18 STR 29 STR 30 STR 29 STR 31 STR 32 STR 33 STR 32 STR 34
11 12 21 22 32 24 33 27 35 5 34 9 38 39
28 29 31 30 31 32 34 33 34 19 20
SIDE 107 42 43 $ NODEBC CARDS NODEBC 2 1 NODEBC 1 2 NODEBC 1 3
6 7
8 10
66 18
0 0 0 0 0 0
0 0 0 0
0 0 0 0 0 0 0 0 0 0 0
0 0 0 0 0 0 0 0 0 0 0 0 0 0 0 0 0
0
16 23
$ Top of the Model
7 5 8 5 8 5
7 8 7 8
12 12 12
7 7
15 7
0.8 1.2 1.15 1.2 1.15 1.2
0.8 0.8 0.8 0.8
0.8 1.1
15 1.1 8 8
15 1.1 8
20 1.15 20 1.15 22 1.0
7 0.8 7 0.8 7 0.8 7 4 4 7
15 1 1 7
15 4 4
20 37
0.8
0.8 1.1
0.8 1.1
36 41
$ SIDEBC CARDS SIDEBC 10 31 SIDEBC 20 1 SIDEBC 100 12 SIDEBC 200 17 SIDEBC 300 21 SIDEBC 400 13 SIDEBC 500 14 SIDEBC 600 15
$ Bottom of the Model $ $ $
63 68 69
Room Floor Room Wall Room Roof
$ Waste Bottom $ waste Side $ Waste Top
40 45
44 30
113ofl40
29

Information Only
Determination of the Porosity Surfaces of the Disposal Room Containing Various Waste Inventories for WIPP PA 114ofl40
SIDEBC 700 12 17 21 $ Room Boundary $ REG ION CARDS REGION 1 1 -1 -3 104 -2 REGION 2 2 104 -7 105 -6 REGION 3 1 105 -10 100 -8 REGION 4 1 -11 -18 -22 -17 REGION 5 1 101 -23 102 -20 REGION 6 3 102 -37 106 -36 REGION 7 1 103 -30 -31 -29 $ around Pucks REGION 11 4 -13 -14 -67 -64 REGION 12 4 -67 -68 -69 -70 REGION 13 4 -65 -70 -15 -16 $ Pucks REGION 14 5 -63 -64 -65 -66 $ REGION 9 2 106 -41 107 -40 REGION 10 3 107 -45 103 -44 SCHEME p
EXIT

Information Only
Detennination of the Porosity Surfaces of the Disposal Room Containing Various Waste Inventories for WIPP PA 115 of140
APPENDIX H: SAMPLE AWK SCRIPT TO CALCULATE THE POROSITY CHANGE IN THE ROOM WITH TIME (ALL AMWTP CASE) # # This awk script computes the porosity change in the room an outputs # it as a function of time (Based upon SANTOS output, All AMWTP) # BEGIN {
}
{
dens_ws = 2352.26 dens_w = 1399.21 val room= 3642.8 vol_waste = 1596.3 rnass_ws = dens_w*vol_waste dens_room = mass_ws/vol_room ratio = dens_room/dens_ws
if I $1 -/(0-9]/ I { vol_ratio = 19.92/$2 poro = 1. - ratio*vol_ratio print $l,poro

Information Only
Determination of the Porosity Surfaces of the Disposal Room Containing Various Waste Inventories for WIPP P A
APPENDIX I: SAMPLE SANTOS INPUT FILE
I-1: 12-inch POP TITLE
116of140
Porosity Surface Calculation for the Disposal Room with 12" POP Waste: f=0.4 PLANE STRAIN INITIAL STRESS = USER GRAVITY = 1 = 0. = ~9.79 = 0. PLOT ELEMENT, STRESS, STRAIN, VONMISES, PRESSURE PLOT NODAL, DISPLACEMENT, RESIDUAL PLOT STATE, EQCS, EV RESIDUAL TOLERANCE= 0.5 MAXIMUM ITERATIONS = 1000 MAXIMUM TOLERANCE = 100. INTERMEDIATE PRINT = 100 ELASTIC SOLUTION PREDICTOR SCALE FACTOR 3 AUTO STEP .015 2.592E6 NOREDUCE 1.E~5
TIME STEP SCALE= 0.5 HOURGLASS STIFFENING .005 STEP CONTROL 500 3.1536e7 2000 3.1536e9 36000 3.1536ell END OUTPUT TIME 1 3.1536e7 1 3.1536e9 200 3 .1536ell END PLOT TIME 10 3 .1536e7 100 3.1536e9 120 3.1536ell END MATERIAL, 1, M~D CREEP MODEL, 2300. $ARGILLACEOUS HALITE TWO MU = 24.8E9 BULK MODULUS = 20.66E9 A1 = 1. 407E23 Q1/R = 41.94 Nl 5.5 B1 = 8.998E6 A2 = 1. 314El3 Q2/R = 16.776 N2 = 5.0 B2 = 4.289E~2 SIGO = 20.57E6 QLC = 5335. M = 3.0 KO = 2.47E6 c = 2.759 ALPHA = ~14. 96 BETA= -7.738 DELTLC = . 58 RN3 = 2. AMULT = .95 END MATERIAL, 2, SOIL N FOAMS, 2300. $ ANHYDRITE TWO MU = 5.563E10 BULK MODULUS = 8.3444E10

Information Only
Determination of the Porosity Surfaces of the Disposal Room Containing Various Waste Inventories for WIPP PA
AO 2.338e6 A1 2.338 A2 0. PRESSURE CUTOPF 0.0 FUNCTION ID = 0 END MATERIAL, 3, M-D CREEP MODEL, 2300. $ PURE HALITE TWO MU = 24.8E9 BULK MODULUS = 20.66E9 Al = 8.386E22 Ql/R = 41.94 N1 = 5. 5 B1 = 6.086E6 A2 = 9.672E12 Q2/R = 16.776 N2 = 5.0 B2 = 3.034E-2 SIGO = 20.57E6 QLC = 5335. M = 3.0 KO = 6.275E5 c = 2.759 ALPHA= -17.37 BETA= -7.738 DELTLC = .58 RN3 = 2. AMULT = . 95 END MATERIAL, 4, SOIL N FOAMS, 655.94 $Waste TWO MU = 1.442E9 BULK MODULUS = 1.561E9 AO = 8.473E6 Al = 0. A2 = 0. PRESSURE CUTOFF 0. FUNCTION ID = 2 END
NO DISPLACEMENT X = 1 NO DISPLACEMENT Y = 2 PRESSURE, 10, 1, 13.57E6 CONTACT SURFACE, 100, 400, 0., 1.E-3, 1.E40 CONTACT SURFACE, 200, 500, 0., 1.E-3, 1.E4 CONTACT SURFACE, 300, 600, 0., 1.E-3, 1.E4 CONTACT SURFACE, 300, 200, 0., 1.E-3, 1.E4 CONTACT SURFACE, 100, 200, 0., 1.E-3, 1.E4 ADAPTIVE PRESSURE, 700, l.e-6, -6.4 FUNCTION,! $FUNCTION TO DEFINE PRESCRIBED PRESSURE 0., 1. 3 .153 6ell, 1. END FUNCTION,2 O.OOOE+OO O.OOOE+OO 4.767E-03 1. OOOE+06 8.475E-03 1.600E+06 9.534E-03 1.800E+06 1.059E-02 1.900E+06 1.218E-02 2.000E+06 3.125E-02 3.000E+06 5.085E-02 4.000E+06 7.044E-02 5.000E+06 1.091E-01 7.000E+06 1.637E-01 1.000E+07
117ofl40

Information Only
Determination of the Porosity Surfaces of the Disposal Room Containing Various Waste rnventories for WIPP PA
2 .172E-01 END FUNCTION :::: 3 0. 0. 5 3.1536Ell 1. END EXIT
1. 300E+07
1-2: All AMWTP TITLE
118of140
Porosity Surface Calculation for the Disposal Room with AMWTP Waste: f=0.4 PLANE STRAIN INITIAL STRESS = USER GRAVITY= 1 = 0. = -9.79 = 0. PLOT ELEMENT, STRESS, STRAIN, VONMISES, PRESSURE PLOT NODAL, DISPLACEMENT, RESIDUAL PLOT STATE, EQCS, EV RESIDUAL TOLERANCE = 0.5 MAXIMUM ITERATIONS = 1000 MAXIMUM TOLERANCE = 100. INTERMEDIATE PRINT = 100 ELASTIC SOLUTION PREDICTOR SCALE FACTOR 3 AUTO STEP .015 2.592E6 NOREDUCE 1.E-5 TIME STEP SCALE = 0.5 HOURGLASS STIFFENING .005 STEP CONTROL 500 3.1536e7 2000 3.1536e9 36000 3 .1536ell END OUTPUT TIME 1 3.1536e7 1 3.1536e9 200 3 .1536ell END PLOT TIME 10 3.1536e7 100 3.1536e9 120 3.1536e11 END MATERIAL, l, M-D CREEP MODEL, 2300. $ ARGILLACEOUS HALITE TWO MU = 24.8E9 BULK MODULUS = 20.66E9 Al = 1. 407E23 Ql/R = 41.94 Nl 5.5 B1 = 8.998E6 A2 = 1. 314El3 Q2/R = 16.776 N2 = 5.0 B2 = 4.289E-2 SIGO = 20.57E6 QLC = 5335. M = 3.0 KO = 2.47E6 c = 2.759 ALPHA = -14.96 BETA= -7.738 DELTLC = . 58

Information Only
DetermiMtion of the Porosity Surfaces of the Disposal Room Containing Various Waste Inventories for WIPP PA
RN3 = 2. AMULT = .95 END MATERIAL, 2, SOIL N FOAMS, 2300. $ANHYDRITE TWO MU = 5.563E10 BULK MODULUS = 8.3444El0 AO 2. 338e6 A1 = 2.338 A2 = 0. PRESSURE CUTOFF 0.0 FUNCTION ID = 0 END MATERIAL, 3, M-D CREEP MODEL, 2300. $ PURE HALITE TWO MU = 24.8E9 BULK MODULUS = 20.66E9 A1 = 8. 386E22 Q1/R = 41.94 N1 5. 5 B1 = 6.086E6 A2 = 9. 672El2 Q2/R = 16.776 N2 = 5.0 B2 = 3. 034E-2 SIGO = 20.57E6 QLC = 5335. M = 3.0 KO = 6.275E5 c ~ 2.759 ALPHA = -17.37 BETA= -7.738 DELTLC = .58 RN3 = 2. AMULT = .95 END MATERIAL, 4, SOIL N FOAMS, 559.5 $ around Pucks TWO MU = 6.66E8 BULK MODULUS= 2.223E8 AO 1. Oe6 A1 = 3. A2 = 0. PRESSURE CUTOFF 0. FUNCTION ID = 2 END MATERIAL, 5, SOIL N FOAMS, 1399.21 $ Pucks TWO MU = 5.563E10 BULK MODULUS = 8.3444E10 AO 2.338e6 A1 = 2.338 A2 = 0. PRESSURE CUTOFF 0.0 FUNCTION ID :::: 0 END NO DISPLACEMENT X = 1 NO DISPLACEMENT Y = 2 PRESSURE, 10, 1, 13. 57E6
119 ofl40
$ Card 39: Coarser mesh should be designated as the master surface. $ master,slave, mu, dis, tenrel CONTACT SURFACE, 100, 400, 0.' 1. E-3, l.E40 $ btwn room floor and waste bottom CONTACT SURFACE, 500, 200, o .. 1.E-3, l.E4 $ btwn waste side and room wall CONTACT SURFACE, 300' 600, o .. 1. E-3, l.E4 $ btwn room roof and waste top CONTACT SURFACE, 200, 300, 0.' 1. E-3, l.E4 $ btwn room wall and room roof CONTACT SURFACE, 200, 100, 0.' l.E-3, l.E4 $ btwn room wall and room floor
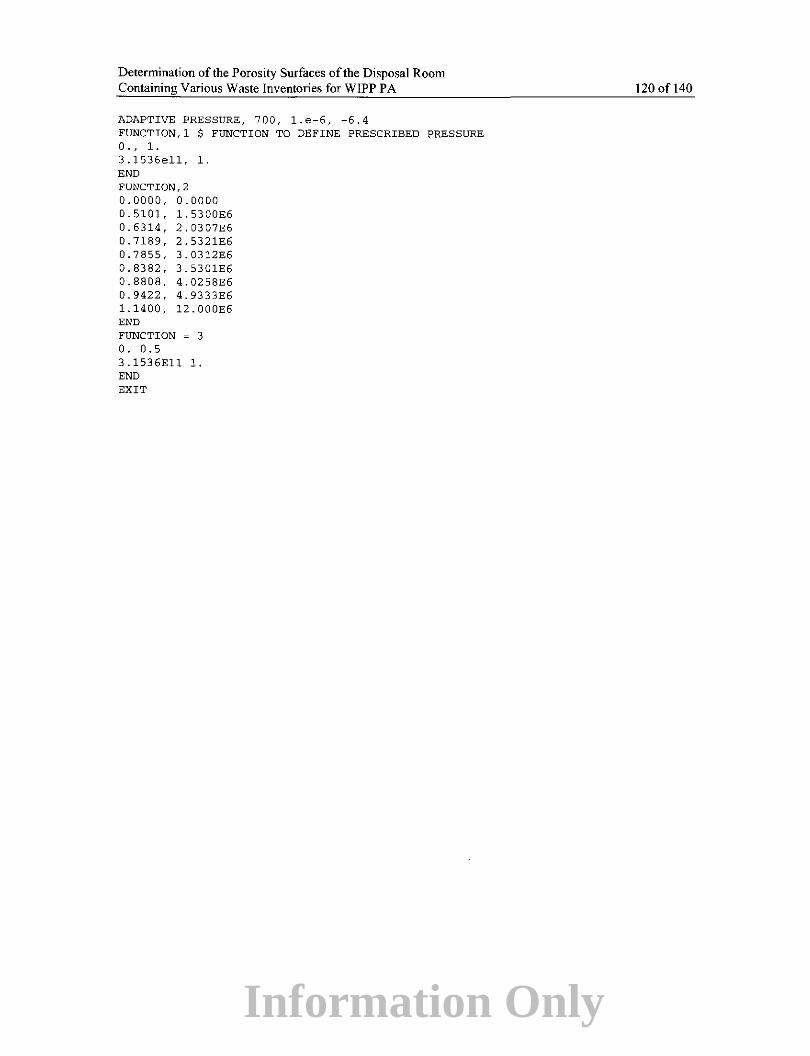
Information Only
Determination ofthe Porosity Surfaces of the Disposal Room Containing Various Waste Inventories for WIPP PA
ADAPTIVE PRESSURE, 700, l.e-6, -6.4 FUNCTION,!$ FUNCTION TO DEFINE PRESCRIBED PRESSURE 0.' 1. 3.1536ell, 1. END FUNCTION,2 0.0000, 0.0000 0.5101, 1.5300E6 0.6314, 2.0307E6 0.7189, 2.5321E6 0.7855, 3.0312E6 0.8382, 3.5301E6 0.8808, 4.0258E6 0.9422, 4.9333E6 1.1400, 12.000E6 END FUNCTION = 3 0. 0. 5 3 .1536Ell 1. END EXIT
120ofl40

Information Only
Determination ofthe Porosity Surfaces of the Disposal Room Containing Various Waste Inventories for WIPP PA 121 of 140
APPENDIX J: SAMPLE USER SUBROUTINES (ALL AMWTP WITH.f-=0.1)
J-1 Initial Stress State
SUBROUTINE INITST( SIG,COORD,LINK,DATMAT,KONMAT,SCREL ) c c ********************************************************************** c C DESCRIPTION' C THIS ROUTINE PROVIDES AN INITIAL STRESS STATE TO SANTOS c c c c c c c c c c c
FORMAL PARAMETERS' SIG REAL
COORD REAL LINK INTEGER DATMAT REAL KONMAT INTEGER
CALLED BY: INIT
ELEMENT STRESS ARRAY WHICH MUST BE RETURNED WITH THE REQUIRED STRESS VALUES GLOBAL NODAL COORDINATE ARRAY CONNECTIVITY ARRAY MATERIAL PROPERTIES ARRAY MATERIAL PROPERTIES INTEGER ARRAY
c ********************************************************************** c
c
c *
*
INCLUDE 'precision.blk' INCLUDE 'params.blk' INCLUDE 'psize.blk' INCLUDE 'contrl.blk' INCLUDE 'bsize.blk' INCLUDE 'timer.blk'
DIMENSION LINK(NELNS,NUMEL),KONMAT(10,NEMBLK),COORD(NNOD,NSPC), SIG(NSYMM,NUMEL) ,DATMAT(MCONS,*) ,SCREL(NEBLK,*)
DO 1000 I = 1,NEMBLK MATID KONMAT(1,I) MKIND = KONMAT(2,I) ISTRT = KONMAT(3,I) IEND = KONMAT(4,I)
DO 500 J = ISTRT,IEND II LINK( 1,J ) JJ LINK( 2,J ) KK LINK( 3,J ) LL LINK( 4,J ) ZAVG = 0.25 * ( COORD(II,2) + COORD(JJ,2) + COORD(KK,2) +
COORD(LL,2) ) STRESS = - 2300. * 9.79 * ( 655. - ZAVG ) IF( MATID .EQ. 4 )THEN
STRESS = 0. END IF SIG(l,J) SIG (2, J) SIG (3, J) SIG(4,J)
STRESS STRESS STRESS 0.0
500 CONTINUE 1000 CONTINUE
RETURN END

Information Only
Determination of the Porosity Surfaces of the Disposal Room Containing Various Waste Inventories for WIPP PA
J-2 Adaptive Pressure Boundary Condition SUBROUTINE FPRES( VOLUME,TIME,PGAS )
c C THE PRESSURE IS COMPUTED ON THE BASIS OF THE IDEAL GAS LAW, C PV = NRT. THE TOTAL NUMBER OF MOLES OF GAS, N (EN), PRESENT C AT ANY TIME IS DETERMINED ON THE BASIS OF A CONSTANT RATE OF GAS C GENERATION. R IS THE UNIVERSAL GAS CONSTANT AND THETA IS THE ROOM
122 of 140
C TEMPERATURE, 300 K. V IS THE CURRENT VOLUME OF THE ROOM. THE VOLUME C MUST BE CORRECTED BY MULTIPLYING BY 2 OR 4 TO ACCOUNT FOR THE USE OF C HALF OR QUARTER-SYMMETRY MODELS. THE VOLUME MUST ALSO BE MULTIPLIED C BY A FACTOR TO ACCOUNT FOR 3D LENGTH. c c
c
c
c
INCLUDE 'precision.blk'
R = 8.3144 THETA= 300.
IF( TIME .LT. 1.7325El0 )THEN PVALUE = 0. 0 RATE = 7. 3 92E-4 TSTAR = 0.0
ELSE IF( TIME .LT. 3.3075El0 )THEN PVALUE = 1.283E7 RATE = 3. 696E-4 TSTAR = 1.7325E10
ELSE PVALUE = 1.8662E7 RATE = 0.0 TSTAR = 0.0
END IF
C .... CORRECT VOLUME AT THIS TIME TO GET VOLUME OF VOIDS c
c
EN = PVALUE + RATE * ( TIME - TSTAR SCALE = 0.1 SYMFAC = 2. XLENG = 91.44
C .... THIS MODIFICATION REMOVES THE BACKFILL FROM VSOLID c C VSOLID FOR WASTE AND DRUMS ONLY 949.5
VSOLID = 949. 5
c
c
VOLUME = SYMFAC * VOLUME * XLENG - VSOLID IF( VOLUME .LE. 0.0 )VOLUME= 1.
PGAS = SCALE * EN * R * THETA / VOLUME
RETURN END

Information Only
Determination of the Porosity Surfaces of the Disposal Room Containing Various Waste Inventories for WIPP PA 123 of 140
APPENDIX K: COMPARISON BETWEEN POROSITY HISTORIES FOR THE DISPOSAL ROOM CONTAINING VARIOUS WASTE INVENTORIES
Gas Generation Factor,j=O.O 1.0..--~--~~~--~~~---~ ........ -----,
- Standard Waste --- 6-inch POP Waste
0.8 - 12-inch POP Waste ----- 113 AMWTP+213 Std --- 213 AMWTP+1/3 Std - AIIAMWTP
0.6 • '""---~~-~-~--~-~--~-~--~-~-=--~-=----~-=--~-=--=--=-~--=-~--=-=--~=-=:l ' \ \
\ -,_ :-..,.. '--...
0.4 ---- -- ----- ----- - - ·-- - ------- ----------- -
0.2
2000 4000 6000 10000
Time (years)
Gas Generation Factor,j=0.025 1.0~~~-..,--~--~~~-..:.--~~....-,--~--,
- standard Waste - - - 6-inch POP Waste
0.8 - 12-inch POP Waste ----- 1/3 AMWTP+2/3 Std --- 213 AMWTP+113 Std -AIAMWTP
0.6 ~ ' "' ~\, e 0 ........... -0.. -----
0.4
0.2
2000 4000 6000
Time (years)
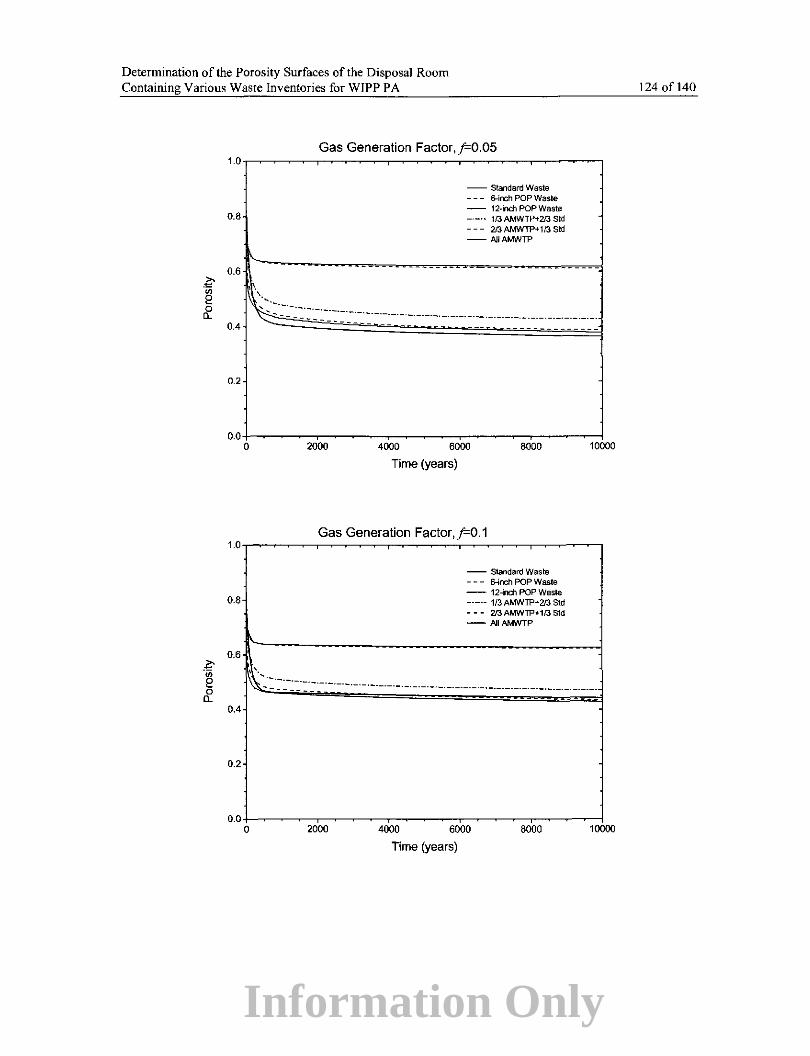
Information Only
Determination ofthe Porosity Surfaces of the Disposal Room Containing Various Waste Inventories for WIPP PA
~ e 0 0..
.2:' -~ 0
0..
Gas Generation Factor,.f=0.05
-- Standard Waste - - - 6-inch POP Waste - 12-inch POP Waste
0.8 ---·· 1/3 AMWTP+2/3 Std --- 213 AMWTP+1/3 Std -AUAMWTP
' \:_:.:-~-~~·=.:-~-~~-----~~-~-:--·---·------
OA -------
0.2
o.o+-~~-----------~~--,-----1 0 2000 4000 6000 8000 10000
Time (years)
Gas Generation Factor,j=0.1 1.o,-~~--~~---~--=.--~~--,---~,......,
- Standard Waste - - - &inch POP Waste -- 12-inch POP Waste
0.8 ----- 1/3AMWTP+213 Std - - - 213 AMWTP+1/3 std -.AIIAMWTP
0.6
1\..:: .:-:-:- : ~:- --- -- ---- ------ ---- -- -·-0.4
0.2
o.o+----~~---.--~~--.---~-.---.---1 0 2000 4000 6000 8000 10000
Time (years)
124 of 140

Information Only
Determination of the Porosity Surfaces of the Disposal Room Containing Various Waste Inventories for WIPP P A
Gas Generation Factor, f=0.2 1.o,-~~~-.-~~~~~~-.-~..:.-~~~-,--.-~~,.......,
- Standard Waste - - - 6-inch POP Waste - 12-inchPOPWaste
0.8 -·-·· 113 AMWTP+2/3 Std --- 213 AMWTP+113 Std - AJIAMWTP
0.4
0.2
4000 6000
Time (years)
Gas Generation Factor, f=0.4 1.o.--~~~...,-~~~..,-~~~-.-~~~---,--~~,......,
- Standard Waste --- 6-inc;h POP Waste - 12-inch POP Waste ----- 113AMWTP+213 Std 0.8 --- 213 AMWTP+113 std -AIIAMWTP
O.Bl""===========---·-·-·--·--·=-·=-·=-·=-·=-·=-·=·4
0.4
0.2
o.o+-~~~...,-~~~..,-..,----,-~~~---,-~~~--l 0 2000 4000 6000 8000 10000
Time (years)
125 of 140

Information Only
Determination of the Porosity Surfaces of the Disposal Room Containing Various Waste Inventories for WIPP PA
~ "' E' ~
1.0
0.8
0.6 ' ____ ;_
~
0.4
0.2
0.0 0
0.8
0.6
L/
0.4
0.2
Gas Generation Factor,;=o.5
- Standard Waste --- 6-inch POP Waste - 12-inch POP Waste ----- 1/3AMWTP+213 std --- 213 AMWTP+113 S1d -AIIAMWTP
2000 4000 6000 8000
Time (years)
Gas Generation Factor,;=0.6
- Standard Waste -- - 6-inch POP Waste - 12-inch POP Waste ----- 113 AMWTP+2/3 std -- - 213 AMWTP+113 Std -AIIMWVTP
4000 6000
Time (years)
126ofl40
10000

Information Only
Determination of the Porosity Surfaces of the Disposal Room Containing Various Waste Inventories for WIPP PA
Gas Generation Factor,j=0.8
- Standard Waste - - - EHrch POP Waste - 12-inch POP Wasta
0.8 -·-·- 113AMWTP+213Sid - - - 213 AMWTP+ 113 Sid - AIIANM/TP
0.4
0.2
o.o+-~~~..,-~~~~~~~-,--,--.,--.,-~~~~-1 0 2000 4000 6000 8000 10000
Time (years)
Gas Generation Factor,j=1.0
0.8
0.4
- Standard Wasta --- 6-inch POP Waste
0.2 - 12-inch POP Waste -·-·- 113AMWTP+213 std --- 213 AMWTP+1/3 Std - AIIAMNTP
Time (years)
127 of140

Information Only
Determination of the Porosity Surfaces of the Disposal Room Containing Various Waste Inventories for WIPP PA
Gas Generation Factor,.f-=1.2
0.8
0.4
- Standard Waste - -- 6-irrll POP Waste
0.2 - 12-inch POP Waste ---·- 1/3 AMWTP-t-213 Std --- 213 AMWTP+1/3 Std - AJIAMWTP
4000 6000
Time (years)
Gas Generation Factor,.f-=1.6
0.8
0.4
-- Standard Waste - - - 6-in::h POP Waste
0.2 - 12-inch POP Waste ----- 113 AMWTP-t-213 Std --- 213AMWTP+1/3 std -- AIIAMWTP
4000 6000
Time (years)
128 of 140

Information Only
Determination of the Porosity Surfaces of the Disposal Room Containing Various Waste Inventories for WIPP PA
Gas Generation Factor,.f-'2.0
OBV 06~
~ "' 12 rr.
0.4
- Standard Waste --- 6-inch POP Waste
0.2 - 12-inch POP Waste ----- 113AMWTP+2/3 std --- 2/3 AMWlP+1J3 std -AIIAMWTP
4000 6000 8000
Time (years)
129 of 140
10000

Information Only
Determination of the Porosity Surfaces of the Disposal Room Containing Various Waste Inventories for WIPP PA 130ofl40
APPENDIX L: CALCULATION OF POROSITY SURFACES USED IN THE AMWPA
This information is included here for completeness and reproducibility. The porosity surfaces reported in the main body of this report represent an improvement upon earlier analyses conducted in support of the evaluation of the effects of supercompacted waste on repository performance (Hansen et al. 2003b ). These improved porosity surfaces were not completed in time for inclusion in the PA reported in Hansen et al. (2003a). This appendix documents the calculation of the earlier porosity surfaces that were used in the AMW PA (reference).
L-1 Overview
The calculation of the porosity surfaces used in Hansen et al. (2003a) and described in this appendix followed the same methodology outlined in Section 2.0 of this report. The same six configurations of waste were considered:
1. All standard waste (55-gallon drums) 2. All 6-inch POPs 3. Alll2-inch POPs 4. A mix of 113 supercompacted waste and 2/3 standard waste 5. A mix of2/3 supercompacted waste and 113 standard waste 6. All supercompacted waste
The gas generation potentials and rates, and the constitutive models for the waste were the same as described in Section 2.0 of this report. The porosity surfaces computed for configurations I (all standard waste), 2 (all 6-inch POPs) and 3 (all 12-inch POPs), as used in Hansen et al. (2003a) are described in Section 5.0 of this report.
However, Hansen et al. (2003a) report porosity surfaces for configuration 5 (2/3 AMWTP) and configuration 6 (all AMWTP) that differ from the results for these configurations presented in Section 5.0 of this report, because these earlier porosity surfaces were computed using a different mesh representation for the AMWTP waste. Figure L-1 illustrates these meshes in which AMWTP and standard waste were separated into columns; in the later calculations described in this report, the standard waste was placed as a shell around the AMWTP waste to better represent closure of the interstitial space between waste packages (see Figure 10). For completeness this appendix includes the earlier results for configuration 4 (1/3 AMWTP) although this porosity surface was not discussed in Hansen et al. (2003a). In addition, the total volume of the container shells (14.9 m3
) was not considered in the earlier AMWTP waste calculations described in this appendix, but was considered in the later calculations described in Section 5.0. Thus, the initial porosities of the disposal room containing AMWTP waste were slightly different as listed in Table L-1.

Information Only
Determination of the Porosity Surfaces of the Disposal Room Containing Various Waste Inventories for WIPP PA 131 ofl40
ap ad pre SSI
adap
"
5.03 m
..
··~ ..
ve internal
re, "~
.478~ lj I .. 3.9 f. -+
6m
---'}_-:; - ;r-
3.675 m
1/3 AMWTP+2/3 Standard
5.03 m
tve internal
••
F-478 :Y 13.96 m
~
3.675 m
AIIAMWTP
5.03m
' '
ada pi ~ve internal ,p,
~.478,11 i 13.96 m
3.675m
2/3AMWTP+ 1/3 Standard
EEEEB Halite
EHH3 Argillaceous Halite EHffi AMWTPWaste
=trEE Anhydrite
Figure L-1: Meshes for cases including AMWTP waste.
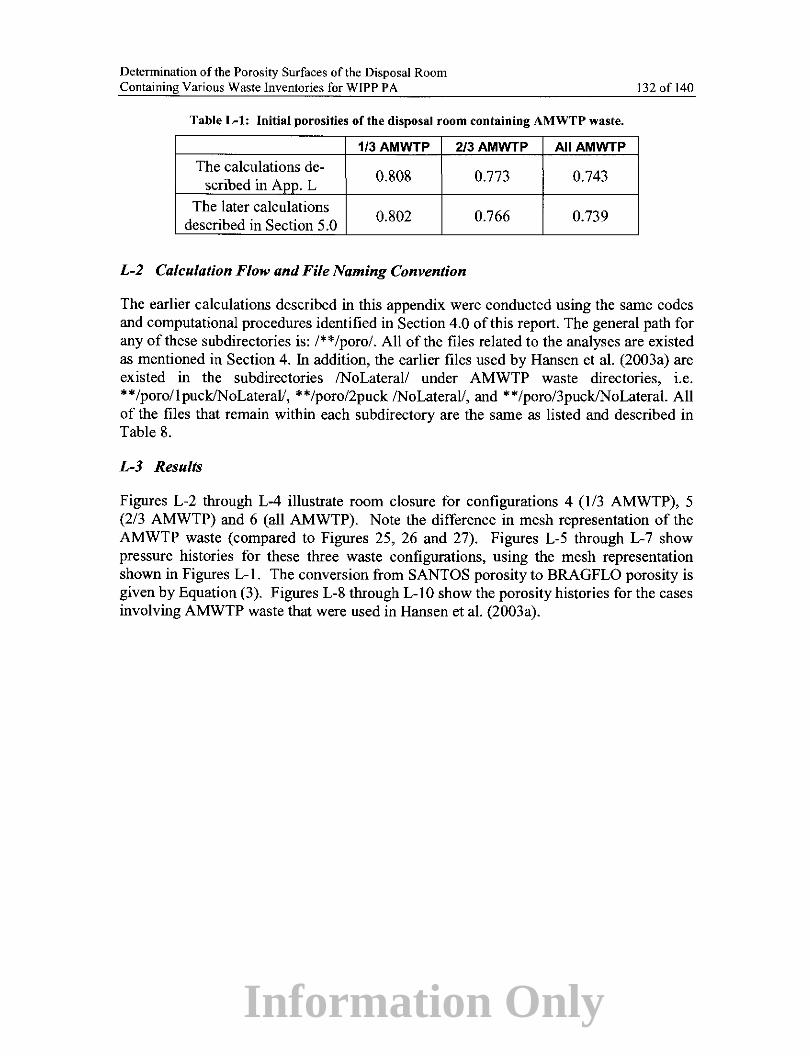
Information Only
Determination of the Porosity Surfaces of the Disposal Room Containing Various Waste Inventories for WIPP PA
Table L-1: Initial porosities of the disposal room containing AMWTP waste.
1/3AMWTP 2/3AMWTP All AMWTP
The calculations de-0.808 0.773 0.743 scribed in Aoo. L
The later calculations 0.802 0.766 0.739 described in Section 5.0
L-2 Calculation Flow and File Naming Convention
132 of 140
The earlier calculations described in this appendix were conducted using the same codes and computational procedures identified in Section 4.0 of this report. The general path for any of these subdirectories is: /**/poro/. All of the files related to the analyses are existed as mentioned in Section 4. In addition, the earlier files used by Hansen et a!. (2003a) are existed in the subdirectories /NoLaterall under AMWTP waste directories, i.e. ** /poro/1 puck/N oLaterall, * * /poro/2puck /No Lateral!, and ** /poro/3puck/N oLateral. All of the files that remain within each subdirectory are the same as listed and described in Table 8.
L-3 Results
Figures L-2 through L-4 illustrate room closure for configurations 4 (113 AMWTP), 5 (2/3 AMWTP) and 6 (all AMWTP). Note the difference in mesh representation of the AMWTP waste (compared to Figures 25, 26 and 27). Figures L-5 through L-7 show pressure histories for these three waste configurations, using the mesh representation shown in Figures L-1. The conversion from SANTOS porosity to BRAGFLO porosity is given by Equation (3). Figures L-8 through L-1 0 show the porosity histories for the cases involving AMWTP waste that were used in Hansen et a!. (2003a).

Information Only
Determination of the Porosity Surfaces of the Disposal Room Containing Various Waste Inventories for WIPP PA
Oyear 7yea"'
r i' I
10,000 years 1,000years
133 of !40
-c.....,_ --
Ri ~··~
... u1111· .·m·~~····,. ~~~~·. 300 years
Figure L-2. Close-up view of the deformed disposal room containing the 1/3 AMWTP + 2/3 standard waste for _r-o.o (earlier calculations).
Oyea•
10,000 years
~ 141
7yea"'
1,000 years
Fi 23years
~
300 years
--- $tQo(iofdWQN ---
Figure L-3. Close-up view of the deformed disposal room containing the 2/3 AMWTP + 1/3 standard waste at 10,000 years for _r-o.o (earlier calculations).

Information Only
Determination of the Porosity Surfaces of the Disposal Room Containing Various Waste Inventories for WIPP PA
-
r ' ':: c: ~ : -i •. r ' i I ~-
" :: ;····---· I
f '
,-, f _,
" Oyear
10,000 years 1,000 years
134 of 140
• wasta
...n..24years
Figure L-4. Close-up view of the deformed disposal room containing all AMWTP waste for .f-=0.0 (earlier calculations).
25
20
&. 15
~
~ "- 10
5
0 0
1/3 AMWTP + 2/3 Standard Waste
t v I I
~ 2DDD 4000 6000 8000
Time (years)
f2 1. 6
-' 1.0
"1
,.,, F0.6 f=O.S
"'-'
'""-' f=Q.1
f=0.05
f=0.025
f=O.O 10000
Figure L-5. Pressure histories for a disposal room containing 1/3 AMWTP + 2/3 standard waste used by Hansen et a!., (2003a)
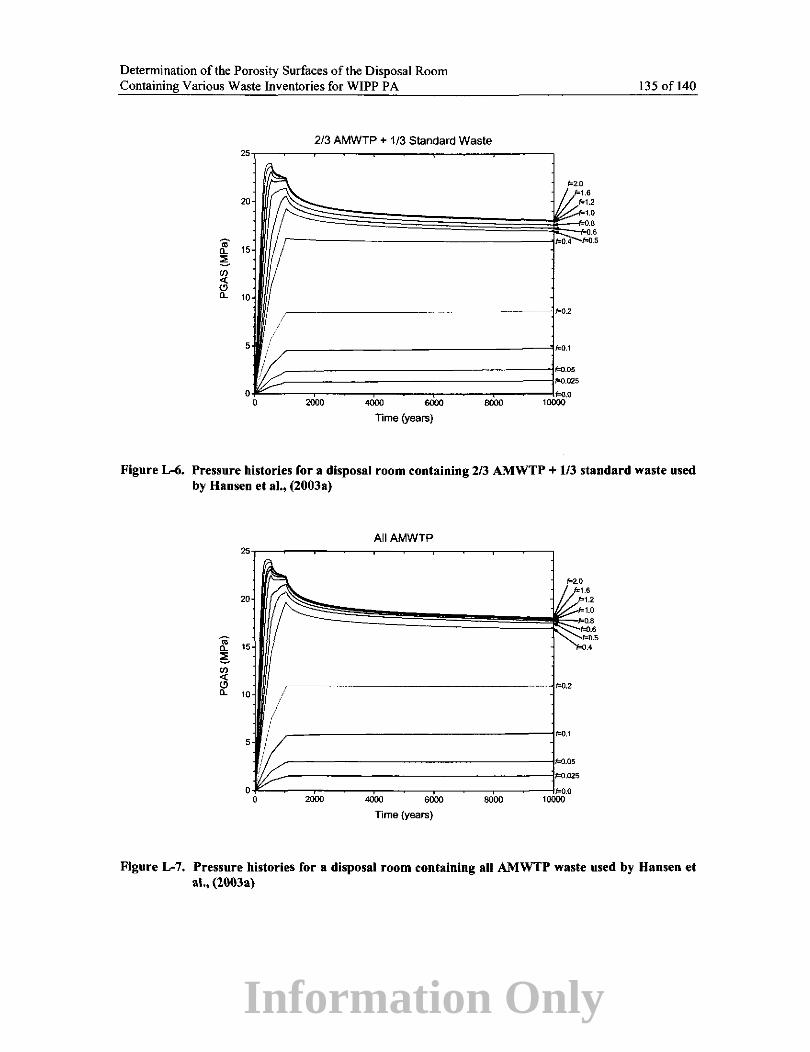
Information Only
Determination ofthe Porosity Surfaces of the Disposal Room Containing Various Waste Inventories for WIPP PA
2/3 AMWTP + 1/3 Standard Waste
20
... 15 n_
5 (f) <(
"' n_ 10
,-----
/ 5 ~-------------------Jf::0.1
0 0 2000
~~~300.05 fi:0.025
f.<J.C 4000 6000 8000 1 0000
Time (years)
135 of 140
Figure L-6. Pressure histories for a disposal room containing 2/3 AMWTP + l/3 standard waste used by Hansen et al., (2003a)
20
... 15 n_
5 rtJ <( (!) n_ 10
5
AIIAMWTP
.~----- --------------!fo0.2
/ r------------------1"'·'
------------------------if=0.05 / -~-------------------l1=0.025
-1"--~-~---~---~---~------l~:o.o 2000 4000 6000 8000 1 0000
Time (years)
Figure L-7. Pressure histories for a disposal room containing all AMWTP waste used by Hansen et al., (2003a)

Information Only
Determination ofthe Porosity Surfaces of the Disposal Room Containing Various Waste Inventories for WIPP PA
1.0
0.8 /
0.6 ~ bi::/: ~ --
0.4
0.2
0.0 0 2000 4000 6000
Time (years)
8000
f=2.0 f=1.6
P1.2 .E=1.0 f=O.B
F0.6 ~B:l F0.2
FO.O 1 5 5 r--,"'·" FO.O
10000
l36ofl40
Figure L-8. Porosity histories for a disposal room containing 113 AMWTP + 213 standard waste used by Hansen eta!., (2003a)
1.0
0.8
0.6 ?;- ~ ·;; e 0
11. 0.4
0.2
0.0 0 2000 4000 6000 8000
Time (years)
---
P2.0 1=1.6 f=1.2 F1.0 1=0.8
1=0.6 1=0.5
{;8' .2 -0.1 .05
025 f:O
~r f=O.O
10000
Figure L-9. Porosity histories for a disposal room containing 213 AMWTP + 113 standard waste used by Hansen et al., (2003a)

Information Only
Determination of the Porosity Surfaces of the Disposal Room Containing Various Waste Inventories for WIPP P A
1.0
ft ~
0.8
0.6
0.4
0.2
0.0 0 2000 4000 6000
Time (years)
8000
137 of 140
f.2.0 f.::1.6 f=1.2 f=1.0
f=O.B
""·' f=O.S
f=0.4
f=0.2
\ ~".o. 025
""·1 , ... ""·'
10000
Figure L-10. Porosity histories for a disposal room containing all AMWTP waste used by Hansen et at., (2003a)
1.0
0.8
0.6 ~ ., e 0
.~ ;e ~'. '
~·
' ' . ' . ' . ' ' . .. . . . . . 0 0 ' . . . a. 0.4
0.2
-This Report . Hansen et al., 2003
0.0 0 2000 4000 6000
Time (years)
' ' . . ' ' . . . . 0 .
8000
. ' . .
f:2.0 f=1.6
f=t.2 f=1.0 F0.8
""·' 5 4 ""· • 1'=0.2
f=O.t . F0.05 1'=0.025 f=O.O
10000
Figure L-ll: Porosity histories for a disposal room containing l/3 AMWTP + 2/3 standard waste: Solid lines are for the results of this report and symbols are for the earlier results used by Hansen et at., (2003a)

Information Only
Determination of the Porosity Surfaces of the Disposal Room Containing Various Waste Inventories for WIPP PA
1.0,-----~---~---~---~------,
0.2
--This Report Hansen et al., 2003
o.o+----~---~---~---~------4 0 2000 4000 6000 BODO 10000
Time (years)
l38ofl40
Figure L-12: Porosity histories for a disposal room containing 2/3 AMWTP + 1/3 standard waste: Solid lines are for the results of this report and symbols are for the earlier results used by Hansen et al., (2003a)
"" ·;; e 0 n.
1.0
f; '~
0.8
0.6
\'--' '
0.4
0.2
--This Report . Hansen et al., 2003
0.0 0 2000 4000
~~
"----....---l~~.....-~~
~ ~~~~-
' ' ' ' '
f=2.0 f=1.6
f=1.2 1=1.0
f=O.S
"'·' "'·' f={J.4
f=0.2
f=0.1
/=0.05 f=0.025 /=0.0
6000 8000 10000
Time (years)
Figure L-13: Porosity histories for a disposal room containing all AMWTP waste: Solid lines are for the results of this report and symbols are for the earlier results used by Hansen et al., (2003a)

Information Only
Determination of the Porosity Surfaces of the Disposal Room Containing Various Waste Inventories for WIPP PA 139 ofl40
Figures L-11 through L-13 compare the porosity histories for the earlier calculations (used by Hansen eta!., 2003a) with the results of the calculations described in Section 5.0 of this report.
For the values offless than 0.4, the porosities from the early calculations are higher than the porosities shown in Section 5.0, because the lateral deformation of the AMWTP waste was not considered in the earlier analyses. This is because the AMWTP wastes in those earlier calculations impede the inward movement of the wall: in other words, the AMWTP container stacks are fixed after the roof contacts the top of the stacks. In contrast, the movement of the AMWTP containers due to room closure is considered in later calculations, leading to smaller room volume and lower porosity.
For values off greater than 0.4, the room is inflated by generated gas pressure, the lateral deformation of the AMWTP is less of a factor, and the porosity histories of earlier calculations are almost the same as the later calculations.
References
Hansen, C.W., L.H. Brush, M.B. Gross, F.D. Hansen, B.Y. Park, J.S. Stein and T.W. Thompson. 2003a, Effects of Supercompacted Waste and Heterogeneous Waste Emplacement on Repository Performance, Revision I, ERMS#532475, Sandia National Laboratories, Carlsbad NM.
Hansen, C.W., L.H. Brush, F.D. Hansen, J.S. Stein. 2003b, Analysis Plan for Evaluating Assumptions of Waste Homogeneity in WIPP Performance Assessment (AP-107), Revision I. Sandia National Laboratories, Carlsbad, NM., ERMS 531067.
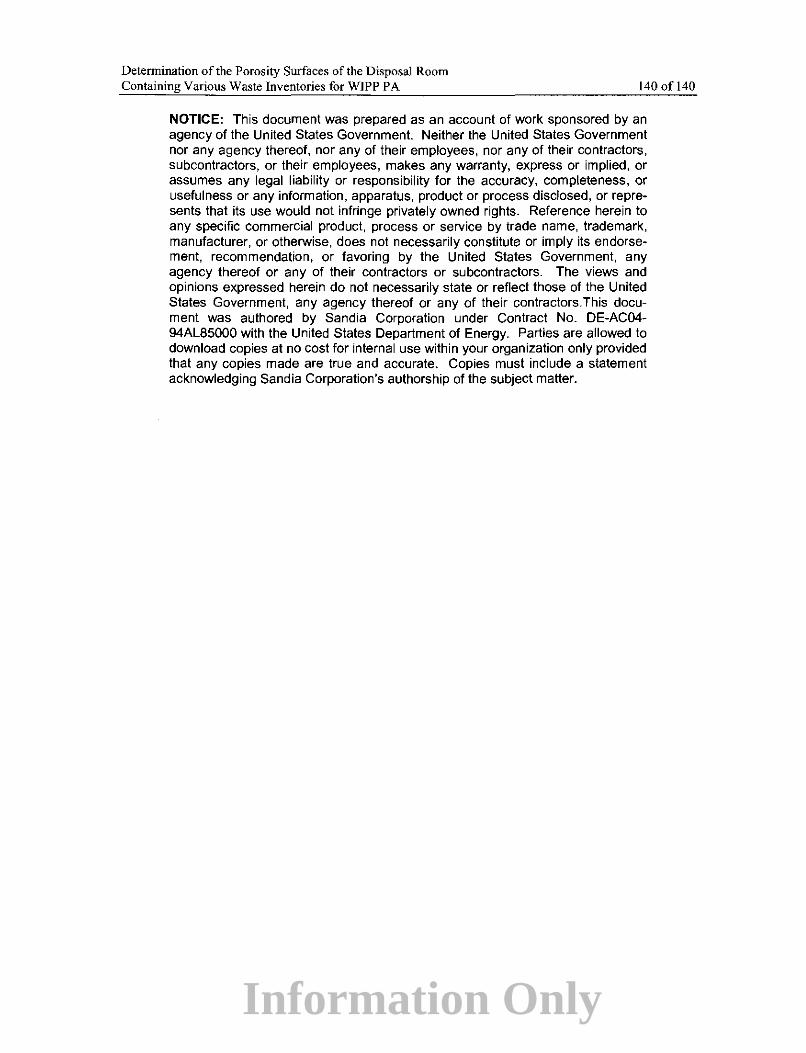
Information Only
Determination of the Porosity Surfaces of the Disposal Room Containing Various Waste Inventories for WJPP PA 140ofl40
NOTICE: This document was prepared as an account of work sponsored by an agency of the United States Government. Neither the United States Government nor any agency thereof, nor any of their employees, nor any of their contractors, subcontractors, or their employees, makes any warranty, express or implied, or assumes any legal liability or responsibility for the accuracy, completeness, or usefulness or any information, apparatus, product or process disclosed, or represents that its use would not infringe privately owned rights. Reference herein to any specific commercial product, process or service by trade name, trademark, manufacturer, or otherwise, does not necessarily constitute or imply its endorsement, recommendation, or favoring by the United States Government, any agency thereof or any of their contractors or subcontractors. The views and opinions expressed herein do not necessarily state or reflect those of the United States Government, any agency thereof or any of their contractors.This document was authored by Sandia Corporation under Contract No. DE-AC04-94AL85000 with the United States Department of Energy. Parties are allowed to download copies at no cost for internal use within your organization only provided that any copies made are true and accurate. Copies must include a statement acknowledging Sandia Corporation's authorship of the subject matter.

Information Only
Park, B Yoon
From: Sent: To: Cc: Subject:
To whom it may concern.
p-jf'i ~? Hansen, Francis D Thursday, December 11, Park, Byoung Yoon Shoemaker, Paul E
10:06 AM
Delegation of signature authority
Dr. Park has signature authority for our two technical reports concerning: 1) the POP and 2) the Porosity Surface. Also, as primary author, Dr. Park has authority to resolve technical, quality, and management review issues associated with these reports.
Frank Hansen
1

Information Only
Message
Park, Byoung Yoon
From: Thompson, Bill [[email protected]
Sent: Wednesday, December 17, 2003 10:37 AM
To: 'Park, Byoung Yoon'; Tom W Pfeifle {twpfeif@sandi ov)
Subject: RE: Park and Hansen review
Tom: You have my signature authority for the referenced report Bill
-----Original Message-----From: Park, Byoung Yoon [mailto:[email protected]] Sent: Wednesday, December 17, 2003 9:27AM To: 'Thompson, Bill' Subject: RE: Park and Hansen review
Hi Bill,
Page 1 of 2
I need your signature authority for our technical report, the porosity surface, as technical reviewer. I think Tom Pfeifle is adequate. Could you please give him an authority?
Thank you, Byoung-Yoon
-----Original Message-----From: Thompson, Bill [mailto:[email protected]] Sent: Monday, December 15, 2003 3:01 PM To: 'Hansen, Clifford W'; Park, Byoung Yoon; Thompson, Bill Cc: Pfeifle, Tom W; Chavez, Mario Joseph Subject: RE: Park and Hansen review
Byoung-Yoon: I have added my suggestions to Cliffs in the attached file. Bill
-----Original Message-----From: Hansen, Clifford W [mailto:[email protected]] Sent: Monday, December 15, 2003 1:49PM To: Park, Byoung Yoon; 'Thompson, Bill'
12/17/2003
Cc: Pfeifle, Tom W; Chavez, Mario Joseph Subject: RE: Park and Hansen review
Byoung-Yoon,
My suggestions are typed into this document.
The additional reference (Hansen et al., 2003b) is
Hansen, C.W., L.H. Brush, F.D. Hansen, J.S. Stein. 2003. Analysis Plan for Evaluating Assumptions of Waste Homogeneity in WIPP Performance Assessment (AP-107), Revision 1. Sandia National Laboratories. Carlsbad, NM. ERMS 531067.

Information Only
Message
-----Original Message----From: Park, Byoung Yoon Sent: Monday, December 15, 2003 1:09 PM To: 'Thompson, Bill' Cc: Hansen, Clifford W; Pfeifle, Tom W; Chavez, Mario Joseph Subject: RE: Park and Hansen review
Dear Dr. Thompson,
Page 2 of 2
Attached is the appendix L for comparing between the earlier calculation and this report. Please review it and give me comments.
Thank you, Byoung-Yoon
-----Original Message-----From: Thompson, Bill [mailto:[email protected]] Sent: Friday, December 12, 2003 2:59PM To: Cliff Hansen; Tom W Pfeifle ([email protected]); Park, Byoung Yoon Subject: Park and Hansen review
See attached -call me or email me with any questions: note I have no comments on 6 and 7 'cause Frank has already incorporated my earlier comments. Also note that as of now I have NOT checked calculations due to time constraints. I can do so if required to by Monday
Bill
Attachments are virus free!
This message has been scanned for viruses at the originating end by
Nemx Anti-Virus for MS Exchange Server/IMC
http://www.nemx.com/products/antivirus
Attachments are virus free!
This message has been scanned for viruses at the originating end by
Nemx Anti-Virus forMS Exchange Server/IMC
http://www .nemx.com/products/antivi rus
12/17/2003