Container Shipping - Homepage | Vlaams Instituut voor … vessels, such as high cube contain ers,...
34
12 Container Shipping Theo Notteboom 12.1 Introduction The container shipping industry consists of shipping companies with as core activity the transportation of containerized goods over sea via regular liner services. A liner service is "a fleet of ships, with a common owner- ship or management, which provide a fixed service, at regular intervals, between named ports, and offer transport to any goods in the catchment area served by those ports and ready for transit by their sailing dates" (Stopford 1997: 343). Container liner serv- ices are specifically focused on the transport of a limited range of standardized unit loads: the twenty-foot dry-cargo container or TEU and the forty-foot dry-cargo con- tainer or FEU. Occasionally, slightly diverg- ing container units ar e also loaded on container vessels, such as high cube contain- ers, tank and open-top containers and 45- foot containers. The diversity in unit loads in the container shipping industry is low due to the need for uniformity when stack- ing containers below and on the deck of specialized container vessels. Container shipping has a dynamic history of only 55 years. The launching of the first container ship, Ideal X, by Malcolm McLean in 1956 can be considered as the beginning of the container era. In the early years of container shipping, vessel capacity remained very limited in scale and geographical deployment, and the ships used were simply converted tankers. Shipping companies and other logistics players hesitated to embrace the new technology as it required large capital investments in ships, terminals and inland transport. The first transatlantic con- tainer service between the US East Coast and Northern Europe in 1966 marked the start of long-distance containerized trade. The first specialized cellular container ships were delivered in 1968, and soon the con- tainerization process expanded over mari- time and inland freight transport systems (Levinson 2006; Rodrigue and Notteboom 2009a). Container shipping developed rapidly because of the adoption of standard container sizes in the mid-1960s and the awareness of industry players of the advan- tages and cost savings resulting from faster vessel turnaround times in ports, a reduc- tion in the level of damages and associated insurance fees, and integration with inland transport modes such as trucks, barges and The Blackwell Companion to Maritime Economics, Pirst Edition. Edited by Wayne K. Talley. © 2012 Blackwell Publishing Ltd. Published 2012 by Blackwell Publishing Ltd.
Transcript of Container Shipping - Homepage | Vlaams Instituut voor … vessels, such as high cube contain ers,...

12
Container Shipping
Theo Notteboom
12.1 Introduction
The container shipping industry consists of shipping companies with as core activity the transportation of containerized goods over sea via regular liner services. A liner service is "a fleet of ships, with a common ownership or management, which provide a fixed service, at regular intervals, between named ports, and offer transport to any goods in the catchment area served by those ports and ready for transit by their sailing dates" (Stopford 1997: 343). Container liner services are specifically focused on the transport of a limited range of standardized unit loads: the twenty-foot dry-cargo container or TEU and the forty-foot dry-cargo container or FEU. Occasionally, slightly diverging container units are also loaded on container vessels, such as high cube containers, tank and open-top containers and 45-foot containers. The diversity in unit loads in the container shipping industry is low due to the need for uniformity when stacking containers below and on the deck of specialized container vessels.
Container shipping has a dynamic history of only 55 years. The launching of the first
container ship, Ideal X, by Malcolm McLean in 1956 can be considered as the beginning of the container era. In the early years of container shipping, vessel capacity remained very limited in scale and geographical deployment, and the ships used were simply converted tankers. Shipping companies and other logistics players hesitated to embrace the new technology as it required large capital investments in ships, terminals and inland transport. The first transatlantic container service between the US East Coast and Northern Europe in 1966 marked the start of long-distance containerized trade. The first specialized cellular container ships were delivered in 1968, and soon the containerization process expanded over maritime and inland freight transport systems (Levinson 2006; Rodrigue and Notteboom 2009a). Container shipping developed rapidly because of the adoption of standard container sizes in the mid-1960s and the awareness of industry players of the advantages and cost savings resulting from faster vessel turnaround times in ports, a reduction in the level of damages and associated insurance fees, and integration with inland transport modes such as trucks, barges and
The Blackwell Companion to Maritime Economics, Pirst Edition. Edited by Wayne K. Talley. © 2012 Blackwell Publishing Ltd. Published 2012 by Blackwell Publishing Ltd.

CONTAINER SHIPPING 231
trains. The container and the associated maritime and inland transport systems proved to be very instrumental to the consecutive waves of globalization. Hence, emerging worldwide container shipping networks allowed changes in the economic and transport geography, as they significantly shortened the maritime cost distances between production and consumption centers around the world. Container shipping also became an essential driver in reshaping global supply chain practices, allowing global sourcing strategies of multinational enterprises, pull logistics solutions and the development of global production networks. New supply chain practices in turn increased the requirements on container shipping in terms of frequency, schedule reliability I integrity, global coverage of services and rate setting.
This chapter aims to provide a comprehensive overview of current issues in the container shipping industry. Section 12.2
analyzes mark.et growth and the changing geography in container shipments. Sections 12.3 and 12.4 zoom in on, respectively, the
capacity management issue and the pricing problem in the container shipping industry. Section 12.5 deals with carriers' search for scale and scope in their operations. A last section discusses the evolving nature of the container shipping networks operated by carriers.
12.2 Growth in the Container Shipping Industry
The shipping industry has witnessed spectacular growth in container trade, fueled by the globalization process and the large-scale adoption of the container. Worldwide container port throughput increased from 36 million TEU in 1980 and 88 million TEU in 1990 to about 535 million TEU in 2008. Around 60% of the world port throughput involves laden containers, about 15% are empty containers. The remainder consists of transshipped containers. Sea-sea transshipment shows the strongest growth: it has more than tripled in the last 15 years (see Table 12.1). World container traffic, the
Table 12.1 World container port throughput and its components for selected years (million TEU)
Total port Port-to-port Transshipment Port-to-port Transshipment handling
Full Empty FuU (%) Empty(%) (%)
1990 87.9 57.4 14.6 16.0 100.0 25.4 27.9
1995 145.2 92.1 20.8 32.3 100.0 22.6 35.1
2000 235.4 136.7 36.8 62. 1 100.0 26.9 45.4
2005 399.2 231.3 59.7 108.2 100.0 25.8 46.8
2009 (est.) 478.0 275.0 69.0 134.0 100.0 25.1 48.7
2009 vs +229 +199 +232 +315 1995 (%)
2009 vs +20 +1 9 + 16 + 24 2005 (%)
Sources: Drewry (2006), ITMMA/ ESPO (2007) and estimates 2009.

232 THEO NOTTEBOOM
absolute number of containers being carried by sea, has grown from 28.7 million TEU in 1990 to 152 million TEU in 2008- an average annual increase of 9.5%. The ratio of container traffic over container throughput evolved from 3 in 1990 to around 3.5 in 2008; i.e., a container on average is handled (loaded or discharged) 3.5 times between the first port of loading and the last port of discharge. The changing configuration of liner service networks is at the core of the rise in the average number of port handlings per box (see Section 12.6, "Dynamics in Container Shipping Networks").
With the exception of the year 2009 (when there was a decline in world container traffic of about 12% to 478 million TEU), the container shipping business has always witnessed moderate-to-strong yearon-year growth figures. The pace of growth
18000 ,...._ ;:.,
= 16000 Q
"' "' QI
= 14000 ! = Q
"' 12000 ~ ...... ;:i f;a;l !--<
10000
0 8000 0 0 ......
·= 6000 QI
-= .. "' ... 4000 "' QI
= ·; ... = 2000 Q u
even accelerated in the period 2002- 8, partly as a result of the "China effect" in the world economy. The absolute rise of container traffic is the result of the interplay of economic, policy-oriented and technological factors. World trade was facilitated through the mitigation of trade barriers and the introduction of market liberalization and deregulation. Market liberalization also enhanced the development of logistics throughout the world.
The center of gravity of the container business is shifting to Asia. During the last twenty years the transatlantic container trade has gradually lost its dominance to the transpacific and Europe-Far East trades, with large volumes moving from Asia to North America and Europe (Figure 12.1). The container ports in East Asia handled 19.8% of the global container throughput
--.-Asia-USA
---USA- Asia ..,._Asia- Europe
~Europe-Asia
~USA-Europe
--- Europe- USA
0 +----,,.---.~-.---,,--.~-.---,,~-.~-.---,.--.~-.-~.--.
°'°'\:) °'°'"' °'°''o °'°'" °'°'co ~\:)r;::, ~\:)" ~r:::,"V \:)r:::,"> r:::,~ \:)\:)"' \:)\:)'o \:)~ \:)\:)co ' ' ' ' ' ~ ~ ~ ~ ~ ~ ~ ~ ~
Figure 12.1 Container trade on the main routes, in TEU (full containers). Source: own elaboration based on data in various reports of Drewry and UNCTAD, Review of Maritime Transport.

CONTAINER SHIPPING 233
in 1980. In 2008, their share had increased to about 37%. Ports in Southeast Asia saw a steep rise in their joint market share, from 4.8% in 1980 to around 14% in 2008. In contrast, Western Europe saw its share fall from 30.3% (then the highest in the world) to about 18% in the same period. North America also witnessed its share declining, from 24.5% (then the second-highest in the world) to less than 10%. The dominance of Asia is also reflected in world container port rankings (Table 12.2). In 2009 fourteen of the twenty busiest container ports came from Asia, mainly from China. In the mid-1980s there were only six Asian ports in the top twenty, mainly Japanese load centers. The top twenty container ports represented 46% of the world container port throughput in 2009, the top five an elevated 21.3%.
Table 12.3 provides a list of the main container-handling regions in the world. The share of gateway traffic in total container throughput tends to differ quite significantly between the gateway regions. The Singapore region primarily acts as a sea- sea transshipment platform (that is, it functions mainly as a hub, not as a gateway), whereas the seaport system in the Yangtze Delta, for instance, is a true multi-port gateway region, giving access to vast service areas in the Delta and along the Yangtze River. Moreover, some multi-port gateway regions feature a high density of port terminals in a small geographical space, while other regions cover larger areas with interport distances of up to 350km. The RhineScheldt Delta region in Europe was the main container-handling region in the world till the early 1990s. From that moment on Asia took over the leadership. One out of every ten containers handled worldwide is handled in ports of the Pearl River Delta. The joint cargo throughput of the ten port
regions considered constitutes almost half of the world container port handlings. Within the region of East Asia, exportoriented industrialization policies adopted by Hong Kong, Taiwan and South Korea sustained a strong growth in the container throughput handled by these economies from the 1980s. China developed similar strategies in the late 1980s, which resulted in elevated growth, first in the Pearl River Delta and later also in the Yangtze Delta port system and the Bohai Bay region. In recent years Shanghai, Guangzhou, Shenzhen, Qingdao and Ningbo joined Hong Kong and Singapore in the list of busiest container ports in the world. The future could see more Chinese ports entering the ranks of the busiest container ports.
Despite the sustained growth brought about by the containerization process (particularly in relation to Asia), container carriers have always somewhatunderperformed financially compared to other players in the logistics industries. The weaker performance is linked to the combination of capitalintensive operations and high risks associated with the revenues.
12.3 Capacity Management in Container Shipping
12.3.1 Asset management and the capital-intensive nature of the industry
Container shipping is a very capital-intensive industry, in which some assets are owned and others leased and there exists a wide variability in cost bases (Brooks 2000). Asset management is a key component of the operational and commercial success of container shipping lines, since they are primarily asset-based. Common asset management

Table 12.2 Top twenty container ports based on throughput in million TEU (1975-2009)
R 1975 1985 1995 2004 2006 2008 2009 R --
Port mTEU Port mTEU Port mTEU Port mTEU Port mTEU Port mTEU Port mTEU
Rotterdam 1.08 Rotterdam 2.65 Hong Kong 12.55 Hong Kong 21.93 Singapore 24.79 Singapore 29.92 Singapore 25.87
2 ~_. Yodt/NJI 0.95 ~_.y;,m1N1 2.37 Singapore 11.85 Singapore 21.33 Hong Kong 23.31 Shanghai 27.98 Shanghai 25.00 2
3 Kobe 0.90 Hong Kong 2.29 Ka ohs.!:!!!!_ 5.23 Shanghai 14.55 Shanghai 21.70 Hong Kong 24.25 Hong Kong 20.93 3
4 Hong Kong 0.80 Kobe 1.52 Rotterdam 4.79 Shenzhen 13.66 Shenzhen 18.46 Shenzhen 21.41 Shenzhen 18.25 4
5 Kcelung 0.56 Antwerp 1.35 Busan 4.50 Busan 11.43 Busan 12.04 Busan 13.43 Busan 11.95 5
6 t::J 0.52 Yokohama 1.33 Hamburg 2.89 Kaohsiung 9.71 Kaohsiung 9.77 Dubai I 1.83 Guangzhou 11.19 6 ,__ -- --7 0.48 Hamburg 1.16 Yokohama 2.76 Rotterdam 8.22 Rotterdam 9.69 Ningbo 11.23 Dubai 11.10 7
8 0.41 Keelung 1.16
EJ 2.56 ~~ 7.32 Dubai 8.92 ~gz~ 11.00 Ningbo 10.50 8
~Beach I ~ ~ -9 0.39 Busan 1.15 2.39 Hamburg 7.00
b burg 8.86 Rotterdam 10.83 Qingdao 10.26 9
10 Melbourne 0.36 ~ 1.14 2.33 Dubai 6.42 ~1es l 8.47 Qingdao I0.32 ·Rotterdam , 9.74 10
Tokyo ---,
Qingdao liiambu; Tianjin 11 0.36 1.10 Ort/ 2.28
c;~, 6.06 7.70 9.74 8.70 11
12 IAn;,e~ 0.36 Tokyo 1.00 Tokyo 2.18 5.78 l;ft&Beach I 7.29 Kaohsiung 9.68 ~g 8.58 12 •
13 Yokohama 0.33 Bremethavcn 0.99 Keelung 2.17 Port Kelang 5.24 Ningbo 7.07 Antwerp 8.66 Antwerp 7.31 13 ..... I 14 Hamburg 0.30 Sanjuan 0.88 Dubai 2.07 Qingdao 5.14 Antwerp I 7.02 Tianjin 8.50 Port Kelang 7.31 14
Sydney IOaklwl 15 Harbour 0 .26 1 0.86 Felixstowe 1.90 INI I 4.47 Guangzhou 6.60 Port Kelang 7.97 Hamburg 7.01 15

Tanjung 16 Sanjuan 0.26 !Sede ..... j 0.85 Manila 1.67 Pelepas 4.02. Port Kelang 6.33 ~ 7.85 Lcwgkf 6.70 16
Tanjung
17 Tilbury 0.23 Bremerhavcn 0.83 Sanjuan 1.59 Ningbo 4.01 Tianjin 5.95 ~e..ch I 6.49 Pelepas 6 .02 17 -Tanjung
18 Le Havre 0.23 Dunkirlt 0.71 IOlklend .. I 1.55 Tianjin 3.81 t.icwYOC'k/~ 5.13 Pclepas 5.60 '1:.aia.r_Bac:b I 5.07 18
Laem Tanjung
19 Kaohsiung 0.23 ~ I 0.71 Shanghai 1.53 Cha bang 3.62 Pelepas 4.77 Bremerhaven 5.60 Xiamen 4.68 19
La em -20 ~J 0.21 jeddah 0.68 Bremerhaven 1.53 Tokyo 3.58 Bremerhaven 4.45 5.27 Chabang 4.64 20
Top 20 9.2 Top 20 24.7 Top20 70.3 Top20 167.3 Top 20 208.3 Top20 247.5 Top20 22.0.8
World total 24.l World total 57.4 World total 145.2 World total 354.5 World total 440 World total 535 World total 478
Share of top Share of top Share of top Share of Share of top Share of top Share of
20 38.3% 20 43.1% 20 48.4% top 20 47.2% 20 47.3% 20 46.3% top 20 46.2%
Share of top Share of top Share of top Share of Share of top Share of top Share of
10 26.8% 10 28.1% 10 35.7% top 10 34.3% 10 33.2% 10 32.2% top 10 32.4%
Share of top Share of top Share of top Share of Share of top Share of top Share of
5 17.9% 5 17.7% 5 26.8% top 5 23.4% 5 22.8% 5 21.9% top 5 21.3%
Source: own elaboration based on the statistics of the respective port authorities.

Table 12.3 The ranking of major container handling regions in the world (in million TEU)
Clu.stcr Main container Di.stanc~a 1985 R 1990 R 1995 R 2000 R 2004 R 2006 R 2007 R 2008 R 2009 R S' ports (lcm) (%)
Pearl River Hong Kong. 130 2.34 3 5.37 3 13.74 1 24.26 1 40.16 1 49.95 1 55.98 1 58.30 1 51.87 1 10.9
Delta Shenzhen, Guangzhou,
Zhongzhan, Jiuzbou
Malacca Singapore, Port 340 1.70 6 5.56 2 12.98 2 20.66 2 30.41 2 35.88 2 40.27 2 43.49 2 39.20 2 8.2
Straits Klang. Tanjung Pelepas
Yangtze Shanghai, Ningbo 180 0.20 9 0.47 10 1.69 9 6.51 7 18.56 3 28.78 3 35.51 3 39.21 3 35.50 3 7.4
River Delta
Bohai Bay Dalian, Qingdao, 350 0.20 10 0.55 9 1.68 10 4.84 9 11.16 7 16.86 5 20.37 5 23.05 4 23.51 4 4.9
Tianjin Rhine- Rotterdam, 105 4.20 1 5.62 1 7.74 3 11.38 3 15.59 4 18.67 4 21.37 4 22.08 5 19.58 5 4.1
Scheidt Antwerp, Delta Zeebrugge,
Amsterdam

Korean Busan, 135 Ll6 7 2.35 7 4.50 6 8.18 5 13.28 6 13.79 7 14.53 7 14.30 8 12.79 6 2.1 Twin Gwangyang
Hub
San Pedro Los Angdes, Long 10 2.25 4 3.71 4 5.40 4 9.48 4 13.10 5 15.76 6 15.67 6 14.34 7 11.77 7 2.5
Bay Beach
Hclgoland Hamburg, 95 2.15 5 3.13 6 4.41 7 7.03 6 10.52 8 13.31 8 14.80 8 15.19 6 11.57 8 2.4
Bay Bremcrhaven,
Wilhelms haven
Gulf/ Dubai 150 0.30 8 0.92 8 2 .07 8 3.05 10 6.42 10 8.92 9 10.71 9 11.83 9 11.10 9 2.3
Emirates Tokyo Bay Tokyo, Yokohama, 50 2.46 2 3.37 5 5.16 5 5.63 8 6.59 9 7.20 10 7.62 JO 7.68 JO 6.92 JO 1.4
Shimizu Total of 10 clusters 16.94 31.04 59.37 101.02 165.79 209.12 236.83 249.4 7 223.81
Total world port container 57.4 87.9 145.2 235.4 354.5 440 492 535 478
throughput
Share of I 0 clusters 29.5% 35.3% 40.9% 42.9% 46.8% 47.5% 48.1% 46.6% 46.8%
'Longest distance between competing ports in the cluster. b Share of cluster in world port throughput. Source: own elaboration based on the statistics of the respective port authorities.
238 THEO NOTIEBOOM
decisions for shipping lines include management of the equipment to reduce downtime and operating costs, increase the useful service life and residual value of vessels, increase equipment safety and reduce potential liabilities, and reduce costs through better capacity management.
Container shipping lines are particularly challenged to develop an effective asset management program for the fleet they own or operate. Vessel life cycle management includes the procurement, acquisition, deployment and disposal of container vessels. Fleet capacity management is complex, given the inflexible nature of vessel capacity in the short run due to fixed timetables, the seasonality effects in the shipping business and cargo imbalances on trade routes. Lines vie for market share and capacity tends to be added as additional loops (i.e. in large chunks) to already existing services. Lines incur high fixed costs in this process. For example, eight to ten ships are needed to operate one regular liner service on the Europe-Far East trade, and
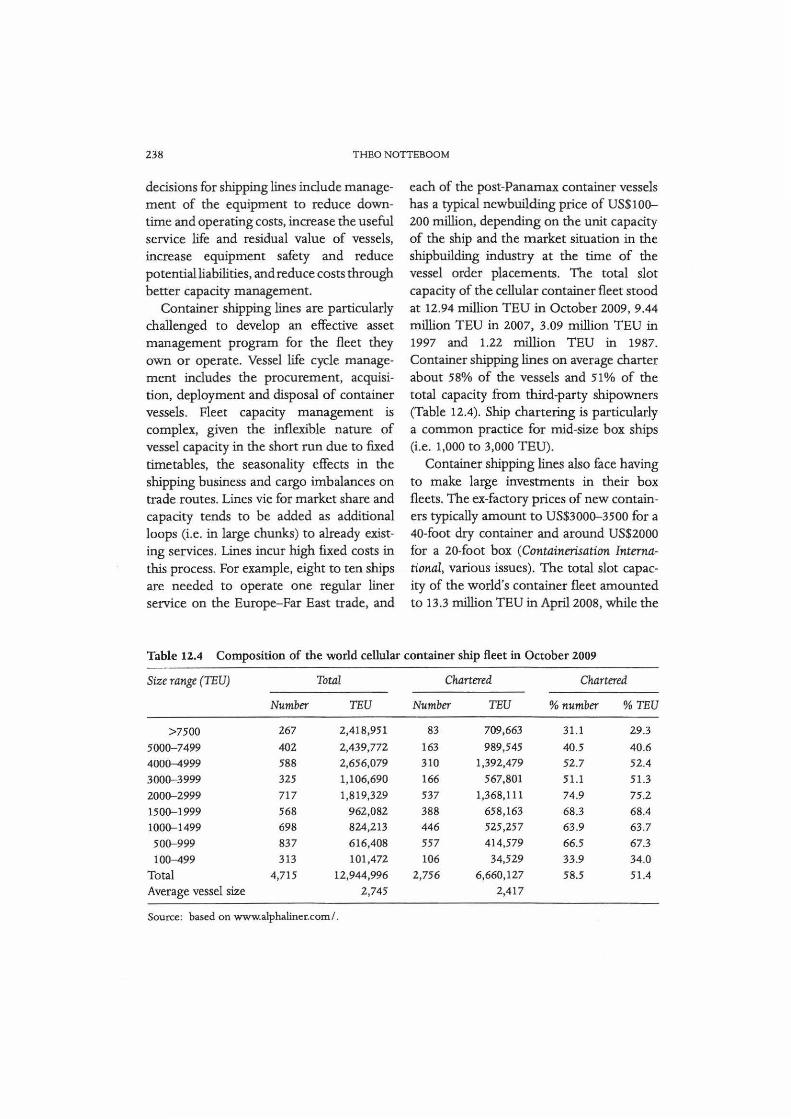
each of the post-Panamax container vessels has a typical newbuilding price of US$100-200 million, depending on the unit capacity of the ship and the market situation in the shipbuilding industry at the time of the vessel order placements. The total slot capacity of the cellular container fleet stood at 12.94 million TEU in October 2009, 9.44 million TEU in 2007, 3.09 million TEU in 1997 and 1.22 million TEU in 1987. Container shipping lines on average charter about 58% of the vessels and 51% of the total capacity from third-party shipowners (Table 12.4). Ship chartering is particularly a common practice for mid-size box ships (i.e. 1,000 to 3,000 TEU).
Container shipping lines also face having to make large investments in their box fleets. The ex-factory prices of new containers typically amount to US$3000-3500 for a 40-foot dry container and around US$2000 for a 20-foot box (Containerisation International, various issues). The total slot capacity of the world's container fleet amounted to 13.3 million TEU in April 2008, while the
Table 12.4 Composition of the world cellular container ship fleet in October 2009
Size range (TEU) Total Chartered Chartered
Number TEU Number TEU % number %TEU
>7500 267 2,418,951 83 709,663 31.1 29.3 5000-7499 402 2,439,772 163 989,545 40.5 40.6 4000-4999 588 2,656,079 310 1,392,479 52.7 52.4 3000-3999 325 1,106,690 166 567,801 51.1 51.3 2000-2999 717 1,819,329 537 1,368,111 74.9 75.2 1500-1999 568 962,082 388 658,163 68.3 68.4 1000-1499 698 824,213 446 525,257 63.9 63.7 500-999 837 616,408 557 414,579 66.5 67.3 100-499 313 101,472 106 34,529 33.9 34.0
Total 4,715 12,944,996 2,756 6,660,127 58.5 51.4 Average vessel size 2,745 2,417
Source: based on www.alphaliner.com/.
CONTAINER SHIPPING 239
total box fleet reached 25.36 million TEU (Cl online, May 2008). Thus, the number of containers needed to run a regular container service is about twice the joint TEU capacity of the vessels deployed in that liner service. For example, a container carrier operating a regular service between Europe and Asia with eight vessels of 10,000 TEU needs a box fleet of at least 160,000 TEU to support the service. Theofanis and Baile (2009) report that container shipping lines and other transport operators own about 59% of the total global container equipment fleet (compared to 53.6% in 2002), while leasing companies own the remaining 41 %.
The large investments in assets and the fixed nature of the liner service schedules, even if the cargo volume is too low to fill the vessel, lie at the core of the risk profile in the container liner shipping industry. High commercial and operational risks are associated with the deployment of a fixed fleet capacity (at least in the short run) within a fixed schedule between a set of ports of call at both ends of a trade route. Unused capacity cannot be stored and used later. Once the large and expensive liner services are set up, the pressure is on to fill the ships with freight. When there is an oversupply of vessels in the market, high fixed costs and product perishability give shipping lines an incentive to fill vessels at a marginal cost-only approach, often leading to direct operational losses on the trades considered.
12.3.2 The drive towards scale enlargement in vessel size
Since the 1990s a great deal of attention has been devoted to larger, more fuel-efficient vessels (see for example Cullinane and
Khanna 1999). The average vessel size increased from 1,155 TEU in 1987 to 1,581 TEU ten years later, 2,417 TEU in 2007 and 2,618 TEU in 2009 (UNCTAD 2009). The mid-1970s brought the first ships of over 2,000 TEU capacity. The Panamax vessel of 4,000 to 5,000 TEU was introduced in the early 1990s. In 1989 APL was the first shipping line to deploy a post-Panamax vessel. Maersk Line introduced the Regina Maersk (nominal capacity of 6,418 TEU but "stretchable" to about 8,000 TEU) in 1996. Ten years later the Emma Maersk of around 13,500 TEU capacity was the first vessel to move far beyond the 10,000 TEU mark. Given the relentless search for cost savings at sea (through economies of scale), many shipping lines' expansion plans are heavily focused towards large post-Panamax (500o+ TEU) container ships. Whereas 78 of such ships provided a total slot capacity of just 464,000 TEU at the beginning of 2000, these numbers already amounted to 504 units and 3.3 million TEU at the beginning of 2007 and 669 units and nearly 4.9 million TEU at the end of 2009 (Table 12.5). Whereas 5000+ TEU ships provided just 10% of the total cellular fleet capacity at the beginning of 2000, their share increased to 37.5% at the end of 2009. The total fleet in late 2009 counted 39 vessels in the range of 10,000-15,500 TEU, and another 168 vessels of above 10,000 TEU unit capacity were on order. The massive influx of new tonnage and the cascading-down effect triggered by the introduction of large post-Panamax ships on the arterial trade routes invoked a significant increase in average vessel sizes on the main trade routes. For example, the size of a typical container vessel deployed on the Far East-Europe trade increased from 4,500-5,500 TEU in 2000 to about 7,500 TEU in 2010.

Table IZ.5 Composition of the cellular container ship fleet for selected dates
Size range (TEU) Order book Oct. 2009 Oct. 1 o, 2009 ]an. 1, 2007 ]an. 1,2000 ]an. 1, 1995
Number TEU Number TEU Number TEU Number TEU Number TEU
>7500 Z58 2,914,640 267 2 ,418,951 147 1,250,003 10 80,8ZZ 0 0
5000-7499 116 760,150 40Z 2,439,772 357 Z,070,373 68 383,415 0 0
400Q-4999 194 869,607 588 Z,656,079 346 1,529,854 156 682,428 79 345,351
3000-3999 45 156,020 325 1,106,690 282 956,165 227 770,410 164 541,516
2000-2999 60 156,166 717 1,819,329 648 1,630,850 389 960,443 255 637,502
1500-1999 56 98,357 568 962,082 466 786,591 327 552,003 198 339,511
1000-1499 71 84,439 698 824,213 595 705,600 484 565,073 367 433,533
500-999 65 52,511 837 616,408 722 525,853 539 381,630 336 239,439
lOQ-499 0 0 313 101,472 387 122,944 422 132,484 343 107,046
Total 865 5,091,890 4,715 12,944,996 3,950 9,578,233 2,622 4,508,708 1,742 2,643,898
Average vessel size 5,887 2,745 2,425 1,720 1,518
Source: based on www.alphaliner.com/.

CONTAINER SHIPPING 241
The focus of container carriers on vessel sizes did not lead to a more stable market environment. Consecutive rounds of scale enlargements in vessel size have reduced the slot costs in container trades, but carriers have not reaped the full benefits of economies of scale at sea (see for example Lim 1998). The large container vessels can be deployed efficiently on the major trade lanes, provided they are full. Many carriers have not been able to realize consistent high utilization of available slot capacity on their bigger vessels, which would have offset some of the scale advantages. Unpredictable business cycles and the seasonality on some of the major trade lanes (e.g. demand peak just before Chinese New Year) have more than once resulted in unstable cargo guarantees to shipping lines. Adding post-Panamax capacity gave a short-term competitive edge to the early mover, putting pressure on the followers in the market to upgrade their container fleet and avert a serious unit cost disadvantage. A boomerang effect eventually also hurt the carrier who started the vessel scaling up round.
The economic slowdown since late 2008
has had its consequences on vessel size. There is a common belief that the market will not see an increase in the maximum size of container vessel for at least the next five years. The Emma Maersk class and comparable vessel sizes of MSC ( cf. the MSC Beatrice of around 14,000 TEU) are thus expected to form the upper limit in vessel size, at least for the coming years. The crisis has also urged shipping lines to rationalize services and to cascade larger vessels downstream to secondary trade routes. There is also a renewed interest in "baby post-Panamax" ships with unit capacities ranging from 5,000 to 7,500 TEU. These ships are more flexible, since they can
be deployed in routes to emerging markets, where port systems typically face draught and berth limitations.
12.3.3 Operational strategies to absorb vessel overcapacity
The container shipping industry goes through consecutive cycles of vessel oversupply and capacity shortages. However, the periods with vessel overcapacity are generally much longer, as shipowners massively order new ships when demand is surging and the peak in demand is near. In recent years, fleet investments have been facilitated by the ease of getting ships financed, low interest rates and superoptimism about future demand. Overcapacity situations are often sustained as a result of a vicious circle which takes many years to dissolve. It is very difficult to absorb overcapacity, for several reasons. First of all, shipyards are not eager to give in to requests of shipowners to cancel orders or delay deliveries. Secondly, oversupply in the market results in a weak second-hand market for ships, low charter prices and low newbuilding prices. Third, shipowners are not eager to reduce capacity by scrapping vessels, as scrap prices are low in a weak market. The four main segments of the shipping sector (shipbuilding, charter market, second-hand market and the scrap market) thus actively reinforce the negative downward spiral.
Overall, crises and overcapacity situations in the container shipping industry are partly the result of exogenous factors, such as a decrease in demand, and partly the result of endogenous factors, such as wrong investment decisions by shipping lines. Many of the overcapacity problems are linked to the failure by the key stakeholders,
242 THEO NOTIEBOOM
in the first place the shipowners and providers of ship finance (many without a maritime background), to correctly anticipate the future markets for different ship types and sizes. This observation is in line with the views of Randers and Goluke (2007) on system dynamics in shipping markets. They argue that the turbulence in shipping markets is partly the consequence of the collective action of the members of the shipping community. In principle, one player can exploit the cyclicality for his or her own profit by selling vessels near the peak in freight rates or by not entering the shipping business during extremely good times. But in practice, a common market sentiment means that shipping lines seldom go anti-cyclical. The liner shipping community creates the cyclicality and adds significantly to the volatility of the business environment through investment and allocation decisions. If the container shipping community acted rationally on the available information (on ordering, scrapping, utilization and so on) and better anticipated fluctuations in demand, they could greatly reduce the violent volatility. at least if the regulatory powers would allow them to
collect such information and use it. With the outlawing of liner conferences in Europe since October 2008, market-related information about capacity deployment, demand/supply dynamics and pricing of liner services has become more scarce.
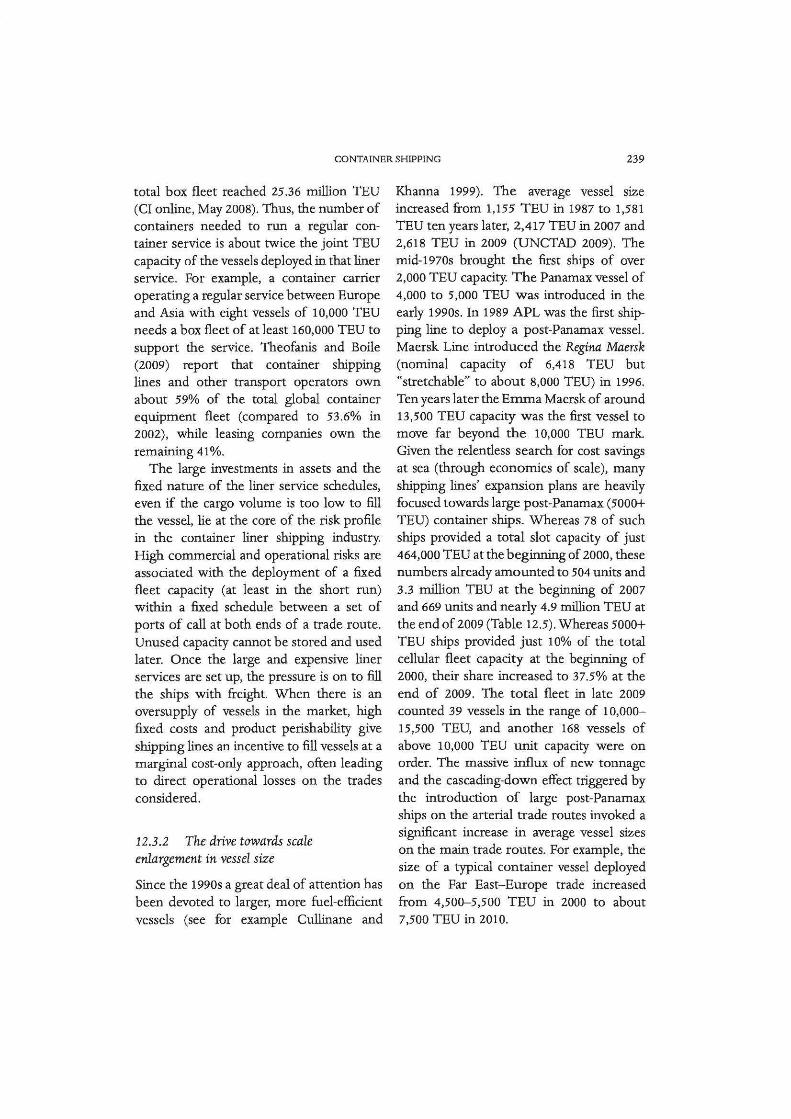
The economic crisis which started in late 2008 provides a good example of the difficulties the container shipping industry has in adapting capacity to changing market conditions. Until early 2008, shipyards struggled to satisfy demand for new and bigger container ships. The economic crisis generated a large surplus of cargo capacities, particularly on the Europe-Asia and transpacific routes. World container shipping demand in TBU-mile fell by 12.4% in 2009. As shipyards were still completing the numerous orders from previous years, total slot capacities in the market would have continued climbing, with 15.6% in 2009, if no action had been taken to absorb some of that capacity (Table 12.6). In late 2008, a number of shipping lines started to postpone orders, and older ships were put out of service in large numbers. Since the late summer of 2008, shipyards have been renegotiating price and delivery dates, with various ship-
Table 12.6 Changes in fleet operations, TBU-mile supply
2006 (%) 2007 (%) 2008 (%) 2009 (est.) (%)
Deliveries of new vessels 14.1 13.1 12.7 15.6
Delayed deliveries from previous years 1.2
Scrapping --0.3 --0.2 --0.9 - 2.0
Newbuilding delivery deferrals 1.0 --0.3 -1.2 - 5.0
Newbuilding cancellations -2.0
Lay- ups/ service suspensions - 10.0
Slow-steaming/ re-routing -1.9 -5.6 - 7.5
Effective supply growth 14.8 10.7 5.0 -9.7
Effective demand growth 12.4 11.3 --0.3 - 12.4
Source: own compilation based on figures from Drewry and Goldman Sachs.

CONTAJNER SHIPPING 243
ping lines looking for delayed deliveries. The total number of cancellations of container ship orders amounted to 140 ships or 436,000 TEU between the start of the financial crisis in September 2008 and midFebruary 2010 (Alphaliner 2010a). The order cancellations represent 6.7% of the container ship order book at October 1, 2008. A limited number of container ship orders were converted into other vessel types by their owners.
Shipping lines also tried to absorb overcapacity by laying up vessels. In mid-April 2009, the worldwide laid-up fleet totaled about 1.3 million TEU or 10.4% of the world container fleet and even reached more than 12% in the fall of 2009. Most of the idled ships were midsize vessels between 1 OOO and 3000 TEU capacity, while hardly any post-Panamax vessels were laid up. The idle container ship fleet decreased to 9 .9% of the world fleet capacity in February 2010 (508 ships totaling 1.3 million TEU; Alphaliner 2010b).
Another measure taken to absorb overcapacity involves the suspension of liner services, particularly on the Far East-Europe and transpacific trade routes. Total capacity on the Far East-Europe trade fell by 21 % between October 2008 and March 2009. This corresponded to a net withdrawal of 19 liner services on the trade, leaving only 45 services between Europe/Med and the Far East in March 2009 (figures www.alphaliner.com/). Maersk Line suspended several major loops, such as the AE5 and AES services. The New World Alliance took out 25% of its capacity, while the CK.HY group decreased capacity by about 24%. Senator Lines ceased all its operations from February 2009.
Vessel lay-ups, order cancellations and service suspensions were not the only tools
used by shipping lines in an attempt to absorb overcapacity, as suggested by Table 12.6. Many vessels continue to slow steam at around 18 to 19 knots as the longer roundtrip time helps to absorb surplus capacity in the market (because more vessels are needed per loop). Initially; shipping lines introduced slow steaming in 2007 to offset the rise in bunker costs (N otteboom and Vernimmen 2009), but the slow steaming option remained popular even after a steep decline in the bunker price from the peak of US$700 in July 2008 to a low of US$170 per ton in December 2009 (bunker price for IFO 380 grade in Rotterdam obtained from www.bunkerworld.com/). Alphaliner reported that during the second half of 2009, 42 liner services in the world (of which 13 were on the Northern EuropeAsia trade) switched to (super)slow steaming of 14 to 18knots. In total, 47 additional container vessels between 3,000 and 13,000 TEU had to be deployed on these services in order to guarantee weekly calls in each of the visited ports. Slow steaming absorbed about 300,000 TEU of vessel capacity, or 2.3% of the world container fleet. 1be cost model used by Notteboom and Vernimmen (2009) shows that the cost savings linked to slow steaming on a liner service between Europe and Asia compensate for the cost increases linked to the deployment of an additional vessel to guarantee a weekly call in each port included in the service. Quite a number of shipping lines are now examining the possibilities of making cost savings by further slowing down ships to about half their usual speeds. A service speed of 14knots is considered by some the possible future norm for container ships, in contrast to speeds of up to 22- 3 knots before slow steaming was introduced. While some container carriers, such as Maersk Line and
244 THEO NOTIEBOOM
CMA CGM, are moving to super slow steaming, others continue to run their services at full speed despite the high fuel price. Some shipowners who have managed to defer newbuilding deliveries are taking advantage of the extra time to modify designs and specify smaller, more fuelefficient propulsion systems with lower service speeds. Many shipowners, however, are still reluctant to commit to smaller engines, as they fear that at some stage higher speeds will be viable again. Quite a number of shippers are concerned about the higher transit times brought about by slow steaming practices. If super slow steaming becomes the norm, shippers might have to redesign their supply chains to meet the new reality of longer transit times. The future might bring premiumpriced high-speed services to carry timesensitive cargo, but most ships would be operated at a much slower speed to save on bunkers, reduce emissions and absorb part of the overcapacity in the market.
The situation in the charter market is particularly interesting. In late 2009 container ship operators owned around 58% of the global vessel fleet, while the remainder was owned by financiers through chartering contracts (see Table 12.4). Given the current market situation, chartered-in vessels are returned when leases expire and, consequently; taken out of the market. The rental reversion rate for the chartered fleet currently stands at 20-2% of the global container ship market, based on an average tenure of 4.5 to 4.9 years. Given that half of the fleet is chartered in, as much as 1.37
million TEU of available capacity could in theory be removed from the network per annum. That would be about 10% of the entire fleet per annum, which could mitigate expected nominal supply growth in the
years to come. However, a certain proportion of the charter expiries are renewed, with daily rates in late 2009 about 75%
lower than the average level of 2008. It is also expected that many operators will return chartered fleet when the leases expire, because they have their own newly built deliveries coming to market. Consequently, redelivered vessels are likely to be laid up, since charter owners cannot effectively operate container ships without a network, unlike bulk carriers and tanker vessels. This will have a substantial impact on the balance sheet of those who have provided financing to these charter ships. Therefore, the market could see fewer container ships on trade routes, at least until rates rebound to profitable levels. This brings us to the pricing issue in the container shipping industry.
12.4 Pricing and the Risks Associated with Revenue Streams
12.4.1 The pricing problem in container shipping
The container shipping industry does not face challenges only in the area of capacity management. A combination of poorly differentiated rates (too many customers to negotiate a rate for every cargo) and inflexible capacity causes a pricing problem and explains existing freight rate volatility in the market. Shipping lines are not able to achieve rate stability, as they cannot adjust vessel capacity to meet short-run demand fluctuations (see discussion in the previous section). For most shipments freight accounts for only a very small portion of the shipment's total value, but as carriers cannot influence the size of the final market,

CONTAINER SHIPPING 245
they will try to increase their short-run market share by reducing prices. Thus, shipping lines may reduce freight rates without substantially affecting the underlying demand for container freight. The only additional demand can come from lowvalue products which will only be shipped overseas if freight rates are very low (e.g. waste paper and metal scrap). These "temporary" markets disappear again once the freight rate is above a threshold level that does not allow a profit on trading these products overseas.
The fairly inelastic nature of demand for shipping services constitutes the core problem for the financial performance of container shipping lines. Through their pricing strategies container lines only have a marginal impact on total trade volumes. In a market situation with vessel oversupply, processes of rate erosion unfold as shipping lines try to increase their market shares by lowering the freight rates, without substantially impacting the total demand. Such price competition continues till the freight stabilizes at a low level, just above the "refusal rate," i.e. the lowest rate at which the shipping line is prepared to operate its vessel rather than having it in lay-up. If the freight rate on a specific route fell below the refusal rate then many vessels would be laid up. The resulting reduction in vessel capacity would push rates back up to a level above the refusal rate. When demand starts to pick up, ships are taken out of lay-up. The freight rates move away from the refusal rate once all vessels are out of lay-up and all deployable capacity is operational in the market. It is only then that rates start to increase significantly. Rates will reach their highest level when the utilization of the fleet reaches its upper limits and not enough new capacity is added to the market. At that
moment, container shipping lines massively order new vessel capacity, leading to a shockwave of new capacity being brought into the market one-and-a-half to two years later, typically pushing the shipping market back into a period of overcapacity and lower rates. These dynamics in the shipping market combined with the rather inelastic demand force shipping lines to an intense concentration on costs and to seeking negotiated long-term contracts with large shippers with a view to securing cargo. Even though lower rates may allow carriers to take on extra cargo, in most cases, where there remains capacity, they also reduce their profitability. In many cases, shipping lines can earn more money with higher rates and lower utilization than with lower rates and higher utilization.
Evidence on the pricing problem can be found in the way shipping lines reacted to the economic crisis which started to unfold in late 2008. The sudden decline in demand meant that spot container freight rates on many trade routes were reduced to very low levels in early 2009. The global freight rate index developed by Drewry fell from US$2,727 per FEU in July 2008 to US$1,536 per FEU in May 2009. For cargo flows from Asia to Europe the index plunged from US$3,169 per FEU in July 2008 to a low point of US$1,071inMarch2010. Rates bottomed out in February I March 2009 as they could not go much lower. In the second quarter of 2009, vessel capacity reductions on the major trade lanes started to have a positive effect on rates. In April 2009, NOL started to charge US$250 more for a TEU from Asia to Europe. Maersk Line increased its rates for all cargo in the Asia to Europe trade (e.g. +US$250 per TEU/main port, effective 1 April 2009, and +US$300 per TEU /main port, effective 1 July 2009). Also,
246 THEO NOTTEBOOM
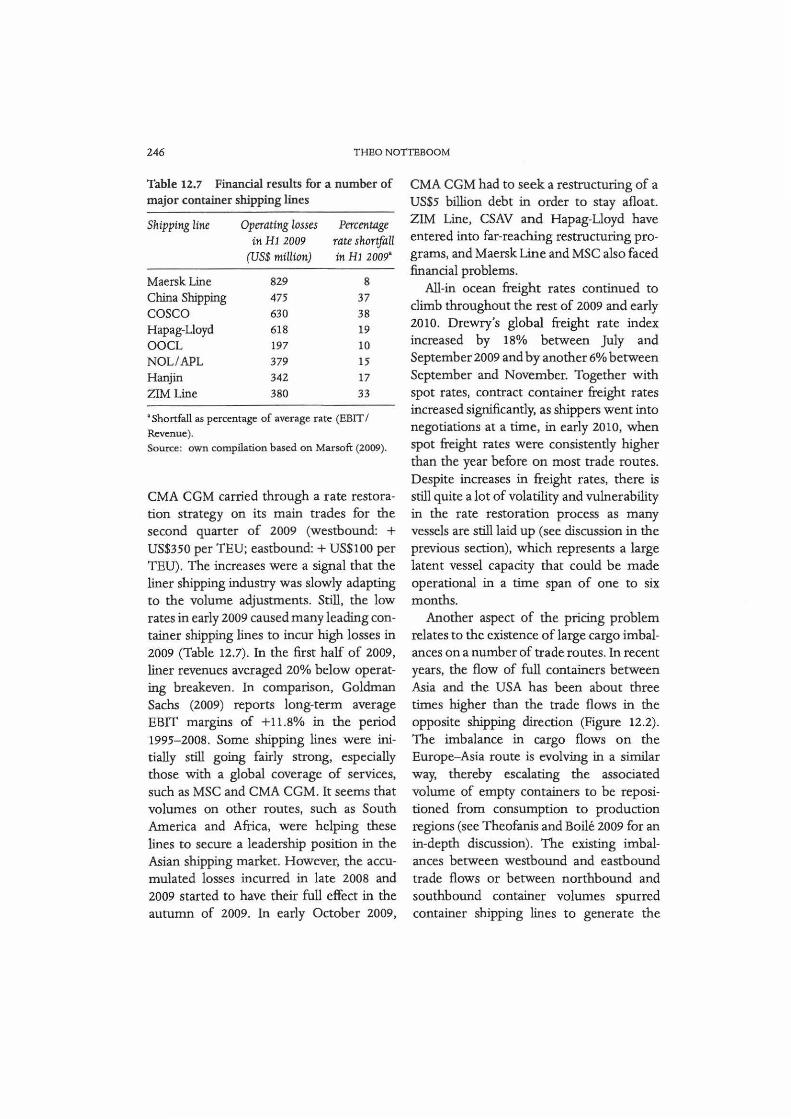
Table 12.7 Financial results for a number of major container shipping lines
Shipping line Operating losses Percentage in H1 2009 rate shortfall
(US$ million) in Hl 2009•
MaerskLine 829 8 China Shipping 475 37 COSCO 630 38 Hapag-Lloyd 618 19 OOCL 197 10 NOL/APL 379 15 Hanjin 342 17 ZIM Line 380 33
•Shortfall as percentage of average rate (EBIT I Revenue). Source: own compilation based on Marsoft (2009).
CMA CGM carried through a rate restoration strategy on its main trades for the second quarter of 2009 (westbound: + US$350 per TEU; eastbound:+ US$100 per TEU). The increases were a signal that the liner shipping industry was slowly adapting to the volume adjustments. Still, the low rates in early 2009 caused many leading container shipping lines to incur high losses in 2009 (Table 12.7). In the first half of 2009, liner revenues averaged 20% below operating break.even. In comparison, Goldman Sachs (2009) reports long-term average EBIT margins of + 11.8% in the period 1995- 2008. Some shipping lines were initially still going fairly strong, especially those with a global coverage of services, such as MSC and CMA CGM. It seems that volumes on other routes, such as South America and Africa, were helping these lines to secure a leadership position in the Asian shipping market. However, the accumulated losses incurred in late 2008 and 2009 started to have their full effect in the autumn of 2009. In early October 2009,
CMA CGM had to seek a restructuring of a US$5 billion debt in order to stay afloat. ZIM Line, CSAV and Hapag-Lloyd have entered into far-reaching restructuring programs, and Maersk Line and MSC also faced financial problems.
All-in ocean freight rates continued to climb throughout the rest of 2009 and early 2010. Drewry's global freight rate index increased by 18% between July and September 2009 and by another 6% between September and November. Together with spot rates, contract container freight rates increased significantly, as shippers went into negotiations at a time, in early 2010, when spot freight rates were consistently higher than the year before on most trade routes. Despite increases in freight rates, there is still quite a lot of volatility and vulnerability in the rate restoration process as many vessels are still laid up (see discussion in the previous section), which represents a large latent vessel capacity that could be made operational in a time span of one to six months.
Another aspect of the pricing problem relates to the existence of large cargo imbalances on a number of trade routes. In recent years, the flow of full containers between Asia and the USA has been about three times higher than the trade flows in the opposite shipping direction (Figure 12.2). The imbalance in cargo flows on the Europe-Asia route is evolving in a similar way, thereby escalating the associated volume of empty containers to be repositioned from consumption to production regions (see Theofanis and Boile 2009 for an in-depth discussion). The existing imbalances between westbound and eastbound trade flows or between northbound and southbound container volumes spurred container shipping lines to generate the

CONTAJNER SHIPPING 247
90% • Share of eastbound volume in total two-way volume Asia-USA o Share of westbound volume in total two-way volume Asia-Europe
80% •Share of westbound volume in total two-way volume Europe-USA
-~ 70%
60% - r-- - - ,_
- - - -50% - - -- - - - I- I- - - - - - - -
40% - - - - - - - - - - - - - - -
30% - - f- - ,_ f- e- ,_ - - - - - - -
20% - - ,_ - ,_ - ,_ ,_ - - - - - - -
10% - - - - I- I- ,_ I- ,_ - - - >-- - -
0%
1990 1995 1996 1997 1998 2000 2001 2002 2003 2004 2005 2006 2007 2008
Figure 12.2 Traffic imbalances on the main routes, based on volumes in TEU (full containers). Source: own elaboration based on data in various reports of Drewry and UNCTAD, Review of Maritime Transport.
bulk of their revenues on the full leg, leading to large differences in freight rates between sailing directions. Shipping lines have developed a range of organizational strategies to reposition their empty containers (Lopez 2003), for example the spot organization of the repositioning flows, and the adoption of different renewable contracts to frame the externalization of the repositioning problem, often using leasing companies to absorb some of the associated risks. The trade imbalance and container repositioning issues also affect shippers in their ability to access equipment. In order to guarantee space, shippers may doublebook their container loads, which leads to missed bookings for shipping lines. Container liner companies have reacted by imposing additional surcharges in the form of "no-show" fees.
12.4.2 The economics of additional price items and surcharges
The container shipping industry is characterized by specific and complex pricing practices, partly to seek protection from freight rate instability. Base freight rates or Freight All Kinds (FAK) rates are applicable in most trades. These freight rates are lump sum rates for a container on a specific origin- destination relation irrespective of its contents and irrespective of the quantity of cargo stuffed into the box by the shipper himself. On top of these base freight rates, liner companies charge separately for additional items. The most common surcharges include fuel surcharges (Bunker Adjustment Factor or BAF), surcharges related to the exchange rate risk (Currency Adjustment Factor or CAF), port congestion surcharges,
248 THEO NOTTEBOOM
terminal handling charges (THCs) and various container-equipment related surcharges (e.g. demurrage, detention, and equipment handover charges, equipment imbalance surcharge, and charges for the special equipment needed for handling open-top containers, heavy lift, etc.). Table 12.8 provides an empirical example of the relative importance of the base freight rate compared to the total out-of-pocket costs and time costs for a shipment from Shanghai to Brussels.
Fuel surcharges are aimed at passing (part of) the fuel costs on to the customer through variable charges. The use of fuel surcharges has always been a source of contention in shipping circles, particularly in times of high fuel prices. Shippers' organizations argue that the way fuel surcharges are determined is opaque, without uniformity, and involves a significant element of revenue making. In contrast, shipping lines underline that the increase in bunker prices, especially in the short term, is only partially compensated through surcharges to the freight rates and that it still affects their earnings negatively. Empirical research by Notteboom and Cariou (2011) related to data for rnid-2008 and early 2009 and by Meyrick and Associates (2008) shows that fuel surcharges are mainly used by shipping lines for revenue-making purposes and go beyond mere cost recovery. The analysis of Cariou and Wolff (2006) of the causal relationship between the fuel surcharges imposed by members of the Far Eastern Freight Conference and bunker prices on the Europe- Far East container trade concluded that from 2000 to 2004 a causality can be established and that an increase in fuel price by 1 would lead to an increase in the Bunker Adjustment Factor by 1.5. Time lags can be observed between changes in
the bunker price and corresponding changes in fuel surcharges. For example, the economic slowdown since late 2008 initially put a strong downward pressure on the fuel price with a positive impact on vessel operating costs. A number of shipping lines kept the fuel surcharges artificially high for some time to generate some revenue out of the container business. But in early 2009 lines started to quote all-in prices rather than split ocean rates from currency, bunker and terminal handling surcharges.
The Currency Adjustment Factor (CAF) is typically expressed as a percentage of the basic freight rate. This surcharge ensures that shipping lines enjoy a more or less stable income in the currency of their own country.
Terminal Handling Charges (THCs) are a tariff charged by the shipping line to the shipper which is intended to cover (part or all of) the terminal handling costs, and which the shipping line pays to the terminal operator (Dynamar 2003). THCs vary within a port by trade route and are a negotiable item for large customers. The origin of THCs is to be found in the development of a common formula in 1989 by the Council of European and Japanese National Shipping Association (CENSA). The basic principle was to distribute all cost components of the terminal handling operation on an 80 I 20 basis, with the shipping lines being responsible for the 20 percent. The use of THCs is widely accepted in Europe and North America, and THCs are also found in ports in the Far East (China and Vietnam) and Israel. In many countries, though (including Indonesia, Malaysia and Hong Kong), a resistance exists against the level and/ or the application of TH Cs. Shippers' councils and individual shippers argue that THCs are used as a source of income rather

CONTAINER SHIPPING 249
Table 12.8 Breakdown of transport costs Shanghai-Brussels for a 40-foot container with a cargo load value of 85,000 euro (market prices of February 2007)
Value container content (euro) Time variables Transit time to Shanghai (by barge) Dwell time Shanghai Transit time Shanghai-Antwerp Dwell time Antwerp End-haulage (including pickup and delivery) Total transit time Transport and handling costs Pre-haulage Shanghai (by barge) Typical freight rate Shanghai-Antwerp THC Shanghai THC Antwerp (per container) BAF CAF ISPS surcharge Antwerp (per container) Delivery order (20 euro/BL) Customs clearance fee (IM4) Administration fee (25 euro/BL) Dwell time charges Antwerp - import containers
Shanghai-Brussels
85000 Days
0
3
28 5
0.5
36.5 Euro
0 1641
56 112
367 141
15 20 75
25
End-haulage by truck (including handling): Antwerp-Brussels (60km) Total transport and handling costs
0 215
2667 Time costs goods Opportunity cost capital (6% per year) Depreciation cost (economic/technical - 10% per year) Damage and loss costs (5% per year)
Euro 510 850 425
170 Insurance (2% per year) Leasing costs container (0.65 euro/ day) Total time costs goods Total costs % of value of goods
24 1979 4645
5.5
Source: own elaboration based on data of an Antwerp-based freight forwarding company.
than cost recovery and that they were only introduced to compensate for declining rates. Shipping lines underline that THCs are certainly not a profit centre and that THC levels have not been increased for years, despite inflation. In a recent study, the European Commission (2009) analyzed the
impact of the end of the liner conference block exemption on the TH Cs applied by all container carriers in most ports. The study revealed that THCs are an insignificant part of the pricing mix when freight rates are high, but during a freight rate collapse, as in early 2009, they constitute a much higher

250 THEO NOTIEBOOM
percentage of the total port-to-port price. After the abolition of liner conferences in Europe, THCs were simplified and restructured on a country basis rather than a port basis. Similarly to how they deal with fuel surcharges, individual shipping companies follow different approaches on what they include in THCs.
Freight rates can vary greatly depending on the economic characteristics (e.g. cargo availability, imbalances, competitive situation among shipping lines) and technological characteristics (e.g. maximum allowable vessel size) of the trade route concerned. Figure 12.3 gives an example of applicable freight rates (including fuel surcharges and CAP) for the shipment of an FEU from a
~ OCTOBER 2009
major North European container port to a large number of overseas destinations. It can be concluded that there is no straightforward relation between price and sailing distance. Many destinations in West Africa and East Africa are relatively expensive given the market risks involved (cargo availability and port congestion), the imbalance in container flows (southbound volumes are much higher than northbound traffic), the market structure, which has relatively few suppliers of regular container services, and the limitations in terms of vessel scale. Rates to the Far East were very low in comparison, because of the scale economies in vessels deployed, the imbalance between westbound and eastbound trade flows
Ill Export Rat s - from a ~ ~ 7000 -+-- ---+------+--- 0- L_,,__ --An--!-+-----< o = Africa
0 o to - go a = •= FarEast
~ ~ 6000 L anda - Ang la • = India/Pakistan ~ !-o • = Middle East ~ 1' ape Verde • = Australia - New Zealand .f j 5000 0 • = Mediterranean ~ i Reu ion/Mauriti s and • = Baltic/Iberian peninsula U Mada asc = South and Latin America ~ ~ 4000+-----+------+----~:.::=::1:2::::.=:+---'-~-.-~~~ ..... ~~~~ < ;:i = = + :::, 3000,._----t------~---tid'--::;:;>"'.77'<--f------=-+-~==-~-1-=---~ ~ ;:i
f !: ~ .. 2000+---- -+-----..----..... Ill .s e
0+-- ---t-----t------1i-----+-----+-----+-------i 0 4000 6000 8000 10000 12000 14000
Distance from North European hub (in nautical miles)
Figure 12.3 Container rates (including BAF and CAF) from a North European container port to a series of overseas destinations, in October 2009, in US$. Source: own elaboration based on company data.

CONTAINER SHIPPING 251
which makes it very cheap to ship cargo to Asia, and the large number of competing firms on this route.
12.5 In Search of Scale and Scope
12.5.1 Scale increases via operational agreements and mergers and acquisitions
Shipping lines are viewing market mass as one of the most effective ways of coping with a trade environment that is characterized by intense pricing pressure. Operational cooperation between container shipping companies comes in many forms, ranging from slot-chartering and vessel-sharing agreements to strategic alliances. The container shipping industry has also been marked by several waves of mergers and acquisitions (M&A). Trade agreements in the form of liner conferences were very common till these forms of cooperation were outlawed by the European Commission in October 2008.
The first strategic alliances between shipping lines date back to the mid-1990s, a period that coincided with the introduction of the first 6000+ TEU vessels on the Europe-Far East trade. In 1997, about 70 percent of the services on the main eastwest trades were supplied by the four main strategic alliances. The main incentives for shipping lines to engage in strategic alliances relate to the need for critical mass in the scale of operation and to the need to spread the risks associated with investments in large post-Panamax vessels (Ryoo and Thanopoulou 1999; Slack, Comtois and Mccalla 2002). The alliance partnerships evolved as a result of mergers and acquisi-
tions and the market entry and exit of liner shipping companies (Figure 12.4). Strategic alliances provide their members easy access to more loops or services with relatively low cost implications and allow them to share terminals and to cooperate in many areas at sea and ashore, thereby achieving costs savings in the end. Parola and Musso (2007) rightly point out that an individual company will not opt for alliance membership once it reaches a scale that allows it, by itself, to benefit from the same economies of scale and scope that strategic alliances offer. A number of shipping lines stay out of alliances for reasons of commercial independence and flexibility (e.g. Evergreen). McLellan (2006) argues that the formerly strong ties between members of strategic alliances are getting looser. Alliance members engage increasingly in vesselsharing agreements with outside carriers. Individual shipping lines show an increased level of pragmatism when setting up partnerships with other carriers on specific trade routes.
The shipping business has been subject to several waves of mergers and acquisitions. Yap (2010) reports that the number of acquisitions rose from three in 1993 to thirteen in 1998 before peaking at eighteen in 2006. The main M&A events include the merger between P&O Container Line and Nedlloyd in 1997, the merger between CMA and CGM in 1999 and the take-over by Maersk of Sea-Land in 1999 and P&O Nedlloyd in 2005. Shipping lines opt for mergers and acquisitions in order to obtain a larger size, to secure growth and to benefit from scale advantages. Other motives for mergers and acquisitions in liner shipping relate to gaining instant access to markets and distribution networks, obtaining access

\t h ]•JI/(,
APL Mits.ui OSK Lines
Ncdlloyd OOCL MlSC
<.((I\'{) H././ 4 \( f: · Hapag-Lloyd
NYKLme NOL
P&OCL
Maersk Sea-Land Hyundai
MSC Norasia Hanjin
Trlcon-consortlum· - DSR Senator
-Cho Yang K-Line
Yang Ming
Evergreen UASC
COSCO
\ 1.11 l 11 ! ,,.,,
\f.11 11011/f) 11/14\CI.
APL/NOL Mitsui OSK Lme~ Hyundai
CiR I \'/) IU/.l\Cf. II
Hapag-Lloyd NYKLinc P&ONedlloyd pocL MlSC
-~-Maersk Sea-Land MSC Norasia
l- \IT/:'/J 11.Ll 4 \'CF
I nd ~0111
\'/;If If 0/1/ [) IU.IA.\'CE
'APL/NOL Mitsui OSK Lines Hyundai
<7R nruu 1Jw1: 11 Hapag-Lloyd NYKLme P&ONedlloyd OOCL
,MlSC p Maersk SeaLand -
MSC Norasia
C')A./l '.!,IOU/'
HanJtn (incl DSR-Senator) K-Lme 1YangMing COSCO
Evergreen UASC
Exit: Cho Yang
Figure 12.4 Evolution in strategic alliance configuration in liner shipping, Source: updated from Notteboom (2004).
I
I 11d ~ ru !'
Mitsui OSK Lines Hyundai
CRA \'/) 11.U L\CE
Hapag-Lloyd/CP Slups NYK Lme
~o= MISC
Maersk Line
MSC
c lAH~1,mp ·
Hanj in (incl. DSR-Senator) K-Line Yang Ming COSCO CMA-CGM slot chartering with CSCL
Evergreen UASC
I
I
I 11! ~H!l'I
.PUNOL
GR.1.\'!J 4Ll.l.1 \'C E
Hapag-Lloyd Group NYKLme OOCL
Macrsk Line
MSC
< l'A'Hgro11p
Hanjin K-Line
1YangMing COSCO CMA-CGM slot chartering with CSCL
Evergreen UASC MISC
CONTAINER SHIPPING 253
to new technologies or diversifying the asset base. Acquisitions typically feature some pitfalls, certainly in the highly international maritime industry: cultural differences, overestimated synergies and high expenses with respect to the integration of departments. Still, acquisitions make sense in liner shipping as the maritime industry is mature and the barriers to entry are relatively high (because of the investment volumes required and the need to develop a customer base). Through a series of major acquisitions (besides Sea-Land and P&O Nedlloyd there was Safmarine in 1999),
Maersk Line was able to increase its market share substantially and to make strategic adjustments to secure its competitive advantage on key trade routes. Fusillo (2002)
argued that a large fleet capacity enabled Maersk Line to use excess capacity as a form of entry deterrence by saturating the market and reducing profit opportunities for competing carriers. In contrast to Maersk Line, MSC reached the number two position in the world ranking of container lines by organic or internal growth. MSC was only involved in two minor take-overs: Kenya National in 1997 and Lauro in 1989.
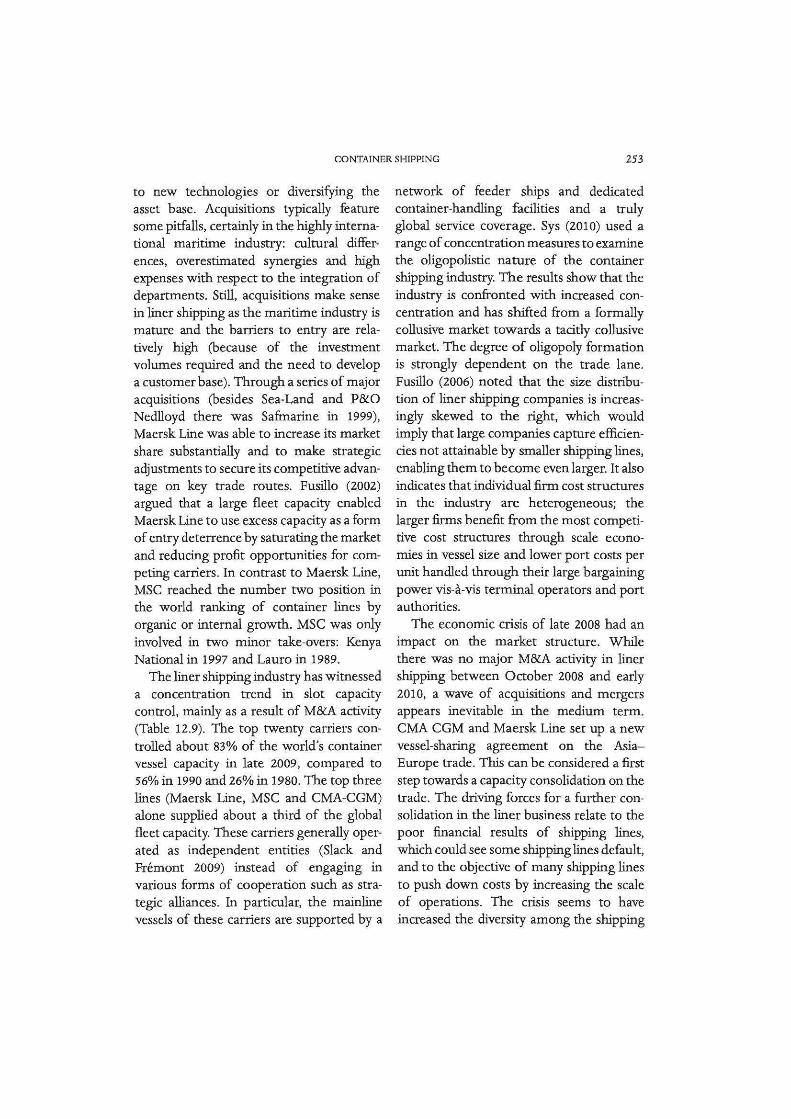
The liner shipping industry has witnessed a concentration trend in slot capacity control, mainly as a result of M&A activity (Table 12.9). The top twenty carriers controlled about 83% of the world's container vessel capacity in late 2009, compared to 56% in 1990 and 26% in 1980. The top three lines (Maersk Line, MSC and CMA-CGM) alone supplied about a third of the global fleet capacity. These carriers generally operated as independent entities (Slack and Fremont 2009) instead of engaging in various forms of cooperation such as strategic alliances. In particular, the mainline vessels of these carriers are supported by a
network of feeder ships and dedicated container-handling facilities and a truly global service coverage. Sys (2010) used a range of concentration measures to examine the oligopolistic nature of the container shipping industry. The results show that the industry is confronted with increased concentration and has shifted from a formally collusive market towards a tacitly collusive market. The degree of oligopoly formation is strongly dependent on the trade lane. Fusillo (2006) noted that the size distribution of liner shipping companies is increasingly skewed to the right, which would imply that large companies capture efficiencies not attainable by smaller shipping lines, enabling them to become even larger. It also indicates that individual firm cost structures in the industry are heterogeneous; the larger firms benefit from the most competitive cost structures through scale economies in vessel size and lower port costs per unit handled through their large bargaining power vis-a-vis terminal operators and port authorities.
The economic crisis of late 2008 had an impact on the market structure. While there was no major M&A activity in liner shipping between October 2008 and early 2010, a wave of acquisitions and mergers appears inevitable in the medium term. CMA CGM and Maersk Line set up a new vessel-sharing agreement on the AsiaEurope trade. This can be considered a first step towards a capacity consolidation on the trade. The driving forces for a further consolidation in the liner business relate to the poor financial results of shipping lines, which could see some shipping lines default, and to the objective of many shipping lines to push down costs by increasing the scale of operations. The crisis seems to have increased the diversity among the shipping

Table 12.9 Slot capacities of the fleets operated by the top twenty container lines (in TEU)
January 1980 Septanbor 1995 January 2000 November 2005 March2007 Fdm1ary 2010
Sea-Land 70,000 Sea-Land 196,708 A.P. 620,324 Maersk 1,620,587 Maersk 1,758,857 Maersk 2,061,607
Moller- Line Line Line Maersk
2 Hapag-Lloyd 41,000 Maersk 186,040 Evergreen 317,292 MSC 733,471 MSC 1,081,005 MSC 1,536,244
3 OCL 31,400 Evergreen 181,982 P&O 280,794 CMA/ 485,250 CMA 746,185 CMACGM 1,042,308
Nedlloyd CGM CGM Group Group Group
4 Maersk 25,600 COSCO 169,795 Hanjin/ DSR 244,636 Evergreen 458,490 Evergreen 566,271 Evergreen 554,316
Senator Group Group Group 5 NYKLine 24,000 NYKLine 137,018 MSC 224,620 Hapag 413,281 Hapag- 467,030 APL 548,788
Lloyd/ Lloyd CP Ships
6 Evergreen 23,600 Nedlloyd 119,599 NOL/APL 207,992 China 334,337 CSCL 417,337 Hapag- 495,894
Shipping Lloyd 7 OOCL 22,800 Mitsui OSK 118,208 COSCO 198,841 NOL/APL 331,639 COSCO 391,527 COSCO 453,922
Lines 8 ZIM 21,100 P&OCL 98,893 NYKLine 166,206 Hanjin/ 315,153 NYK 353,832 CSCL 438,176
Senator
9 US Line 20,900 Hanjin 92,332 CP 141,419 COSCO 311,644 Hanjin/ 345,037 Hanjin 428,436
Shipping Ships- Senator Shipping Americana
10 APL 20,000 MSC 88,955 ZIM 136,075 NYKLine 303,799 APL 342,899 NYK 407,300 11 Mitsui OSK 19,800 APL 81,547 Mitsui OSK 132,618 OOCL 236,789 OOCL 303,864 CSAV 348,746
Lines Lines Group

12 Farrell Lines 16,400 ZIM 79,738 CMA/CGM 122,848 CSAV 230,699 K-Line 283,076 OOCL 342,512
Group
13 NOL 14,800 K-Line 75,528 K-Line 112,884 KLine 228,612 MOL 281,447 MOL 336,971
14 Trans Freight 13,900 DSR- 75,497 Hapag-Lloyd 102,769 Mitsui OSK 220,122 Yang Ming 253,104 KLine .325,071
Line Senator Lines Line
15 CGM 12,700 Hapag- 71,688 Hyundai 102,314 ZIM 201,263 CSAV 250,436 ZIM 310,568
Lloyd Group
16 Yang Ming 12,700 NOL 63,469 OOCL 101,044 Yang Ming 185,639 ZlM 248,922 Yang Ming 308,664
Line
17 Ncdlloyd ll,700 Yang Ming 60,034 Yang Ming 93,348 Hamburg- 185,355 Hamburg- 222,907 Hamburg- 302,056
Siid Siid Siid
Group Group
18 Columbus 11,200 Hyundai 59,195 China 86,335 Hyundai 148,681 HMM 168,966 Hyundai 283,550
Line Shipping M.M.
19 Safmarine 11,100 OOCL 55,811 UASC 74,989 Pacific lnt'l 134,292 PIL 146,174 UASC 202,099
Lines
20 Ben Line 10,300 CMA 46,026 Wan Hai 70,755 Wan Hai 106,505 Wan Hai 116,439 PlL 189,281
Lines Lines
Slop capacity of 435,000 2,058,063 3,538,103 7,185,608 8,745,315 10,916,509
top 20
C4-index (%) 38.6 35.7 41.4 45.9 47.5 47.6
Share of top 5 in 44.l 42.3 47.7 56.3 57.6 57.2
top 20 (%)
Share of top 10 in 69.1 67.5 71.7 73.9 74.0 73.0
top 20 (%)
Source: compiled from BRS Alphaliner, ASX Alphaliner and Containerisation Jnta-natianal.
256 THEO NOTTEBOOM
lines' long-term strategies. MSC, Evergreen and Hapag-Lloyd are among the shipping lines concentrating on the core business of liner shipping. The concept is to invest capital in liner shipping and to demand a return on that capital. While MSC and Evergreen are also present in the terminal business and have some presence in inland logistics, Hapag-Lloyd limits itself to operating ships. APL and OOCL on the other hand are trying to reinvent themselves as logistics service providers competing directly with established logistics service providers such as Kuehne & Nagel and OHL. They have become logistics providers by cutting their sea freight prices, but it allows them to control the cargo for the line. Japanese and Korean lines increasingly rely on their role within large shipping conglomerates. For example, NYK and MOL have only 40 percent of their business in liner shipping. By being involved in many sectors, these conglomerates spread risk. Finally, the A.P. Moller group (of which Maersk Line is a subsidiary) and CMA CGM continue to rely heavily on vertical integration; they have involvements in container shipping, terminal operations and inland logistics. The A.P. Moller group in particular has gone beyond container logistics and has involvements in supermarkets and the oil business.
12.5.2 Extending the scope of operations
The operating scale of the top-tier shipping lines gives them enormous bargaining power vis-a-vis terminal operators. Over the past decades, the largest container lines have shown a keen interest in developing dedicated terminal capacity in an effort to better control costs and operational per-
formance, and as a measure to remedy against poor vessel schedule integrity (see Notteboom 2006 and Vernimmen, Dullaert and Engelen 2007 for a discussion of schedule unreliability). Maersk Line's parent company, A.P. Moller- Maersk, operates a large number of container terminals in Europe (and abroad) through its subsidiary APM Terminals. CMA CGM, MSC, Evergreen, Cosco and Hanjin are among the shipping lines that fully or partly control terminal capacity around the world. Global terminal operators such as Hutchison Port Holdings, PSA and DP World are increasingly hedging the risks by setting up dedicated terminal joint ventures in cooperation with shipping lines and strategic alliances. Terminal operators also seek long-term contracts with shipping lines using gain sharing clauses. The above developments have given rise to a growing complexity in terminal ownership structures and partnership arrangements.
The scope extension of a number of shipping lines goes beyond terminal operations to include inland transport and logistics (see for example Cariou 2001; Fremont and Soppe 2007; Graham 1998). The deployment of larger vessels, the formation of strategic alliances and waves of M&A have resulted in lower costs at sea, shifting the cost burden to landside operations. Notteboom (2009) estimated that the cost per FEU-km for a post-Panamax vessel between Shanghai and Europe amounts to €0.12, while inland haulage from North European ports usually ranges from €1.5 to €4 per FEU-km for trucks and €0.5 to €1 .5
euro per FEU-km for barges (excluding handling costs and pre- and end-haul by truck). The observed price difference per FEU-km makes clear that cost savings in land operations potentially have a large impact on total

CONTAINER SHIPPING 257
transport costs. Shipping lines develop doorto-door services based on the principle of carrier haulage in an attempt to get a stronger grip on the routing of inland container flows. Carrier haulage is said to have a positive influence on the modal split in port-based inland transportation, as it provides shipping lines with a better overview of the flows so that intermodal bundling options come into play If the inland leg is based on merchant haulage then the carrier often loses control of and information on its boxes.
Anumberof shipping lines try to enhance network integration through structural or ad hoe coordination with independent inland transport operators and logistics service providers. They do not own inland transport equipment. Instead they tend to use trustworthy independent inland operators' services on a (long-term) contract basis. Other shipping lines combine a strategy of selective investments in key supporting activities (e.g. agency services or distribution centers) with subcontracting of less critical services. With only a few exceptions, the management of pure logistics services is done by subsidiaries that share the same mother company as the shipping line but operate independently of liner shipping operations, and as such also ship cargo on competitor lines (Heaver 2002). A last group of shipping lines is increasingly active in the management of hinterland flows. The focus is now on the efficient synchronization of inland distribution capacities with port capacities.
Shipping lines can offer their own rail, barge and truck services through subsidiary companies or through strategic partnerships with major third-party operators. Maersk Line is actively involved in rail services through its sister company European
Rail Services (ERS). Since 2001, CMA CGM has operated container shuttle trains in France, Benelux and Germany through its subsidiary Rail Link. The large majority of shipping lines, however, buy slot capacity from third-party rail operators. Only a few container lines offer their own inland barge services (e.g. CMA CGM via River Shuttle Containers in Europe). Shipping lines are exploring ways to integrate deep-sea operations and inland depots. Following the extended gate principle as described in Rodrigue andNotteboom (2009b), a number of shipping lines push export containers from an inland location to the ocean terminal, initiated by the shipping line, yet prioritized according to available inland transport capacity and the ETA of the mother vessel. A similar concept can be applied to push import containers from the deep-sea terminal to an inland location, from where final delivery to the receiver will be initiated at a later stage.
Shipping lines face significant challenges if they wish to further optimize inland logistics. Competition with the merchant haulage option remains fierce. Customers often consider land transport part of the "normal" service provision of a shipping line, for which no additional financial remuneration is required. Shipping lines are also challenged to monitor container flows with a view to managing the empty repositioning problem from the global to the local level. The logistics requirements of customers (e.g. late bookings, peaks in equipment demand) typically lead to money-wasting peaks in inland logistics costs. Given the mounting challenges in inland logistics, shipping lines that do succeed in achieving a better management of inland logistics can secure an important cost advantage over their rivals.
258 THEO NOTTEBOOM
12.6 Dynamics in Container Shipping Networks
Liner shipping networks are developed to meet the growing demand in global supply chains in terms of frequency, direct accessibility and transit times. Shippers demand direct services between their preferred ports of loading and discharge. The demand side thus exerts a strong pressure on the service schedules, port rotations and feeder linkages. Shipping lines, however, have to design their liner services and networks to optimize ship utilization and benefit the most from scale economies in vessel size. Their objective is to optimize their shipping networks by rationalizing coverage of ports, shipping routes and transit time (Lirn, Thanopoulou, Beynon and Beresford 2004; Zohil and Prijon 1999). Shipping lines may direct flows along paths that are optimal for the system, the lowest cost for the entire network being achieved by indirect routing via hubs and the amalgamation of flows . However, the more efficient the network from the carrier's point of view, the less convenient that network could be for shippers' needs (Notteboom 2006). When designing their networks, shipping lines thus implicitly have to make a trade-off between the requirements of the customers and operational cost considerations. A higher demand for service segmentation adds to the growing complexity of the networks.
As a result, liner shipping networks feature a great diversity in types of liner services and a great complexity in the way end-to-end services, line-bundling services and pendulum services are connected to form extensive shipping networks. Maersk Line, MSC and CMA-CGM operate truly global liner service networks, with a strong
presence also on secondary routes. Maersk Line, especially, has created a balanced global coverage of liner services. The networks of CMA-CGM and MSC differ from the general scheme of traffic circulation by incorporating a network of specific hubs (many of these are not among the world's biggest container ports) and a more selective serving of secondary markets such as Africa (where MSC has a strong presence), the Caribbean and the East Mediterranean. Notwithstanding the demand pull for global services, a large number of individual carriers remain regionally based. Asian carriers such as APL, Hanjin, NYK, China Shipping and HMM mainly focus on intra-Asian trade, transpacific trade and the Europe- Far East route, partly because of their huge dependence on export flows generated by their Asian home bases. MOL and Evergreen are among the few exceptions frequenting secondary routes such as Africa and South America. Profound differences exist in service network design among shipping lines. Some carriers have clearly opted for a truly global coverage; others are somewhat stuck in a triad-based service network forcing them to develop a strong focus on cost bases.
Most liner services are line-bundling itineraries connecting two to five ports of call scheduled in each of the main markets. The establishment of global networks has given rise to hub port development at the crossing points of trade lanes. Intermediate hubs have emerged since the mid-1990s within many global port systems: Freeport (Bahamas), Salalah (Oman), Tanjung Pelepas (Malaysia), and Gioia Tauro, Algeciras, Taranto, Cagliari, Damietta and Malta in the Mediterranean, to name but a few. The role of intermediate hubs in maritime hub-and-spoke systems has been

CONTAINER SHIPPING 259
extensively discussed (see for instance Baird 2006; Fagerholt 2004; Guy 2003; McCalla, Slack and Comtois 2005). The hubs have a range of common characteristics in terms of nautical accessibility, proximity to main shipping lanes, and ownership, in whole or in part, by carriers or multinational terminal operators. Most of these intermediate hubs are located along the global beltway or equatorial round-the-world route (i.e. the Caribbean, Southeast and East Asia, the Middle East and the Mediterranean). These nodes multiply shipping options and improve connectivity within the network through their pivotal role in regional huband-spoke networks and in cargo relay and interlining operations between the carriers' east-west services and other inter- and intra-regional services. Container ports in Northern Europe, North America and mainland China mainly act as gateways to the respective hinterlands.
Two developments undermine the position of pure transshipment hubs (Rodrigue and Notteboom 2010). First of all, the insertion of hubs often represents a temporary phase in connecting a region to global shipping networks. Once traffic volumes for the gateway ports are sufficient, hubs are bypassed and become redundant (see also Wtlmsmeier and Notteboom 2010).
Secondly, transshipment cargo can easily be moved to new hub terminals that emerge along the long-distance shipping lanes. The combination of these factors means that seaports which are able to combine a transshipment function with gateway cargo obtain a less vulnerable and thus more sustainable position in shipping networks.
In channeling gateway and transshipment flows through their shipping networks, container carriers aim for control over key terminals in the network (see dis-
cussion earlier in this chapter). Decisions on the desired port hierarchy are guided by strategic, commercial and operational considerations. Shipping lines rarely opt for the same port hierarchy, in the sense that a terminal can be a regional hub for one shipping line and a secondary feeder port for another operator.
While some expect a further concentration of cargo and ships on equatorial roundthe-world services (linked to the expansion of the Panama Canal), the global shipping landscape exhibits an increasing complexity linked to a hierarchical set of networks reflecting differing cost/ efficiency levels in the market. At one end of the spectrum, we find high-order service networks featuring slow-steaming large vessels, few ports of call and a strong port hierarchy within multi-layered feeder subsystems that involve north-south and regional routes. Different services dovetail to provide smooth connections and operations at the main hubs which are under the control of the carrier. At the other extreme lower-order networks support an increasing segmentation in liner service networks.
12.7 Summary
The highly dynamic container shipping industry is one of the youngest market segments in shipping. The establishment of world-embracing liner shipping networks has facilitated globalization processes and associated global production and logistics practices. At the same time, the economic and logistic actors exert an everlarger demand pull on the capacity, connectivity, coverage and reliability of the liner shipping networks. Container carriers operate in a market characterized by

260 THEO NOTfEBOOM
moderate-to-strong growth (at least till 2009) with Asian economies representing an ever-larger share in the global container volumes. Still, the financial performance of many container shipping lines is rather poor compared to other logistics market players. The core of the problem lies in a combination of the capital-intensive operations and high risks associated with the revenues due to a combination of volatile markets and inflexible capacity in the short run. On top of this, the pricing strategies of container lines have only a marginal impact on total trade volumes. The specificities of the market have urged shipping lines to develop capacity management strategies aimed at reducing the cost per TEU carried, but also to develop vertical integration strategies with a view to extending their control over the inland segment. Larger companies have expanded their control of the market.
Exogenous shocks in demand in combination with the endogenous vessel order strategies of shipping lines mean that the container shipping industry regularly faces long periods of vessel oversupply and rate erosion. Capacity management proves to be a very difficult issue in periods of shrinking demand, as the carriers which decide to cut capacity might see other shipping lines freeriding on the resulting rate restoration. The economic crisis challenges shipping lines to carry out a comprehensive review of their business models. Recent declines in global trade and container flows were unprecedented. Shipping lines incurred massive losses and have no other option than to seek recovery in total revenue streams up to a level where carriers may achieve mid-cycle margins and returns. Rate restoration will remain vulnerable as long as deferred deliveries and idle ships are not fully absorbed by growth in demand. The shipping industry
not only needs to find a solution to bridge the current situation, but should also develop appropriate strategies to cope with different potential scenarios.
References
Alphaliner (2010a) Weekly Newsletter 2010(8). Alphaliner (2010b) Weekly Newsletter 2010(7). Baird, A. (2006) Optimising the container
transshipment hub location in northern Europe. journal of Transport Geography 14(3): 195-214.
Brooks, M. (2000) Sea Change in Liner Shipping: Regulation and Managerial Decision-Making in a Global Industry. Oxford: Pergamon.
Cariou, P. (2001) Vertical integration within the logistic chain: does regulation play rational? The case for dedicated container terminals. Trasporti Europei 7: 37-41.
Cariou, P. and F.-C . Wolff (2006) An analysis of Bunker Adjustment Factor and freight rates in the Europe /Far East market 2000-2004. Maritime Economics and Logistics 8(2): 187- 201.
Cullinane, K. and M. Khanna (1999) Economies of scale in large container ships. journal of Transport &onomics and Policy 33(2): 185-208.
Drewry (2006) The Drewry Container Market Quarterly.
Dynamar (2003) Terminal handling charges: a bone of contention. Dynamar report, Alkmaar.
European Commission (2009) Terminal handling charges during and after the liner conference era. Competition Reports, European Commission, Brussels.
Fagerholt, K. (2004) Designing optimal routes in a liner shipping problem. Maritime Policy and Management 31(4): 259-68.
Fremont, A. and M. Soppe (2007) Northern European range: shipping line concentration and port hierarchy. In]. Wang, T. Notteboom, D. Olivier and B. Slack (eds.), Ports, Cities, and

CONTAINER SHIPPING 261
Global Supply Chains, pp. 105-20. Aldershot, Hants: Ashgate.
Fusillo, M. (2002) Excess capacity and entry deterrence: the case of ocean liner shipping markets. Marititne Economics and Logistics 5(2): 100- 15.
Fusillo, M. (2006) Some notes on structure and stability in liner shipping. Maritime Policy and Management 33(5): 463-75.
Goldman Sachs (2009) Containerships: big bounce off the bottom. What next? Goldman Sachs Asia, Singapore.
Graham, M. G. (1998) Stability and competition in intermodal container shipping: finding a balance. Maritime Policy and Management 25: 129-47.
Guy, E. (2003) Shipping line networks and the integration of South America trades. Maritime Policy and Management 30(3): 231-42.
Heaver, T. (2002) The evolving roles of shipping lines in international logistics. International Journal of Maritime Economics 4: 210-30.
ITMMA/ESPO (2007) Market report on the European seaport industry. Annual Report 2006--2007, pp. 15-91. Brussels: European Sea Ports Organization.
Levinson, M. (2006) The Box: How the Shipping Container Made the World Smaller and the World Economy Bigger. Princeton, N]: Princeton University Press.
Lim, S.-M. (1998) Economies of scale in container shipping. Marititne Policy and Management 25: 361- 73.
Lim, T. C., H. A. Thanopoulou, M.]. Beynon and A. K C. Beresford (2004) An application of AHP on transshipment port selection: a global perspective. Marititne Economics and Logistics 6: 70--91.
Lopez, E. (2003) How do ocean carriers organize the empty containers reposition activity in the USA? Maritime Policy and Management 30(4): 339- 55.
Marsoft (2009) Containership Market Outlook. Marsoft, Singapore.
Mccalla, R., B. Slack and C. Comtois (2005) The Caribbean basin: adjusting to global trends in
containerization. Maritime Policy and Management 32(3): 245-61.
Mclellan, R. (2006) Liner shipping development trends. Marititne Policy and Management 33(5): 519-25.
Meyrick and Associates (2008) Review of BAFs - Transatlantic and Europe/Far East trades. Report for the European Shippers' Council, Melbourne.
Notteboom, T. (2004) Container shipping and ports: an overview. Review of Network Economics 3(2): 86-106.
Notteboom, T. (2006) The time factor in liner shipping services. Maritime Economics and Logistics 8(1): 19- 39.
Notteboom, T. (2009) The relationship between seaports and the intermodal hinterland in light of global supply chains: European challenges. In OECD/International Transport Forum, Port Competition and Hinterland Connections, pp. 25-75. Round Table 143. Paris: OECD Publishing.
Notteboom, T. and P. Cariou (2011) Are Bunker Adjustment Factors aimed at revenue-making or cost recovery? Empirical evidence on pricing strategies of shipping lines. In K. Cullinane (ed.), International Handbook of Maritime Economics, pp. 223-55. Cheltenham: Edward Elgar.
Notteboom, T. and B. Vernimmen (2009) The effect of high fuel costs on liner service configuration in container shipping. journal of Transport Geography 17(5): 325-37.
Parola, F. and E. Musso (2007) Market structures and competitive strategies: the carrierstevedore arm-wrestling in northern European ports. Marititne Policy and Management 34(3): 259- 78.
Randers, J. and J. Goluke (2007) Forecasting turning points in shipping freight rates: lessons from 30 years of practical effort. System Dynamics Review 23(2/3), 253-84.
Rodrigue, J.-P. and T. Notteboom (2009a) The future of containerization: perspectives from maritime and inland freight distribution. Geo journal 74: 7-22.

262 THEO NOTTEBOOM
Rodrigue, J.-P. and T. Notteboom (2009b) The terminalization of supply chains: reassessing port-hinterland logistical relationships. Maritime Policy and Management 36(2): 165-83.
Rodrigue, J.-P. and T. Notteboom (2010) Foreland-based regiona!ization: integrating intermediate hubs with port hinterlands. Research in Transportation Economics 27(1): 19- 29. Special issue: The Port and Maritime Industries in the Post-2008 World: Challenges and Opportunities.
Ryoo, D. Kand H. A. Thanopoulou (1999) Liner alliances in the globalisation era: a strategic tool for Asian container carriers. Maritime Policy and Management 26: 349-67.
Slack, B., C. Comtois and R. J. Mccalla (2002) Strategic alliances in the container shipping industry: a global perspective. Maritime Policy and Management 29: 65- 75.
Slack, B. and A. Fremont (2009) Fifty years of organisational change in container shipping: regional shift and the role of family firms. Geojournal 74: 23-34.
Stopford, M. (1997)Maritime Economics. London: Routledge.
Sys, C. (2010) Is the container liner shipping industry an oligopoly? Transport Policy 16: 259- 70.
Theofanis, S. and M. Boile (2009) Empty marine container logistics: facts, issues and management strategies. Geo]ournal 74: 51- 65.
UNCTAD (2009) Review of Maritime Transport, 2009. Geneva: UNCTAD.
Vernimmen, B., W Dullaert and S. Engelen (2007) Schedule unreliability in liner shipping: origins and consequences for the hinterland supply chain. Maritime Economics and Logistics 9(3): 193-213.
Wilmsmeier, G. and T. Notteboom (2011 ) Determinants of liner shipping network configuration: a two-region comparison. Geo]ournal 76(3): 213- 28.
Yap, W Y. (2010) Container Shipping Services and Their Impact on Container Port Competitiveness. Antwerp: University Press Antwerp.
Zohil,J. and M. Prijon (1999) The MED rule: the inte rdependence of container throughput and transshipment volumes in the Mediterranean ports. Maritime Policy and Management 26: 175- 93.