Container Shipping 2013 Market Outlook
22
Container Shipping 2013 Market Outlook Web: www.alphaliner.com E-mail: [email protected] The worldwide reference in liner shipping Shenzhen, 17 October 2012
Transcript of Container Shipping 2013 Market Outlook

Container Shipping
2013 Market Outlook
Web: www.alphaliner.com E-mail: [email protected]
The worldwide reference in liner shipping
Shenzhen, 17 October 2012

ALPHALINER Containership Market Outlook www.alphaliner.com – the worldwide reference in liner shipping © Alphaliner 1999-2012 – Contents not to be reproduced without permission
TPM Asia : October 2012
Carriers remain trapped with surplus capacity
© Alphaliner Page 1
New deliveries
Return of chartered tonnage
Scrapping increases
Charter rates drop
Surplus Capacity
Rates fall below
breakeven
Idling of surplus capacity
Rates return to breakeven
Idle capacity re-activated
The surplus
capacity trap
may last to
2014
ALPHALINER Containership Market Outlook www.alphaliner.com – the worldwide reference in liner shipping © Alphaliner 1999-2012 – Contents not to be reproduced without permission
TPM Asia : October 2012
Capacity overhang remains
© Alphaliner Page 2
New deliveries
Return of chartered tonnage
Scrapping increases
Charter rates drop
Surplus Capacity
Rates fall below
breakeven
Idling of surplus capacity
Rates return to breakeven
Idle capacity re-activated
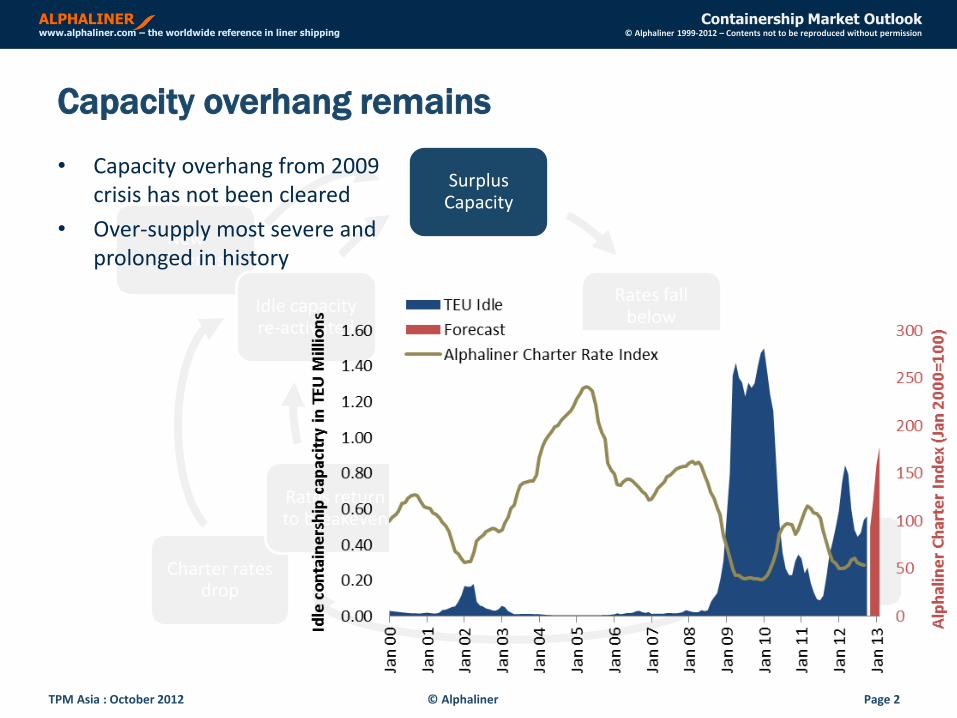
• Capacity overhang from 2009 crisis has not been cleared
• Over-supply most severe and prolonged in history
ALPHALINER Containership Market Outlook www.alphaliner.com – the worldwide reference in liner shipping © Alphaliner 1999-2012 – Contents not to be reproduced without permission
TPM Asia : October 2012
Rate volatility in 2012 unprecedented
© Alphaliner Page 3
New deliveries
Return of chartered tonnage
Scrapping increases
Charter rates drop
Surplus Capacity
Rates fall below
breakeven
Idling of surplus capacity
Rates return to breakeven
Idle capacity re-activated
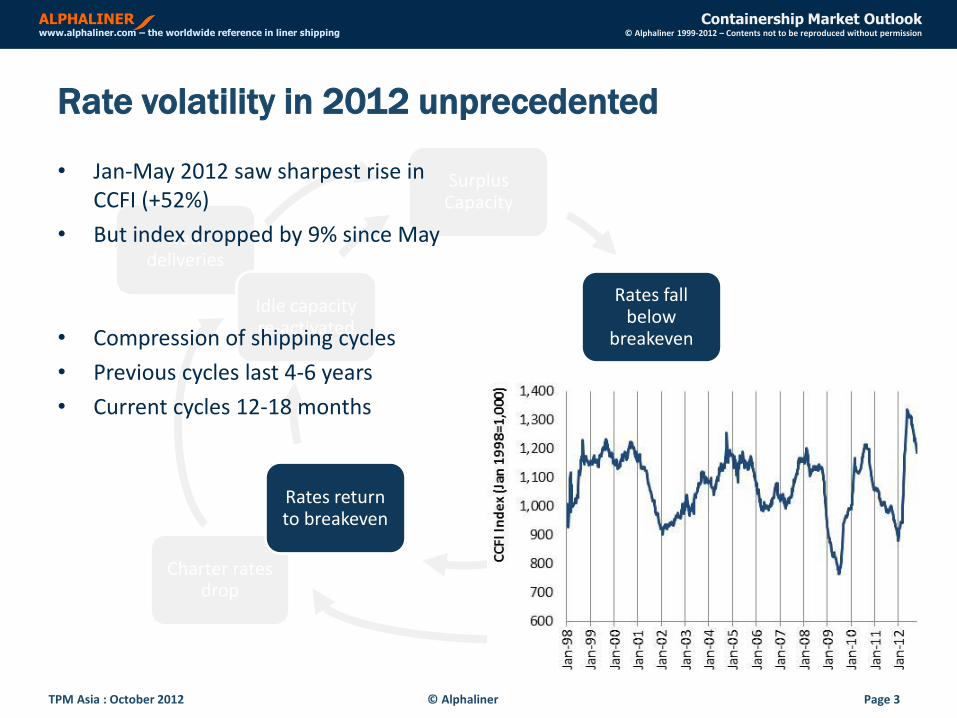
• Jan-May 2012 saw sharpest rise in CCFI (+52%)
• But index dropped by 9% since May
• Compression of shipping cycles
• Previous cycles last 4-6 years
• Current cycles 12-18 months

ALPHALINER Containership Market Outlook www.alphaliner.com – the worldwide reference in liner shipping © Alphaliner 1999-2012 – Contents not to be reproduced without permission
TPM Asia : October 2012
Compression of the shipping cycle
© Alphaliner Page 4
New deliveries
Return of chartered tonnage
Scrapping increases
Charter rates drop
Surplus Capacity
Rates fall below
breakeven
Idling of surplus capacity
Rates return to breakeven
Idle capacity re-activated
• Variance of CCFI rates in 2012 highest since 1998
• High volatility due to capacity overhang
• Excess capacity returns with each recovery
• Idling/slow steaming/charter redeliveries are only temporary solutions

ALPHALINER Containership Market Outlook www.alphaliner.com – the worldwide reference in liner shipping © Alphaliner 1999-2012 – Contents not to be reproduced without permission
TPM Asia : October 2012
Compressed shipping cycle will continue in 2013
© Alphaliner Page 5
New deliveries
Return of chartered tonnage
Scrapping increases
Charter rates drop
Surplus Capacity
Rates fall below
breakeven
Idling of surplus capacity
Rates return to breakeven
Idle capacity re-activated
• Lows more severe – limited only by carriers’ capacity to stomach losses
• Highs will be short-lived
• Rate trend show long-term decline
0
200
400
600
800
1,000
1,200
1,400
1,600
Jan
-98
Jan
-99
Jan
-00
Jan
-01
Jan
-02
Jan
-03
Jan
-04
Jan
-05
Jan
-06
Jan
-07
Jan
-08
Jan
-09
Jan
-10
Jan
-11
Jan
-12
CC
FI I
nd
ex
(Jan
19
98
=1,0
00
)
CCFI
0
200
400
600
800
1,000
1,200
1,400
1,600
Jan
-98
Jan
-99
Jan
-00
Jan
-01
Jan
-02
Jan
-03
Jan
-04
Jan
-05
Jan
-06
Jan
-07
Jan
-08
Jan
-09
Jan
-10
Jan
-11
Jan
-12
CC
FI I
nd
ex
(Jan
19
98
=1,0
00
)
FO $/tonCCFIFuel Adjusted Freight Index
• Trend even more apparent if fuel adjusted rate index

ALPHALINER Containership Market Outlook www.alphaliner.com – the worldwide reference in liner shipping © Alphaliner 1999-2012 – Contents not to be reproduced without permission
TPM Asia : October 2012
Significant new vessel deliveries due in 2013
© Alphaliner Page 6
New deliveries
Return of chartered tonnage
Scrapping increases
Charter rates drop
Surplus Capacity
Rates fall below
breakeven
Idling of surplus capacity
Rates return to breakeven
Idle capacity re-activated
• 40% are new ships of over 10,000 teu
• Driven by need to lower unit costs
• Orders have not stopped
• 1.05 million TEU already delivered YTD
• 1.41 million TEU to be delivered in 2012
• 1.77 million TEU due in 2013
ALPHALINER Containership Market Outlook www.alphaliner.com – the worldwide reference in liner shipping © Alphaliner 1999-2012 – Contents not to be reproduced without permission
TPM Asia : October 2012
Idle capacity remains at 6%
© Alphaliner Page 7
New deliveries
Return of chartered tonnage
Scrapping increases
Charter rates drop
Surplus Capacity
Rates fall below
breakeven
Idling of surplus capacity
Rates return to breakeven
Idle capacity re-activated
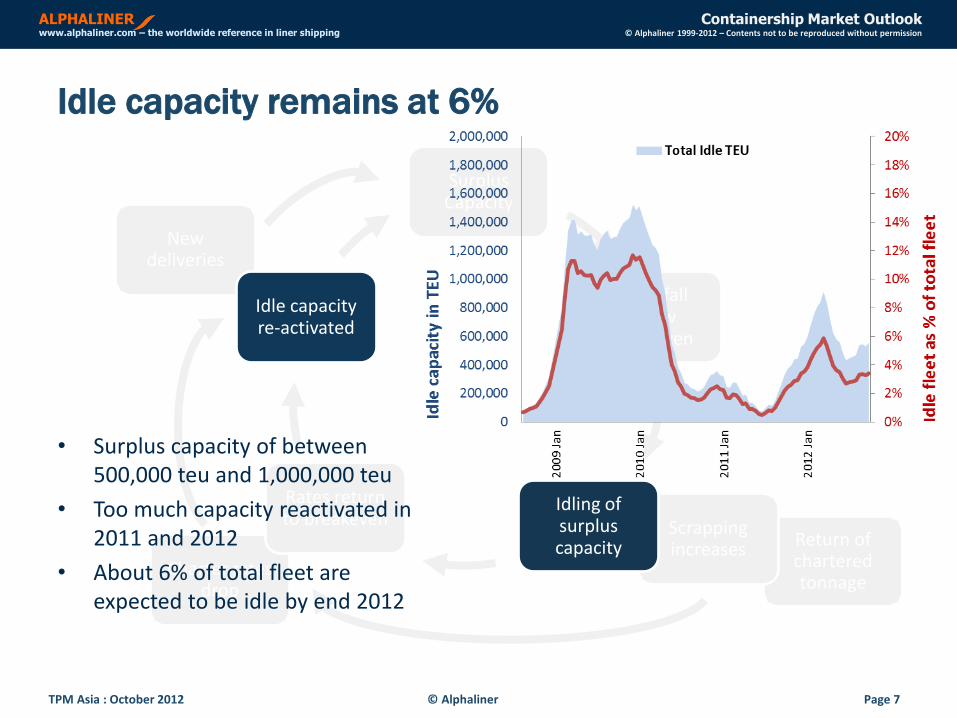
• Surplus capacity of between 500,000 teu and 1,000,000 teu
• Too much capacity reactivated in 2011 and 2012
• About 6% of total fleet are expected to be idle by end 2012
ALPHALINER Containership Market Outlook www.alphaliner.com – the worldwide reference in liner shipping © Alphaliner 1999-2012 – Contents not to be reproduced without permission
TPM Asia : October 2012
Scrapping has increased but still insufficient
© Alphaliner Page 8
New deliveries
Return of chartered tonnage
Scrapping increases
Charter rates drop
Surplus Capacity
Rates fall below
breakeven
Idling of surplus capacity
Rates return to breakeven
Idle capacity re-activated
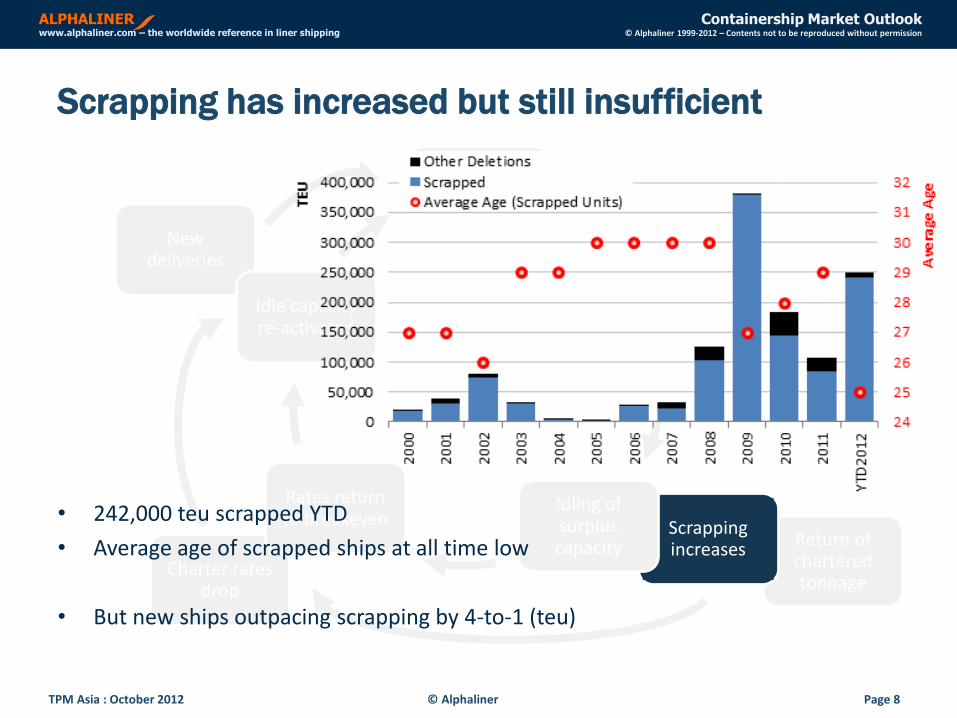
• 242,000 teu scrapped YTD
• Average age of scrapped ships at all time low
• But new ships outpacing scrapping by 4-to-1 (teu)
ALPHALINER Containership Market Outlook www.alphaliner.com – the worldwide reference in liner shipping © Alphaliner 1999-2012 – Contents not to be reproduced without permission
TPM Asia : October 2012
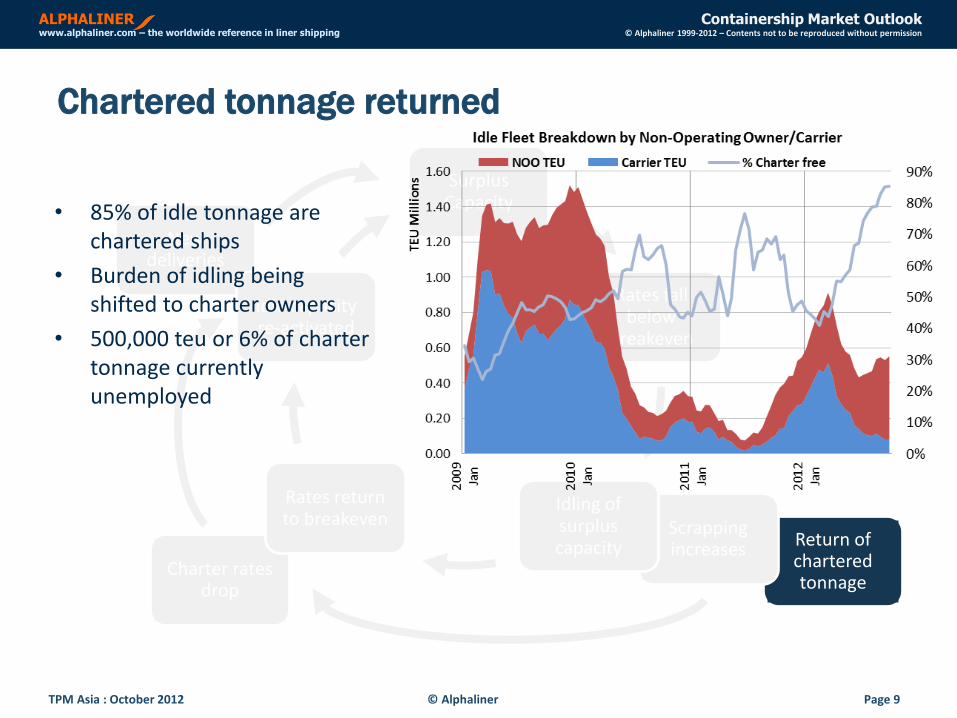
Chartered tonnage returned
© Alphaliner Page 9
New deliveries
Return of chartered tonnage
Scrapping increases
Charter rates drop
Surplus Capacity
Rates fall below
breakeven
Idling of surplus capacity
Rates return to breakeven
Idle capacity re-activated
• 85% of idle tonnage are chartered ships
• Burden of idling being shifted to charter owners
• 500,000 teu or 6% of charter tonnage currently unemployed
ALPHALINER Containership Market Outlook www.alphaliner.com – the worldwide reference in liner shipping © Alphaliner 1999-2012 – Contents not to be reproduced without permission
TPM Asia : October 2012
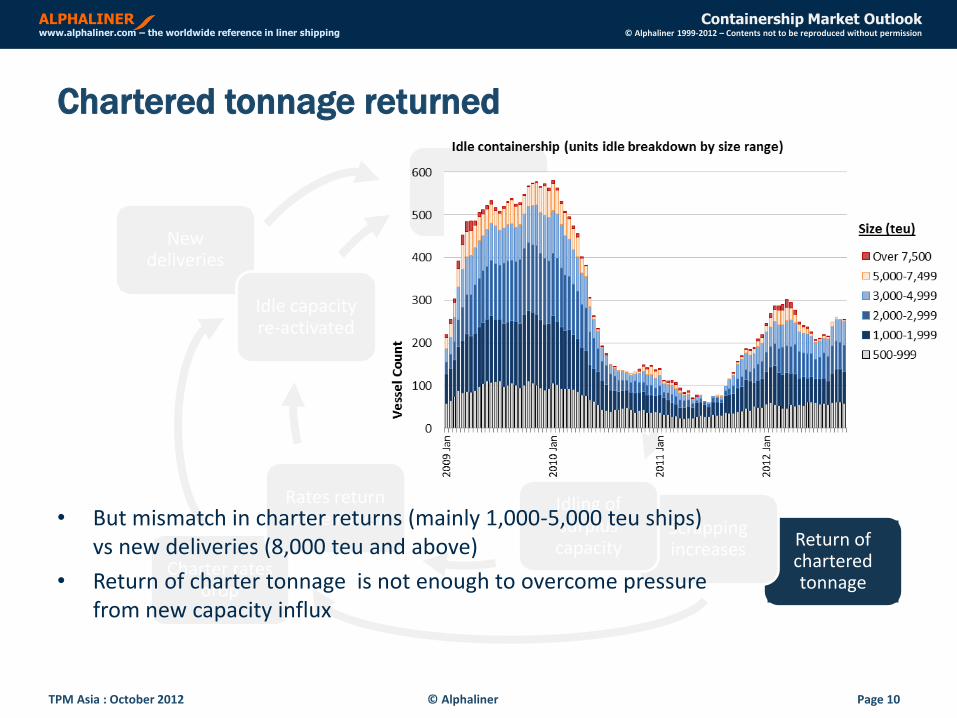
Chartered tonnage returned
© Alphaliner Page 10
New deliveries
Return of chartered tonnage
Scrapping increases
Charter rates drop
Surplus Capacity
Rates fall below
breakeven
Idling of surplus capacity
Rates return to breakeven
Idle capacity re-activated
• But mismatch in charter returns (mainly 1,000-5,000 teu ships) vs new deliveries (8,000 teu and above)
• Return of charter tonnage is not enough to overcome pressure from new capacity influx

ALPHALINER Containership Market Outlook www.alphaliner.com – the worldwide reference in liner shipping © Alphaliner 1999-2012 – Contents not to be reproduced without permission
TPM Asia : October 2012
Charter rates remain depressed
© Alphaliner Page 11
New deliveries
Return of chartered tonnage
Scrapping increases
Charter rates drop
Surplus Capacity
Rates fall below
breakeven
Idling of surplus capacity
Rates return to breakeven
Idle capacity re-activated
• Depressed charter rates will continue in 2013
• Carriers continue to take on new charters, with low charter rates
• Capacity can return on short notice
ALPHALINER Containership Market Outlook www.alphaliner.com – the worldwide reference in liner shipping © Alphaliner 1999-2012 – Contents not to be reproduced without permission
TPM Asia : October 2012
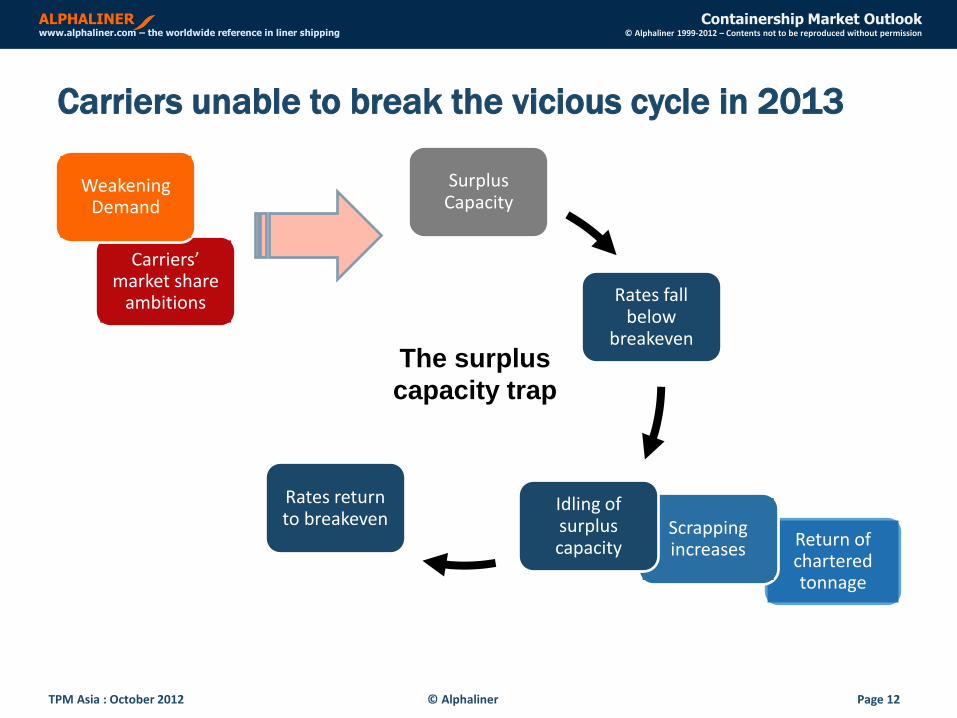
Carriers unable to break the vicious cycle in 2013
© Alphaliner Page 12
Return of chartered tonnage
Scrapping increases
Surplus Capacity
Rates fall below
breakeven
Idling of surplus capacity
Rates return to breakeven
Idle capacity re-activated
The surplus
capacity trap
Carriers’ market share
ambitions
Weakening Demand

ALPHALINER Containership Market Outlook www.alphaliner.com – the worldwide reference in liner shipping © Alphaliner 1999-2012 – Contents not to be reproduced without permission
TPM Asia : October 2012
Growth is slowing
© Alphaliner Page 13
Carriers’ market share
ambitions
Weakening Demand
• Demand growth at 4-6% in 2012-2013
• Vs capacity growth of 9% in 2013

ALPHALINER Containership Market Outlook www.alphaliner.com – the worldwide reference in liner shipping © Alphaliner 1999-2012 – Contents not to be reproduced without permission
TPM Asia : October 2012
Weak headhaul volumes pose significant challenge
© Alphaliner Page 14
Carriers’ market share
ambitions
Weakening Demand
• FE-Europe volume expected to shrink by -4.2% in 2012
• FE-US volume growth still weak at 1.5%
• The two main trades will come under greatest capacity pressure

ALPHALINER Containership Market Outlook www.alphaliner.com – the worldwide reference in liner shipping © Alphaliner 1999-2012 – Contents not to be reproduced without permission
TPM Asia : October 2012
Average load factors weak
© Alphaliner Page 15
Carriers’ market share
ambitions
Weakening Demand
• Average load factor on FE-Europe only 85%
• Average load factor on FE-US at 91%
• Capacity reductions are necessary but difficult to implement
60%
65%
70%
75%
80%
85%
90%
95%
100%
Jan
-10
Ap
r-1
0
Jul-
10
Oct
-10
Jan
-11
Ap
r-1
1
Jul-
11
Oct
-11
Jan
-12
Ap
r-1
2
Jul-
12
Oct
-12
Average vessel load factor FE-Europe route (Source : Shanghai Shipping Exchange)
60%
65%
70%
75%
80%
85%
90%
95%
100%
Jan
-10
Ap
r-1
0
Jul-
10
Oct
-10
Jan
-11
Ap
r-1
1
Jul-
11
Oct
-11
Jan
-12
Ap
r-1
2
Jul-
12
Oct
-12
Average vessel load factor FE-US route (Source : Shanghai Shipping Exchange)

ALPHALINER Containership Market Outlook www.alphaliner.com – the worldwide reference in liner shipping © Alphaliner 1999-2012 – Contents not to be reproduced without permission
TPM Asia : October 2012
Carriers unable to curb appetite for capacity
© Alphaliner Page 16
Carriers’ market share
ambitions
Weakening Demand
• 19 of Top 21 carriers have new capacity coming in next 15 months
• Only UASC/Zim are without new capacity
0 50,000 100,000 150,000 200,000 250,000
APLAPM-Maersk
MSCEvergreen
Hamburg SüdHapag-Lloyd
COSCONCSCL
Hanjin ShgOOCLMOL
Yang MingPIL
CMA CGMNYK Line
HMMWan Hai
K LineCSAV
ZimUASC
New Vessel Deliveries Oct 2012-Dec 2013 (TEU)

ALPHALINER Containership Market Outlook www.alphaliner.com – the worldwide reference in liner shipping © Alphaliner 1999-2012 – Contents not to be reproduced without permission
TPM Asia : October 2012
Carriers unable to curb appetite for capacity
© Alphaliner Page 17
Carriers’ market share
ambitions
Weakening Demand
• Top 21 carriers – capacity growth of 7.4% p.a. over 2008-2012 period
• A single carrier is enough to break capacity discipline and trigger a rate war
7%
12
%
9%
10
%
2%
6%
6%
7%
11
%
8%
5%
10
%
-1%
10
%
4%
4%
2%
13
%
19
%
-2%
7%
0.00
0.50
1.00
1.50
2.00
2.50
3.00
AP
M-M
aers
k
MSC
CM
A C
GM
CO
SCO
N
Eve
rgre
en
Hap
ag-L
loyd
AP
L
CSC
L
Han
jin S
hg
MO
L
OO
CL
Ham
bu
rg S
üd
NYK
Lin
e
HM
M
K L
ine
Yan
g M
ing
Zim PIL
UA
SC
CSA
V
Wan
Hai
Cap
acit
y O
pe
rate
d in
TEY
Mill
ion
s
Sep-08 Sep-12 CAGR 2008-2012

ALPHALINER Containership Market Outlook www.alphaliner.com – the worldwide reference in liner shipping © Alphaliner 1999-2012 – Contents not to be reproduced without permission
TPM Asia : October 2012
Excessive competition will remain
© Alphaliner Page 18
Carriers’ market share
ambitions
Weakening Demand
• 20 main carriers in FE-US and 19 main carriers in FE-Europe
• No indication of carrier exits in 2013
• Formation of alliances (MSC-CMA CGM, G6, CKYH ++) has reduced impetus for carrier consolidation
0 10,000 20,000 30,000 40,000 50,000 60,000 70,000 80,000 90,000
MaerskMSC
CMA CGMCOSCO
EvergreenCSCL
Hanjin ShgHapag-Lloyd
HMMOOCLUASCMOL
NYK LineAPL
K LineZim
Yang MingWan Hai
PIL
FE - Europe Weekly Capacity in nominal TEU
0 10,000 20,000 30,000 40,000 50,000 60,000 70,000 80,000 90,000
MaerskHanjin Shg
COSCOEvergreen
MSCHapag-Lloyd
APLCMA CGM
K LineYang Ming
HMMOOCLMOLNYK
CSCLZim
Wan HaiPIL
MatsonUASC
Westwood
FE - North America Weekly Capacity in nominal TEU
Weekly capacity share by carrier (Oct 2012) FE-Europe FE-North America

ALPHALINER Containership Market Outlook www.alphaliner.com – the worldwide reference in liner shipping © Alphaliner 1999-2012 – Contents not to be reproduced without permission
TPM Asia : October 2012
Carriers have limited options to curb growth
© Alphaliner Page 19
Carriers’ market share
ambitions
Weakening Demand
• Slow steaming, return of chartered tonnage and idling are only temporary solutions
• Scrapping & curbing new orders are more permanent solutions
• But capacity curbs have been ineffective so far
-15%
-10%
-5%
0%
5%
10%
15%
20%
10
11
12
13
14
15
16
17
2009Jan
2010Jan
2011Jan
2012Jan
% C
han
ge (
Ye
ar-o
n-y
ear
)
Tota
l Cel
lula
r C
apac
ity
in T
EU M
illio
ns
Capacity absorbed by ESS/SSS Idle capacityEffective Capacity YoY % change in Fleet CapacityYoY % change in Effective Capacity
Slow steaming absorbed 6% of fleet
Potential for further slow steaming
~4%

ALPHALINER Containership Market Outlook www.alphaliner.com – the worldwide reference in liner shipping © Alphaliner 1999-2012 – Contents not to be reproduced without permission
TPM Asia : October 2012
Predictions for 2013
© Alphaliner Page 20
• Rate volatility will continue
• Supply overhang will continue to dictate rates cycle in 2013
• NVO rates will be less volatile than 2012 - 3Q base rates 28% higher than 2011
• BCO rates will rise in 2013 but quantum probably lower than carrier targets
• Carriers will continue to shoot themselves in the foot
• Carrier discipline only when suffering from losses or when utilisation levels are high
• Nov GRI on FE-Europe will be followed by rate undercutting if load factors remain weak
• None of the main carriers will exit the market
• Excessive competitive will continue
• Predictions of industry consolidation are premature

ALPHALINER Containership Market Outlook www.alphaliner.com – the worldwide reference in liner shipping © Alphaliner 1999-2012 – Contents not to be reproduced without permission
TPM Asia : October 2012
End
Please send any queries to [email protected]/[email protected]
© Alphaliner Page 21
Alphaliner clients include the following top shipping lines :